Attached files
| file | filename |
|---|---|
| 8-K - FORM 8-K - Regional Management Corp. | d185933d8k.htm |
| EX-99.1 - EX-99.1 - Regional Management Corp. | d185933dex991.htm |
Exhibit 99.2

Exhibit 99.2
Regional
Management Corp.
1Q 2016 Earnings Presentation
April 28, 2016
RM LISTED NYSE
Safe Harbor Statement
This presentation and the responses to various questions contain forward-looking statements, which reflect our current views with respect to, among other things,
the Company’s operations and financial performance. You can identify these forward-looking statements by the use of words such as “outlook,” “believes,” “expects,” “potential,” “continues,”
“may,” “will,” “should,” “seeks,” “approximately,” “predicts,” “intends,” “plans,” “estimates,” “anticipates” or the negative version of these words
or other comparable words. Such forward-looking statements are subject to various risks and uncertainties. Accordingly, there are or will be important factors that could cause actual outcomes or results to differ materially from those indicated in
these statements. These factors include but are not limited to those described under “Risk Factors” in the Company’s Annual Report on Form 10-K. We cannot guarantee future events, results, actions, levels of activity, performance or
achievements.
Neither the Company nor any of its respective agents, employees or advisors undertake any duty or obligation to supplement, amend, update or revise
any forward-looking statement, whether as a result of new information or otherwise.
The information and opinions contained in this document are provided as of the
date of this presentation and are subject to change without notice. This document has not been approved by any regulatory or supervisory authority.
2
RM LISTED NYSE
Regional Management Corp.
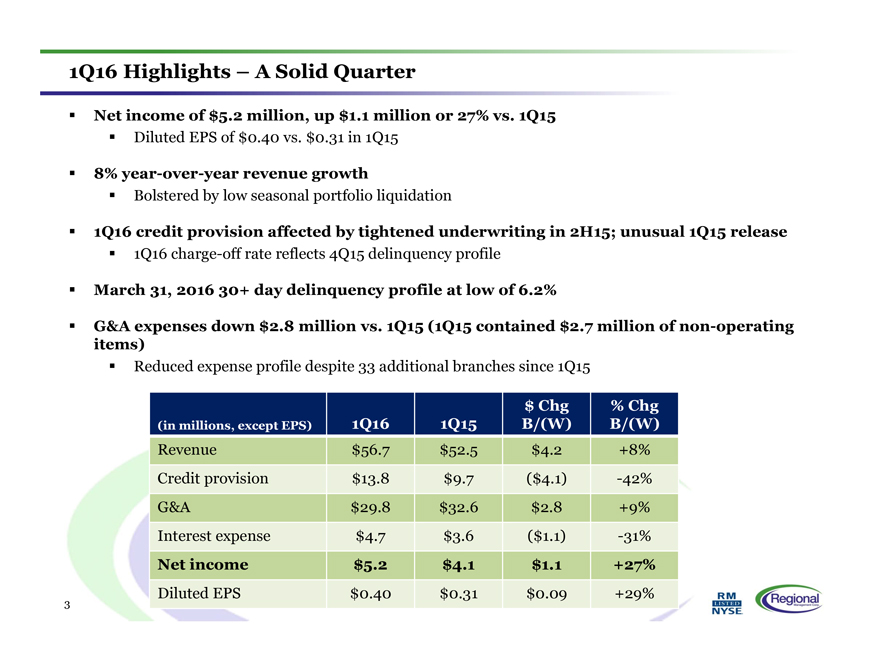
1Q16 Highlights – A Solid Quarter
Net income of $5.2 million, up $1.1 million or 27% vs. 1Q15
Diluted EPS of $0.40 vs. $0.31 in
1Q15
8% year-over-year revenue growth
Bolstered by low seasonal portfolio
liquidation
1Q16 credit provision affected by tightened underwriting in 2H15; unusual 1Q15 release
1Q16 charge-off rate reflects 4Q15 delinquency profile
March 31, 2016 30+ day delinquency
profile at low of 6.2%
G&A expenses down $2.8 million vs. 1Q15 (1Q15 contained $2.7 million of non-operating items)
Reduced expense profile despite 33 additional branches since 1Q15
(in millions, except EPS)
1Q16
1Q15
$ Chg
B/(W)
% Chg
B/(W)
Revenue
$56.7
$52.5
$4.2
+8%
Credit provision
$13.8
$9.7
($4.1)
-42%
G&A
$29.8
$32.6
$2.8
+9%
Interest expense
$4.7
$3.6
($1.1)
-31%
Net income
$5.2
$4.1
$1.1
+27%
Diluted EPS
$0.40
$0.31
$0.09
+29%
3
RM LISTED NYSE
Regional Management Corp.
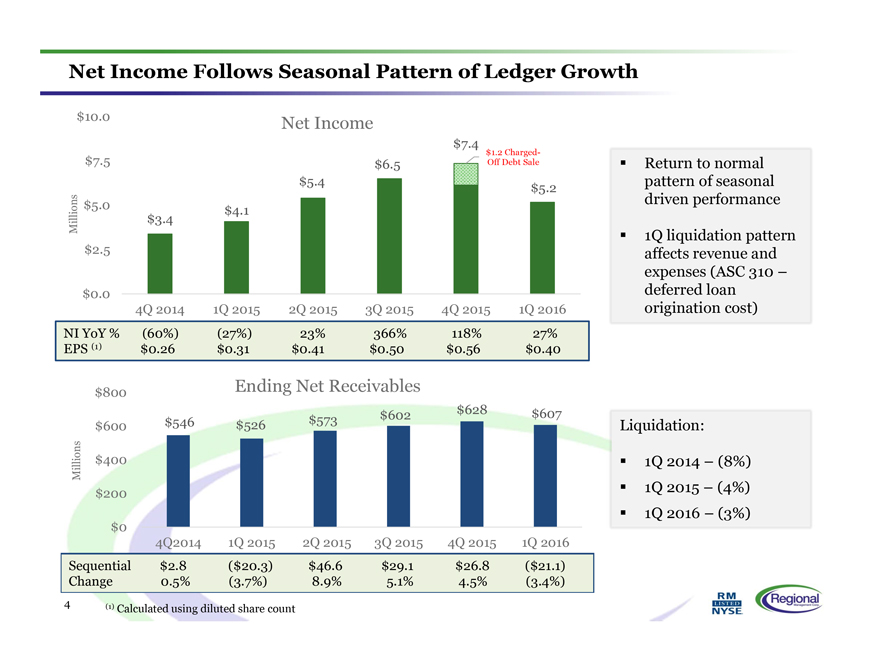
Net Income Follows Seasonal Pattern of Ledger Growth
Net Income
Millions
$10.0
$7.5
$5.0
$2.5
$0.0
$3.4
$4.1
$5.4
$6.5
$7.4
$1.2 Charged-Off Debt Sale
$5.2
4Q 2014
1Q 2015
2Q 2015
3Q 2015
4Q 2015
1Q 2016
NI YoY%
(60%)
(27%)
23%
366%
118%
27%
EPS (1)
$0.26
$0.31
$0.41
$0.50
$0.56
$0.40
Ending Net Receivables
Millions
$800
$600
$400
$200
$0
$546
$526
$573
$602
$628
$607
4Q2014
1Q 2015
2Q 2015
3Q 2015
4Q 2015
1Q 2016
Sequential
$2.8
($20.3)
$46.6
$29.1
$26.8
($21.1)
Change
0.5%
(3.7%)
8.9%
5.1%
4.5%
(3.4%)
Return to normal pattern of seasonal driven performance
1Q liquidation pattern affects revenue and expenses (ASC 310 – deferred loan origination cost)
Liquidation:
1Q 2014 – (8%)
1Q 2015 – (4%)
1Q 2016 – (3%)
(1) Calculated using diluted share count
4
RM LISTED NYSE
Regional Management Corp.
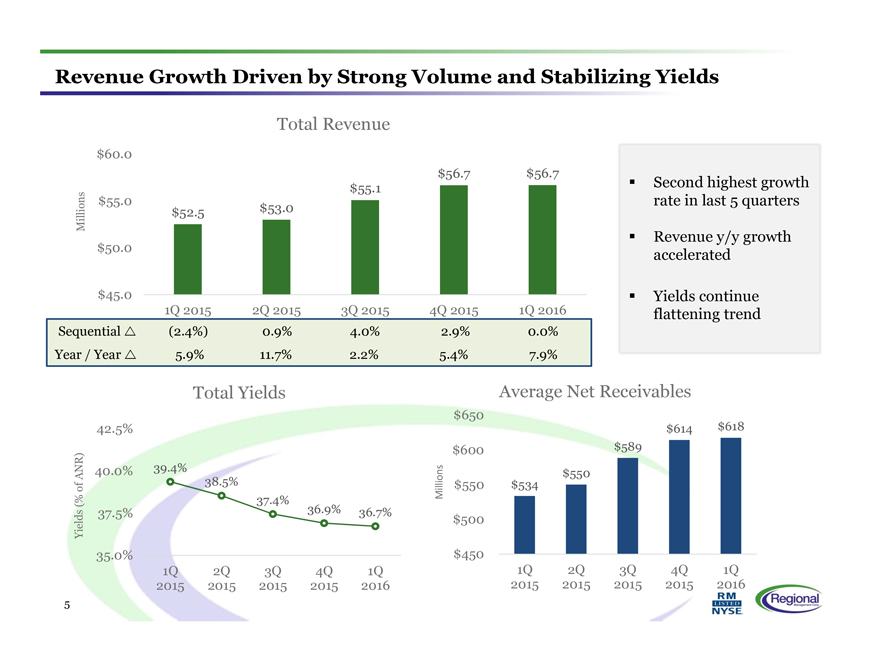
Revenue Growth Driven by Strong Volume and Stabilizing Yields
Total Revenue
Millions
$60.0
$55.0
$50.0
$45.0
$52.5
$53.0
$55.1
$56.7
$56.7
1Q 2015
2Q 2015
3Q 2015
4Q 2015
1Q 2016
Sequential
(2.4%)
0.9%
4.0%
2.9%
0.0%
Year / Year
5.9%
11.7%
2.2%
5.4%
7.9%
Total Yields
Yields (% of ANR)
42.5%
40.0%
37.5%
35.0%
39.4%
38.5%
37.4%
36.9%
36.7%
1Q
2015
2Q
2015
3Q
2015
4Q
2015
1Q
2016
Average Net Receivables
Millions
$650
$600
$550
$500
$450
$534
$550
$589
$614
$618
1Q
2015
2Q
2015
3Q
2015
4Q
2015
1Q
2016
Second highest growth rate in last 5 quarters
Revenue y/y growth accelerated
Yields continue flattening trend
5
RM LISTED NYSE
Regional Management Corp.
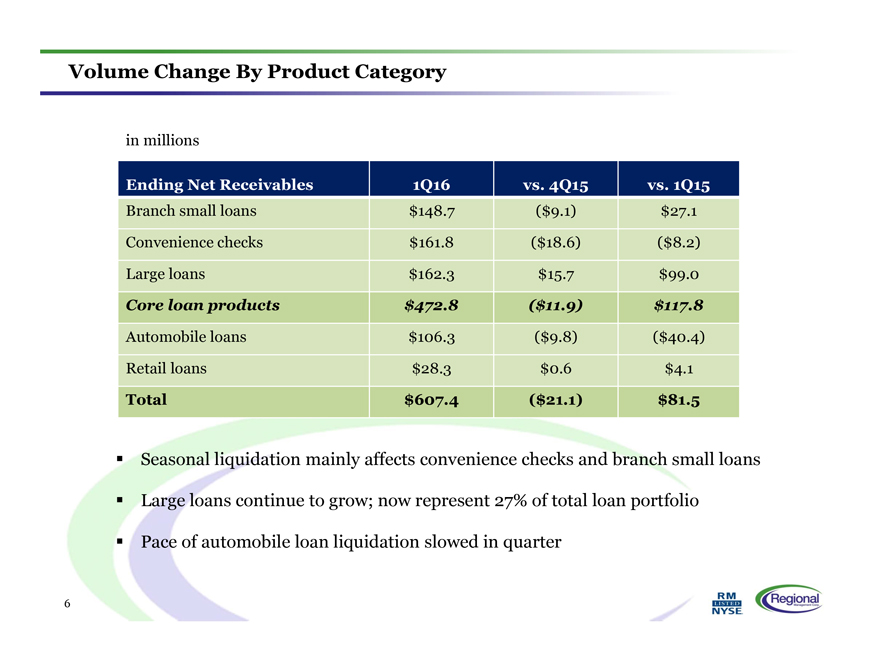
Volume Change By Product Category
in millions
Ending Net Receivables
1Q16
vs. 4Q15
vs. 1Q15
Branch small loans
$148.7
($9.1)
$27.1
Convenience checks
$161.8
($18.6)
($8.2)
Large loans
$162.3
$15.7
$99.0
Core loan products
$472.8
($11.9)
$117.8
Automobile loans
$106.3
($9.8)
($40.4)
Retail loans
$28.3
$0.6
$4.1
Total
$607.4
($21.1)
$81.5
Seasonal liquidation mainly affects convenience checks and branch small loans
Large loans continue to grow; now represent 27% of total loan portfolio
Pace
of automobile loan liquidation slowed in quarter
6
RM LISTED NYSE
Regional Management Corp.
Losses Affected by Tightened Underwriting; Credit Quality Stable
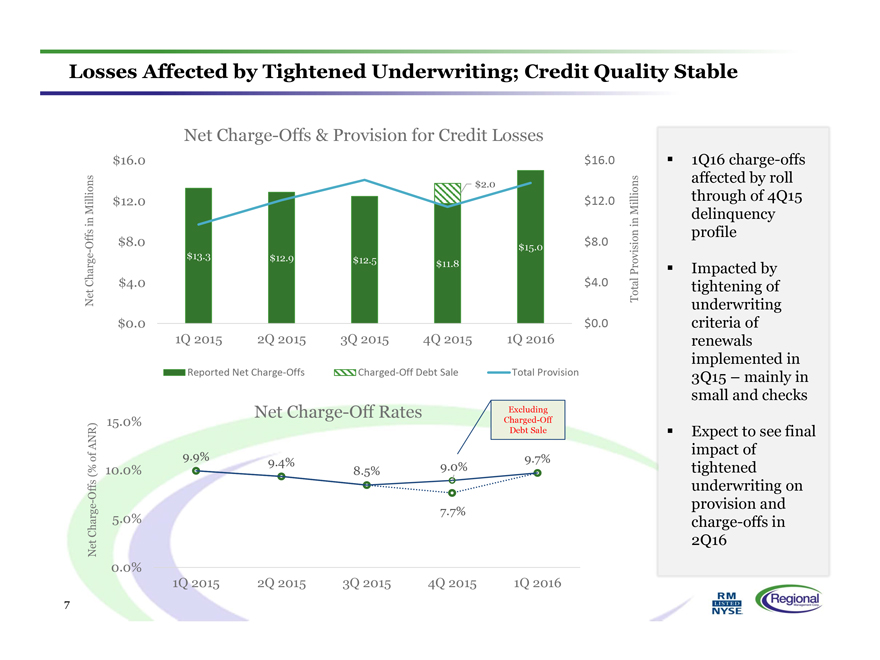
Net Charge-Offs & Provision for Credit Losses
Net Charge-Offs in Millions
$16.0
$12.0
$8.0
$4.0
$0.0
$13.3
$12.9
$12.5
$11.8
$2.0
$15.0
$16.0
$12.0
$8.0
$4.0
$0.0
Total Provision in Millions
1Q 2015 2Q 2015 3Q 2015 4Q 2015 1Q 2016
Reported Net Charge Offs
Charged Off Debt Sale
Total Provision
Net Charge-Off Rates
Net Charge-Offs (% of ANR)
15.0%
10.0%
5.0%
0.0%
9.9%
9.4%
8.5%
9.0%
Excluding Charged-Off Debt Sale
9.7%
7.7%
1Q 2015 2Q 2015 3Q 2015 4Q 2015 1Q 2016
1Q16 charge-offs affected by roll
through of 4Q15 delinquency profile
Impacted by tightening of underwriting criteria of renewals implemented in 3Q15 – mainly in small and checks
Expect to see final impact of tightened underwriting on provision and charge-offs in 2Q16
7
RM LISTED NYSE
Regional Management Corp.
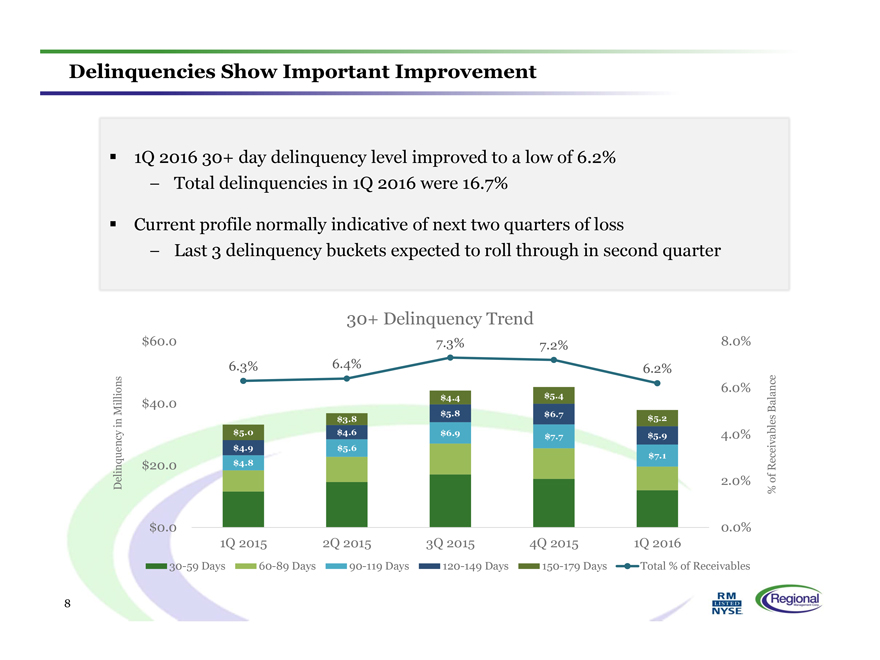
Delinquencies Show Important Improvement
1Q 2016 30+ day delinquency level improved to a low of 6.2%
- Total delinquencies in 1Q 2016
were 16.7%
Current profile normally indicative of next two quarters of loss
-
Last 3 delinquency buckets expected to roll through in second quarter
30+ Delinquency Trend
Delinquency in Millions
$60.0
$40.0
$20.0
$0.0
6.3%
6.4%
7.3%
7.2%
6.2%
$5.0
$4.9
$4.8
$3.8
$4.6
$5.6
$4.4
$5.8
$6.9
$5.4
$6.7
$7.7
$5.2
$5.9
$7.1
8.0%
6.0%
4.0%
2.0%
0.0%
% of Receivables Balance
1Q 2015 2Q 2015 3Q 2015 4Q 2015 1Q 2016
30-59 Days 60-89 Days 90-119 Days 120-149 Days 150-179 Days Total % of Receivables
8
RM LISTED NYSE
Regional Management Corp.
Good Sequential and Year-Over-Year Expense Management
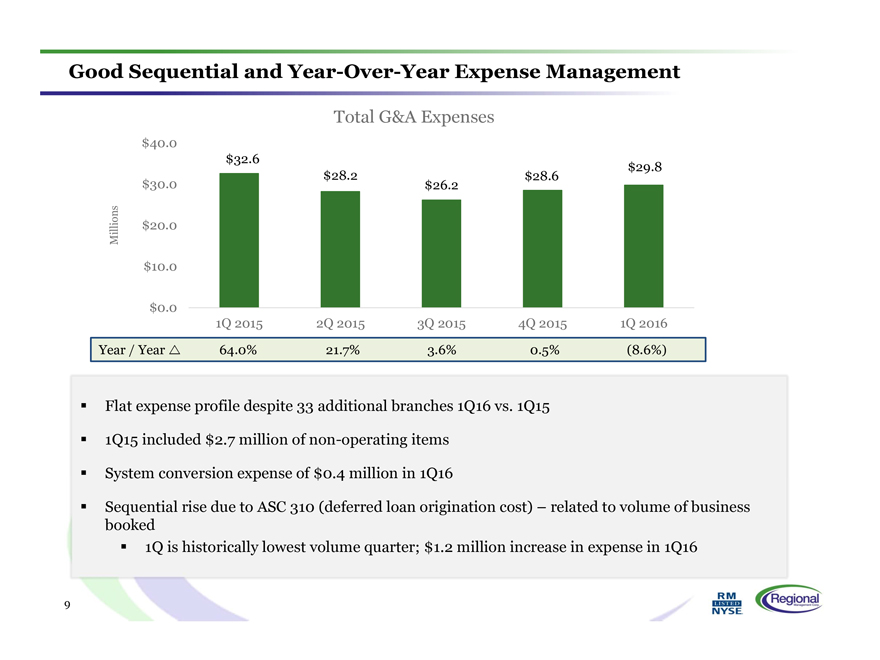
Total G&A Expenses
Millions
$40.0
$30.0
$20.0
$10.0
$0.0
$32.6
$28.2
$26.2
$28.6
$29.8
1Q 2015 2Q 2015 3Q 2015 4Q 2015 1Q 2016
Year / Year
64.0%
21.7%
3.6%
0.5%
(8.6%)
Flat expense profile despite 33 additional branches 1Q16 vs. 1Q15
1Q15 included $2.7 million of non-operating items
System conversion expense
of $0.4 million in 1Q16
Sequential rise due to ASC 310 (deferred loan origination cost) – related to volume of business booked
1Q is historically lowest volume quarter; $1.2 million increase in expense in 1Q16
9
RM LISTED NYSE
Regional Management Corp.
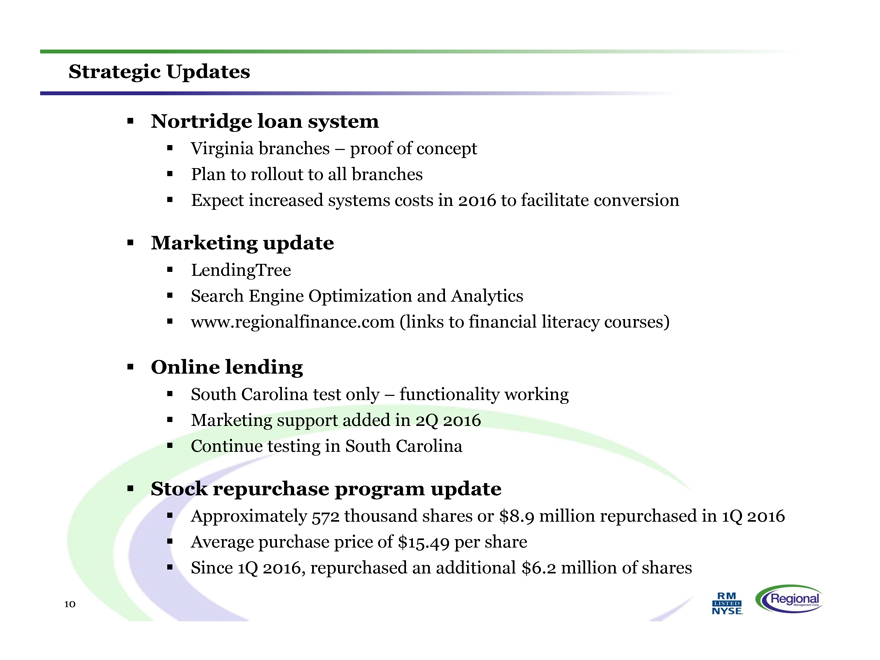
Strategic Updates
Nortridge loan system
Virginia branches – proof of concept
Plan to rollout to all branches
Expect increased systems costs in 2016 to facilitate
conversion
Marketing update
LendingTree
Search Engine Optimization and Analytics
www.regionalfinance.com (links to financial literacy
courses)
Online lending
South Carolina test only – functionality working
Marketing support added in 2Q 2016
Continue testing in South Carolina
Stock repurchase program update
Approximately 572 thousand shares or $8.9
million repurchased in 1Q 2016
Average purchase price of $15.49 per share
Since 1Q 2016, repurchased an additional $6.2 million of shares
10
RM LISTED NYSE
Regional Management Corp.
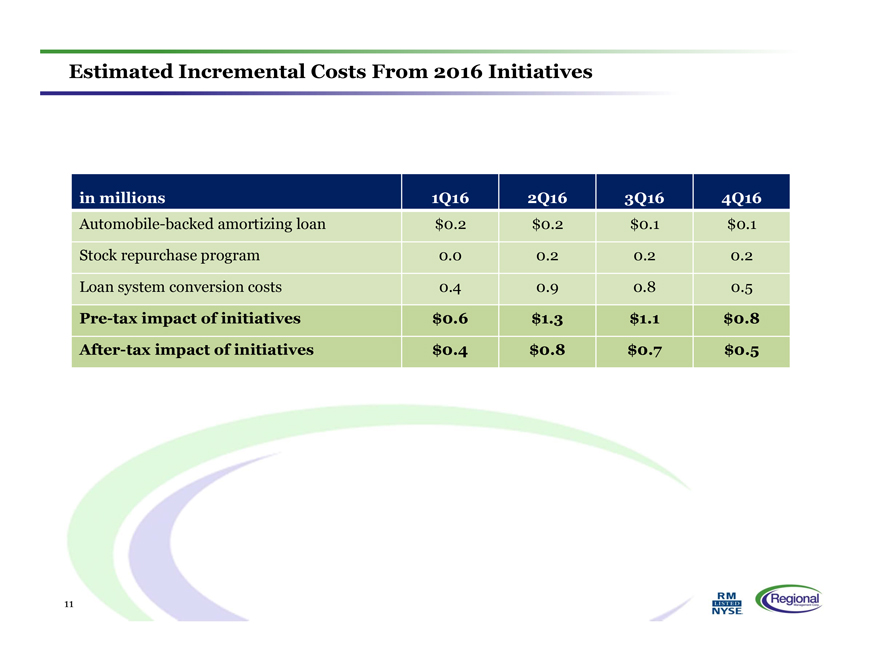
Estimated Incremental Costs From 2016 Initiatives
in millions
1Q16
2Q16
3Q16
4Q16
Automobile-backed amortizing loan
$0.2
$0.2
$0.1
$0.1
Stock repurchase program
0.0
0.2
0.2
0.2
Loan system conversion costs
0.4
0.9
0.8
0.5
Pre-tax impact of initiatives
$0.6
$1.3
$1.1
$0.8
After-tax impact of initiatives
$0.4
$0.8
$0.7
$0.5
11
RM LISTED NYSE
Regional Management Corp.
Regional Management Corp.
CONFIDENTIAL
12
RM LISTED NYSE
Regional Management Corp.