Attached files
| file | filename |
|---|---|
| 8-K - 8-K SD INVEST SOC PRESENTATION - NORTHWESTERN CORP | a201604288ksdpresentation.htm |

South Dakota Investment Society April 28, 2016 Beethoven Wind Farm, near Tripp, SD

2 Forward Looking Statements Forward Looking Statements During the course of this presentation, there will be forward- looking statements within the meaning of the “safe harbor” provisions of the Private Securities Litigation Reform Act of 1995. Forward-looking statements often address our expected future business and financial performance, and often contain words such as “expects,” “anticipates,” “intends,” “plans,” “believes,” “seeks,” or “will.” The information in this presentation is based upon our current expectations as of the date hereof unless otherwise noted. Our actual future business and financial performance may differ materially and adversely from our expectations expressed in any forward-looking statements. We undertake no obligation to revise or publicly update our forward-looking statements or this presentation for any reason. Although our expectations and beliefs are based on reasonable assumptions, actual results may differ materially. The factors that may affect our results are listed in certain of our press releases and disclosed in the Company’s most recent Form 10-K and 10-Q along with other public filings with the SEC. Company Information NorthWestern Corporation dba: NorthWestern Energy www.northwesternenergy.com Corporate Support Office 3010 West 69th Street Sioux Falls, SD 57106 (605) 978-2900 Montana Operational Support Office 11 East Park Butte, MT 59701 (406) 497-1000 SD/NE Operational Support Office 600 Market Street West Huron, SD 57350 (605) 353-7478 Director of Investor Relations Travis Meyer 605-978-2945 travis.meyer@northwestern.com

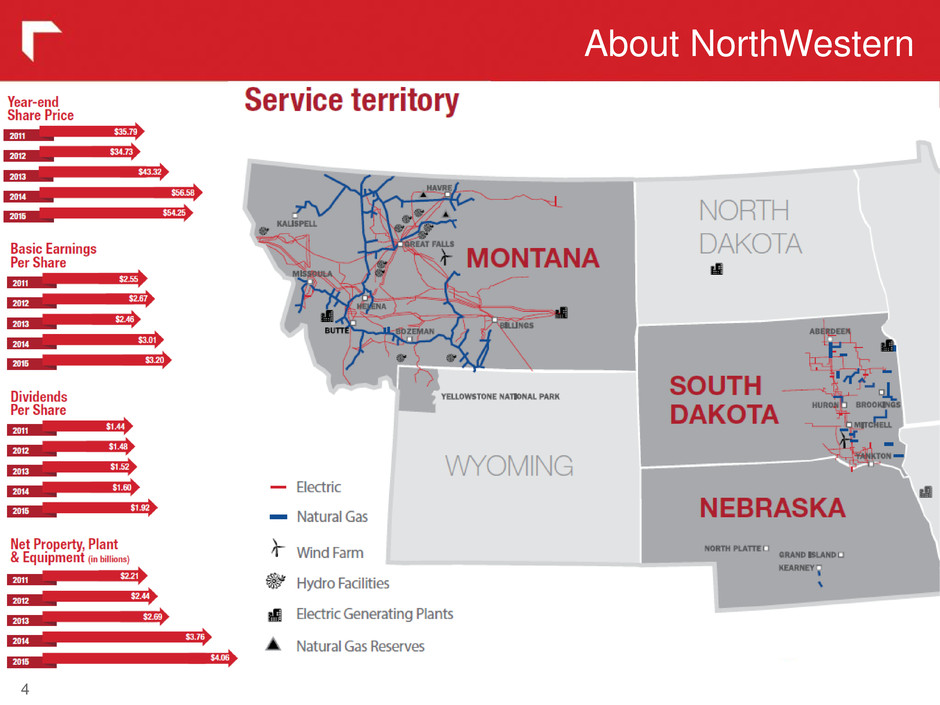
About NorthWestern 3 701,000 Customers 27,900 Miles of electric transmission & distribution lines 9,630 Miles of natural gas transmission & distribution lines 3 States served & one national park 1,294 MW Nameplate owned Power generation 84 Bcf Gas storage & owned natural gas reserves
About NorthWestern 4

South Dakota Operations 5 Nebraska Neal 4 Big Stone Coyote 1 Coal Plants Wind Farm Peaking Plant Electric Service Territory Natural Gas Service Territory Electric Transmission Lines Beethoven Wind Farm Aberdeen Peaker Plant Electric Operations – South Dakota • 62,800 customers in 110 communities & 25 counties • 440 MW Owned Power Generation • 111 MW Big Stone (23.4% owner) • 43 MW Coyote (10.0% owner) • 56 MW Neal 4 (8.7% owner) • 52 MW Aberdeen Peaker Plant (100% owner) • 80 MW Beethoven Wind Farm (100% owner) • 98 MW Miscellaneous combustion turbine units • 3,550 Miles of Transmission & Distribution lines Gas Operations – South Dakota • 45,700 customers in 60 communities • No owned gas reserves – all via market • 5.4 Bcf supply requirements • 1,625 miles of pipeline • 55 miles of interstate transmission pipeline All data as of 12/31/2015

NorthWestern Energy – South Dakota 6 • NorthWestern Energy is headquartered in Sioux Falls • Traded on New York Stock Exchange as: NWE • Largest publicly traded company in SD by market cap (as of 12/31/15) (1) (2) (5) (3) (4) (6) (1) Number of jobs generated (FT & PT) – including sole proprietors (2) Equals revenues collected including indirect business taxes (3) Sum of labor, business income (profit, interests, rent) and indirect business tax (4) Wages and benefits to employees and self-employed proprietors (5) Property type income (profits, interest income & rental income) (6) Taxes and fees not based in business income (i.e. sales taxes) Nearly $300K of donations, sponsorships and economic development funds given to South Dakota communities in 2015. This does not include employee contributions or hours volunteering.
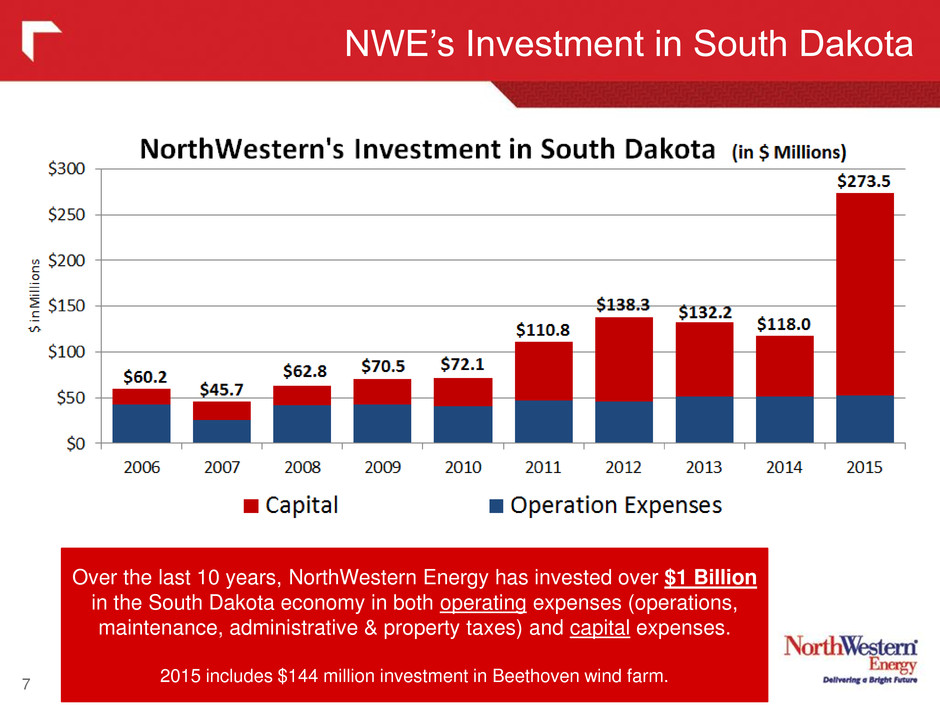
NWE’s Investment in South Dakota 7 Over the last 10 years, NorthWestern Energy has invested over $1 Billion in the South Dakota economy in both operating expenses (operations, maintenance, administrative & property taxes) and capital expenses. 2015 includes $144 million investment in Beethoven wind farm.

NWE: An Investment for the Long Term 8 • 100% Regulated electric & natural gas utility business • 100 year history of competitive customer rates, system reliability and customer satisfaction • Solid economic indicators in service territory • A diverse electric supply portfolio that is approximately 54% hydro and wind (combined MT & SD) • Customer service satisfaction scores above the JD Power survey average • Residential electric and natural gas rates below the national average • Solid system reliability (EEI 2nd quartile) • Low leaks per 100 miles of pipe (AGA 1st quartile) • Named a “Utility Customer Champion” by Cogent Reports (top trusted utility brand in the West region) • Consistent track record of earnings and dividend growth • Strong cash flows aided by net operating loss carry-forwards • Strong balance sheet and solid investment grade credit ratings • Recent hydro & wind transactions increase rate base & provide energy supply stability • Disciplined maintenance capital investment program • Reintegrating energy supply portfolio • Significant future investment in a comprehensive transmission, distribution, and substation infrastructure project to address asset lives, safety, capacity and grid modernization Pure Electric & Gas Utility Solid Utility Foundation Strong Earnings & Cash Flows Attractive Future Growth Prospects (NYSE Ethics) Best Practices Corporate Governance

A Diversified Electric and Gas Utility 9 Gross Margin in 2015: Electric: $663M Natural Gas: $178M Gross Margin in 2015: Montana: $729M South Dakota: $102M Nebraska: $ 10M Average Customers in 2015: Residential: 579k Commercial: 111k Industrial: 7k NorthWestern’s ‘80/20’ rules: Approximately 80% Electric, 80% Residential and 80% Montana jurisdictional Above data reflects full year 2015 results. Jurisdiction and service type based upon gross margin contribution. See “Non-GAAP Financial Measures” slide in appendix for Gross Margin reconciliation.

NorthWestern Energy Profile 10 Financial and Company Statistics See “Non-GAAP Financial Measure” slide in appendix for Net Debt and EBITDA reconciliation

Experienced & Engaged Board of Directors 11 Dr. E. Linn Draper Jr. • Chairman of the Board • Independent • Director since November 1, 2004 Stephan P. Adik • Committees: Audit (chair), Human Resources • Independent • Director since November 1, 2004 Dorothy M. Bradley • Committees: Human Resources, Governance and Innovation • Independent • Director since April 22, 2009 Robert C. Rowe • Committees: None • CEO and President • Director since August 13, 2008 Dana J. Dykhouse • Committees: Human Resources (chair), Audit • Independent • Director since January 30, 2009 Jan R. Horsfall • Committees: Audit, Governance and Innovation • Independent • Director since April 23, 2015 Julia L. Johnson • Committees: Governance and Innovation, Human Resources • Independent • Director since November 1, 2004
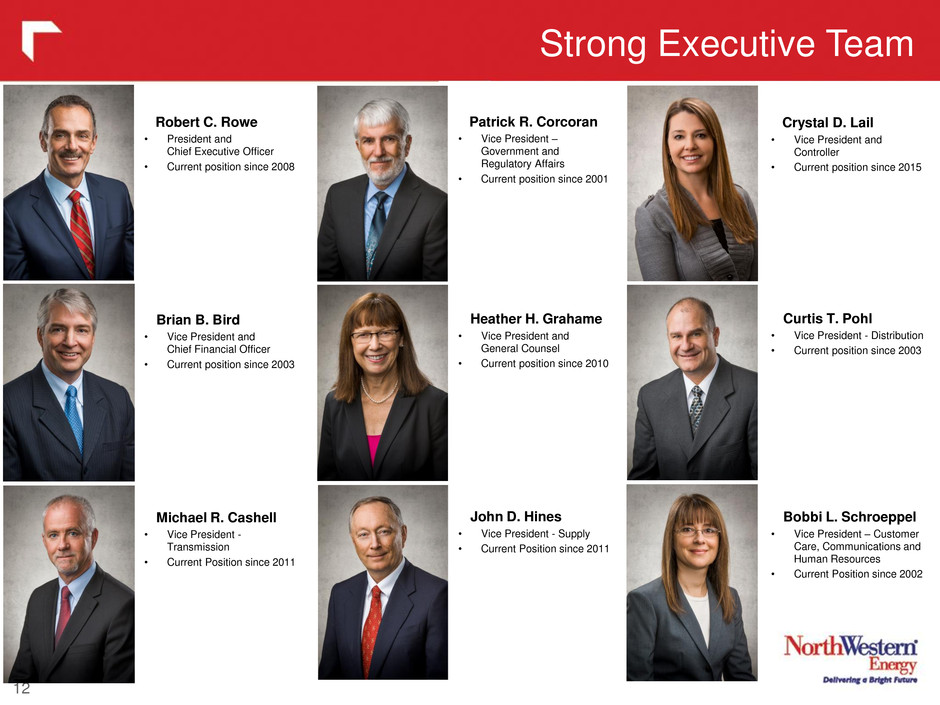
Strong Executive Team 12 Robert C. Rowe • President and Chief Executive Officer • Current position since 2008 Brian B. Bird • Vice President and Chief Financial Officer • Current position since 2003 Michael R. Cashell • Vice President - Transmission • Current Position since 2011 Patrick R. Corcoran • Vice President – Government and Regulatory Affairs • Current position since 2001 Heather H. Grahame • Vice President and General Counsel • Current position since 2010 John D. Hines • Vice President - Supply • Current Position since 2011 Crystal D. Lail • Vice President and Controller • Current position since 2015 Curtis T. Pohl • Vice President - Distribution • Current position since 2003 Bobbi L. Schroeppel • Vice President – Customer Care, Communications and Human Resources • Current Position since 2002

Solid Economic Indicators 13 • Unemployment rates in all three of our states are meaningfully below National Average. • Customer growth rates historically exceed National Averages. Source: NorthWestern customer growth - 2008-2015 Forms 10-K Unemployment Rate: US Department of Labor via SNL Database 2/19/16 Electric: EEI Statistical Yearbook (published December 2014, table 7.2) Natural Gas: EIA.gov (Data table "Number of Natural Gas Consumers")

Strong Utility Foundation 14 Electric source: Edison Electric Institute Typical Bills and Average Rates Report, 1/1/16 Natural gas source: US EIA - Monthly residential supply and delivery rates as of 1/29/16 Customer service satisfaction scores in line or better than survey average (JD Powers) Residential electric and natural gas rates below national average Solid electric system reliability and low gas leaks per mile System Average Interruption Duration Index (SAIDI) NWE versus EEI System Reliability Quartiles

Track Record of Delivering Results 15 Notes: - ROE in 2011, 2012 , 2013, 2014 & 2015 on a Non-GAAP Adjusted basis, would be 10.5%, 9.8%, 9.6% ,9.4% & 9.9% respectively. - 2016 ROAE and 2016 Dividend payout ratio estimate based on midpoint of our updated guidance range of $3.20-$3.35. - Details regarding Non-GAAP Adjusted EPS can be found in the “Adjusted EPS Schedule” page of the appendix Return on Equity within 9.5% - 11.0% band over the last 5 years. Annual dividend increases since emergence in 2004. 5 Year (2011-2015) Avg. Return on Equity: 10.4% 5 Year (2011-2015) CAGR Dividend Growth: 7.5% Current Dividend Yield Approximately 3.3%
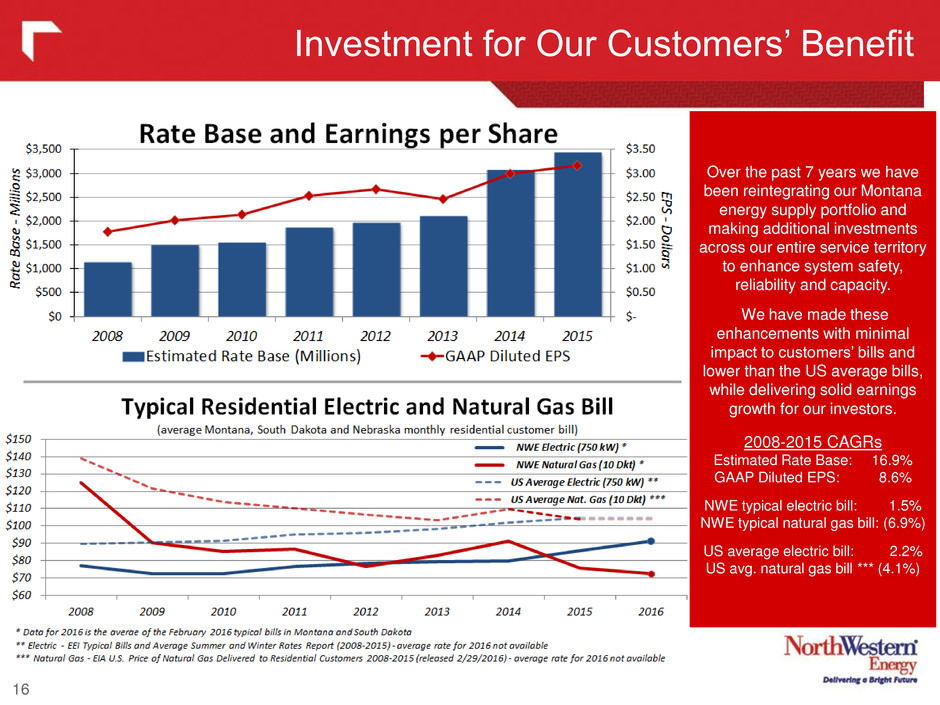
Investment for Our Customers’ Benefit 16 Over the past 7 years we have been reintegrating our Montana energy supply portfolio and making additional investments across our entire service territory to enhance system safety, reliability and capacity. We have made these enhancements with minimal impact to customers’ bills and lower than the US average bills, while delivering solid earnings growth for our investors. 2008-2015 CAGRs Estimated Rate Base: 16.9% GAAP Diluted EPS: 8.6% NWE typical electric bill: 1.5% NWE typical natural gas bill: (6.9%) US average electric bill: 2.2% US avg. natural gas bill *** (4.1%)

Total Shareholder Return 17 • 13 member peer group: ALE (Allete), AVA (Avista), BKH (Black Hills), EE (El Paso Electric), GXP (Great Plains), IDA (IDA Corp), MGEE (Madison Gas & Electric), OGE (OGE Energy), OTTR (Otter Tail Power), PNM (PNM Resources), POR (Portland Electric),, VVC (Vectren), WR (Westar)

While maintenance capex and total dividend payments have continued to grow since 2011 (16.6% and 14.8% CAGR respectively), Cash Flow from Operations has continued to outpace maintenance capex and averaged approximately $38 million of positive Free Cash Flow per year. With the addition of production tax credits from the Beethoven Wind project and continued flow-through tax benefits, we anticipate our effective tax rate rising into the low-twenties by 2020. Additionally, we expect NOLs to be available into 2020 to reduce cash taxes. Strong Cash Flows 18 (1) See “Non-GAAP Financial Measure” slide in appendix for Free Cash Flows reconciliation. Components of Free Cash Flow This expected tax rate and the expected availability of NOLs are subject to significant business, economic, regulatory and competitive uncertainties and contingencies, many of which are beyond the control of the Company and its management, and are based upon assumptions with respect to future decisions, which are subject to change. Actual results will vary and those variations may be material. For discussion of some of the important factors that could cause these variations, please consult the “Risk Factors” section of the preliminary prospectus. Nothing in this presentation should be regarded as a representation by any person that these objectives will be achieved and the Company undertakes no duty to update its objectives. (2) Net Operating Loss (NOL) Carryforward Balance (2) (1)

Balance Sheet and Credit Ratings Strength 19 Credit ratings went from junk bond to Single A ratings since emergence from bankruptcy. Target: 50% - 55% Annual ratio is average of each quarter end debt/cap ratio Excludes Basin Creek capital lease and New Market Credit Financing

2016 Updated Earnings Guidance 20 Our recently updated 2016 guidance range of $3.20 - $3.35 (originally $3.20 - $3.40) per diluted share is based upon, but not limited to, the following major assumptions and expectations: • Normal weather in our electric and natural gas service territories; • Excludes any potential additional impact as a result of the FERC decision regarding revenue allocation at our Dave Gates Generating Station; • A consolidated income tax rate of approximately 6% to 10% of pre-tax income (originally 9%-13%); and • Diluted average shares outstanding of approximately 48.6 million. Continued investment in our system to serve our customers and communities is expected to provide a targeted 7-10% total return to our investors through a combination of earnings growth and dividend yield. See “Non-GAAP Financial Measures” slide in appendix for “Non-GAAP “Adjusted EPS”. $2.60 - $2.75 $3.20-$3.35

The Hydro Facilities 21 Overview of Hydro Facilities Black Eagle Hydro Asset Integration • Montana Asset Optimization Study: As part of reintegrating the hydro facilities into our generation portfolio, we initiated an asset optimization study to maximize the value of our diverse generation portfolio. The study was recently completed and we are in the process of implementing new operating procedures that we anticipate will reduce both operating cost and market risk. Kerr Dam Conveyance / Hydro Compliance Filing • In accordance with the 1985 FERC relicensing, the facility was conveyed to the Confederated Salish and Kootenai Tribes (CSKT) on September 5, 2015. • As required by the MPSC order approving the hydro transaction, we filed a compliance filing in December 2015 to remove the Kerr project from the hydros cost of service and to adjust for actual revenue credits and property taxes. In January 2016, the MPSC approved an interim adjustment to our hydro rates based on the compliance filing, and opened a separate contested docket requesting additional detail on the adjustment to rates due to the conveyance of the Kerr Project. We expect the MPSC to issue a final order during the second half of 2016. (1) As of June 2013. Despite the 2015 drought conditions in western Montana, the hydro assets generated at targeted capacity (5 year historical average). Talen Energy’s recently announced sale of 292 MW of hydro generation for $860 million (or $2,945 per KW) to Brookfield Renewables is significantly higher cost (49%) than the 439 MW of hydro generation we purchased for $870 million (or $1,982 per KW).
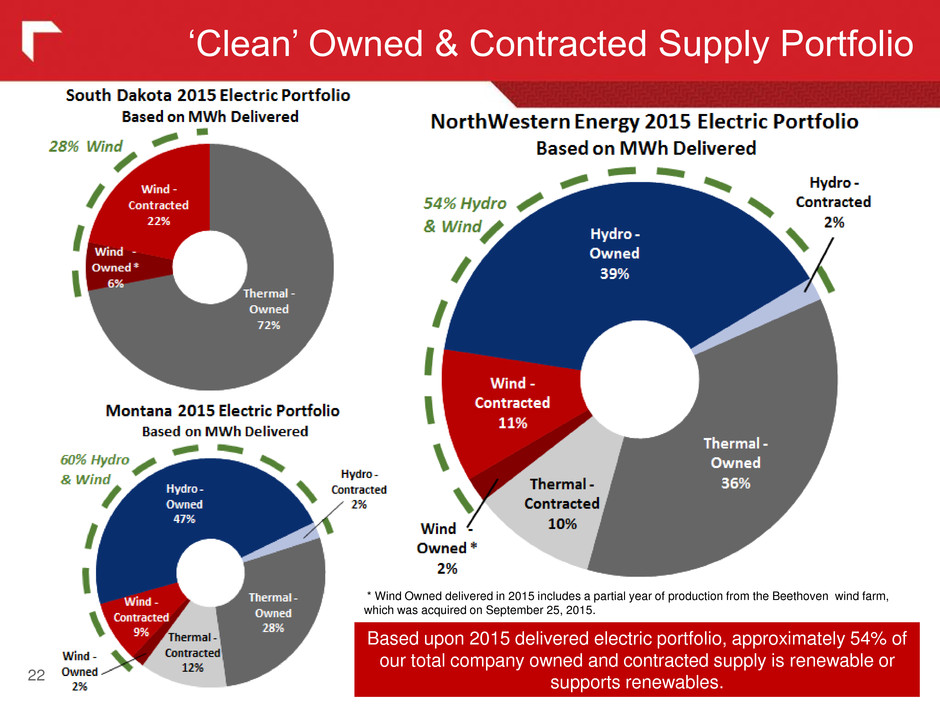
22 ‘Clean’ Owned & Contracted Supply Portfolio Based upon 2015 delivered electric portfolio, approximately 54% of our total company owned and contracted supply is renewable or supports renewables. * Wind Owned delivered in 2015 includes a partial year of production from the Beethoven wind farm, which was acquired on September 25, 2015.

23 South Dakota Electric Operations The owned and rate-based cost of energy from the Beethoven wind project over the next 20 years is expected to be $44 million ($25 million net present value) less than the PPA alternative, thus benefitting our customers’ bills over the long-term. Beethoven Wind Project: In September 2015, we completed the purchase of the 80 MW Beethoven wind project, near Tripp, South Dakota for approximately $143 million from BayWa r.e. Wind LLC. The SDPUC granted approval of our request on placing the assets into rate base using a 3-year levelized rate calculation. We financed the project with $70 million in 25 year bonds at 4.26% and $57 million of equity, issuing 1.1 million shares at $51.81. South Dakota Rate Case: In October 2015, the SDPUC commissioners approved the settlement agreement we reached with the SDPUC staff and intervenors providing for an increase in base rates of approximately $20.2 million based on an overall rate of return of 7.24%. In addition, the settlement would allow us to collect approximately $9.0 million annually related to the Beethoven Wind Project. Source: BayWa r.e. Wind, LLC We anticipate net income to increase by approximately $13.6 million in 2016 as a result of full year impact of the rate adjustment and Beethoven acquisition. SD Electric Transmission: Effective October 1, 2015, we are a transmission owning member of Southwest Power Pool (SPP) for our South Dakota transmission operations. Marketing activities in SPP are handled for us by a third party provider acting as our agent. Upon entering SPP, we exited out of MAPP, which had been our transmission planning region.

Big Stone and Neal Air Quality Projects 24 Big Stone Power Plant Neal Power Plant

Capital Spending Forecast 25 Current estimated cumulative capital spending for 2016 through 2020 is $1.66 billion. This reflects a $187 million increase from the capital plan included in our 2015 10-K; approximately $122 million increase for internal combustion units in Montana and $65 million increase for a peaking facility in South Dakota. Spending on the added generation assets will be subject to the development of a plan for clear regulatory recovery. Additional information is available in our 2015 Montana and 2014 South Dakota Electric Resource Supply Plans. We anticipate funding the capital projects with a combination of cash flows, aided by NOLs anticipated to be available into 2020, and long-term debt. If other opportunities arise that are not in the above projections (natural gas reserves, acquisitions, etc.), new equity funding may be necessary. * .0M

Conclusion 26 Pure Electric and Gas Utility Solid Utility Foundation Strong Earnings and Cash Flows Attractive Future Growth Prospects Best Practices Corporate Governance

Appendix 27

Big Stone Air Quality Control System 28 NorthWestern’s $98 million investment in Big Stone’s federally required Air Quality Control System is nearly twice our initial investment in the facilities in 1975 and and nearly 7x its current depreciated net book value. $98 million investment for federally required pollution control equipment
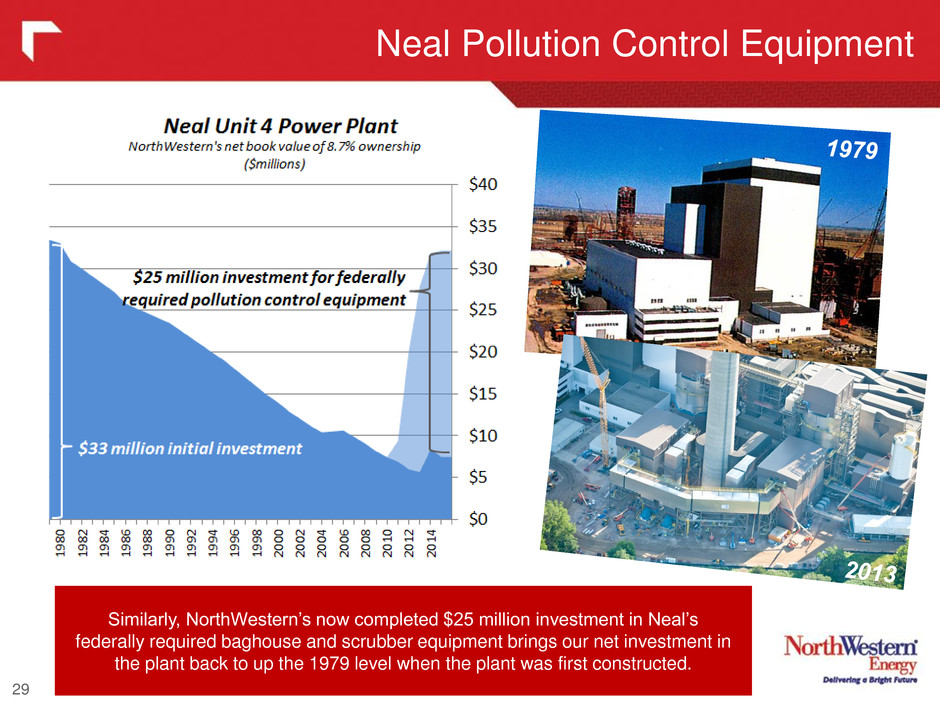
Neal Pollution Control Equipment 29 Similarly, NorthWestern’s now completed $25 million investment in Neal’s federally required baghouse and scrubber equipment brings our net investment in the plant back to up the 1979 level when the plant was first constructed.

South Dakota Rate Filing 30 34 Years of Declining ‘Real’ Rates Docket EL14-106 The requested $26.5 million revenue increase was primarily due to investments made to meet federal environmental mandates and to maintain our high-level of system reliability in South Dakota. Of the $26.5 million requested , the SD PUC approved $20.2 million (15.4%) increase in base rates in October 2015. Three major projects alone account for 96% of the requested $26.5M increase. Big Stone/Neal……..$15.2M Aberdeen Peaker……$7.4M Yankton Substation…$2.8M All other……………...$1.1M Total $26.5M
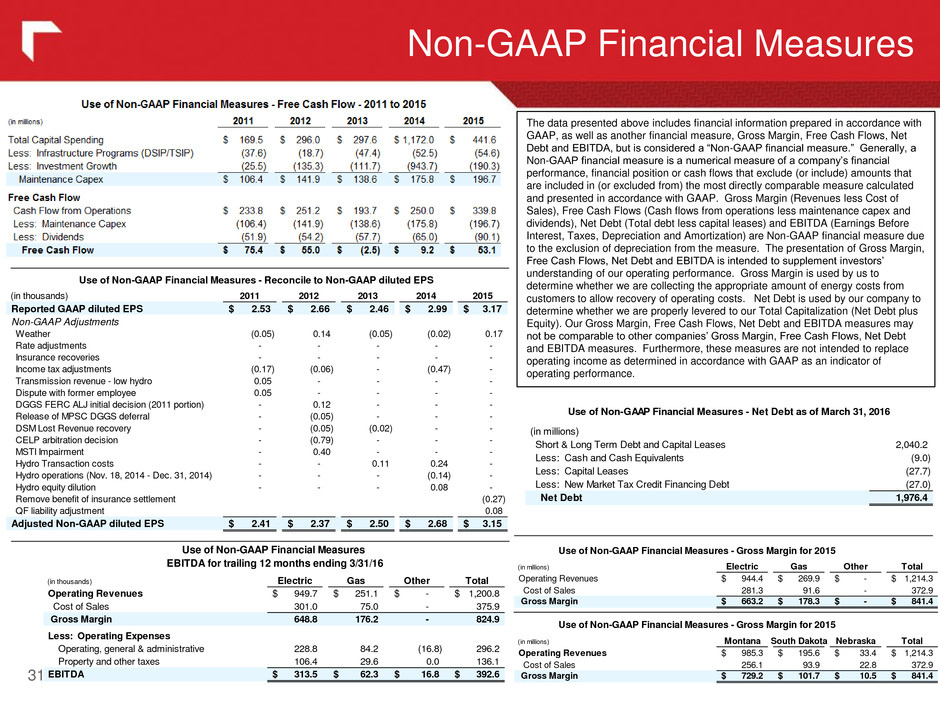
Non-GAAP Financial Measures 31 The data presented above includes financial information prepared in accordance with GAAP, as well as another financial measure, Gross Margin, Free Cash Flows, Net Debt and EBITDA, but is considered a “Non-GAAP financial measure.” Generally, a Non-GAAP financial measure is a numerical measure of a company’s financial performance, financial position or cash flows that exclude (or include) amounts that are included in (or excluded from) the most directly comparable measure calculated and presented in accordance with GAAP. Gross Margin (Revenues less Cost of Sales), Free Cash Flows (Cash flows from operations less maintenance capex and dividends), Net Debt (Total debt less capital leases) and EBITDA (Earnings Before Interest, Taxes, Depreciation and Amortization) are Non-GAAP financial measure due to the exclusion of depreciation from the measure. The presentation of Gross Margin, Free Cash Flows, Net Debt and EBITDA is intended to supplement investors’ understanding of our operating performance. Gross Margin is used by us to determine whether we are collecting the appropriate amount of energy costs from customers to allow recovery of operating costs. Net Debt is used by our company to determine whether we are properly levered to our Total Capitalization (Net Debt plus Equity). Our Gross Margin, Free Cash Flows, Net Debt and EBITDA measures may not be comparable to other companies’ Gross Margin, Free Cash Flows, Net Debt and EBITDA measures. Furthermore, these measures are not intended to replace operating income as determined in accordance with GAAP as an indicator of operating performance. (in thousands) Electric Gas Other Total Operating Revenues 949.7$ 251.1$ -$ 1,200.8$ Cost of Sales 301.0 75.0 - 375.9 Gross Margin 648.8 176.2 - 824.9 Less: Operating Expenses Operating, general & administrative 228.8 84.2 (16.8) 296.2 Property and other taxes 106.4 29.6 0.0 136.1 EBITDA 313.5$ 62.3$ 16.8$ 392.6$ Use of Non-GAAP Financial Measures EBITDA for trailing 12 months ending 3/31/16 (in thousands) 2011 2012 2013 2014 2015 Reported GAAP diluted EPS 2.53$ 2.66$ 2.46$ 2.99$ 3.17$ Non-GAAP Adjustments Weather (0.05) 0.14 (0.05) (0.02) 0.17 Rate adjustments - - - - - Insurance recoveries - - - - - Income tax adjustments (0.17) (0.06) - (0.47) - Transmission revenue - low hydro 0.05 - - - - Dispute with former employee 0.05 - - - - DGGS FERC ALJ initial decision (2011 portion) - 0.12 - - - Release of MPSC DGGS deferral - (0.05) - - - DSM Lost Revenue recovery - (0.05) (0.02) - - CELP arbitratio cisi n - (0.79) - - - MSTI Impairm t - 0.40 - - - Hydro Transac io c st - - 0.11 0.24 - Hydro operatio s (N v. 18, 2014 - Dec. 31, 2014) - - - (0.14) - Hydro equity dilution - - - 0.08 - Remove benefit of insurance settlement (0.27) QF li bility adjustment 0.08 Adju ted Non-GAAP diluted EPS 2.41$ 2.37$ 2.50$ 2.68$ 3.15$ Use of Non-GAAP Financial Measures - Reconcile to Non-GAAP diluted EPS (in millions) Electric Gas Other Total Operating Revenues 944.4$ 269.9$ -$ 1,214.3$ Cost of Sales 281.3 91.6 - 372.9 Gross Margin 663.2$ 178.3$ -$ 841.4$ (in millions) Montana South Dakota Nebraska Total Operating Revenues 985.3$ 195.6$ 33.4$ 1,214.3$ Cost of Sales 256.1 93.9 22.8 372.9 Gross Margin 729.2$ 101.7$ 10.5$ 841.4$ Use of Non-GAAP Financial Measures - Gross Margin for 2015 Use of Non-GAAP Financial Measures - Gross Margin for 2015 (in millions) Short & Long Term Debt and Capital Leases 2,040.2 L ss: Cash and Cash Equivalents (9.0) Le s: Capital Leases (27.7) Less: New Market Tax Credit Financing Debt (27.0) Net Debt 1,976.4 Us of Non-GAAP Financi l Measures - N t Debt as of March 31, 016

32
