Attached files
| file | filename |
|---|---|
| EX-32.2 - EXHIBIT 32.2 CERTIFICATION OF BRIAN B. BIRD PURSUANT TO SECTION 906 - NORTHWESTERN CORP | ex322certificationq12016.htm |
| EX-31.2 - EXHIBIT 31.2 CERTIFICATION OF CHIEF FINANCIAL OFFICER - NORTHWESTERN CORP | ex312certificationq12016.htm |
| EX-32.1 - EXHIBIT 32.1 CERTIFICATION OF ROBERT C. ROWE PURSUANT TO SECTION 906 - NORTHWESTERN CORP | ex321certificationq12016.htm |
| EX-31.1 - EXHIBIT 31.1 CERTIFICATION OF CHIEF EXECUTIVE OFFICER - NORTHWESTERN CORP | ex311certificationq12016.htm |
UNITED STATES
SECURITIES AND EXCHANGE COMMISSION
WASHINGTON, D.C. 20549
FORM 10-Q
(mark one) | ||
x | QUARTERLY REPORT PURSUANT TO SECTION 13 OR 15(d) OF THE SECURITIES EXCHANGE ACT OF 1934 | |
For the quarterly period ended March 31, 2016 | ||
OR | ||
o | TRANSITION REPORT PURSUANT TO SECTION 13 OR 15(d) OF THE SECURITIES EXCHANGE ACT OF 1934 | |
For the transition period from to
Commission File Number: 1-10499

NORTHWESTERN CORPORATION
(Exact name of registrant as specified in its charter)
Delaware | 46-0172280 | |
(State or other jurisdiction of incorporation or organization) | (I.R.S. Employer Identification No.) | |
3010 W. 69th Street, Sioux Falls, South Dakota | 57108 | |
(Address of principal executive offices) | (Zip Code) | |
Registrant’s telephone number, including area code: 605-978-2900 | ||
Indicate by check mark whether the registrant (1) has filed all reports required to be filed by Section 13 or 15(d) of the Securities Exchange Act of 1934 during the preceding 12 months (or for such shorter period that the registrant was required to file such reports), and (2) has been subject to such filing requirements for the past 90 days. Yes x No o
Indicate by check mark whether the registrant has submitted electronically and posted on its corporate Web site, if any, every Interactive Data File required to be submitted and posted pursuant to Rule 405 of Regulation S-T (§232.405 of this chapter) during the preceding 12 months (or for such shorter period that the registrant was required to submit and post such files). Yes x No o
Indicate by check mark whether the registrant is a large accelerated filer, an accelerated filer, a non- accelerated filer or a smaller reporting company. See the definitions of “large accelerated filer,” “accelerated filer” and “smaller reporting company” in Rule 12b-2 of the Exchange Act.
Large Accelerated Filer x | Accelerated Filer o | Non-accelerated Filer o | Smaller Reporting Company o |
Indicate by check mark whether the registrant is a shell company (as defined in Rule 12b-2 of the Exchange Act). Yes o No x
Indicate the number of shares outstanding of each of the issuer’s classes of common stock, as of the latest practicable date:
Common Stock, Par Value $0.01
48,306,885 shares outstanding at April 15, 2016
1
NORTHWESTERN CORPORATION
FORM 10-Q
INDEX
Page | ||
Condensed Consolidated Statements of Income — Three Months Ended March 31, 2016 and 2015 | ||
Condensed Consolidated Statements of Comprehensive Income — Three Months Ended March 31, 2016 and 2015 | ||
Condensed Consolidated Balance Sheets — March 31, 2016 and December 31, 2015 | ||
Condensed Consolidated Statements of Cash Flows — Three Months Ended March 31, 2016 and 2015 | ||
Condensed Consolidated Statements of Shareholders' Equity — Three Months Ended March 31, 2016 and 2015 | ||
2
SPECIAL NOTE REGARDING FORWARD-LOOKING STATEMENTS
On one or more occasions, we may make statements in this Quarterly Report on Form 10-Q regarding our assumptions, projections, expectations, targets, intentions or beliefs about future events. All statements other than statements of historical facts, included or incorporated by reference in this Quarterly Report, relating to management's current expectations of future financial performance, continued growth, changes in economic conditions or capital markets and changes in customer usage patterns and preferences are forward-looking statements within the meaning of Section 27A of the Securities Act of 1933 and Section 21E of the Securities Exchange Act of 1934.
Words or phrases such as “anticipates," “may," “will," “should," “believes," “estimates," “expects," “intends," “plans," “predicts," “projects," “targets," “will likely result," “will continue" or similar expressions identify forward-looking statements. Forward-looking statements involve risks and uncertainties, which could cause actual results or outcomes to differ materially from those expressed. We caution that while we make such statements in good faith and believe such statements are based on reasonable assumptions, including without limitation, management's examination of historical operating trends, data contained in records and other data available from third parties, we cannot assure you that we will achieve our projections. Factors that may cause such differences include, but are not limited to:
• | adverse determinations by regulators, as well as potential adverse federal, state, or local legislation or regulation, including costs of compliance with existing and future environmental requirements, could have a material effect on our liquidity, results of operations and financial condition; |
• | changes in availability of trade credit, creditworthiness of counterparties, usage, commodity prices, fuel supply costs or availability due to higher demand, shortages, weather conditions, transportation problems or other developments, may reduce revenues or may increase operating costs, each of which could adversely affect our liquidity and results of operations; |
• | unscheduled generation outages or forced reductions in output, maintenance or repairs, which may reduce revenues and increase cost of sales or may require additional capital expenditures or other increased operating costs; and |
• | adverse changes in general economic and competitive conditions in the U.S. financial markets and in our service territories. |
We have attempted to identify, in context, certain of the factors that we believe may cause actual future experience and results to differ materially from our current expectation regarding the relevant matter or subject area. In addition to the items specifically discussed above, our business and results of operations are subject to the uncertainties described under the caption “Risk Factors” which is part of the disclosure included in Part II, Item 1A of this Quarterly Report on Form 10-Q.
From time to time, oral or written forward-looking statements are also included in our reports on Forms 10-K, 10-Q and 8-K, Proxy Statements on Schedule 14A, press releases, analyst and investor conference calls, and other communications released to the public. We believe that at the time made, the expectations reflected in all of these forward-looking statements are and will be reasonable. However, any or all of the forward-looking statements in this Quarterly Report on Form 10-Q, our reports on Forms 10-K and 8-K, our other reports on Form 10-Q, our Proxy Statements on Schedule 14A and any other public statements that are made by us may prove to be incorrect. This may occur as a result of assumptions, which turn out to be inaccurate, or as a consequence of known or unknown risks and uncertainties. Many factors discussed in this Quarterly Report on Form 10-Q, certain of which are beyond our control, will be important in determining our future performance. Consequently, actual results may differ materially from those that might be anticipated from forward-looking statements. In light of these and other uncertainties, you should not regard the inclusion of any of our forward-looking statements in this Quarterly Report on Form 10-Q or other public communications as a representation by us that our plans and objectives will be achieved, and you should not place undue reliance on such forward-looking statements.
We undertake no obligation to publicly update or revise any forward-looking statements, whether as a result of new information, future events or otherwise. However, your attention is directed to any further disclosures made on related subjects in our subsequent reports filed with the Securities and Exchange Commission (SEC) on Forms 10-K, 10-Q and 8-K and Proxy Statements on Schedule 14A.
Unless the context requires otherwise, references to “we,” “us,” “our,” “NorthWestern Corporation,” “NorthWestern Energy,” and “NorthWestern” refer specifically to NorthWestern Corporation and its subsidiaries.
3
PART 1. FINANCIAL INFORMATION | ||||
ITEM 1. | FINANCIAL STATEMENTS |
NORTHWESTERN CORPORATION
CONDENSED CONSOLIDATED STATEMENTS OF INCOME
(Unaudited)
(in thousands, except per share amounts)
Three Months Ended March 31, | ||||||||
2016 | 2015 | |||||||
Revenues | ||||||||
Electric | $ | 241,342 | $ | 236,046 | ||||
Gas | 91,197 | 109,965 | ||||||
Total Revenues | 332,539 | 346,011 | ||||||
Operating Expenses | ||||||||
Cost of sales | 115,434 | 112,391 | ||||||
Operating, general and administrative | 79,861 | 81,123 | ||||||
Property and other taxes | 35,421 | 32,787 | ||||||
Depreciation and depletion | 39,890 | 35,819 | ||||||
Total Operating Expenses | 270,606 | 262,120 | ||||||
Operating Income | 61,933 | 83,891 | ||||||
Interest Expense, net | (24,509 | ) | (23,115 | ) | ||||
Other Income | 3,102 | 665 | ||||||
Income Before Income Taxes | 40,526 | 61,441 | ||||||
Income Tax Expense | (2,472 | ) | (10,016 | ) | ||||
Net Income | $ | 38,054 | $ | 51,425 | ||||
Average Common Shares Outstanding | 48,242 | 46,977 | ||||||
Basic Earnings per Average Common Share | $ | 0.79 | $ | 1.09 | ||||
Diluted Earnings per Average Common Share | $ | 0.79 | $ | 1.09 | ||||
Dividends Declared per Common Share | $ | 0.50 | $ | 0.48 | ||||
See Notes to Condensed Consolidated Financial Statements
4
NORTHWESTERN CORPORATION
CONDENSED CONSOLIDATED STATEMENTS OF COMPREHENSIVE INCOME
(Unaudited)
(in thousands)
Three Months Ended March 31, | ||||||||
2016 | 2015 | |||||||
Net Income | $ | 38,054 | $ | 51,425 | ||||
Other comprehensive (loss) income, net of tax: | ||||||||
Foreign currency translation | (118 | ) | 268 | |||||
Cash flow hedges: | ||||||||
Reclassification of net losses (gains) on derivative instruments | 37 | (89 | ) | |||||
Total Other Comprehensive (Loss) Income | (81 | ) | 179 | |||||
Comprehensive Income | $ | 37,973 | $ | 51,604 | ||||
See Notes to Condensed Consolidated Financial Statements
5
NORTHWESTERN CORPORATION
CONDENSED CONSOLIDATED BALANCE SHEETS
(Unaudited)
(in thousands, except share data)
March 31, 2016 | December 31, 2015 | ||||||
ASSETS | |||||||
Current Assets: | |||||||
Cash and cash equivalents | $ | 9,027 | $ | 11,980 | |||
Restricted cash | 6,831 | 6,634 | |||||
Accounts receivable, net | 134,983 | 154,410 | |||||
Inventories | 46,633 | 53,458 | |||||
Regulatory assets | 40,798 | 51,348 | |||||
Other | 12,204 | 8,830 | |||||
Total current assets | 250,476 | 286,660 | |||||
Property, plant, and equipment, net | 4,069,086 | 4,059,499 | |||||
Goodwill | 357,586 | 357,586 | |||||
Regulatory assets | 535,447 | 517,223 | |||||
Other noncurrent assets | 48,578 | 43,727 | |||||
Total Assets | $ | 5,261,173 | $ | 5,264,695 | |||
LIABILITIES AND SHAREHOLDERS' EQUITY | |||||||
Current Liabilities: | |||||||
Current maturities of capital leases | $ | 1,871 | $ | 1,837 | |||
Short-term borrowings | 161,913 | 229,874 | |||||
Accounts payable | 56,522 | 74,511 | |||||
Accrued expenses | 219,872 | 183,988 | |||||
Regulatory liabilities | 78,019 | 80,990 | |||||
Total current liabilities | 518,197 | 571,200 | |||||
Long-term capital leases | 25,849 | 26,325 | |||||
Long-term debt | 1,768,393 | 1,768,183 | |||||
Deferred income taxes | 527,343 | 501,532 | |||||
Noncurrent regulatory liabilities | 383,554 | 378,711 | |||||
Other noncurrent liabilities | 423,166 | 418,570 | |||||
Total Liabilities | 3,646,502 | 3,664,521 | |||||
Commitments and Contingencies (Note 12) | |||||||
Shareholders' Equity: | |||||||
Common stock, par value $0.01; authorized 200,000,000 shares; issued and outstanding 51,954,883 and 48,306,885 shares, respectively; Preferred stock, par value $0.01; authorized 50,000,000 shares; none issued | 520 | 518 | |||||
Treasury stock at cost | (96,346 | ) | (93,948 | ) | |||
Paid-in capital | 1,379,133 | 1,376,291 | |||||
Retained earnings | 340,041 | 325,909 | |||||
Accumulated other comprehensive loss | (8,677 | ) | (8,596 | ) | |||
Total Shareholders' Equity | 1,614,671 | 1,600,174 | |||||
Total Liabilities and Shareholders' Equity | $ | 5,261,173 | $ | 5,264,695 | |||
See Notes to Condensed Consolidated Financial Statements
6
NORTHWESTERN CORPORATION
CONDENSED CONSOLIDATED STATEMENTS OF CASH FLOWS
(Unaudited)
(in thousands)
Three Months Ended March 31, | |||||||
2016 | 2015 | ||||||
OPERATING ACTIVITIES: | |||||||
Net income | $ | 38,054 | $ | 51,425 | |||
Items not affecting cash: | |||||||
Depreciation and depletion | 39,890 | 35,819 | |||||
Amortization of debt issue costs, discount and deferred hedge gain | 979 | 287 | |||||
Stock-based compensation costs | 2,242 | 1,246 | |||||
Equity portion of allowance for funds used during construction | (652 | ) | (1,707 | ) | |||
Gain on disposition of assets | (55 | ) | (88 | ) | |||
Deferred income taxes | 4,890 | 9,007 | |||||
Changes in current assets and liabilities: | |||||||
Restricted cash | (197 | ) | 165 | ||||
Accounts receivable | 19,427 | 14,636 | |||||
Inventories | 6,825 | 7,057 | |||||
Other current assets | (3,374 | ) | 1,004 | ||||
Accounts payable | (11,303 | ) | (23,179 | ) | |||
Accrued expenses | 38,023 | 12,653 | |||||
Regulatory assets | 10,550 | 16,770 | |||||
Regulatory liabilities | (2,971 | ) | 840 | ||||
Other noncurrent assets | (1,485 | ) | (782 | ) | |||
Other noncurrent liabilities | 1,293 | 1,648 | |||||
Cash Provided by Operating Activities | 142,136 | 126,801 | |||||
INVESTING ACTIVITIES: | |||||||
Property, plant, and equipment additions | (51,318 | ) | (56,538 | ) | |||
Proceeds from sale of assets | 51 | 80 | |||||
Change in restricted cash | — | 4,806 | |||||
Cash Used in Investing Activities | (51,267 | ) | (51,652 | ) | |||
FINANCING ACTIVITIES: | |||||||
Treasury stock activity | (1,788 | ) | (1,991 | ) | |||
Dividends on common stock | (23,922 | ) | (22,376 | ) | |||
Repayments on long-term debt | — | (7 | ) | ||||
Repayments of short-term borrowings, net | (67,961 | ) | (57,936 | ) | |||
Financing costs | (151 | ) | (1,092 | ) | |||
Cash Used in Financing Activities | (93,822 | ) | (83,402 | ) | |||
Decrease in Cash and Cash Equivalents | (2,953 | ) | (8,253 | ) | |||
Cash and Cash Equivalents, beginning of period | 11,980 | 20,362 | |||||
Cash and Cash Equivalents, end of period | $ | 9,027 | $ | 12,109 | |||
Supplemental Cash Flow Information: | |||||||
Cash (received) paid during the period for: | |||||||
Income taxes | $ | (2,948 | ) | $ | 27 | ||
Interest | 12,977 | 12,213 | |||||
Significant non-cash transactions: | |||||||
Capital expenditures included in trade accounts payable | 5,805 | 6,395 | |||||
See Notes to Condensed Consolidated Financial Statements
7
NORTHWESTERN CORPORATION
CONSOLIDATED STATEMENTS OF COMMON SHAREHOLDERS' EQUITY
(Unaudited)
(in thousands, except per share data)
Number of Common Shares | Number of Treasury Shares | Common Stock | Paid in Capital | Treasury Stock | Retained Earnings | Accumulated Other Comprehensive Loss | Total Shareholders' Equity | ||||||||||||||||||||||
Balance at December 31, 2014 | 50,522 | 3,607 | $ | 505 | $ | 1,313,844 | $ | (92,558 | ) | $ | 264,758 | $ | (8,766 | ) | $ | 1,477,783 | |||||||||||||
Net income | — | — | — | — | — | 51,425 | — | 51,425 | |||||||||||||||||||||
Foreign currency translation adjustment | — | — | — | — | — | — | 268 | 268 | |||||||||||||||||||||
Reclassification of net gains on derivative instruments from OCI to net income, net of tax | — | — | — | — | — | — | (89 | ) | (89 | ) | |||||||||||||||||||
Stock-based compensation | 161 | 38 | — | 1,338 | (2,085 | ) | — | — | (747 | ) | |||||||||||||||||||
Issuance of shares | — | — | 2 | (122 | ) | — | — | — | (120 | ) | |||||||||||||||||||
Dividends on common stock ($0.48 per share) | — | — | — | — | — | (22,376 | ) | — | (22,376 | ) | |||||||||||||||||||
Balance at March 31, 2015 | 50,683 | 3,645 | $ | 507 | $ | 1,315,060 | $ | (94,643 | ) | $ | 293,807 | $ | (8,587 | ) | $ | 1,506,144 | |||||||||||||
Balance at December 31, 2015 | 51,789 | 3,617 | $ | 518 | $ | 1,376,291 | $ | (93,948 | ) | $ | 325,909 | $ | (8,596 | ) | $ | 1,600,174 | |||||||||||||
Net income | — | — | — | — | — | 38,054 | — | 38,054 | |||||||||||||||||||||
Foreign currency translation adjustment | — | — | — | — | — | — | (118 | ) | (118 | ) | |||||||||||||||||||
Reclassification of net losses on derivative instruments from OCI to net income, net of tax | — | — | — | — | — | — | 37 | 37 | |||||||||||||||||||||
Stock-based compensation | 166 | 31 | — | 2,853 | (2,398 | ) | — | — | 455 | ||||||||||||||||||||
Issuance of shares | — | — | 2 | (11 | ) | — | — | — | (9 | ) | |||||||||||||||||||
Dividends on common stock ($0.50 per share) | — | — | — | — | — | (23,922 | ) | — | (23,922 | ) | |||||||||||||||||||
Balance at March 31, 2016 | 51,955 | 3,648 | $ | 520 | $ | 1,379,133 | $ | (96,346 | ) | $ | 340,041 | $ | (8,677 | ) | $ | 1,614,671 | |||||||||||||
8
NOTES TO CONDENSED CONSOLIDATED FINANCIAL STATEMENTS
(Reference is made to Notes to Financial Statements included in NorthWestern Corporation’s Annual Report)
(Unaudited)
(1) | Nature of Operations and Basis of Consolidation |
NorthWestern Corporation, doing business as NorthWestern Energy, provides electricity and natural gas to approximately 701,000 customers in Montana, South Dakota and Nebraska.
The preparation of financial statements in conformity with accounting principles generally accepted in the United States of America (GAAP) requires management to make estimates and assumptions that may affect the reported amounts of assets, liabilities, revenues and expenses during the reporting period. Actual results could differ from those estimates. The unaudited Condensed Consolidated Financial Statements (Financial Statements) reflect all adjustments (which unless otherwise noted are normal and recurring in nature) that are, in the opinion of management, necessary to fairly present our financial position, results of operations and cash flows. The actual results for the interim periods are not necessarily indicative of the operating results to be expected for a full year or for other interim periods. Events occurring subsequent to March 31, 2016, have been evaluated as to their potential impact to the Financial Statements through the date of issuance.
The Financial Statements included herein have been prepared by NorthWestern, without audit, pursuant to the rules and regulations of the SEC. Certain information and footnote disclosures normally included in financial statements prepared in accordance with GAAP have been condensed or omitted pursuant to such rules and regulations; however, management believes that the condensed disclosures provided are adequate to make the information presented not misleading. Management recommends that these unaudited Financial Statements be read in conjunction with the audited financial statements and related footnotes included in our Annual Report on Form 10-K for the year ended December 31, 2015.
Variable Interest Entities
A reporting company is required to consolidate a variable interest entity (VIE) as its primary beneficiary, which means it has a controlling financial interest, when it has both the power to direct the activities of the VIE that most significantly impact the VIE's economic performance, and the obligation to absorb losses or the right to receive benefits from the VIE that could potentially be significant to the VIE. An entity is considered to be a VIE when its total equity investment at risk is not sufficient to permit the entity to finance its activities without additional subordinated financial support, or its equity investors, as a group, lack the characteristics of having a controlling financial interest. The determination of whether a company is required to consolidate an entity is based on, among other things, an entity’s purpose and design and a company’s ability to direct the activities of the entity that most significantly impact the entity’s economic performance.
Certain long-term purchase power and tolling contracts may be considered variable interests. We have various long-term purchase power contracts with other utilities and certain Qualifying Facility (QF) plants. We identified one QF contract that may constitute a VIE. We entered into a power purchase contract in 1984 with this 35 Megawatt (MW) coal-fired QF to purchase substantially all of the facility's capacity and electrical output over a substantial portion of its estimated useful life. We absorb a portion of the facility's variability through annual changes to the price we pay per Megawatt Hour (MWH) (energy payment). After making exhaustive efforts, we have been unable to obtain the information from the facility necessary to determine whether the facility is a VIE or whether we are the primary beneficiary of the facility. The contract with the facility contains no provision which legally obligates the facility to release this information. We have accounted for this QF contract as an executory contract. Based on the current contract terms with this QF, our estimated gross contractual payments aggregate approximately $266.6 million through 2024.
(2) New Accounting Standards
Accounting Standards Issued
In May 2014, the Financial Accounting Standards Board (FASB) issued accounting guidance on the recognition of revenue from contracts with customers, which will supersede nearly all existing revenue recognition guidance under GAAP. Under the new standard, entities will recognize revenue to depict the transfer of goods and services to customers in amounts that reflect the payment to which the entity expects to be entitled in exchange for those goods or services. The guidance also requires additional disclosure about the nature, amount, timing and uncertainty of revenue and cash flows from an entity’s contracts with customers. The FASB delayed the effective date of this guidance to the first quarter of 2018, with early adoption permitted as of the original effective date of the first quarter of 2017. We are currently evaluating the impact of adoption of this new guidance on our Financial Statements and disclosures.
9
In February 2016, the FASB issued revised guidance on accounting for leases. The new standard requires a lessee to recognize in the balance sheet a liability to make lease payments (the lease liability) and a right-of-use asset representing its right to use the underlying asset for the lease term for all leases with terms longer than 12 months. Leases with a term of 12 months or less will be accounted for similar to existing guidance for operating leases. Recognition, measurement and presentation of expenses will depend on classification as a finance or operating lease. The new guidance will be effective for us in our first quarter of 2019 and early adoption is permitted. A modified retrospective transition approach is required for lessees for capital and operating leases existing at, or entered into after, the beginning of the earliest comparative period presented in the financial statements. We are currently evaluating the impact of adoption of this guidance, and based on our initial analysis do not expect it to have a significant impact on our Financial Statements and disclosures.
In March 2016, the FASB issued guidance revising certain elements of the accounting for share-based payments. The new standard is intended to simplify several aspects of the accounting for share-based payment award transactions including: (a) income tax consequences; (b) classification of awards as either equity or liabilities; and (c) classification on the statement of cash flows. The new guidance will be effective for us in our first quarter of 2017, with early adoption permitted. We are currently evaluating the impact of adoption of this guidance on our Financial Statements and disclosures.
Accounting Standards Adopted
In February 2015, the FASB issued consolidation guidance that eliminated two consolidation models and requires all legal
entities to be evaluated under a voting interest entity model or a variable interest entity model. Both models require the reporting entity to identify whether it has a controlling financial interest in a legal entity and is therefore required to consolidate the entity. We adopted this guidance during the first quarter of 2016 with no material impact to our Financial Statements and disclosures.
In April 2015, the FASB issued accounting guidance that changes the presentation of debt issuance costs. The core principle of this revised accounting guidance is that debt issuance costs are not assets, but adjustments to the carrying cost of debt. During the first quarter of 2016, we retrospectively adopted this guidance. The implementation of this accounting standard resulted in a reduction of other noncurrent assets and long-term debt of $13.9 million in the Condensed Consolidated Balance Sheets as of December 31, 2015.
(3) Regulatory Matters
Montana Electric and Natural Gas Tracker Filings
Each year we submit an electric and natural gas tracker filing for recovery of supply costs for the 12-month period ended June 30 and for the projected supply costs for the next 12-month period. The Montana Public Service Commission (MPSC) reviews such filings and makes its cost recovery determination based on whether or not our supply procurement activities were prudent.
Electric Tracker - Our 2012/2013 and 2013/2014 tracker periods are part of consolidated dockets. The 2013/2014 electric tracker filing included market purchases made between July 2013 and January 2014 for replacement power during an outage at Colstrip Unit 4. Inclusion of these costs in the tracker filing is consistent with the treatment of replacement power during previous Colstrip Unit 4 outage costs. During a June 2014 MPSC work session, these incremental market purchases related to the Colstrip Unit 4 outage were identified by the MPSC for additional prudency review.
For the 2014/2015 electric supply tracker, we reached a Stipulation and Settlement Agreement in November 2015 between us and the Montana Consumer Counsel (MCC) (Electric Stipulation), which requires us to include a $0.7 million reduction for production tax credits, suspend certain types of hedging of purchase power costs without first obtaining approval from the MPSC, and to make a compliance filing to remove lost revenues from electric rates effective December 1, 2015.
The MPSC held a work session in March 2016 and, in a 3 - 2 decision, directed staff to draft a final order in the 2012/2013 and 2013/2014 consolidated tracker docket disallowing both replacement power costs from the outage at Colstrip Unit 4 and costs related to generation portfolio modeling. The MPSC also directed staff to draft an order in the 2014/2015 tracker addressing the Electric Stipulation and disallowing modeling costs. Based on this March 2016 oral decision, we recorded a disallowance totaling approximately $10.3 million, which includes $8.2 million of replacement power costs and $2.1 million of modeling costs, and is reflected in cost of sales in the Condensed Consolidated Statement of Income for the three months ended March 31, 2016. In April 2016, we received a final written order in the 2014/2015 tracker consistent with the oral decision, and
10
expect the MPSC to issue a final order in the consolidated 2012/2013 and 2013/2014 tracker dockets in the second quarter of 2016. We will evaluate our legal options once we receive a final written order in the consolidated docket.
Natural Gas Tracker - In October 2015, we received a final order in the natural gas consolidated 2013/2014 and 2012/2013 tracker docket, which allows us to continue collecting the cost of service for natural gas production interests acquired in December 2013 and in August 2012 in northern Montana's Bear Paw Basin (Bear Paw) on an interim basis until approval is received for inclusion of these assets in rate base. The MPSC final order requires that we revise the bridge rates currently used to reflect expected 2015 fixed cost revenue requirements, and to make a filing by September 2016 to address the cost-recovery of our gas production fields. As of March 31, 2016, we have deferred revenue of approximately $0.8 million consistent with the final order.
For the 2014/2015 natural gas supply tracker, we reached a Stipulation and Settlement Agreement between us and the MCC, which requires us to refund our customers approximately $1.5 million as a result of revising the Bear Paw bridge rates to our expected 2015 fixed cost requirements through October 2015, which was recorded as a regulatory liability during 2015. The MPSC issued a final order approving the Stipulation and Settlement Agreement during the first quarter of 2016.
Electric and Natural Gas Lost Revenue Adjustment Mechanism - In 2005, the MPSC approved an energy efficiency program, by which we recovered on an after-the-fact basis a portion of our fixed costs that would otherwise have been collected in kilowatt hour sales lost due to the implementation of energy saving measures between rate filings in our supply trackers. In an order issued in October 2013 related to our 2011/2012 electric supply tracker, the MPSC required us to lower the calculated lost revenue recovery and imposed a new burden of proof on us for future recovery. We appealed the October 2013 order to Montana District Court, which led to a docket being initiated in June 2014 by the MPSC to review lost revenue policy issues. In October 2015, the MPSC issued an order to eliminate the lost revenue adjustment mechanism prospectively effective December 1, 2015.
Based on the October 2013 MPSC order, we have recognized $7.1 million of lost revenues for each annual electric supply tracker period (July 1, 2012 through November 30, 2015) and deferred the remaining portion, which is approximately $13.4 million as of March 31, 2016, and is recorded within current regulatory liabilities in the Condensed Consolidated Balance Sheets. Since the 2012/2013 and 2013/2014 annual electric tracker filings are still subject to final approval, the MPSC may ultimately require us to refund more than we have deferred or approve recovery of more DSM lost revenues than we have recognized since July 2012.
Hydro Compliance Filing
In December 2015, we submitted the required hydro compliance filing to remove the Kerr Project from cost of service, adjust for actual revenue credits and increase property taxes to actual amounts. In January 2016, the MPSC approved an interim adjustment to our hydro rates based on the compliance filing, and opened a separate contested docket requesting additional detail on the adjustment to rates due to the conveyance of the Kerr Project. The MCC has not filed testimony in this contested docket, however, the MPSC identified additional issues and requested information. We expect the MPSC to issue a final order during the second half of 2016. Due to the timing of the rate adjustment, as of March 31, 2016, we have deferred revenue of approximately $6.9 million that will be refunded to customers in 2016.
Dave Gates Generating Station at Mill Creek (DGGS)
In April 2014, the Federal Energy Regulatory Commission (FERC) issued an order affirming a FERC Administrative Law Judge's (ALJ) initial decision in September 2012, regarding cost allocation at DGGS between retail and wholesale customers. This decision concluded that only a portion of these costs should be allocated to FERC jurisdictional customers. We have been recognizing revenue consistent with the ALJ's initial decision. As of March 31, 2016, we have cumulative deferred revenue of approximately $27.3 million, which is subject to refund and recorded within current regulatory liabilities in the Consolidated Balance Sheets.
In May 2014, we filed a request for rehearing, which remains pending. In our request for rehearing, we have argued that no refunds are due even if the cost allocation method is modified prospectively. There is no deadline by which FERC must act on our rehearing petition. Customer refunds, if any, will not be due until 30 days after a FERC order on rehearing. If unsuccessful on rehearing, we may appeal to a United States Circuit Court of Appeals. The time line for any such appeal would likely extend into 2017 or beyond.
The FERC order was assessed as a triggering event as to whether an impairment charge should be recorded with respect to DGGS. As of March 31, 2016, the DGGS net property, plant and equipment is approximately $159 million. DGGS previously
11
provided only regulation and balancing service, which is the basis for the cost allocation in our filings. The addition of owned hydro generation is driving a shift in utilization of DGGS. In support of our biennial electricity supply resource procurement plan that we filed with the MPSC in March 2016, we conducted a portfolio optimization analysis to evaluate options to use DGGS in combination with other generation resources. This analysis indicates DGGS provides cost-effective products necessary to operate our Montana electricity portfolio, including regulation, load following, peaking services and other ancillary products such as operating reserves, which should guide future cost recovery. The cost recovery of any alternative use of DGGS would be subject to regulatory approval and we cannot provide assurance of such approval. We do not believe an impairment loss is probable at this time; however, we will continue to evaluate recovery of this asset in the future as facts and circumstances change.
(4) Income Taxes
The following table summarizes the significant differences in income tax expense (benefit) based on the differences between our effective tax rate and the federal statutory rate (in thousands):
Three Months Ended March 31, | |||||||||||||
2016 | 2015 | ||||||||||||
Income Before Income Taxes | $ | 40,526 | $ | 61,441 | |||||||||
Income tax calculated at 35% federal statutory rate | 14,184 | 35.0 | % | 21,504 | 35.0 | % | |||||||
Permanent or flow through adjustments: | |||||||||||||
State income, net of federal provisions | (1,100 | ) | (2.7 | ) | 161 | 0.3 | |||||||
Flow-through repairs deductions | (6,674 | ) | (16.5 | ) | (9,613 | ) | (15.7 | ) | |||||
Production tax credits | (2,775 | ) | (6.8 | ) | (1,261 | ) | (2.1 | ) | |||||
Plant and depreciation of flow through items | (938 | ) | (2.3 | ) | (381 | ) | (0.6 | ) | |||||
Other, net | (225 | ) | (0.6 | ) | (394 | ) | (0.6 | ) | |||||
(11,712 | ) | (28.9 | ) | (11,488 | ) | (18.7 | ) | ||||||
Income Tax Expense | $ | 2,472 | 6.1 | % | $ | 10,016 | 16.3 | % | |||||
We compute income tax expense for each quarter based on the estimated annual effective tax rate for the year, adjusted for certain discrete items. Our effective tax rate typically differs from the federal statutory tax rate of 35% primarily due to the regulatory impact of flowing through the federal and state tax benefit of repairs deductions, state tax benefit of accelerated tax depreciation deductions (including bonus depreciation when applicable) and production tax credits. The regulatory accounting treatment of these deductions requires immediate income recognition for temporary tax differences of this type, which is referred to as the flow-through method. When the flow-through method of accounting for temporary differences is reflected in regulated revenues, we record deferred income taxes and establish related regulatory assets and liabilities.
Uncertain Tax Positions
We recognize tax positions that meet the more-likely-than-not threshold as the largest amount of tax benefit that is greater than 50 percent likely of being realized upon ultimate settlement with a taxing authority that has full knowledge of all relevant information. We have unrecognized tax benefits of approximately $91.2 million as of March 31, 2016, including approximately $67.1 million that, if recognized, would impact our effective tax rate. We do not anticipate that total unrecognized tax benefits will significantly change due to the settlement of audits or the expiration of statutes of limitation within the next twelve months.
Our policy is to recognize interest and penalties related to uncertain tax positions in income tax expense. During the three months ended March 31, 2016, we did not recognize expense for interest and penalties in the Condensed Consolidated Statements of Income and did not have any amounts accrued at March 31, 2016 and December 31, 2015, respectively, for the payment of interest and penalties.
12
Our federal tax returns from 2000 forward remain subject to examination by the IRS.
(5) Goodwill
There were no changes in our goodwill during the three months ended March 31, 2016. Goodwill by segment is as follows for both March 31, 2016 and December 31, 2015 (in thousands):
Electric | $ | 243,558 | |
Natural gas | 114,028 | ||
$ | 357,586 | ||
(6) Comprehensive (Loss) Income
The following tables display the components of Other Comprehensive (Loss) Income (in thousands):
Three Months Ended | |||||||||||||||||||||||
March 31, 2016 | March 31, 2015 | ||||||||||||||||||||||
Before-Tax Amount | Tax Expense | Net-of-Tax Amount | Before-Tax Amount | Tax Benefit | Net-of-Tax Amount | ||||||||||||||||||
Foreign currency translation adjustment | $ | (118 | ) | $ | — | $ | (118 | ) | $ | 268 | $ | — | $ | 268 | |||||||||
Reclassification of net losses (gains) on derivative instruments | 62 | (25 | ) | 37 | (143 | ) | 54 | (89 | ) | ||||||||||||||
Other comprehensive (loss) income | $ | (56 | ) | $ | (25 | ) | $ | (81 | ) | $ | 125 | $ | 54 | $ | 179 | ||||||||
Balances by classification included within accumulated other comprehensive loss (AOCL) on the Condensed Consolidated Balance Sheets are as follows, net of tax (in thousands):
March 31, 2016 | December 31, 2015 | ||||||
Foreign currency translation | $ | 1,237 | $ | 1,355 | |||
Derivative instruments designated as cash flow hedges | (8,977 | ) | (9,014 | ) | |||
Pension and postretirement medical plans | (937 | ) | (937 | ) | |||
Accumulated other comprehensive loss | $ | (8,677 | ) | $ | (8,596 | ) | |
13
The following tables display the changes in AOCL by component, net of tax (in thousands):
Three Months Ended | |||||||||||||||||
March 31, 2016 | |||||||||||||||||
Affected Line Item in the Condensed Consolidated Statements of Income | Interest Rate Derivative Instruments Designated as Cash Flow Hedges | Pension and Postretirement Medical Plans | Foreign Currency Translation | Total | |||||||||||||
Beginning balance | $ | (9,014 | ) | $ | (937 | ) | $ | 1,355 | (8,596 | ) | |||||||
Other comprehensive loss before reclassifications | — | — | (118 | ) | (118 | ) | |||||||||||
Amounts reclassified from AOCL | Interest Expense | 37 | — | — | 37 | ||||||||||||
Net current-period other comprehensive income (loss) | 37 | — | (118 | ) | (81 | ) | |||||||||||
Ending balance | $ | (8,977 | ) | $ | (937 | ) | $ | 1,237 | $ | (8,677 | ) | ||||||
March 31, 2015 | |||||||||||||||||
Three Months Ended | |||||||||||||||||
Affected Line Item in the Condensed Consolidated Statements of Income | Interest Rate Derivative Instruments Designated as Cash Flow Hedges | Pension and Postretirement Medical Plans | Foreign Currency Translation | Total | |||||||||||||
Beginning balance | $ | (8,316 | ) | $ | (1,247 | ) | $ | 797 | (8,766 | ) | |||||||
Other comprehensive income before reclassifications | — | — | 268 | 268 | |||||||||||||
Amounts reclassified from AOCI | Interest Expense | (89 | ) | — | — | (89 | ) | ||||||||||
Net current-period other comprehensive (loss) income | (89 | ) | — | 268 | 179 | ||||||||||||
Ending balance | $ | (8,405 | ) | $ | (1,247 | ) | $ | 1,065 | $ | (8,587 | ) | ||||||
14
(7) Risk Management and Hedging Activities
Nature of Our Business and Associated Risks
We are exposed to certain risks related to the ongoing operations of our business, including the impact of market fluctuations in the price of electricity and natural gas commodities and changes in interest rates. We rely on market purchases to fulfill a portion of our electric and natural gas supply requirements within the Montana market. Several factors influence price levels and volatility. These factors include, but are not limited to, seasonal changes in demand, weather conditions, available generating assets within regions, transportation availability and reliability within and between regions, fuel availability, market liquidity, and the nature and extent of current and potential federal and state regulations.
Objectives and Strategies for Using Derivatives
To manage our exposure to fluctuations in commodity prices we routinely enter into derivative contracts. These types of contracts are included in our electric and natural gas supply portfolios and are used to manage price volatility risk by taking advantage of fluctuations in market prices. While individual contracts may be above or below market value, the overall portfolio approach is intended to provide greater price stability for consumers. These commodity costs are included in our cost tracking mechanisms and are recoverable from customers subject to prudence reviews by the applicable state regulatory commissions. We do not maintain a trading portfolio, and our derivative transactions are only used for risk management purposes consistent with regulatory guidelines.
In addition, we may use interest rate swaps to manage our interest rate exposures associated with new debt issuances or to manage our exposure to fluctuations in interest rates on variable rate debt.
Accounting for Derivative Instruments
We evaluate new and existing transactions and agreements to determine whether they are derivatives. The permitted accounting treatments include: normal purchase normal sale; cash flow hedge; fair value hedge; and mark-to-market. Mark-to-market accounting is the default accounting treatment for all derivatives unless they qualify, and we specifically designate them, for one of the other accounting treatments. Derivatives designated for any of the elective accounting treatments must meet specific, restrictive criteria both at the time of designation and on an ongoing basis. The changes in the fair value of recognized derivatives are recorded each period in current earnings or other comprehensive income, depending on whether a derivative is designated as part of a hedge transaction and the type of hedge transaction.
Normal Purchases and Normal Sales
We have applied the normal purchase and normal sale scope exception (NPNS) to our contracts involving the physical purchase and sale of gas and electricity at fixed prices in future periods. During our normal course of business, we enter into full-requirement energy contracts, power purchase agreements and physical capacity contracts, which qualify for NPNS. All of these contracts are accounted for using the accrual method of accounting; therefore, there were no unrealized amounts recorded in the Financial Statements at March 31, 2016 and December 31, 2015. Revenues and expenses from these contracts are reported on a gross basis in the appropriate revenue and expense categories as the commodities are received or delivered.
Credit Risk
Credit risk is the potential loss resulting from counterparty non-performance under an agreement. We manage credit risk with policies and procedures for, among other things, counterparty analysis and exposure measurement, monitoring and mitigation. We limit credit risk in our commodity and interest rate derivatives activities by assessing the creditworthiness of potential counterparties before entering into transactions with them and continuing to evaluate their creditworthiness on an ongoing basis.
We are exposed to credit risk through buying and selling electricity and natural gas to serve customers. We may request collateral or other security from our counterparties based on the assessment of creditworthiness and expected credit exposure. It is possible that volatility in commodity prices could cause us to have material credit risk exposures with one or more counterparties. We enter into commodity master enabling agreements with our counterparties to mitigate credit exposure, as these agreements reduce the risk of default by allowing us or our counterparty the ability to make net payments. The agreements generally are: (1) Western Systems Power Pool agreements – standardized power purchase and sales contracts in the electric industry; (2) International Swaps and Derivatives Association agreements – standardized financial gas and electric
15
contracts; (3) North American Energy Standards Board agreements – standardized physical gas contracts; and (4) Edison Electric Institute Master Purchase and Sale Agreements – standardized power sales contracts in the electric industry.
Many of our forward purchase contracts contain provisions that require us to maintain an investment grade credit rating from each of the major credit rating agencies. If our credit rating were to fall below investment grade, the counterparties could require immediate payment or demand immediate and ongoing full overnight collateralization on contracts in net liability positions.
Interest Rate Swaps Designated as Cash Flow Hedges
We have previously used interest rate swaps designated as cash flow hedges to manage our interest rate exposures associated with new debt issuances. We have no interest rate swaps outstanding. These swaps were designated as cash flow hedges with the effective portion of gains and losses, net of associated deferred income tax effects, recorded in AOCL. We reclassify these gains from AOCL into interest expense during the periods in which the hedged interest payments occur. The following table shows the effect of these interest rate swaps previously terminated on the Financial Statements (in thousands):
Location of amount reclassified from AOCL to Income | Amount Reclassified from AOCL into Income during the Three Months Ended March 31, 2016 | |||||
Interest rate contracts | Interest Expense | $ | 62 | |||
A net pre-tax loss of approximately $14.9 million is remaining in AOCL as of March 31, 2016, and we expect to reclassify approximately $0.3 million of net pre-tax gains from AOCL into interest expense during the next twelve months. These amounts relate to terminated swaps.
(8) Fair Value Measurements
Fair value is defined as the price that would be received to sell an asset or paid to transfer a liability in an orderly transaction between market participants at the measurement date (i.e., an exit price). Measuring fair value requires the use of market data or assumptions that market participants would use in pricing the asset or liability, including assumptions about risk and the risks inherent in the inputs to the valuation technique. These inputs can be readily observable, corroborated by market data, or generally unobservable. Valuation techniques are required to maximize the use of observable inputs and minimize the use of unobservable inputs.
Applicable accounting guidance establishes a hierarchy that prioritizes the inputs used to measure fair value, and requires fair value measurements to be categorized based on the observability of those inputs. The hierarchy gives the highest priority to unadjusted quoted prices in active markets for identical assets or liabilities (Level 1 inputs) and the lowest priority to unobservable inputs (Level 3 inputs). The three levels of the fair value hierarchy are as follows:
• | Level 1 – Unadjusted quoted prices available in active markets at the measurement date for identical assets or liabilities; |
• | Level 2 – Pricing inputs, other than quoted prices included within Level 1, which are either directly or indirectly observable as of the reporting date; and |
• | Level 3 – Significant inputs that are generally not observable from market activity. |
We classify assets and liabilities within the fair value hierarchy based on the lowest level of input that is significant to the fair value measurement of each individual asset and liability taken as a whole. The table below sets forth by level within the fair value hierarchy the gross components of our assets and liabilities measured at fair value on a recurring basis. NPNS transactions are not included in the fair values by source table as they are not recorded at fair value. See Note 7 - Risk Management and Hedging Activities for further discussion.
We record transfers between levels of the fair value hierarchy, if necessary, at the end of the reporting period. There were no transfers between levels for the periods presented.
16
Quoted Prices in Active Markets for Identical Assets or Liabilities (Level 1) | Significant Other Observable Inputs (Level 2) | Significant Unobservable Inputs (Level 3) | Margin Cash Collateral Offset | Total Net Fair Value | ||||||||||||||||
(in thousands) | ||||||||||||||||||||
March 31, 2016 | ||||||||||||||||||||
Restricted cash | $ | 6,437 | $ | — | $ | — | $ | — | $ | 6,437 | ||||||||||
Rabbi trust investments | 29,116 | — | — | — | 29,116 | |||||||||||||||
Total | $ | 35,553 | $ | — | $ | — | $ | — | $ | 35,553 | ||||||||||
December 31, 2015 | ||||||||||||||||||||
Restricted cash | $ | 6,240 | $ | — | $ | — | $ | — | $ | 6,240 | ||||||||||
Rabbi trust investments | 24,245 | — | — | — | 24,245 | |||||||||||||||
Total | $ | 30,485 | $ | — | $ | — | $ | — | $ | 30,485 | ||||||||||
Restricted cash represents amounts held in money market mutual funds. Rabbi trust investments represent assets held for non-qualified deferred compensation plans, which consist of our common stock and actively traded mutual funds with quoted prices in active markets.
Financial Instruments
The estimated fair value of financial instruments is summarized as follows (in thousands):
March 31, 2016 | December 31, 2015 | ||||||||||||||
Carrying Amount | Fair Value | Carrying Amount | Fair Value | ||||||||||||
Liabilities: | |||||||||||||||
Long-term debt | $ | 1,768,393 | $ | 1,915,299 | $ | 1,768,183 | $ | 1,844,974 | |||||||
Short-term borrowings consist of commercial paper and are not included in the table above as carrying value approximates fair value. The estimated fair value amounts have been determined using available market information and appropriate valuation methodologies; however, considerable judgment is required in interpreting market data to develop estimates of fair value. Accordingly, the estimates presented herein are not necessarily indicative of the amounts that we would realize in a current market exchange.
We determined fair value for long-term debt based on interest rates that are currently available to us for issuance of debt with similar terms and remaining maturities, except for publicly traded debt, for which fair value is based on market prices for the same or similar issues or upon the quoted market prices of U.S. treasury issues having a similar term to maturity, adjusted for our bond issuance rating and the present value of future cash flows. These are significant other observable inputs, or level 2 inputs, in the fair value hierarchy.
17
(9) Segment Information
Our reportable business segments are primarily engaged in the electric and natural gas business. The remainder of our operations are presented as other, which primarily consists of unallocated corporate costs.
We evaluate the performance of these segments based on gross margin. The accounting policies of the operating segments are the same as the parent except that the parent allocates some of its operating expenses to the operating segments according to a methodology designed by management for internal reporting purposes and involves estimates and assumptions.
Financial data for the business segments are as follows (in thousands):
Three Months Ended | |||||||||||||||||||
March 31, 2016 | Electric | Gas | Other | Eliminations | Total | ||||||||||||||
Operating revenues | $ | 241,342 | $ | 91,197 | $ | — | $ | — | $ | 332,539 | |||||||||
Cost of sales | 83,624 | 31,810 | — | — | 115,434 | ||||||||||||||
Gross margin | 157,718 | 59,387 | — | — | 217,105 | ||||||||||||||
Operating, general and administrative | 55,443 | 21,912 | 2,506 | — | 79,861 | ||||||||||||||
Property and other taxes | 27,429 | 7,989 | 3 | — | 35,421 | ||||||||||||||
Depreciation and depletion | 32,521 | 7,361 | 8 | — | 39,890 | ||||||||||||||
Operating income (loss) | 42,325 | 22,125 | (2,517 | ) | — | 61,933 | |||||||||||||
Interest expense | (22,055 | ) | (1,955 | ) | (499 | ) | — | (24,509 | ) | ||||||||||
Other income | 467 | 309 | 2,326 | — | 3,102 | ||||||||||||||
Income tax (expense) benefit | (1,015 | ) | (3,021 | ) | 1,564 | — | (2,472 | ) | |||||||||||
Net income | $ | 19,722 | $ | 17,458 | $ | 874 | $ | — | $ | 38,054 | |||||||||
Total assets | $ | 4,180,672 | $ | 1,073,778 | $ | 6,723 | — | $ | 5,261,173 | ||||||||||
Capital expenditures | $ | 41,625 | $ | 9,693 | $ | — | — | $ | 51,318 | ||||||||||
Three Months Ended | |||||||||||||||||||
March 31, 2015 | Electric | Gas | Other | Eliminations | Total | ||||||||||||||
Operating revenues | $ | 236,046 | $ | 109,965 | $ | — | $ | — | $ | 346,011 | |||||||||
Cost of sales | 63,919 | 48,472 | — | — | 112,391 | ||||||||||||||
Gross margin | 172,127 | 61,493 | — | — | 233,620 | ||||||||||||||
Operating, general and administrative | 60,055 | 21,911 | (843 | ) | — | 81,123 | |||||||||||||
Property and other taxes | 25,259 | 7,525 | 3 | — | 32,787 | ||||||||||||||
Depreciation and depletion | 28,554 | 7,256 | 9 | — | 35,819 | ||||||||||||||
Operating income | 58,259 | 24,801 | 831 | — | 83,891 | ||||||||||||||
Interest expense | (19,698 | ) | (2,994 | ) | (423 | ) | — | (23,115 | ) | ||||||||||
Other income (expense) | 1,282 | 142 | (759 | ) | — | 665 | |||||||||||||
Income tax (expense) benefit | (6,253 | ) | (4,721 | ) | 958 | — | (10,016 | ) | |||||||||||
Net income | $ | 33,590 | $ | 17,228 | $ | 607 | $ | — | $ | 51,425 | |||||||||
Total assets | $ | 3,919,536 | 1,048,449 | $ | 7,444 | $ | — | $ | 4,975,429 | ||||||||||
Capital expenditures | $ | 50,061 | 6,477 | $ | — | $ | — | $ | 56,538 | ||||||||||
18
(10) Earnings Per Share
Basic earnings per share is computed by dividing net income by the weighted average number of common shares outstanding for the period. Diluted earnings per share reflects the potential dilution of common stock equivalent shares that could occur if all unvested shares were to vest. Common stock equivalent shares are calculated using the treasury stock method, as applicable. The dilutive effect is computed by dividing earnings applicable to common stock by the weighted average number of common shares outstanding plus the effect of the outstanding unvested performance share awards. Average shares used in computing the basic and diluted earnings per share are as follows:
Three Months Ended | |||||
March 31, 2016 | March 31, 2015 | ||||
Basic computation | 48,242,307 | 46,976,989 | |||
Dilutive effect of: | |||||
Performance share awards (1) | 98,065 | 218,457 | |||
Diluted computation | 48,340,372 | 47,195,446 | |||
______________
(1) Performance share awards are included in diluted weighted average number of shares outstanding based upon what would be issued if the end of the most recent reporting period was the end of the term of the award.
(11) Employee Benefit Plans
Net periodic benefit cost (income) for our pension and other postretirement plans consists of the following (in thousands):
Pension Benefits | Other Postretirement Benefits | ||||||||||||||
Three Months Ended March 31, | Three Months Ended March 31, | ||||||||||||||
2016 | 2015 | 2016 | 2015 | ||||||||||||
Components of Net Periodic Benefit Cost (Income) | |||||||||||||||
Service cost | $ | 2,939 | $ | 3,463 | $ | 130 | $ | 129 | |||||||
Interest cost | 6,566 | 6,542 | 202 | 183 | |||||||||||
Expected return on plan assets | (7,081 | ) | (7,920 | ) | (261 | ) | (243 | ) | |||||||
Amortization of prior service cost | 62 | 62 | (471 | ) | (500 | ) | |||||||||
Recognized actuarial loss | 2,466 | 2,618 | 87 | 81 | |||||||||||
Net Periodic Benefit Cost (Income) | $ | 4,952 | $ | 4,765 | $ | (313 | ) | $ | (350 | ) | |||||
(12) Commitments and Contingencies
ENVIRONMENTAL LIABILITIES AND REGULATION | ||||
Environmental Matters
The operation of electric generating, transmission and distribution facilities, and gas gathering, transportation and distribution facilities, along with the development (involving site selection, environmental assessments, and permitting) and construction of these assets, are subject to extensive federal, state, and local environmental and land use laws and regulations. Our activities involve compliance with diverse laws and regulations that address emissions and impacts to the environment, including air and water, protection of natural resources, avian and wildlife. We monitor federal, state, and local environmental initiatives to determine potential impacts on our financial results. As new laws or regulations are implemented, our policy is to assess their applicability and implement the necessary modifications to our facilities or their operation to maintain ongoing compliance.
Our environmental exposure includes a number of components, including remediation expenses related to the cleanup of current or former properties, and costs to comply with changing environmental regulations related to our operations. At present, the majority of our environmental reserve relates to the remediation of former manufactured gas plant sites owned by us and is
19
estimated to range between $27 million to $32 million. As of March 31, 2016, we have a reserve of approximately $31.2 million, which has not been discounted. Environmental costs are recorded when it is probable we are liable for the remediation and we can reasonably estimate the liability. We use a combination of site investigations and monitoring to formulate an estimate of environmental remediation costs for specific sites. Our monitoring procedures and development of actual remediation plans depend not only on site specific information but also on coordination with the different environmental regulatory agencies in our respective jurisdictions; therefore, while remediation exposure exists, it may be many years before costs are incurred.
Over time, as costs become determinable, we may seek authorization to recover such costs in rates or seek insurance reimbursement as applicable; therefore, although we cannot guarantee regulatory recovery, we do not expect these costs to have a material effect on our consolidated financial position or results of operations.
Manufactured Gas Plants - Approximately $24.5 million of our environmental reserve accrual is related to manufactured gas plants. A formerly operated manufactured gas plant located in Aberdeen, South Dakota, has been identified on the Federal Comprehensive Environmental Response, Compensation, and Liability Information System list as contaminated with coal tar residue. We are currently conducting feasibility studies and implementing remedial actions at the Aberdeen site pursuant to work plans approved by the South Dakota Department of Environment and Natural Resources (DENR). Our current reserve for remediation costs at this site is approximately $11.4 million, and we estimate that approximately $6.8 million of this amount will be incurred during the next five years.
We also own sites in North Platte, Kearney and Grand Island, Nebraska on which former manufactured gas facilities were located. We are currently working independently to fully characterize the nature and extent of potential impacts associated with these Nebraska sites. Our reserve estimate includes assumptions for site assessment and remedial action work. At present, we cannot determine with a reasonable degree of certainty the nature and timing of any risk-based remedial action at our Nebraska locations.
In addition, we own or have responsibility for sites in Butte, Missoula and Helena, Montana on which former manufactured gas plants were located. The Butte and Helena sites, both listed as high priority sites on Montana's state superfund list, were placed into the Montana Department of Environmental Quality (MDEQ) voluntary remediation program for cleanup due to soil and groundwater impacts. Soil and coal tar were removed at the sites in accordance with MDEQ requirements. Groundwater monitoring is conducted semiannually at both sites. In February 2016, the MDEQ requested additional information regarding the Helena site, which we provided to the MDEQ in April 2016. At this time, we cannot estimate with a reasonable degree of certainty the nature and timing of additional remedial actions and/or investigations, if any, at the Butte and Helena sites.
An investigation conducted at the Missoula site did not require remediation activities, but required preparation of a groundwater monitoring plan. Monitoring wells have been installed and groundwater is monitored semiannually. At the request of Missoula Valley Water Quality District, a draft risk assessment was prepared for the Missoula site and presented to the Missoula County Water Quality Board (MCWQB). The MCWQB deferred all decision making to the MDEQ, but suggested additional site delineation. Additional delineation work began in December 2015 and has continued in 2016. The result of the additional delineation work may lead to amending the risk assessment and/or development of a remedial alternatives report followed by implementation of a remedy. At this time, we cannot estimate with a reasonable degree of certainty the nature and timing of risk-based remedial action at the Missoula site or if any additional actions beyond monitored natural attenuation will be required.
Global Climate Change - National and international actions have been initiated to address global climate change and the contribution of emissions of greenhouse gases (GHG) including, most significantly, carbon dioxide (CO2). These actions include legislative proposals, Executive and Environmental Protection Agency (EPA) actions at the federal level, actions at the state level, and private party litigation relating to GHG emissions. Coal-fired plants have come under particular scrutiny due to their level of GHG emissions. We have joint ownership interests in four coal-fired electric generating plants, all of which are operated by other companies. We are responsible for our proportionate share of the capital and operating costs while being entitled to our proportionate share of the power generated.
While numerous bills have been introduced that address climate change from different perspectives, including through direct regulation of GHG emissions, the establishment of cap and trade programs and the establishment of Federal renewable portfolio standards, Congress has not passed any federal climate change legislation and we cannot predict the timing or form of any potential legislation. In the absence of such legislation, EPA is presently regulating new and existing sources of GHG emissions.
20
On August 3, 2015, the EPA released for publication in the Federal Register, the final standards of performance to limit GHG emissions from new, modified and reconstructed fossil fuel generating units and from newly constructed and reconstructed natural gas combined cycle (NGCC) units. The standards reflect the degree of emission limitations achievable through the application of the best system of emission reduction that the EPA determined has been demonstrated for each type of unit.
In a separate action that also affects power plants, on August 3, 2015, the EPA released its final rule establishing GHG performance standards for existing power plants under Clean Air Act Section 111(d). EPA refers to this rule as the Clean Power Plan (CPP). The CPP specifically establishes CO2 emission performance standards for existing electric utility steam generating units and NGCC units. States may develop implementation plans for affected units to meet the individual state targets established in the CPP or may adopt a federal plan. The EPA has given states the option to develop compliance plans for annual rate-based reductions (pounds per megawatt hour (MWH)) or mass-based tonnage limits for CO2. The 2030 rate-based requirement for all existing affected generating units in South Dakota and Montana is 1,167 and 1,305 pounds per MWH, respectively. The rate-based approach requires a 38.4 percent reduction in South Dakota and a 47.4 percent reduction in Montana from 2012 levels by 2030. The mass-based approach for existing units in South Dakota requires a 30.9 percent decrease by 2030, while in Montana the mass-based approach requires a 41 percent decrease by 2030. States are required to submit initial plans for achieving GHG emission standards to EPA by September 2016, but may seek additional time to finalize State plans by September 2018. The initial performance period for compliance would commence in 2022, with full implementation by 2030. The EPA also indicated that states may establish emission trading programs to facilitate compliance with the CPP and provides three options: an emission rate trading program that would allow the trading of emission reduction credits equal to one MWH of emission free generation; a mass-based program that would allow trading of allowances with an allowance equal to one short ton of CO2; and a state measures program that would allow intra-state trading to achieve the state-wide average emission rate.
On August 3, 2015, the EPA also proposed a federal plan that would be imposed if a state fails to submit a satisfactory plan under the CPP. The federal plan proposal includes a "model trading rule" that describes how the EPA would establish an emission trading program as part of the federal plan to allow affected units to comply with the emission rate requirements. EPA proposed both an emission rate trading plan and a mass-based trading plan and indicated that the final federal rule will elect one of the two options. Comments on the proposed federal plan and model trading rule were due January 21, 2016. The EPA has indicated that it intends to finalize both the federal plan and the model trading rules in the summer of 2016.
The CPP reduction of 47 percent in carbon dioxide emissions in Montana by 2030 is the greatest reduction target among the lower 48 states, according to a nationwide analysis. Our Montana generation portfolio emits less carbon on average than the EPA's 2030 target due to investments we made prior to 2013 in carbon-free generation resources. However, the CPP's target reduction is applied on a statewide basis, and investments made prior to 2012 are not counted in the CPP's 2030 target. The State of Montana is required by the CPP to submit a satisfactory state plan to EPA by no later than September 2018. The state plan will determine whether we will have to meet rate-based or mass-based requirements and, if the state adopts a mass-based plan, the number and vintages of allowances that will be allocated to Colstrip. Until the plan is submitted, or a federal plan is imposed, we cannot predict the impact of the CPP on us. We asked the University of Montana’s Bureau of Business and Economic Research (BBER) to study the potential impacts of the CPP across Montana. The BBER study looked at the implications of closing the Colstrip generating facilities in southeast Montana as a scenario for complying with the federal rule. The study's conclusions describe the likely loss of jobs and population, the decline in the local and state tax base, the impact on businesses statewide, and the closure's impact on electric reliability and affordability. The electricity produced at Unit 4 represents approximately 25 percent of our customer needs. Closing Colstrip would lead to higher utility rates in order to replace the base-load generation that currently is provided by Colstrip. Closing Colstrip would also create significant issues with the transmission grid that serves Montana, and we would lose transmission revenues that are credited to and lower electric customer bills.
On October 23, 2015, the same date the CPP was published in the Federal Register, we along with other utilities, trade groups, coal producers, labor and business organizations, filed Petitions for Review of the CPP with the United States Court of Appeals for the District of Columbia Circuit. Accompanying these Petitions for Review were Motions to Stay the implementation of the CPP. On January 21, 2016, the U.S. Court of Appeals for the District of Columbia denied the requests for stay but ordered expedited briefing on the merits, with oral argument scheduled for June 2, 2016. On January 26, 2016, 29 states and state agencies asked the U.S. Supreme Court to issue an immediate stay of the CPP. On January 27, 2016, 60 utilities and allied petitioners also requested the U.S. Supreme Court to immediately stay the CPP, and we were among the utilities seeking a stay. On February 9, 2016, the U.S. Supreme Court entered an order staying the CPP. The stay of the CPP will remain in place until the U.S. Supreme Court either denies a petition for certiorari following the U.S. Court of Appeals’ decision on the substantive challenges to the CPP, if one is submitted, or until the U.S. Supreme Court enters judgment following grant of a petition for certiorari. The effect is to delay the CPP’s implementation until challenges to the CPP have been fully litigated and
21
the U.S. Supreme Court has ruled. We do not expect a final judicial decision on challenges to the CPP until mid-2017 at the earliest, and, more likely, early 2018.
On December 22, 2015 we also filed an administrative Petition for Reconsideration with the EPA, requesting that it reconsider the CPP, on the grounds that the CO2 reductions in the CPP were substantially greater in Montana than in the proposed rule. We also requested EPA stay the CPP while it considered our Petition for Reconsideration. At this time no action has been taken on the Petition for Reconsideration or stay request.
On June 23, 2014, the U.S. Supreme Court struck down the EPA's Tailoring Rule, which limited the sources subject to GHG permitting requirements to the largest fossil-fueled power plants, indicating that EPA had exceeded its authority under the Clean Air Act by "rewriting unambiguous statutory terms." However, the decision affirmed EPA's ability to regulate GHG emissions from sources already subject to regulation under the prevention of significant deterioration program, which includes most electric generating units.
Requirements to reduce GHG emissions could cause us to incur material costs of compliance, increase our costs of procuring electricity, decrease transmission revenue and impact cost recovery. Although there continues to be proposed legislation and regulations that affect GHG emissions from power plants, technology to efficiently capture, remove and/or sequester such emissions may not be available within a timeframe consistent with the implementation of such requirements. In addition, physical impacts of climate change may present potential risks for severe weather, such as droughts, floods and tornadoes, in the locations where we operate or have interests.
We are evaluating the implications of these rules and technology available to achieve the CO2 emission performance standards. We will continue working with federal and state regulatory authorities, other utilities, and stakeholders to seek relief from the final rules that, in our view, disproportionately impact customers in our region, and to seek relief from the final compliance requirements. We cannot predict the ultimate outcome of these matters nor what our obligations might be under the state compliance plans with any degree of certainty until they are finalized; however, complying with the carbon emission standards, and with other future environmental rules, may make it economically impractical to continue operating all or a portion of our jointly owned facilities or for individual owners to participate in their proportionate ownership of the coal-fired generating units. This could lead to significant impacts to customer rates for recovery of plant improvements and / or closure related costs and costs to procure replacement power. In addition, these changes could impact system reliability due to changes in generation sources.
Water Intakes and Discharges - Section 316(b) of the Federal Clean Water Act requires that the location, design, construction and capacity of any cooling water intake structure reflect the “best technology available (BTA)” for minimizing environmental impacts. In May 2014, the EPA issued a final rule applicable to facilities that withdraw at least 2 million gallons per day of cooling water from waters of the US and use at least 25 percent of the water exclusively for cooling purposes. The final rule, which became effective in October 2014, gives options for meeting BTA, and provides a flexible compliance approach. Under the rule, permits required for existing facilities will be developed by the individual states and additional capital and/or increased operating costs may be required to comply with future water permit requirements. Challenges to the final cooling water intake rule filed by industry and environmental groups are under review in the Court of Appeals.
In November 2015, the EPA published final regulations on effluent limitations for power plant wastewater discharges, including mercury, arsenic, lead and selenium. The rule became effective in January 2016. Some of the new requirements for existing power plants would be phased in starting in 2018 with full implementation of the rule by 2023. The EPA rule estimates that 12 percent of the steam electric power plants in the U.S. will have to make new investments to meet the requirements of the new effluent limitation regulations; however, it is too early to determine whether the impacts of these rules will be material.
Clean Air Act Rules and Associated Emission Control Equipment Expenditures - The EPA has proposed or issued a number of rules under different provisions of the Clean Air Act that could require the installation of emission control equipment at the generation plants in which we have joint ownership.
In December 2011, the EPA issued a final rule relating to Mercury and Air Toxics Standards (MATS). Among other things, the MATS set stringent emission limits for acid gases, mercury, and other hazardous air pollutants from new and existing electric generating units. The rule was challenged by industry groups and states, and was upheld by the D.C. Circuit Court in April 2014. The decision was appealed to the Supreme Court and in June 2015, the Supreme Court issued an opinion that the EPA did not properly consider the costs to industry when making the requisite “appropriate and necessary” determination as part of its analysis in connection with the issuance of the MATS rule. The Supreme Court remanded the case back to the U.S. Court of Appeals for the District of Columbia Circuit, and on July 31 the litigation was formally sent back to the D.C. Circuit, which will decide whether the standards will be vacated or will remain in place while the EPA addresses the Supreme Court
22
decision. The EPA indicated that it will seek a remand without vacatur of the MATS rule, and in support of that request, the EPA will submit to the court a declaration establishing a plan to "complete the required consideration of costs" to support the "appropriate and necessary finding" by spring 2016. Installation or upgrading of relevant environmental controls at our affected plants is complete. Colstrip Unit 4 is currently controlling emissions of mercury under regulations issued by the State of Montana, which are stricter than the Federal MATS. At this time, we cannot predict whether and when compliance with the MATS rule ultimately will be required.
In July 2011, the EPA finalized the Cross-State Air Pollution Rule (CSAPR) to reduce emissions from electric generating units that interfere with the ability of downwind states to achieve ambient air quality standards. Under CSAPR, significant reductions in emissions of nitrogen oxide (NOx) and sulfur dioxide (SO2) were to be required in certain states beginning in 2012. In April 2014 the Supreme Court reversed and remanded the 2012 decision of the U.S. Court of Appeals for the D.C. Circuit that had vacated the CSAPR. In December, 2015 EPA published a proposed update to the CSAPR rule. Litigation of the remaining CSAPR lawsuits is pending.
In October 2013, the Supreme Court denied certiorari in Luminant Generation Co v. EPA, which challenged the EPA’s current approach to regulating air emissions during startup, shutdown and malfunction (SSM) events. As a result, fossil fuel power plants may need to address SSM in their permits to reduce the risk of enforcement or citizen actions.
The Clean Air Visibility Rule was issued by the EPA in June 2005, to address regional haze in national parks and wilderness areas across the United States. The Clean Air Visibility Rule requires the installation and operation of Best Available Retrofit Technology (BART) to achieve emissions reductions from designated sources (including certain electric generating units) that are deemed to cause or contribute to visibility impairment in such 'Class I' areas.
In September 2012, a final Federal Implementation Plan for Montana was published in the Federal Register to address regional haze. As finalized, Colstrip Units 3 and 4 do not have to improve removal efficiency for pollutants that contribute to regional haze. By 2018, Montana, or EPA, must develop a revised Plan that demonstrates reasonable progress toward eliminating man made emissions of visibility impairing pollutants, which could impact Colstrip Unit 4. In November 2012, PPL Montana, the operator of Colstrip, as well as environmental groups (National Parks Conservation Association, Montana Environmental Information Center, and Sierra Club) jointly filed a petition for review of the Federal Implementation Plan in the U.S. Court of Appeals for the Ninth Circuit. Montana Environmental Information Center and Sierra Club challenged the EPA's decision not to require any emissions reductions from Colstrip Units 3 and 4. In June 2015, the U.S. Court of Appeals for the Ninth Circuit rejected the challengers’ contention that the EPA should have required additional pollution-reduction technologies on Unit 4 beyond those in the regulations and the matter is back in EPA Region 8 for action.
Jointly Owned Plants - We have joint ownership in generation plants located in South Dakota, North Dakota, Iowa and Montana that are or may become subject to the various regulations discussed above that have been issued or proposed. Compliance with the final rule on Water Intakes and Discharges discussed above, which became effective in January 2016, is not expected to have a significant impact at any of our jointly owned facilities.
North Dakota. The North Dakota Regional Haze SIP requires the Coyote generating facility, in which we have 10% ownership, to reduce its NOx emissions by July 2018. Coyote is in the process of installing control equipment to limit its NOx emissions to 0.5 pounds per million Btu as calculated on a 30-day rolling average basis, including periods of start-up and shutdown, with the project expected to be operational by the third quarter of 2016. The cost of the control equipment is not significant.
Montana. Colstrip Unit 4, a coal fired generating facility in which we have a 30% interest, is subject to EPA's CCR Rule. A compliance plan has been developed and is in the initial stages of implementation. The current estimate of the total project cost is approximately $90.0 million (our share is 30%) over the remaining life of the facility.
See 'Legal Proceedings - Colstrip Litigation' below for discussion of Sierra Club litigation.
Other - We continue to manage equipment containing polychlorinated biphenyl (PCB) oil in accordance with the EPA's Toxic Substance Control Act regulations. We will continue to use certain PCB-contaminated equipment for its remaining useful life and will, thereafter, dispose of the equipment according to pertinent regulations that govern the use and disposal of such equipment.
We routinely engage the services of a third-party environmental consulting firm to assist in performing a comprehensive evaluation of our environmental reserve. Based upon information available at this time, we believe that the current environmental reserve properly reflects our remediation exposure for the sites currently and previously owned by us. The
23
portion of our environmental reserve applicable to site remediation may be subject to change as a result of the following uncertainties:
• | We may not know all sites for which we are alleged or will be found to be responsible for remediation; and |
• | Absent performance of certain testing at sites where we have been identified as responsible for remediation, we cannot estimate with a reasonable degree of certainty the total costs of remediation. |
LEGAL PROCEEDINGS |
Colstrip Litigation
On March 6, 2013, the Sierra Club and the MEIC (Plaintiffs) filed suit in the United States District Court for the District of Montana (Court) against the six individual owners of Colstrip, including us, as well as the operator or managing agent of the station (Defendants). On September 27, 2013, Plaintiffs filed an Amended Complaint for Injunctive and Declaratory Relief. The original complaint included 39 claims for relief based upon alleged violations of the Clean Air Act and the Montana State Implementation Plan. The Amended Complaint dropped claims associated with projects completed before 2001, the Title V claims and the opacity claims. The Amended Complaint alleged a total of 23 claims covering 64 projects.
In the Amended Complaint, Plaintiffs identified physical changes made at Colstrip between 2001 and 2012, that Plaintiffs allege (a) have increased emissions of SO2, NOx and particulate matter and (b) were “major modifications” subject to permitting requirements under the Clean Air Act. They also alleged violations of the requirements related to Part 70 Operating Permits.
On May 3, 2013, the Colstrip owners and operator filed a partial motion to dismiss, seeking dismissal of 36 of the 39 claims asserted in the original complaint. The motion was not ruled upon, and the Colstrip owners filed a second motion to dismiss the Amended Complaint on October 11, 2013, incorporating parts of the first motion and supplementing it with new authorities and with regard to new claims contained in the Amended Complaint.
On September 12, 2013, Plaintiffs filed a motion for partial summary judgment as to the applicable method for calculating emissions increases from modifications.
The parties filed a joint notice (Notice) on April 21, 2014, that advised the Court of Plaintiffs’ intent to file a Second Amended Complaint which dropped claims relating to 52 projects, and added one additional project. On May 6, 2014, the Court held oral argument on Defendants' motion to dismiss and on Plaintiffs’ motion for summary judgment on the applicable legal standard. On May 22, 2014, the United States Magistrate Judge (Magistrate) issued findings and recommendations, which denied Plaintiffs’ motion for summary judgment and denied most of the Colstrip owners’ motion to dismiss, but dismissed seven of Plaintiffs’ “best available control technology” claims and dismissed two of Plaintiffs' claims for injunctive relief. The Plaintiffs filed an objection to the Magistrate's findings and recommendations with the Court, and on August 13, 2014, the Court adopted the Magistrate's findings and conclusions.
On August 27, 2014, the Plaintiffs filed their Second Amended Complaint, which alleged a total of 13 claims covering eight projects and seeks injunctive and declaratory relief, civil penalties (including $100,000 of civil penalties to be used for beneficial environmental projects), and recovery of their attorney fees. Defendants filed their Answer to the Second Amended Complaint on September 26, 2014. Since filing the Second Amended Complaint, Plaintiffs have indicated that they are no longer pursuing a number of claims and projects thereby reducing their total claims to eight relating to four projects. The parties filed motions for summary judgment and briefs in support with regard to issues affecting the remaining claims.
On December 1, 2015, the Court held oral argument on all pending motions for summary judgment, and on December 31, 2015, the Magistrate issued findings and recommendations which (a) denied Plaintiffs’ motion for partial summary judgment regarding routine maintenance, repair and replacement; (b) denied Plaintiffs’ motion for partial summary judgment that the redesign projects for the Unit 1 and 4 turbines and the Unit 1 economizer were not “like kind replacements”; (c) granted Defendants’ motion for partial summary judgment regarding Plaintiffs’ use of the “actual-to-potential” emissions test; (d) granted in part and denied in part Plaintiffs’ motion for partial summary judgment regarding the allowable period from which to select a baseline for the Unit 3 reheater project; (e) granted in part and denied in part Defendants’ motion for partial summary judgment on baseline selection; and (f) granted Defendants’ motion for partial summary judgment on emissions calculations for alleged aggregated turbine and safety valve project. Plaintiffs filed objections to the Magistrate’s findings and recommendations on January 19, 2016, and Defendants filed their response on February 5, 2016. The Court’s ruling on these
24
motions, when issued, should clarify what claims remain and the standards to be applied at trial. A bench trial is scheduled for May 31, 2016.
We intend to vigorously defend this lawsuit. At this time, we cannot predict an outcome, nor is it reasonably possible to estimate the amount or range of loss, if any, that would be associated with an adverse decision.
Billings, Montana Refinery Outage Claim
In August 2014, we received a letter from the ExxonMobil refinery in Billings claiming that it had sustained damages of approximately $48.5 million as a result of a January 2014 electrical outage. In December 2015, Exxon increased the estimated losses related to that incident to approximately $61.7 million. On January 13, 2016, a second electrical outage shut down the ExxonMobil refinery. On January 22, 2016, ExxonMobil filed suit against NorthWestern in U.S. District Court in Billings, Montana, seeking unspecified compensatory and punitive damages arising from both outages. We dispute ExxonMobil’s claims and intend to vigorously defend this lawsuit. We have reported the refinery's claims and lawsuit to our liability insurance carriers under our liability insurance coverage, which has a $2.0 million per occurrence retention. This matter is in the initial stages and we cannot predict an outcome or estimate the amount or range of loss that would be associated with an adverse result.
State of Montana - Riverbed Rents
On April 1, 2016, the State of Montana filed a complaint on remand with the Montana First Judicial District Court (District Court), naming us, along with Talen Montana, LLC (Talen), as defendants. The State claims it owns the riverbeds underlying 10 of our hydroelectric facilities (dams, along with reservoirs and tailraces) on the Missouri, Madison and Clark Fork Rivers, and seeks rents for Talen’s and our use and occupancy of such lands. The facilities at issue in the litigation include the Hebgen, Madison, Hauser, Holter, Black Eagle, Rainbow, Cochrane, Ryan and Morony facilities on the Missouri-Madison Rivers and the Thompson Falls facility on the Clark Fork River. We acquired these facilities from Talen in November 2014.
Prior to our acquisition of the facilities, Talen litigated this issue against the State in Montana state courts and in the United States Supreme Court. In August 2007, the District Court determined that the 10 hydroelectric facilities were located on rivers which were navigable and that the State held title to the riverbeds. Subsequently, in June 2008, the District Court awarded the State compensation with respect to all 10 facilities of approximately $34 million for the 2000-2006 period and approximately $6 million for 2007 (we have owned the facilities since November 2014). The District Court deferred the determination of compensation for 2008 and future years to the Montana State Land Board.
Talen appealed the issue of navigability to the Montana Supreme Court, which in March 2010 affirmed the District Court decision. In June 2011, Talen petitioned the United States Supreme Court to review the Montana Supreme Court decision. The United States Supreme Court issued an opinion in February 2012, overturning the Montana Supreme Court and holding that the Montana courts erred first by not considering the navigability of the rivers on a segment-by-segment basis and second in relying on present day recreational use of the rivers. The United States Supreme Court also considered the navigability of what it referred to as the Great Falls Reach and concluded, at least from the head of the first waterfall to the foot of the last, that the Great Falls Reach was not navigable for title purposes, and thus the State did not own the riverbeds in that segment. The United States Supreme Court remanded the case to the Montana Supreme Court for further proceedings not inconsistent with its opinion.
Following the 2012 remand, the case laid dormant for four years until the State filed the complaint on remand with the District Court. The complaint on remand renews all of the State’s claims that the rivers on which the 10 hydroelectric facilities are located are navigable (including the Great Falls Reach), and that because they were navigable the riverbeds became State lands upon Montana’s statehood in 1889 and that the State is entitled to rent for their use. The State’s complaint on remand does not claim any specific rental amount. Pursuant to the terms of our acquisition of the hydroelectric facilities, Talen and NorthWestern will share jointly the expense of this litigation, and Talen is responsible for any rents applicable to the periods of time prior to the acquisition (i.e., before November 18, 2014), while we are responsible for periods thereafter.
We dispute the State’s claims and intend to vigorously defend the lawsuit. This matter is in the initial stages, and we cannot predict an outcome. If on remand the District Court determines the riverbeds under all 10 of the hydroelectric facilities are navigable (including the five hydroelectric facilities on the Great Falls Reach) and if it calculates damages as before remand, we estimate the annual rents could be approximately $7.0 million commencing in November 2014, when we acquired the facilities. We anticipate that any obligation to pay the State rent for use and occupancy of the riverbeds would be recoverable in rates from customers, although there can be no assurances that the MPSC would approve any such recovery.
25
Other Legal Proceedings
We are also subject to various other legal proceedings, governmental audits and claims that arise in the ordinary course of business. In the opinion of management, the amount of ultimate liability with respect to these other actions will not materially affect our financial position, results of operations, or cash flows.
26
ITEM 2. | MANAGEMENT’S DISCUSSION AND ANALYSIS OF FINANCIAL CONDITION AND RESULTS OF OPERATIONS |
OVERVIEW | ||||
NorthWestern Corporation, doing business as Northwestern Energy, provides electricity and natural gas to approximately 701,000 customers in Montana, South Dakota and Nebraska. For a discussion of NorthWestern’s business strategy, see Management’s Discussion and Analysis of Financial Condition and Results of Operations in our Annual Report on Form 10-K for the year ended December 31, 2015.
As you read this discussion and analysis, refer to our Consolidated Statements of Income, which present the results of our operations for 2016, and 2015.
HOW WE PERFORMED AGAINST OUR FIRST QUARTER 2015 RESULTS | ||||
Quarter-over-Quarter Change | |||
Gross Margin by Segment(1) | |||
Electric | $(14.4)M | ê | (8.4)% |
Natural Gas | $(2.1)M | ê | (3.4)% |
Operating Expenses | $5.5M | é | 3.7% |
Operating Income | $(22.0)M | ê | (26.2)% |
Net Income | $(13.4)M | ê | (26.0)% |
EPS (Diluted) | $(0.30) | ê | (27.5)% |
(1) Non-GAAP financial measure. See "non-GAAP Financial Measure" below.
SIGNIFICANT DEVELOPMENTS IN 2016 | ||||
Ÿ | Lower Net Income of $13.4 million, which is primarily a result of a MPSC disallowance of costs included in our electric supply trackers (discussed below) and increases in operating costs. These impacts were partially offset by an increase in rates in South Dakota and lower income tax expense. | ||||
Ÿ | Filed our biennial electricity supply resource procurement plan with the MPSC, which provides a road map to our stakeholders, including customers and regulators regarding how we expect to respond to future supply needs. | ||||
Following is a brief overview of significant items for 2016, and a discussion of our strategy and outlook.
SIGNIFICANT TRENDS AND REGULATION | ||||
Rate Cases
General rate cases are necessary to cover the costs of providing safe, reliable service, while contributing to earnings growth and achieving our financial objectives. We evaluate the need for electric and natural gas rate changes in each of our jurisdictions annually. In conjunction with the filing required for our natural gas production assets in Montana, we expect to submit a natural gas distribution, transmission and storage rate filing based on a 2015 test year.
27
Montana Electric and Natural Gas Tracker Filings
Each year we submit an electric and natural gas tracker filing for recovery of supply costs for the 12-month period ended June 30 and for the projected supply costs for the next 12-month period. The MPSC reviews such filings and makes its cost recovery determination based on whether or not our electric and natural gas supply procurement activities were prudent.
Electric Tracker - The MPSC held a work session in March 2016 and, in a 3 - 2 decision, directed staff to draft final orders in our electric tracker dockets covering 2012/2013, 2013/2014 and 2014/2015 that reflect a disallowance of both replacement power costs from an outage at Colstrip Unit 4 and generation portfolio modeling costs. Inclusion of replacement power costs in the tracker filing is consistent with the treatment of previous Colstrip Unit 4 outage costs. Due to the joint ownership of Colstrip Units 3 and 4 with other utilities, the replacement power costs associated with this outage were subject to a prudency review by several other state utility commissions. No other state utility commission found that the replacement power costs relating to the 2013 Colstrip Unit 4 outage were imprudent. In fact, the Idaho Public Utilities Commission concluded that there was no evidence that one of our co-owners imprudently incurred the Colstrip replacement power costs. The Washington Utilities and Transportation Commission Staff concluded that the outage was not the result of imprudent actions by that same owner, and authorized the adjustment of rates as requested in the filing.
The disallowed modeling costs reflect costs we incur with external vendors to conduct analysis and determine a prudent approach to our supply needs, which reflects the use of our owned generation combined with a procurement strategy. The statute guiding our trackers defines electricity supply costs as those directly related to power purchase agreements, demand-side management and energy efficiency programs.
Based on this March 2016 oral decision, we recorded a disallowance in the first quarter of 2016. In April 2016, we received a final written order in the 2014/2015 tracker consistent with the oral decision, and expect the MPSC to issue a final order in the consolidated 2012/2013 and 2013/2014 tracker dockets in the second quarter of 2016. We will evaluate our legal options once we receive a final written order in the consolidated docket.
• | This disallowance of approximately $10.3 million, which includes $8.2 million of replacement power costs and $2.1 million of modeling costs, is reflected in cost of sales in our results for the three months ended March 31, 2016. The modeling cost disallowance includes approximately $1.5 million of costs included in the tracker dockets discussed above, and approximately $0.6 million expensed for the 2015/2016 tracker period to be filed in May 2016. The total disallowed modeling costs for periods prior to 2016 is approximately $1.9 million. |
Natural Gas Tracker - In October 2015, we received a final order in the natural gas consolidated 2013/2014 and 2012/2013 tracker docket. This consolidated docket included our request to continue collecting the cost of service for natural gas production interests acquired in August 2012 and December 2013 in northern Montana's Bear Paw Basin (Bear Paw) on an interim basis until approval is received for inclusion of these assets in rate base. In addition, the MPSC issued an order in February 2016 on our 2014/2015 natural gas tracker. In addition to revising rates on an interim basis, these orders require us to provide information supporting a departure from normal ratemaking procedures for our natural gas production assets. We must submit information sufficient for the MPSC to adopt its choice of a mechanism that annually lowers the revenue requirement and associated rate base value of the depleting and depreciating assets.
• | The order requires us to make a filing by September 2016 to address the cost-recovery of our natural gas production fields. |
Electric and Natural Gas Lost Revenue Adjustment Mechanism - In October 2015, the MPSC issued an order eliminating the lost revenue adjustment mechanism. This mechanism was established in 2005 by the MPSC as a component of an approved energy efficiency program, by which we recovered on an after-the-fact basis a portion of our fixed costs that would otherwise have been collected in the kWh sales lost due to energy efficiency programs through our electric and natural supply tracker. Lost revenues were removed prospectively effective December 1, 2015.
Our last approved supply tracker included approximately $7.1 million of lost revenue recovery based on an approved independent study of the annual impact of efficiency efforts. Consistent with this approval, for the period July 1, 2012 through November 30, 2015, we recognized $7.1 million of DSM lost revenues for each annual electric supply tracker period and deferred the remaining portion of efficiency efforts in excess of these amounts. As the 2012/2013 and 2013/2014 annual electric tracker filings are still subject to final approval, the MPSC may ultimately require us to refund more than we have deferred or approve recovery of more DSM lost revenues than we have recognized since July 2012.
28
• | We expect net income to decrease approximately $4 million on an annualized basis due to this decision. |
Hydro Compliance Filing
The MPSC order approving our acquisition of the hydro assets provided that customers would have no financial risk related to our temporary ownership of the Kerr facility, with a compliance filing required upon completion of the transfer to the Confederated Salish and Kootenai Tribes (CSKT). We sold any excess system generation, which was primarily due to our temporary ownership of Kerr, in the market and provided revenue credits to our Montana retail customers until the transfer to the CSKT. Therefore, during our temporary ownership a net benefit of approximately $2.7 million was provided to customers and there was no benefit to shareholders. In December 2015, we submitted the required compliance filing to remove Kerr from cost of service, adjust for actual revenue credits and increase property taxes to actual amounts. In January 2016, the MPSC approved an interim adjustment to our hydro generation rate based on the compliance filing, and opened a separate contested docket requesting additional detail on the adjustment to rates due to the conveyance of Kerr. While the MCC has not filed testimony in this contested docket, the MPSC identified additional issues and requested information. We expect the MPSC to issue a final order during the second half of 2016.
• | We expect the reduction in revenues as a result of the conveyance of Kerr to be offset with a corresponding reduction in operating expenses. |
Montana Electricity Supply Resource Procurement Plan
In March 2016, we submitted our electricity supply resource procurement plan (the Plan) to the MPSC, which is updated and filed every two years. The Plan is meant to provide a road map to our stakeholders, including our customers and regulators regarding how we expect to respond to future supply needs and is subject to review and public comment. While we have acquired a significant amount of generation capacity, a significant capacity resource deficit persists. The Plan identifies how to best meet the capacity need and includes a set of action plans we expect to implement on a going forward basis. In addition to meeting peak needs, soon-to-be imposed national reliability standards will require us to have even greater generation capacity available and be capable of increasing or decreasing output to address the intermittent nature of generation such as wind. To address the need for more capacity generation, the analysis indicates adding natural gas-fired generation is the lowest-cost/least-risk approach for addressing customers’ peak demand needs. In addition, we are evaluating adding incremental generation to our hydro capability as a zero carbon alternative.
Supply Investments
We updated our capital spending forecast during the first quarter of 2016 to reflect the Montana procurement plan and our analysis of needs in South Dakota. This updated forecast includes incremental investment of approximately $122 million on internal combustion facilities in Montana, and approximately $65 million of peaking facilities in South Dakota over the five year period that was not included in the forecast in our most recent Form 10-K. Prior to any generation investment we will work with our regulators to define a clear regulatory recovery approach.
29
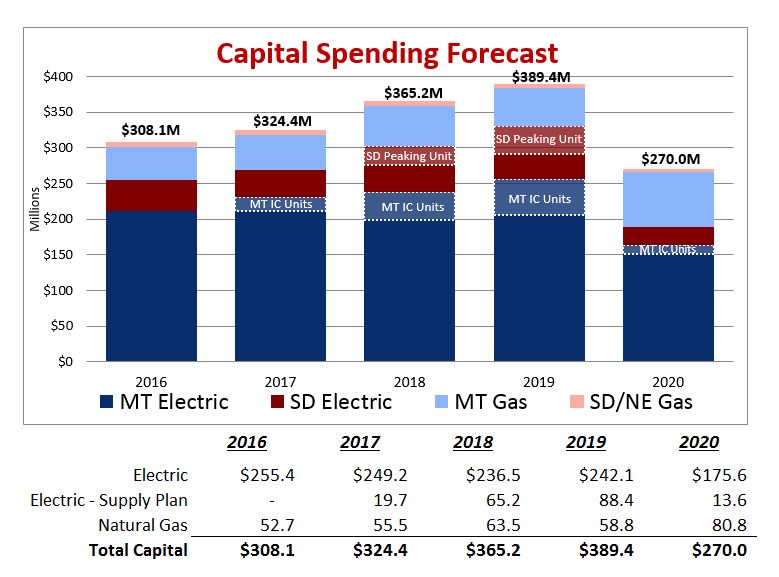
Colstrip Facility Working Group
The Colstrip coal-fired generating facility is located in southeastern Montana and includes four units with a net capacity of 2,094 MW. We own a 30 percent interest in Unit 4, or 222 MWs. As discussed above, the CPP reduction of 47 percent in carbon dioxide emissions in Montana by 2030 is the greatest reduction target among the lower 48 states, according to a nationwide analysis. The Governor of Montana is convening a working group to explore the potential of a transfer of ownership of Colstrip Units 1, 2, and 3. At the Governor's request, we agreed to participate in the working group while, at the same time expressing our concerns regarding the significant legal and regulatory constraints. As noted in our response to the request, our primary focus is the core obligation of serving our Montana customers, and ownership of additional generation that is not consistent with the needs outlined in our electricity supply procurement plan raises significant concerns.
FERC Filing - Dave Gates Generating Station at Mill Creek (DGGS)
In April 2014, the FERC issued an order affirming a FERC Administrative Law Judge's (ALJ) initial decision in September 2012, regarding cost allocation at DGGS between retail and wholesale customers. This decision concluded that only a portion of these costs should be allocated to FERC jurisdictional customers. We have been recognizing revenue consistent with the ALJ's initial decision. As of March 31, 2016, we have cumulative deferred revenue of approximately $27.3 million, which is subject to refund and recorded within current regulatory liabilities in the Consolidated Balance Sheets.
In May 2014, we filed a request for rehearing, which remains pending. In our request for rehearing, we have argued that no refunds are due even if the cost allocation method is modified prospectively. There is no deadline by which FERC must act on our rehearing petition. Customer refunds, if any, will not be due until 30 days after a FERC order on rehearing. If unsuccessful on rehearing, we may appeal to a United States Circuit Court of Appeals. The time line for any such appeal could, depending on when the FERC issues a rehearing order, extend into 2017 or beyond.
The FERC order was assessed as a triggering event as to whether an impairment charge should be recorded with respect to DGGS. DGGS previously provided only regulation and balancing service, which is the basis for the cost allocation in our filings. The addition of owned hydro generation is driving a shift in utilization of DGGS. In support of our electricity supply resource procurement plan filed with the MPSC in March 2016, we conducted a portfolio optimization analysis to evaluate
30
options to use DGGS in combination with other generation resources. This analysis indicates DGGS provides cost-effective products necessary to operate our Montana electricity portfolio, including regulation, load following, peaking services and other ancillary products such as operating reserves, which should guide future cost recovery. The cost recovery of any alternative use of DGGS would be subject to regulatory approval and we cannot provide assurance of such approval. We do not believe an impairment loss is probable at this time; however, we will continue to evaluate recovery of this asset in the future as facts and circumstances change.
RESULTS OF OPERATIONS | ||||
Our consolidated results include the results of our reportable business segments, which are primarily engaged in the electric and natural gas business. The overall consolidated discussion is followed by a detailed discussion of gross margin by segment.
Non-GAAP Financial Measure
The following discussion includes financial information prepared in accordance with GAAP, as well as another financial measure, Gross Margin, that is considered a “non-GAAP financial measure.” Generally, a non-GAAP financial measure is a numerical measure of a company’s financial performance, financial position or cash flows that exclude (or include) amounts that are included in (or excluded from) the most directly comparable measure calculated and presented in accordance with GAAP. Gross Margin (Revenues less Cost of Sales) is a non-GAAP financial measure due to the exclusion of depreciation and depletion from the measure. The presentation of Gross Margin is intended to supplement investors’ understanding of our operating performance. Gross Margin is used by us to determine whether we are collecting the appropriate amount of energy costs from customers to allow recovery of operating costs. Our Gross Margin measure may not be comparable to other companies’ Gross Margin measure. Furthermore, this measure is not intended to replace operating income as determined in accordance with GAAP as an indicator of operating performance.
31
Factors Affecting Results of Operations
Our revenues may fluctuate substantially with changes in supply costs, which are generally collected in rates from customers. In addition, various regulatory agencies approve the prices for electric and natural gas utility service within their respective jurisdictions and regulate our ability to recover costs from customers.
Revenues are also impacted to a lesser extent by customer growth and usage, the latter of which is primarily affected by weather. Very cold winters increase demand for natural gas and to a lesser extent, electricity, while warmer than normal summers increase demand for electricity, especially among our residential and commercial customers. We measure this effect using degree-days, which is the difference between the average daily actual temperature and a baseline temperature of 65 degrees. Heating degree-days result when the average daily temperature is less than the baseline. Cooling degree-days result when the average daily temperature is greater than the baseline. The statistical weather information in our regulated segments represents a comparison of this data.
Three Months Ended March 31, 2016 Compared with the Three Months Ended March 31, 2015
Three Months Ended March 31, | ||||||||||||||
2016 | 2015 | Change | % Change | |||||||||||
(dollars in millions) | ||||||||||||||
Operating Revenues | ||||||||||||||
Electric | $ | 241.3 | $ | 236.0 | $ | 5.3 | 2.2 | % | ||||||
Natural Gas | 91.2 | 110.0 | (18.8 | ) | (17.1 | ) | ||||||||
Total Operating Revenues | $ | 332.5 | $ | 346.0 | $ | (13.5 | ) | (3.9 | )% | |||||
Three Months Ended March 31, | ||||||||||||||
2016 | 2015 | Change | % Change | |||||||||||
(dollars in millions) | ||||||||||||||
Cost of Sales | ||||||||||||||
Electric | $ | 83.6 | $ | 63.9 | $ | 19.7 | 30.8 | % | ||||||
Natural Gas | 31.8 | 48.5 | (16.7 | ) | (34.4 | ) | ||||||||
Total Cost of Sales | $ | 115.4 | $ | 112.4 | $ | 3.0 | 2.7 | % | ||||||
Three Months Ended March 31, | ||||||||||||||
2016 | 2015 | Change | % Change | |||||||||||
(dollars in millions) | ||||||||||||||
Gross Margin | ||||||||||||||
Electric | $ | 157.7 | $ | 172.1 | $ | (14.4 | ) | (8.4 | )% | |||||
Natural Gas | 59.4 | 61.5 | (2.1 | ) | (3.4 | ) | ||||||||
Total Gross Margin | $ | 217.1 | $ | 233.6 | $ | (16.5 | ) | (7.1 | )% | |||||
32
Primary components of the change in gross margin include the following:
Gross Margin 2016 vs. 2015 | |||
(in millions) | |||
Gross Margin Items Impacting Net Income | |||
South Dakota electric rate increase | $ | 8.6 | |
Natural gas retail volumes | 0.2 | ||
MPSC disallowance | (10.3 | ) | |
Natural gas production | (2.4 | ) | |
Lost revenue adjustment mechanism | (1.8 | ) | |
Electric transmission | (1.3 | ) | |
Electric retail volumes | (1.0 | ) | |
Spion Kop rate decrease | (0.4 | ) | |
Other | (0.9 | ) | |
Change in Gross Margin Impacting Net Income | (9.3 | ) | |
Gross Margin Items Offset in Operating Expenses and Income Tax Expense | |||
Hydro operations - Kerr conveyance | (5.9 | ) | |
Production tax credits flowed-through trackers | (3.0 | ) | |
Property taxes recovered in trackers | 1.7 | ||
Change in Items Offset Within Net Income | (7.2 | ) | |
Decrease in Consolidated Gross Margin | $ | (16.5 | ) |
Consolidated gross margin for items impacting net income is a decrease of $9.3 million, which includes the following:
• | Improvement in gross margin due to an increase in South Dakota electric rates and an increase in natural gas retail volumes, offset by; |
• | The MPSC disallowance of previously incurred costs as discussed above; |
• | A decrease in gross margin from natural gas production due primarily to a reduction in interim rates of approximately $1.8 million, based on actual costs, and a decrease in gathering fees; |
• | A decrease in the recovery of fixed costs through our trackers as a result of the MPSC order eliminating the lost revenue adjustment mechanism prospectively effective December 1, 2015; |
• | Lower demand to transmit energy across our transmission lines due to market pricing and other conditions; |
• | The decrease in electric retail volumes reflects lower industrial volumes of a large Montana customer of approximately $0.7 million, which we expect to continue through 2016, and warmer winter weather in our South Dakota jurisdiction; and |
• | A decrease in Spion Kop rates effective January 2016. |
The change in consolidated gross margin also includes the following items that had no impact on net income:
• | A decrease in revenues from the conveyance of the Kerr facility to the CSKT in September 2015 (offset by reduced operating expenses); |
• | A decrease in revenues for production tax credits associated with the Beethoven wind project, which is a reduction in our customers rates (offset by reduced income tax expense); and |
• | An increase in revenues for property taxes included in trackers (offset by increased property tax expense). |
33
Three Months Ended March 31, | ||||||||||||||
2016 | 2015 | Change | % Change | |||||||||||
(dollars in millions) | ||||||||||||||
Operating Expenses (excluding cost of sales) | ||||||||||||||
Operating, general and administrative | $ | 79.9 | $ | 81.1 | $ | (1.2 | ) | (1.5 | )% | |||||
Property and other taxes | 35.4 | 32.8 | 2.6 | 7.9 | ||||||||||
Depreciation and depletion | 39.9 | 35.8 | 4.1 | 11.5 | ||||||||||
$ | 155.2 | $ | 149.7 | $ | 5.5 | 3.7 | % | |||||||
Consolidated operating, general and administrative expenses were $79.9 million for the three months ended March 31, 2016, as compared with $81.1 million for the three months ended March 31, 2015. Primary components of the change include the following:
Operating, General & Administrative Expenses | |||
2016 vs. 2015 | |||
(in millions) | |||
Hydro operations - Kerr conveyance | $ | (5.6 | ) |
Non-employee directors deferred compensation | 3.1 | ||
Insurance reserves | 0.9 | ||
Other | 0.4 | ||
Decrease in Operating, General & Administrative Expenses | $ | (1.2 | ) |
The decrease in hydro operations costs in the current period is a result of the conveyance of Kerr to the CSKT in September 2015, which is offset by reduced revenue discussed above. In addition, the change in value of non-employee directors deferred compensation as a result of changes in stock price is offset below in other income. These items have no impact on net income. Absent these items, operating, general and administrative expenses increased by approximately $1.3 million, driven by an increase in insurance reserves primarily due to the Billings, Montana refinery outage discussed in Note 12 to the financial statements.
Property and other taxes were $35.4 million for the three months ended March 31, 2016, as compared with $32.8 million in the same period of 2015. This increase was primarily due to plant additions and higher estimated property valuations in Montana, offset in part by a $0.3 million decrease from the conveyance of Kerr to the CSKT in September 2015. We estimate property taxes throughout each year and update to the actual expense when we receive our Montana property tax bills in November. In addition, under Montana law, we are allowed to track the increases in the actual level of state and local taxes and fees and recover these amounts. The MPSC has authorized recovery of approximately 60% of the estimated increase in our local taxes and fees (primarily property taxes) as compared to the related amount included in rates during our last general rate case.
Depreciation and depletion expense was $39.9 million for the three months ended March 31, 2016, as compared with $35.8 million in the same period of 2015. This increase was primarily due to plant additions, including approximately $1.4 million of depreciation associated with the Beethoven wind project acquisition.
Consolidated operating income for the three months ended March 31, 2016 was $61.9 million, as compared with $83.9 million in the same period of 2015. This decrease was primarily due to the MPSC disallowance and higher operating costs as discussed above, partly offset by the South Dakota electric rate increase.
Consolidated interest expense for the three months ended March 31, 2016 was $24.5 million, as compared with $23.1 million in the same period of 2015. This increase was primarily due to increased debt outstanding associated with the Beethoven wind project acquisition and lower capitalization of allowance for funds used during construction (AFUDC).
Consolidated other income for the three months ended March 31, 2016, was $3.1 million, as compared with $0.6 million in the same period of 2015. This increase was primarily due to a $3.1 million increase in the value of deferred shares held in trust
34
for non-employee directors deferred compensation (which, as discussed above, is offset by a corresponding increase to operating, general and administrative expenses). The resulting net decrease in other income is due to lower capitalization of AFUDC.
Consolidated income tax expense for the three months ended March 31, 2016 was $2.5 million, as compared with $10.0 million in the same period of 2015. Our effective tax rate for the three months ended March 31, 2016 was 6.1% as compared with 16.3% for the same period of 2015. We currently expect our 2016 effective tax rate to range between 6% - 10%.
The following table summarizes the differences between our effective tax rate and the federal statutory rate (in millions):
Three Months Ended March 31, | |||||||||||||
2016 | 2015 | ||||||||||||
Income Before Income Taxes | $ | 40.5 | $ | 61.4 | |||||||||
Income tax calculated at 35% federal statutory rate | 14.2 | 35.0 | % | 21.5 | 35.0 | % | |||||||
Permanent or flow through adjustments: | |||||||||||||
State income, net of federal provisions | (1.1 | ) | (2.7 | ) | 0.2 | 0.3 | |||||||
Flow-through repairs deductions | (6.7 | ) | (16.5 | ) | (9.6 | ) | (15.7 | ) | |||||
Production tax credits | (2.8 | ) | (6.8 | ) | (1.3 | ) | (2.1 | ) | |||||
Plant and depreciation of flow through items | (0.9 | ) | (2.3 | ) | (0.4 | ) | (0.6 | ) | |||||
Other, net | (0.2 | ) | (0.6 | ) | (0.4 | ) | (0.6 | ) | |||||
(11.7 | ) | (28.9 | ) | (11.5 | ) | (18.7 | ) | ||||||
Income Tax Expense | $ | 2.5 | 6.1 | % | $ | 10.0 | 16.3 | % | |||||
We compute income tax expense for each quarter based on the estimated annual effective tax rate for the year, adjusted for certain discrete items. Our effective tax rate typically differs from the federal statutory tax rate of 35% primarily due to the regulatory impact of flowing through federal and state tax benefits of repairs deductions, state tax benefit of accelerated tax depreciation deductions (including bonus depreciation when applicable) and production tax credits.
Consolidated net income for the three months ended March 31, 2016 was $38.1 million as compared with $51.4 million for the same period in 2015. This decrease was primarily due to the MPSC disallowance and higher operating expenses as discussed above, partly offset by the South Dakota electric rate increase and lower income tax expense.
35
ELECTRIC SEGMENT
We have various classifications of electric revenues, defined as follows:
• | Retail: Sales of electricity to residential, commercial and industrial customers. |
• | Regulatory amortization: Primarily represents timing differences for electric supply costs and property taxes between when we incur these costs and when we recover these costs in rates from our customers. |
• | Transmission: Reflects transmission revenues regulated by the FERC. |
• | Ancillary Services: FERC jurisdictional services that ensure reliability and support the transmission of electricity from generation sites to customer loads. Such services include regulation service, reserves and voltage support. |
• | Wholesale and other: In October 2015, we became a member of the Southwest Power Pool (SPP), which is a regional transmission organization. As a market participant in SPP, we buy and sell wholesale energy and reserves through the operation of a single, consolidated SPP balancing authority. As such, the increase in wholesale revenues is offset through an increase in cost of sales. This line also includes miscellaneous electric revenues. |
Three Months Ended March 31, 2016 Compared with the Three Months Ended March 31, 2015
Results | ||||||||||||||
2016 | 2015 | Change | % Change | |||||||||||
(dollars in millions) | ||||||||||||||
Retail revenues | $ | 210.1 | $ | 220.0 | $ | (9.9 | ) | (4.5 | )% | |||||
Regulatory amortization | (3.2 | ) | (1.0 | ) | (2.2 | ) | (220.0 | ) | ||||||
Total retail revenues | 206.9 | 219.0 | (12.1 | ) | (5.5 | ) | ||||||||
Transmission | 12.5 | 13.9 | (1.4 | ) | (10.1 | ) | ||||||||
Ancillary services | 0.4 | 0.4 | — | — | ||||||||||
Wholesale and other | 21.5 | 2.7 | 18.8 | 696.3 | ||||||||||
Total Revenues | 241.3 | 236.0 | 5.3 | 2.2 | ||||||||||
Total Cost of Sales | 83.6 | 63.9 | 19.7 | 30.8 | ||||||||||
Gross Margin | $ | 157.7 | $ | 172.1 | $ | (14.4 | ) | (8.4 | )% | |||||
Revenues | Megawatt Hours (MWH) | Avg. Customer Counts | |||||||||||||||||
2016 | 2015 | 2016 | 2015 | 2016 | 2015 | ||||||||||||||
(in thousands) | |||||||||||||||||||
Montana | $ | 76,690 | $ | 79,727 | 668 | 667 | 290,053 | 285,948 | |||||||||||
South Dakota | 15,238 | 14,723 | 168 | 184 | 49,910 | 49,774 | |||||||||||||
Residential | 91,928 | 94,450 | 836 | 851 | 339,963 | 335,722 | |||||||||||||
Montana | 83,023 | 89,840 | 793 | 793 | 65,277 | 64,370 | |||||||||||||
South Dakota | 20,494 | 19,037 | 251 | 257 | 12,466 | 12,322 | |||||||||||||
Commercial | 103,517 | 108,877 | 1,044 | 1,050 | 77,743 | 76,692 | |||||||||||||
Industrial | 9,917 | 11,815 | 534 | 566 | 73 | 75 | |||||||||||||
Other | 4,775 | 4,895 | 23 | 23 | 4,668 | 4,574 | |||||||||||||
Total Retail Electric | $ | 210,137 | $ | 220,037 | 2,437 | 2,490 | 422,447 | 417,063 | |||||||||||
Heating Degree Days | 2016 as compared with: | ||||||||
2016 | 2015 | Historic Average | 2015 | Historic Average | |||||
Montana | 2,987 | 2,891 | 3,288 | 3% colder | 9% warmer | ||||
South Dakota | 3,674 | 4,089 | 4,074 | 10% warmer | 10% warmer | ||||
36
The following summarizes the components of the changes in electric gross margin for the three months ended March 31, 2016 and 2015:
Gross Margin 2016 vs. 2015 | |||
(in millions) | |||
Gross Margin Items Impacting Net Income | |||
South Dakota electric rate increase | $ | 8.6 | |
MPSC disallowance | (10.3 | ) | |
Lost revenue adjustment mechanism | (1.8 | ) | |
Transmission | (1.3 | ) | |
Retail volumes | (1.0 | ) | |
Spion Kop rate decrease | (0.4 | ) | |
Other | (0.7 | ) | |
Change in Gross Margin Impacting Net Income | (6.9 | ) | |
Gross Margin Items Offset in Operating Expenses and Income Tax Expense | |||
Hydro operations - Kerr conveyance | (5.9 | ) | |
Production tax credits flowed-through trackers | (3.0 | ) | |
Property taxes recovered in trackers | 1.4 | ||
Change in Items Offset Within Net Income | (7.5 | ) | |
Decrease in Consolidated Gross Margin | $ | (14.4 | ) |
Gross margin for items impacting net income is a decrease of $6.9 million including the following:
• | Improvement in gross margin due to an increase in South Dakota electric rates, offset by; |
• | The MPSC disallowance of previously incurred costs as discussed above; |
• | A decrease in the recovery of fixed costs through our trackers as a result of the MPSC order eliminating the lost revenue adjustment mechanism prospectively effective December 1, 2015; |
• | Lower demand to transmit energy across our transmission lines due to market pricing and other conditions; |
• | The decrease in retail volumes reflects lower industrial volumes of a large Montana customer of approximately $0.7 million, which we expect to continue through 2016, and warmer winter weather in our South Dakota jurisdiction; and |
• | A decrease in Spion Kop rates effective January 2016. |
The change in gross margin also includes the following items that had no impact on net income:
• | A decrease in revenues from the conveyance of the Kerr facility to the CSKT in September 2015 (offset by reduced operating expenses); |
• | A decrease in revenues for production tax credits associated with the Beethoven wind project, which is a reduction in our customers rates (offset by reduced income tax expense); and |
• | An increase in revenues for property taxes included in trackers (offset by increased property tax expense). |
The change in regulatory amortization revenue is due to timing differences between when we incur electric supply costs and when we recover these costs in rates from our customers, which has a minimal impact on gross margin. In addition, our wholesale and other revenues are largely gross margin neutral as they are offset by changes in cost of sales.
37
NATURAL GAS SEGMENT
We have various classifications of natural gas revenues, defined as follows:
• | Retail: Sales of natural gas to residential, commercial and industrial customers. |
• | Regulatory amortization: Primarily represents timing differences for natural gas supply costs and property taxes between when we incur these costs and when we recover these costs in rates from our customers, which is also reflected in cost of sales and therefore has minimal impact on gross margin. |
• | Wholesale: Primarily represents transportation and storage for others. |
Three Months Ended March 31, 2016 Compared with the Three Months Ended March 31, 2015
Results | ||||||||||||||
2016 | 2015 | Change | % Change | |||||||||||
(dollars in millions) | ||||||||||||||
Retail revenues | $ | 83.9 | $ | 101.8 | $ | (17.9 | ) | (17.6 | )% | |||||
Regulatory amortization | (3.0 | ) | (3.0 | ) | — | — | ||||||||
Total retail revenues | 80.9 | 98.8 | (17.9 | ) | (18.1 | ) | ||||||||
Wholesale and other | 10.3 | 11.2 | (0.9 | ) | (8.0 | ) | ||||||||
Total Revenues | 91.2 | 110.0 | (18.8 | ) | (17.1 | ) | ||||||||
Total Cost of Sales | 31.8 | 48.5 | (16.7 | ) | (34.4 | ) | ||||||||
Gross Margin | $ | 59.4 | $ | 61.5 | $ | (2.1 | ) | (3.4 | )% | |||||
Revenues | Dekatherms (Dkt) | Customer Counts | |||||||||||||||||
2016 | 2015 | 2016 | 2015 | 2016 | 2015 | ||||||||||||||
(in thousands) | |||||||||||||||||||
Montana | $ | 36,324 | $ | 39,832 | 4,957 | 4,763 | 167,786 | 165,618 | |||||||||||
South Dakota | 10,148 | 13,751 | 1,387 | 1,566 | 39,351 | 39,089 | |||||||||||||
Nebraska | 7,819 | 11,436 | 1,138 | 1,319 | 37,309 | 37,221 | |||||||||||||
Residential | 54,291 | 65,019 | 7,482 | 7,648 | 244,446 | 241,928 | |||||||||||||
Montana | 17,885 | 19,895 | 2,525 | 2,448 | 23,224 | 22,973 | |||||||||||||
South Dakota | 6,609 | 9,246 | 1,255 | 1,375 | 6,462 | 6,316 | |||||||||||||
Nebraska | 4,273 | 6,658 | 799 | 930 | 4,746 | 4,692 | |||||||||||||
Commercial | 28,767 | 35,799 | 4,579 | 4,753 | 34,432 | 33,981 | |||||||||||||
Industrial | 437 | 565 | 63 | 71 | 262 | 263 | |||||||||||||
Other | 386 | 386 | 62 | 56 | 158 | 152 | |||||||||||||
Total Retail Gas | $ | 83,881 | $ | 101,769 | 12,186 | 12,528 | 279,298 | 276,324 | |||||||||||
Heating Degree Days | 2016 as compared with: | ||||||||
2016 | 2015 | Historic Average | 2015 | Historic Average | |||||
Montana | 2,987 | 2,891 | 3,288 | 3% colder | 9% warmer | ||||
South Dakota | 3,674 | 4,089 | 4,074 | 10% warmer | 10% warmer | ||||
Nebraska | 2,951 | 3,374 | 3,381 | 13% warmer | 13% warmer | ||||
38
The following summarizes the components of the changes in natural gas gross margin for the three months ended March 31, 2016 and 2015:
Gross Margin 2016 vs. 2015 | |||
(in millions) | |||
Gross Margin Items Impacting Net Income | |||
Natural gas production | $ | (2.4 | ) |
Retail volumes | 0.2 | ||
Other | (0.2 | ) | |
Change in Gross Margin Impacting Net Income | (2.4 | ) | |
Gross Margin Item Offset in Operating Expenses | |||
Property taxes recovered in trackers | 0.3 | ||
Change in Item Offset Within Net Income | 0.3 | ||
Decrease in Consolidated Gross Margin | $ | (2.1 | ) |
Gross margin for items impacting net income is a decrease of $2.4 million. Gross margin includes a decrease from natural gas production due primarily to a reduction in interim rates of approximately $1.8 million, based on actual costs, and a decrease in gathering fees. This was offset by an increase in natural gas retail volumes, which reflects colder winter weather in Montana offset by warmer winter weather in South Dakota. The increase in revenues for property taxes included in trackers is offset by increased property tax expense with no impact to net income.
Average natural gas supply prices decreased in 2016 resulting in lower retail revenues and cost of sales as compared with 2015, with no impact to gross margin. In addition, our wholesale and other revenues are largely gross margin neutral as they are offset by changes in cost of sales.
LIQUIDITY AND CAPITAL RESOURCES | ||||
Sources and Uses of Funds
We require liquidity to support and grow our business, and use our liquidity for working capital needs, capital expenditures, investments in or acquisitions of assets, and to repay debt. We believe our cash flows from operations and existing borrowing capacity should be sufficient to fund our operations, service existing debt, pay dividends, and fund capital expenditures (excluding strategic growth opportunities). The amount of capital expenditures and dividends are subject to certain factors including the use of existing cash, cash equivalents and the receipt of cash from operations. In addition, a material change in operations or available financing could impact our current liquidity and ability to fund capital resource requirements, and we may defer a portion of our planned capital expenditures as necessary.
We issue debt securities to refinance retiring maturities, reduce short-term debt, fund construction programs and for other general corporate purposes. To fund our strategic growth opportunities we utilize available cash flow, debt capacity and equity issuances that allow us to maintain investment grade ratings. We plan to maintain a 50 - 55 percent debt to total capital ratio excluding capital leases, and expect to continue targeting a long-term dividend payout ratio of 60 - 70 percent of earnings per share; however, there can be no assurance that we will be able to meet these targets.
Short-term liquidity is provided by internal cash flows, the sale of commercial paper and use of our revolving credit facility. We utilize our short-term borrowings and/or revolver availability to manage our cash flows due to the seasonality of our business, and utilize any cash on hand in excess of current operating requirements to invest in our business and reduce borrowings. Short-term borrowings may also be used to temporarily fund utility capital requirements. As of March 31, 2016, our total net liquidity was approximately $197.1 million, including $9.0 million of cash and $188.1 million of revolving credit facility availability. Revolving credit facility availability was $153.1 million as of April 15, 2016.
39
The following table presents additional information about short term borrowings during the three months ended March 31, 2016 (in millions):
Amount outstanding at period end | $ | 161.9 | |
Daily average amount outstanding | $ | 183.3 | |
Maximum amount outstanding | $ | 230.8 | |
Factors Impacting our Liquidity
Supply Costs - Our operations are subject to seasonal fluctuations in cash flow. During the heating season, which is primarily from November through March, cash receipts from natural gas and electric sales typically exceed cash requirements. During the summer months, cash on hand, together with the seasonal increase in cash flows and utilization of our existing revolver, are used to purchase natural gas to place in storage, perform maintenance and make capital improvements.
The effect of this seasonality on our liquidity is also impacted by changes in the market prices of our electric and natural gas supply, which is recovered through various monthly cost tracking mechanisms. These energy supply tracking mechanisms are designed to provide stable and timely recovery of supply costs on a monthly basis during the July to June annual tracking period, with an adjustment in the following annual tracking period to correct for any under or over collection in our monthly trackers. Due to the lag between our purchases of electric and natural gas commodities and revenue receipt from customers, cyclical over and under collection situations arise consistent with the seasonal fluctuations discussed above; therefore we usually under collect in the fall and winter and over collect in the spring. Fluctuations in recoveries under our cost tracking mechanisms can have a significant effect on cash flows from operations and make year-to-year comparisons difficult.
As of March 31, 2016, we are under collected on our supply trackers by approximately $18.5 million, as compared with $29.4 million as of December 31, 2015, and $12.7 million as of March 31, 2015.
Credit Ratings
In general, less favorable credit ratings make debt financing more costly and more difficult to obtain on terms that are favorable to us and our customers, and impact our trade credit availability. Fitch Ratings (Fitch), Moody’s Investors Service (Moody's) and Standard and Poor’s Ratings Service (S&P) are independent credit-rating agencies that rate our debt securities. These ratings indicate the agencies’ assessment of our ability to pay interest and principal when due on our debt. As of April 15, 2016, our current ratings with these agencies are as follows:
Senior Secured Rating | Senior Unsecured Rating | Commercial Paper | Outlook | ||||
Fitch | A | A- | F2 | Stable | |||
Moody’s | A1 | A3 | Prime-2 | Negative | |||
S&P | A- | BBB | A-2 | Stable | |||
A security rating is not a recommendation to buy, sell or hold securities. Such rating may be subject to revision or withdrawal at any time by the credit rating agency and each rating should be evaluated independently of any other rating.
40
Cash Flows
The following table summarizes our consolidated cash flows (in millions):
Three Months Ended March 31, | |||||||
2016 | 2015 | ||||||
Operating Activities | |||||||
Net income | $ | 38.1 | $ | 51.4 | |||
Non-cash adjustments to net income | 47.3 | 44.6 | |||||
Changes in working capital | 57.0 | 30.0 | |||||
Other noncurrent assets and liabilities | (0.3 | ) | 0.8 | ||||
Cash Provided by Operating Activities | 142.1 | 126.8 | |||||
Investing Activities | |||||||
Property, plant and equipment additions | (51.3 | ) | (56.5 | ) | |||
Change in restricted cash | — | 4.8 | |||||
Cash Used in Investing Activities | (51.3 | ) | (51.7 | ) | |||
Financing Activities | |||||||
Repayments of short-term borrowings, net | (68.0 | ) | (57.9 | ) | |||
Dividends on common stock | (23.9 | ) | (22.4 | ) | |||
Financing costs | (0.2 | ) | (1.1 | ) | |||
Other | (1.7 | ) | (2.0 | ) | |||
Cash Used in Financing Activities | (93.8 | ) | (83.4 | ) | |||
Decrease in Cash and Cash Equivalents | $ | (3.0 | ) | $ | (8.3 | ) | |
Cash and Cash Equivalents, beginning of period | $ | 12.0 | $ | 20.4 | |||
Cash and Cash Equivalents, end of period | $ | 9.0 | $ | 12.1 | |||
Cash Provided by Operating Activities
As of March 31, 2016, cash and cash equivalents were $9.0 million as compared with $12.0 million at December 31, 2015 and $12.1 million at March 31, 2015. Cash provided by operating activities totaled $142.1 million for the three months ended March 31, 2016 as compared with $126.8 million during the three months ended March 31, 2015. This increase in operating cash flows is primarily due to an $18.4 million settlement of interest rate swaps during the first quarter of 2015.
Cash Used in Investing Activities
Cash used in investing activities decreased by approximately $0.4 million as compared with the first three months of 2015. Plant additions during 2016 include maintenance additions of approximately $28.5 million, capacity related capital expenditures of approximately $13.9 million, and infrastructure capital expenditures of approximately $8.9 million. Plant additions during the first three months of 2015 included maintenance additions of approximately $37.0 million, supply related capital expenditures of approximately $9.9 million, which were primarily related to electric generation facilities in South Dakota, and infrastructure capital expenditures of approximately $9.6 million.
Cash Used in Financing Activities
Cash used in financing activities totaled $93.8 million during the three months ended March 31, 2016 as compared with $83.4 million during the three months ended March 31, 2015. During the three months ended March 31, 2016, net cash used in financing activities includes net repayments of commercial paper of $68.0 million and the payment of dividends of $23.9 million. During the three months ended March 31, 2015, net cash used in financing activities consisted of net repayments of commercial paper of $57.9 million and the payment of dividends of $22.4 million.
41
Contractual Obligations and Other Commitments
We have a variety of contractual obligations and other commitments that require payment of cash at certain specified periods. The following table summarizes our contractual cash obligations and commitments as of March 31, 2016. See our Annual Report on Form 10-K for the year ended December 31, 2015 for additional discussion.
Total | 2016 | 2017 | 2018 | 2019 | 2020 | Thereafter | |||||||||||||||||||||
(in thousands) | |||||||||||||||||||||||||||
Long-term debt | $ | 1,768,393 | $ | — | $ | — | $ | 55,000 | $ | 250,000 | $ | — | $ | 1,463,393 | |||||||||||||
Capital leases | 27,720 | 1,395 | 1,979 | 2,133 | 2,298 | 2,476 | 17,439 | ||||||||||||||||||||
Short-term borrowings | 161,913 | 161,913 | — | — | — | — | — | ||||||||||||||||||||
Estimated pension and other postretirement obligations (1) | 67,086 | 12,917 | 13,661 | 13,554 | 13,489 | 13,465 | N/A | ||||||||||||||||||||
Qualifying facilities liability (2) | 937,136 | 54,472 | 74,684 | 76,782 | 78,918 | 81,068 | 571,212 | ||||||||||||||||||||
Supply and capacity contracts (3) | 1,817,386 | 163,362 | 195,255 | 149,732 | 145,942 | 111,562 | 1,051,533 | ||||||||||||||||||||
Contractual interest payments on debt (4) | 1,429,807 | 63,297 | 84,396 | 82,622 | 71,820 | 63,895 | 1,063,777 | ||||||||||||||||||||
Environmental remediation obligations (1) | 6,825 | 1,225 | 1,650 | 1,650 | 1,500 | 800 | N/A | ||||||||||||||||||||
Total Commitments (5) | $ | 6,216,266 | $ | 458,581 | $ | 371,625 | $ | 381,473 | $ | 563,967 | $ | 273,266 | $ | 4,167,354 | |||||||||||||
_________________________
(1) | We estimate cash obligations related to our pension and other postretirement benefit programs and environmental remediation obligations for five years, as it is not practicable to estimate thereafter. Pension and postretirement benefit estimates reflect our expected cash contributions, which may be in excess of minimum funding requirements. |
(2) | Certain QFs require us to purchase minimum amounts of energy at prices ranging from $74 to $136 per MWH through 2029. Our estimated gross contractual obligation related to these QFs is approximately $0.9 billion. A portion of the costs incurred to purchase this energy is recoverable through rates authorized by the MPSC, totaling approximately $0.7 billion. |
(3) | We have entered into various purchase commitments, largely purchased power, coal and natural gas supply and natural gas transportation contracts. These commitments range from one to 26 years. |
(4) | For our variable rate short-term borrowings outstanding, we have assumed an average interest rate of 0.82% through maturity. |
(5) | Potential tax payments related to uncertain tax positions are not practicable to estimate and have been excluded from this table. |
42
CRITICAL ACCOUNTING POLICIES AND ESTIMATES | ||||
Management’s discussion and analysis of financial condition and results of operations is based on our Financial Statements, which have been prepared in accordance with GAAP. The preparation of these Financial Statements requires us to make estimates and assumptions that affect the reported amounts of assets, liabilities, revenues and expenses, and related disclosure of contingent assets and liabilities. We base our estimates on historical experience and other assumptions that are believed to be proper and reasonable under the circumstances.
As of March 31, 2016, there have been no significant changes with regard to the critical accounting policies disclosed in Management’s Discussion and Analysis of Financial Condition and Results of Operations in our Annual Report on Form 10-K for the year ended December 31, 2015. The policies disclosed included the accounting for the following: goodwill and long-lived assets, qualifying facilities liability, revenue recognition, regulatory assets and liabilities, pension and postretirement benefit plans, and income taxes. We continually evaluate the appropriateness of our estimates and assumptions. Actual results could differ from those estimates.
43
ITEM 3. | QUANTITATIVE AND QUALITATIVE DISCLOSURES ABOUT MARKET RISK |
We are exposed to market risks, including, but not limited to, interest rates, energy commodity price volatility, and credit exposure. Management has established comprehensive risk management policies and procedures to manage these market risks.
Interest Rate Risk
Interest rate risks include exposure to adverse interest rate movements for outstanding variable rate debt and for future anticipated financings. We manage our interest rate risk by issuing primarily fixed-rate long-term debt with varying maturities, refinancing certain debt and, at times, hedging the interest rate on anticipated borrowings. All of our debt has fixed interest rates, with the exception of our revolving credit facility. The revolving credit facility bears interest at the lower of prime or available rates tied to the Eurodollar rate plus a credit spread, ranging from 0.88% to 1.75%. To more cost effectively meet short-term cash requirements, we issue commercial paper supported by our revolving credit facility. Since commercial paper terms are short-term, we are subject to interest rate risk. As of March 31, 2016, we had approximately $161.9 million of commercial paper outstanding and no borrowings on our revolving credit facility. A 1% increase in interest rates would increase our annual interest expense by approximately $1.6 million.
Commodity Price Risk
We are exposed to commodity price risk due to our reliance on market purchases to fulfill a portion of our electric and natural gas supply requirements within the Montana market. We also participate in the wholesale electric market to balance our supply of power from our own generating resources. Several factors influence price levels and volatility. These factors include, but are not limited to, seasonal changes in demand, weather conditions, available generating assets within regions, transportation availability and reliability within and between regions, fuel availability, market liquidity, and the nature and extent of current and potential federal and state regulations.
As part of our overall strategy for fulfilling our electric and natural gas supply requirements, we employ the use of market purchases and sales, including forward contracts. These types of contracts are included in our supply portfolios and in some instances, are used to manage price volatility risk by taking advantage of seasonal fluctuations in market prices. These contracts are part of an overall portfolio approach intended to provide price stability for consumers. As a regulated utility, our exposure to market risk caused by changes in commodity prices is substantially mitigated because these commodity costs are included in our cost tracking mechanisms and are recoverable from customers subject to prudence reviews by applicable state regulatory commissions.
Counterparty Credit Risk
We are exposed to counterparty credit risk related to the ability of these counterparties to meet their contractual payment obligations, and the potential non-performance of counterparties to deliver contracted commodities or services at the contracted price. We are also exposed to counterparty credit risk related to providing transmission service to our customers under our Open Access Transmission Tariff and under gas transportation agreements. We have risk management policies in place to limit our transactions to high quality counterparties. We monitor closely the status of our counterparties and take action, as appropriate, to further manage this risk. This includes, but is not limited to, requiring letters of credit or prepayment terms. There can be no assurance, however, that the management tools we employ will eliminate the risk of loss.
44
ITEM 4. | CONTROLS AND PROCEDURES |
Evaluation of Disclosure Controls and Procedures
We have established disclosure controls and procedures designed to ensure that information required to be disclosed in the reports we file or submit under the Securities Exchange Act of 1934 is recorded, processed, summarized and reported, within the time periods specified in the SEC’s rules and forms, and accumulated and communicated to management, including the principal executive officer and principal financial officer to allow timely decisions regarding required disclosure.
We conducted an evaluation, under the supervision and with the participation of our principal executive officer and principal financial officer of our disclosure controls and procedures (as defined in Rules 13a-15(e) and 15d-15(e) under the Securities Exchange Act of 1934). Based on this evaluation, our principal executive officer and principal financial officer have concluded that, as of the end of the period covered by this report, our disclosure controls and procedures are effective.
Changes in Internal Control Over Financial Reporting
There have been no changes in our internal control over financial reporting during the most recent fiscal quarter that have materially affected, or are reasonably likely to materially affect, our internal control over financial reporting.
45
PART II. OTHER INFORMATION
ITEM 1. | LEGAL PROCEEDINGS |
See Note 12, Commitments and Contingencies, to the Financial Statements for information regarding legal proceedings.
ITEM 1A. RISK FACTORS
You should carefully consider the risk factors described below, as well as all other information available to you, before making an investment in our common stock or other securities.
We are subject to potential state and federal unfavorable regulatory outcomes, including to the extent our incurred supply costs are deemed imprudent by the applicable regulatory commissions or certain regulatory mechanisms are not available, we may not recover some of our costs, which could adversely impact our results of operations and liquidity.
Our profitability is dependent on our ability to recover the costs of providing energy and utility services to our customers and earn a return on our capital investment in our utility operations. We provide service at rates established by several regulatory commissions. These rates are generally set based on an analysis of our costs incurred in a historical test year. In addition, each regulatory commission sets rates based in part upon their acceptance of an allocated share of total utility costs. When commissions adopt different methods to calculate inter-jurisdictional cost allocations, some costs may not be recovered. Thus, the rates we are allowed to charge may or may not match our costs at any given time. While rate regulation is premised on providing a reasonable opportunity to earn a reasonable rate of return on invested capital, there can be no assurance that the applicable regulatory commission will judge all of our costs to have been prudently incurred or that the regulatory process in which rates are determined will always result in rates that will produce full recovery of such costs.
In addition to general rate cases, our cost tracking mechanisms are a significant component of how we recover our costs. Our wholesale costs for electricity and natural gas supply are recovered through various pass-through cost tracking mechanisms in each of the states we serve. The rates are established based upon projected market prices or contractual obligations. As these variables change, we adjust our rates through our monthly trackers, which are subject to approval by the applicable regulatory commissions. To the extent our energy supply costs are deemed imprudent by the applicable state regulatory commissions, we do not recover some of our costs, which could adversely impact our results of operations.
We have received several unfavorable regulatory rulings in Montana, including:
•In March 2016, the MPSC disallowed approximately $8.2 million of replacement power costs from an outage at Colstrip Unit 4, and approximately $2.1 million of costs related to generation portfolio modeling previously recovered through our electric tracker filings.
•In October 2015, the MPSC issued an order eliminating the lost revenue adjustment mechanism. This mechanism was established in 2005 by the MPSC as a component of an approved energy efficiency program, by which we recovered on an after-the-fact basis a portion of our fixed costs that would otherwise have been collected in the kWh sales lost due to energy efficiency programs through our supply tracker. Lost revenues were removed prospectively effective December 1, 2015.
•In October 2013, the MPSC concluded that $1.4 million of incremental costs associated with regulation service acquired from third parties during a 2012 outage at DGGS were imprudently incurred, and disallowed recovery.
With regard to the lost revenue mechanism decision, our last approved supply tracker included approximately $7.1 million of lost revenue recovery based on an approved independent study of the annual impact of efficiency efforts. Consistent with this approval, for the period July 1, 2012 through November 30, 2015, we recognized $7.1 million of DSM lost revenues for each annual electric supply tracker period and deferred the remaining portion of efficiency efforts in excess of these amounts. As the 2012/2013 and 2013/2014 annual electric tracker filings are still subject to final approval, the MPSC may ultimately require us to refund more than we have deferred or approve recovery of more DSM lost revenues than we have recognized since July 2012.
We appealed the October 2013 decision regarding DGGS outage costs to the Montana District Court, which, in August 2015, upheld the MPSC’s decision. In October 2015, we appealed the District Court’s decision to the Montana Supreme Court. We filed our opening brief in March 2016.
46
In addition, the MPSC Order approving the purchase of hydro assets in Montana provided that customers would have no financial risk related to our temporary ownership of the Kerr facility, with a compliance filing required upon completion of the transfer to CSKT. We sold any excess system generation, which was primarily due to our temporary ownership of Kerr, in the market and provided revenue credits to our Montana retail customers until the transfer to the CSKT of the Flathead Reservation. The cost of our temporary ownership was not included in rate base, and the benefits were provided to customers. In December 2015, we submitted the required hydro compliance filing to remove Kerr from cost of service, adjust for actual revenue credits and increase property taxes to actual amounts.
In addition, in our regulatory filings related to DGGS, we proposed an allocation of approximately 80% of costs to retail customers subject to the MPSC's jurisdiction and approximately 20% allocated to wholesale customers subject to FERC's jurisdiction. In March 2012, the MPSC's final order approved using our proposed cost allocation methodology, but requires us to complete a study of the relative contribution of retail and wholesale customers to regulation capacity needs. The results of this study may be used in determining future cost allocations between retail and wholesale customers. However, there is no assurance that both the MPSC and FERC will agree on the results of this study, which could result in an inability to fully recover our costs.
In April 2014, the FERC issued an order affirming a FERC Administrative Law Judge's (ALJ) initial decision in September 2012, regarding cost allocation at DGGS between retail and wholesale customers. This decision concluded that only a portion of these costs should be allocated to FERC jurisdictional customers. We filed a request for rehearing, which remains pending. The FERC order was assessed as a triggering event as to whether an impairment charge should be recorded with respect to DGGS. We are evaluating options to use DGGS in combination with other generation resources, including our hydro facilities, to minimize portfolio costs, which may facilitate cost recovery. The cost recovery of any alternative use of DGGS would be subject to regulatory approval and we cannot provide assurance of such approval. If we are not able to obtain cost recovery of DGGS we may be required to record an impairment charge, which could have a material adverse effect on our operating results.
During the second quarter of 2015, we reached a settlement agreement with an insurance carrier for the former Montana Power Company for what were primarily generation related environmental remediation costs. As a result of this settlement, we recognized a net recovery of approximately $20.8 million, which is reflected as a reduction to operating expenses in our other segment. The environmental remediation costs were never reflected in customer rates and the litigation expenses have not been treated as utility expenses. In a 2002 order approving NorthWestern’s acquisition of the transmission and distribution assets of the Montana Power Company, the MPSC approved a stipulation in which NorthWestern agreed to release its customers from all environmental liabilities associated with the Montana Power Company’s generation assets. While we believe the recovery we recognized as a reduction to operating expenses is not subject to refund to customers, the MPSC could disagree with us and could ultimately require us to refund all or a portion of the net recovery to customers, which could have a material adverse effect on our operating results.
Our ability to invest in additional generation is impacted by regulatory and public policy. Under the Public Utility Regulatory Policies Act of 1978 (PURPA), electric utilities are required, with exceptions, to purchase energy and capacity from independent power producers that are qualifying co-generation facilities and qualifying small power production facilities (QFs). Our requirements to procure power from these sources could impact our ability to make generation investments depending upon the number and size of QF contracts we ultimately enter into. In addition, the cost to procure power from these QFs may not be a cost effective resource for customers, or the type of generation resource needed, resulting in increased supply costs.
We are subject to many FERC rules and orders that regulate our electric and natural gas business and are subject to periodic audits. In March 2015, FERC began conducting an audit of our open access transmission tariffs and operations in Montana and South Dakota. These audits typically take up to 24 months to complete.
We must also comply with established reliability standards and requirements, which apply to North American Electric Reliability Corporation (NERC) functions in both the Midwest Reliability Organization for our South Dakota operations and Western Electric Coordination Council for our Montana operations. The FERC, NERC, or a regional reliability organization may assess penalties against any responsible entity that violates their rules, regulations or standards. Violations may be discovered through various means, including self-certification, self-reporting, compliance investigations, audits, periodic data submissions, exception reporting, and complaints. Penalties for the most severe violations can reach as high as $1 million per violation, per day. If a serious reliability incident or other incidence of noncompliance did occur, it could have a material adverse effect on our operating and financial results.
47
We are also subject to changing federal and state laws. Congress and state legislatures may enact legislation that adversely affects our operations and financial results.
We are subject to existing, and potential future, federal and state legislation. In the planning and management of our operations, we must address the effects of legislation within a regulatory framework. Federal and state laws can significantly impact our operations, whether it is new or revised statutes directly affecting the electric and gas industry, or other issues such as taxes. In addition, new or revised statutes can also materially affect our operations through impacting existing regulations or requiring new regulations. These changes are ongoing, and we cannot predict the future course of changes or the ultimate effect that this changing environment will have on us. Changes in laws, and the resulting regulations and tariffs and how they are implemented and interpreted, may have a material adverse effect on our businesses, financial condition, results of operations and cash flows.
We are subject to extensive and changing laws and regulations that affect our industry and our operations, including environmental laws and regulations and potential environmental liabilities, which could have a material adverse effect on our liquidity and results of operations.
We are subject to extensive laws and regulations imposed by federal, state, and local government authorities in the ordinary course of operations with regard to the environment, including environmental laws and regulations relating to air and water quality, protection of natural resources, migratory birds and other wildlife, solid waste disposal, coal ash and other environmental considerations. We believe that we are in compliance with environmental regulatory requirements; however, possible future developments, such as more stringent environmental laws and regulations, and the timing of future enforcement proceedings that may be taken by environmental authorities, could affect our costs and the manner in which we conduct our business and could require us to make substantial additional capital expenditures or abandon certain projects.
National and international actions have been initiated to address global climate change and the contribution of greenhouse gas (GHG) emissions including, most significantly, carbon dioxide. In August 2015, the EPA released final standards of performance to limit GHG emissions from new, modified and reconstructed fossil fuel generating units and from newly constructed and reconstructed natural gas combined cycle units. In a separate action that also affects power plants, in August 2015, the EPA released its final rule establishing GHG performance standards for existing power plants under Clean Air Act Section 111(d). EPA refers to this rule as the Clean Power Plan or CPP.
The CPP reduction of 47 percent in carbon dioxide emissions in Montana by 2030 is the greatest reduction target among the lower 48 states, according to a nationwide analysis. Our Montana generation portfolio emits less carbon on average than the EPA's 2030 target due to investments we made prior to 2013 in carbon-free generation resources. However, the CPP's target reduction is applied on a statewide basis, and investments made prior to 2012 are not counted in the CPP's 2030 target. The State of Montana is required by the CPP to submit a satisfactory state plan to EPA by no later than September 2018. The state plan will determine whether we will have to meet rate-based or mass-based requirements and, if the state adopts a mass-based plan, the number and vintages of allowances that will be allocated to Colstrip. Until the plan is submitted, or a federal plan is imposed, we cannot predict the impact of the CPP on us. We asked the University of Montana’s Bureau of Business and Economic Research (BBER) to study the potential impacts of the CPP across Montana. The BBER study looked at the implications of closing the Colstrip generating facilities in southeast Montana as a scenario for complying with the federal rule. The study's conclusions describe the likely loss of jobs and population, the decline in the local and state tax base, the impact on businesses statewide, and the closure's impact on electric reliability and affordability. The electricity produced at Unit 4 represents approximately 25 percent of our customer needs. Closing Colstrip would lead to higher utility rates in order to replace the base-load generation that currently is provided by Colstrip. Closing Colstrip would also create significant issues with the transmission grid that serves Montana, and we would lose transmission revenues that are credited to lower electric customer bills.
On October 23, 2015, the same date the CPP was published in the Federal Register, we along with other utilities, trade groups, coal producers, labor and business organizations, filed Petitions for Review of the CPP with the United States Court of Appeals for the District of Columbia Circuit. Accompanying these Petitions for Review were Motions to Stay the implementation of the CPP. On January 21, 2016, the U.S. Court of Appeals for the District of Columbia denied the requests for stay but ordered expedited briefing on the merits, with oral argument scheduled for June 2, 2016. On January 26, 2016, 29 states and state agencies asked the U.S. Supreme Court to issue an immediate stay of the CPP. On January 27, 2016, 60 utilities and allied petitioners also requested the U.S. Supreme Court to immediately stay the CPP, and we were among the utilities seeking a stay. On February 9, 2016, the U.S. Supreme Court entered an order staying the Clean Power Plan. The stay of the CPP will remain in place until the U.S. Supreme Court either denies a petition for certiorari following the U.S. Court of Appeals’ decision on the substantive challenges to the CPP, if one is submitted, or until the U.S. Supreme Court enters judgment following grant of a petition for certiorari. The effect is to delay the CPP’s deadlines until challenges to the CPP have
48
been fully litigated and the U.S. Supreme Court has ruled. We do not expect a final judicial decision on challenges to the CPP until mid-2017 at the earliest, and, more likely, early 2018.
On December 22, 2015 we also filed an administrative Petition for Reconsideration with the EPA, requesting it reconsider the CPP, on the grounds that the CO2 reductions in the CPP were substantially greater in Montana than in the proposed rule. We also requested EPA stay the CPP while it considered our Petition for Reconsideration. At this time no action has been taken on the Petition for Reconsideration or stay request.
Requirements to reduce GHG emissions could cause us to incur material costs of compliance and increase our costs of procuring electricity. Although there continues to be changes in legislation and regulations that affect GHG emissions from power plants, technology to efficiently capture, remove and/or sequester such emissions may not be available within a timeframe consistent with the implementation of such requirements. We cannot predict with any certainty the impact of these risks on our results of operations.
We are evaluating the implications of these rules and technology available to achieve the CO2 emission performance standards. We will continue working with federal and state regulatory authorities, other utilities, and stakeholders to seek relief from the final rules that, in our view, disproportionately impact customers in our region, and to seek relief from the final compliance requirements. We cannot predict the ultimate outcome of these matters nor what our obligations might be under the state compliance plans with any degree of certainty until they are finalized; however, complying with the carbon emission standards, and with other future environmental rules, may make it economically impractical to continue operating all or a portion of our jointly owned facilities or for individual owners to participate in their proportionate ownership of the coal-fired generating units. This could lead to significant impacts to customer rates for recovery of plant improvements and / or closure related costs and costs to procure replacement power. In addition, these changes could impact system reliability due to changes in generation sources.
Many of these environmental laws and regulations provide for substantial civil and criminal fines for noncompliance which, if imposed, could result in material costs or liabilities. In addition, there is a risk of environmental damages claims from private parties or government entities. We may be required to make significant expenditures in connection with the investigation and remediation of alleged or actual spills, personal injury or property damage claims, and the repair, upgrade or expansion of our facilities to meet future requirements and obligations under environmental laws.
To the extent that costs exceed our estimated environmental liabilities, or we are not successful in recovering remediation costs or costs to comply with the proposed or any future changes in rules or regulations, our results of operations and financial position could be adversely affected.
Our revenues, results of operations and financial condition are impacted by customer growth and usage in our service territories and may fluctuate with current economic conditions or response to price increases. We are also impacted by market conditions outside of our service territories related to demand for transmission capacity and wholesale electric pricing.
Our revenues, results of operations and financial condition are impacted by customer growth and usage, which can be impacted by a number of factors, including the voluntary reduction of consumption of electricity and natural gas by our customers in response to increases in prices and demand-side management programs, economic conditions impacting decreases in their disposable income, the use of distributed generation resources or other emerging technologies for electricity. Advances in distributed generation technologies that produce power, including fuel cells, micro-turbines, wind turbines and solar cells, may reduce the cost of alternative methods of producing power to a level competitive with central power station electric production. Customer-owned generation itself reduces the amount of electricity purchased from utilities and has the effect of increasing rates unless retail rates are designed to share the costs of the distribution grid across all customers that benefit from their use. Such developments could affect the price of energy, could affect energy deliveries as customer-owned generation becomes more cost-effective, could require further improvements to our distribution systems to address changing load demands and could make portions of our electric system power supply and transmission and/or distribution facilities obsolete prior to the end of their useful lives. Such technologies could also result in further declines in commodity prices or demand for delivered energy.
Both decreasing use per customer driven by appliance and lighting efficiency and the availability of cost-effective distributed generation puts downward pressure on load growth. Our electricity supply resource procurement plan includes an expected load growth assumption of 0.8 percent annually, which reflects low customer and usage increases, offset in part by these efficiency measures. Reductions in usage, attributable to various factors could materially affect our results of operations, financial position, and cash flows through, among other things, reduced operating revenues, increased operating and
49
maintenance expenses, and increased capital expenditures, as well as potential asset impairment charges or accelerated depreciation and decommissioning expenses over shortened remaining asset useful lives.
Demand for our Montana transmission capacity fluctuates with regional demand, fuel prices and weather related conditions. The levels of wholesale sales depend on the wholesale market price, transmission availability and the availability of generation, among other factors. Declines in wholesale market price, availability of generation, transmission constraints in the wholesale markets, or low wholesale demand could reduce wholesale sales. These events could adversely affect our results of operations, financial position and cash flows.
Weather and weather patterns, including normal seasonal and quarterly fluctuations of weather, as well as extreme weather events that might be associated with climate change, could adversely affect our results of operations and liquidity.
Our electric and natural gas utility business is seasonal, and weather patterns can have a material impact on our financial performance. Demand for electricity and natural gas is often greater in the summer and winter months associated with cooling and heating. Because natural gas is heavily used for residential and commercial heating, the demand for this product depends heavily upon weather patterns throughout our market areas, and a significant amount of natural gas revenues are recognized in the first and fourth quarters related to the heating season. Accordingly, our operations have historically generated less revenue and income when weather conditions are milder in the winter and cooler in the summer. In the event that we experience unusually mild winters or cool summers in the future, our results of operations and financial position could be adversely affected. Higher temperatures may also decrease the Montana snowpack, which may result in dry conditions and an increased threat of forest fires. Forest fires could threaten our communities and electric transmission lines and facilities. Any damage caused as a result of forest fires could negatively impact our financial condition, results of operations or cash flows. In addition, exceptionally hot summer weather or unusually cold winter weather could add significantly to working capital needs to fund higher than normal supply purchases to meet customer demand for electricity and natural gas. Our sensitivity to weather volatility is significant due to the absence of regulatory mechanisms, such as those authorizing revenue decoupling, lost margin recovery, and other innovative rate designs. There is also a concern that the physical risks of climate change could include changes in weather conditions, such as changes in the amount or type of precipitation and extreme weather events.
Climate change and the costs that may be associated with its impacts have the potential to affect our business in many ways, including increasing the cost incurred in providing electricity and natural gas, impacting the demand for and consumption of electricity and natural gas (due to change in both costs and weather patterns), and affecting the economic health of the regions in which we operate. Extreme weather conditions creating high energy demand on our own and/or other systems may raise market prices as we buy short-term energy to serve our own system. Severe weather impacts our service territories, primarily through thunderstorms, tornadoes and snow or ice storms. To the extent the frequency of extreme weather events increase, this could increase our cost of providing service. We derive a significant portion of our power supply from hydroelectric facilities. Because of our heavy reliance on hydroelectric generation, snowpack, the timing of run-off, drought conditions, and the availability of water can significantly affect operations. In addition, extreme weather may exacerbate the risks to physical infrastructure. We may not recover all costs related to mitigating these physical and financial risks.
Cyber and physical attacks, threats of terrorism and catastrophic events that could result from terrorism, or individuals and/or groups attempting to disrupt our business, or the businesses of third parties, may affect our operations in unpredictable ways and could adversely affect our liquidity and results of operations.
We are subject to the potentially adverse operating and financial effects of terrorist acts and threats, as well as cyber (such as hacking and viruses) and physical security breaches and other disruptive activities of individuals or groups. Our generation, transmission and distribution facilities are deemed critical infrastructure and provide the framework for our service infrastructure. These assets and the information technology systems on which they depend could be direct targets of, or indirectly affected by, cyber attacks and other disruptive activities, including cyber attacks and other disruptive activities on third party facilities that are interconnected to us through the regional transmission grid or natural gas pipeline infrastructure. Any significant interruption of these assets or systems could prevent us from fulfilling our critical business functions including delivering energy to our customers, and sensitive, confidential and other data could be compromised.
We rely on information technology networks and systems to operate our critical infrastructure, engage in asset management activities, and process, transmit and store electronic information including customer and employee information. Further, our infrastructure, networks and systems are interconnected to external networks and neighboring critical infrastructure systems. Security breaches could lead to system disruptions, generating facility shutdowns or unauthorized disclosure of confidential information. In particular, any data loss or information security lapses resulting in the compromise of personal
50
information or the improper use or disclosure of sensitive or classified information could result in claims, remediation costs, regulatory sanctions, loss of current and future contracts, and serious harm to our reputation.
Security threats continue to evolve and adapt. Cyber or physical attacks, terrorist acts, or disruptive activities could harm our business by limiting our ability to generate, purchase or transmit power and by delaying the development and construction of new generating facilities and capital improvements to existing facilities. These events, and governmental actions in response, could result in a material decrease in revenues and significant additional costs to repair and insure assets, and could adversely affect our operations by contributing to the disruption of supplies and markets for natural gas, oil and other fuels. These events could also impair our ability to raise capital by contributing to financial instability and reduced economic activity.
Our plans for future expansion through the acquisition of assets including natural gas reserves, capital improvements to current assets, generation investments, and transmission grid expansion involve substantial risks.
Acquisitions include a number of risks, including but not limited to, additional costs, the assumption of material liabilities, the diversion of management’s attention from daily operations to the integration of the acquisition, difficulties in assimilation and retention of employees, securing adequate capital to support the transaction, and regulatory approval. Uncertainties exist in assessing the value, risks, profitability, and liabilities associated with certain businesses or assets and there is a possibility that anticipated operating and financial synergies expected to result from an acquisition do not develop. The failure to successfully integrate future acquisitions that we may choose to undertake could have an adverse effect on our financial condition and results of operations.
Our business strategy also includes significant investment in capital improvements and additions to modernize existing infrastructure, generation investments and transmission capacity expansion. The completion of generation and natural gas investments and transmission projects are subject to many construction and development risks, including, but not limited to, risks related to permitting, financing, regulatory recovery, escalating costs of materials and labor, meeting construction budgets and schedules, and environmental compliance. In addition, these capital projects may require a significant amount of capital expenditures. We cannot provide certainty that adequate external financing will be available to support such projects. Additionally, borrowings incurred to finance construction may adversely impact our leverage, which could increase our cost of capital.
Our electric and natural gas operations involve numerous activities that may result in accidents and other operating risks and costs.
Inherent in our electric and natural gas operations are a variety of hazards and operating risks, such as fires, electric contacts, leaks, explosions and mechanical problems. These risks could cause a loss of human life, significant damage to property, loss of customer load, environmental pollution, impairment of our operations, and substantial financial losses to us and others. In accordance with customary industry practice, we maintain insurance against some, but not all, of these risks and losses. The occurrence of any of these events not fully covered by insurance could have a material adverse effect on our financial position and results of operations. For our natural gas transmission and distribution lines located near populated areas, including residential areas, commercial business centers, industrial sites and other public gathering areas, the level of damages resulting from these risks potentially is greater.
Our owned and jointly owned electric generating facilities are subject to operational risks that could result in unscheduled plant outages, unanticipated operation and maintenance expenses and increased power purchase costs.
Operation of electric generating facilities involves risks, which can adversely affect energy output and efficiency levels. Operational risks include facility shutdowns due to breakdown or failure of equipment or processes, labor disputes, operator error, catastrophic events such as fires, explosions, floods, and intentional acts of destruction or other similar occurrences affecting the electric generating facilities; and operational changes necessitated by environmental legislation, litigation or regulation. The loss of a major electric generating facility would require us to find other sources of supply or ancillary services, if available, and expose us to higher purchased power costs.
In early July 2013, following the return to service from a scheduled maintenance outage, Colstrip Unit 4 tripped off-line and incurred damage to its stator and rotor. Colstrip Unit 4 returned to service in early 2014. As discussed above, we were not able to fully recover our costs for the purchase of replacement power while Colstrip Unit 4 was out of service.
We also rely on a limited number of suppliers of coal for our electric generation, making us vulnerable to increased prices for fuel as existing contracts expire or in the event of unanticipated interruptions in fuel supply. We are a captive rail shipper of
51
the Burlington Northern Santa Fe Railway for shipments of coal to the Big Stone Plant (our largest source of generation in South Dakota), making us vulnerable to railroad capacity and operational issues and/or increased prices for coal transportation from a sole supplier.
Poor investment performance of plan assets of our defined benefit pension and post-retirement benefit plans, in addition to other factors impacting these costs, could unfavorably impact our results of operations and liquidity.
Our costs for providing defined benefit retirement and postretirement benefit plans are dependent upon a number of factors. Assumptions related to future costs, return on investments and interest rates have a significant impact on our funding requirements related to these plans. These estimates and assumptions may change based on economic conditions, actual stock market performance and changes in governmental regulations. Without sustained growth in the plan assets over time and depending upon interest rate changes as well as other factors noted above, the costs of such plans reflected in our results of operations and financial position and cash funding obligations may change significantly from projections.
Our obligation to include a minimum annual quantity of power in our Montana electric supply portfolio at an agreed upon price per MWH could expose us to material commodity price risk if certain QFs under contract with us do not perform during a time of high commodity prices, as we are required to make up the difference. In addition, we are subject to price escalation risk with one of our largest QF contracts.
As part of a stipulation in 2002 with the MPSC and other parties, we agreed to include a minimum annual quantity of power in our Montana electric supply portfolio at an agreed upon price per MWH through June 2029. The annual minimum energy requirement is achievable under normal QF operations, including normal periods of planned and forced outages. However, to the extent the supplied QF power for any year does not reach the minimum quantity set forth in the settlement, we are obligated to purchase the difference from other sources. The anticipated source for any QF shortfall is the wholesale market, which would subject us to commodity price risk if the cost of replacement power is higher than contracted QF rates.
In addition, we are subject to price escalation risk with one of our largest QF contracts due to variable contract terms. In estimating our QF liability, we have estimated an annual escalation rate of three percent over the remaining term of the contract (through June 2024). To the extent the annual escalation rate exceeds three percent, our results of operations, cash flows and financial position could be adversely affected.
We must meet certain credit quality standards. If we are unable to maintain investment grade credit ratings, our liquidity, access to capital and operations could be materially adversely affected.
A downgrade of our credit ratings to less than investment grade could adversely affect our liquidity. Certain of our credit agreements and other credit arrangements with counterparties require us to provide collateral in the form of letters of credit or cash to support our obligations if we fall below investment grade. Also, a downgrade below investment grade could hinder our ability to raise capital on favorable terms, including through the commercial paper markets. Higher interest rates on short-term borrowings with variable interest rates or on incremental commercial paper issuances could also have an adverse effect on our results of operations.
ITEM 6. EXHIBITS
(a) Exhibits
Exhibit 10.1—NorthWestern Energy 2016 Annual Incentive Plan (incorporated by reference to Exhibit 99.1 of NorthWestern Corporation's Current Report on Form 8-K, dated February 16, 2016, Commission File No. 1-10499).
Exhibit 10.2—Form of NorthWestern Corporation Performance Unit Award Agreement (incorporated by reference to Exhibit 99.2 of NorthWestern Corporation's Current Report on Form 8-K, dated February 16, 2016, Commission File No. 1-10499).
Exhibit 31.1—Certification of chief executive officer.
Exhibit 31.2—Certification of chief financial officer.
Exhibit 32.1—Certification of chief executive officer pursuant to Section 906 of the Sarbanes-Oxley Act of 2002.
Exhibit 32.2—Certification of chief financial officer pursuant to Section 906 of the Sarbanes-Oxley Act of 2002.
52
Exhibit 101.INS—XBRL Instance Document
Exhibit 101.SCH—XBRL Taxonomy Extension Schema Document
Exhibit 101.CAL—XBRL Taxonomy Extension Calculation Linkbase Document
Exhibit 101.DEF—XBRL Taxonomy Extension Definition Linkbase Document
Exhibit 101.LAB—XBRL Taxonomy Label Linkbase Document
Exhibit 101.PRE—XBRL Taxonomy Extension Presentation Linkbase Document
53
SIGNATURES
Pursuant to the requirements of the Securities Exchange Act of 1934, the registrant has duly caused this report to be signed on its behalf by the undersigned thereunto duly authorized.
NorthWestern Corporation | |||
Date: | April 20, 2016 | By: | /s/ BRIAN B. BIRD |
Brian B. Bird | |||
Chief Financial Officer | |||
Duly Authorized Officer and Principal Financial Officer | |||
54
EXHIBIT INDEX | ||||
Exhibit Number | Description | |
10.1 | NorthWestern Energy 2016 Annual Incentive Plan (incorporated by reference to Exhibit 99.1 of NorthWestern Corporation's Current Report on Form 8-K, dated February 16, 2016, Commission File No. 1-10499). | |
10.2 | Form of NorthWestern Corporation Performance Unit Award Agreement (incorporated by reference to Exhibit 99.2 of NorthWestern Corporation's Current Report on Form 8-K, dated February 16, 2016, Commission File No. 1-10499). | |
*31.1 | Certification of chief executive officer. | |
*31.2 | Certification of chief financial officer. | |
*32.1 | Certification of chief executive officer pursuant to Section 906 of the Sarbanes-Oxley Act of 2002. | |
*32.2 | Certification of chief financial officer pursuant to Section 906 of the Sarbanes-Oxley Act of 2002. | |
*101.INS | XBRL Instance Document | |
*101.SCH | XBRL Taxonomy Extension Schema Document | |
*101.CAL | XBRL Taxonomy Extension Calculation Linkbase Document | |
*101.DEF | XBRL Taxonomy Extension Definition Linkbase Document | |
*101.LAB | XBRL Taxonomy Label Linkbase Document | |
*101.PRE | XBRL Taxonomy Extension Presentation Linkbase Document | |
_________________________
* | Filed herewith |
55