Attached files
| file | filename |
|---|---|
| 8-K - WEX INC. 8-K - WEX Inc. | a51328166.htm |
| EX-99.1 - EXHIBIT 99.1 - WEX Inc. | a51328166ex99_1.htm |
Exhibit 99.2

WEX INC. First Quarter 2016 Earnings Call April 27, 2016
2 The attached materials and our commentary relating to those materials contain statements about future plans and expectations, which constitute forward-looking statements within the meaning of the Private Securities Litigation Reform Act of 1995. Such forward looking statements are generally stated in terms of the Company’s plans, expectations and intentions. Any statements that are not statements of historical facts are forward-looking statements. The words “may," "could," "anticipate," "plan," "continue," "project," "intend," "estimate," "believe," "expect" and similar expressions are intended to identify forward-looking statements, although not all forward-looking statements contain such words. These forward-looking statements are subject to a number of risks and uncertainties that could cause actual results to differ materially, including: the effects of general economic conditions on fueling patterns as well as payment and transaction processing activity; the impact of foreign currency exchange rates on the Company’s operations, revenue and income; changes in interest rates; the impact of fluctuations in fuel prices; the effects of the Company’s business expansion and acquisition efforts; the Company’s failure to successfully integrate the businesses it has acquired or plans to acquire; the Company's failure to successfully operate and expand ExxonMobil's European commercial fuel card program, or Esso Card; the failure of corporate investments to result in anticipated strategic value; the impact and size of credit losses; the impact of changes to the Company's credit standards; breaches of the Company’s technology systems and any resulting negative impact on our reputation, liabilities or relationships with customers or merchants; the Company’s failure to maintain or renew key agreements; failure to expand the Company’s technological capabilities and service offerings as rapidly as the Company’s competitors; the actions of regulatory bodies, including banking and securities regulators, or possible changes in banking or financial regulations impacting the Company’s industrial bank, the Company as the corporate parent or other subsidiaries or affiliates; the impact of the Company’s outstanding notes on its operations; the impact of increased leverage on the Company's operations, results or capacity generally, and as a result of potential acquisitions specifically; financial loss if the Company determines it necessary to unwind its derivative instrument position prior to the expiration of a contract; the incurrence of impairment charges if our assessment of the fair value of certain of our reporting units changes; the uncertainties of litigation; as well as other risks and uncertainties identified in Item 1A of our Annual Report for the year ended December 31, 2015, filed on Form 10-K with the Securities and Exchange Commission on February 26, 2016. The Company's forward-looking statements do not reflect the potential future impact of any alliance, merger, acquisition, disposition or stock repurchases. The forward-looking statements speak only as of the date of this presentation and undue reliance should not be placed on these statements. The Company disclaims any obligation to update any forward-looking statements as a result of new information, future events or otherwise. Non-GAAP Information: For additional important information and disclosure regarding non-GAAP metrics, specifically adjusted net income (or “ANI”), total FX and PPG adjusted revenue, revenue adjusted for FX and ANI adjusted for FX and PPG, please see the appendix to this document and our most recent earnings release, issued on April 27, 2016, for an explanation and reconciliation of non-GAAP ANI to GAAP net income.
Performance Highlights 3 FINANCIAL SUMMARY STRATEGY PERFORMANCE OF FLEET SOLUTIONS PERFORMANCE OF HEALTH AND EMPLOYEE BENEFIT SOLUTIONS PERFORMANCE OF TRAVEL AND CORPORATE SOLUTIONS OUTLOOK
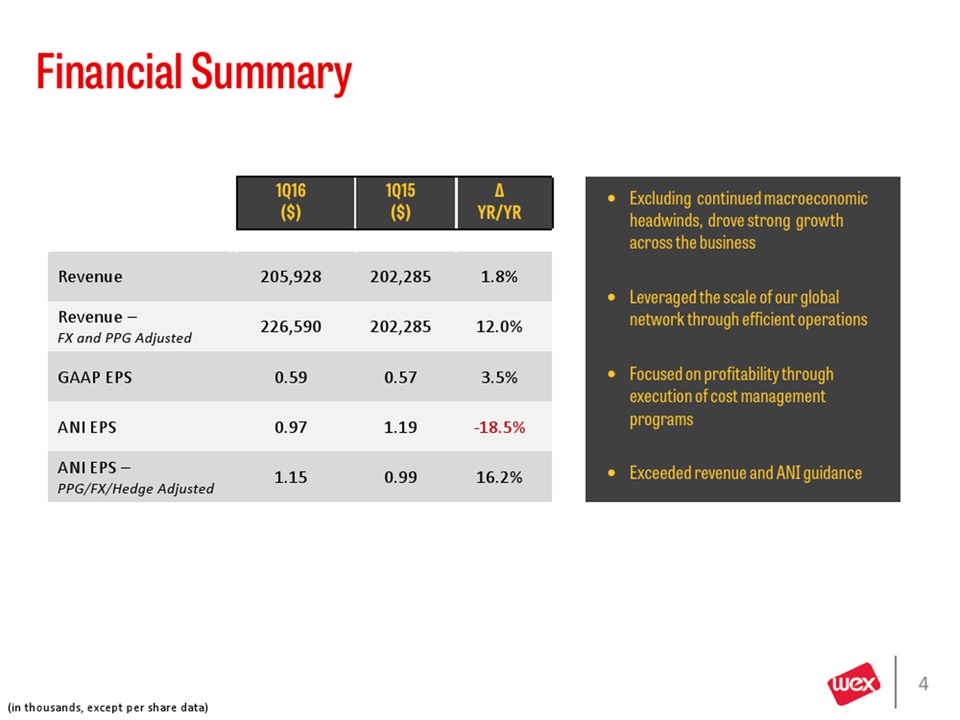
Financial Summary 4 Excluding continued macroeconomic headwinds, drove strong growth across the businessLeveraged the scale of our global network through efficient operationsFocused on profitability through execution of cost management programs Exceeded revenue and ANI guidance 1Q16($) 1Q15($) ∆ YR/YR Revenue 205,928 202,285 1.8% Revenue – FX and PPG Adjusted 226,590 202,285 12.0% GAAP EPS 0.59 0.57 3.5% ANI EPS 0.97 1.19 -18.5% ANI EPS – PPG/FX/Hedge Adjusted 1.15 0.99 16.2% (in thousands, except per share data)
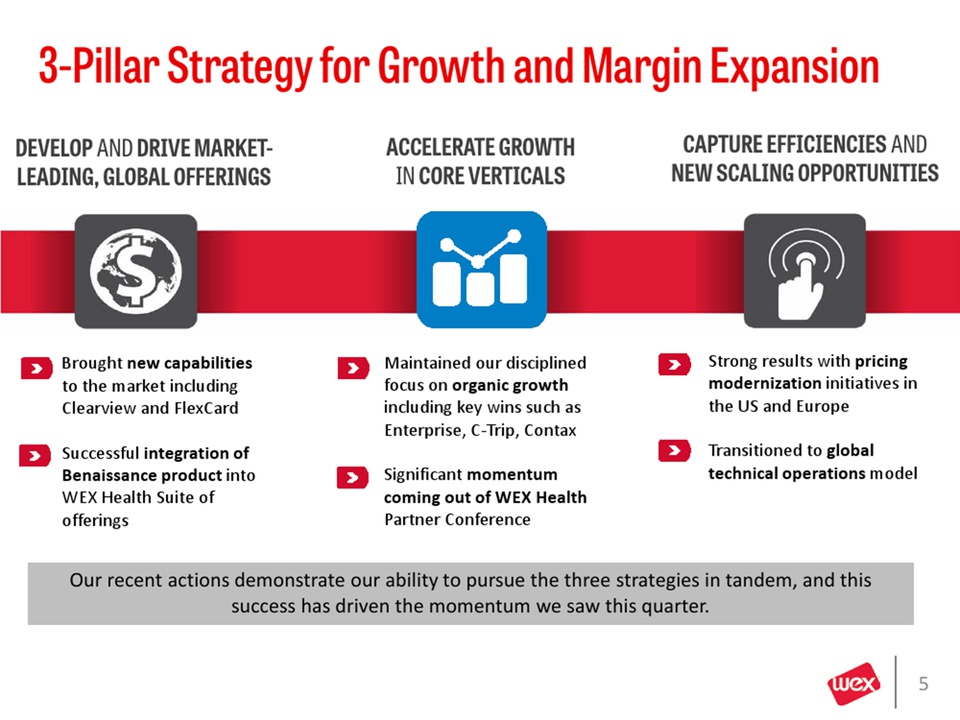
3-Pillar Strategy for Growth and Margin Expansion ACCELERATE GROWTHIN CORE VERTICALS CAPTURE EFFICIENCIES AND NEW SCALING OPPORTUNITIES DEVELOP AND DRIVE MARKET-LEADING, GLOBAL OFFERINGS Our recent actions demonstrate our ability to pursue the three strategies in tandem, and this success has driven the momentum we saw this quarter. Brought new capabilities to the market including Clearview and FlexCardSuccessful integration of Benaissance product into WEX Health Suite of offerings Maintained our disciplined focus on organic growth including key wins such as Enterprise, C-Trip, ContaxSignificant momentum coming out of WEX Health Partner Conference Strong results with pricing modernization initiatives in the US and EuropeTransitioned to global technical operations model 5
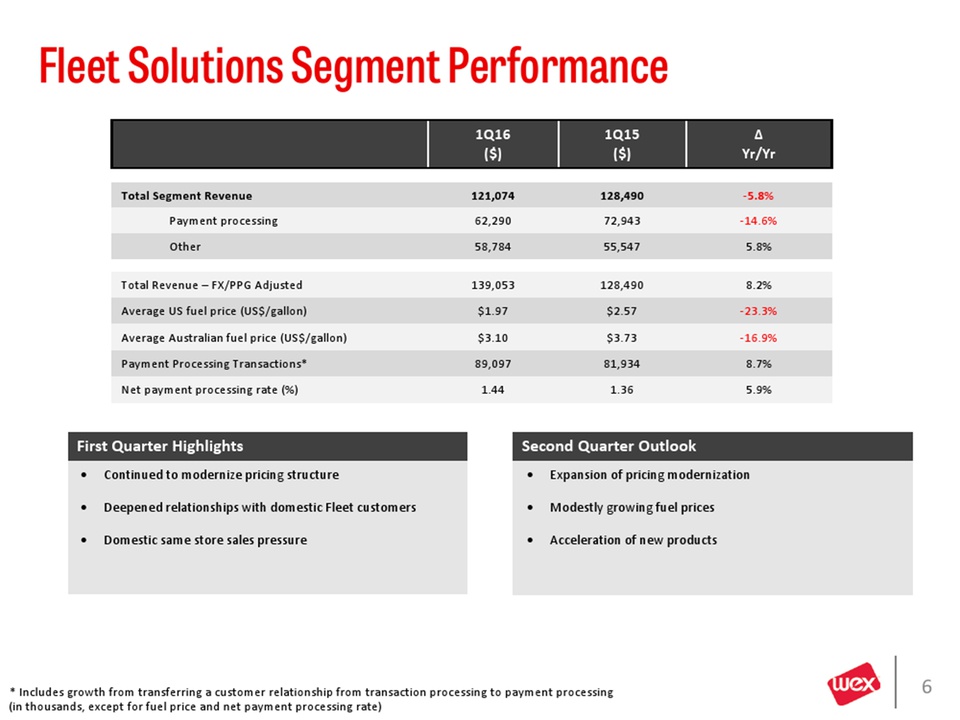
Fleet Solutions Segment Performance 6 Continued to modernize pricing structure Deepened relationships with domestic Fleet customers Domestic same store sales pressure First Quarter Highlights Second Quarter Outlook 1Q16($) 1Q15($) ∆ Yr/Yr Total Segment Revenue 121,074 128,490 -5.8% Payment processing 62,290 72,943 -14.6% Other 58,784 55,547 5.8% Total Revenue – FX/PPG Adjusted 139,053 128,490 8.2% Average US fuel price (US$/gallon) $1.97 $2.57 -23.3% Average Australian fuel price (US$/gallon) $3.10 $3.73 -16.9% Payment Processing Transactions* 89,097 81,934 8.7% Net payment processing rate (%) 1.44 1.36 5.9% Expansion of pricing modernization Modestly growing fuel prices Acceleration of new products (in thousands, except for fuel price and net payment processing rate) * Includes growth from transferring a customer relationship from transaction processing to payment processing
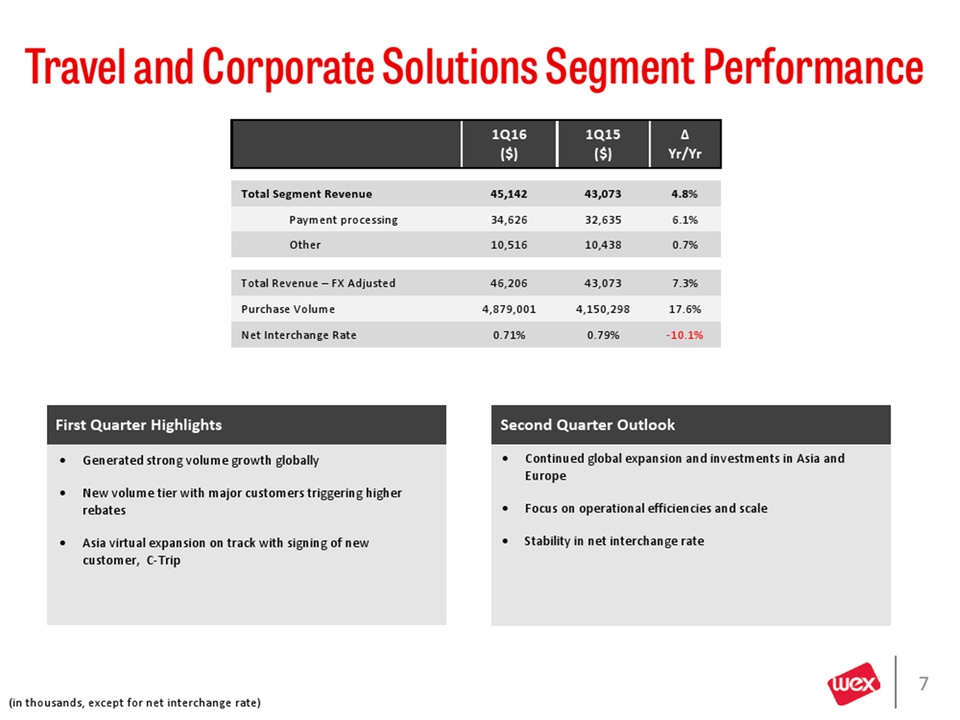
Travel and Corporate Solutions Segment Performance 7 (in thousands, except for net interchange rate) Generated strong volume growth globally New volume tier with major customers triggering higher rebates Asia virtual expansion on track with signing of new customer, C-Trip First Quarter Highlights Second Quarter Outlook 1Q16($) 1Q15($) ∆ Yr/Yr Total Segment Revenue 45,142 43,073 4.8% Payment processing 34,626 32,635 6.1% Other 10,516 10,438 0.7% Total Revenue – FX Adjusted 46,206 43,073 7.3% Purchase Volume 4,879,001 4,150,298 17.6% Net Interchange Rate 0.71% 0.79% -10.1% Continued global expansion and investments in Asia and Europe Focus on operational efficiencies and scale Stability in net interchange rate
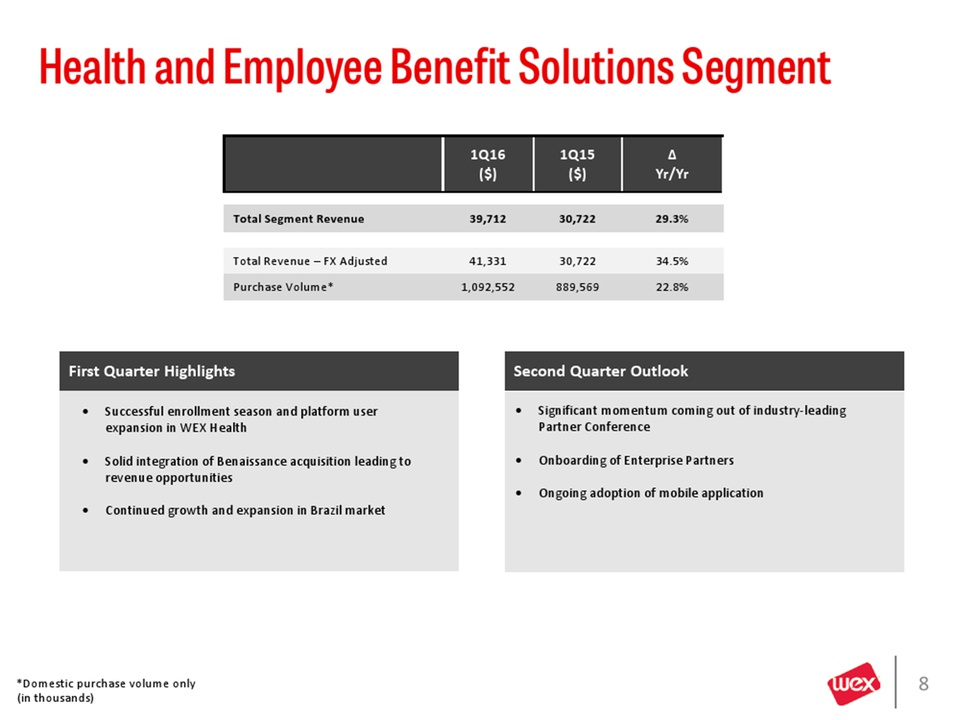
*Domestic purchase volume only (in thousands) 8 1Q16($) 1Q15($) ∆ Yr/Yr Total Segment Revenue 39,712 30,722 29.3% Total Revenue – FX Adjusted 41,331 30,722 34.5% Purchase Volume* 1,092,552 889,569 22.8% First Quarter Highlights Second Quarter Outlook Successful enrollment season and platform user expansion in WEX Health Solid integration of Benaissance acquisition leading to revenue opportunities Continued growth and expansion in Brazil market Significant momentum coming out of industry-leading Partner Conference Onboarding of Enterprise Partners Ongoing adoption of mobile application Health and Employee Benefit Solutions Segment
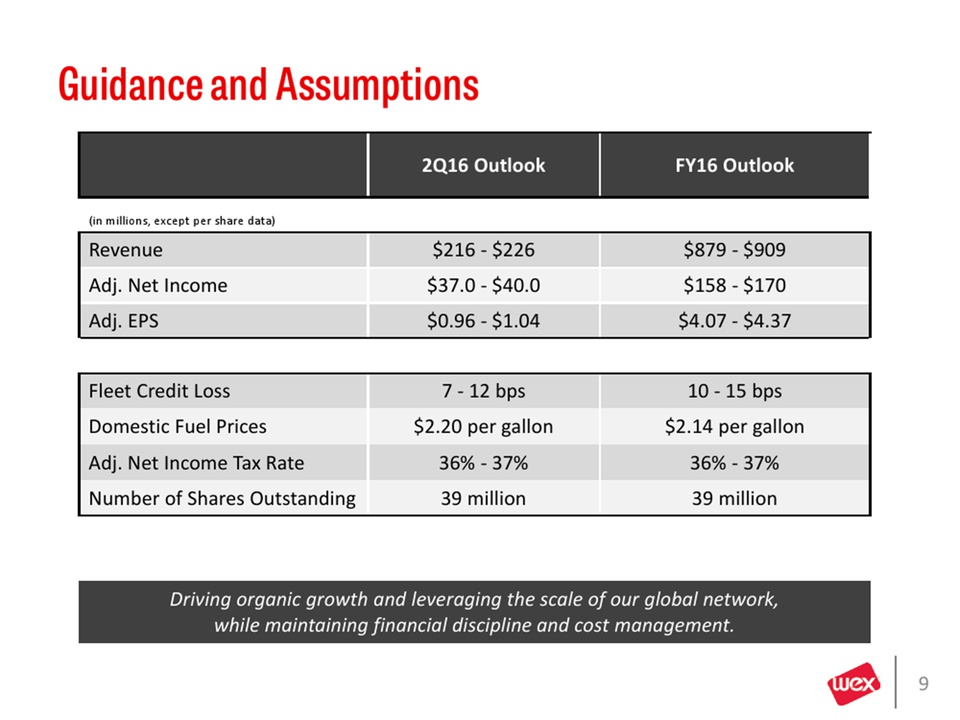
Guidance and Assumptions 9 (in millions, except per share data) 2Q16 Outlook FY16 Outlook Revenue $216 - $226 $879 - $909 Adj. Net Income $37.0 - $40.0 $158 - $170 Adj. EPS $0.96 - $1.04 $4.07 - $4.37 Fleet Credit Loss 7 - 12 bps 10 - 15 bps Domestic Fuel Prices $2.20 per gallon $2.14 per gallon Adj. Net Income Tax Rate 36% - 37% 36% - 37% Number of Shares Outstanding 39 million 39 million Driving organic growth and leveraging the scale of our global network, while maintaining financial discipline and cost management.

WEX Appendix WEX LISTED NYSE 10
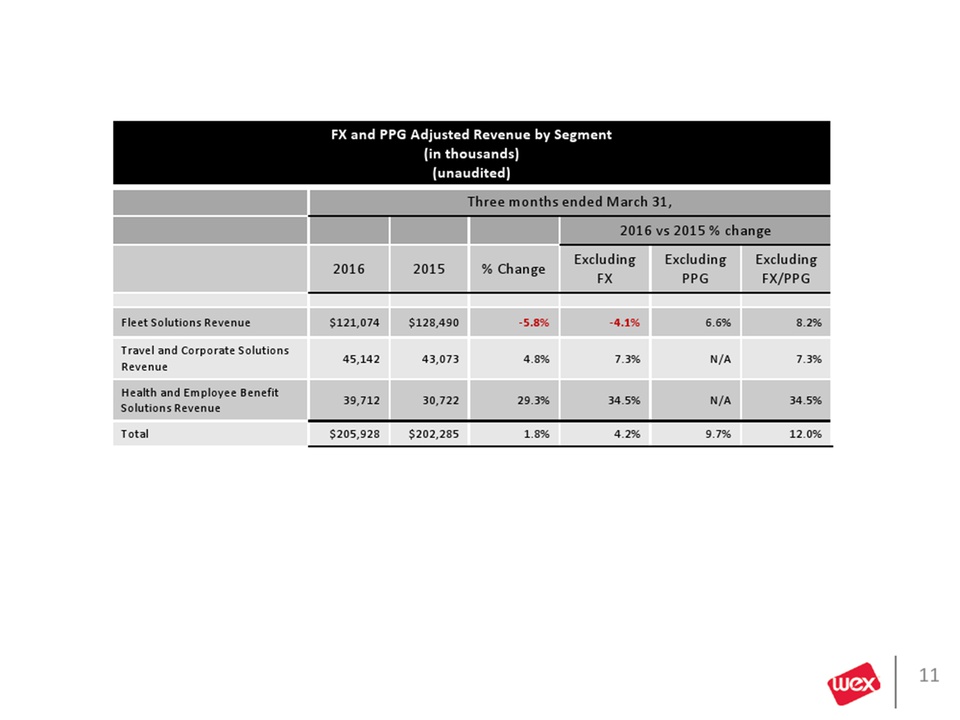
11 FX and PPG Adjusted Revenue by Segment(in thousands)(unaudited) Three months ended March 31, 2016 vs 2015 % change 2016 2015 % Change Excluding FX Excluding PPG Excluding FX/PPG Fleet Solutions Revenue $121,074 $128,490 -5.8% -4.1% 6.6% 8.2% Travel and Corporate Solutions Revenue 45,142 43,073 4.8% 7.3% N/A 7.3% Health and Employee Benefit Solutions Revenue 39,712 30,722 29.3% 34.5% N/A 34.5% Total $205,928 $202,285 1.8% 4.2% 9.7% 12.0%
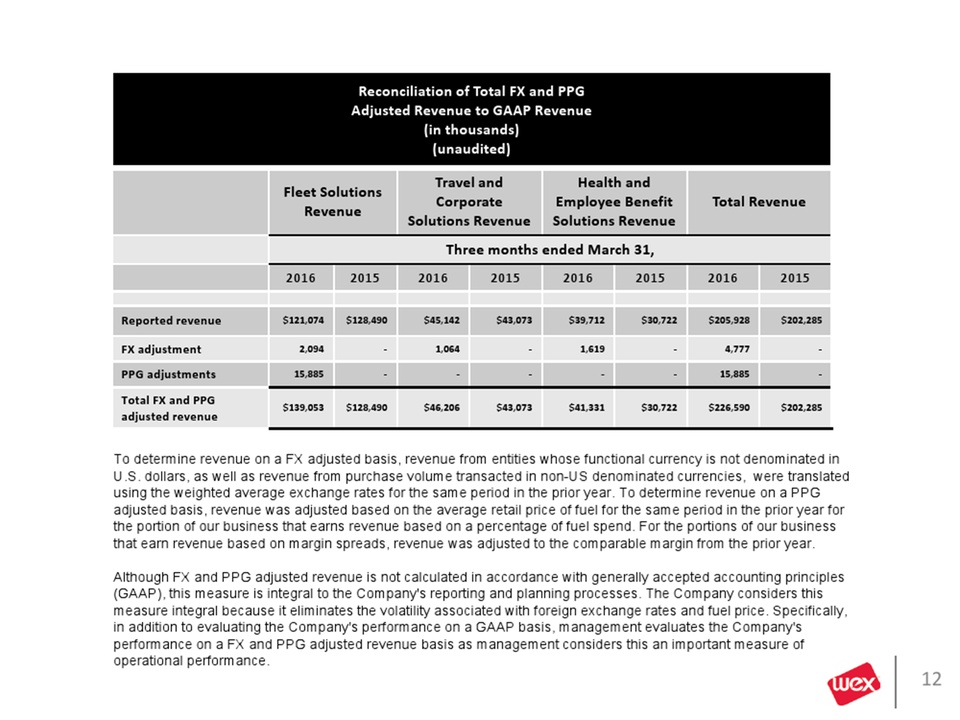
12 Reconciliation of Total FX and PPGAdjusted Revenue to GAAP Revenue(in thousands)(unaudited) Fleet Solutions Revenue Travel and Corporate Solutions Revenue Health and Employee Benefit Solutions Revenue Total Revenue Three months ended March 31, 2016 2015 2016 2015 2016 2015 2016 2015 Reported revenue $121,074 $128,490 $45,142 $43,073 $39,712 $30,722 $205,928 $202,285 FX adjustment 2,094 - 1,064 - 1,619 - 4,777 - PPG adjustments 15,885 - - - - - 15,885 - Total FX and PPG adjusted revenue $139,053 $128,490 $46,206 $43,073 $41,331 $30,722 $226,590 $202,285 To determine revenue on a FX adjusted basis, revenue from entities whose functional currency is not denominated in U.S. dollars, as well as revenue from purchase volume transacted in non-US denominated currencies, were translated using the weighted average exchange rates for the same period in the prior year. To determine revenue on a PPG adjusted basis, revenue was adjusted based on the average retail price of fuel for the same period in the prior year for the portion of our business that earns revenue based on a percentage of fuel spend. For the portions of our business that earn revenue based on margin spreads, revenue was adjusted to the comparable margin from the prior year. Although FX and PPG adjusted revenue is not calculated in accordance with generally accepted accounting principles (GAAP), this measure is integral to the Company's reporting and planning processes. The Company considers this measure integral because it eliminates the volatility associated with foreign exchange rates and fuel price. Specifically, in addition to evaluating the Company's performance on a GAAP basis, management evaluates the Company's performance on a FX and PPG adjusted revenue basis as management considers this an important measure of operational performance.
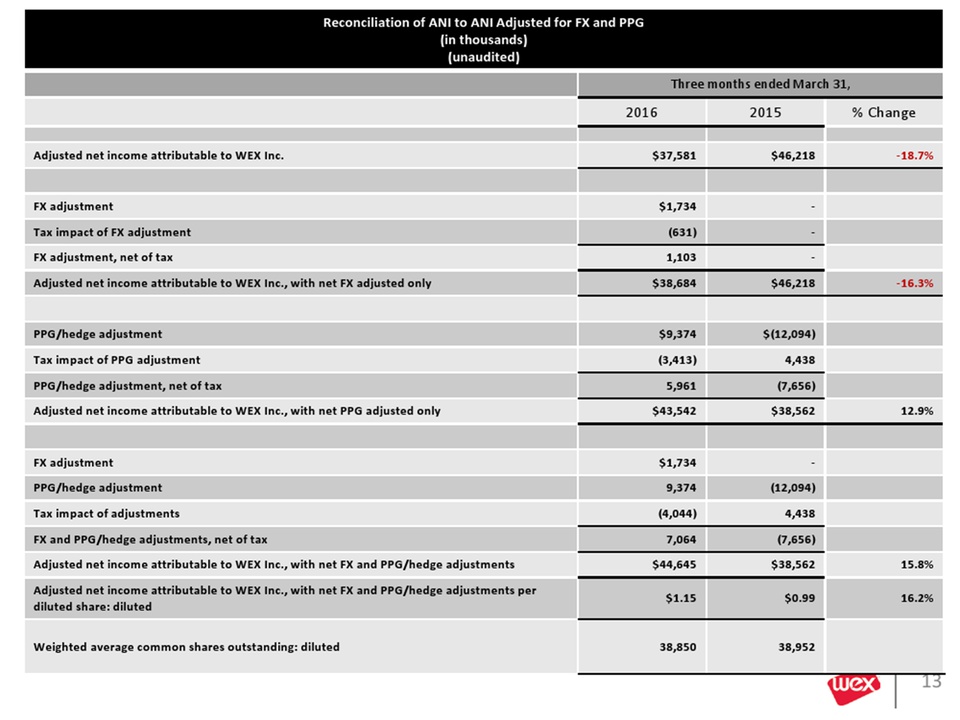
13 Reconciliation of ANI to ANI Adjusted for FX and PPG(in thousands)(unaudited) Three months ended March 31, 2016 2015 % Change Adjusted net income attributable to WEX Inc. $37,581 $46,218 -18.7% FX adjustment $1,734 - Tax impact of FX adjustment (631) - FX adjustment, net of tax 1,103 - Adjusted net income attributable to WEX Inc., with net FX adjusted only $38,684 $46,218 -16.3% PPG/hedge adjustment $9,374 $(12,094) Tax impact of PPG adjustment (3,413) 4,438 PPG/hedge adjustment, net of tax 5,961 (7,656) Adjusted net income attributable to WEX Inc., with net PPG adjusted only $43,542 $38,562 12.9% FX adjustment $1,734 - PPG/hedge adjustment 9,374 (12,094) Tax impact of adjustments (4,044) 4,438 FX and PPG/hedge adjustments, net of tax 7,064 (7,656) Adjusted net income attributable to WEX Inc., with net FX and PPG/hedge adjustments $44,645 $38,562 15.8% Adjusted net income attributable to WEX Inc., with net FX and PPG/hedge adjustments per diluted share: diluted $1.15 $0.99 16.2% Weighted average common shares outstanding: diluted 38,850 38,952
To determine adjusted net income on a FX adjusted basis, revenue and expenses from entities whose functional currency is not denominated in U.S. dollars, as well as revenue and variable expenses from purchase volume transacted in non-US denominated currencies, were translated using the weighted average exchange rates for the same period in the prior year, net of tax. To determine adjusted net income on a PPG adjusted basis, revenue, and expenses variable to changes in fuel prices, were adjusted based on the average retail price of fuel for the same period in the prior year for the portion of our business that earns revenue based on a percentage of fuel spend. For the portions of our business that earn revenue based on margin spreads, revenue was adjusted to the comparable margin from the prior year. Realized gains or losses on fuel price related hedges were removed from both current and the same period in the prior year. Although FX and PPG adjusted net income is not calculated in accordance with GAAP, this measure is integral to the Company's reporting and planning processes. The Company considers this measure integral because it eliminates the volatility associated with foreign exchange rates and fuel price. Specifically, in addition to evaluating the Company's performance on a ANI basis, management evaluates the Company's performance on a FX and PPG adjusted ANI basis as management considers this an important measure of operational performance. Reconciliation of ANI to ANI Adjusted for FX and PPG (Notes) 14
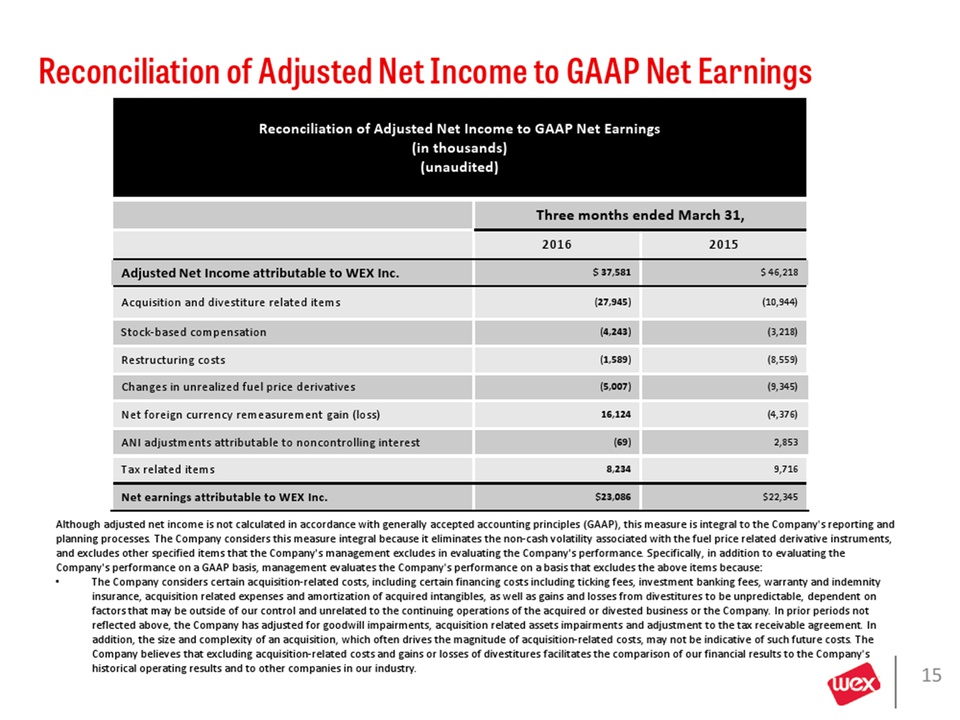
Although adjusted net income is not calculated in accordance with generally accepted accounting principles (GAAP), this measure is integral to the Company's reporting and planning processes. The Company considers this measure integral because it eliminates the non-cash volatility associated with the fuel price related derivative instruments, and excludes other specified items that the Company's management excludes in evaluating the Company's performance. Specifically, in addition to evaluating the Company's performance on a GAAP basis, management evaluates the Company's performance on a basis that excludes the above items because: The Company considers certain acquisition-related costs, including certain financing costs including ticking fees, investment banking fees, warranty and indemnity insurance, acquisition related expenses and amortization of acquired intangibles, as well as gains and losses from divestitures to be unpredictable, dependent on factors that may be outside of our control and unrelated to the continuing operations of the acquired or divested business or the Company. In prior periods not reflected above, the Company has adjusted for goodwill impairments, acquisition related assets impairments and adjustment to the tax receivable agreement. In addition, the size and complexity of an acquisition, which often drives the magnitude of acquisition-related costs, may not be indicative of such future costs. The Company believes that excluding acquisition-related costs and gains or losses of divestitures facilitates the comparison of our financial results to the Company's historical operating results and to other companies in our industry. Reconciliation of Adjusted Net Income to GAAP Net Earnings Reconciliation of Adjusted Net Income to GAAP Net Earnings(in thousands)(unaudited) Three months ended March 31, 2016 2015 Adjusted Net Income attributable to WEX Inc. $ 37,581 $ 46,218 Acquisition and divestiture related items (27,945) (10,944) Stock-based compensation (4,243) (3,218) Restructuring costs (1,589) (8,559) Changes in unrealized fuel price derivatives (5,007) (9,345) Net foreign currency remeasurement gain (loss) 16,124 (4,376) ANI adjustments attributable to noncontrolling interest (69) 2,853 Tax related items 8,234 9,716 Net earnings attributable to WEX Inc. $23,086 $22,345 15
Stock-based compensation is different from other forms of compensation, as it is a non-cash expense. For example, a cash salary generally has a fixed and unvarying cash cost. In contrast, the expense associated with an equity-based award is generally unrelated to the amount of cash ultimately received by the employee, and the cost to us is based on a stock-based compensation valuation methodology and underlying assumptions that may vary over time. Restructuring charges are related to employee termination benefits from certain identified initiatives to further streamline the business, improve the Company's efficiency, non-reoccurring costs to create synergies, and to globalize the Company's operations, all with an objective to improve scale and increase profitability going forward. We exclude these items when evaluating our continuing business performance as such items are not consistently occurring and do not reflect expected future operating expense, nor provide meaningful insight into the fundamentals of current or past operations of our business.Exclusion of the non-cash, mark-to-market adjustments on fuel-price related derivative instruments helps management identify and assess trends in the Company's underlying business that might otherwise be obscured due to quarterly non-cash earnings fluctuations associated with fuel-price-related derivative contracts. The non-cash, mark-to-market adjustments on derivative instruments are difficult to forecast accurately, making comparisons across historical and future quarters difficult to evaluate. Net foreign currency gains and losses primarily result from the remeasurement to functional currency of foreign currency cash, receivable and payable balances, certain intercompany notes and any gain or loss on foreign currency hedges relating to these items. The exclusion of these items helps management compare changes in operating results between periods that might otherwise be obscured due to currency fluctuations. The adjustments attributable to non-controlling interests, including adjustments to the redemption value of a non- controlling interest, have no significant impact on the ongoing operations of the business.For the same reasons, WEX believes that adjusted net income may also be useful to investors as one means of evaluating the Company's performance. However, because adjusted net income is a non-GAAP measure, it should not be considered as a substitute for, or superior to, net income, operating income or cash flows from operating activities as determined in accordance with GAAP. In addition, adjusted net income as used by WEX may not be comparable to similarly titled measures employed by other companies. The tax impact of the foregoing adjustments is the difference between the Company’s U.S. GAAP tax provision and a pro forma tax provision based upon the Company’s adjusted net income before taxes. The methodology utilized for calculating the Company’s adjusted net income tax provision is the same methodology utilized in calculating the Company’s U.S. GAAP tax provision. The Company is unable to reconcile our adjusted net income guidance to the comparable GAAP measure because of the difficulty in predicting the amounts to be adjusted. Reconciliation of Adjusted Net Income to GAAP Net Earnings (Cont.) 16