Attached files
| file | filename |
|---|---|
| 8-K - FORM 8-K - SHORE BANCSHARES INC | v438057_8k.htm |
Exhibit 99.1


Welcome & Introductions Christopher F. Spurry Chairman of the Board

Directors Shore Bancshares, Inc. • Blenda W. Armistead • David J. Bates • Lloyd L. “Scott” Beatty, Jr. • James A. Judge • Frank E. Mason, III • David W. Moore • Christopher F. Spurry • W. Moorhead Vermilye • John H. Wilson 3

Chairman’s Remarks & Procedural Matters Christopher F. Spurry Camille A. Pecorak

Nominees • Frank E. Mason, III Class I (term expires 2019) • Christopher F. Spurry Class I (term expires 2019) • John H. Wilson Class I (term expires 2019) • Jeffrey E. Thompson Class I (term expires 2019) • David A. Fike Class II (term expires 2017) • Clyde V. Kelly, III Class II (term expires 2017) • R. Michael Clemmer, Jr. Class III (term expires 2018 ) 5

President & CEO Remarks Lloyd L. “Scott” Beatty, Jr.

Forward - Looking Statement This presentation includes forward - looking statements, including statements about future results. These statements are subject to uncertainties and risks, including but not limited to our ability to integrate acquisitions; the strength of the U.S. economy and the local economies where we conduct operations; harsh weather conditions; fluctuations in inflation, interest rates, or monetary and governmental policies ; changes in the stock market and other capital and real estate markets; legislative or regulatory changes; results of regulatory examinations; customer acceptance of third - party products and services; increased competition and its effect on pricing; technological changes; security breaches and computer viruses that may affect our computer systems; changes in consumer spending and savings habits; our growth and profitability; changes in accounting; and our ability to manage the risks involved in the foregoing. These factors, as well as additional factors, can be found in our Annual Report on Form 10 - K for the fiscal year ended December 31, 2015 along with our other filings with the SEC, which are available at the SEC’s internet site (www.sec.gov). Actual results may differ materially from projections and could be affected by a variety of factors, including factors beyond our control. Forward - looking statements in this presentation speak only as of the date of these materials, and we assume no obligation to update forward - looking statements or the reasons why actual results could differ. In addition, this presentation includes certain non - GAAP financial measures . 7
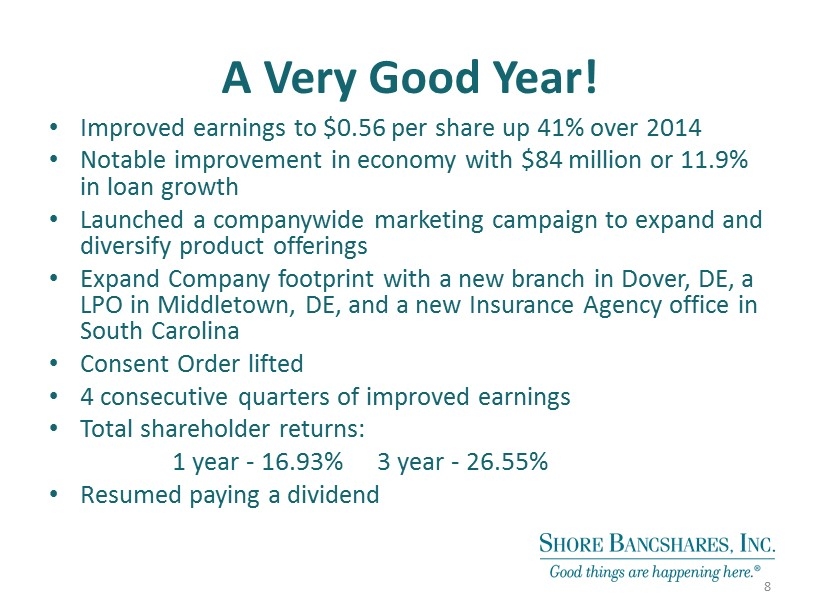
A Very Good Year! • Improved earnings to $0.56 per share up 41% over 2014 • Notable improvement in economy with $84 million or 11.9% in loan growth • Launched a companywide marketing campaign to expand and diversify product offerings • Expand Company footprint with a new branch in Dover, DE, a LPO in Middletown, DE, and a new Insurance Agency office in South Carolina • Consent Order lifted • 4 consecutive quarters of improved earnings • Total shareholder returns: 1 year - 16.93% 3 year - 26.55 % • Resumed paying a dividend 8
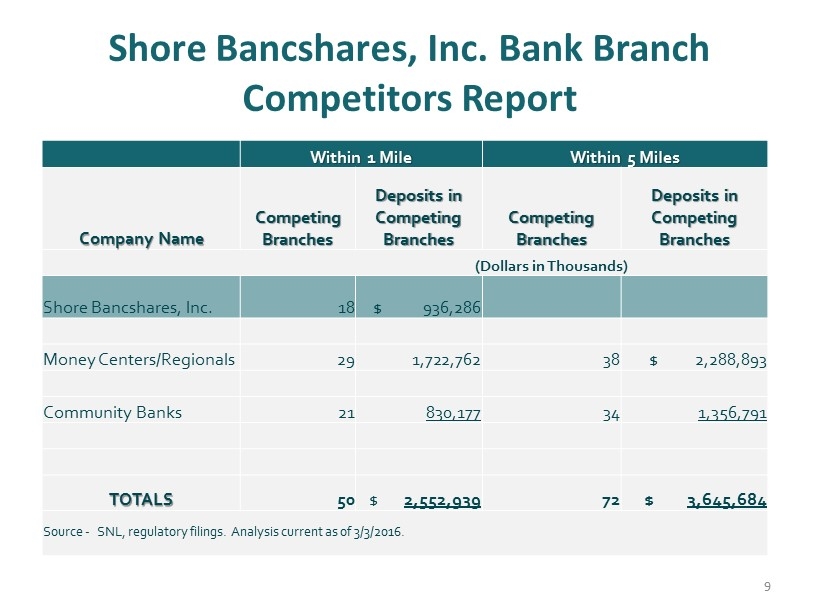
Shore Bancshares, Inc. Bank Branch Competitors Report Within 1 Mile Within 5 Miles Company Name Competing Branches Deposits in Competing Branches Competing Branches Deposits in Competing Branches (Dollars in Thousands) Shore Bancshares, Inc . 18 $ 936,286 Money Centers/Regionals 29 1,722,762 38 $ 2,288,893 Community Banks 21 830,177 34 1,356,791 TOTALS 50 $ 2,552,939 72 $ 3,645,684 Source - SNL, regulatory filings. Analysis current as of 3/3/2016. 9

Looking Toward the Future • Look for opportunities to expand our footprint • Continue to enhance client relationships in Banking, Insurance, and Investments • Continue to add products and services • Focus on development of our employees, our most valuable assets • Focus on our community. We are vested in our market and provide 15,000 hours of community service time as well as significant financial resources. 10

11 Bank Consolidation • Banks affiliated since 2000 • Merger application filed • New name

Bank Consolidation • Merger provides efficiencies allowing us to focus on our mission: • Creates security & stability for our clients, communities and employees • Reduces impact of growing costs as a result of current regulatory environment

13 Bank Consolidation • Create more awareness of the size and capabilities of our organization: • $1.1 Billion Bank • Retain all 18 Branches & LPO • One name creates awareness of the size of our footprint • One brand for easier customer recognition • 100% of banking activity, not just transactions, can occur at any branch

14 Bank Consolidation • From customer perspective – no adverse changes: • Basically a name change • Very minimal customer disruption • Same great people, products, and service

Shore Bancshares, Inc. Year End Highlights George S. Rapp Chief Financial Officer
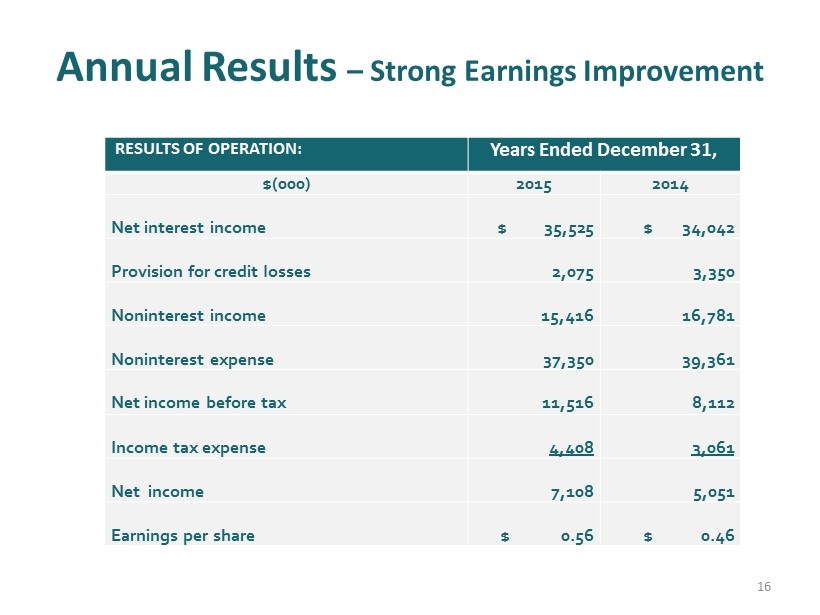
Annual Results – Strong Earnings Improvement RESULTS OF OPERATION: Years Ended December 31, $(000) 2015 2014 Net interest income $ 35,525 $ 34,042 Provision for credit losses 2,075 3,350 Noninterest income 15,416 16,781 Noninterest expense 37,350 39,361 Net income before tax 11,516 8,112 Income t ax expense 4,408 3,061 Net income 7,108 5,051 Earnings per share $ 0.56 $ 0.46 16

Quarterly Results – A 70% Increase Over last Year RESULTS OF OPERATION: $(000) 1Q16 4Q15 1Q15 Net interest income $ 9,243 $ 9,293 $ 8,539 Provision for credit losses 450 475 650 Noninterest income 4,541 3,638 4,085 Noninterest expense 9,339 8,950 9,704 Net Income before tax 3,995 3,506 2,270 Income Tax expense 1,535 1,343 861 Net income $ 2,460 $ 2,163 $ 1,409 Earnings per share $ 0.19 $ 0.17 $ 0.11 17
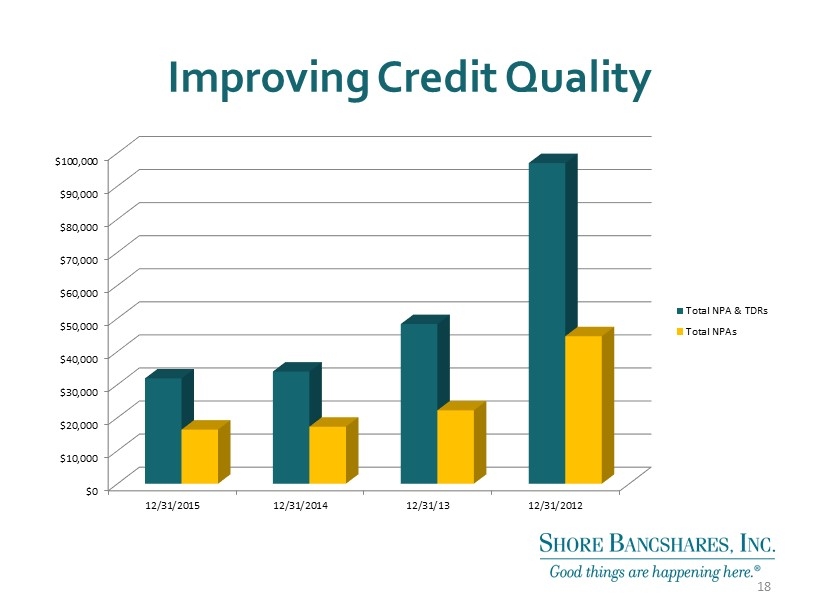
Improving Credit Quality $0 $10,000 $20,000 $30,000 $40,000 $50,000 $60,000 $70,000 $80,000 $90,000 $100,000 12/31/2015 12/31/2014 12/31/13 12/31/2012 Total NPA & TDRs Total NPAs 18

19 Capital Ratios - Very Strong 11.93% 11.70% 8.41% 8.36% 15.60% 15.27% 10.09% 12.05% 16.67% 16.36% 11.34% 13.32% 15.60% 0.00% 2.00% 4.00% 6.00% 8.00% 10.00% 12.00% 14.00% 16.00% 18.00% YE 2015 YE 2014 YE 2013 YE 2012 Tangible Common equity / Tangible Assets Tier 1 Risk-Based Capital Ratio Total Risk-Based Capital Ratio Common Equity Tier 1

Questions and Answers 20

Report on Voting 21

Adjournment 22