Attached files
| file | filename |
|---|---|
| 8-K - 8-K - NUVASIVE INC | d127838d8k.htm |
| EX-99.1 - EX-99.1 - NUVASIVE INC | d127838dex991.htm |
 NuVasive, Inc.
First Quarter 2016 Results
April 26, 2016
Exhibit 99.2 |
 ©2016 NuVasive®, Inc.
Forward-Looking Statements
NuVasive cautions you that statements included in this presentation that are not a description of historical facts are forward-looking statements that involve risks, uncertainties, assumptions and other factors which, if they do not materialize or prove correct, could cause NuVasive’s results to differ materially from historical results or those expressed or implied by such forward-looking statements. In addition, this presentation contains selected financial results from the first quarter 2016, as well as projections for 2016 financial guidance and longer-term financial performance goals. The numbers for the first quarter 2016 are prior to the completion of review procedures by the Company’s external auditors and are subject to adjustment. In addition, the Company’s projections for 2016 financial guidance and longer-term financial performance goals represent current estimates, including initial estimates of the potential benefits, synergies and cost savings associated with acquisitions, which are subject to the risk of being inaccurate because of the preliminary nature of the forecasts, the risk of further adjustment, or unanticipated difficulty in selling products or generating expected profitability. The potential risks and uncertainties that could cause actual growth and results to differ materially include, but are not limited to: the risk that NuVasive’s revenue or earnings projections may turn out to be inaccurate because of the preliminary nature of the forecasts; the risk of further adjustment to financial results or future financial expectations; unanticipated difficulty in selling products, generating revenue or producing expected profitability; the risk that acquisitions will not be integrated successfully or that the benefits and synergies from the acquisition may not be fully realized or may take longer to realize than expected; and those other risks and uncertainties more fully described in the Company’s news releases and periodic filings with the Securities and Exchange Commission. NuVasive’s public filings with the Securities and Exchange Commission are available at www.sec.gov.
The forward- looking statements contained herein are based on the current expectations and assumptions of NuVasive and not on historical facts. NuVasive assumes no obligation to update any forward-looking statement to reflect events or circumstances arising after the date on which it was made. 2 |
 ©2016 NuVasive®, Inc.
Non-GAAP Financial Measures
Management uses certain non-GAAP financial measures such as non-GAAP earnings per share, non-GAAP net income, non-GAAP operating expenses and non-GAAP operating profit margin, which exclude amortization of intangible assets, purchase accounting related charges, leasehold related charges, integration related expenses associated with acquired businesses, one-time restructuring and acquisition related items, CEO transition related costs, certain litigation charges, non-cash interest expense and/or losses on convertible notes, and the impact from taxes related to these items, including those taxes that would have occurred in lieu of these items. Management also uses certain non-GAAP measures which are intended to exclude the impact of foreign exchange currency fluctuations. The measure constant currency is the use of an exchange rate that eliminates fluctuations when calculating financial performance numbers. The Company also uses measures such as free cash flow, which represents cash flow from operations less cash used in the acquisition and disposition of capital. Additionally, the Company uses an adjusted EBITDA measure which represents earnings before interest, taxes, depreciation and amortization and excludes the impact of stock-based compensation, purchase accounting related changes, leasehold related charges, integration related expenses associated with acquired businesses, CEO transition related costs, certain litigation liabilities, acquisition related items and other significant one-time items. Management calculates the non-GAAP financial measures provided in this earnings release excluding these costs and uses these non-GAAP financial measures to enable it to further and more consistently analyze the period-to-period financial performance of its core business operations. Management believes that providing investors with these non-GAAP measures gives them additional information to enable them to assess, in the same way management assesses, the Company’s current and future continuing operations. These non-GAAP measures are not in accordance with, or an alternative for, GAAP, and may be different from non-GAAP measures used by other companies. For reconciliations of non-GAAP financial measures to the comparable GAAP financial measure, please visit the Investor Relations section of the Company’s corporate website at www.nuvasive.com.
3 |
 ©2016 NuVasive®, Inc.
Double-digit revenue growth and profitability expansion
First Quarter 2016 Performance Highlights
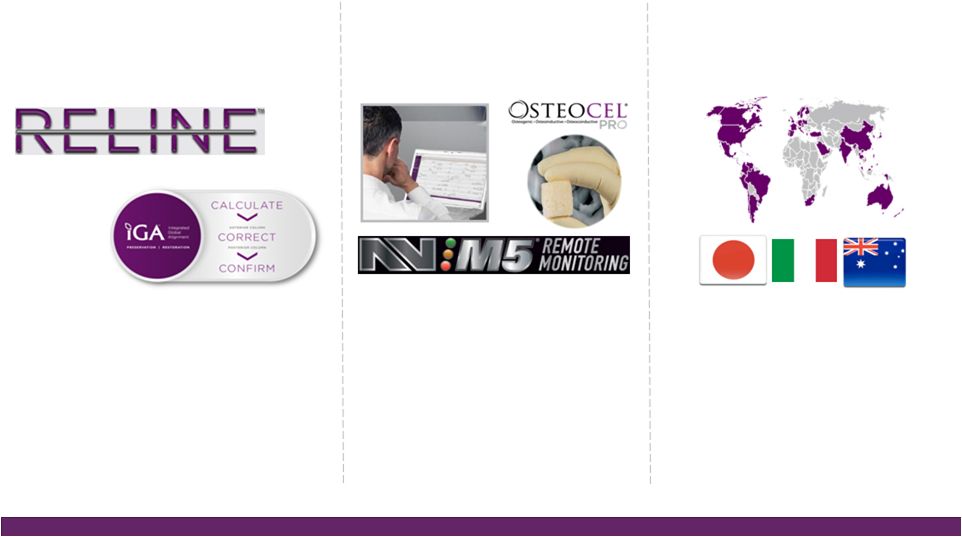
4 Innovation Growth Profitability • Completed acquisition of Ellipse Technologies and now focused on integration • Expanded reach into early-onset scoliosis market with acquisition of MAGEC® technology • Readying launch of several new innovations at AANS, including AttraX® Putty Biotextured™ Bone Graft, Reline® Modular System and Reline Power, MAS® TLIF 2 and Monolith™ Corpectomy System • Dedicating 5.6% of revenue, or more than $50 million, to R&D investments in 2016 • Returned to double-digit revenue growth up 12.3%, constant currency, to $215.1 million • Strong Reline posterior fixation system performance and ongoing adoption of iGA™ and NUVA planning technology • Performance up in all procedural categories, lead by posterior lumbar with strong growth in cervical and anterior lumbar • Localized improvement plans in Western Europe showing improved results • Acquired Brazilian distributor • Delivered 150 basis points of profitability expansion • Non-GAAP operating profit margin of 14.1% • Non-GAAP EPS of $0.31 • Capturing well-identified operating efficiencies, particularly around gross margin and SM&A leverage • Continued focus on optimizing scale and globalization efforts • On track with build out of West Carrollton, OH manufacturing facility to support ~100% self- manufacturing goal |
 ©2016 NuVasive®, Inc.
Operational excellence
delivering significant
margin expansion
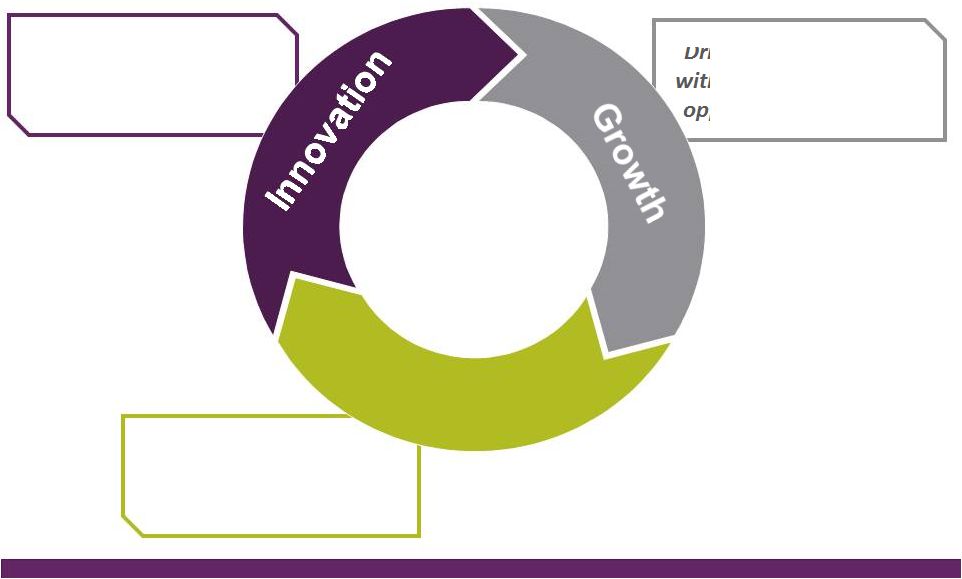
Driving organic growth
with numerous inorganic
opportunities available
Industry disruptor
adding value and
addressing unmet needs
NuVasive’s Formula for Success Fueling 2016 strategic agenda with proven approach to win 5 Profitability ©2015 NuVasive®, Inc. |
 ©2016 NuVasive®, Inc.
First Quarter 2016 Revenue Highlights
Strong revenue performance in key growth areas
*Constant currency basis
6 U.S. SPINAL HARDWARE Includes All Implants, Fixation, MAGEC® & PRECICE® Up 15.0% in 1Q16 Key Performance Factors: Fifth Consecutive Quarter of Increasing Growth Driven by ReLine, Increased Adoption of iGA, Strong MAGEC and PRECICE Sales U.S. SURGICAL SUPPORT Key Performance Factors: Driven By Increased Case Volumes INTERNATIONAL Up 20.7% * in 1Q16 Includes Puerto Rico Key Performance Factors: Japan, Italy & ANZ Remain Strong Performers Localized XLIF/MIS Focus Driving Resurgence in Germany & U.K. Includes Biologics, IOM Services & Disposables Up 3.7% in 1Q16 |
 ©2016 NuVasive®, Inc.
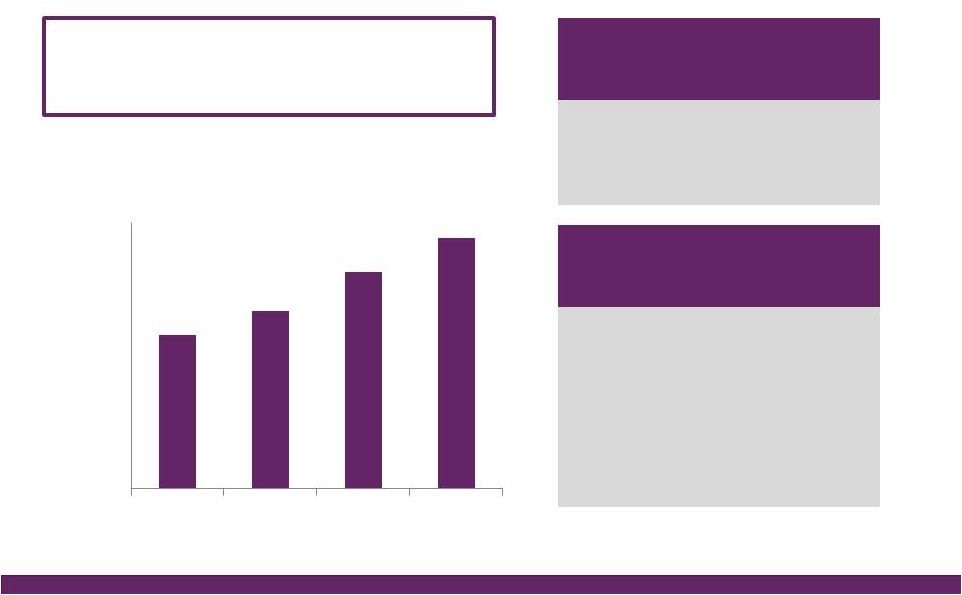
7 Driving Improved Financial Profile Improve Adjusted EBITDA, reduce tax rate and lower depreciation Driving to ~41% in 2016 Mid to High 30% in 2017 Mid to Low 30% Beyond Reducing Non-GAAP Effective Tax Rate* Reducing CapEx Burn from ~8% to ~6% of Revenue* Through Better Set Configuration and Utilization in Near Term Improvement Opportunities Such as 3-D Printing Longer Term Lower Depreciation *NuVasive financial performance guidance as of April 26, 2016 * Increased Focus on Driving Improved Adjusted EBITDA Through Disciplined Spending and Improved Efficiencies $144 $167 $204 ~$236 $0 $50 $100 $150 $200 $250 2013 2014 2015 2016E (In Millions) Adjusted EBITDA |
 ©2016 NuVasive®, Inc.
NuVasive Specialized Orthopedics™ (NSO)
Ellipse Technologies Integrates Into Newly Created NUVA Division
8 1Q16 Actuals 1Q16 YoY Growth NSO Revenues • As Reported – February 12 to March 31, 2016 $5.8M N/A • Pro Forma – January 1 to March 31, 2016 $11.7M 39.3% NUVA Core Revenues • U.S. $182.7M 8.9% • International $26.7M 8.5%, or 12.5% excluding currency • Total $209.3M 8.8%, or 9.3% excluding currency Combined 1Q16 Pro Forma Revenue Grew 10%, or 10.6% Constant Currency –
Outperforming Expectations to Drive High Single-Digit Growth with the
Addition of NSO ©2016 NuVasive®, Inc.
|
 ©2016 NuVasive®, Inc.
Non-GAAP Measures
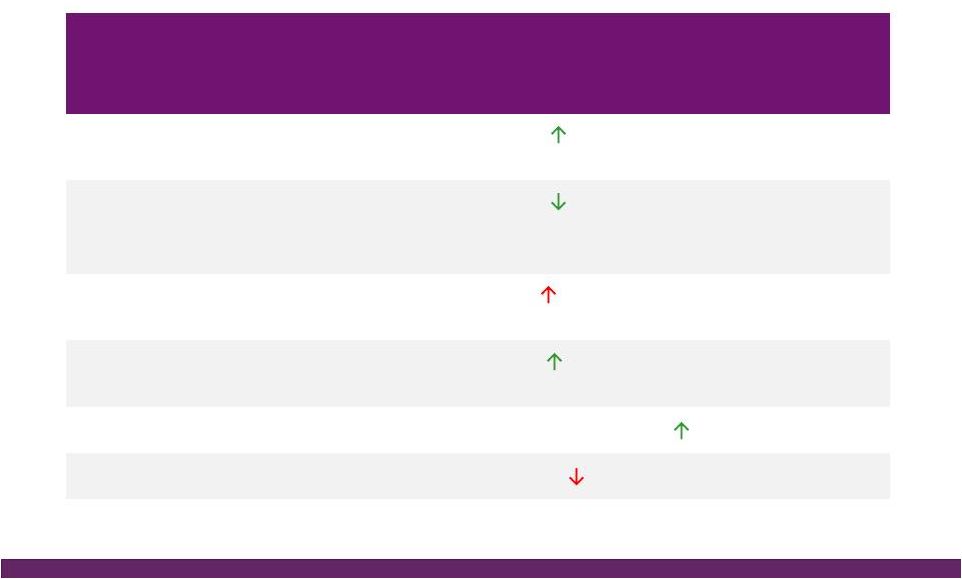
1Q16 Actuals 1Q16 YoY Performance Factors Gross Margin 77.1% 80 bps driven by asset efficiencies, lower royalties, med device tax repeal Sales, Marketing & Admin. 58.0% 80 bps driven by asset efficiencies, including better instrument utilization & back-office efficiencies Research & Development 4.9% 10 bps driven by investments in NSO & iGA platforms, procedural offerings Operating Profit Margin 14.1% 150 bps driven by COGS and SM&A leverage EPS $0.31 $0.01 Adjusted EBITDA Margin 22.5% 50 bps due to NSO acquisition Operating leverage story continues to play out First Quarter 2016 P&L Performance 9 ©2015 NuVasive®, Inc. |
| ©2016 NuVasive®, Inc.
©2016 NuVasive®, Inc.
Provides certainty, extends maturities and addresses potential dilution
Completed 2021 Convertible Notes Issuance
• Raised $650 million, including a $100 million over-allotment option,
generating net proceeds of ~$634 million
• Notes have a coupon rate of 2.25%, in addition to callable feature that
provides opportunity to control future dilutive impacts to
shareholders •
Used proceeds to put in place bond hedge at net cost of ~$66 million, taking
effective conversion price from $59.82 to $80.00
• Used ~$344 million to repurchase ~70% of existing 2017 convertible notes
and intend to make additional repurchases over time
• Paid down the original $50 million draw on revolver • Expect 2016 non-GAAP Other Income & Expense of ~$19 million for the year
• Expect 2016 non-GAAP weighted average shares outstanding of ~51.3 million
10 |
 ©2016 NuVasive®, Inc.
11 FY16 Guidance Performance Drivers Revenues • As reported • Full year pro forma ~$928.0M, ~14% YoY growth^ $935M, ~9% growth ~$53M NSO contribution; ~$5M currency impact $~875 core business revenue; ~$60M NSO revenue • U.S. Spinal Hardware • U.S. Surgical Support • International ~14% YoY growth ~3% YoY growth ~40% YoY growth Strong expected lumbar, cervical and NSO product performance Slower growth expectations for biologics and services ~37% constant currency impact; comprised of core NuVasive growth of ~20%, NSO product growth of ~17% Non-GAAP Gross Margin ~77.4% ~140 bps increase due to 2-year suspension of med device tax, favorable mix from lumbar and cervical portfolios Non-GAAP Sales, Marketing & Admin. ~56.0% ~40 bps improvement driven by core NuVasive asset and sales force efficiencies, support function management, International scale Non-GAAP Research & Development ~5.6% ~130 bps increase in organic and inorganic investment in innovation Non-GAAP Operating Profit Margin ~15.8% ~140 bps of core NuVasive margin improvement, primarily offset by NSO investment Non-GAAP Earnings Per Share ~$1.48 ~13% YoY growth Adjusted EBITDA Margin ~25.4% ~20 bps increase Non-GAAP Effective Tax Rate ~41.0% ~100 bps improvement from 42% in 2015 Non-GAAP diluted WASO ~51.3M shares Reduced from ~52.5M shares due to convertible note issuance and note repurchases Reflects Impact of Acquisitions, Convertible Note Issuance and Note Repurchases, and Expected Currency Rates Full Year 2016 Financial Performance Guidance* *NuVasive financial performance guidance as of April 26, 2016; ^Constant currency as reported |
 ©2016 NuVasive®, Inc.
Relentless focus on driving shareholder value
Why Invest in NuVasive
12 Industry-leading innovation and integrated procedural solutions enables share-taking and premium pricing Drive surgeon conversion, increase service line partnerships and expand services integration Double International revenue contribution in coming years Competitively positioned in large and growing global spine market with favorable transformative dynamics playing to NuVasive strengths Grow revenues at multiples of market in high single-digit range* Achieve ~25% long-term non- GAAP operating profit margin and ~32% adjusted EBITDA goals* Optimize tax structure to help drive EPS growth 2x the rate of revenue growth* Disciplined capital deployment for strategic M&A and partnerships Set to generate significant increases in free cash flow *NuVasive financial performance guidance as of April 26, 2016 |