Attached files
| file | filename |
|---|---|
| 8-K - 8-K - CAMDEN NATIONAL CORP | a8k_033116earnings.htm |
| EX-99.1 - EXHIBIT 99.1 - CAMDEN NATIONAL CORP | ex991earningsreleaseq116.htm |
| EX-99.2 - EXHIBIT 99.2 - CAMDEN NATIONAL CORP | ex992shareholderletterq116.htm |

2016 Annual Shareholders Meeting

Welcome to the 2016 Annual Shareholders’ Meeting Karen W. Stanley Chairman of the Board

Agenda • Business Meeting • Introductions • Reading of the Minutes • Shareholder Voting • Presentations • Financial Results – Deborah Jordan • Strategic Update – Greg Dufour • Questions and Answers

Camden National Bank Board of Directors • Karen Stanley, Chair • Gregory Dufour, President/CEO • Ann Bresnahan • William Dubord • David Flanagan • John Holmes • James Markos, Jr. • Robert Merrill • David Ott • John Rohman • Carl Soderberg • Rosemary Weymouth

Camden National Corporation Board of Directors • Karen Stanley, Chair • Gregory Dufour, President/CEO • Ann Bresnahan • David Flanagan • Craig Gunderson • John Holmes • Catherine Longley • David Ott • James Page, Ph.D. • John Rohman • Robin Sawyer, CPA • Carl Soderberg • Lawrence Sterrs
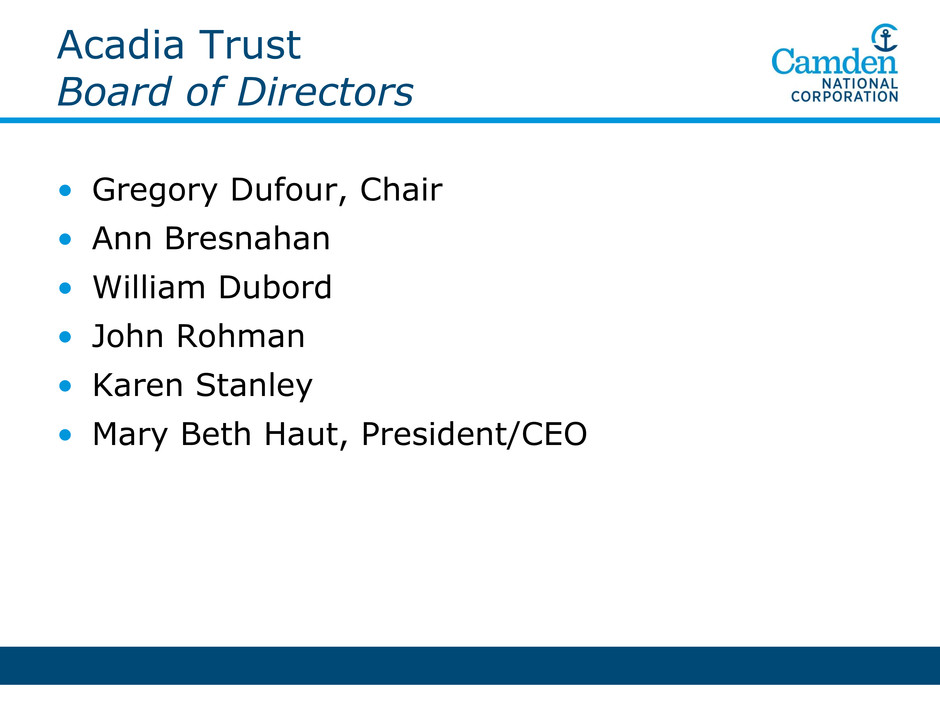
Acadia Trust Board of Directors • Gregory Dufour, Chair • Ann Bresnahan • William Dubord • John Rohman • Karen Stanley • Mary Beth Haut, President/CEO

Camden National Corporation Senior Management Team Gregory Dufour, President and Chief Executive Officer Joanne Campbell, EVP - Risk Management Officer Carolyn Crosby, SVP - Human Resources & Development Mary Beth Haut, Acadia Trust; President and Chief Executive Officer Mac Hayden, EVP – Chief Credit Officer Deborah Jordan, CPA, EVP – Chief Operating and Financial Officer Timothy Nightingale, EVP - Senior Lending Officer June Parent, EVP - Senior Retail Banking Officer Renee Smyth, SVP – Chief Marketing Officer

Meeting Minutes

Judges of Election Paul Gibbons Orman Goodwin, Jr. Proxies Thomas Jackson Jeffrey Weymouth Alternates Parker Laite, Jr. Arthur Sprowl
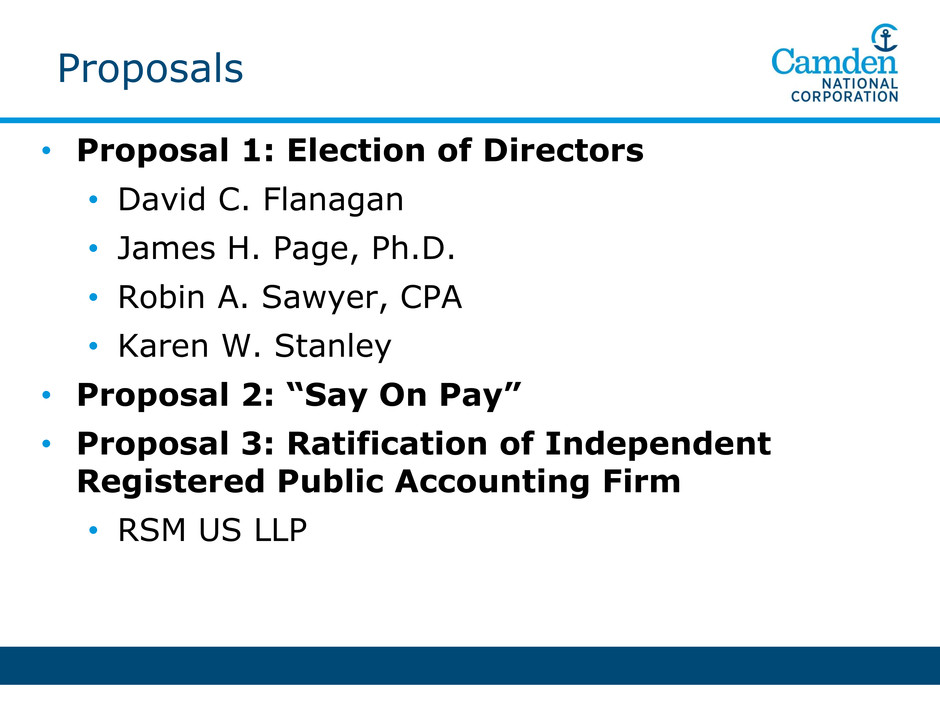
• Proposal 1: Election of Directors • David C. Flanagan • James H. Page, Ph.D. • Robin A. Sawyer, CPA • Karen W. Stanley • Proposal 2: “Say On Pay” • Proposal 3: Ratification of Independent Registered Public Accounting Firm • RSM US LLP Proposals

Submission of Proxy Votes
Financial Results for 2015 and First Quarter 2016 Deborah Jordan Chief Operating Officer and Chief Financial Officer
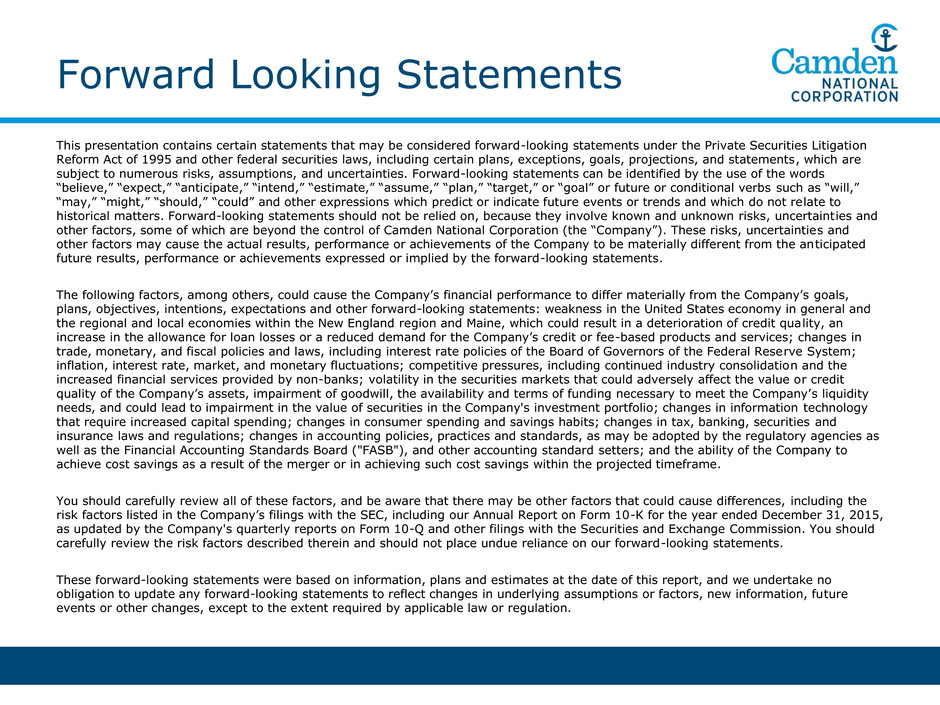
Forward Looking Statements This presentation contains certain statements that may be considered forward-looking statements under the Private Securities Litigation Reform Act of 1995 and other federal securities laws, including certain plans, exceptions, goals, projections, and statements, which are subject to numerous risks, assumptions, and uncertainties. Forward-looking statements can be identified by the use of the words “believe,” “expect,” “anticipate,” “intend,” “estimate,” “assume,” “plan,” “target,” or “goal” or future or conditional verbs such as “will,” “may,” “might,” “should,” “could” and other expressions which predict or indicate future events or trends and which do not relate to historical matters. Forward-looking statements should not be relied on, because they involve known and unknown risks, uncertainties and other factors, some of which are beyond the control of Camden National Corporation (the “Company”). These risks, uncertainties and other factors may cause the actual results, performance or achievements of the Company to be materially different from the anticipated future results, performance or achievements expressed or implied by the forward-looking statements. The following factors, among others, could cause the Company’s financial performance to differ materially from the Company’s goals, plans, objectives, intentions, expectations and other forward-looking statements: weakness in the United States economy in general and the regional and local economies within the New England region and Maine, which could result in a deterioration of credit quality, an increase in the allowance for loan losses or a reduced demand for the Company’s credit or fee-based products and services; changes in trade, monetary, and fiscal policies and laws, including interest rate policies of the Board of Governors of the Federal Reserve System; inflation, interest rate, market, and monetary fluctuations; competitive pressures, including continued industry consolidation and the increased financial services provided by non-banks; volatility in the securities markets that could adversely affect the value or credit quality of the Company’s assets, impairment of goodwill, the availability and terms of funding necessary to meet the Company’s liquidity needs, and could lead to impairment in the value of securities in the Company's investment portfolio; changes in information technology that require increased capital spending; changes in consumer spending and savings habits; changes in tax, banking, securities and insurance laws and regulations; changes in accounting policies, practices and standards, as may be adopted by the regulatory agencies as well as the Financial Accounting Standards Board ("FASB"), and other accounting standard setters; and the ability of the Company to achieve cost savings as a result of the merger or in achieving such cost savings within the projected timeframe. You should carefully review all of these factors, and be aware that there may be other factors that could cause differences, including the risk factors listed in the Company’s filings with the SEC, including our Annual Report on Form 10-K for the year ended December 31, 2015, as updated by the Company's quarterly reports on Form 10-Q and other filings with the Securities and Exchange Commission. You should carefully review the risk factors described therein and should not place undue reliance on our forward-looking statements. These forward-looking statements were based on information, plans and estimates at the date of this report, and we undertake no obligation to update any forward-looking statements to reflect changes in underlying assumptions or factors, new information, future events or other changes, except to the extent required by applicable law or regulation.
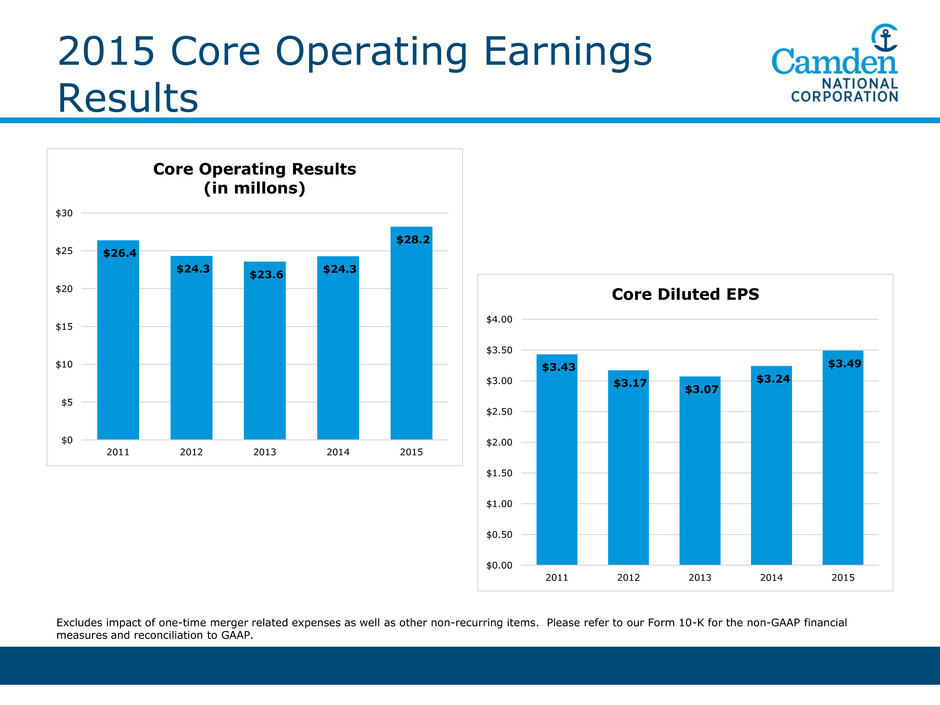
2015 Core Operating Earnings Results Excludes impact of one-time merger related expenses as well as other non-recurring items. Please refer to our Form 10-K for the non-GAAP financial measures and reconciliation to GAAP. $26.4 $24.3 $23.6 $24.3 $28.2 $0 $5 $10 $15 $20 $25 $30 2011 2012 2013 2014 2015 Core Operating Results (in millons) $3.43 $3.17 $3.07 $3.24 $3.49 $0.00 $0.50 $1.00 $1.50 $2.00 $2.50 $3.00 $3.50 $4.00 2011 2012 2013 2014 2015 Core Diluted EPS

Loan Growth and Mix (1) Includes loans held for sale. Commercial 15% Commercial Real Estate 37% Residential Mortgages 33% Home Equity/Consumer 15% Loan Mix 12/31/15 1,520 1,564 1,580 1,773 1,886 615 0 500 1,000 1,500 2,000 2,500 3,000 2011 2012 2013 2014 2015 $ ( in m ill io n s ) Total Loans Outstanding1 2,501

Funding Growth and Mix 12/31/15 Funding: $3.3 billion Total Funding Cost: 0.47% Deposit Cost: 0.26% 12/31/14 Checking, 30% Saving/Money Market, 26% CD's, 21% Borrowings, 23% Funding: $2.5 billion Total Funding Cost: 0.50% Deposit Cost: 0.28% Borrowings, 17% Checking, 33% Savings/Money Market, 28% CD's, 22% Acquired Acquired Acquired

Non-Performing Assets to Total Assets Proxy Peer – Average of 21 publicly traded commercial and savings banks in the Northeast. BHCPR Peer – Average of 142 bank holding companies with $3B to $10B in assets. Source: SNL Financial 1.26% 1.11% 1.16% 0.82% 0.66% 0.00% 0.50% 1.00% 1.50% 2.00% 2.50% 3.00% 2011 2012 2013 2014 2015 CAC Proxy Peer BHCPR

Core Operating Expenses to Average Assets Non-GAAP financial measure – It excludes the impact of one-time merger related expenses as well as other non-recurring items. Proxy Peer – Average of 21 publicly traded commercial and savings banks in the Northeast. SNL U.S. Banks $3B-$10B – Average of all major exchanges (NYSE, NYSE MKT, NASDAQ) banks in SNL's coverage universe with $3B to $10B in assets. Source: SNL Financial; Calculated by dividing total operating expense (reported) by average assets (reported). 2.40% 2.37% 2.44% 2.32% 2.36% 0.00% 0.50% 1.00% 1.50% 2.00% 2.50% 3.00% 3.50% 2011 2012 2013 2014 2015 CAC Proxy Peer SNL U.S. Banks $3B-$10B
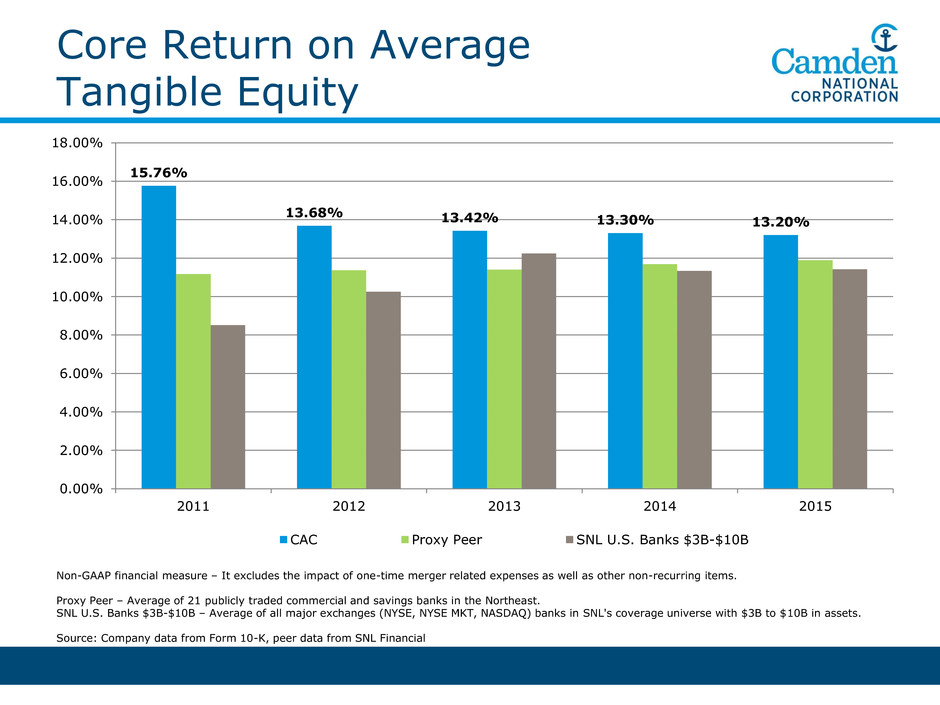
Non-GAAP financial measure – It excludes the impact of one-time merger related expenses as well as other non-recurring items. Proxy Peer – Average of 21 publicly traded commercial and savings banks in the Northeast. SNL U.S. Banks $3B-$10B – Average of all major exchanges (NYSE, NYSE MKT, NASDAQ) banks in SNL's coverage universe with $3B to $10B in assets. Source: Company data from Form 10-K, peer data from SNL Financial Core Return on Average Tangible Equity 15.76% 13.68% 13.42% 13.30% 13.20% 0.00% 2.00% 4.00% 6.00% 8.00% 10.00% 12.00% 14.00% 16.00% 18.00% 2011 2012 2013 2014 2015 CAC Proxy Peer SNL U.S. Banks $3B-$10B

(1) Defined as the sum of net interest income and non-interest income. (2) Non-GAAP measure. Please refer to the earnings release filed on Form 8-K on April 26, 2016 for the “Reconciliation of non-GAAP to GAAP Financial Measures” section. First Quarter 2016 Core Operating Results March 31, Increase 2016 2015 $ % (in thousands, except per share) Revenue 1 35,869$ 25,581$ 10,288$ 40% Expenses/Provision/Taxes 2 (27,116) (19,317) 7,799 40% Core Operating Earnings 2 8,753$ 6,264$ 2,489$ 40% Core Diluted EPS 2 0.85$ 0.84$ 0.01$ 1% Core Return on Avg Tangible Equity 2 13.72% 13.10% 0.62% 5%

Estimated Actual/Expected Deal Value: $135 million $137 million Tangible Book Value: 13.6% dilution at closing Earn back of 5 years Improvement to 12% dilution Maintain earn back of 5 years Earnings Per Share: 14% accretion in 2016 Mid-teens accretion in 2017 and beyond Reduction to 11% accretion in 2016 Mid-teens accretion in 2017 and beyond Cost Savings: Cost savings of $11 million On track for $11 million of cost savings SBM Merger Update

Voting Results Gregory A. Dufour President and Chief Executive Officer

CEO Comments Gregory A. Dufour President and Chief Executive Officer

Camden National Corporation Camden National Corporation • Headquartered in Maine – largest bank in Northern New England • Full-service community bank • Focused on delivering long-term shareholder value through banking, brokerage and wealth management services • Operates in Maine, New Hampshire and select markets of New England.

Camden National Corporation Headquarters Camden, ME Employees Over 650 Ticker CAC (NASDAQ) Current Price $43.34 52 Week Range $37.23 to $47.49 Avg. Daily Volume 27,210 Assets $3.8 billion Loans / Deposits $2.5 billion / $2.7 billion Market Cap $440 million Analyst Coverage Piper Jaffrey (overweight – target price $54) KBW (outperform – target price $49) Market data as of April 25, 2016 Balance sheet data as of March 31, 2016

40% organic growth over 20 year horizon $0 $500 $1,000 $1,500 $2,000 $2,500 $3,000 $3,500 $4,000 1995 1997 1999 2001 2003 2005 2007 2009 2011 2013 2015 T h o u s a n d s United Corp. $54 million Key Bank 4 Branches $54 million KSB Bancorp $179 million Union Bankshares $565 million Bank of America 14 Branches $287 million Branch Sale 5 Branches $46 million The Bank of Maine $806 millionThrough 12/31/15 Organic Growth: $1,284 million Acquired Growth: $1,945 million Total Growth CAGR: 10.8% Opportunistic but disciplined approach to growth

Strategic Plan for Growth Core Market Acquired Market Growth Target Camden National Corporation • 63 banking centers • 2 wealth management offices • 1 loan production office (NH) • 1 mortgage office (MA) Positions us in • Cumberland and York County • 36% of Maine’s population • 35% of Maine’s retail sales • 43% of Maine’s property value • New Hampshire • Massachusetts

Focused Priorities Following a strategic plan with three major initiatives: • Organic growth continues to be our #1 priority. • Growth through acquisitions • 2015: Acquired The Bank of Maine (SBM Financial) and $687 million of deposits o Expanded market opportunity by 202,605 households • 2012: Acquired 14 Bank of America branches and $287 million of deposits • Growth through talent • Continue to invest in our team and internal training • Added 21 new lenders since 2013 (increased lenders by 64%) • Acquiring key talent to deepen and strengthen credit bench Build Market Share 1

Focused Priorities Maintain discipline around expense control • Focus on improving Efficiency Ratio • The Bank of Maine (SBM Financial) cost savings of $11 million in 2016 • Branch Consolidation • 1 location (2016) • 4 locations (2015) • 2 locations (2013) • Divested 5 rural branches (2013) • IT/Support: Invest in innovation and leverage scale • Outsourced core processing system (Jack Henry) • Expanded digital technology platform • Levered mortgage loan platform and AML/BSA system Create Efficiencies 2

Focused Priorities Strategically positioned for future growth • Geographic expansion to high growth markets • Southern Maine • New Hampshire • Massachusetts • Product & service enhancements to meet diverse business needs • Mortgage Banking • Treasury Management • Business Banking • Technology upgrades with a strong focus on security • Q2 • Apple Pay Expand Business Banking Services 3

Dividend History (a) 2005 and 2011, special dividend of $0.50 per share. $0.63 $1.20 $0.00 $0.20 $0.40 $0.60 $0.80 $1.00 $1.20 $1.40 $1.60 '00 '01 '02 '03 '04 '05 (a) '06 '07 '08 '09 '10 '11 (a) '12 '13 '14 '15 $118 million of dividends paid since 2000 Average dividend payout ratio of 37%

Returning Capital to Investors (a) 2005 and 2011, special dividend of $0.50 per share. (b) 2006 issuance of trust preferred and share buyback. $195 million returned to shareholders since 2000 $118 million of dividends $77 million of share repurchases 0 20,000 40,000 60,000 80,000 100,000 120,000 140,000 160,000 180,000 200,000 '00 '01 '02 '03 '04 '05 (a) '06 (b) '07 '08 '09 '10 '11 (a) '12 '13 '14 '15 Dividends Buybacks

Total Return CNC: 393% S&P 500: 108% SNL U.S. Bank $1B-$5B: 152% -100% -50% 0% 50% 100% 150% 200% 250% 300% 350% 400% 450% Dec-00 Dec-01 Dec-02 Dec-03 Dec-04 Dec-05 Dec-06 Dec-07 Dec-08 Dec-09 Dec-10 Dec-11 Dec-12 Dec-13 Dec-14 Dec-15 Source: SNL Financial Strong 15 year return • Stock price appreciation of 209.40% • Average dividend yield of 2.91%

Why be a Shareholder of Camden National? • Track record of consistent and stable earnings • Diversified business model • Proven management team • Favorable trading range to book • Solid and consistent record of dividends
