Attached files
| file | filename |
|---|---|
| 8-K - FORM 8-K - FARMERS NATIONAL BANC CORP /OH/ | d171285d8k.htm |
 Annual Meeting of Shareholders Thursday, April 21, 2016 Exhibit 99.1 |
 |
 Kevin J. Helmick President & Chief Executive Officer |
 Stakeholders Shareholders Customers Associates Community |
 • Small Businesses are those with fewer than 500
employees
• Small businesses employ 57%
of the country’s private workforce
• Small businesses pay 44%
of U.S. payroll
• Small businesses create 13x
more patents per employee than large
patenting companies
• 60% to 80% of new jobs come from small businesses • 46% of small business lending is done by Community
Banks
5 Why are Small Businesses so Important? Source: www.businessinsider.com |
 Community Banks: • Focus attention on the needs of local families and businesses
• Use local deposits to make loans to the neighborhoods where their
depositors live and work
• Officers are generally accessible to their customers on site with
decisions on loans being made locally
• Employees are typically deeply involved in local community affairs
6 Why are Community Banks so Important? |
 Community Banks: • Are willing to consider important attributes such as a person’s
character when making loans
• Are themselves small businesses, so they understand the needs of
small business owners
• Board of directors are made up of local citizens who want to
advance the interests of the towns and cities where they
live and the bank does
business 7
Why are Community Banks
so Important? |
 8 Farmers Footprint Financial Highlights - December 31, 2015 • Banking Locations: 38 • Assets: $1.9 billion • Loans: $1.3 billion • Deposits: $1.4 billion • Loan/Deposit Ratio: 92.0% • Tangible Common Equity: 8.5% • Market Capitalization: $232 million 1 Mergers/Acquisitions • National Bancshares: Closed June 19, 2015 • Tri-State 1 st Banc: Closed October 1, 2015 • Added 17 branches for a total of 38 banking locations • Integration • Retention of key producers/key contributors (1) Based on FMNB’s stock price of $8.60 on December 31, 2015
Source: SNL Financial
|
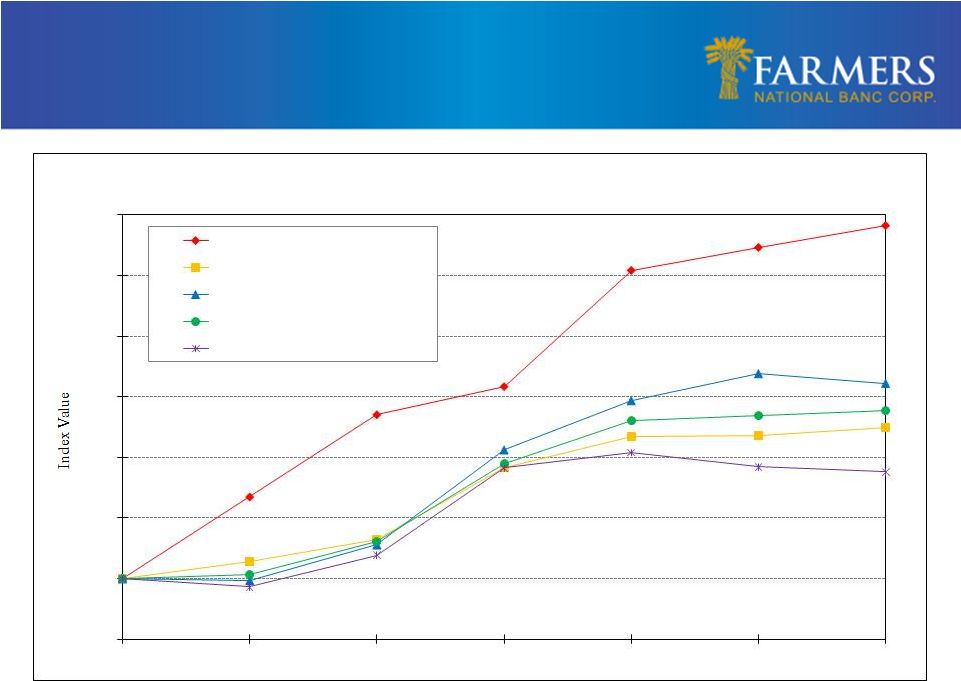 Total Return Performance 70 100 130 160 190 220 250 280 12/31/10 12/31/11 12/31/12 12/31/13 12/31/14 12/31/15 03/31/16 Total Return Performance Farmers National Banc Corp. Dow Jones Industrial Average NASDAQ Composite S&P 500 Russell 2000 |
 Total Return Performance 70 100 130 160 190 220 250 280 12/31/10 12/31/11 12/31/12 12/31/13 12/31/14 12/31/15 03/31/16 Total Return Performance Farmers National Banc Corp. NASDAQ Bank SNL Midwest Bank SNL Microcap Bank |
 11 • Organic Growth – Continued organic growth in current markets – Growth opportunities in new markets with Private Banking, Trust and
Investments
• Acquisition Opportunities – Targeted acquisitions include fee-based business and banks
– Accretive to earnings near term (excluding one-time charges)
– Manageable initial tangible book value dilution – Must sustain our culture – Sustain our TCE and regulatory ratios • Cash Dividend Payout Policy – Maintain 25% - 35% range • Share Repurchase Plan – Continue to look for repurchase opportunities Strategic Focus - Capital Management |
 Strategic Focus Continued • Management of non interest expense • Fee income • Loan growth |
 Strategic Focus – Investment in Technology Online Banking Mobile Banking ApplePay/Tokenization EMV/Chip Card |
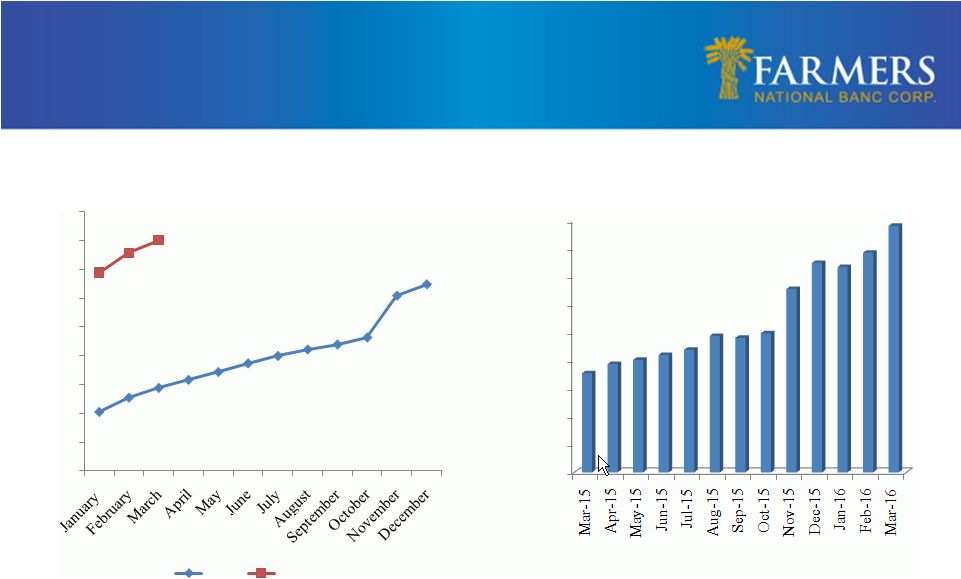 Strategic Focus - Investment in Technology 3,389 8,515 500 1500 2500 3500 4500 5500 6500 7500 8500 9500 Mobile Banking Users YOY Growth: 151% YOY Growth: 149% 0 2000 4000 6000 8000 10000 12000 14000 16000 18000 7,084 17,620 Mobile Transactions 2015 2016 |
 Strategic Focus - Investment in Technology YOY Growth: 60% 0 5000 10000 15000 20000 25000 30000 16,978 27,128 Online Banking Transactions 17,039 24,380 10000 12000 14000 16000 18000 20000 22000 24000 26000 Online Banking Users 2015 2016 YOY Growth: 43% |
 Strategic Focus - Investment in Technology • Data Security Products/Services – Positive Pay/ACH Debit Blocker – Trusteer – Multi factor authentication and out of wallet – Security token – Required password complexity • Data Security Internal Practices – Outgoing wire call back procedures – Annual vulnerability assessments and training – Internal cyber threat exercise to determine top cyber threats to banks and
remediation |
 Future Focus – Growing Deposits • 2016 Initiative • Huntington/First Merit disruption • Loan/Deposit ratio 72.50% 74.09% 85.94% 88.93% 92.04% 50.00% 60.00% 70.00% 80.00% 90.00% 100.00% 12/31/14 3/31/15 6/30/15 9/30/15 12/31/15 Loan/Deposit Ratio |
 Carl D. Culp Executive Vice President Chief Financial Officer |
 Financial Overview • Strong capital position – 8.5% tangible common equity ratio • Experienced senior management team – Over 300 years of combined experience – 134 with Farmers 12/31/15 12/31/14 Assets $1.87 billion $1.14 billion Total loans $1.30 billion $663.90 million Total deposits $1.41 billion $915.70 million |
 • Improving net interest margin – Low cost core deposit funding – Shift in asset mix from securities to loans Historical Operating Results Net Interest Income and Margin $18,000 20 $16,000 $14,000 $12,000 $10,000 $8,000 $6,000 $4,000 $2,000 4.05% 4.00% 3.95% 3.90% 3.85% 3.80% 3.75% 3.70% 3.65% 3.60% 3.55% 3.50% $9,243 $8,992 $9,749 $14,538 $16,458 3.63% 3.64% 3.66% 3.84% 3.99% 4Q 2014 1Q 2015 2Q 2015 3Q 2015 4Q 2015 Net Interest Income Net Interest Margin |
 21 Continued Strong Results – 2015 Overview 2015 2014 % Increase (Decrease) Net income per share $0.36 $0.48 (25.00%) Net income per share, excluding merger costs $0.57 $0.48 18.75% Noninterest income $18,306 $15,303 19.62% Net interest income $49,737 $36,336 36.88% Efficiency ratio 75.26% 70.24% 7.15% Efficiency ratio, excluding merger costs 66.20% 70.24% (5.75%) Total loans $1,296,865 $663,852 95.35% Nonperforming assets to total assets 0.61% 0.76% (19.74%) |
 • Wealth Management creates fee-based income – Fee Income 2009: 14.5% of total gross income o Noninterest income excluding security gains – Fee Income 2015: 25.2% of total gross income o Noninterest income excluding security gains Non Interest Income 22 74.7% 9.8% 8.6% 2.4% 3.0% 1.5% Total Revenue 2015*: $72.0 million Total Interest Income Other Non-interest Income Trust Income Insurance & Investment Income Retirement Planning Income Mortgage Banking Income |
 23 Loan Growth YOY Growth: 5.26% $- $200,000 $400,000 $600,000 $800,000 $1,000,000 $1,200,000 $1,400,000 12/31/2012 12/31/2013 12/31/2014 12/31/2015 $586,592 $630,684 $663,852 $430,000 $66,000 Total Loans Farmers Total Loans NBOH Acquistion TSOH Acquisition YOY Growth: 7.52% YOY Growth: 95.35% Organic Growth:20.00 % Growth from Acquisitions: 75.02% $1,296,865 $800,865 |
 24 • Diverse loan mix • No national lending • No sub-prime lending • Farmers’ practice is to lend primarily within its market area • Less than 2% of loan portfolio is participations purchased • Less than 4% of loan portfolio is construction loans Loan Portfolio Mix – December 31, 2015 Overview of Loan Portfolio Note: Dollars in thousands Commercial Construction $31,671 2.4% Residential Construction $15,251 1.2% Consumer $185,077 14.3% Commercial & Industrial $230,748 17.8% Commercial Real Estate $454,302 35.0% Residential Real Estate $379,816 29.3% |
 25 Excellent Asset Quality Note: Dollars in millions; Asset quality ratios exclude troubled debt restructuring
12/31/2015
Nonaccrual loans
$9.1
Accruing loans past due 90 days or more
1.4
OREO
0.9
Total nonperforming assets (NPAs)
$11.4
NPLs & 90 days past due/Gross loans (excl.
HFS) 0.81%
NPAs/Total Assets
0.61%
TDR/Gross loans (excl. HFS)
0.72%
30-89 days delinquent/Gross loans (excl.
HFS) 0.70%
ALL/NPLs & 90 days past due
85.96%
ALL/Gross loans (excl. HFS)
0.69%
Texas
Ratio
6.48%
Nonaccrual Loans by Type
Nonaccrual
$9.1mm
79.5%
Accruing
loans past
due 90 days
or more
$1.4mm
12.2%
OREO
$0.9mm
8.3%
Commercial
Real Estate
42.8%
Residential
Real Estate
34.4%
Commercial
& Industrial
17.8%
Consumer
5.0% |
 26 Continued Strong Results – Overview of 1Q 2016 • 22% organic annual loan growth since March 31, 2015
• 133 consecutive quarters of profitability • Net income for quarter ended March 31, 2016 was $4.8 million
compared to $3.2 million for the linked quarter, on a
per share basis net income was $0.18 and
$0.12 for the two quarters •
Annualized return on assets was 1.03% for the first
quarter •
Noninterest income increased 22.5% compared to same
quarter in 2015
• Non-performing assets to total assets remain at low levels, 0.55%
at March 31, 2016 |
 Questions and Answers |