Attached files
| file | filename |
|---|---|
| 8-K - 8-K - BANC OF CALIFORNIA, INC. | d142211d8k.htm |
| EX-99.1 - EX-99.1 - BANC OF CALIFORNIA, INC. | d142211dex991.htm |
 April 21, 2016
2016 First Quarter Earnings
Investor Presentation
Exhibit 99.2 |
 1 1 Forward-looking Statements When used in this presentation and in documents filed with or furnished to the Securities and Exchange Commission (the “SEC”),
or other public shareholder communications, or in oral statements
made with the approval of an authorized executive officer, the words or phrases “believe,” “will,” “should,” “will likely result,” “are expected to,” “will continue,” “is anticipated,” “estimate,” “project,”
“plans,” or similar expressions are intended to identify “forward-looking statements” within the meaning of the Private Securities Litigation Reform Act of 1995. You are cautioned not to place undue reliance on any
forward-looking statements, which speak only as of the date
made. These statements may relate to future financial performance, strategic plans or objectives, revenue, expense or earnings projections, or other financial items of Banc of California Inc. and its affiliates (“BANC,” the “Company,” “we,”
“us” or “our”). By their nature, these statements are subject to numerous uncertainties that could cause actual results to differ materially from those anticipated in the statements. Factors that could cause actual results to differ materially from the results
anticipated or projected include, but are not limited to, the following: (i) risks that the Company’s acquisitions and dispositions, including the acquisitions of branches from Banco Popular, The Private Bank of California,
and CS Financial, Inc., and the acquisition and disposition of
The Palisades Group, may disrupt current plans and operations, the potential difficulties in customer and employee retention as a result of those transactions and the amount of the costs, fees, expenses and charges related to those transactions; (ii) the credit risks of
lending activities, which may be affected by further
deterioration in real estate markets and the financial condition of borrowers, may lead to increased loan and lease delinquencies, losses and nonperforming assets in our loan portfolio, and may result in our allowance for loan and lease losses not being adequate to cover actual
losses and require us to materially increase our loan and lease
loss reserves; (iii) the quality and composition of our securities and loan portfolios; (iv) changes in general economic conditions, either nationally or in our market areas; (v) continuation of the historically low short-term interest rate environment, changes in
the levels of general interest rates, and the relative
differences between short- and long-term interest rates, deposit interest rates, our net interest margin and funding sources; (vi) fluctuations in the demand for loans and leases, the number of unsold homes and other properties and fluctuations in commercial and residential real estate
values in our market area; (vii) results of examinations of us by
regulatory authorities and the possibility that any such regulatory authority may, among other things, require us to increase our allowance for loan and lease losses, write-down asset values, increase our capital levels, or affect our ability to borrow funds or
maintain or increase deposits, which could adversely affect our
liquidity and earnings; (viii) legislative or regulatory changes that adversely affect our business, including changes in regulatory capital or other rules; (ix) our ability to control operating costs and expenses; (x) staffing fluctuations in response to product demand or the
implementation of corporate strategies that affect our work force
and potential associated charges; (xi) errors in our estimates in determining fair value of certain of our assets, which may result in significant declines in valuation; (xii) the network and computer systems on which we depend could fail or experience a security breach;
(xiii) our ability to attract and retain key members of our
senior management team; (xiv) costs and effects of litigation, including settlements and judgments; (xv) increased competitive pressures among financial services companies; (xvi) changes in consumer spending, borrowing and saving habits; (xvii) adverse changes in the
securities markets; (xviii) earthquake, fire or other natural
disasters affecting the condition of real estate collateral; (xix) the availability of resources to address changes in laws, rules or regulations or to respond to regulatory actions; (xx) inability of key third-party providers to perform their obligations to us;
(xxi) changes in accounting policies and practices, as may be
adopted by the financial institution regulatory agencies or the Financial Accounting Standards Board or their application to our business or final audit adjustments, including additional guidance and interpretation on accounting issues and details of the implementation of new
accounting methods; (xxii) war or terrorist activities; and
(xxiii) other economic, competitive, governmental, regulatory, and technological factors affecting our operations, pricing, products and services and the other risks described in this report and from time to time in other documents that we file with or furnish to the SEC. You should
not place undue reliance on forward-looking statements, and
we undertake no obligation to update any such statements to reflect circumstances or events that occur after the date on which the forward-looking statement is made. |
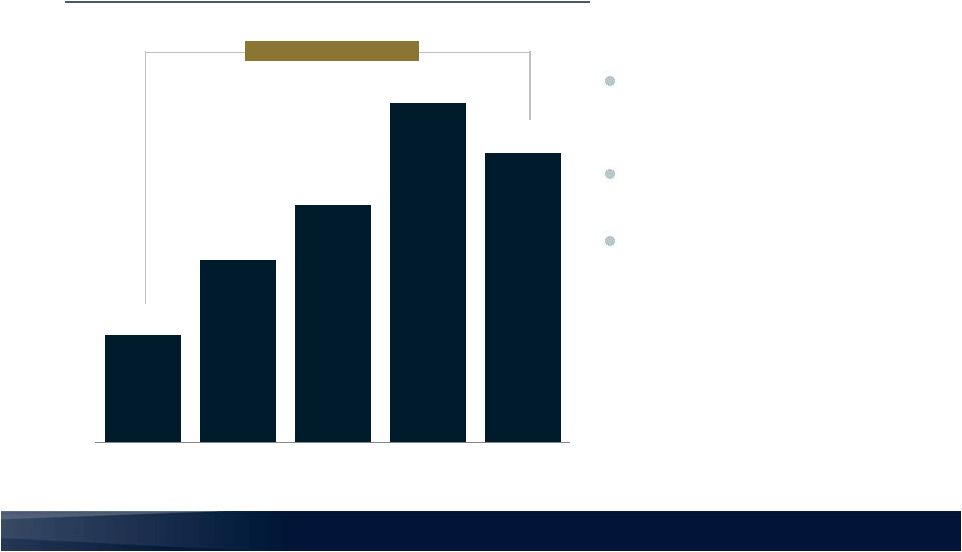
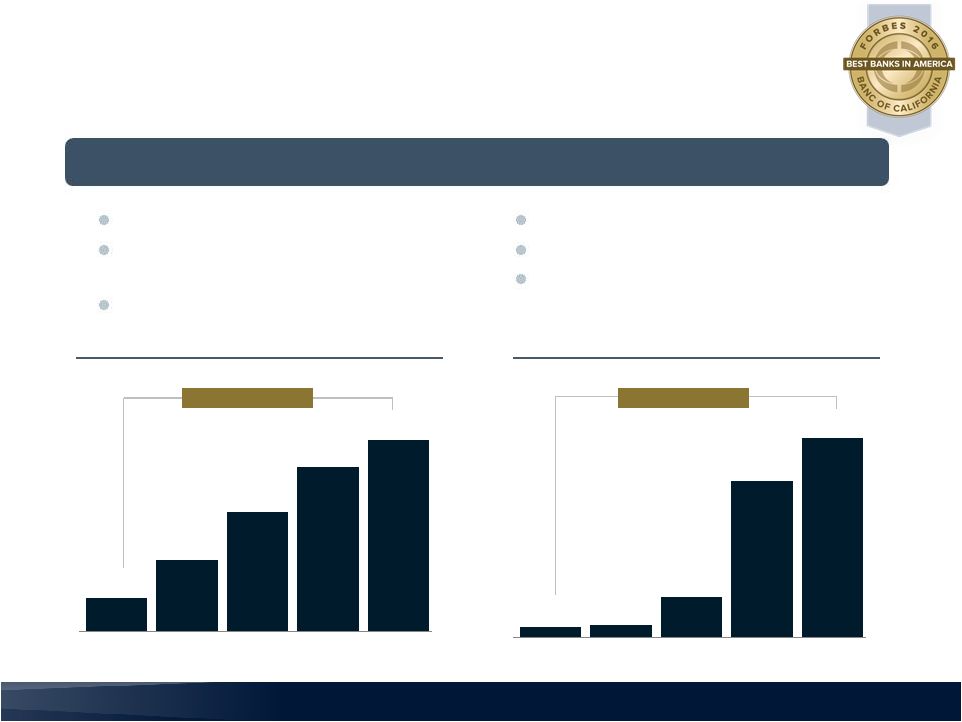 2 2 $6.5 $7.9 $26.5 $104.3 $132.5 FY 2012 FY 2013 FY 2014 FY 2015 1Q16 $1.7 $3.6 $6.0 $8.2 $9.6 YE 2012 YE 2013 YE 2014 YE 2015 1Q16 Banc of California Franchise Value Accelerating $9.6 billion in Assets Record $278 million noninterest- bearing deposit growth in 1Q16 All organic growth since YE2014 CAGR +71% CAGR +113% 1 #1 Total Shareholder Return of all banks on 2016 Forbes Top 100 Banks List from January 1, 2015 to March 31, 2016
2 Dollars in billions 3 Dollars in millions
14.5% ROATCE 1Q16
0.9% ROAA 1Q16
#1 Performing Bank Stock Since YE2014
Pretax Income 3 Total Assets 2 Banc of California winning market share and top talent Annualized 1 |
 3 3 $0.29 $0.32 $0.29 $0.39 $0.36 1Q15 2Q15 3Q15 4Q15 1Q16 $22.1 $27.4 $23.8 $31.0 $33.0 1Q15 2Q15 3Q15 4Q15 1Q16 0.9% 1.0% 0.9% 1.0% 0.9% 1Q15 2Q15 3Q15 4Q15 1Q16 13% 15% 12% 17% 14% 1Q15 2Q15 3Q15 4Q15 1Q16 1 Diluted 2 Dollars in millions 3 Return on Assets and Return on Tangible Common Equity based on average assets and average tangible common equity,
respectively, over stated time periods Track-Record of
Compelling, Sustainable Financial Results Eighth Straight Quarter
Exceeding Analyst Estimates Pretax Income
2 Earnings per Share 1 Return on Tangible Common Equity 3 Return on Assets 3 |
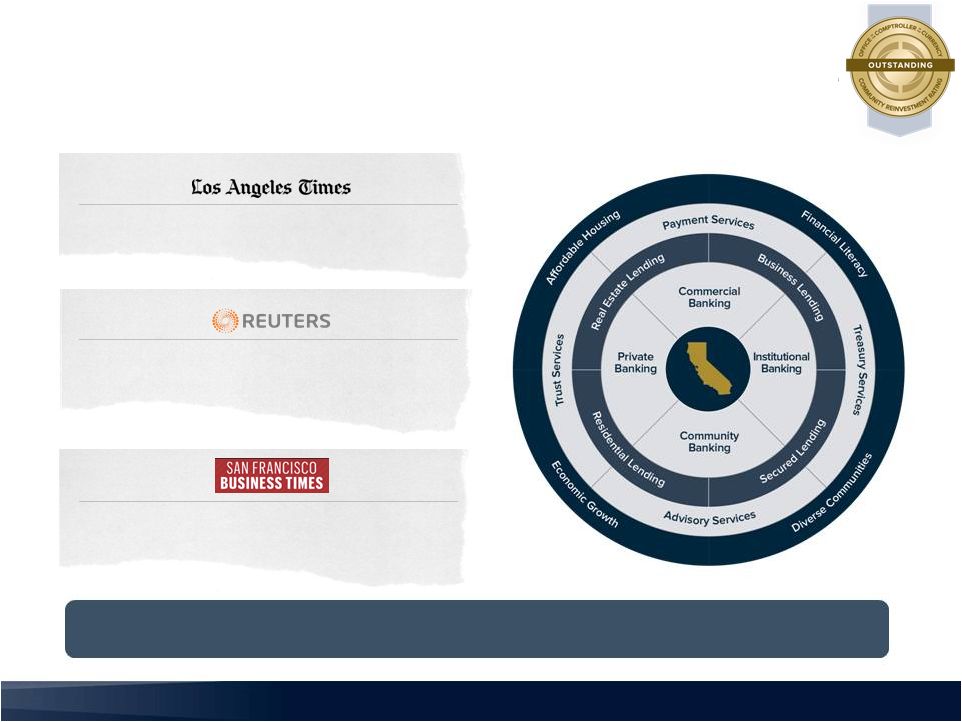 4 4 Banc of California has successfully attracted key employees and teams from
New York and Canadian-based competitors
L.A.’s ‘bank to the stars,’ City National Bank, now under Canadian ownership CIT to buy OneWest Bank for more reliable
funding source
S.F. loses another HQ as
Union Bank’s parent moves to New York California Banking Landscape Increasingly Attractive California Clients and Employees Expressing Preference for California’s Bank |
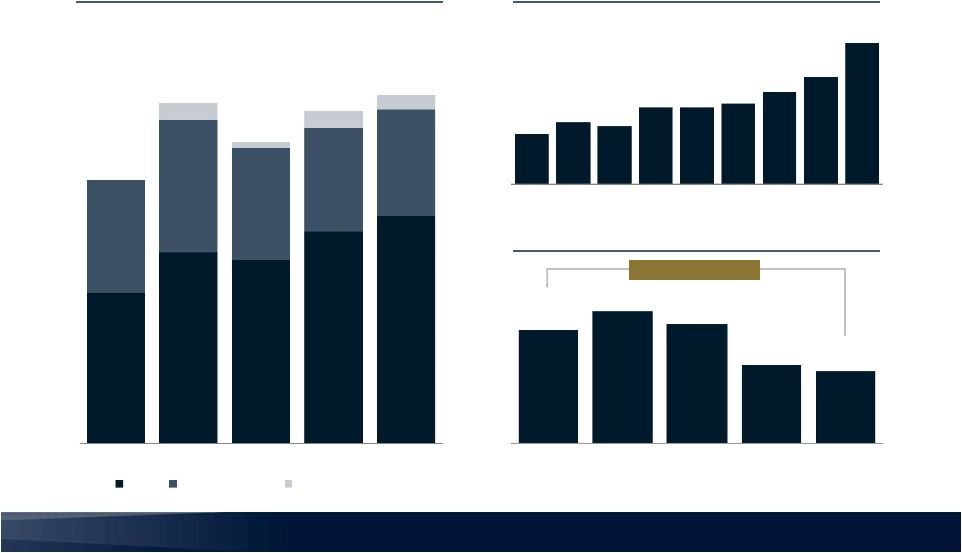
 2016 capital deployment and growth focused on Commercial Banking
segment Mortgage Banking segment impacted by negative valuation
marks on MSR portfolio during 1Q16 Sale of The Palisades Group,
which represented the Financial Advisory Segment, is expected to close in 2Q16. Sale will end reporting of this segment and retains $20+ million in upside to be realized over the next several
years, subject to certain performance-related conditions.
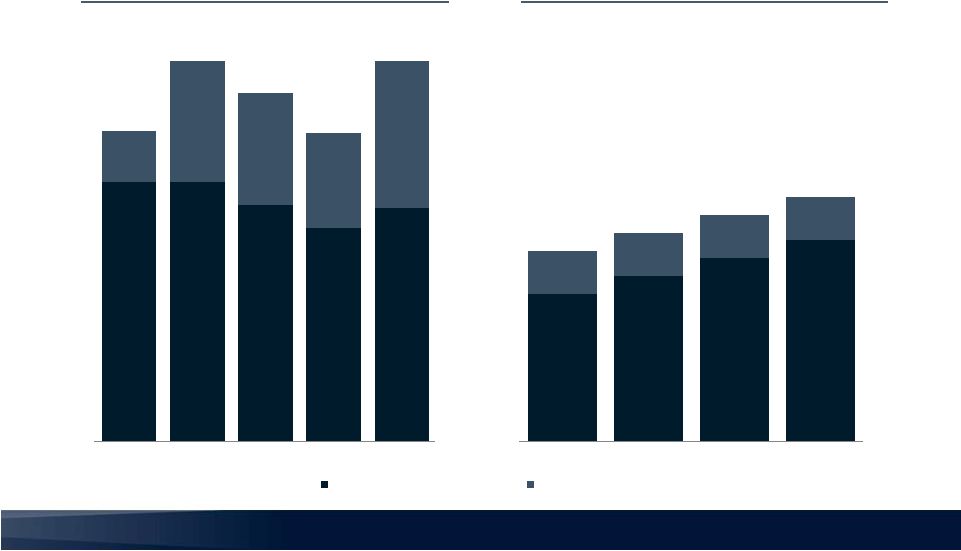
+35% 77% 78% 91% 90% 100% 1Q15 2Q15 3Q15 4Q15 1Q16 Commercial Banking $52.0 $54.1 $55.6 $62.1 $70.4 1Q15 2Q15 3Q15 4Q15 1Q16 Commercial Banking Segment Driving Earnings Strength Mortgage Banking Segment Profits Expected to Accelerate in 2Q/3Q 1 Dollars in millions 2 Business Segment Pretax Income inclusive of intra-company allocations ; excludes
unallocated Corporate / Other interest expense. Mortgage Banking
and Financial Advisory segments reported negative pre-tax income after allocated intra-company expenses for 1Q16. High quality earnings resulting in low earnings volatility with strong financial results
Pretax Income by Business Segment
Net Interest Income
$18.5 $24.7 $25.3 $31.9 $43.8 1 2 5 |
 Noninterest Expense and Productivity
Investments in Scalable Platform Yielding Positive Results
1 Includes Mortgage Banking-related commissions, bonus and loan-related expenses
6 Assets / FTE Noninterest Expense ($ in millions) 1 ($ in millions) Efficiency Ratio -15% $58.3 $64.7 $63.4 $67.9 $70.4 $17.6 $20.6 $17.5 $16.1 $16.5 $2.6 $0.8 $2.7 $2.2 $75.9 $87.9 $81.7 $86.7 $89.1 1Q15 2Q15 3Q15 4Q15 1Q16 Base Volume-Related Acquisition/Non-core $3.3 $3.6 $3.5 $4.0 $4.0 $4.1 $4.4 $4.8 $5.7 1Q14 2Q14 3Q14 4Q14 1Q15 2Q15 3Q15 4Q15 1Q16 86% 92% 88% 75% 73% FY 2012 FY 2013 FY 2014 FY 2015 1Q16 |
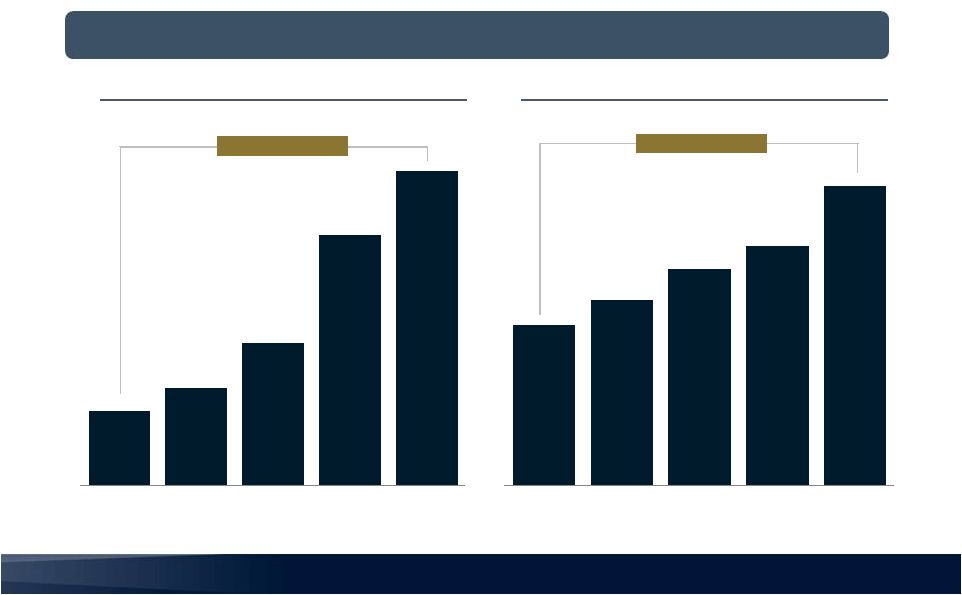 7 7 ($ in billions) Deposit Growth Driven by Deepening Client Relationships Non-Interest Bearing Deposit Growth Evidence of Strengthening Relationships
$4.9 $5.1 $5.4 $6.3 $6.8 1Q15 2Q15 3Q15 4Q15 1Q16 $0.7 $0.9 $1.0 $1.1 $1.4 1Q15 2Q15 3Q15 4Q15 1Q16 +41% +87% Noninterest-bearing Deposits Total Deposits ($ in billions) Record quarterly noninterest-bearing deposit growth of $278 million |
 $495 $629 $729 $914 $823 1Q15 2Q15 3Q15 4Q15 1Q16 Commercial Banking Segment Loan Production Strong Commercial Banking Loan Production On Track to Achieve 2016 Target for Total Annual Loan Production ($ in millions) +66% Commercial Banking segment yield of 4.2% on new loans in 1Q16 Mortgage Banking Segment production over $1 billion in 1Q Management guidance for 2016 total loan production of over $8 billion with approximately $2.5 billion from Commercial Banking Segment 8 |
 5.1% 5.8% 6.4% 7.0% 1.5% 1.5% 1.5% 1.5% 6.6% 7.3% 7.9% 8.5% 2016 2017 2018 2019 9.0% 9.0% 8.2% 7.4% 8.1% 1.8% 4.2% 3.9% 3.3% 5.1% 10.8% 13.2% 12.1% 10.7% 13.2% 1Q15 2Q15 3Q15 4Q15 1Q16 Common Equity Tier 1 (CET1) Additional Tier 1 Capital Ratios Continue to Exceed Basel III Guidelines Capital Structure Focused on Total Tier 1 Eligible Capital BASEL III Capital Requirements BANC Capital Ratios 9 |
 Asset Quality Remains Strong and Stable
1Q 2015 2Q 2015 3Q 2015 4Q 2015 1Q 2016 % Change YoY NPAs / Assets 0.71% 0.66% 0.62% 0.56% 0.46% (35%) NPAs / Equity 8.4% 6.7% 7.0% 7.1% 5.1% (39%) ALLL / NPLs 69% 81% 77% 79% 81% 17% ALLL / Total Loans 0.75% 0.78% 0.74% 0.69% 0.66% (12%) ALLL and Discount / Total Loans 3.27% 2.94% 2.65% 2.66% 2.47% (24%) 10 |
 11 11 Implications for BANC Reduction in debit card interchange revenue FDIC Fees/Surcharge Durbin Amendment Stress Testing (DFAST) Consumer Financial Protection Bureau (CFPB) Addition of CFPB as regulator Focused on consumer protection and UDAAP compliance Required annual stress testing covering credit, PPNR, liquidity and capital Revised assessment framework for FDIC insurance assessment fees Regulatory Changes Threshold for qualifying banks based on prior year-end balance sheet.
Limited current debit card revenue; Durbin impact as a tax on future
growth
Credit risk analytics team already in place running stress testing of
portfolio
BANC has run enterprise stress testing program for the 2+ years
Limited expenses projected for DFAST compliance; primarily related to
one time items
Robust compliance risk assessment and program in place today with
comprehensive compliance testing
Likely to result in increased budget for examination and regulatory
expenses
De minimis ongoing impact from large bank FDIC assessment formula
Limited impact from FDIC special assessment passed in 2015 which is
expected to sunset in 2018. Impacts only deposits in excess of
$10 billion with an estimated surcharge of 4.5 bps.
BANC Well-Prepared to Cross $10 Billion in Assets
Organic Growth Continues to be Highly Accretive Inclusive of Regulatory
Considerations Board and Governance
Additional Board and Governance Policies and
Responsibilities under multiple regulations
Increased Board and Governance responsibilities will increase Board,
Enterprise risk and governance responsibilities and require
increased resources and budget during transition
period |
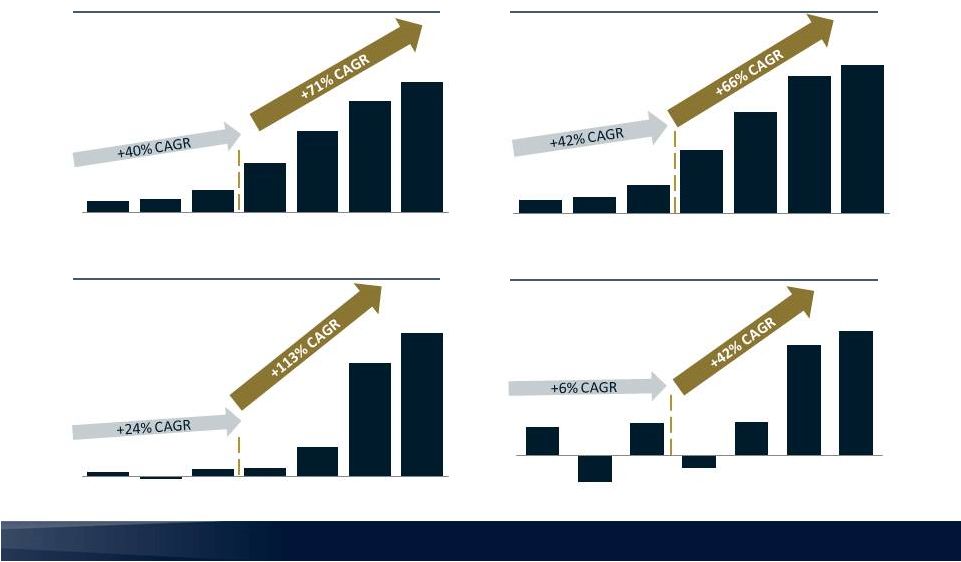 Accelerating Results Under Current Leadership
Platform and Infrastructure Investments Leading to Increased Long-term Value
Creation 1
Dollars in billions 2 Dollars in
millions 3 Diluted 4
Normalized to assume full 40% tax rate 12
Deposits Earnings per Share Assets 4 2016 Guidance ($3) Annualized $0.9 $1.0 $1.7 $3.6 $6.0 $8.2 $9.6 2010 2011 2012 2013 2014 2015 1Q16 $0.6 $0.8 $1.3 $2.9 $4.7 $6.3 $6.8 2010 2011 2012 2013 2014 2015 1Q16 $3.9 $6.5 $7.9 $26.5 $104.3 $132.5 2010 2011 2012 2013 2014 2015 1Q16 $(0.31) $(0.15) $1.60+ $0.35 $0.39 $0.41 $1.34 2010 2011 2012 2013 2014 2015 1 1 3 Pretax Income 2 |
 13 13 2016 Guidance Implies Continued Outperformance Maintaining ROATCE and ROAA with Strong Balance Sheet Growth To Yield 15%+ EPS Growth in 2016
Metric FY 2016 ROATCE 15% ROAA 1%+ Efficiency Ratio 65% - 70% Total Assets $10 - $11 billion Earnings Per Share $1.60+ Management expects total assets to exceed $10 billion during 2016 based on current
market conditions
Management expects to be subject to DFAST requirements beginning in
2018 1
Excluding expenses related to capital transactions
Q2 redemption of senior notes is expected to result in $2 -$3 million of
expenses related to capital transactions during the period
1 |