Attached files
| file | filename |
|---|---|
| 8-K - SHENANDOAH TELECOMMUNICATIONS COMPANY 8-K 4-19-2016 - SHENANDOAH TELECOMMUNICATIONS CO/VA/ | form8k.htm |
| EX-99.2 - EXHIBIT 99.2 - SHENANDOAH TELECOMMUNICATIONS CO/VA/ | ex99_2.htm |

April 19, 2016 2016 Shareholder Meeting Exhibit 99.1

Management Reports Chris French President and CEO

Safe Harbor Statement This presentation includes “forward-looking statements” within the meaning of Section 27A of the Securities Act and Section 21E of the Securities Exchange Act of 1934, as amended, regarding, among other things, our business strategy, our prospects and our financial position. These statements can be identified by the use of forward-looking terminology such as “believes,” “estimates,” “expects,” “intends,” “may,” “will,” “should,” “could,” or “anticipates” or the negative or other variation of these similar words, or by discussions of strategy or risks and uncertainties. These statements are based on current expectations of future events. If underlying assumptions prove inaccurate or unknown risks or uncertainties materialize, actual results could vary materially from the Company’s expectations and projections. Important factors that could cause actual results to differ materially from such forward-looking statements include, without limitation, risks related to the following: Increasing competition in the communications industry; andA complex and uncertain regulatory environment.A further list and description of these risks, uncertainties and other factors can be found in the Company’s SEC filings which are available online at www.sec.gov, www.shentel.com or on request from the Company. The Company does not undertake to update any forward-looking statements as a result of new information or future events or developments.
Use of Non-GAAP Financial Measures Included in this presentation are certain non-GAAP financial measures that are not determined in accordance with US generally accepted accounting principles. These financial performance measures are not indicative of cash provided or used by operating activities and exclude the effects of certain operating, capital and financing costs and may differ from comparable information provided by other companies, and they should not be considered in isolation, as an alternative to, or more meaningful than measures of financial performance determined in accordance with US generally accepted accounting principles. These financial performance measures are commonly used in the industry and are presented because Shentel believes they provide relevant and useful information to investors. Shentel utilizes these financial performance measures to assess its ability to meet future capital expenditure and working capital requirements, to incur indebtedness if necessary, return investment to shareholders and to fund continued growth. Shentel also uses these financial performance measures to evaluate the performance of its businesses and for budget planning purposes.

Record Financial Results x Revenue Net Income Operating Income x x 2013 2015 2014 Earnings per Share (Diluted)

Earnings Per Share (Diluted) x x
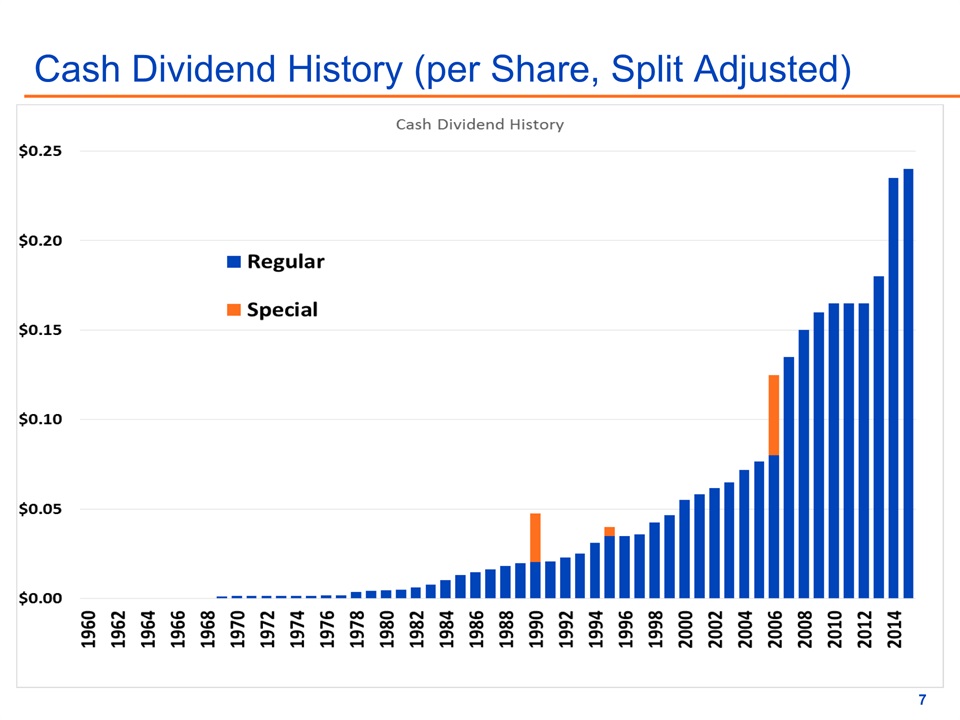
Cash Dividend History (per Share, Split Adjusted) x x

Total Long Term Debt to Assets (in millions) Debt as % of Assets 42% 38% 41% 36% 39% 32%

Operating Income by Segment Wireless Wireline Cable x x x x 2013 2015 2014

Cable Revenue Generating Units (in thousands) (Year End)

Access, Local, and Fiber Lease Revenue (in millions)

Wireless Highlights PCS Customers (000s)

Wireless Expansion

Pro Forma Network Following nTelos Acquisition Shentel Cable Coverage Shentel Coverage Overlap Coverage NTELOS Coverage

Cumulative Total Shareholder Return x
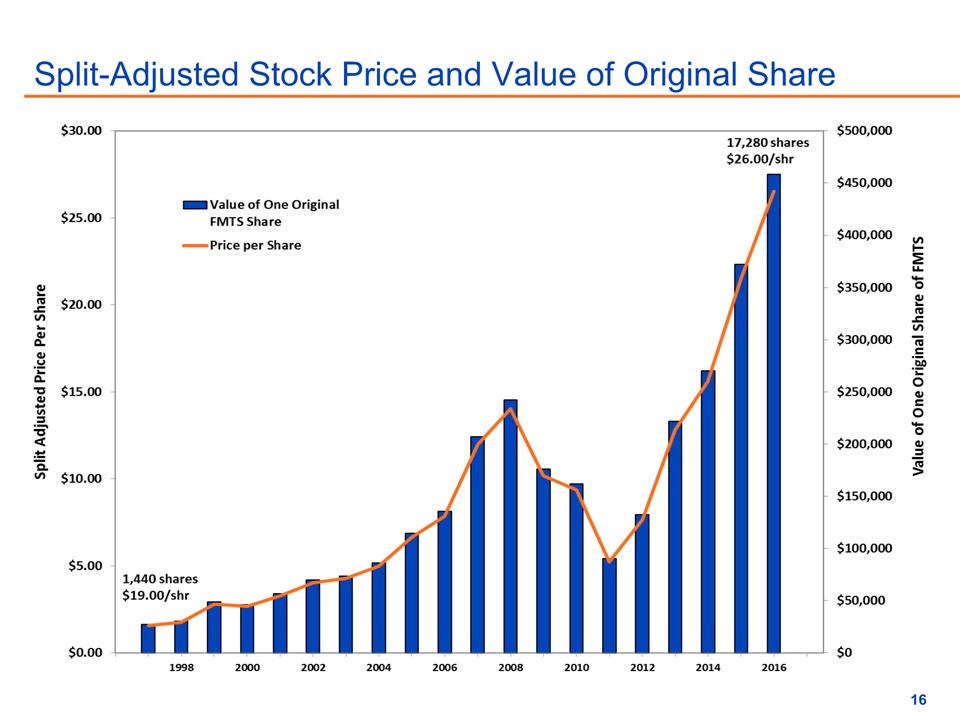
Split-Adjusted Stock Price and Value of Original Share x

Management Reports Adele Skolits VP of Finance and CFO

Mix of External Revenues (in millions) After elimination of affiliate revenues the total revenues for 2013, 2014, and 2015 were $308.9, 326.9, and $342.5, respectively. 1

Mix of Operating Expenses (in millions)

Operating Income (in millions)
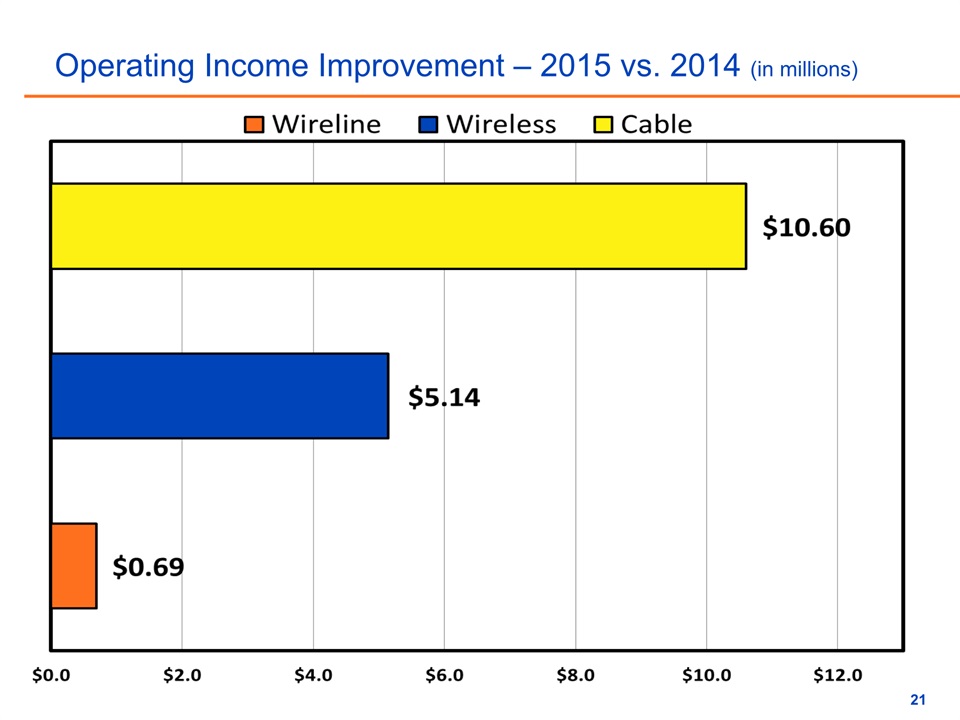
Operating Income Improvement – 2015 vs. 2014 (in millions)

Pro Forma External Revenues (in millions) Actual 2015 for Shentel and nTelos (Western Markets). For illustrative purposes only. Not indicative of future results.

Net Transaction Consideration (in millions) As of December 31, 2015.Adjusted Operating Income Before Depreciation and Amortization as reported in the 10K’s of both organizations.

Pro Forma Capitalization – As of 12/31/15 (in millions) Assets Debt

Management Reports Earle MacKenzie EVP and COO
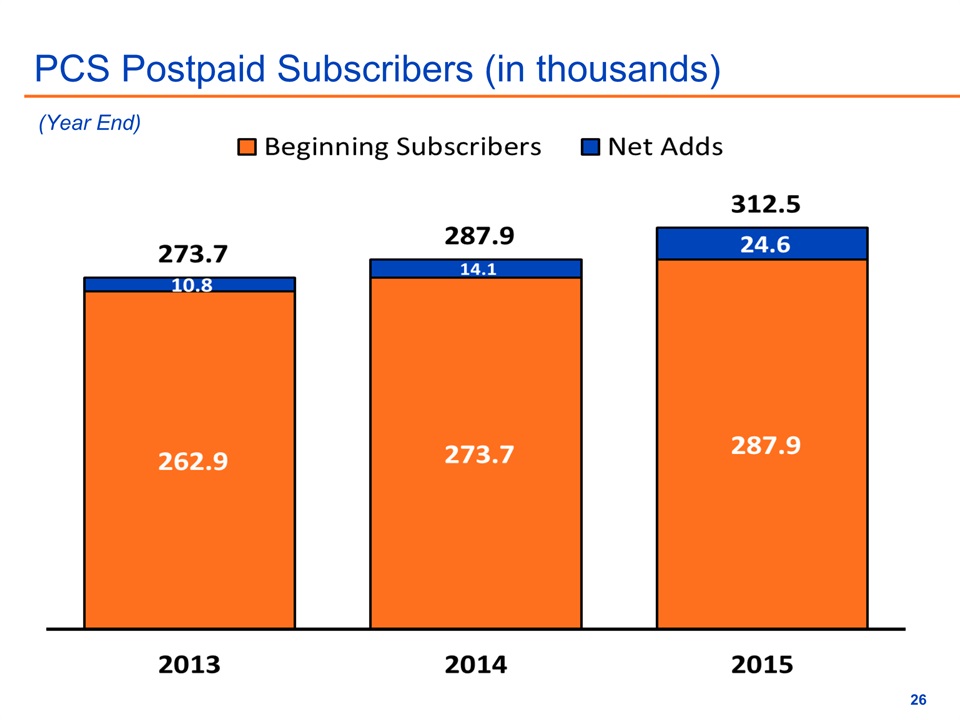
PCS Postpaid Subscribers (in thousands) (Year End)

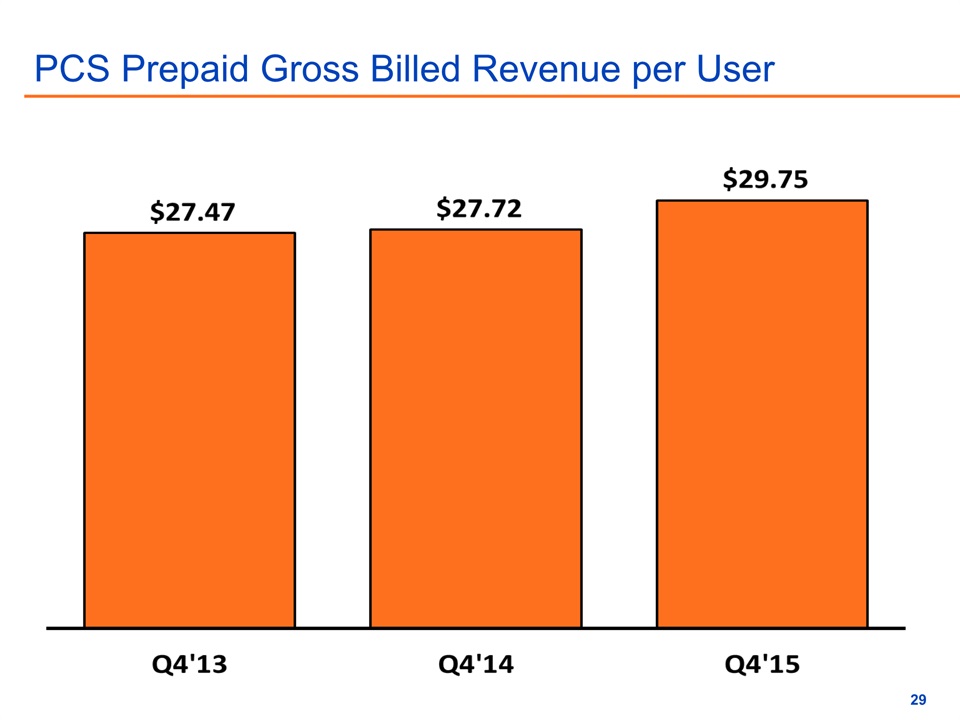
PCS Postpaid Gross Billed Revenue per User

PCS Prepaid Subscribers (in thousands) (Year End)
PCS Prepaid Gross Billed Revenue per User

How Does Shentel’s Wireless Compare? * Total Subs includes Wholesale Subscribers and Connected Device data plans.
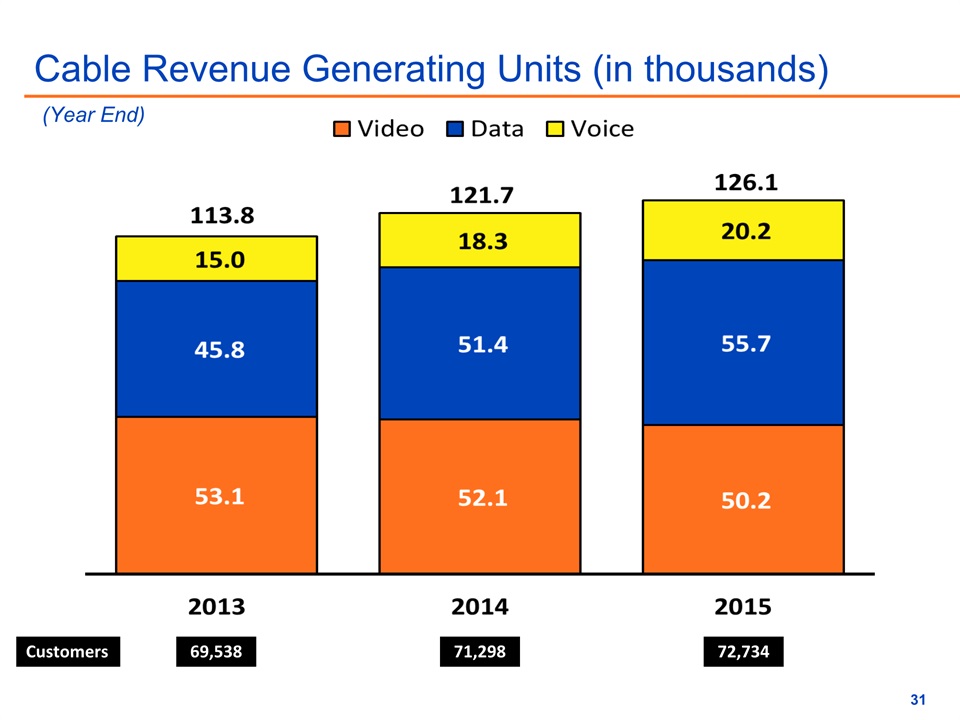
Cable Revenue Generating Units (in thousands) x Customers 72,734 69,538 71,298 (Year End)

Cable Average Monthly Revenue per Customer

How Does Shentel Cable Compare? * Note: Information for Industry and Peer Averages from SNL Kagan as of 12/31/15. Selections for the peer group include peers with numbers of homes passed similar to that of Shentel. (Year End)

Wireline Customers (Year End)
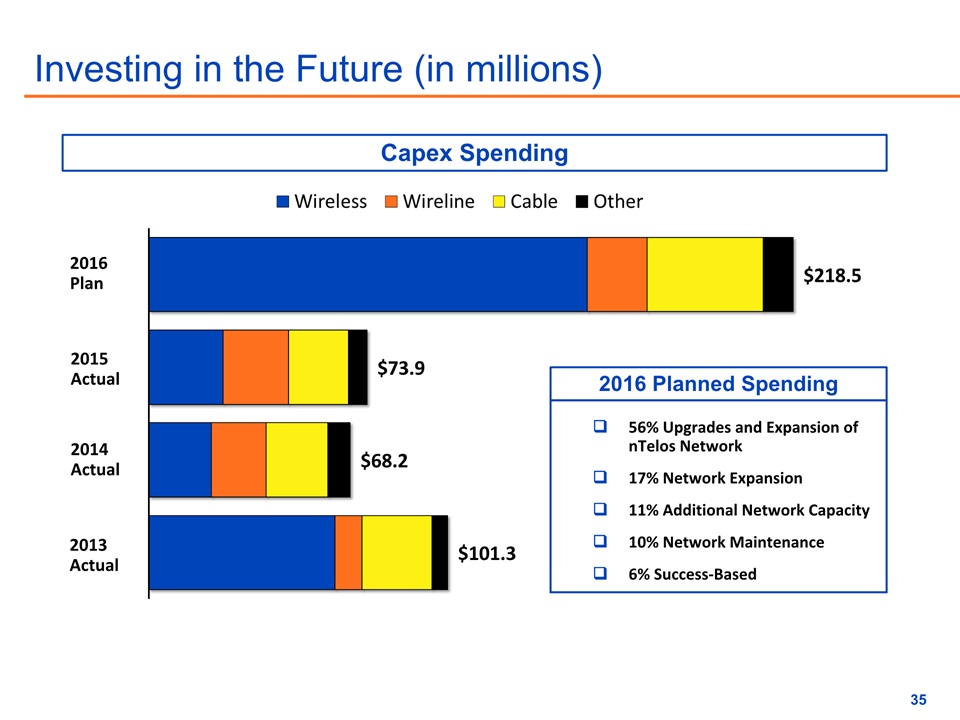
Investing in the Future (in millions) Capex Spending 56% Upgrades and Expansion of nTelos Network17% Network Expansion11% Additional Network Capacity10% Network Maintenance6% Success-Based 2016 Plan 2015 Actual 2014 Actual 2016 Planned Spending 2013 Actual

Pro Forma Footprint Shentel Fiber Routes Shentel POP Shentel Leased Routes Shentel Planned Routes Shentel Coverage Shentel Master Headend Overlap Coverage NTELOS Coverage Shentel Cable Coverage Planned Shentel POP Internet POP

Pro Forma Operating Statistics as of 12/31/15 Cell Sites 552 1,008 NA 1,411 Market POPs (000’s) 2,433 4,400 4,400 5,449 Covered POPs (000’s) 2,224 3,100 3,100 4,283 % Coverage 91% 70% 70% 79% Postpaid Subs (000’s) 313 233 190 736 Prepaid Subs (000’s) 143 69 88 300 Total Subs (000’s) 455 302 278 1,035 Penetration % 20.5% 9.7% 9.0% 24.1% Employees 700 300 60 1,060 SHENTELPro Forma Represents Western Markets only.Represents Sprint customers within the market governed by the revised Affiliate Agreement. POPs totals include areas that overlap current Shentel markets.After the elimination of 149 redundant sites. 1 2 4 3 3 3 3

April 19, 2016 2016 Shareholder Meeting