Attached files
| file | filename |
|---|---|
| 8-K - 8-K - HOOPER HOLMES INC | form8k040116.htm |
| EX-99.3 - EXHIBIT 99.3 - HOOPER HOLMES INC | exhibit993sparelease.htm |
| EX-99.2 - EXHIBIT 99.2 - HOOPER HOLMES INC | q42015earningspresentati.htm |
| EX-99.1 - EXHIBIT 99.1 - HOOPER HOLMES INC | exhibit991earningsrelease.htm |

1 Hooper Holmes, Inc. March, 2016 2016-03 Corporate Overview Presented By: Henry Dubois, Chief Executive Officer

2 Safe Harbor Statement 2 This presentation contains forward-looking statements, as such term is defined in the Private Securities Litigation Reform Act of 1995, concerning the Company’s plans, objectives, goals, strategies, future events or performances, which are not statements of historical fact and can be identified by words such as: “expect,” “continue,” “should,” “may,” “will,” “project,” “anticipate,” “believe,” “plan,” “goal,” and similar references to future periods. The forward-looking statements contained in this presentation reflect our current beliefs and expectations. Actual results or performance may differ materially from what is expressed in the forward looking statements. Among the important factors that could cause actual results to differ materially from those expressed in, or implied by, the forward-looking statements contained in this presentation are our ability to realize the expected benefits from the acquisition of Accountable Health Solutions and our strategic alliance with Clinical Reference Laboratory; our ability to successfully implement our business strategy and integrate Accountable Health Solutions’ business with ours; our ability to retain and grow our customer base; our ability to recognize operational efficiencies and reduce costs; uncertainty as to our working capital requirements over the next 12 to 24 months; our ability to maintain compliance with the financial covenants contained in our credit facilities; the rate of growth in the Health and Wellness market and such other factors as discussed in Part I, Item 1A, Risk Factors, and Part II, Item 7, Management’s Discussion and Analysis of Financial Conditions and Results of Operations of our Annual Report on Form 10-K for the year ended December 31, 2014. The Company undertakes no obligation to update or release any revisions to these forward-looking statements to reflect events or circumstances, or to reflect the occurrence of unanticipated events, after the date of this presentation, except as required by law. This presentation contains information from third-party sources, including data from studies conducted by others and market data and industry forecasts obtained from industry publications. Although the Company believes that such information is reliable, the Company has not independently verified any of this information and the Company does not guarantee the accuracy or completeness of this information. Any references to documents not included in the presentation itself are qualified by the full text and content of those documents. During our prepared comments or responses to your questions, we may offer incremental metrics to provide greater insight into the dynamics of our business or our quarterly results, such as references to EBITDA and other measures of financial performance. Please be advised that this additional detail may be one-time in nature and we may or may not provide an update in the future. These and other financial measures may also have been prepared on a non-GAAP basis. For some of these measures, a reconciliation schedule showing GAAP versus non-GAAP results has been provided in our press release that was issued after the market closed today.

Hooper Holmes Overview 3 Health & Wellness Annual Sales (in millions) Hooper Holmes focuses on providing health risk assessment services to the Health & Wellness Industry 116 Year-old Start-up Positioned to Grow Health & Wellness segment started in 2007 History of annual Health & Wellness revenue growth Compelling market dynamics and opportunities Major restructuring activities completed Ended 2015 with record Health & Wellness Revenues and significant reduction in net adjusted EBITDA loss Infrastructure created to be EBITDA positive in 2016 $5 $8 $11 $14 $18 $21 $24 $29 $32 0 5 10 15 20 25 30 35

Turnaround Activities Completed to Build Value 4 2013 – 2014 Sold Non Core Businesses 2014 Adjusted Cost Base 2015 Acquired AHS 2015 H&W Focus 2013 New Management Team 2016 Profitable EBITDA Growth

Expanded Leadership Team Focused on Health & Wellness 5 Henry E. Dubois - President and Chief Executive Officer (April 2013) • As Partner at Tatum, LLC, consulted with Hooper Holmes’ Board and management on strategies to improve growth • Experienced in helping businesses accelerate performance and create shareowner value • International business leader: C-suite officer with multinational technology and communications companies - several in Asia Pacific • Former consultant with Booz and Company; began career as internal auditor and finance supervisor for Exxon Steven R. Balthazor - Chief Financial Officer (August 2015) • Senior consultant, providing executive management and hands-on business services to public and private companies • Vice President of Finance for Digital Globe (NYSE: DGI) • Vice President of Finance and interim CFO for Geo Eye, Inc. . John Bond - Vice President of Provider Relations (July 2012) • Leader in developing health professional networks • Local and national recruiting expert • Developed provider networks for Tufts Health Plan, Blue Cross and Blue Shield of Vermont and Harvard Pilgrim Health Care Alex B. Thompson - Vice President of Operations (January 2012) • Extensive experience in strategic planning, finance and operational turnarounds • Former Strategic Analyst for Cerner Corporation, a leading healthcare IT company • Healthcare-based non-profit experience Neil F. Gordon, MD, PhD, MPH, FACC - Medical Director (February 2015) • Author of eight books on preventive medicine and more than 100 scientific articles in peer-reviewed medical journals • Founder, CEO and chief science officer of INTERVENT International, a provider of evidence-based, lifestyle management and chronic disease risk reduction services Steve Marin - Chief Revenue Officer (October 2015) • 25 years in sales, business development, client service • Former Senior VP of Sales at Chip Rewards, specialists in incentives to increase healthcare participant engagement • Leadership roles with Alere Health & CorSolution Medical Arielle Band - SVP, Health & Wellness Solutions (April 2015) • Former President of Accountable Health Solutions • Expert in payer, behavioral health, wellness, disease management and pharmacy benefit manager markets • Previous assignments at Great-West Healthcare, Cigna Healthcare, UnitedHealthcare and Catamaran

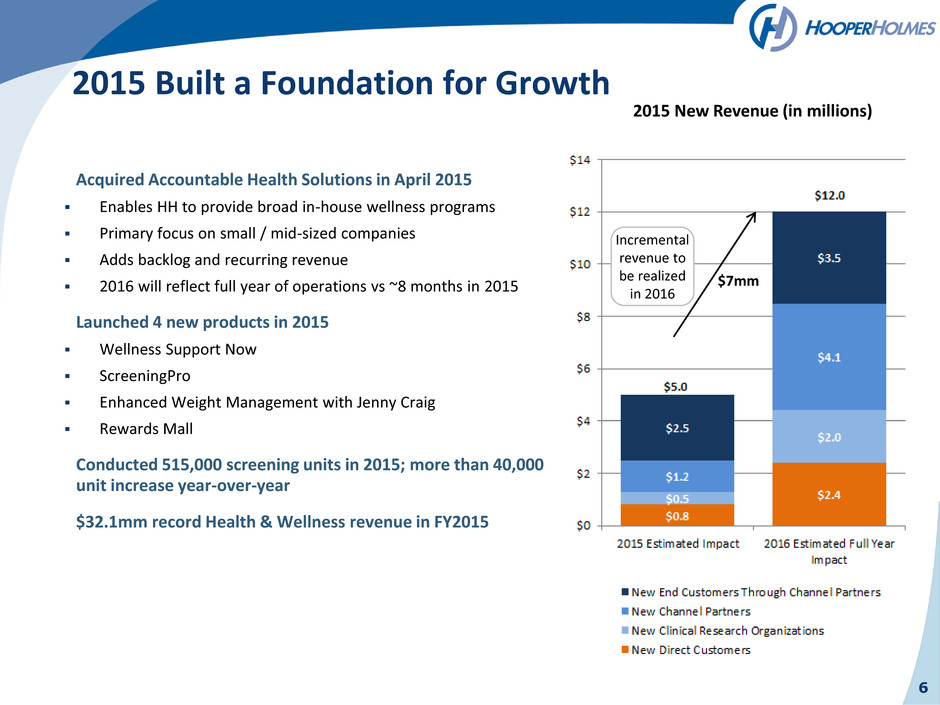
2015 Built a Foundation for Growth Acquired Accountable Health Solutions in April 2015 Enables HH to provide broad in-house wellness programs Primary focus on small / mid-sized companies Adds backlog and recurring revenue 2016 will reflect full year of operations vs ~8 months in 2015 Launched 4 new products in 2015 Wellness Support Now ScreeningPro Enhanced Weight Management with Jenny Craig Rewards Mall Conducted 515,000 screening units in 2015; more than 40,000 unit increase year-over-year $32.1mm record Health & Wellness revenue in FY2015 6 ~ ~ 2015 New Revenue (in millions) Incremental revenue to be realized in 2016 $7mm

7 Momentum Continues to Build New Sales Won in Q1 2016 and Associated Estimated 2016 Revenue ($mm) 2 0 1 6 n ew sal e s re ve n u e in mill io n $ New Direct Customers Estimated $0.5mm in 2016 Contracts are typically multi-year New Clinical Research Organization Revenue Estimated $0.9mm in 2016 Large contract extension estimated at $12.0mm in revenue over the life of the contract, $0.8mm in 2016 New Channel Partners Estimated $1.1mm in 2016 New End Customers Through Existing Channel Partners Estimated $0.9mm in 2016 We are positioned to grow with our Channel Partners $0.5 $0.9 $1.1 $0.9 $3.3 $0 $1 $2 $3 $4 2016 Estimated Revenue Impact Total New End Customers Through Channel Partners New Channel Partners New Clinical Research Organizations

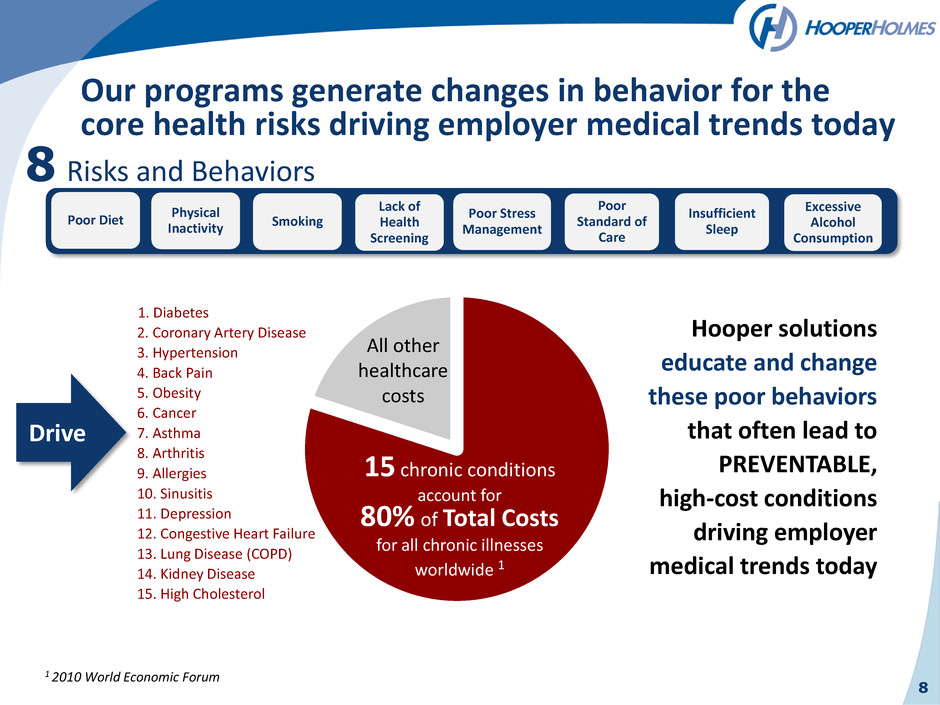
Our programs generate changes in behavior for the core health risks driving employer medical trends today 1 2010 World Economic Forum Poor Diet Physical Inactivity Smoking Lack of Health Screening Poor Stress Management Poor Standard of Care Insufficient Sleep Excessive Alcohol Consumption 8 Risks and Behaviors 1. Diabetes 2. Coronary Artery Disease 3. Hypertension 4. Back Pain 5. Obesity 6. Cancer 7. Asthma 8. Arthritis 9. Allergies 10. Sinusitis 11. Depression 12. Congestive Heart Failure 13. Lung Disease (COPD) 14. Kidney Disease 15. High Cholesterol Hooper solutions educate and change these poor behaviors that often lead to PREVENTABLE, high-cost conditions driving employer medical trends today Drive 8 15 chronic conditions account for 80% of Total Costs for all chronic illnesses worldwide 1 All other healthcare costs

Biometric screenings Clinical research support Mobile data collection Portal activities/msg. Team challenges Rewards mall Incentives Email/direct mail Coaching w/medical sensor plans - future Onsite health coaching Telephonic health coaching Condition management Online content and seminars Health assessment Personal wellness report plans - future 9 Hooper Services Provide End-to-End Integrated Health & Wellness Screening & Data Collection Education Engagement Knowledge Aggregation

10 Why Employers Want Health & Wellness Positive return on every dollar invested Reduced health risks and associated costs Improved employee productivity and morale Attractive employee benefit Investment generates payback

11 Hooper Wellness Programs Get Results Annual healthcare cost reduction of nearly $1.5mm; additional cost savings related to higher productivity, reduced absenteeism, ability to attract and retain top talent, and fewer safety incidents not included $2,680 $5,004 $7,230 $5,952 (Non-Participants) At Start of the Program Risk Transition Two Years Into the Program Low Risk 5,742 (76%) Moderate Risk 1,471 (20%) High Risk 293 (4%) High Risk 183 (3%) Moderate Risk 1,065 (14%) Low Risk 6,258 (83%) Low Risk (n=5,251) Moderate Risk (n=461) High Risk (n=30) Low Risk (n=899) Moderate Risk (n=491) High Risk (n=81) Low Risk (n=108) Moderate Risk (n=113) High Risk (n=72) Average Annual Healthcare Cost Per Employee 7.3% net change in health risk status improvement 91% of the participants that started as a low health risk stayed low health risk

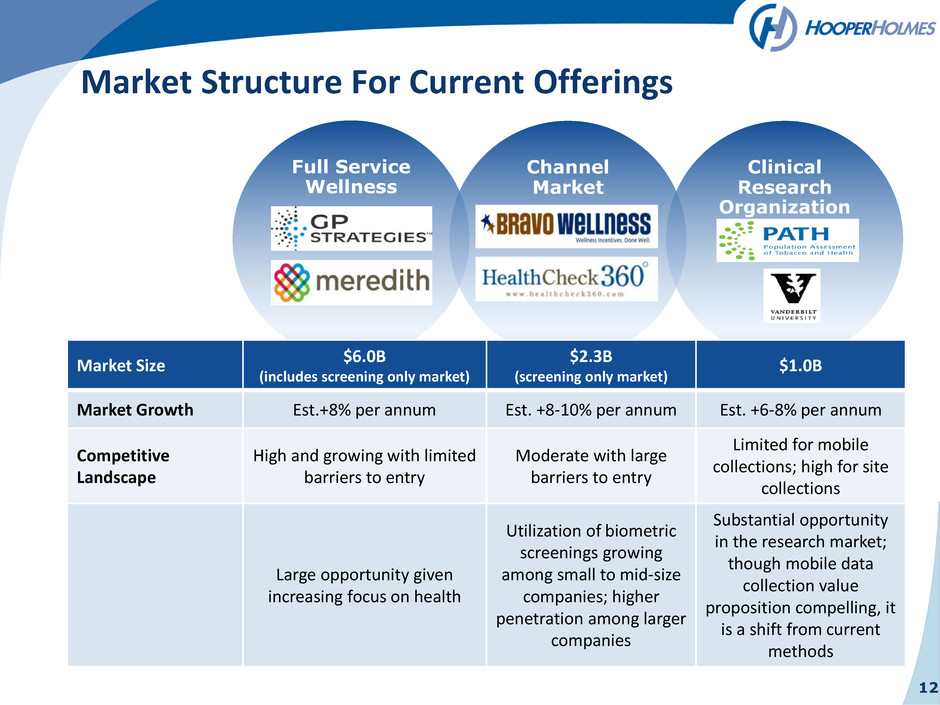
12 Market Structure For Current Offerings Full Service Wellness Channel Market Clinical Research Organization Market Size $6.0B (includes screening only market) $2.3B (screening only market) $1.0B Market Growth Est.+8% per annum Est. +8-10% per annum Est. +6-8% per annum Competitive Landscape High and growing with limited barriers to entry Moderate with large barriers to entry Limited for mobile collections; high for site collections Large opportunity given increasing focus on health Utilization of biometric screenings growing among small to mid-size companies; higher penetration among larger companies Substantial opportunity in the research market; though mobile data collection value proposition compelling, it is a shift from current methods

Data Collection Services Proprietary Screening Services as a Differentiator 13 Bottom line? Higher quality, faster results, greater engagement into the right programs, at the right time

Our Health Professional Network Coverage for every zip code in the U.S. 14 Hooper Nationwide HP Coverage Right People Right Place Right Equipment Right Information Right Time

Education Services 15

Engagement Services 16 Smart Technology & Multi-Modal Engagement Solutions Smart engagement and analytics engine allows for highly targeted, personalized messaging. Professional quality, multi-modal collateral Flexible Incentive Platform with Meaningful Reward Options • Flexible plan designs with leading outcomes-based tools and expertise • Sync with leading apps and devices • Rewards Mall to supplement traditional incentives Corporate Team Challenges Boost participation and good results with a side effect of fun, healthy competition, camaraderie, loyalty, and… you name it! Add BANG and BOOM Participants engage in programs and activities to improve their health Member-specific solutions that are relevant, meaningful and convenient Programs are customizable and can be launched any time of the year

Knowledge Aggregation – Stratifying an employer’s workforce by areas of risk 17 Class-leading business intelligence informatics pinpoints population health risks, measures engagement rates and helps guide recommendations for continued impact and improvement, and more!

Customer & Client Testimonials 18 “A participant called and wanted to personally thank the examiner she saw the day of her screening. She said her first blood pressure reading was extremely high. The examiner sat with her and tried to calm her down. Since that didn’t appear to be working, she left work and went to the doctor immediately. Her physician put her on medication and she had to stay overnight in the hospital. They are now working together to monitor and lower her blood pressure. She shared with us that she feels like the examiner sincerely saved her life.” – Screening participant “The Site Manager and her group did a fantastic job working our event. They were courteous and quick and the professionals everyone wants at their event. Thank you for making our event a true success.” – Channel Partner customer “I want to express my gratitude for your prompt response and professionalism in carrying out exams for my wife and I. We experienced inclement weather in our area and were not certain about the appointment’s status. You were able to confirm the status and the examiner was at our door when most people were operating on delayed schedules. She was very thorough, insightful, and articulate in explaining our exam and the impact wellness screening should have on our overall health. The manner of promptness and professionalism is an area that I personally find lacking in many organizations today. Thanks for your help and professionalism!” – Screening participant “This has been the most well organized, and professionally orchestrated Screening clinic in the history of our onsite program.” – Human Resources Director of a direct customer

19 Q4 2015 Results Set Stage for Accelerated Growth FULL YEAR 2015 HIGHLIGHTS $32.1mm record Health & Wellness revenue 515,000 record screening units Transformed business model, reduced costs New sales in 2015 increased the revenue base for 2016 and beyond Q4 2014 Q4 2015 +42% REVENUE $6.7mm $9.5mm 2016 OUTLOOK Successfully raised $3.5mm in rights offering and an additional $1.2mm from 200 NNH, LLC an affiliate of Kanon Ventures $42.0mm revenue expected for full year with positive EBITDA & operating cash flow for full year Q1 is off to a good start Due to the seasonality of the business, ~60% of revenue historically comes in the second half Repayment of $2.3mm of debt planned in 2016 Q4 2014 Q4 2015 +22% GROSS MARGIN % 16.9% 20.7% Q4 2014 Q4 2015 +20% SCREENING UNITS 127,000 152,000

20 Strengthened Capital Structure Rights Offering Successfully Completed in Q1 2016 ̶ Strong interest and shareholder support ̶ Raised $3.5mm ̶ Board and management as a group over subscribed and now hold ~10% of total shares ̶ 300+ individual shareholders participated Additional Capital Raised in Q1 2016 ̶ 200 NNH, LLC, an affiliate of Kanon Ventures, invested $1.2mm Debt ̶ Repayment of $2.3mm of debt planned for 2016 ̶ Principal payment made in Q1 2016 ̶ Meaningful interest expense reduction with each quarterly payment Cash added through rights offering $3.5mm Cash added from investment by 200 NNH, LLC $1.2mm $7.0mm Revolving Line of Credit $1.5mm at 3/15 (credit line – amount drawn) SWK Term Loan $4.5mm Current Capital Structure Highlights

21 2015 sales wins expected to drive $7.0mm of incremental revenue in 2016 $3.3mm of new 2016 revenue won through sales efforts already this year, including the addition of full service wellness clients Q1 2016 progressing toward annual goal For full year 2016, expecting $42.0mm revenue representing 30% growth as compared to 2015 and continued progress toward achieving our $100mm revenue target Expecting positive EBITDA and operating cash flow for the full year New Sales Financial Growth Building Awareness 2016 Outlook: Accelerated Growth Q4 2015: LD Micro Conference February 22nd: Presented at SeeThruEquity Conference March 31st: Sidoti Emerging Growth Conference Drive Shareholder Value
