Attached files
| file | filename |
|---|---|
| EX-21.1 - EX-21.1 - MOVADO GROUP INC | mov-ex211_6.htm |
| EX-32.1 - EX-32.1 - MOVADO GROUP INC | mov-ex321_9.htm |
| EX-23.1 - EX-23.1 - MOVADO GROUP INC | mov-ex231_7.htm |
| EX-31.1 - EX-31.1 - MOVADO GROUP INC | mov-ex311_12.htm |
| EX-31.2 - EX-31.2 - MOVADO GROUP INC | mov-ex312_10.htm |
| EX-32.2 - EX-32.2 - MOVADO GROUP INC | mov-ex322_11.htm |
UNITED STATES
SECURITIES AND EXCHANGE COMMISSION
Washington, D.C. 20549
FORM 10-K
(Mark one)
|
x |
ANNUAL REPORT PURSUANT TO SECTION 13 OR 15(d) OF THE SECURITIES AND EXCHANGE ACT OF 1934 |
For fiscal year ended January 31, 2016
OR
|
¨ |
TRANSITION REPORT PURSUANT TO SECTION 13 OR 15(d) OF THE SECURITIES EXCHANGE ACT OF 1934 |
For the transition period from to
Commission File Number 1-16497
MOVADO GROUP, INC.
(Exact name of registrant as specified in its charter)
|
New York |
|
13-2595932 |
|
(State or Other Jurisdiction of Incorporation or Organization) |
|
(IRS Employer Identification No.) |
|
|
|
|
|
650 From Road, Ste. 375 Paramus, New Jersey |
|
07652-3556 |
|
(Address of Principal Executive Offices) |
|
(Zip Code) |
Registrant’s Telephone Number, Including Area Code: (201) 267-8000
Securities Registered Pursuant to Section 12(b) of the Act:
|
|
Title of Each Class |
|
|
|
Name of Each Exchange on which Registered |
|
|
Common stock, par value $0.01 per share |
|
New York Stock Exchange |
||||
Indicate by check mark if the registrant is a well-known seasoned issuer, as defined in Rule 405 of the Securities Act. Yes ¨ No x
Indicate by check mark if the registrant is not required to file reports pursuant to Section 13 or Section 15(d) of the Exchange Act. Yes ¨ No x
Indicate by check mark whether the registrant (1) has filed all reports required to be filed by Section 13 or 15(d) of the Securities Exchange Act of 1934 during the preceding 12 months (or for such shorter period that the registrant was required to file such reports), and (2) has been subject to such filing requirements for the past 90 days. Yes x No ¨
Indicate by check mark whether the registrant has submitted electronically and posted on its corporate Web site, if any, every Interactive Data File required to be submitted and posted pursuant to Rule 405 of Regulation S-T during the preceding 12 months (or for such shorter period that the registrant was required to submit and post such files). Yes x No ¨
Indicate by check mark if disclosure of delinquent filers pursuant to Item 405 of Regulation S-K is not contained herein, and will not be contained, to the best of registrant’s knowledge, in definitive proxy or information statements incorporated by reference in Part III of this Form 10-K or any amendment to this Form 10-K. ¨
Indicate by check mark whether the registrant is a large accelerated filer, an accelerated filer, a non-accelerated filer, or a smaller reporting company. See the definitions of “large accelerated filer,” “accelerated filer” and “smaller reporting company” in Rule 12b-2 of the Exchange Act.
|
Large accelerated filer |
|
¨ |
Accelerated filer |
|
x |
|
Non-accelerated filer |
¨ |
|
Smaller reporting company |
|
¨ |
Indicate by check mark whether the registrant is a shell company (as defined in Rule 12b-2 of the Exchange Act). Yes ¨ No x
The aggregate market value of the voting stock held by non-affiliates of the registrant as of July 31, 2015, was approximately $401,887,000 (based on the closing sale price of the registrant’s Common Stock on that date as reported on the New York Stock Exchange). For purposes of this computation, each share of Class A Common Stock is assumed to have the same market value as one share of Common Stock into which it is convertible and only shares of stock held by directors and executive officers were excluded.
The number of shares outstanding of the registrant’s Common Stock and Class A Common Stock as of March 24, 2016, were 16,298,144 and 6,644,105, respectively.
DOCUMENTS INCORPORATED BY REFERENCE
Portions of the definitive proxy statement relating to registrant’s 2016 annual meeting of shareholders (the “Proxy Statement”) are incorporated by reference in Part III hereof.
Statements in this annual report on Form 10-K, including, without limitation, statements under Item 7 “Management’s Discussion and Analysis of Financial Condition and Results of Operations” and elsewhere in this report, as well as statements in future filings by the Company with the Securities and Exchange Commission (“SEC”), in the Company’s press releases and oral statements made by or with the approval of an authorized executive officer of the Company, which are not historical in nature, are intended to be, and are hereby identified as, “forward-looking statements” for purposes of the safe harbor provided by the Private Securities Litigation Reform Act of 1995. These statements are based on current expectations, estimates, forecasts and projections about the Company, its future performance, the industry in which the Company operates and management’s assumptions. Words such as “expects”, “anticipates”, “targets”, “goals”, “projects”, “intends”, “plans”, “believes”, “seeks”, “estimates”, “may”, “will”, “should” and variations of such words and similar expressions are also intended to identify such forward-looking statements. The Company cautions readers that forward-looking statements include, without limitation, those relating to the Company’s future business prospects, projected operating or financial results, revenues, working capital, liquidity, capital needs, plans for future operations, expectations regarding capital expenditures, operating efficiency initiatives and other items, operating expenses, effective tax rates, margins, interest costs, and income as well as assumptions relating to the foregoing. Forward-looking statements are subject to certain risks and uncertainties, some of which cannot be predicted or quantified. Actual results and future events could differ materially from those indicated in the forward-looking statements, due to several important factors herein identified, among others, and other risks and factors identified from time to time in the Company’s reports filed with the SEC, including, without limitation, the following: general economic and business conditions, which may impact disposable income of consumers in the United States and the other significant markets (including Europe) where the Company’s products are sold, uncertainty regarding such economic and business conditions, trends in consumer debt levels and bad debt write-offs, general uncertainty related to possible terrorist attacks, natural disasters, the stability of the European Union and defaults on or downgrades of sovereign debt and the impact of any of those events on consumer spending, changes in consumer preferences and popularity of particular designs, new product development and introduction, the ability of the Company to successfully implement its business strategies, competitive products and pricing, the impact of “smart” watches and other wearable tech products on the traditional watch market, seasonality, availability of alternative sources of supply in the case of the loss of any significant supplier or any supplier’s inability to fulfill the Company’s orders, the loss of or curtailed sales to significant customers, the Company’s dependence on key employees and officers, the ability to successfully integrate the operations of acquired businesses without disruption to other business activities, the continuation of the company’s major warehouse and distribution centers, the continuation of licensing arrangements with third parties, losses possible from pending or future litigation, the ability to secure and protect trademarks, patents and other intellectual property rights, the ability to lease new stores on suitable terms in desired markets and to complete construction on a timely basis, the ability of the Company to successfully manage its expenses on a continuing basis, information systems failure or breaches of network security, the continued availability to the Company of financing and credit on favorable terms, business disruptions, disease, general risks associated with doing business outside the United States including, without limitation, import duties, tariffs, quotas, political and economic stability, changes to existing laws or regulations, and success of hedging strategies with respect to currency exchange rate fluctuations.
These risks and uncertainties, along with the risk factors discussed under Item 1A. “Risk Factors” in this Annual Report on Form 10-K, should be considered in evaluating any forward-looking statements contained in this report or incorporated by reference herein. All forward-looking statements speak only as of the date of this report or, in the case of any document incorporated by reference, the date of that document. All subsequent written and oral forward-looking statements attributable to the Company or any person acting on its behalf are qualified by the cautionary statements in this section. The Company undertakes no obligation to update or publicly release any revisions to forward-looking statements to reflect events, circumstances or changes in expectations after the date of this report.
1
GENERAL
In this Form 10-K, all references to the “Company” or “Movado Group” include Movado Group, Inc. and its subsidiaries, unless the context requires otherwise.
Movado Group designs, sources, markets and distributes fine watches. Its portfolio of brands is currently comprised of Coach® Watches, Concord®, Ebel®, ESQ® Movado, Scuderia Ferrari® Watches, HUGO BOSS® Watches, Juicy Couture® Watches, Lacoste® Watches, Movado®, and Tommy Hilfiger® Watches. The Company is a leader in the design, development, marketing and distribution of watch brands sold in almost every major category comprising the watch industry.
The Company was incorporated in New York in 1967 under the name North American Watch Corporation to acquire Piaget Watch Corporation and Corum Watch Corporation, which had been, respectively, the exclusive importers and distributors of Piaget and Corum watches in the United States since the 1950’s. The Company sold its Piaget and Corum distribution businesses in 1999 and 2000, respectively, to focus on its own portfolio of brands. Since its incorporation, the Company has developed its brand-building reputation and distinctive image across an expanding number of brands and geographic markets. Strategic acquisitions of watch brands and their subsequent growth, along with license agreements, have played an important role in the expansion of the Company’s brand portfolio.
In 1970, the Company acquired the Concord brand and the Swiss company that had been manufacturing Concord watches since 1908. In 1983, the Company acquired the U.S. distributor of Movado watches and substantially all of the assets related to the Movado brand from the Swiss manufacturer of Movado watches. The Company changed its name to Movado Group, Inc. in 1996. In March 2004, the Company completed its acquisition of Ebel, one of the world’s premier luxury watch brands that was established in La Chaux-de-Fonds, Switzerland in 1911.
The Company is highly selective in its licensing strategy and chooses to enter into long-term agreements with only powerful brands with strong positions in their respective businesses.
The following table sets forth the brands licensed by the Company and the year in which the Company launched each licensed brand for watches.
|
Brand |
|
Licensor |
|
Calendar Year Launched |
|
|
|
|
||
|
ESQ Movado |
|
Hearst Communication, Inc. |
|
1992 |
|
|
|
|
||
|
Coach |
|
Coach, Inc. |
|
1999 |
|
|
|
|
||
|
Tommy Hilfiger |
|
Tommy Hilfiger Licensing LLC |
|
2001 |
|
|
|
|
||
|
HUGO BOSS |
|
HUGO BOSS Trade Mark Management GmbH & Co |
|
2006 |
|
|
|
|
||
|
Juicy Couture |
|
ABG Juicy Couture, LLC |
|
2007 |
|
|
|
|
||
|
Lacoste |
|
Lacoste S.A., Sporloisirs S.A. and Lacoste Alligator S.A. |
|
2007 |
|
|
|
|
||
|
Scuderia Ferrari |
|
Ferrari Brand S.p.A. |
|
2013 |
The Company’s common stock is traded on the NYSE under the trading symbol MOV.
RECENT DEVELOPMENTS
On March 31, 2016, the Board approved an increase in the Company’s quarterly cash dividend to $0.13 for each share of the Company’s outstanding common stock and class A common stock. The dividend will be paid on April 26, 2016 to all shareholders of record as of the close of business on April 12, 2016. The decision of whether to declare any future cash dividend, including the amount of any such dividend and the establishment of record and payment dates, will be determined, in each quarter, by the Board of Directors, in its sole discretion.
On March 31, 2016, the Board approved the Company’s share repurchase program under which the Company is authorized to purchase up to $50.0 million of its outstanding common stock from time to time, depending on market conditions, share price and other factors. The Company may purchase shares of its common stock through open market purchases, repurchase programs, block trades or otherwise. This authorization expires on September 30, 2017.
2
Also on March 31, 2016, the Company announced that Rick Coté, Vice Chairman and Chief Operating Officer, will retire in June 2016. He will remain on the Board of Directors of Movado Group, in which capacity he will continue to serve as a trusted advisor to the Company. The Company does not plan to replace the Chief Operating Officer role. The Company will record an approximate $2.0 million pre-tax charge for the immediate vesting of stock awards and certain other compensation related to Rick Coté’s retirement in fiscal 2017. The Company will record this charge in the first quarter of fiscal 2017.
On January 6, 2016, Movado Group, Inc. and Financiere TWC SA (“TWC”), a French company with established distribution, marketing and sales operations in France and Germany, terminated the joint venture agreement they entered into on August 31, 2005 (the “JV Agreement”) relating to MGI-TWC B.V., a Dutch holding company that wholly owns MGI-TWC SAS, a French corporation, and MGI-TWC GmbH, a German corporation (collectively, the “Subsidiaries”). Under the JV Agreement, the Company and TWC controlled 51% and 49%, respectively, of MGI-TWC B.V. On January 6, 2016 the JV Agreement was terminated in connection with the acquisition by the Company of the outstanding 49% ownership interest in MGI-TWC B.V. Since that date, the Company has accounted for the Subsidiaries as wholly-owned entities. The Subsidiaries continue to be responsible for the marketing, distribution and sale in France and Germany of the Company's licensed HUGO BOSS, Lacoste, Scuderia Ferrari and Tommy Hilfiger brands, as well as future brands licensed to the Company, subject to the terms of the applicable license agreements. As of January 31, 2016, the Company had a remaining balance of $1.4 million regarding this purchase.
On November 24, 2015, the Board approved the payment of a cash dividend of $0.11 for each share of the Company’s outstanding common stock and class A common stock. The dividend was paid on December 18, 2015 to all shareholders of record as of the close of business on December 4, 2015.
On November 16, 2015, the Company announced the launch of two distinct smart watch collections with iOS® and Android® compatible apps: Movado Swiss watches utilizing Silicon Valley's Fullpower Technologies, Inc.’s MotionX-365® end-to-end solution, and Movado's BOLD collection watches utilizing HP Inc.’s smart accessories technology.
On October 6, 2015, the Company announced the launch of the new Movado Edge watch collection, developed in collaboration with world-renowned industrial designer Yves Behar and his design firm fuseproject. Uniting the talents of two of the most important industrial designers of the last 70 years, Nathan George Horwitt and Yves Behar, the Company has brought design innovation and enhanced sophistication to its legendary Museum Dial.
On August 27, 2015, the Board approved the payment of a cash dividend of $0.11 for each share of the Company’s outstanding common stock and class A common stock. The dividend was paid on September 22, 2015 to all shareholders of record as of the close of business on September 8, 2015.
Following the Company’s strategic decision in the fourth quarter of fiscal 2014 to reduce the presence of ESQ Movado watches in order to expand the Movado brand offering in certain retail doors, the Company continues to offer ESQ Movado only in select retail locations as well as its direct-to-consumer retail outlet locations. The Company has discontinued the production of ESQ Movado watches going forward and, accordingly, on July 28, 2015, extended its ESQ watch license with Hearst only through December 31, 2016, with the right to sell any remaining inventory for up to six months thereafter.
On May 27, 2015, the Board approved the payment of a cash dividend of $0.11 for each share of the Company’s outstanding common stock and class A common stock. The dividend was paid on June 22, 2015 to all shareholders of record as of the close of business on June 8, 2015.
On May 1, 2015, the Company and ABG Juicy Couture, LLC entered into Amendment Number 5, effective as of January 1, 2014, to that certain License Agreement between the two parties, dated as of November 15, 2005 (as previously amended, the “Amended License Agreement”), which modifies, and extends the term of, the Amended License Agreement through December 31, 2017.
For the fiscal year ended January 31, 2016, the Company recorded $4.0 million of pre-tax expenses primarily for severance, occupancy charges, and fixed assets as a result of actions it took to achieve greater operating efficiencies and streamline its operations, primarily at certain of its foreign subsidiaries (see Note 21 to the Consolidated Financial Statements regarding Operating Efficiency Initiatives and Other Items).
3
INDUSTRY OVERVIEW
The largest markets for watches are North America, Europe, Latin America and Asia. The Company divides the watch market into five principal categories as set forth in the following table.
|
Market Category |
|
Suggested Retail Price Range |
|
Primary Category of Movado Group, Inc. Brands |
|
Exclusive |
|
$10,000 and over |
|
— |
|
Luxury |
|
$2,000 to $9,999 |
|
Concord and Ebel |
|
Accessible Luxury |
|
$500 to $2,499 |
|
Movado |
|
Moderate and Fashion |
|
$75 to $500 |
|
ESQ Movado, Coach, HUGO BOSS, Juicy Couture, Tommy Hilfiger, Scuderia Ferrari and Lacoste |
|
Mass Market |
|
Less than $75 |
|
— |
Exclusive Watches
Exclusive watches are usually made of precious metals, including 18 karat gold or platinum, and are often set with precious gems. These watches are primarily mechanical or quartz-analog watches. Mechanical watches keep time with intricate mechanical movements consisting of an arrangement of wheels, jewels and winding and regulating mechanisms. Quartz-analog watches have quartz movements in which time is precisely calibrated to the regular frequency of the vibration of quartz crystal. Exclusive watches are manufactured almost entirely in Switzerland. Well-known brand names of exclusive watches include Audemars Piguet, Patek Philippe, Piaget and Vacheron Constantin. The Company does not compete in the exclusive watch category.
Luxury Watches
Luxury watches are either quartz-analog or mechanical watches. These watches typically are made with either 14 or 18 karat gold, stainless steel, ceramic or a combination of gold and stainless steel, and are occasionally set with precious gems. Luxury watches are primarily manufactured in Switzerland. In addition to a majority of the Company’s Ebel and Concord watches, well-known brand names of luxury watches include Baume & Mercier, Breitling, Cartier, Omega, Rolex and TAG Heuer.
Accessible Luxury Watches
The majority of accessible luxury watches are quartz-analog watches, which may also include connected technology for transmitting data wirelessly between the watch and a smartphone or other device. These watches typically are made with gold finish, stainless steel, ceramic or a combination of gold finish and stainless steel. Accessible luxury watches are manufactured primarily in Switzerland, although some are manufactured in Asia. In addition to a majority of the Company’s Movado watches, well-known brand names of accessible luxury watches include Gucci, Rado, Michele and Raymond Weil.
Moderate and Fashion Watches
Most moderate and fashion watches are quartz-analog watches, which may also include connected technology for transmitting data wirelessly between the watch and a smartphone or other device. These watches typically are made with gold finish, stainless steel, brass, plastic or a combination of gold finish and stainless steel. Moderate and fashion watches are manufactured primarily in Asia and Switzerland. In addition to the Company’s ESQ Movado, Coach, HUGO BOSS, Juicy Couture, Tommy Hilfiger, Scuderia Ferrari and Lacoste brands, well-known brand names of watches in the moderate and fashion category include Anne Klein, Bulova, Citizen, Fossil, Guess, Seiko, Michael Kors, Swatch and Wittnauer.
Mass Market Watches
Mass market watches typically consist of digital watches and analog watches made from stainless steel, brass and/or plastic and are manufactured in Asia. Well-known brands include Casio, Pulsar, Seiko and Timex. The Company does not compete in the mass market watch category.
4
BRANDS
The Company designs, develops, sources, markets and distributes products under the following watch brands:
Owned Brands
Concord
Concord was founded in 1908 in Bienne, Switzerland. Concord turns to its past for inspiration, thereby yielding visionary newness as seen with the re-introduction of inspired collections over the past few years. Concord watches have Swiss movements and are made with solid 18 karat gold, stainless steel or a combination of 18 karat gold and stainless steel. Some are set with diamonds.
Ebel
The Ebel brand was established in La Chaux-de-Fonds, Switzerland in 1911. Since acquiring Ebel, the Company has returned Ebel to its roots as the “Architects of Time” through its product development, marketing initiatives and global advertising campaigns. Ebel is a fine Swiss watch brand that marries function and beauty, and is known for its craftsmanship and creativity. All Ebel watches feature Swiss movements and are made with solid 18 karat yellow or rose gold, stainless steel or a combination of 18 karat yellow or rose gold, ceramic and, or stainless steel. Some are set with diamonds.
Movado
The Movado brand is renowned for its iconic Museum® dial and modern design aesthetic. Since its founding in La Chaux-de-Fonds, Switzerland in 1881, Movado has earned more than 100 patents and 200 international awards for artistry and innovation in watch design and technology, and Movado timepieces have won world renown for their unique beauty and timeless design.
Movado is a hallmark of some of the most famous timepieces ever created, most notably, the Movado Museum® Watch. Designed in 1947 by Bauhaus-influenced artist Nathan George Horwitt, the watch dial defined by a solitary dot at 12, symbolizing the sun at high noon, has been acclaimed for purity of design unrivaled in the history of time-keeping. When Horwitt’s dial was selected for the permanent design collection of the Museum of Modern Art, New York, in 1960, it became the first watch dial ever awarded this distinction. Known today as the Movado Museum Watch, this legendary dial is regarded as an icon of Modernism. A trademarked and award-winning design, the celebrated single dot dial now distinguishes a wide range of Movado timepieces.
The Movado brand experience is defined by its long, rich heritage of design innovation, and a close, enduring association with the arts. Expressions of Movado’s commitment to the fine and cultural arts encompass commissioned watch designs by famed artists, affiliations with talented brand ambassadors, sponsorship of major arts institutions and support of emerging artists.
The Movado BOLD collection represents iconic Movado design re-imagined for the cool, fashion-savvy, on-trend consumer and is innovative in both design and use of materials. The Movado Edge collection, launched on October 6, 2015, brings design innovation and enhanced sophistication to the legendary Museum Dial through the efforts of world-renowned industrial designer Yves Behar.
A majority of Movado watches have Swiss movements and are made with 14 or 18 karat gold, 18 karat gold finish, stainless steel, ceramic or a combination of 18 karat gold finish and stainless steel.
A majority of Movado BOLD and Movado Edge watches have Swiss movements and are made with composite materials, stainless steel, gold finish or a combination of stainless steel and gold finish, with leather straps, stainless steel bracelets or gold finish bracelets.
In the fourth quarter of fiscal 2016, the Company announced the launch of two distinct smart watch collections with iOS® and Android® compatible apps: Movado Swiss watches utilizing Silicon Valley's Fullpower Technologies, Inc.’s MotionX-365® end-to-end solution, and Movado's BOLD collection watches utilizing HP Inc.’s smart accessories technology. These watches use Bluetooth® technology to communicate with smartphones using iOS® and Android® operating systems. The initial Movado Motion smart watches feature automatic local time/date setting, steps activity tracking and sleep monitoring. The initial Movado Bold Motion smart watches feature steps activity tracking and alerts for upcoming appointments, incoming texts, phone calls, emails and social media updates.
5
Licensed Brands
Coach Watches
Coach watches reflect the Coach brand image and classic American style. The Coach brand stands for authenticity, innovation, and relevance and represents a blend of classic American style with a distinctive New York spirit, offering a design that is known for a characteristic combination of style and function. With an expanding presence globally, the Coach brand exemplifies modern luxury. As an extension of the brand, Coach watches offer a fresh and compelling assortment of timepieces for women and men, with a wide variety of bracelets and straps constructed of stainless steel accented with gold tone finishes and leather straps.
ESQ Movado
ESQ Movado watches have been marketed by the Company since fiscal 2013 as a collection within the Movado brand. The watches are priced to compete in the entry level Swiss watch category and are defined by bold sport and fashion designs. All ESQ Movado watches contain Swiss movements and most are made with stainless steel, gold finish or a combination of stainless steel and gold finish, with leather straps, stainless steel bracelets or gold finish bracelets. Following the Company’s strategic decision in the fourth quarter of fiscal 2014 to reduce the presence of ESQ Movado watches to expand the Movado brand offering in certain retail doors, the Company continues to offer ESQ Movado only in select retail locations as well as its direct-to-consumer retail outlet locations. The Company has discontinued the production of ESQ Movado watches going forward and, accordingly, has extended its ESQ watch license with Hearst only through December 31, 2016, with the right to sell any remaining inventory for up to six months thereafter.
HUGO BOSS Watches
HUGO BOSS is a global leader in the world of fashion and modern luxury. The HUGO BOSS watch collection features classic, modern and sporty timepieces combining functionality with a touch of refined luxury.
Juicy Couture Timepieces
Juicy Couture is an L.A. inspired, casual, affordable luxury lifestyle brand. Juicy infuses couture in the everyday through the use of bold colors and graphics, flirty feminine designs and whimsical prints, across lifestyle categories.
Juicy Couture timepieces reflect the brand’s clear vision, unique identity in the upscale contemporary category, encompassing both trend-right and core styling contemporary watches.
Lacoste Watches
The Lacoste watch collection embraces the Lacoste lifestyle proposition which encompasses elegance, refinement and comfort, as well as a dedication to quality and innovation. Mirroring key attributes of the Lacoste brand, the collection features stylish timepieces with a contemporary sport elegant feel.
Scuderia Ferrari Watches
Asserting Scuderia Ferrari’s proud racing heritage and Italian pedigree, Movado Group’s Scuderia Ferrari watch collection for men and women brings the excitement and distinctive style of the time honored racing team to fans around the world.
Tommy Hilfiger Watches
Reflecting the fresh, fun all-American style for which Tommy Hilfiger is known, Tommy Hilfiger watches feature quartz, digital or analog-digital movements, with stainless steel, titanium, aluminum, silver-tone, two-tone or gold-tone cases and bracelets, and leather, fabric, plastic or rubber straps. The line includes fashion and sport models.
6
DESIGN AND PRODUCT DEVELOPMENT
The Company’s offerings undergo two phases before they are produced for sale to customers: design and product development. The design phase includes the creation of artistic and conceptual renderings while product development involves the construction of prototypes. The Company’s Movado BOLD and licensed brands are designed by in-house design teams in Switzerland and the United States in cooperation with outside sources, including (in the case of the licensed brands) licensors’ design teams. Product development for the licensed brands and Movado BOLD takes place in the Company’s Asia operations. For the Company’s Movado (with the exception of Movado BOLD), Ebel and Concord brands, the design phase is performed by a combination of in-house and freelance designers in Europe and the United States while product development is carried out in the Company’s Swiss operations. Senior management of the Company is actively involved in the design and product development process.
MARKETING
The Company’s marketing strategy is to communicate a consistent, brand-specific message to the consumer. Recognizing that advertising is an integral component to the successful marketing of its product offerings, the Company devotes significant resources to advertising and maintains its own in-house advertising department which focuses primarily on the implementation and management of global marketing and advertising strategies for each of the Company’s brands, ensuring consistency of presentation. The Company develops advertising campaigns individually for each of the Company’s brands, utilizing outside agencies as deemed appropriate. These campaigns are directed primarily to the end consumer rather than to trade customers. The Company’s advertising targets consumers with particular demographic characteristics appropriate to the image and price range of each brand. Company advertising is placed in magazines and other print media, on radio and television, online, in catalogs, on outdoor signs and through other promotional materials. Marketing expenses totaled 12.5%, 12.3% and 13.0% of net sales in fiscal 2016, 2015 and 2014, respectively.
OPERATING SEGMENTS
The Company conducts its business primarily in two operating segments: Wholesale and Retail. For operating segment data and geographic segment data for the years ended January 31, 2016, 2015 and 2014, see Note 14 to the Consolidated Financial Statements regarding Segment and Geographic Information.
The Company’s Wholesale segment includes the design, development, sourcing, marketing and distribution of high quality watches, and unallocated corporate expenses, in addition to after-sales service activities and shipping. The Retail segment includes the Company’s retail outlet locations.
The Company divides its business into two major geographic locations: United States operations, and International, which includes the results of all other Company operations. The allocation of geographic revenue is based upon the location of the customer. The Company’s International operations in Europe, the Americas (excluding the United States), the Middle East and Asia account for 21.2%, 10.5%, 7.4% and 6.1%, respectively, of the Company’s total net sales for fiscal 2016. Substantially all of the Company’s International assets are located in Switzerland and Hong Kong. For a discussion of the risks associated with the Company’s operations conducted outside the United States, see “A significant portion of the Company’s business is conducted outside of the United States. Many factors affecting business activities outside the United States could adversely impact this business” under Item 1A. Risk Factors, below.
Wholesale
United States Wholesale
The Company sells all of its brands in the U.S. wholesale market primarily to major jewelry store chains such as Sterling, Inc. and Helzberg Diamonds Corp.; department stores, such as Macy’s and Nordstrom; as well as independent jewelers. Sales to trade customers in the United States are made directly by the Company’s U.S. sales force and, to a lesser extent, independent sales representatives. Sales representatives are responsible for a defined geographic territory, generally specialize in a particular brand and sell to and service independent jewelers within their territory. The sales force also consists of account executives and account representatives who, respectively, sell to and service chain and department store accounts.
7
International Wholesale
Internationally, the Company’s brands are sold in department stores, jewelry chains and independent jewelers. The Company employs its own international sales force operating at the Company’s sales and distribution offices in Canada, China, Germany, France, Hong Kong, Singapore, Switzerland, the United Kingdom and the United Arab Emirates. In addition, the Company sells all of its brands through a network of independent distributors operating in numerous countries around the world. A majority of the Company’s arrangements with its international distributors are long-term, generally require certain minimum purchases and minimum advertising expenditures and impose restrictions on the distributor’s sale of competitive products.
In France and Germany, the Company’s licensed brands were marketed and distributed by MGI-TWC SAS, a French corporation, and MGI-TWC GmbH, a German corporation, that are wholly-owned by MGI-TWC B.V., a Dutch company, of a joint venture company that was owned 51% by the Company and 49% by TWC, a French company with established distribution, marketing and sales operations in France and Germany. As of January 6, 2016, the Company acquired the remaining 49% interest from TWC and simultaneously terminated the joint venture agreement. Since that date, the Company has accounted for the Subsidiaries as wholly-owned entities.
In the U.K., the Company distributes both its licensed brands as well as Movado and Ebel watches through MGS Distribution Limited (“MGS”), an English company in which the Company has a 90% ownership interest. The Company’s former joint venture partner in MGS, Swico Limited, also based in the U.K., continues to own the remaining 10% interest and provides MGS with logistical support and after-sales service.
Retail
The Company’s subsidiary, Movado Retail Group, Inc., operates 40 retail outlet locations in outlet centers across the United States, which serve as an effective vehicle to sell discontinued models and factory seconds of all of the Company’s watches.
SEASONALITY
The Company’s U.S. sales are traditionally greater during the Christmas and holiday season. Consequently, the Company’s net sales historically have been higher during the second half of its fiscal year. The amount of net sales and operating profit generated during the second half of each fiscal year depends upon the general level of retail sales during the Christmas and holiday season, as well as economic conditions and other factors beyond the Company’s control. Major selling seasons in certain international markets center on significant local holidays that occur in late winter or early spring. The second half of each fiscal year accounted for 55.3%, 54.9%, and 56.5% of the Company’s net sales for the fiscal years ended January 31, 2016, 2015, and 2014, respectively.
BACKLOG
At March 24, 2016, the Company had unfilled orders of $50.3 million compared to $54.1 million at March 24, 2015 and $30.4 million at March 19, 2014. Unfilled orders include both confirmed orders and orders that the Company believes will be confirmed based on the historical experience with the customers. It is customary for many of the Company’s customers not to confirm their future orders with formal purchase orders until shortly before their desired delivery dates.
CUSTOMER SERVICE, WARRANTY AND REPAIR
The Company assists in the retail sales process of its wholesale customers by monitoring their sales and inventories by product category and style. The Company also assists in the conception, development and implementation of customers’ marketing vehicles. The Company places considerable emphasis on cooperative advertising programs with its wholesale customers. The Company’s assistance in the retail sales process has resulted in close relationships with its principal customers, often allowing for influence on the mix, quantity and timing of their purchasing decisions. The Company believes that customers’ familiarity with its sales approach has facilitated, and should continue to facilitate, the introduction of new products through its distribution network.
The Company permits the return of damaged or defective products. In addition, although the Company generally has no obligation to do so, it accepts other returns from customers in certain instances.
8
The Company has service facilities around the world including five Company-owned service facilities and multiple independent service centers which are authorized to perform warranty repairs. A list of authorized service centers can be accessed online at www.mgiservice.com. In order to maintain consistency and quality at its service facilities and authorized independent service centers, the Company conducts training sessions and distributes technical information and updates to repair personnel. All watches sold by the Company come with limited warranties covering the movement against defects in material and workmanship for periods ranging from two to three years from the date of purchase, with the exception of Tommy Hilfiger watches, for which the warranty period is ten years. In addition, the warranty period is five years for the gold plating on certain Movado watch cases and bracelets. Products that are returned under warranty to the Company are generally serviced by the Company’s employees at its service facilities.
The Company retains adequate levels of component parts to facilitate after-sales service of its watches for an extended period of time after the discontinuance of such watches.
The Company makes available a web-based system at www.mgiservice.com providing immediate access for the Company’s retail partners to information they may want or need about after sales service issues. The website allows the Company’s retailers to track their repair status online 24 hours a day. The system also permits customers to authorize repairs, track repair status through the entire repair life cycle, view repair information and obtain service order history.
SOURCING, PRODUCTION AND QUALITY
The Company does not manufacture any of the products it sells. The Company employs a flexible manufacturing model that relies on independent manufacturers to meet shifts in marketplace demand and changes in consumer preferences. All product sources must achieve and maintain the Company’s high quality standards and specifications. With strong supply chain organizations in Switzerland, China and Hong Kong, the Company maintains control over the quality of its products, wherever they are manufactured. Compliance is monitored with strictly enforced quality control standards, including on-site quality inspections.
A majority of the Swiss watch movements used in the manufacture of Movado, Ebel and Concord watches are purchased from two suppliers. The Company obtains other watch components for all of its brands, including movements, cases, hands, dials, bracelets and straps from a number of other suppliers. The Company does not have long-term supply commitments with any of its component parts suppliers.
Movado (with the exception of Movado BOLD), Ebel and Concord watches are manufactured in Switzerland by independent third party assemblers. All Movado (with the exception of Movado BOLD), Ebel and Concord watches are manufactured using Swiss movements. Movado smart watches include connected technology developed by Fullpower Technologies, Inc. or HP Inc. All of the Company’s products are manufactured using components obtained from third party suppliers. A majority of Movado BOLD watches are manufactured by independent contractors in Asia using Swiss movements. Coach, Tommy Hilfiger, HUGO BOSS, Juicy Couture, Scuderia Ferrari and Lacoste watches are manufactured by independent contractors in Asia.
TRADEMARKS, PATENTS AND LICENSE AGREEMENTS
The Company owns the trademarks CONCORD®, EBEL® and MOVADO®, as well as trademarks for the Movado Museum dial design, and related trademarks for watches and jewelry in the United States and in numerous other countries.
The Company licenses ESQUIRE®, ESQ® and related trademarks on an exclusive worldwide basis for use in connection with the manufacture, distribution, advertising and sale of watches pursuant to a license agreement with Hearst Magazine, a division of Hearst Communications, Inc., dated as of January 1, 1992 (as amended, the “Hearst License Agreement”). The current term of the Hearst License Agreement expires December 31, 2016, and the Company has the right to sell any remaining inventory for up to six months thereafter.
The Company licenses the trademark COACH® and related trademarks on an exclusive worldwide basis for use in connection with the manufacture, distribution, advertising and sale of watches pursuant to an amended and restated license agreement with Coach, Inc., dated January 30, 2015, which expires on June 30, 2020.
Under an amended and restated license agreement with Tommy Hilfiger Licensing LLC dated September 16, 2009 (the “Tommy Hilfiger License Agreement”), the Company has the exclusive license to use the trademark TOMMY HILFIGER® and related trademarks in connection with the manufacture of watches and jewelry worldwide and in connection with the marketing, advertising, sale and distribution of watches and jewelry at wholesale (and at retail through its outlet locations) worldwide (excluding certain accounts in Japan). The term of the Tommy Hilfiger License Agreement expires December 31, 2019 and may be extended by the Company for an additional five years ending on December 31, 2024, subject to the satisfaction of minimum sales requirements and approval of a new business plan.
9
On March 5, 2012, the Company entered into an amended and restated license agreement with HUGO BOSS Trade Mark Management GmbH & Co. (the “Hugo Boss License Agreement”), extending the term and making certain other changes to the license agreement originally entered by the parties on December 15, 2004, under which the Company received a worldwide exclusive license to use the trademark HUGO BOSS® and any other trademarks containing the names “HUGO” or “BOSS”, in connection with the production, promotion and sale of watches. The term of the Hugo Boss License Agreement continues through December 31, 2018.
In November 2005, the Company entered into a license agreement with L.C. Licensing, Inc., for the exclusive worldwide license to use the trademarks JUICY COUTURE® and related trademarks in connection with the manufacture, advertising, merchandising, promotion, sale and distribution of timepieces and components (the “Juicy Couture License Agreement”). In November 2013, L.C. Licensing, Inc. assigned its entire interest in the Juicy Couture License Agreement to ABG Juicy Couture, LLC. The current term of the Juicy Couture License Agreement is through December 31, 2017.
On March 28, 2014, the Company entered into an amended and restated license agreement with Lacoste S.A., Sporloisirs S.A. and Lacoste Alligator S.A. (the “Lacoste License Agreement”), extending the term and making certain other changes to the license agreement originally entered into by the parties in 2006, under which the Company received a worldwide exclusive license to use the Lacoste® name and the distinctive “alligator” logo to design, produce, market and distribute watches. The term of the Lacoste License Agreement continues through December 31, 2022.
On March 22, 2012, the Company entered into an exclusive worldwide license agreement with Ferrari S.p.A. to use certain well known trademarks of Ferrari including the S.F. and Prancing Horse device in shield, FERRARI OFFICIAL LICENSED PRODUCT and SCUDERIA FERRARI, in connection with the manufacture, advertising, merchandising, promotion, sale and distribution of watches with a suggested retail price not exceeding €1,500 (the “Ferrari License Agreement”). The current term of the Ferrari License Agreement is through December 31, 2017.
The Company also owns, and has pending applications for, a number of design patents in the United States and internationally for various watch designs, as well as designs of watch dials, cases, bracelets and jewelry.
The Company actively seeks to protect and enforce its intellectual property rights by working with industry associations, anti-counterfeiting organizations, private investigators and law enforcement authorities, including customs authorities in the United States and internationally, and, when necessary, suing infringers of its trademarks and patents. Consequently, the Company is involved from time to time in litigation or other proceedings to determine the enforceability, scope and validity of these rights. With respect to the trademarks MOVADO®, EBEL®, CONCORD® and certain other related trademarks, the Company has received exclusion orders that prohibit the importation of counterfeit goods or goods bearing confusingly similar trademarks into the United States and other countries. In accordance with customs regulations, these exclusion orders, however, do not cover the importation of genuine Movado, Ebel and Concord watches because the Company is considered the manufacturer of such watches. All of the Company’s exclusion orders are renewable.
COMPETITION
The markets for each of the Company’s watch brands are highly competitive. With the exception of Swatch Group, Ltd., a large Swiss-based competitor, no single company competes with the Company across all of its brands. Certain companies, however, compete with Movado Group with respect to one or more of its watch brands. Certain of these companies have, and other companies that may enter the Company’s markets in the future may have, greater financial, distribution, marketing and advertising resources than the Company. The Company’s future success will depend, to a significant degree, upon its continued ability to compete effectively with regard to, among other things, the style, quality, price, advertising, marketing, distribution and availability of supply of the Company’s watches and other products.
EMPLOYEES
As of January 31, 2016, the Company had approximately 1,100 full-time employees in its global operations. Approximately 210 Company employees in Switzerland and 13 Company employees in France are subject to collective bargaining agreements. The Company has never experienced a work stoppage due to labor difficulties and believes that its employee relations are good.
10
AVAILABLE INFORMATION
The Company’s annual reports on Form 10-K, quarterly reports on Form 10-Q, current reports on Form 8-K and all amendments to those reports filed or furnished pursuant to Section 13(a) or 15(d) of the Securities Exchange Act of 1934, as amended, are available free of charge on the Company’s website, located at www.movadogroup.com, as soon as reasonably practicable after the same are electronically filed with, or furnished to, the SEC. The public may read any materials filed by the Company with the SEC at the SEC’s public reference room at 100 F. Street, N.E., Washington, D.C., 20549. The public may obtain information on the operation of the public reference room by calling the SEC at 1-800-SEC-0330. The SEC maintains a website that contains reports, proxy and information statements, and other information regarding the Company at www.sec.gov.
The Company has adopted a Code of Business Conduct and Ethics that applies to all directors, officers and employees, including the Company’s Chief Executive Officer, Chief Financial Officer and principal accounting and financial officers, which is posted on the Company’s website. The Company will post any amendments to the Code of Business Conduct and Ethics and any waivers that are required to be disclosed by SEC regulations on the Company’s website. In addition, the committee charters for the audit committee, the compensation committee and the nominating/corporate governance committee of the Board of Directors of the Company and the Company’s corporate governance guidelines have been posted on the Company’s website.
Item 1A. Risk Factors
The following risk factors and the forward-looking statements contained in this Form 10-K should be read carefully in connection with evaluating Movado Group’s business. These risks and uncertainties could cause actual results and events to differ materially from those anticipated. Additional risks which the Company does not presently consider material, or of which it is not currently aware, may also have an adverse impact on the business. Please also see “Forward-Looking Statements” on page 1.
Adverse economic conditions in the U.S. or in other key markets, and the resulting declines in consumer confidence and spending, could have a material adverse effect on the Company’s operating results.
The Company’s results are dependent on a number of factors impacting consumer confidence and spending, including, but not limited to, general economic and business conditions; wages and employment levels; volatility in the stock market; home values; inflation; consumer debt levels; availability and cost of consumer credit; economic uncertainty; solvency concerns of major financial institutions; fluctuations in foreign currency exchange rates; fuel and energy costs and/or shortages; tax issues; and general political conditions, both domestic and abroad.
Adverse economic conditions, including declines in employment levels, disposable income, consumer confidence and economic growth could result in decreased consumer spending that would adversely affect sales of consumer goods, particularly those, such as the Company’s products, that are viewed as discretionary items. In addition, events such as war, terrorism, natural disasters or outbreaks of disease could further suppress consumer spending on discretionary items. If any of these events should occur, the Company’s future sales could decline.
Changes to existing laws or regulations, or the adoption of new laws or regulations, whether in the United States or in any of the other key markets in which the Company does business, could require the Company to change any number of its business practices which could have a material adverse effect on its financial condition or results of operations.
The Company conducts business, either directly or indirectly, in numerous countries and accordingly is subject to a multitude of legal requirements impacting every aspect of its operations. Changes to existing laws and regulations or new laws and regulations could impose new requirements and additional, associated costs on the Company and its suppliers, making the Company’s products more costly to produce, forcing the Company to change its existing business practices and potentially affecting its financial condition and results of operations. The Swiss parliament recently amended its Federal Act on the Protection of Trade Marks and Indications of Source to require that a greater percentage of manufacturing costs be incurred in Switzerland for goods to bear a Swiss indication of origin. Subsequently, upon request of the Swiss Federal Government, an ordinance was drafted by the Federation of the Swiss Watch Industry (“FH”), and will be effective beginning January 31, 2017, subject to a two-year transition period. Under the FH ordinance, a watch may only be marked with a Swiss indication of origin if, in addition to meeting existing requirements, the design and prototyping of the watch occurred in, and that at least 60% of the manufacturing costs were incurred in, Switzerland. Compliance with the new Swissness law and regulations may require the Company to incur additional costs and seek different sources of supply, which may increase the production costs of Movado, Ebel and Concord watches. The Company may also be unable to secure adequate Swiss-based suppliers to meet all of its needs. If the production costs for these watches become more expensive or the watches can no longer be marked as “Swiss,” the Company may then be at a competitive disadvantage as compared to other watch brands and sales of its products may decline, adversely affecting its financial condition and results of operations. In addition, in October 2015, the United States and eleven other Pacific Rim countries (excluding China) signed a multilateral free-trade agreement called the Trans-Pacific
11
Partnership (the “TPP”). The TPP will become effective if, and to the extent, ratified by member countries. If the TPP is ratified in the U.S., tariffs on the importation into the U.S. of watches manufactured in other TPP countries would be significantly reduced or eliminated. Since certain competitors of the Company manufacture watches in other potential TPP countries, those competitors could garner a cost advantage that could allow them to compete more effectively against the Company and thereby adversely impact the Company’s results of operations.
The Company faces intense competition in the worldwide watch industry not only from competitors selling traditional watches but also from those selling smart watches and other smart wearables.
The watch industry is highly competitive and the Company competes globally with numerous manufacturers, importers, distributors and Internet-based retailers, some of which are larger than the Company and have greater financial, distribution, advertising and marketing resources than the Company. The Company’s products compete on the basis of price, features, brand image, design, perceived desirability, reliability and perceived attractiveness. However, there can be no assurance that the Company’s products will compete effectively in the future and, unless the Company remains competitive, its future results of operations and financial condition could be adversely affected. The Company also faces increased, new competition from companies introducing and selling smart wearable devices including smart watches. Many of these companies have significantly greater financial, distribution, advertising and marketing resources than does the Company. The sale of these new smart products could materially adversely impact the traditional watch market and the Company’s results of operations and financial condition unless the Company is able to effectively compete in this new product area. The Company’s ability to successfully design, produce, market and sell products which are competitive with smart watches and other similar wearables will depend, among other things, on its ability to obtain and maintain the necessary expertise in this area by enhancing its internal capabilities or by entering into business relationships with third parties that have such expertise. The Company may not be able to launch commercially successful smart watch models or other such products in a timely manner or frequently enough to remain competitive. Any of these events could have a material adverse effect on the Company’s business, results of operations and financial condition or could result in the Company’s products not achieving market acceptance or becoming obsolete.
The design, sourcing, marketing, distribution and after-sales servicing of smart watches involve additional challenges than those applicable to traditional watches.
Although smart watches share certain characteristics with traditional watches, there are important differences in the way the two sets of products are designed, sourced, marketed, distributed, and serviced after they are sold. These differences may make it more difficult to compete successfully in the smart watch market, particularly for competitors such as the Company that do not have significant experience with similar consumer technology products. Although the Company has used and expects to continue to use reputable technology companies to assist it in bringing smart watches to market and supporting end-user customers, there are technology-related and other risks of competing in this market that cannot be eliminated. For example, smart watches’ significant reliance on technology increases the risk of allegations of infringement on the intellectual property rights of others. In addition, although the Company does not currently provide longer warranties on its smart watches than it does for its traditional watches, consumers may expect that smart watches purchased by them, particularly smart watches in the Company’s Luxury category, will for many years continue to function and be compatible with the smart phone operating systems with which they were intended to interface, including future updates to such operating systems. Since the Company has no control over such operating system updates, it cannot be certain that it will be able to ensure that its smart watches continue to interface with smart phones using such updated operating systems. If the Company fails to meet consumers’ expectations regarding the long-term functioning of its smart watches, the Company may suffer reputational damage that could adversely affect its business, results of operations and financial condition.
Maintaining favorable brand recognition is essential to the success of the Company, and failure to do so could materially and adversely affect the Company’s results of operations.
Favorable brand recognition is an important factor to the future success of the Company. The Company sells its products under a variety of owned and licensed brands. Factors affecting brand recognition are often outside the Company’s control, and the Company’s efforts to create or enhance favorable brand recognition, such as making significant investments in marketing and advertising campaigns, product design and anticipation of fashion trends, may not have their desired effects. Additionally, the Company relies on its licensors to maintain favorable brand recognition of their respective brands, and the Company often has no control over the brand management efforts of its licensors. Finally, although the Company’s independent distributors are subject to contractual requirements to protect the Company’s brands, it may be difficult to monitor or enforce such requirements, particularly in foreign jurisdictions.
Any decline in perceived favorable recognition of the Company’s owned or licensed brands could materially and adversely affect future results of operations and profitability. If the Company is unable to respond to changes in consumer demands and fashion trends in a timely manner, sales and profitability could be adversely affected.
12
Fashion trends and consumer demands and tastes often shift quickly. The Company attempts to monitor these trends in order to adapt its product offerings to suit customer demand. There is a risk that the Company will not properly perceive changes in trends or tastes, which may result in the failure to adapt the Company’s products accordingly. In addition, new model designs are regularly introduced into the market for all brands to keep ahead of evolving fashion trends as well as to initiate new trends of their own. There is risk that the public may not favor these new models or that the models may not be ready for sale until after the trend has passed. If the Company fails to respond to and keep up to date with fashion trends and consumer demands and tastes, its brand image, sales, profitability and results of operations could be materially and adversely affected.
If the Company misjudges the demand for its products, high inventory levels could adversely affect future operating results and profitability.
Consumer demand for the Company’s products can affect inventory levels. If consumer demand is lower than expected, inventory levels can rise causing a strain on operating cash flows. If the inventory cannot be sold through the Company’s wholesale channel or retail outlet locations, additional write-downs or write-offs to future earnings could be necessary. Conversely, if consumer demand is higher than expected, insufficient inventory levels could result in unfilled customer orders, loss of revenue and an unfavorable impact on customer relationships. In particular, volatility and uncertainty related to macro-economic factors make it more difficult for the Company to forecast customer demand in its various markets. Failure to properly judge consumer demand and properly manage inventory could have a material adverse effect on profitability and liquidity.
An increase in product returns could negatively impact the Company’s operating results and profitability.
The Company recognizes revenue as sales when merchandise is shipped and title and risk of loss transfers to the customer. The Company permits the return of damaged or defective products and accepts limited amounts of product returns in certain instances. Accordingly, the Company provides allowances for the estimated amounts of these returns at the time of revenue recognition based on historical experience. While such returns have historically been within management’s expectations and the provisions established, future return rates may differ from those experienced in the past, in particular in light of the Company’s launch of two smart watch collections. Any significant increase in damaged or defective products or expected returns could have a material adverse effect on the Company’s operating results for the period or periods in which such returns materialize.
The Company’s business relies on the use of independent parties to manufacture its products. Any loss of an independent manufacturer, or the Company’s inability to deliver quality goods in a timely manner, could have an adverse effect on customer relations, brand image, net sales and results of operations.
The Company employs a flexible manufacturing model that relies on independent manufacturers to meet shifts in marketplace demand. Most of these manufacturers rely on third party suppliers for the various component parts needed to assemble finished watches sold to the Company. All such independent manufacturers and suppliers must achieve and maintain the Company’s high quality standards and specifications. The inability of a manufacturer to ship orders in a timely manner or to meet the Company’s high quality standards and specifications could cause the Company to miss committed delivery dates with customers, which could result in cancellation of the customers’ orders. In addition, delays in delivery of satisfactory products could have a material adverse effect on the Company’s profitability, particularly if the delays cause the Company to be unable to market certain products during the seasonal periods when its sales are typically higher. See “Risk Factors – The Company’s business is seasonal, with sales traditionally greater during certain holiday seasons, so events and circumstances that adversely affect holiday consumer spending will have a disproportionately adverse effect on the Company’s results of operations.” A majority of the Swiss watch movements used in the manufacture of Movado, Ebel and Concord watches are purchased from two suppliers, one of which is a wholly-owned subsidiary of one of the Company’s competitors. Additionally, the Company generally does not have long-term supply commitments with its manufacturers and thus competes for production facilities with other organizations, some of which are larger and have greater resources. Any loss of an independent manufacturer or disruption in the supply chain with respect to critical component parts may result in the Company’s inability to deliver quality goods in a timely manner and could have an adverse effect on customer relations, brand image, net sales and results of operations.
The Company contractually obligates its contract manufacturers to adhere to the Company’s vendor code of conduct and similar codes of conduct adopted by the Company’s trademark licensors and the Company monitors compliance with those codes by conducting periodic factory audits. There can be no assurance, however, that any of those independent manufacturers or one or more of the Company’s licensors might not violate labor or other laws or use labor practices that deviate from those generally accepted as ethical in the United States or other countries in which the violation or other activities occurred. Such an event could interrupt or otherwise disrupt the shipment of finished products or damage the Company’s reputation and could have a material adverse effect on our financial condition and results of operations.
13
The loss or shut down of any of the Company’s major warehouse and distribution centers could materially adversely affect its business.
The Company operates one distribution facility in New Jersey that is responsible for importing and warehousing products as well as fulfilling and shipping orders to all of the Company’s customers in the United States, Canada and the Caribbean. The Company operates a smaller, similar facility in Bienne, Switzerland for the distribution of its Swiss watch brands throughout Europe and the Middle East, and has contracted with a third party warehouse and fulfillment provider in Asia to handle most of the distribution of its licensed brands. The complete or partial loss or temporary shutdown of any of these facilities (including as a result of fire or other casualty or labor or other disturbances) could have a material adverse effect on the Company’s business. In addition, the Company’s New Jersey warehouse and distribution facility is operated in a special purpose sub-zone established by the U.S. Department of Commerce Foreign Trade Zone Board and is highly regulated by U.S. Customs and Border Protection, which, under certain circumstances, has the right to shut down the entire sub-zone and, therefore, the entire warehouse and distribution facility. If that were to occur, the Company’s ability to fill orders for its U.S., Canadian and Caribbean customers would be significantly impacted, which could have a material adverse effect on the Company’s business, results of operations and financial condition.
If the Company loses any of its license agreements, there may be significant loss of revenues and a negative effect on business.
The Company has the right to produce, market and distribute watches under the brand names of Coach, Tommy Hilfiger, HUGO BOSS, Juicy Couture, Scuderia Ferrari and Lacoste pursuant to license agreements with the respective owners of those trademarks. The Company has the right to distribute watches under the brand name ESQ through December 31, 2016, with the right to sell any remaining inventory for up to six months thereafter. There are certain minimum royalty payments as well as other requirements associated with these agreements. Failure to meet any of these requirements could result in the loss of the license. Additionally, after the term of any license agreement has concluded, the licensor may decide not to renew with the Company. For the fiscal year ended January 31, 2016, the above mentioned licensed brands represented approximately 50% of the Company’s net sales. While no individual licensed brand represented net sales greater than 20% of the Company’s total consolidated net sales, the loss of any single licensed brand could have a material adverse effect on the Company’s results of operations and although the Company is not substantially dependent on a particular licensed brand, the loss of one or more of the Company’s licenses could result in loss of future revenues which could adversely affect its financial condition. In addition, the Company’s revenues and profitability under its various license agreements may change from period to period due to various factors, including the maturity of the Company's relationship with the respective licensor, changes in consumer preferences, brand repositioning activities and other factors, some of which are outside of the Company's control.
Changes in the sales or channel mix of the Company’s products could impact gross profit margins.
The individual brands that are sold by the Company are sold at a wide range of price points and yield a variety of gross profit margins. In addition, sales of excess and/or discontinued inventory into the liquidation channel generate a lower gross profit margin than non-liquidation sales. Thus, the mix of sales by brand as well as by distribution channel can have an impact on the gross profit margins of the Company. If the Company’s sales mix shifts unfavorably toward brands with lower gross profit margins than the Company’s historical consolidated gross profit margin or if a greater proportion of liquidation sales are made, it could have an adverse effect on the results of operations.
The Company’s business is seasonal, with sales traditionally greater during certain holiday seasons, so events and circumstances that adversely affect holiday consumer spending will have a disproportionately adverse effect on the Company’s results of operations.
The Company’s sales are seasonal by nature. The Company’s U.S. sales are traditionally greater during the Christmas and holiday season. Internationally, major selling seasons center on significant local holidays that occur in late winter or early spring. The amount of net sales and operating income generated during these seasons depends upon the general level of retail sales at such times, as well as economic conditions and other factors beyond the Company’s control. The second half of each year accounted for 55.3%, 54.9%, and 56.5% of the Company’s net sales for the fiscal years ended January 31, 2016, 2015, and 2014, respectively. If events or circumstances were to occur that negatively impact consumer spending during such holiday seasons, it could have a material adverse effect on the Company’s sales, profitability and results of operations.
Sales in the Company’s retail outlet locations are dependent upon customer foot traffic.
The success of the Company’s retail outlet locations is, to a certain extent, dependent upon the amount of customer foot traffic generated by the outlet centers in which those stores are located.
14
Factors that can affect customer foot traffic include:
|
|
· |
changes in customer discretionary spending; |
|
|
· |
the location of the outlet center; |
|
|
· |
the location of the Company’s store within the outlet center; |
|
|
· |
the other tenants in the outlet center; |
|
|
· |
the occupancy rate of the outlet center; |
|
|
· |
the success of the outlet center and tenant advertising to attract customers; |
|
|
· |
changes in competition in areas surrounding the outlet center; and |
|
|
· |
increased competition from shopping over the internet and other alternatives such as mail-order. |
Additionally, since most of the Company’s retail outlets are located near vacation destinations, factors that affect travel could decrease outlet center traffic. Such factors include the price and supply of fuel, travel concerns and restrictions, international instability, terrorism and inclement weather. A reduction in foot traffic in relevant shopping centers could have a material adverse effect on retail sales and profitability.
If the Company is unable to maintain existing space or to lease new space for its retail outlets in prime outlet center locations or is unable to complete construction on a timely basis, the Company’s ability to achieve favorable results in its retail business could be adversely affected.
The Company’s outlet stores are strategically located in top outlet centers in the United States, most of which are located near vacation destinations. If the Company cannot maintain and secure locations in prime outlet centers for its outlet stores on acceptable lease terms, it could jeopardize the operations of the stores and business plans for the future. Additionally, if the Company cannot complete construction in new stores within the planned timeframes, cost overruns and lost revenue could adversely affect the profitability of the retail segment. The Company on average plans for two to three new stores or renovations per fiscal year. The average time required to build-out or renovate each store and open it after delivery of possession is generally less than 60 days.
Current or future cost reduction, streamlining, restructuring or business optimization initiatives could result in the Company incurring various one-time, non-recurring or unusual charges and other items, which could have a material adverse effect on the Company’s reported earnings per share and other unadjusted financial measures.
In the course of the Company’s efforts to implement its business plan to adapt to the changing economic environment, the Company may be required to take actions that could result in the incurrence of various one-time, non-recurring or unusual charges and other items. These charges and other items may include severance and relocation expenses, write-offs or write-downs of assets, impairment charges, facilities closure costs or other business optimization costs. In general, these costs will reduce the Company’s operating income and net income (along with the associated per share measures). Therefore, such charges and other items could have a material adverse effect on the Company’s reported results of operations and the market price of the Company’s securities.
If the Company is unable to successfully implement its growth strategies, its future operating results could suffer.
There are certain risks involved in the Company seeking to expand its business through acquisitions, license agreements, joint ventures and other initiatives. Acquisitions and new license agreements require the Company to ensure that new brands will successfully complement the other brands in its portfolio. The Company assumes the risk that the new brand will not be viewed by the public as favorably as its other brands. In addition, the integration of an acquired company or licensed brand into the Company’s existing business can strain the Company’s current infrastructure with the additional work required and there can be no assurance that the integration of acquisitions or licensed brands will be successful or that acquisitions or licensed brands will generate sales increases. The Company needs to ensure it has the adequate human resources and systems in place to allow for successful assimilation of new businesses. The inability to successfully implement its growth strategies could adversely affect the Company’s future financial condition and results of operations.
The loss or infringement of the Company’s trademarks or other intellectual property rights could have an adverse effect on future results of operations.
The Company believes that its trademarks and other intellectual property rights are vital to the competitiveness and success of its business and therefore it takes appropriate actions to register and protect them. Such actions may not be adequate to prevent imitation
15
of the Company’s products or infringement of its intellectual property rights, or to assure that others will not challenge the Company’s rights, or that such rights will be successfully defended. Moreover, the laws of some foreign countries, including some in which the Company sells its products, may not protect intellectual property rights to the same extent as do the laws of the United States, which could make it more difficult to successfully defend such challenges to them. The Company’s inability to obtain or maintain rights in its trademarks, including its licensed marks, could have an adverse effect on brand image and future results of operations.
Fluctuations in the pricing of commodities or the cost of labor could adversely affect the Company’s ability to produce products at favorable prices.
Some of the Company’s higher-end watch offerings are made with materials such as diamonds, precious metals and gold. The Company relies on independent contractors to manufacture and assemble its watch brands. A significant change in the prices of these commodities or the cost of third-party labor could adversely affect the Company’s business by:
|
|
· |
reducing gross profit margins; and/or |
|
|
· |
forcing an increase in suggested retail prices, which could lead to decreasing consumer demand and higher inventory levels. |
Any and all of the above events could adversely affect the Company’s future cash flows and results of operations.
The Company’s business is subject to foreign currency exchange rate risk.
A significant portion of the Company’s inventory purchases are denominated in Swiss francs. The Company also sells to third-party customers in a variety of foreign currencies, most notably the Euro. The Company reduces its exposure to the Swiss franc and Euro exchange rate risks through a hedging program. Under the hedging program, the Company manages most of its foreign currency exposures on a consolidated basis, which allows it to net certain exposures and take advantage of natural offsets. In the event these exposures do not offset, the Company has the ability under a hedging program to utilize forward exchange contracts and purchased foreign currency options to mitigate foreign currency risk. If the Company does not utilize hedge instruments or if such instruments are unsuccessful at minimizing the risk or are deemed ineffective, any fluctuation of the Swiss franc or Euro exchange rates could impact the future results of operations. Changes in currency exchange rates may also affect relative prices at which the Company and its foreign competitors sell products in the same market. Additionally, a portion of the Company’s net sales are recorded in its foreign subsidiaries in a currency other than the local currency of that subsidiary. This predominantly occurs in the Company’s Hong Kong and Swiss subsidiaries when they sell to Euro and British Pound based customers. Beginning in fiscal 2016, the Company utilized forward exchange contracts to mitigate this exposure. To the extent not hedged, any fluctuation in the Euro and British Pound exchange rates in relation to the Hong Kong dollar and Swiss franc would have an effect on these sales that are recorded in Euros and British Pounds. The currency effect on these sales has an equal effect on their recorded gross profit since the costs of these sales are recorded in the entities’ respective local currency. As a result of these and other foreign currency sales, certain of the Company’s subsidiaries have outstanding foreign currency receivables. Furthermore, since the Company’s consolidated financial statements are presented in U.S. dollars, revenues, income and expenses, as well as assets and liabilities of foreign currency denominated subsidiaries must be translated into U.S. dollars at exchange rates in effect during or at the end of each reporting period. Fluctuations in foreign currency exchange rates could adversely affect the Company’s reported revenues, earnings, financial position and the comparability of results of operations from period to period.
The Grinberg family owns a majority of the voting power of the Company’s stock.
Each share of common stock of the Company is entitled to one vote per share while each share of class A common stock of the Company is entitled to ten votes per share. While the members of the Grinberg family do not own a majority of the Company’s outstanding common stock, by their significant holdings of class A common stock they control a majority of the voting power represented by all outstanding shares of both classes of stock. Consequently, the Grinberg family is in a position to determine or significantly influence any matters that are brought to a vote of the shareholders including, but not limited to, the election of the Board of Directors and any action requiring the approval of shareholders, including any amendments to the Company’s certificate of incorporation, mergers or sales of all or substantially all of the Company’s assets. This concentration of ownership also may delay, defer or even prevent a change in control of the Company and make some transactions more difficult or impossible without the support of the Grinberg family. These transactions might include proxy contests, tender offers, mergers or other purchases of shares of common stock that could give stockholders the opportunity to realize a premium over the then-prevailing market price for shares of the Company’s common stock.
16
The Company’s stock price could fluctuate and possibly decline due to changes in revenue, operating results and cash flows.
The Company’s revenue, results of operations and cash flows can be affected by several factors, some of which are not within its control. Those factors include, but are not limited to, those described as risk factors in this Item 1A. and under “Forward-Looking Statements” on page 1.
Any or all of these factors could cause a decline in revenues or increased expenses, both of which could have an adverse effect on the results of operations. If the Company’s earnings failed to meet the expectations of the public in any given period, the Company’s stock price could fluctuate and possibly decline.
If the Company were to lose its relationship with any of its key customers or distributors or any of such customers or distributors were to experience financial difficulties or go out of business, there may be a significant loss of revenue and operating results.
The Company’s customer base covers a wide range of distribution including national jewelry store chains, department stores, independent regional jewelers, licensors’ retail stores and a network of independent distributors in many countries throughout the world. Except for its agreements with independent distributors, the Company does not have long-term sales contracts with its customers, nor does it have a significant backlog of unfilled orders. Customer purchasing decisions could vary with each selling season. A material change in the Company’s customers’ purchasing decisions could have an adverse effect on its revenue and operating results.
The Company extends credit to its customers based on an evaluation of each customer’s financial condition usually without requiring collateral. Should any of the Company’s larger customers experience financial difficulties, it could result in the Company’s curtailing of doing business with them, an increased rate of product returns or an increase in its exposure related to its accounts receivable. The inability to collect on these receivables could have an adverse effect on the Company’s financial results and cash flows.
The inability or difficulty of the Company’s customers, suppliers and business partners to obtain credit could materially and adversely affect its results of operations and liquidity.
Many of the Company’s customers, suppliers and business partners rely on a stable, liquid and well-functioning financial system to fund their operations and a disruption in their ability to access liquidity could cause serious disruptions to or an overall deterioration of their businesses which could impair their ability to meet their obligations to the Company, including delivering product ordered by the Company and placing or paying for future orders of the Company’s products, any of which could have a material adverse effect on the Company’s results of operations and liquidity.
The Company’s wholesale business could be negatively affected by further changes of ownership, contraction and consolidation in the retail industry, as well as by the consumer shift toward online sales.
A large portion of the Company’s U.S. wholesale business is based on sales to major jewelry store chains and department stores. In recent years, the retail industry has experienced changes in ownership, contraction and consolidations, with a number of jewelry chain stores and department store operators going out of business and liquidating their inventories. Future reorganizations, changes of ownership and consolidations could further reduce the number of retail doors in which the Company’s products are sold and increase the concentration of sales among fewer national or large regional retailers, which could materially adversely affect the Company’s wholesale business. In addition, consumers’ growing preference for purchasing products online may reduce foot traffic at traditional retail stores and increase price competition for the Company’s products, which could discourage traditional retailers from investing in sales support for those products. This could reduce consumer demand for the Company’s products and thereby materially adversely affect the Company’s wholesale business.
If the Company were to lose key members of management or be unable to attract and retain the talent required for the business, operating results could suffer.
The Company’s ability to execute key operating initiatives as well as to deliver product and marketing concepts appealing to target consumers depends largely on the efforts and abilities of key executives and senior management’s competencies. The unexpected loss of one or more of these individuals could have an adverse effect on the future business. The Company cannot guarantee that it will be able to attract and retain the talent and skills needed in the future.
17
If the Company cannot secure financing and credit on favorable terms, the Company’s financial condition and results of operations may be materially adversely affected.
Credit and equity markets remain sensitive to world events and macro-economic developments. Therefore, the Company’s cost of borrowing may increase and it may be more difficult to obtain financing for the Company’s operations or to refinance long-term obligations as they become payable. In addition, the Company’s borrowing costs can be affected by independent rating agencies’ short and long-term debt ratings which are based largely on the Company’s performance as measured by credit metrics including interest coverage and leverage ratios. A decrease in these ratings would likely also increase the Company’s cost of borrowing and make it more difficult for it to obtain financing. A significant increase in the costs that the Company incurs to finance its operations may have a material adverse impact on its business results and financial condition.
A significant portion of the Company’s business is conducted outside of the United States. Many factors affecting business activities outside the United States could adversely impact this business.
Substantially all of the Company’s watches are assembled in Europe and Asia. The Company also generates approximately 45% of its revenue from international sources.
Factors that could affect this business activity vary by region and market and generally include, without limitation:
|
|
· |
instability or changes in social, political and/or economic conditions that could disrupt the trade activity in the countries where the Company’s manufacturers, suppliers and customers are located; |
|
|
· |
the imposition of additional duties, taxes and other charges on imports and exports; |
|
|
· |
changes in foreign laws and regulations; |
|
|
· |
the adoption or expansion of trade sanctions; |
|
|
· |
recessions in foreign economies; and |
|
|
· |
a significant change in currency valuation in specific countries or markets. |
If the Company was unable to protect the security of personal information about its customers or employees or prevent a privacy breach, it could be subject to costly government enforcement actions and private litigation and suffer significant negative publicity which could materially and adversely affect the Company’s results of operations.
As part of the normal course of business the Company is involved in the receipt and storage of electronic information about customers and employees, as well as proprietary financial and non-financial data. Although the Company believes it has taken reasonable and appropriate actions to protect the security of this information, if the Company were to experience a security breach, acts of vandalism, computer viruses, misplaced or lost data, programming and/or human errors or other similar events, it could result in government enforcement actions and private litigation, attract a substantial amount of media attention, and damage the Company’s reputation and its relationships with its customers and employees, materially adversely affecting the Company’s sales and results of operations. This risk has increased with the launch of the Company’s smart watches, which collect and transmit personal data about the consumers who purchase and use them.
The Company relies on information systems to conduct its business, and failure to protect these systems against security breaches could adversely affect its business and results of operations. Additionally, if these systems fail or become unavailable for any significant period of time, the Company’s business could be harmed.
The efficient operation of the Company’s business is dependent on computer hardware and software systems. Information systems are vulnerable to security breaches by computer hackers and cyber terrorists. The Company relies on industry accepted security measures and technology to securely maintain confidential and proprietary information maintained on its information systems. However, these measures and technology may not adequately prevent security breaches. In addition, the unavailability of the information systems or the failure of these systems to perform as anticipated for any reason could disrupt the Company’s business and could result in decreased performance and increased operating costs, causing the Company’s business and results of operations to suffer. Any significant interruption or failure of the Company’s information systems or any significant breach of security could adversely affect the Company’s business and results of operations.
18
The Company is subject to complex and evolving U.S. and foreign laws and regulations regarding privacy and data protection that could result in legal claims, changes to business practices and increased costs that could materially and adversely affect the Company’s results of operations.
The Company is subject to a variety of U.S and foreign laws and regulations governing privacy and data protection. The introduction of new products, such as smart watches, and the expansion of our business in certain jurisdictions may subject us to additional such laws and regulations. These U.S. federal and state and foreign laws and regulations are evolving and the restrictions imposed thereby may increase and are not always clear. There are currently a number of proposals pending before federal, state, and foreign legislative and regulatory bodies that may increase restrictions relating to the receipt, transfer and processing of personal data. In addition, foreign court decisions and regulatory actions could impact our ability to receive, transfer and process personal data relating to our employees and direct and indirect customers. For example, in October 2015 the European Union’s highest court, the European Court of Justice, struck down an agreement with the U.S. government regarding a 15-year-old “safe harbor” relied upon by thousands of companies, including the Company, to transfer personal information of European residents to the United States. On February 2, 2016, the European Commission and the U.S. Department of Commerce announced an agreement on a new framework for transatlantic data flows to replace the invalidated U.S.-E.U. Safe Harbor framework. The final E.U.-U.S. Privacy Shield has not yet been adopted, but is expected to require U.S. companies to commit to robust protections of personal data. Existing and proposed privacy and data protection laws and regulations may result in significant compliance and operating costs and negative publicity for the Company, and may subject it to remedies that may harm its business, including fines and orders to modify or cease existing business practices. Any of the foregoing could materially adversely affect the Company’s results of operations and financial condition.
The Company depends on its information systems to run its business and any significant disruption to those systems could materially disrupt the Company’s business and adversely affect its results of operations.
The Company relies on its information systems to operate every aspect of its world-wide business, including, without limitation, order processing, inventory and supply chain management, customer communications, purchasing and financial reporting. Although the Company attempts to take all reasonable steps to mitigate the risks to its information management systems, including such measures as the use of firewalls, automatically expiring passwords, encryption technology and periodic vulnerability tests, no system can be completely secure against all threats. It is possible that the Company’s information systems will experience system failures, viruses, security breaches, power outages, network and telecommunications failures, usage errors by our employees, harmful acts by our website visitors or other events which could disable or significantly impair the systems’ functionality. Additionally, the Company’s systems may fail to operate properly or effectively, experience problems transitioning to upgraded or replacement systems or difficulties in integrating new systems. Any material disruption or slowdown of the Company’s information systems could result in the loss of critical data, the inability to process and properly record transactions and could materially impair the Company’s ability to conduct business, leading to cancelled orders and lost sales. In addition, the Company engages in e-commerce and is vulnerable to certain additional risks and uncertainties associated with the Internet, including changes in required technology interfaces, website downtime and other technical failures, security breaches and consumer privacy concerns. A breach and loss of data could also subject the Company to liability to its customers or suppliers and could also cause competitive harm if sensitive information is publicized. In the event the Company is not successful in responding to these risks and uncertainties, its online sales may decline, the associated costs with its e-commerce activity may increase and the reputation of its brands may be damaged.
Item 1B. Unresolved Staff Comments
None.
19
Item 2. Properties
The Company leases various facilities in North America, Europe, the Middle East and Asia for its corporate, watch assembly, distribution and sales operations. As of January 31, 2016, the Company’s leased facilities were as follows:
|
Location |
|
Function |
|
Square Footage |
|
Lease Expiration |
|
Moonachie, New Jersey |
|
Watch distribution and repair |
|
100,000 |
|
July 2019 |
|
Paramus, New Jersey |
|
Executive offices |
|
98,300 |
|
June 2018 |
|
Bienne, Switzerland |
|
Watch distribution, assembly and repair |
|
35,790 |
|
October 2017 |
|
Bienne, Switzerland |
|
Corporate functions and watch sales |
|
35,500 |
|
June 2017 |
|
Hong Kong |
|
Watch sales, distribution and repair |
|
16,560 |
|
March 2019 |
|
New York, New York |
|
Public relations office, licensed brand showroom |
|
9,900 |
|
August 2016 |
|
Markham, Canada |
|
Watch sales |
|
7,800 |
|
August 2019 |
|
Hackensack, New Jersey |
|
Warehouse |
|
6,600 |
|
July 2016 |
|
ChangAn Dongguan, China |
|
Quality control and engineering |
|
6,460 |
|
December 2018 |
|
Shanghai, China |
|
Watch sales and distribution |
|
6,050 |
|
January 2017 |
|
Aalen, Germany |
|
Watch sales |
|
5,520 |
|
February 2028 |
|
Munich, Germany |
|
Watch sales and repair |
|
4,380 |
|
January 2017 |
|
Coral Gables, Florida |
|
Caribbean office, watch sales |
|
2,880 |
|
January 2017 |
|
Grenchen, Switzerland |
|
Watch sales |
|
2,800 |
|
July 2016 |
|
Villers le Lac, France |
|
Watch sales |
|
2,510 |
|
January 2016* |
|
Paris, France |
|
Watch sales |
|
1,180 |
|
June 2017 |
|
Singapore |
|
Watch sales, distribution and repair |
|
970 |
|
December 2016 |
|
Dubai, United Arab Emirates |
|
Watch sales |
|
730 |
|
May 2016 |
|
Kuala Lumpur, Malaysia |
|
Watch sales, distribution and repair |
|
200 |
|
January 2017 |
*As of January 31, 2016 the current lease for this facility was under negotiation.
All of the foregoing facilities are used exclusively in connection with the Wholesale segment of the Company’s business except that a portion of the Company’s executive office space in Paramus, New Jersey is used in connection with management of its retail business.
Since acquiring Ebel in 2004, the Company owns an architecturally significant building in La Chaux-de-Fonds, Switzerland.
The Company also owns approximately 2,500 square feet of office space in Hanau, Germany, which it previously used for sales, distribution and watch repair functions.
The Company leases retail space averaging 1,700 square feet per store with leases expiring from May 2016 to September 2025 for the operation of the Company’s 40 retail outlet locations in the United States.
The Company believes that its existing facilities are suitable and adequate for its current operations.
Item 3. Legal Proceedings
Legal contingencies are recorded in accordance with the accounting guidance for contingencies. Contingencies are inherently unpredictable and it is possible that results of operations or cash flows could be materially and adversely affected in any particular period by unfavorable developments in, or resolution or disposition of, such matters. For those legal proceedings and claims in respect of which the Company believes that it is reasonably possible that a loss may result that is materially in excess of the accrual (if any) established for the matter, the Company either discloses an estimate of such possible loss or range of loss or includes a statement that such an estimate cannot be made. The Company is party to legal proceedings and contingencies, the resolution of which is not expected to materially affect its financial condition or future results of operations beyond the amounts accrued.
A complaint that was filed on February 4, 2015 against the Company and several of its officers in the United States District Court for the District of New Jersey, which alleged that, between March 26, 2014 and November 13, 2014, the Company made false and misleading statements about the Company’s financial performance, was voluntarily dismissed with prejudice on June 30, 2015.
20
Item 4. Mine Safety Disclosures
Not applicable.
21
PART II
Item 5. Market for Registrant’s Common Equity, Related Stockholder Matters and Issuer Purchases of Equity Securities
As of March 24, 2016 there were 49 holders of record of the Company’s class A common stock and, the Company estimates, 9,300 beneficial owners of the common stock represented by 393 holders of record. The Company’s common stock is traded on the New York Stock Exchange under the symbol “MOV” and on March 24, 2016, the closing price of the Company’s common stock was $29.62. In connection with the October 7, 1993 public offering, each share of the Company’s then currently existing class A common stock was converted into 10.46 shares of new class A common stock, par value of $0.01 per share (the “class A common stock”). Each share of common stock is entitled to one vote per share and each share of class A common stock is entitled to 10 votes per share on all matters submitted to a vote of the shareholders. Each holder of class A common stock is entitled to convert, at any time, any and all such shares into the same number of shares of common stock. Each share of class A common stock is converted automatically into common stock in the event that the beneficial or record ownership of such shares of class A common stock is transferred to any person, except to certain family members or affiliated persons deemed “permitted transferees” pursuant to the Company’s Restated Certificate of Incorporation as amended. The class A common stock is not publicly traded and, consequently, there is currently no established public trading market for these shares. The following table sets forth high and low bid quotations reported for the Company’s common stock for each quarter during fiscal 2016 and 2015 and the dividends declared per share in respect of each such quarter.
|
|
|
Fiscal Year Ended January 31, 2016 |
|
|
|
|
|
Fiscal Year Ended January 31, 2015 |
|
|
|
|
||||||||||||
|
Quarter Ended |
|
Low |
|
|
High |
|
|
Dividends per Share |
|
|
Low |
|
|
High |
|
|
Dividends per Share |
|
||||||
|
April 30 |
|
$ |
23.32 |
|
|
$ |
31.78 |
|
|
$ |
0.11 |
|
|
$ |
35.55 |
|
|
$ |
46.39 |
|
|
$ |
0.10 |
|
|
July 31 |
|
$ |
24.63 |
|
|
$ |
29.43 |
|
|
$ |
0.11 |
|
|
$ |
36.95 |
|
|
$ |
43.20 |
|
|
$ |
0.10 |
|
|
October 31 |
|
$ |
21.42 |
|
|
$ |
28.59 |
|
|
$ |
0.11 |
|
|
$ |
32.58 |
|
|
$ |
44.04 |
|
|
$ |
0.10 |
|
|
January 31 |
|
$ |
21.54 |
|
|
$ |
27.83 |
|
|
$ |
0.11 |
|
|
$ |
23.50 |
|
|
$ |
38.70 |
|
|
$ |
0.11 |
|
During each of fiscal 2016 and 2015, the Company declared four quarters of dividends as indicated in the table above. The decision of whether to declare any future cash dividend, including the amount of any such dividend and the establishment of record and payment dates, will be determined, in each quarter, by the Board of Directors, in its sole discretion.
On November 25, 2014, the Board approved an increase in the Company’s share repurchase program, from $50.0 million, originally approved on March 21, 2013, to $100.0 million. Under the program, the Company was authorized to purchase shares of its outstanding common stock from time to time, depending on market conditions, share price and other factors, through open market purchases, repurchase plans, block trades or otherwise. This authorization expired on January 31, 2016. During the fiscal year ended January 31, 2016, the Company repurchased a total of 1,858,939 shares of its common stock at a total cost of approximately $48.7 million, or an average of $26.22 per share, which included 28,000 shares repurchased from the Movado Group Foundation at a total cost of approximately $0.8 million, or an average of $27.33 per share. On March 31, 2016, the Board approved a new share repurchase program pursuant to which the Company is authorized to purchase up to $50.0 million of its outstanding common stock from time to time, depending on market conditions, share price and other factors, through open market purchases, repurchase plans, block trades or otherwise. This authorization expires on September 30, 2017.
At the election of an employee, upon the vesting of a stock award or the exercise of a stock option, shares of common stock having an aggregate value on the vesting of the award or the exercise date of the option, as the case may be, equal to the employee’s withholding tax obligation may be surrendered to the Company by netting them from the vested shares issued. Similarly, shares having an aggregate value equal to the exercise price of an option may be tendered to the Company in payment of the option exercise price and netted from the shares of common stock issued upon the option exercise. An aggregate of 21,076 shares were repurchased during the fiscal year ended January 31, 2016 as a result of the surrender of shares of common stock in connection with the vesting of certain restricted stock awards and stock options.
22
The following table summarizes information about the Company’s purchases of shares of its common stock in the fourth quarter of fiscal 2016.
Issuer Repurchase of Equity Securities
|
Period |
|
Total Number of Shares Purchased |
|
|
Average Price Paid |
|
|
Total Number of Shares Purchased as Part of Publicly Announced Plans or Programs |
|
|
Maximum Amount that May Yet Be Purchased Under the Plans or Programs |
|
||||
|
November 1, 2015 – November 30, 2015 |
|
|
20,000 |
|
|
$ |
24.94 |
|
|
|
20,000 |
|
|
$ |
16,699,923 |
|
|
December 1, 2015 – December 31, 2015 |
|
|
67,700 |
|
|
$ |
26.53 |
|
|
|
67,700 |
|
|
$ |
14,904,142 |
|
|
January 1, 2016 – January 31, 2016 |
|
|
23,243 |
|
|
$ |
22.43 |
|
|
|
23,243 |
|
|
$ |
14,382,827 |
|
|
Total |
|
|
110,943 |
|
|
$ |
25.38 |
|
|
|
110,943 |
|
|
$ |
14,382,827 |
|
PERFORMANCE GRAPH
The performance graph set forth below compares the cumulative total shareholder return of the Company’s shares of common stock for the last five fiscal years through the fiscal year ended January 31, 2016 with that of the Broad Market (NYSE Stock Market – U.S. Companies), the S&P SmallCap 600 Index and the Russell 2000 Index. Each index assumes an initial investment of $100.0 on January 31, 2011 and the reinvestment of dividends (where applicable).
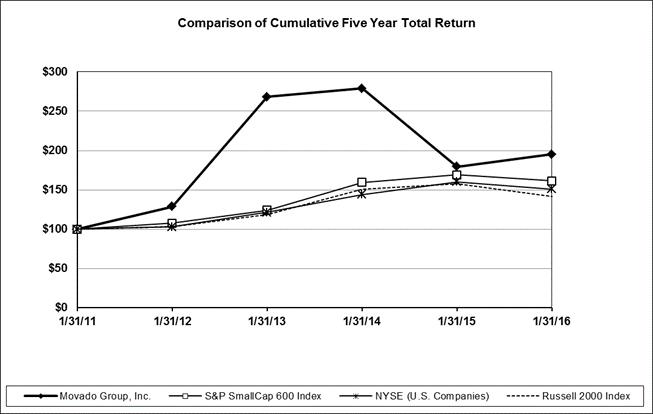
|
Company Name / Index |
|
1/31/11 |
|
|
1/31/12 |
|
|
1/31/13 |
|
|
1/31/14 |
|
|
1/31/15 |
|
|
1/31/16 |
|
||||||
|
Movado Group, Inc. |
|
|
100.00 |
|
|
|
128.74 |
|
|
|
268.35 |
|
|
|
278.92 |
|
|
|
179.64 |
|
|
|
195.28 |
|
|
S&P SmallCap 600 Index |
|
|
100.00 |
|
|
|
107.50 |
|
|
|
124.11 |
|
|
|
159.41 |
|
|
|
169.22 |
|
|
|
161.28 |
|
|
NYSE (U.S. Companies) |
|
|
100.00 |
|
|
|
102.87 |
|
|
|
121.45 |
|
|
|
143.97 |
|
|
|
160.10 |
|
|
|
151.21 |
|
|
Russell 2000 Index |
|
|
100.00 |
|
|
|
102.86 |
|
|
|
118.78 |
|
|
|
150.88 |
|
|
|
157.53 |
|
|
|
141.90 |
|
23
Item 6. Selected Financial Data
The selected financial data presented below has been derived from the Consolidated Financial Statements. This information should be read in conjunction with, and is qualified in its entirety by, the Consolidated Financial Statements and “Management’s Discussion and Analysis of Financial Condition and Results of Operations” contained in Item 7 of this report. Amounts are in thousands except per share amounts:
|
|
Fiscal Year Ended January 31, |
|
|||||||||||||||||
|
|
2016 |
|
|
2015 |
|
|
2014 |
|
|
2013 |
|
|
2012 |
|
|||||
|
Statement of income data: |
|
|
|
|
|
|
|
|
|
|
|
|
|
|
|
|
|
|
|
|
Net sales (2) (3) (4) |
$ |
594,923 |
|
|
$ |
586,980 |
|
|
$ |
570,255 |
|
|
$ |
505,478 |
|
|
$ |
468,117 |
|
|
Cost of sales (1) (5) |
|
277,993 |
|
|
|
276,998 |
|
|
|
264,994 |
|
|
|
227,596 |
|
|
|
211,772 |
|
|
Gross profit (1) (2) (3) (4) (5) |
|
316,930 |
|
|
|
309,982 |
|
|
|
305,261 |
|
|
|
277,882 |
|
|
|
256,345 |
|
|
Selling, general and administrative (1) (6) (7) |
|
246,823 |
|
|
|
238,495 |
|
|
|
237,519 |
|
|
|
228,536 |
|
|
|
222,782 |
|
|
Operating income (1) (2) (3) (4) (5) (6) (7) |
|
70,107 |
|
|
|
71,487 |
|
|
|
67,742 |
|
|
|
49,346 |
|
|
|
33,563 |
|
|
Other income, net (8) (9) |
|
— |
|
|
|
— |
|
|
|
1,526 |
|
|
|
— |
|
|
|
747 |
|
|
Interest expense |
|
(1,109) |
|
|
|
(489) |
|
|
|
(436 |
) |
|
|
(434 |
) |
|
|
(1,277 |
) |
|
Interest income |
|
127 |
|
|
|
166 |
|
|
|
86 |
|
|
|
144 |
|
|
|
199 |
|
|
Income before income taxes |
|
69,125 |
|
|
|
71,164 |
|
|
|
68,918 |
|
|
|
49,056 |
|
|
|
33,232 |
|
|
Provision for / (benefit from) income taxes (10) (11) (12) |
|
23,360 |
|
|
|
19,264 |
|
|
|
17,373 |
|
|
|
(8,812 |
) |
|
|
604 |
|
|
Net income |
|
45,765 |
|
|
|
51,900 |
|
|
|
51,545 |
|
|
|
57,868 |
|
|
|
32,628 |
|
|
Less: Net income attributed to noncontrolling interests |
|
671 |
|
|
|
124 |
|
|
|
668 |
|
|
|
785 |
|
|
|
633 |
|
|
Net income attributed to Movado Group, Inc. |
$ |
45,094 |
|
|
$ |
51,776 |
|
|
$ |
50,877 |
|
|
$ |
57,083 |
|
|
$ |
31,995 |
|
|
Basic income per share: |
|
|
|
|
|
|
|
|
|
|
|
|
|
|
|
|
|
|
|
|
Weighted basic average shares outstanding |
|
23,525 |
|
|
|
25,276 |
|
|
|
25,506 |
|
|
|
25,267 |
|
|
|
24,926 |
|
|
Net income per share attributed to Movado Group, Inc. |
$ |
1.92 |
|
|
$ |
2.05 |
|
|
$ |
1.99 |
|
|
$ |
2.26 |
|
|
$ |
1.28 |
|
|
Diluted income per share: |
|
|
|
|
|
|
|
|
|
|
|
|
|
|
|
|
|
|
|
|
Weighted diluted average shares outstanding |
|
23,774 |
|
|
|
25,581 |
|
|
|
25,849 |
|
|
|
25,664 |
|
|
|
25,141 |
|
|
Net income per share attributed to Movado Group, Inc. |
$ |
1.90 |
|
|
$ |
2.02 |
|
|
$ |
1.97 |
|
|
$ |
2.22 |
|
|
$ |
1.27 |
|
|
Cash dividends paid per share |
$ |
0.44 |
|
|
$ |
0.40 |
|
|
$ |
0.26 |
|
|
$ |
1.45 |
|
|
$ |
0.12 |
|
|
Balance sheet data (end of period): |
|
|
|
|
|
|
|
|
|
|
|
|
|
|
|
|
|
|
|
|
Working capital (13) |
$ |
410,853 |
|
|
$ |
412,996 |
|
|
$ |
388,571 |
|
|
$ |
349,835 |
|
|
$ |
342,175 |
|
|
Total assets |
$ |
585,170 |
|
|
$ |
583,023 |
|
|
$ |
578,610 |
|
|
$ |
526,362 |
|
|
$ |
507,562 |
|
|
Total long-term debt |
$ |
35,000 |
|
|
$ |
— |
|
|
$ |
— |
|
|
$ |
— |
|
|
$ |
— |
|
|
Total equity |
$ |
441,147 |
|
|
$ |
484,285 |
|
|
$ |
465,990 |
|
|
$ |
425,692 |
|
|
$ |
394,074 |
|
|
(1) |
Fiscal 2016 cost of sales included a pre-tax charge of $0.6 million and selling, general and administrative expenses included a pre-tax charge of $3.4 million, as a result of actions taken by the Company in fiscal 2016 to achieve greater operating efficiencies and streamline its operations. |
|
(2) |
Fiscal 2014 net sales include a pre-tax charge of $7.8 million for anticipated returns in fiscal 2015, as a result of the Company’s decision to reduce the presence of ESQ Movado while expanding the Movado brand offering in certain retail doors. |
|
(3) |
Fiscal 2013 net sales include a sales allowance of $4.9 million related to the repositioning of the Coach watch brand. |
|
(4) |
Fiscal 2012 net sales include a $3.0 million sale of certain proprietary watch movements. |
|
(5) |
Fiscal 2014 includes a $2.5 million pre-tax duty refund received relating to payments made by the Company in calendar years 2008 through 2011 for drawback claims filed with U.S. Customs & Border Protection and a $7.5 million pre-tax charge related to anticipated ESQ Movado product returns and the write down of ESQ Movado excess inventory. This charge resulted from the Company’s decision to reduce the presence of ESQ Movado while expanding the Movado brand offering in certain retail doors. |
|
(6) |
Fiscal 2014 includes a $2.0 million donation to the Movado Group Foundation and a $0.8 million pre-tax charge related to the write down of excess displays and point of sale materials, as a result of the Company’s decision to reduce the presence of ESQ Movado while expanding the Movado brand offering in certain retail doors. |
|
(7) |
Fiscal 2013 and 2012 each includes a $3.0 million donation to the Movado Group Foundation. |
|
(8) |
Fiscal 2014 other income consists of a pre-tax gain of $1.5 million on the sale of a building which was completed in the first quarter of fiscal 2014. |
|
(9) |
Fiscal 2012 other income consists of a pre-tax gain of $0.7 million on the sale of a building which was completed in the second quarter of fiscal 2012. |
|
(10) |
Fiscal 2014 provision for income taxes includes a benefit of $1.0 million related to U.S. and foreign tax settlements and the release of uncertain tax positions. |
24
|
(11) |
Fiscal 2013 effective tax rate of (18.0)% includes a tax benefit of $19.8 million attributable to the reversal of a majority of the valuation allowance on the U.S. net deferred tax assets and a tax benefit of $0.5 million attributable to foreign business restructurings in Japan and the UK. |
|
(12) |
Fiscal 2012 effective tax rate of 1.8% includes a release of a valuation allowance against net deferred tax assets in Switzerland, partially offset by the accrual of a Swiss withholding tax settlement, the continued recording of other valuation allowances, most notably the valuation allowance against net U.S. deferred tax assets, and the tax accrued on the repatriation of foreign earnings. |
|
(13) |
The Company defines working capital as current assets less current liabilities. |
25
Item 7. Management’s Discussion and Analysis of Financial Condition and Results of Operations
GENERAL
Net Sales. The Company operates and manages its business in two principal business segments: Wholesale and Retail. The Company also operates in two geographic locations: United States and International. Since April 30, 2014, the Company has divided its watch business into two principal categories: the luxury and the licensed brands categories. The luxury brands category consists of the Ebel®, Concord®, Movado® and ESQ® Movado brands. Previously, the Company classified the Movado and the ESQ Movado brands together as a separate category referred to as accessible luxury. Watches in the licensed brands category include the following brands manufactured and distributed under license agreements with the respective brand owners: Coach®, HUGO BOSS®, Juicy Couture®, Lacoste®, Tommy Hilfiger® and SCUDERIA FERRARI®. These changes to the Company’s watch brand categories did not change the Company’s reportable segments.
The primary factors that influence annual sales are general economic conditions in the Company’s U.S. and international markets, new product introductions, the level and effectiveness of advertising and marketing expenditures and product pricing decisions.
Approximately 45.2% of the Company’s total sales are from international markets (see Note 14 to the Consolidated Financial Statements), and therefore reported sales made in those markets are affected by foreign exchange rates. The Company’s international sales are primarily billed in local currencies (predominantly Euros, British pounds and Swiss francs) and translated to U.S. dollars at average exchange rates for financial reporting purposes.
The Company divides its business into two major geographic locations: United States operations, and International, which includes the results of all other Company operations. The allocation of geographic revenue is based upon the location of the customer. The Company’s International operations in Europe, the Americas (excluding the United States), the Middle East and Asia account for 21.2%, 10.5%, 7.4% and 6.1%, respectively, of the Company’s total net sales for fiscal 2016. Substantially all of the Company’s International assets are located in Switzerland and Hong Kong.
The Company’s business is seasonal. There are two major selling seasons in the Company’s markets: the spring season, which includes school graduations and several holidays and, most importantly, the Christmas and holiday season. Major selling seasons in certain international markets center on significant local holidays that occur in late winter or early spring. The Company’s net sales historically have been higher during the second half of the fiscal year. The second half of each fiscal year accounted for 55.3%, 54.9%, and 56.5% of the Company’s net sales for the fiscal years ended January 31, 2016, 2015 and 2014, respectively.
The Company’s retail operations consist of 40 retail outlet locations throughout the United States.
The significant factors that influence annual sales volumes in the Company’s retail operations are similar to those that influence U.S. wholesale sales. In addition, most of the Company’s retail outlet locations are near vacation destinations and, therefore, the seasonality of these stores is driven by the peak tourist seasons associated with these locations.
In the fourth quarter of fiscal 2014, the Company recorded a pre-tax charge of $7.8 million to net sales, for anticipated returns in fiscal 2015 resulting from the Company’s strategic decision to reduce the presence of ESQ Movado watches in certain retail doors while expanding the Movado brand offering. The Company believes it did not fully realize all of the anticipated benefits of this strategy which was intended to drive incremental sales of its more productive Movado brand watch families by utilizing the increased case space at the point of sale that otherwise would have been occupied by relatively less productive ESQ Movado SKUs. Although Movado brand sales at retail increased while, at the same time, as expected, sales of ESQ Movado watches at retail declined, there was less of an increase than expected in the level of Movado watch sales at wholesale due to retailers tightly managing their inventory. The Company continues to offer ESQ Movado only in select retail locations as well as its direct-to-consumer outlet locations. The Company has discontinued the production of ESQ Movado watches going forward and, accordingly, has extended its ESQ watch license with Hearst only through December 31, 2016, with the right to sell any remaining inventory for up to six months thereafter.
Gross Margins. The Company’s overall gross margins are primarily affected by four major factors: channel and product sales mix, product pricing strategy, manufacturing costs and fluctuation in foreign currency exchange rates, in particular the relationship between the U.S. dollar and the Swiss franc and the Euro. Gross margins for the Company may not be comparable to those of other companies, since some companies include all the costs related to their distribution networks in cost of sales whereas the Company does not include the costs associated with its U.S. and Asia warehousing and distribution facilities nor the occupancy costs for the Retail segment in the cost of sales line item. Those costs are included in selling, general and administrative expenses.
Gross margins vary among the brands included in the Company’s portfolio and also among watch models within each brand. Watches in the luxury brands category generally earn higher gross margin percentages than watches in the licensed brands category. The difference in gross margin percentages for the licensed brands category is primarily due to the impact of royalty payments made on the
26
licensed brands. Gross margins in the Company’s outlet business are affected by the mix of product sold and may exceed those of the wholesale business since the Company earns margins on its outlet location sales from manufacture to point of sale to the consumer.
All of the Company’s brands compete with a number of other brands not only on styling but also on wholesale and retail price. The Company’s ability to improve margins through price increases is therefore, to some extent, constrained by competitors’ actions.
Cost of sales of the Company’s products consists primarily of component costs, royalties, assembly costs, depreciation, amortization and unit overhead costs associated with the Company’s supply chain operations in Switzerland and Asia. The Company’s supply chain operations consist of logistics management of assembly operations and product sourcing in Switzerland and Asia and minor assembly in Switzerland. Through productivity improvement efforts, the Company has controlled the level of overhead costs and maintained flexibility in its cost structure by outsourcing a significant portion of its component and assembly requirements.
Cost of sales of the Company’s products includes costs for raw material and components, as well as labor for assembly of finished goods, all of which can be impacted by inflation. While inflation in costs has negatively impacted gross margin percentage, this effect has not been material to the Company’s results of operations for the periods presented in this report. A significant increase in these costs due to inflation could have a material adverse effect on the Company’s future results of operations. While the Company may seek to offset the negative inflationary impact on these costs with price increases on its products, its ability to effectively do so will depend on the extent it can pass on price increases and still remain competitive in the marketplace.
In fiscal 2016, the Company recorded a $0.6 million pre-tax charge as a result of actions taken by the Company to achieve greater operating efficiencies and streamline its operations.
In the fourth quarter of fiscal 2014, gross margin was impacted by $7.5 million as a result of the pre-tax charge related to anticipated ESQ Movado watch brand returns and the write down of ESQ Movado excess inventory. This charge resulted from the Company’s decision to reduce the presence of ESQ Movado while expanding the Movado brand offering in certain retail doors. The Company reallocated certain of the ESQ Movado retail space in the first half of fiscal 2015 to drive incremental sales of its more productive Movado brand watch families, and continues to offer ESQ Movado only in select retail locations as well as its direct-to-consumer outlets. The Company has discontinued the production of ESQ Movado watches going forward and, accordingly, has extended its ESQ watch license with Hearst only through December 31, 2016, with the right to sell any remaining inventory for up to six months thereafter.
In calendar years 2010 through 2012, drawback claims were filed with U.S. Customs & Border Protection (“CBP”) to recover duty payments made by the Company in calendar years 2008 through 2011. The drawback claims concerned duty paid on watches that were subsequently exported from the United States. A number of drawback claims filed on behalf of the Company were denied by CBP in calendar year 2012 and an administrative protest was filed requesting reconsideration of the denials. This protest was approved and, as a result, in the fourth quarter of fiscal 2014 the Company recorded and received a net pre-tax refund of $2.5 million. The Company does not anticipate receipt of any additional refunds related to this matter nor does the Company anticipate return of any of these refunds to CBP.
Since a substantial amount of the Company’s product costs are incurred in Swiss francs, fluctuations in the U.S. dollar/Swiss franc exchange rate can impact the Company’s cost of goods sold and, therefore, its gross margins. The Company reduces its exposure to the Swiss franc exchange rate risk through a hedging program. Under the hedging program, the Company manages most of its foreign currency exposures on a consolidated basis, which allows it to net certain exposures and take advantage of natural offsets. In the event these exposures do not offset, the Company has the ability to hedge its Swiss franc purchases using a combination of forward contracts and purchased currency options. The Company’s hedging program mitigated the impact of the exchange rate fluctuations on product costs and gross margins for fiscal years 2016, 2015 and 2014.
Selling, General and Administrative (“SG&A”) Expenses. The Company’s SG&A expenses consist primarily of marketing, selling, distribution, general and administrative expenses. In fiscal 2016, the Company recorded a $3.4 million pre-tax charge for severance agreements, occupancy costs and fixed assets, related to the Company’s operating efficiencies initiative and other items as a result of actions taken to achieve greater operating efficiencies and streamline its operations. In fiscal 2014, the Company recorded a $2.0 million pre-tax charge related to donations made to the Movado Group Foundation. In fiscal 2014, the Company also recorded a $0.8 million pre-tax charge related to the write down of excess displays and point of sale materials, as a result of the Company’s decision to reduce the presence of ESQ Movado while expanding the Movado brand offering in certain retail doors.
27
Annual marketing expenditures are based principally on overall strategic considerations relative to maintaining or increasing market share in markets that management considers to be crucial to the Company’s continued success as well as on general economic conditions in the various markets around the world in which the Company sells its products. Marketing expenses include various forms of media advertising, digital advertising and co-operative advertising with customers and distributors and other point of sale marketing and promotion spending.
Selling expenses consist primarily of salaries, sales commissions, sales force travel and related expenses, depreciation and amortization, expenses associated with the annual Baselworld Watch and Jewelry Show and other industry trade shows and operating costs incurred in connection with the Company’s retail business. Sales commissions vary with overall sales levels. Retail selling expenses consist primarily of payroll related and store occupancy costs.
Distribution expenses consist primarily of salaries of distribution staff, rental and other occupancy costs, security, depreciation and amortization of furniture and leasehold improvements and shipping supplies.
General and administrative expenses consist primarily of salaries and other employee compensation including performance based compensation, employee benefit plan costs, office rent, management information systems costs, professional fees, bad debts, depreciation and amortization of furniture, computer software and leasehold improvements, patent and trademark expenses and various other general corporate expenses.
Interest Expense. To the extent it borrows, the Company records interest expense on its revolving credit facility. Additionally, interest expense includes the amortization of deferred financing costs associated with the Company’s revolving credit facility.
CRITICAL ACCOUNTING POLICIES AND ESTIMATES
The Company’s consolidated financial statements have been prepared in accordance with accounting principles generally accepted in the United States and those significant policies are more fully described in Note 2 to the Company’s consolidated financial statements. The preparation of these financial statements and the application of certain critical accounting policies require management to make judgments based on estimates and assumptions that affect the information reported. On an on-going basis, management evaluates its estimates and judgments, including those related to sales discounts and markdowns, product returns, bad debt, inventories, income taxes, warranty obligations, useful lives of property, plant and equipment, impairments, stock-based compensation and contingencies and litigation. Management bases its estimates and judgments about the carrying values of assets and liabilities that are not readily apparent from other sources on historical experience, contractual commitments and on various other factors that are believed to be reasonable under the circumstances. Actual results could differ from these estimates. Management believes the following are the critical accounting policies requiring significant judgments and estimates used in the preparation of its consolidated financial statements.
Revenue Recognition
In the Wholesale segment, the Company recognizes revenue upon transfer of title and risk of loss in accordance with its FOB shipping point terms of sale and after the sales price is fixed and determinable and collectability is reasonably assured. In the Retail segment, transfer of title and risk of loss occurs at the time of register receipt. The Company records estimates for sales returns and sales and cash discount allowances as a reduction of revenue in the same period that the sales are recorded. These estimates are based upon historical analysis, customer agreements and/or currently known factors that arise in the normal course of business. While returns have historically been within the Company’s expectations and the provisions established, future return rates may differ from those experienced in the past. In the event that returns are authorized at a rate significantly higher than the Company’s historical rate, the resulting returns could have an adverse impact on its operating results for the period in which such returns occur.
During the fourth quarter of fiscal 2016, the Company announced the launch of two distinct smart watch collections with iOS and Android compatible software apps: Movado Motion (Swiss watches utilizing Silicon Valley’s Fullpower Technologies, Inc.’s Motion X-365 end to end solution) and Movado’s BOLD Motion (watches utilizing HP Inc.’s smart accessories technologies). Smart watches contain hardware and software components. Software components consist of both firmware embedded in the physical watch as well as an app that will run on iOS and Android mobile devices. The hardware and software components function together to deliver the watches’ essential functionality. As typical with numerous consumer products containing embedded or companion software, updates to the software will be provided from time to time, when and if available. Updates are generally limited to bug fixes or enhancements that incrementally improve on the existing functionality. Arrangements, including those that combine hardware (watch) with software that function together to deliver the watch’s essential functionality are considered multiple element arrangements and are subject to the accounting principles applicable to such arrangements.
28
For multiple element arrangements that include smart watches containing software essential to the smart watch’s functionality and undelivered software elements (cloud service updates and app upgrades) that relate to the smart watch’s essential software, the Company allocates revenue to all deliverables based on their relative selling prices. In such circumstances, the accounting principles establish a hierarchy to determine the selling price to be used for allocating revenue to deliverables as follows: (i) vendor-specific objective evidence of fair value (VSOE), (ii) third-party evidence of selling price (TPE), and (iii) best estimate of the selling price (ESP). Because the Company has neither VSOE nor TPE for the software elements, revenue is allocated to these rights and services based on the Company’s ESPs. ESPs for the software elements reflect the Company’s best estimate of the selling prices if they were sold regularly on a stand-alone basis.
The Company has identified multiple deliverables contained in its smart watch collections. The first deliverable is the watch along with the software essential to the functionality of the watch delivered at the time of sale. The second deliverable is the software downloaded free of charge that enables users to sync and view data on the Company’s mobile app. The third deliverable is the embedded right included with the purchase to receive unspecified firmware and software upgrades, when and if available, as well as related cloud storage services. The Company allocates revenue to all deliverables using the relative selling price method. Amounts allocated to the delivered smart watch collections and the related essential software are recognized at the time of sale, provided the other conditions for revenue recognition have been met. Amounts allocated to the cloud service and app updates are deferred and recognized on a straight-line basis over the estimated two year period the updates are expected to be provided.
Allowance for Doubtful Accounts
Accounts receivable are reduced by an allowance for amounts that may be uncollectible in the future. Estimates are used in determining the allowance for doubtful accounts and are based on an analysis of the aging of accounts receivable, assessments of collectability based on historical trends, the financial condition of the Company’s customers and an evaluation of economic conditions. In general, the actual bad debt losses have historically been within the Company’s expectations and the allowances it established. As of January 31, 2016, except for those accounts provided for in the reserve for doubtful accounts, the Company knew of no situations with any of the Company’s major customers which would indicate the customer’s inability to make their required payments.
Inventories
The Company values its inventory at the lower of cost or market. Cost is determined using the average cost method. The Company reviews its on-hand inventory to determine amounts, if any, of inventory that is deemed discontinued, excess, or unsaleable. Inventory classified as discontinued, together with the related component parts that can be assembled into saleable finished goods, is sold primarily through the Company’s retail outlet locations. When management determines that finished product is unsaleable or that it is economically impractical to build the excess components into watches for sale, a charge is recorded to value those products and components at the lower of cost or market value.
Long-Lived Assets
The Company periodically reviews the estimated useful lives of its depreciable assets based on factors including historical experience, the expected beneficial service period of the asset, the quality and durability of the asset and the Company’s maintenance policy including periodic upgrades. Changes in useful lives are made on a prospective basis unless factors indicate the carrying amounts of the assets may not be recoverable and an impairment is necessary.
The Company performs an impairment review of its long-lived assets once events or changes in circumstances indicate, in management’s judgment, that the carrying value of such assets may not be recoverable. When such a determination has been made, management compares the carrying value of the assets with their estimated future undiscounted cash flows. If it is determined that an impairment has occurred, the loss is recognized during that period. The impairment is calculated as the difference between asset carrying values and their estimated fair values.
Warranties
All watches sold by the Company come with limited warranties covering the movement against defects in material and workmanship for periods ranging from two to three years from the date of purchase, with the exception of Tommy Hilfiger watches, for which the warranty period is ten years. In addition, the warranty period is five years for the gold plating on certain Movado watch cases and bracelets. The Company records an estimate for future warranty costs based on historical repair costs. Warranty costs have historically been within the Company’s expectations and the provisions established. If such costs were to substantially exceed estimates, they could have an adverse effect on the Company’s operating results.
29
Stock-Based Compensation
Under the accounting guidance for share-based payments, the Company utilizes the Black-Scholes option-pricing model to calculate the fair value of each employee stock option at its grant date which requires that certain assumptions be made. The expected life of stock option grants is determined using historical data and represents the time period during which the stock option is expected to be outstanding until it is exercised. The risk free interest rate is the yield on the grant date of U.S. Treasury constant maturities with a maturity date closest to the expected life of the stock option. The expected stock price volatility is derived from historical volatility and calculated based on the estimated term structure of the stock option grant. The expected dividend yield is calculated using a historical average of annualized dividend yields.
Compensation expense for equity instruments is accrued based on the estimated number of instruments for which the requisite service is expected to be rendered. This estimate is reflected in the period the stock option is either granted or canceled. Expense related to stock option compensation is recognized on a straight-line basis over the vesting term.
Income Taxes
The Company follows the asset and liability method of accounting for income taxes under which deferred tax assets and liabilities are recognized for the future tax consequences attributable to differences between the financial statement carrying amounts of existing assets and liabilities and their respective tax bases. Deferred tax assets and liabilities are measured using enacted tax laws and tax rates, in each jurisdiction where the Company operates, and applied to taxable income in the years in which those temporary differences are expected to be recovered or settled. The effect on deferred tax assets and liabilities due to a change in tax rates is recognized in income in the period that includes the enactment date. In addition, the amounts of any future tax benefits are reduced by a valuation allowance to the extent such benefits are not expected to be realized on a more-likely-than-not basis. The Company calculates estimated income taxes in each of the jurisdictions in which it operates. This process involves estimating actual current tax expense along with assessing temporary differences resulting from differing treatment of items for both book and tax purposes.
The Company follows guidance for accounting for uncertainty in income taxes. This guidance clarifies the accounting for uncertainty in income taxes recognized in an enterprise’s financial statements and prescribes a recognition threshold and measurement standard for the financial statement recognition and measurement of an income tax position taken or expected to be taken in a tax return. This guidance also provides guidance for de-recognition, classification, interest and penalties, accounting in interim periods, disclosures and transitions.
RESULTS OF OPERATIONS
The following is a discussion of the results of operations for fiscal 2016 compared to fiscal 2015 and fiscal 2015 compared to fiscal 2014 along with a discussion of the changes in financial condition during fiscal 2016.
The following are net sales by business segment and geographic location (in thousands):
|
|
Fiscal Year Ended January 31, |
|
|||||||||
|
|
2016 |
|
|
2015 |
|
|
2014 |
|
|||
|
Wholesale: |
|
|
|
|
|
|
|
|
|
|
|
|
United States |
$ |
261,292 |
|
|
$ |
255,705 |
|
|
$ |
243,830 |
|
|
International |
|
268,717 |
|
|
|
266,555 |
|
|
|
267,160 |
|
|
Retail |
|
64,914 |
|
|
|
64,720 |
|
|
|
59,265 |
|
|
Net sales |
$ |
594,923 |
|
|
$ |
586,980 |
|
|
$ |
570,255 |
|
The following are net sales by category (in thousands):
|
|
Fiscal Year Ended January 31, |
|||||||||
|
|
2016 |
|
|
2015 |
|
|
2014 |
|||
|
Wholesale: |
|
|
|
|
|
|
|
|
|
|
|
Luxury brands category |
$ |
219,012 |
|
|
$ |
212,684 |
|
|
$ |
220,267 |
|
Licensed brands category |
|
297,227 |
|
|
|
294,316 |
|
|
|
276,356 |
|
After-sales service and all other |
|
13,770 |
|
|
|
15,260 |
|
|
|
14,367 |
|
Total Wholesale |
|
530,009 |
|
|
|
522,260 |
|
|
|
510,990 |
|
Retail |
|
64,914 |
|
|
|
64,720 |
|
|
|
59,265 |
|
Consolidated total |
$ |
594,923 |
|
|
$ |
586,980 |
|
|
$ |
570,255 |
30
The following table presents the Company’s results of operations expressed as a percentage of net sales for the fiscal years indicated:
|
|
Fiscal Year Ended January 31, |
|
|||||||||
|
|
2016 % of net sales |
|
|
2015 % of net sales |
|
|
2014 % of net sales |
|
|||
|
Net sales |
|
100.0 |
% |
|
|
100.0 |
% |
|
|
100.0 |
% |
|
Gross margin |
|
53.3 |
% |
|
|
52.8 |
% |
|
|
53.5 |
% |
|
Selling, general and administrative expenses |
|
41.5 |
% |
|
|
40.6 |
% |
|
|
41.7 |
% |
|
Operating income |
|
11.8 |
% |
|
|
12.2 |
% |
|
|
11.8 |
% |
|
Other income |
|
0.0 |
% |
|
|
0.0 |
% |
|
|
0.2 |
% |
|
Interest expense |
|
0.2 |
% |
|
|
0.1 |
% |
|
|
0.1 |
% |
|
Interest income |
|
0.1 |
% |
|
|
0.1 |
% |
|
|
0.1 |
% |
|
Provision for income taxes |
|
4.0 |
% |
|
|
3.3 |
% |
|
|
3.0 |
% |
|
Noncontrolling interests |
|
0.1 |
% |
|
|
0.1 |
% |
|
|
0.1 |
% |
|
Net income attributed to Movado Group, Inc. |
|
7.6 |
% |
|
|
8.8 |
% |
|
|
8.9 |
% |
Fiscal 2016 Compared to Fiscal 2015
Net Sales
Net sales in fiscal 2016 were $594.9 million, $7.9 million or 1.4% above the prior year. For fiscal 2016, fluctuations in foreign currency exchange rates unfavorably impacted net sales by $24.3 million when compared to the prior year.
United States Wholesale Net Sales
Net sales in fiscal 2016 in the United States location of the Wholesale segment were $261.3 million, above the prior year period by $5.6 million or 2.2%, primarily driven by sales increases in the luxury brands category. Net sales in the luxury brands category were above the prior year by $5.8 million, or 3.7%. The increase in net sales in the luxury brands category was primarily due to higher sales in the Movado brand, partially offset by lower sales primarily in the ESQ Movado and Ebel brands. The net sales increase in the Movado brand was primarily due to strong sell-through in the Company’s Movado brand distribution channels, which included higher net sales of the Movado BOLD and the introduction of new products in the current year, all of which were supported by the Company’s continued focus and investment in marketing and advertising. This net sales increase was partially offset by the lower sales in the ESQ Movado brand which was primarily the result of limited distribution due to the Company’s decision to discontinue production of the brand, and lower sales from the after-sales service and all other category as compared to such sales in the prior year, which benefited from special events in that year. The net sales increase was also partially offset by a decrease in net sales in the Ebel brand, primarily due to a shift in focus to key international markets. The net sales in the licensed brands category was relatively flat compared to the prior year.
International Wholesale Net Sales
Net sales in fiscal 2016 in the International location of the Wholesale segment were $268.7 million, above the prior year by $2.2 million or 0.8%, which included fluctuations in foreign currency exchange rates that unfavorably impacted net sales by $24.3 million. This increase was driven by net sales increases in both the licensed brands and the luxury brands categories. The net sales in the licensed brands category were above the prior year by $2.6 million, or 1.3%, due to higher sales of certain licensed brands, primarily due to strong sell-through, as design and key price points resonated well with customers. These net sales increases were partially offset by lower net sales of certain other licensed brands, primarily due to the translational impact of the weaker European and Canadian currencies when compared to the prior year. The net sales in the luxury brands category were above the prior year by $0.5 million, or 0.9%, primarily the result of higher net sales of certain luxury brands, partially offset by lower net sales of certain other luxury brands. The higher net sales of certain luxury brands were primarily due to a special sale in Europe, partially offset by lower net sales of certain other luxury brands, primarily due to the translational impact of the weaker European and Canadian currencies when compared to the prior year.
Retail Net Sales
Net sales in fiscal 2016 in the Retail segment were $64.9 million, relatively flat compared to the prior year sales of $64.7 million. Comparable outlet store sales decreased 2.3% from the prior year sales, primarily related to the lower levels of international travelers to the Company’s outlet store locations. As of January 31, 2016 and 2015, the Company operated 40 and 38 retail outlet locations, respectively.
31
The Company considers comparable store sales to be sales of stores that were open as of February 1st of the prior fiscal year through January 31st of the current fiscal year. The Company had 35 comparable outlet stores for the year ended January 31, 2016. The sales from stores that have been relocated, renovated or refurbished are included in the calculation of comparable store sales. The method of calculating comparable store sales varies across the retail industry. As a result, the Company’s method for the calculation of comparable store sales may not be the same as measures used or reported by other companies.
Gross Profit
Gross profit for fiscal 2016 was $316.9 million or 53.3% of net sales as compared to $310.0 million or 52.8% of net sales in the prior year. The increase in gross profit of $6.9 million was primarily due to higher net sales for the current year and, to a lesser extent, a higher gross margin percentage. The gross margin percentage for fiscal 2016 increased by approximately 50 basis points. The increase reflects approximately 240 basis points of positive impact from a shift in channel and product mix, selective price increases, and sourcing improvements. The increase in the gross margin percentage was partially offset by an approximately 180 basis points unfavorable impact of fluctuations in foreign currency exchange rates and an approximately 10 basis points unfavorable impact related to severance agreements as a result of the Company’s operating efficiencies initiative.
Selling, General and Administrative
SG&A expenses for fiscal 2016 were $246.8 million, representing an increase from the prior year of $8.3 million or 3.5%. The increase in SG&A expenses was attributable to higher compensation and benefit expense of $8.3 million primarily resulting from higher performance-based compensation, headcount, salaries and stock awards. Also contributing to the increase in SG&A expenses was a $3.4 million charge for severance agreements, occupancy costs and fixed assets, related to the Company’s operating efficiencies initiative and other items. Further contributing to the increase in SG&A expenses were higher marketing expenses of $1.6 million, higher bad debt expenses of $0.8 million primarily related to a customer in Switzerland and higher depreciation and amortization expense of $0.6 million. The increases in SG&A expenses were partially offset by the favorable effect of fluctuations in foreign currency exchange rates of $6.0 million, due to the translation of foreign subsidiary results and the stronger average Swiss franc and Hong Kong dollar to Euro currency rates when compared to the prior year. Also, these increases in SG&A expenses were partially offset by lower other selling related expenses of $0.4 million.
Wholesale Operating Income
Operating income of $58.2 million for both fiscal 2016 and 2015, respectively, included $27.0 million and $19.3 million of unallocated corporate expenses as well as $44.5 million and $47.1 million of certain intercompany profits related to the Company’s supply chain operations, which was recorded in the Wholesale segment for fiscal 2016 and 2015, respectively. The relatively flat operating income was the net result of an increase in gross profit of $7.0 million, offset by an increase in SG&A expenses of $7.0 million. The increase in gross profit of $7.0 million was primarily due to higher net sales and to a lesser extent higher gross margin percentage. The increase in SG&A expenses of $7.0 million was attributable to higher compensation and benefit expense of $7.9 million primarily resulting from higher performance-based compensation, headcount, salaries and stock awards. Also contributing to the increase in SG&A expenses was a $3.4 million charge for severance agreements, occupancy costs and fixed assets, related to the Company’s operating efficiencies initiative and other items. Also contributing to the increase in SG&A expenses were higher marketing expenses of $1.6 million, higher bad debt expenses of $0.8 million primarily related to a customer in Switzerland and higher depreciation and amortization expense of $0.6 million. The increases in SG&A expenses were partially offset by the favorable effect of fluctuations in foreign currency exchange rates of $6.0 million, due to the translation of foreign subsidiary results and the stronger average Swiss franc and Hong Kong dollar to Euro currency rates when compared to the prior year. Also, these increases in SG&A expenses were partially offset by lower other selling related expenses of $0.4 million.
United States Wholesale Operating Income
Operating income of $18.0 million and $5.5 million, which included $27.0 million and $19.3 million of unallocated corporate expenses, was recorded in the United States location of the Wholesale segment for fiscal 2016 and 2015, respectively. The increase in operating income of $12.5 million was due to higher gross profit of $18.8 million partially offset by higher SG&A expenses of $6.3 million. The increase in gross profit of $18.8 million was primarily due to higher sales and a higher gross margin percentage. The increase in SG&A expenses of $6.3 million was attributable to higher compensation and benefit expense of $7.2 million primarily resulting from higher performance-based compensation, headcount, salaries and stock awards. Also contributing to the increase in SG&A expenses were higher depreciation and amortization expense of $0.3 million. These increases in SG&A were partially offset by a $0.9 million transfer of the provision related to severance agreements as a result of the Company’s operating efficiencies initiative and other items. Also contributing to the partial offset were lower other selling related expenses of $0.3 million and lower marketing expenses of $0.3 million.
32
International Wholesale Operating Income
Operating income of $40.2 million and $52.7 million, which included $44.5 million and $47.1 million, respectively, of certain profits related to the Company’s supply chain operations, was recorded in the International location of the Wholesale segment for fiscal 2016 and 2015, respectively. The decrease in operating income of $12.5 million was the result of a lower gross profit of $11.8 million and higher SG&A expenses of $0.7 million. The decrease in gross profit of $11.8 million was primarily due to a lower gross margin percentage, partially offset by higher sales, which were both unfavorably impacted by fluctuations in foreign currency exchange rates. The increase in SG&A expenses of $0.7 million was attributable to a $4.3 million charge for severance agreements, occupancy costs and fixed assets, related to the Company’s operating efficiencies initiative and other items, higher marketing of $1.9 million, higher bad debt expenses of $0.8 million primarily related to a customer in Switzerland, and higher compensation and benefit expense of $0.7 million primarily resulting from higher performance-based compensation, headcount, salaries and stock awards. These increases in SG&A expenses were partially offset by the favorable effect of fluctuations in foreign currency exchange rates of $6.0 million due to the translation of foreign subsidiary results and the stronger average Swiss franc and Hong Kong dollar to Euro currency rates when compared to the prior year. Also contributing to the partial offset were lower other selling related expenses of $0.5 million, and lower rent of $0.2 million and legal expenses of $0.2 million.
Retail Operating Income
Operating income of $11.9 million and $13.3 million was recorded in the Retail segment for fiscal 2016 and 2015, respectively. The $1.4 million decrease in operating income was primarily the result of an increase in SG&A expenses of $1.3 million. Gross profit and gross margin percentage were both relatively flat compared to prior year. The increase in SG&A expenses of $1.3 million was primarily due to higher compensation, benefit expenses and occupancy expenses related to the opening of new retail outlet locations in the current year.
Interest Expense
Interest expense was $1.1 million and $0.5 million for fiscal 2016 and 2015, respectively, which primarily consisted of the amortization of deferred financing costs and interest on the Company’s revolving credit facility.
For information on the Company’s borrowings for fiscal 2016 and fiscal 2015, see Note 5 to the Consolidated Financial Statements.
Interest Income
Interest income was $0.1 million and $0.2 million for fiscal 2016 and 2015, respectively.
Income Taxes
The Company recorded a tax expense of $23.4 million and $19.3 million for fiscal 2016 and 2015, respectively. The effective tax rate for fiscal 2016 was 33.8%, primarily as a result of foreign profits being taxed in lower taxing jurisdictions offset by U.S. tax provided on earnings of non-U.S. subsidiaries. The effective tax rate for fiscal 2015 was 27.1%, primarily as a result of foreign profits being taxed in lower taxing jurisdictions and the recognition of a tax benefit related to intercompany profit in certain jurisdictions. See Note 8 to the Company’s Consolidated Financial Statements for further information regarding income taxes.
Net Income Attributed to Movado Group, Inc.
For fiscal 2016 and 2015, the Company recorded net income attributed to Movado Group, Inc. of $45.1 million and $51.8 million, respectively.
Fiscal 2015 Compared to Fiscal 2014
Net Sales
Net sales in fiscal 2015 were $587.0 million, $16.7 million or 2.9% above the prior year. Net sales in fiscal 2014 included an additional pre-tax charge of $7.8 million to sales, for anticipated returns in fiscal 2015 resulting from the Company’s decision to reduce the presence of ESQ Movado while expanding the Movado brand offering in certain retail doors. For fiscal 2015, fluctuations in foreign currency exchange rates unfavorably impacted net sales by $2.2 million when compared to the prior year.
33
United States Wholesale Net Sales
Net sales in fiscal 2015 in the United States location of the Wholesale segment were $255.7 million, above the prior year period by $11.9 million or 4.9%, primarily driven by sales increases in the licensed brands and luxury brands categories. Net sales in the licensed brands category were above the prior year’s net sales by $5.9 million, or 7.1%. The increase in sales in the licensed brands category was primarily due to higher sales of certain licensed brands, as a result of strong sell-through and expansion in the Company’s distribution channels. Net sales in the luxury category were above the prior year by $4.6 million, or 3.0%. The increase in sales in the luxury brands category was primarily due to higher sales in both Movado and ESQ Movado brand sales. The sales increase in the Movado brand was primarily due to strong sell-through in the Company’s Movado brand distribution channels, which included higher sales of the Movado BOLD and Museum watch collections and the introduction of new products in fiscal 2015, all of which were supported by the Company’s continued focus and investment in marketing and advertising. The year on year fluctuation in sales in the ESQ Movado brand was primarily due to the $7.8 million sales charge in the prior year, for anticipated returns resulting from the Company’s strategic decision to reduce the presence of ESQ Movado watches while expanding the Movado brand offering in certain retail doors. The Company believes it did not fully realize all of the anticipated benefits of this strategy which was intended to drive incremental sales of its more productive Movado brand watch families by utilizing the increased case space at the point of sale that otherwise would have been occupied by relatively less productive ESQ Movado SKUs. Although Movado brand sales at retail increased while, at the same time, sales of ESQ Movado watches at retail declined, Movado brand sales at wholesale increased less than expected due to retailers tightly managing their inventory. Sales increases in the luxury brands category were partially offset by net sales decreases in Ebel and Concord brand watches of $3.2 million when compared to the prior year, primarily due to higher sell-in to retailers of newer product and lower promotional sales in the prior year. Also contributing to the increase in sales was a sales increase of $1.4 million in fiscal 2015 from after-sales service and all other category, primarily due to sales from special events in fiscal 2015.
International Wholesale Net Sales
Net sales in fiscal 2015 in the International location of the Wholesale segment were $266.6 million, below the prior year by $0.6 million or 0.2%, driven by a sales decrease in the luxury brands category, partially offset by a sales increase in the licensed brands category. The net sales decrease in the luxury brands category of $12.2 million was primarily due to lower sales of Movado and the other luxury brand watches. The decrease in Movado watch sales was primarily due to weaker than expected performance in certain markets, including Asia. The decrease in sales of all other luxury brands was primarily the result of higher sell-in to retailers of newer product in the prior year. These sales decreases were mostly offset by a sales increase in the licensed brands category of $12.1 million, or 6.2% compared to the prior year, primarily due to higher sales of certain licensed brands as a result of strong sell-through, as well as geographic expansion in the Company’s distribution channels. In fiscal 2015, fluctuations in foreign currency exchange rates unfavorably impacted net sales by $2.2 million when compared to the prior year.
Retail Net Sales
Net sales in fiscal 2015 in the Retail segment were $64.7 million, representing a 9.2% increase from the prior year sales of $59.3 million. The increase in sales was primarily attributable to the opening of new stores. Comparable outlet store sales increased 2.5% from the prior year sales. As of January 31, 2015 and 2014, the Company operated 38 and 35 outlet stores, respectively.
The Company considers comparable store sales to be sales of stores that were open as of February 1st of the prior fiscal year through January 31st of the current fiscal year. The Company had 33 comparable outlet stores for the year ended January 31, 2015. The sales from stores that have been relocated, renovated or refurbished are included in the calculation of comparable store sales. The method of calculating comparable store sales varies across the retail industry. As a result, the Company’s method for the calculation of comparable store sales may not be the same as measures used or reported by other companies.
Gross Profit
Gross profit for fiscal 2015 was $310.0 million or 52.8% of net sales as compared to $305.3 million or 53.5% of net sales in the prior year. The increase in gross profit of $4.7 million was primarily due to higher net sales for fiscal 2015 partially offset by a lower gross margin percentage. The gross margin percentage for fiscal 2015 decreased by approximately 70 basis points. The decrease reflects the unfavorable impact of fluctuations in foreign currency exchange rates of approximately 60 basis points, an unfavorable shift in channel and product mix of approximately 40 basis points, and a duty refund received in the prior year relating to payments made by the Company in calendar years 2008 through 2011 for drawback claims filed with U.S. Customs & Border Protection of approximately 40 basis points. These decreases were partially offset by the positive impact of approximately 60 basis points due to the Company’s decision to reduce the presence of ESQ Movado while expanding the Movado brand offering in certain retail doors and the positive impact of approximately 10 basis points resulting from leverage gained on certain fixed costs due to the increase in sales volume year-over-year.
34
Selling, General and Administrative
SG&A expenses for fiscal 2015 were $238.5 million, representing an increase from the prior year of $1.0 million or 0.4%. The increase in SG&A expenses was attributable to higher compensation and benefit expense of $7.9 million primarily in support of the Company’s brand building and growth initiatives. Also contributing to the increase in SG&A expenses was the unfavorable effect of fluctuations in foreign currency exchange rates of $1.8 million, which was the result of losses on Euro receivables in entities whose functional currency is not the Euro. Also contributing to the increase in SG&A expenses were higher other selling expenses of $2.1 million, higher trade show expenses of $1.0 million (primarily related to the Baselworld Watch and Jewelry Show), higher rent related expenses of $0.7 million (primarily related to the opening of new stores and warehousing expansion), higher bad debt expense of $0.6 million and higher depreciation and amortization expense of $0.3 million. The increases in SG&A expenses were partially offset by a decrease in performance-based compensation of $9.0 million, resulting from the Company not meeting certain financial targets, lower marketing expense of $2.4 million, which included a $0.8 million pre-tax charge in the prior year related to the write down of unused displays and point of sale materials as a result of the Company’s strategic decision to reduce the presence of ESQ Movado watches while expanding the Movado brand offering in certain retail doors, and a decrease of $2.0 million of charitable contributions related to the prior year contribution of $2.0 million to the Movado Group Foundation.
Wholesale Operating Income
Operating income of $58.2 million and $55.2 million, which included $19.3 million and $26.5 million of unallocated corporate expenses, was recorded in the Wholesale segment for fiscal 2015 and 2014, respectively. The $3.0 million increase in operating income was the net result of an increase in gross profit of $2.1 million and a decrease in SG&A expenses of $0.9 million. The increase in gross profit of $2.1 million was primarily due to higher net sales and partially offset by a lower gross margin percentage. Gross profit in the prior year was negatively impacted by a $7.5 million pre-tax charge related to the anticipated ESQ Movado watch brand returns and the write down of ESQ Movado excess inventory. The decrease in SG&A expense included a decrease in performance-based compensation of $9.0 million, resulting from the Company not meeting certain financial targets. Also contributing to the decrease was lower marketing expense of $2.4 million (which included a $0.8 million pre-tax charge in the prior year related to the write down of unused displays and point of sale materials as a result of the Company’s strategic decision to reduce the presence of ESQ Movado watches while expanding the Movado brand offering in certain retail doors), and a decrease of $2.0 million of charitable contributions related to the prior year contribution of $2.0 million to the Movado Group Foundation. These decreases in SG&A expenses were partially offset by higher compensation and benefit expense of $7.0 million primarily in support of the Company’s brand building and growth initiatives and the unfavorable effect of fluctuations in foreign currency exchange rates of $1.8 million, which was the result of losses on Euro receivables in entities whose functional currency is not the Euro. Also contributing to the partial offset were higher other selling expenses of $2.0 million, higher trade show expenses of $1.0 million, primarily related to the Baselworld Watch and Jewelry Show, higher bad debt expense of $0.6 million, higher depreciation and amortization expense of $0.2 million, and higher rent related expenses of $0.2 million, primarily related to warehousing expansion.
United States Wholesale Operating Income / Loss
Operating income of $5.5 million and an operating loss of $1.5 million, which included $19.3 million and $26.5 million of unallocated corporate expenses, was recorded in the United States location of the Wholesale segment for fiscal 2015 and 2014, respectively. The increase in income of $7.0 million was due to lower SG&A expenses of $4.2 million and higher gross profit of $2.8 million, which was primarily attributable to higher sales and partially offset by a lower gross margin percentage. The decrease in SG&A expense included lower compensation and benefit expense of $2.5 million (resulting from a decrease in performance-based compensation, partially offset by higher headcount, salaries and stock award expenses) and a decrease of $2.0 million of charitable contributions. These decreases were partially offset by higher marketing expense of $0.7 million, which included a $0.8 million pre-tax charge in the prior year related to the write down of unused displays and point of sale materials, as a result of the Company’s strategic decision to reduce the presence of ESQ Movado watches while expanding the Movado brand offering in certain retail doors. The increase in gross profit of $2.8 million was primarily due to higher sales and the non-recurrence of a $7.5 million pre-tax charge that affected the prior year related to the anticipated ESQ Movado watch brand returns and the write down of ESQ Movado excess inventory.
35
International Wholesale Operating Income
Operating income of $52.7 million and $56.7 million was recorded in the international location of the Wholesale segment for fiscal 2015 and 2014, respectively, which included $47.1 million and $44.2 million, respectively, of certain profits related to the Company’s supply chain operations. The decrease in operating income of $4.0 million was due to higher SG&A expenses of $3.4 million and lower gross profit of $0.6 million, which was primarily attributable to lower sales. The increase in SG&A expenses of $3.4 million included higher other selling expenses of $2.0 million, the unfavorable effect of fluctuations in foreign currency exchange rates of $1.8 million, higher trade show expenses of $1.0 million, primarily related to the Baselworld Watch and Jewelry Show, higher bad debt expense of $0.7 million and higher compensation and benefit expenses of $0.5 million resulting primarily from a higher headcount and salaries, partially offset by a lower expense for performance-based compensation. These increased SG&A expenses were partially offset by higher marketing expenses of $3.1 million.
Retail Operating Income
Operating income of $13.3 million and $12.5 million was recorded in the Retail segment for fiscal 2015 and 2014, respectively. The $0.8 million increase in operating income was the result of an increase in gross profit of $2.6 million, partially offset by an increase in SG&A expenses of $1.8 million. The increase in gross profit of $2.6 million was primarily attributable to higher sales and partially offset by a lower gross margin percentage. The increase in SG&A expenses of $1.8 million was primarily due to higher compensation, benefit expenses and occupancy expenses related to the opening of new stores in the current year.
Other Income
Other income for fiscal 2014 consisted of a $1.5 million pre-tax gain on the sale of a building. The Company received cash proceeds from the sale of $2.2 million in the first quarter of fiscal year 2014. Prior to the sale, the building had been classified as an asset held for sale in other current assets.
Interest Expense
Interest expense was $0.5 million and $0.4 million for fiscal 2015 and 2014, respectively, which primarily consisted of the amortization of deferred financing costs.
Interest Income
Interest income was $0.2 million and $0.1 million for fiscal 2015 and 2014, respectively.
Income Taxes
The Company recorded a tax expense of $19.3 million and of $17.4 million for fiscal 2015 and 2014, respectively. The effective tax rate for fiscal 2015 was 27.1%, primarily as a result of foreign profits being taxed in lower taxing jurisdictions and the recognition of a tax benefit related to intercompany transactions in certain jurisdictions. The effective tax rate for fiscal 2014 was 25.2%, primarily as a result of foreign profits being taxed in lower taxing jurisdictions and the release of liabilities for uncertain tax positions as a result of favorable U.S. and foreign audit settlements, which were partially offset by no tax being realized on certain foreign net operating losses. See Note 8 to the Company’s Consolidated Financial Statements for further information regarding income taxes.
Net Income Attributed to Movado Group, Inc.
For fiscal 2015 and 2014, the Company recorded net income attributed to Movado Group, Inc. of $51.8 million and $50.9 million, respectively.
36
LIQUIDITY AND CAPITAL RESOURCES
At January 31, 2016 and January 31, 2015, the Company had $228.2 million and $199.9 million of cash and cash equivalents, $203.5 million and $192.4 million of which consisted of cash and cash equivalents at the Company’s foreign subsidiaries, respectively. The majority of the foreign cash balances are associated with earnings that the Company has asserted are permanently reinvested, and which are required to support continued growth outside the U.S. through funding of capital expenditures, operating expenses and similar cash needs of the foreign operations. The Company has recorded a federal income tax liability of $2.9 million related to $12.6 million of pre-2013 foreign earnings which have been earmarked for future repatriation. A deferred tax liability has not been recorded for the remaining undistributed foreign earnings of approximately $290 million, because the Company intends to permanently reinvest such earnings in its foreign operations. It is not practicable to estimate the amount of tax that may be payable on the future possible distribution of these earnings.
At January 31, 2016, the Company had working capital of $410.9 million as compared to $413.0 million in the prior year. The Company defines working capital as the difference between current assets and current liabilities.
Cash provided by operating activities was $74.6 million and $59.6 million for fiscal 2016 and 2015, respectively. The $74.6 million of cash provided by operating activities for fiscal 2016 was primarily due to income of $45.8 million, favorable non-cash items of $22.5 million and a favorable change in working capital of $5.3 million. The change in working capital of $5.3 million was primarily due to higher accrued liabilities of $5.9 million, primarily related to higher accrued bonus, lower other current assets of $2.8 million, primarily related to tax refunds applied to current year tax payments, partially offset by a decrease in inventory of $3.1 million primarily related to better management of inventory. The $59.6 million of cash provided by operating activities for fiscal 2015 was primarily due to income of $51.9 million and favorable non-cash items of $28.1 million, partially offset by the change in working capital of $20.2 million. The change in working capital of $20.2 million was primarily due to the payout of the Company’s prior year performance-based compensation and the timing of payments of other liabilities. Also contributing to the change in working capital were higher accounts receivable primarily due to lower levels of allowances for returns related to the Company’s strategic decision to reduce the presence of ESQ Movado watches in certain chain and department store retail doors while expanding Movado brand offerings in those same retail doors, partially offset by lower inventory related to the Company’s efforts to manage inventory levels.
Cash used in investing activities was $9.2 million and cash provided by investing activities was $21.6 million for fiscal 2016 and 2015, respectively. The cash used in investing for fiscal 2016 was primarily for capital expenditures of $8.1 million, related to the construction of shop-in-shops at some of the Company’s wholesale customers, expenditures on hardware and software, spending on new store openings and renovations, improvements to Baselworld Watch and Jewelry Show booths and spending on tooling and design. Cash used in investing activities also included $0.7 million primarily related to spending on developed technology used in the Company’s smart watches and $0.4 million due to a restricted deposit as it relates to a lease agreement. The cash provided by investing for fiscal 2015 consisted of proceeds from the maturity of time-deposits of $33.7 million, proceeds from available-for-sale securities of $0.3 million, partially offset by capital expenditures of $11.1 million, primarily related to the construction of shop-in-shops at some of the Company’s wholesale customers, expenditures on hardware and software, spending on new store openings and renovations, improvements to Baselworld Watch and Jewelry Show booths, spending on tooling and design and cash used on a long-term investment of $1.2 million.
The Company expects that annual capital expenditures in fiscal 2017 will be approximately $12.0 million as compared to approximately $8.1 million in fiscal 2016. The capital spending will be primarily for projects in the ordinary course of business including facilities’ and Baselworld Watch and Jewelry Show improvements, shop-in-shops, computer hardware and software and tooling costs. The Company has the ability to manage a portion of its capital expenditures on discretionary projects.
Cash used in financing activities was $23.7 million and $36.2 million for fiscal 2016 and 2015, respectively. Cash used in financing activities for fiscal 2016 primarily included the repurchase of the Company’s common stock and the payment of dividends, the acquisition of the remaining 49% of the Company’s joint venture with TWC, and net bank borrowings. In fiscal 2015, cash used in financing activities included the repurchase of the Company’s common stock and the payment of dividends, payment of debt issuance costs and distribution of noncontrolling interest earnings, partially offset by the result of stock option exercises for the period. Management believes that the cash on hand in addition to the expected cash flows from operations and the Company’s short-term borrowing capacity will be sufficient to meet its working capital needs for at least the next twelve months.
37
On January 30, 2015, the Company, together with Movado Group Delaware Holdings Corporation, Movado Retail Group, Inc. and Movado LLC (collectively, the “Borrowers”), each a wholly-owned domestic subsidiary of the Company, entered into a Credit Agreement (the “Credit Agreement”) with the lenders party thereto and Bank of America, N.A. as administrative agent (in such capacity, the “Agent”). The Credit Agreement provides for a $100.0 million senior secured revolving credit facility (the “Facility”), including a $15.0 million letter of credit sub-facility, that matures on January 30, 2020, with provisions for uncommitted increases of up to $50.0 million in the aggregate, subject to customary terms and conditions. In connection with the Credit Agreement, the Borrowers also entered into a Security and Pledge Agreement dated as of January 30, 2015 in favor of the Agent (the “Security Agreement”).
As of January 31, 2016, $40.0 million in loans were drawn under the Facility. Additionally, approximately $3.6 million in letters of credit, which were outstanding under the Borrower’s pre-existing asset-based revolving credit facility that was concurrently terminated when the Credit Agreement became effective, are deemed to be issued and outstanding under the Facility. As of January 31, 2016, availability under the Facility was approximately $56.4 million.
Borrowings under the Facility bear interest at rates selected periodically by the Company at LIBOR plus a spread ranging from 1.25% to 1.75% per annum, based on the Company’s consolidated leverage ratio or at a base rate plus a spread ranging from 0.25% to 0.75% per annum based on the Company’s consolidated leverage ratio. At January 31, 2016, the Company’s spreads were 1.50% over LIBOR and 0.50% over the base rate. The Company has also agreed to pay certain fees and expenses and provide certain indemnities, all of which are customary for such financings.
The borrowings under the Facility are joint and several obligations of the Borrowers and are also cross-guaranteed by each Borrower. In addition, pursuant to the Security Agreement, the Borrowers’ obligations under the Facility are secured by first priority liens, subject to permitted liens, on substantially all of the Borrowers’ assets other than certain excluded assets. The Security Agreement contains representations, warranties and covenants, which are customary for pledge and security agreements of this type, relating to the creation and perfection of security interests in favor of the Agent over various categories of the Borrowers’ assets.
The Credit Agreement contains affirmative and negative covenants binding on the Borrowers and their subsidiaries that are customary for credit facilities of this type, including, but not limited to, restrictions and limitations on the incurrence of debt and liens, dispositions of assets, capital expenditures, dividends and other payments in respect of equity interests, the making of loans and equity investments, mergers, consolidations, liquidations and dissolutions, and transactions with affiliates (in each case, subject to various exceptions).
The Borrowers are also subject to a minimum consolidated EBITDA (as defined in the Credit Agreement) test of $50.0 million, measured at the end of each fiscal quarter based on the four most recent fiscal quarters and a consolidated leverage ratio (as defined in the Credit Agreement) covenant not to exceed 2.50 to 1.00, measured as of the last day of each fiscal quarter. As of January 31, 2016, the Company was in compliance with its covenants under the Credit Agreement.
The Credit Agreement contains events of default that are customary for facilities of this type, including, but not limited to, nonpayment of principal, interest, fees and other amounts when due, failure of any representation or warranty to be true in any material respect when made or deemed made, violation of covenants, cross default with material indebtedness, material judgments, material ERISA liability, bankruptcy events, asserted or actual revocation or invalidity of the loan documents, and change of control.
As of January 31, 2016, the Company classified $5.0 million of the outstanding balance under the Facility as current based on voluntary pre-payments estimated to be made in the next twelve months, with the remainder classified as long-term debt based on the 2020 maturity date of the Facility and the Company's intent and ability to refinance its obligations thereunder.
A Swiss subsidiary of the Company maintains unsecured lines of credit with an unspecified maturity with a Swiss bank. As of January 31, 2016 and 2015, these lines of credit totaled 5.0 million Swiss francs with a dollar equivalent of $4.9 million and $5.4 million, respectively. As of January 31, 2016 and 2015, there were no borrowings against these lines.
As of January 31, 2016 and 2015, two European banks have guaranteed obligations to third parties on behalf of two of the Company’s foreign subsidiaries in the dollar equivalent of $1.0 million, of which $0.4 million is a restricted deposit as it relates to a lease agreement, and $1.3 million in various foreign currencies, respectively.
The Company paid cash dividends of $0.44 per share or approximately $10.3 million for fiscal 2016. The Company paid cash dividends of $0.40 per share or approximately $10.1 million for fiscal 2015. The Company paid cash dividends of $0.26 per share or approximately $6.6 million for fiscal 2014.
38
On March 31, 2016, the Board approved an increase in the Company’s quarterly cash dividend to $0.13 for each share of the Company’s outstanding common stock and class A common stock. The dividend will be paid on April 26, 2016 to all shareholders of record as of the close of business on April 12, 2016. The decision of whether to declare any future cash dividend, including the amount of any such dividend and the establishment of record and payment dates, will be determined, in each quarter, by the Board of Directors, in its sole discretion.
On March 31, 2016, the Board approved a share repurchase program under which the Company is authorized to purchase up to $50.0 million of its outstanding common stock from time to time, depending on market conditions, share price and other factors. The Company may purchase shares of its common stock through open market purchases, repurchase programs, block trades or otherwise. This authorization expires on September 30, 2017. Under the Company’s prior share repurchase program, which expired on January 31, 2016, the Company repurchased a total of 1,858,939 shares of its common stock during fiscal year 2016 at a total cost of approximately $48.7 million, or an average of $26.22 per share, which included 28,000 shares repurchased from the Movado Group Foundation at a total cost of approximately $0.8 million or an average of $27.33 per share.
On November 24, 2015, the Board approved the payment of a cash dividend of $0.11 for each share of the Company’s outstanding common stock and class A common stock. The dividend was paid on December 18, 2015 to all shareholders of record as of the close of business on December 4, 2015.
On August 27, 2015, the Board approved the payment of a cash dividend of $0.11 for each share of the Company’s outstanding common stock and class A common stock. The dividend was paid on September 22, 2015 to all shareholders of record as of the close of business on September 8, 2015.
On May 27, 2015, the Board approved the payment of a cash dividend of $0.11 for each share of the Company’s outstanding common stock and class A common stock. The dividend was paid on June 22, 2015 to all shareholders of record as of the close of business on June 8, 2015.
CONTRACTUAL OBLIGATIONS AND OFF-BALANCE SHEET ARRANGEMENTS
Payments due by period (in thousands):
|
|
Total |
|
|
Less than 1 year |
|
|
2-3 years |
|
|
4-5 years |
|
|
More than 5 years |
|
|||||
|
Contractual Obligations: |
|
|
|
|
|
|
|
|
|
|
|
|
|
|
|
|
|
|
|
|
Operating Lease Obligations (1) |
$ |
37,150 |
|
|
$ |
11,696 |
|
|
$ |
15,344 |
|
|
$ |
4,822 |
|
|
$ |
5,288 |
|
|
Purchase Obligations (2) |
|
79,246 |
|
|
|
79,246 |
|
|
|
— |
|
|
|
— |
|
|
|
— |
|
|
Other Long-Term Obligations (3) |
|
152,135 |
|
|
|
37,904 |
|
|
|
66,658 |
|
|
|
30,980 |
|
|
|
16,593 |
|
|
Total Contractual Obligations |
$ |
268,531 |
|
|
$ |
128,846 |
|
|
$ |
82,002 |
|
|
$ |
35,802 |
|
|
$ |
21,881 |
|
|
(1) |
Includes store operating leases, which generally provide for payment of direct operating costs in addition to rent. These obligation amounts only include future minimum lease payments and exclude direct operating costs. |
|
(2) |
The Company had outstanding purchase obligations with suppliers at the end of fiscal 2016 for raw materials, finished watches and packaging in the normal course of business. These purchase obligation amounts do not represent total anticipated purchases but represent only amounts to be paid for items required to be purchased under agreements that are enforceable, legally binding and specify minimum quantity, price and term. Also included in purchase obligations is a $1.4 million outstanding balance related to the purchase of incremental ownership of a joint venture with TWC. |
|
(3) |
Other long-term obligations primarily consist of two items: minimum commitments related to the Company’s license agreements and endorsement agreements with brand ambassadors. The Company sources, distributes, advertises and sells watches pursuant to its exclusive license agreements with unaffiliated licensors. Royalty amounts are generally based on a stipulated percentage of revenues, although most of these agreements contain provisions for the payment of minimum annual royalty amounts. The license agreements have various terms and some have additional renewal options, provided that minimum sales levels are achieved. Additionally, the license agreements require the Company to pay minimum annual advertising amounts. |
Unrecognized tax benefits at January 31, 2016 of $2.5 million and accrued interest and penalties of $0.7 million (both gross of tax benefit) are not included in the table above. The final outcome of tax uncertainties is dependent upon various matters including tax examinations, interpretation of the applicable tax laws or expiration of statutes of limitations. The Company believes that its tax positions comply with applicable tax law and that it has adequately provided for these matters. However, the audits may result in proposed assessments where the ultimate resolution may result in the Company owing additional taxes. Management anticipates that it
39
is reasonably possible that the total gross amount of unrecognized tax benefits will decrease by approximately $0.1 million in the next 12 months due to the potential expiration of the statute of limitations for certain tax return examinations, a portion of which may affect the effective tax rate; however, management does not currently anticipate a significant effect on net earnings. Future developments may result in a change in this assessment.
Off-Balance Sheet Arrangements
The Company does not have off-balance sheet financing, other than letters of credit and operating leases, or unconsolidated special-purpose entities.
Recent Accounting Pronouncements
On February 25, 2016, FASB issued ASU 2016-02, “Leases,” which requires lessees to recognize most leases on the balance sheet. This is expected to increase both reported assets and liabilities. The new lease standard does not substantially change lessor accounting. For public companies, the standard will be effective for the first interim reporting period within annual periods beginning after December 15, 2018, although early adoption is permitted. Lessees and lessors will be required to apply the new standard at the beginning of the earliest period presented in the financial statements in which they first apply the new guidance, using a modified retrospective transition method. The requirements of this standard include a significant increase in required disclosures. The Company is analyzing the impact of the adoption of this guidance on the Company’s consolidated financial statements, including assessing changes that might be necessary to information technology systems, processes and internal controls to capture new data and address changes in financial reporting.
On January 5, 2016, FASB issued ASU 2016-01, “Financial Instruments: Recognition and Measurement of Financial Assets and Financial Liabilities,” which enhances the reporting model for financial instruments and includes amendments to address aspects of recognition, measurement, presentation and disclosure. For public companies, the amendment is effective for annual periods beginning after December 15, 2017. Early adoption is permitted for only certain portions of the new guidance. The Company is evaluating the impact of the adoption of this guidance on the Company’s consolidated financial statements.
On November 20, 2015, FASB issued ASU 2015-17, “Income Taxes: Balance Sheet Classification of Deferred Taxes,” which eliminates the current requirement for companies to present deferred tax liabilities and assets as current and non-current in a classified balance sheet. Instead, companies will be required to classify all deferred tax assets and liabilities as non-current. For public companies, the amendments are effective for financial statements issued for annual periods beginning after December 15, 2016, and interim periods within those annual periods. Earlier application is permitted. The Company has elected to early adopt this requirement retrospectively in the current period. The Company reclassified $6.2 million of net current deferred income tax assets from current to noncurrent at January 31, 2015.
On July 22, 2015, FASB issued ASU 2015-11, “Inventory: Simplifying the Measurement of Inventory,” which affects reporting entities that measure inventory using first-in, first-out or average cost. Specifically, the guidance requires that inventory be measured at the lower of cost and net realizable value. Net realizable value is the estimated selling prices in the ordinary course of business, less reasonably predictable cost of completion, disposal, and transportation. The guidance is effective for annual periods beginning after December 15, 2016, with early adoption permitted. The Company is evaluating the effect of adopting this pronouncement, but the adoption is not expected to have a material impact on the Company’s consolidated financial statements.
On April 7, 2015, FASB issued ASU 2015-03, “Simplifying the Presentation of Debt Issuance Costs,” which states that debt issuance costs be presented in the balance sheet as a direct deduction from the debt liability, consistent with debt discounts. Under current accounting standards, such costs are recorded as an asset. On August 18, 2015, FASB clarified that the guidance in this pronouncement does not apply to line-of-credit arrangements. Accordingly, debt issuance costs for line-of-credit arrangements may continue to be presented as an asset that is amortized ratably over the term of the arrangement. The new guidance is effective for the beginning of the Company’s fiscal year ending January 31, 2017, with early adoption permitted. The Company is evaluating the effect of adopting this pronouncement, but the adoption is not expected to have a material impact on the Company’s consolidated financial statements.
On May 28, 2014, FASB issued ASU 2014-09, “Revenue from Contracts with Customers.” This pronouncement affects any entity that either enters into contracts with customers to transfer goods or services or enters into contracts for the transfer of nonfinancial assets, unless those contracts are within the scope of other standards (for example, insurance contracts or lease contracts). The core principle of the guidance is that an entity should recognize revenue to depict the transfer of promised goods or services to customers in an amount that reflects the consideration to which the entity expects to be entitled in exchange for those goods or services. In July 2015, FASB deferred the effective date of the guidance. The new revenue standard is effective for fiscal years, and interim periods within those years, beginning after December 15, 2017 and allows either a full retrospective adoption to all periods presented or a modified
40
retrospective adoption approach with the cumulative effect of initial application of the revised guidance recognized at the date of initial application. Early adoption is permitted for periods beginning after December 15, 2016. The Company is evaluating the impact of the adoption of this guidance on the Company’s consolidated financial statements.
Item 7A. Quantitative and Qualitative Disclosure about Market Risk
Foreign Currency Exchange Rate Risk
The Company’s primary market risk exposure relates to foreign currency exchange risk (see Note 6 to the Consolidated Financial Statements). A significant portion of the Company’s purchases are denominated in Swiss francs. The Company also sells to third-party customers in a variety of foreign currencies, most notably the Euro. The Company reduces its exposure to the Swiss franc and Euro exchange rate risk through a hedging program. Under the hedging program, the Company manages most of its foreign currency exposures on a consolidated basis, which allows it to net certain exposures and take advantage of natural offsets. In the event these exposures do not offset, the Company uses various derivative financial instruments to further reduce the net exposures to currency fluctuations, predominately forward and option contracts. When entered into, the Company designates and documents these derivative instruments as a cash flow hedge of a specific underlying exposure, as well as the risk management objectives and strategies for undertaking the hedge transactions. Changes in the fair value of a derivative that is designated and documented as a cash flow hedge and is highly effective, are recorded in other comprehensive income until the underlying transaction affects earnings, and then are later reclassified into earnings in the same account as the hedged transaction. The earnings impact is mostly offset by the effects of currency movements on the underlying hedged transactions. If the Company does not engage in a hedging program, any change in the Swiss franc and Euro exchange rates to local currency would have an equal effect on the Company’s earnings.
The Company uses forward exchange contracts to offset its exposure to certain foreign currency receivables and liabilities. These forward contracts are not designated as qualified hedges and, therefore, changes in the fair value of these derivatives are recognized in earnings in the period they arise, thereby offsetting the current earnings effect resulting from the revaluation of the related foreign currency receivables and liabilities.
As of January 31, 2016, the Company’s entire net forward contracts hedging portfolio consisted of 30.0 million Swiss francs equivalent and 5.0 million Euros equivalent for various expiry dates ranging through July 12, 2016 compared to a portfolio of 38.0 million Swiss francs equivalent for various expiry dates ranging through July 15, 2015 as of January 31, 2015. If the Company were to settle its Swiss franc forward contracts at January 31, 2016, the net result would be a loss of $0.7 million, net of tax benefit of $0.5 million. If the Company were to settle its Euro forward contracts at January 31, 2016, the net result would be a gain of $0.1 million, net of tax expense of $0.1 million. The Company had no Swiss franc or Euro option contracts related to cash flow hedges as of January 31, 2016 and January 31, 2015, respectively.
Commodity Risk
The Company considers its exposure to fluctuations in commodity prices to be primarily related to gold used in the manufacturing of the Company’s watches. Under its hedging program, the Company can purchase various commodity derivative instruments, primarily futures contracts. When held, these derivatives are documented as qualified cash flow hedges, and the resulting gains and losses on these derivative instruments are first reflected in other comprehensive income, and later reclassified into earnings, partially offset by the effects of gold market price changes on the underlying actual gold purchases. The Company did not hold any future contracts in its gold hedge portfolio as of January 31, 2016 and 2015; thus, any changes in the gold purchase price will have an equal effect on the Company’s cost of sales.
Debt and Interest Rate Risk
The Company has certain debt obligations with variable interest rates, which are based on LIBOR plus a spread ranging from 1.25% to 1.75% or on a base rate plus a spread ranging from 0.25% to 0.75% per annum. The Company does not hedge these interest rate risks. As of January 31, 2016, the Company had $40.0 million in outstanding debt. The Company believes that a 1% change in interest rates would affect the Company’s net income by approximately $0.4 million. For additional information concerning potential changes to future interest obligations, see “Management’s Discussion and Analysis of Financial Condition and Results of Operations – Liquidity and Capital Resources.”
41
Item 8. Financial Statements and Supplementary Data
INDEX TO CONSOLIDATED FINANCIAL STATEMENTS
|
|
Schedule Number |
|
Page Number |
|
|
|
|
50 |
|
Consolidated Statements of Operations for the fiscal years ended January 31, 2016, 2015 and 2014 |
|
|
51 |
|
|
|
|
52 |
|
|
|
|
53 |
|
Consolidated Statements of Cash Flows for the fiscal years ended January 31, 2016, 2015 and 2014 |
|
|
54 |
|
|
|
|
55 |
|
|
|
|
56 to 76 |
|
|
II |
|
S-1 |
42
Item 9. Changes in and Disagreements with Accountants on Accounting and Financial Disclosure
None.
Item 9A. Controls and Procedures
Evaluation of Disclosure Controls and Procedures
The Company’s disclosure controls and procedures are designed to provide reasonable assurance of achieving their objectives. However, it should be noted that a control system, no matter how well conceived or operated, can only provide reasonable, not absolute, assurance that its objectives will be met and may not prevent all errors or instances of fraud.
The Company, under the supervision and with the participation of its management, including the Chief Executive Officer and the Chief Financial Officer, has evaluated the effectiveness of the Company’s disclosure controls and procedures, as such terms are defined in Rule 13a-15(e) under the Securities Exchange Act of 1934, as amended (the “Exchange Act”). Based on that evaluation, the Chief Executive Officer and the Chief Financial Officer concluded that the Company’s disclosure controls and procedures are effective at a reasonable assurance level as of the end of the period covered by this report.
The Company’s Chief Executive Officer and Chief Financial Officer have furnished the Sections 302 and 906 certifications required by the U.S. Securities and Exchange Commission in this annual report on Form 10-K. In addition, the Company’s Chief Executive Officer certified to the NYSE in July 2015 that he was not aware of any violation by the Company of the NYSE’s corporate governance listing standards.
Management’s Annual Report on Internal Control Over Financial Reporting
The management of the Company is responsible for establishing and maintaining internal control over financial reporting, as such term is defined in Rule 13a-15(f) under the Exchange Act, for the Company. With the participation of the Chief Executive Officer and the Chief Financial Officer, the Company’s management conducted an evaluation of the effectiveness of the Company’s internal control over financial reporting based on the framework and criteria established in the Internal Control – Integrated Framework (2013) issued by the Committee of Sponsoring Organizations of the Treadway Commission (COSO). Based on this evaluation, the Company’s management has concluded that the Company’s internal control over financial reporting was effective as of January 31, 2016.
Our internal control over financial reporting as of January 31, 2016 has been audited by PricewaterhouseCoopers LLP, an independent registered public accounting firm, as stated in their report which appears herein.
Changes in Internal Control Over Financial Reporting
There has been no change in the Company’s internal control over financial reporting (as defined in Rule 13a-15(f) under the Exchange Act) during the three months ended January 31, 2016, that has materially affected, or is reasonably likely to materially affect, the Company’s internal control over financial reporting.
See Consolidated Financial Statements and Supplementary Data for the Report of Independent Registered Public Accounting Firm.
Item 9B. Other Information
None.
43
PART III
Item 10. Directors, Executive Officers and Corporate Governance
The information required by this item will be included in the Company’s Proxy Statement for the 2016 annual meeting of shareholders under the captions “Election of Directors” and “Management” and is incorporated herein by reference.
Information on the beneficial ownership reporting for the Company’s directors and executive officers will be contained in the Company’s Proxy Statement for the 2016 annual meeting of shareholders under the caption “Section 16(a) Beneficial Ownership Reporting Compliance” and is incorporated herein by reference.
Information on the Company’s Audit Committee and Audit Committee Financial Expert will be contained in the Company’s Proxy Statement for the 2016 annual meeting of shareholders under the caption “Information Regarding the Board of Directors and Its Committees” and is incorporated herein by reference.
The Company has adopted and posted on its website at www.movadogroup.com a Code of Business Conduct and Ethics that applies to all directors, officers and employees, including the Company’s Chief Executive Officer, Chief Financial Officer and principal financial and accounting officers. The Company will post any amendments to the Code of Business Conduct and Ethics, and any waivers that are required to be disclosed by SEC regulations, on the Company’s website.
Item 11. Executive Compensation
The information required by this item will be included in the Company’s Proxy Statement for the 2016 annual meeting of shareholders under the captions “Executive Compensation” and “Compensation of Directors” and is incorporated herein by reference.
Item 12. Security Ownership of Certain Beneficial Owners and Management and Related Stockholder Matters
The information required by this item will be included in the Company’s Proxy Statement for the 2016 annual meeting of shareholders under the caption “Security Ownership of Certain Beneficial Owners and Management” and is incorporated herein by reference.
Item 13. Certain Relationships and Related Transactions and Director Independence
The information required by this item will be included in the Company’s Proxy Statement for the 2016 annual meeting of shareholders under the caption “Certain Relationships and Related Transactions” and is incorporated herein by reference.
Item 14. Principal Accounting Fees and Services
The information required by this item will be included in the Company’s Proxy Statement for the 2016 annual meeting of shareholders under the caption “Fees Paid to PricewaterhouseCoopers LLP” and is incorporated herein by reference.
44
PART IV
Item 15. Exhibits and Financial Statement Schedules
|
(a) |
Documents filed as part of this report |
|
|
1. |
Financial Statements: |
See Financial Statements Index on page 42 included in Item 8 of Part II of this annual report.
|
|
2. |
Financial Statement Schedule: |
Schedule II Valuation and Qualifying Accounts and Reserves
All other schedules are omitted because they are not applicable, or not required, or because the required information is included in the Consolidated Financial Statements or notes thereto.
|
|
3. |
Exhibits: |
Incorporated herein by reference is a list of the Exhibits contained in the Exhibit Index on pages 47 through 49 of this annual report.
45
SIGNATURES
Pursuant to the requirements of Section 13 or 15(d) of the Securities Exchange Act of 1934, the registrant has duly caused this report to be signed on its behalf by the undersigned, thereunto duly authorized.
|
|
|
MOVADO GROUP, INC. (Registrant) |
|
Dated: March 31, 2016 |
By: |
/s/ Efraim Grinberg |
|
|
|
Efraim Grinberg |
|
|
|
Chairman of the Board of Directors |
|
|
|
and Chief Executive Officer |
Pursuant to the requirements of the Securities Exchange Act of 1934, this report has been signed below by the following persons on behalf of the registrant and in the capacities and on the date indicated.
|
Dated: March 31, 2016 |
|
/s/ Efraim Grinberg |
|
|
|
Efraim Grinberg |
|
|
|
Chairman of the Board of Directors, Director |
|
|
|
and Chief Executive Officer |
|
|
|
|
|
Dated: March 31, 2016 |
|
/s/ Richard J. Coté |
|
|
|
Richard J. Coté |
|
|
|
Vice Chairman of the Board of Directors, |
|
|
|
Director and Chief Operating Officer |
|
|
|
|
|
Dated: March 31, 2016 |
|
/s/ Sallie A. DeMarsilis |
|
|
|
Sallie A. DeMarsilis |
|
|
|
Senior Vice President, Chief Financial Officer |
|
|
|
and Principal Accounting Officer |
|
|
|
|
|
Dated: March 31, 2016 |
|
/s/ Peter Bridgman |
|
|
|
Peter Bridgman |
|
|
|
Director |
|
|
|
|
|
Dated: March 31, 2016 |
|
/s/ Alex Grinberg |
|
|
|
Alex Grinberg |
|
|
|
Director |
|
|
|
|
|
Dated: March 31, 2016 |
|
/s/ Margaret Hayes Adame |
|
|
|
Margaret Hayes Adame |
|
|
|
Director |
|
|
|
|
|
Dated: March 31, 2016 |
|
/s/ Alan H. Howard |
|
|
|
Alan H. Howard |
|
|
|
Director |
|
|
|
|
|
Dated: March 31, 2016 |
|
/s/ Richard D. Isserman |
|
|
|
Richard D. Isserman |
|
|
|
Director |
|
|
|
|
|
Dated: March 31, 2016 |
|
/s/ Nathan Leventhal |
|
|
|
Nathan Leventhal |
|
|
|
Director |
|
|
|
|
|
Dated: March 31, 2016 |
|
/s/ Maurice Reznik |
|
|
|
Maurice Reznik |
|
|
|
Director |
46
EXHIBIT INDEX
|
Exhibit Number |
|
Description |
|
3.1 |
|
Restated By-Laws of the Registrant. Incorporated by reference to Exhibit 3.1 to the Registrant’s Current Report on Form 8-K filed on July 14, 2014. |
|
|
|
|
|
3.2 |
|
Restated Certificate of Incorporation of the Registrant as amended. Incorporated herein by reference to Exhibit 3(i) to the Registrant’s Quarterly Report on Form 10-Q for the quarter ended July 31, 1999. |
|
|
|
|
|
4.1 |
|
Specimen Common Stock Certificate. Incorporated herein by reference to Exhibit 4.1 to the Registrant’s Annual Report on Form 10-K for the year ended January 31, 1998. |
|
|
|
|
|
10.1 |
|
Movado Group, Inc. 1996 Stock Incentive Plan, Amended and Restated as of April 8, 2013. Incorporated herein by reference to Annex A to the Registrant’s Definitive Proxy Statement on Schedule 14A filed on May 2, 2013.* |
|
|
|
|
|
10.2 |
|
Form of Stock Award Agreement under the Movado Group, Inc. 1996 Stock Incentive Plan, amended and restated as of April 4, 2013. Incorporated herein by reference to Exhibit 10.2 to the Registrant’s Quarterly Report on Form 10-Q for the quarter ended April 30, 2015.* |
|
|
|
|
|
10.3 |
|
Form of Option Award Agreement under the Movado Group, Inc. 1996 Stock Incentive Plan, amended and restated as of April 4, 2013. Incorporated herein by reference to Exhibit 10.3 to the Registrant’s Quarterly Report on Form 10-Q for the quarter ended April 30, 2015.* |
|
|
|
|
|
10.4 |
|
Movado Group, Inc. Amended and Restated Deferred Compensation Plan for Executives, effective January 1, 2013. Incorporated herein by reference to Annex B to the Registrant’s Definitive Proxy Statement on Schedule 14A filed on May 2, 2013.* |
|
|
|
|
|
10.5 |
|
Offer letter to Ricardo Quintero dated May 29, 2014. Incorporated herein by reference to Exhibit 10.1 to the Registrant’s Current Report on Form 8-K filed July 14, 2014.* |
|
|
|
|
|
10.6 |
|
Severance Agreement dated December 15, 1999, and entered into December 16, 1999 between the Registrant and Richard J. Coté. Incorporated herein by reference to Exhibit 10.35 to the Registrant’s Annual Report on Form 10-K for the year ended January 31, 2000.* |
|
|
|
|
|
10.7 |
|
Lease made December 21, 2000 between the Registrant and Mack-Cali Realty, L.P. for premises in Paramus, New Jersey together with First Amendment thereto made December 21, 2000. Incorporated herein by reference to Exhibit 10.22 to the Registrant’s Annual Report on Form 10-K for the year ended January 31, 2000. |
|
|
|
|
|
10.8 |
|
Second Amendment of Lease dated July 26, 2001 between Mack-Cali Realty, L.P., as landlord, and Movado Group, Inc., as tenant, further amending lease dated as of December 21, 2000. Incorporated herein by reference to Exhibit 10.2 to the Registrant’s Quarterly Report on Form 10-Q filed for the quarter ended October 31, 2001. |
|
|
|
|
|
10.9 |
|
Third Amendment of Lease dated November 6, 2001 between Mack-Cali Realty, L.P., as lessor, and Movado Group, Inc., as lessee, for additional space at Mack-Cali II, One Mack Drive, Paramus, New Jersey. Incorporated herein by reference to Exhibit 10.4 to the Registrant’s Quarterly Report on Form 10-Q filed for the quarter ended October 31, 2001. |
|
|
|
|
|
10.10 |
|
Fifth Amendment of Lease dated October 20, 2003 between Mack-Cali Realty, L.P. as landlord, and the Registrant as tenant further amending the lease dated as of December 21, 2000. Incorporated herein by reference to Exhibit 10.29 to the Registrant’s Annual Report on Form 10-K for the year ended January 31, 2004. |
|
|
|
|
|
10.11 |
|
Tenth Amendment to Lease dated March 10, 2011 between Mack-Cali Realty, L.P., as landlord, and the Registrant, as tenant, further amending the lease dated as of December 21, 2000. Incorporated herein by reference to Exhibit 10.36 to the Registrant’s Annual Report on Form 10-K for the year ended January 31, 2011. |
|
|
|
|
|
10.12 |
|
Lease Agreement dated May 22, 2000 between Forsgate Industrial Complex and the Registrant for premises located at 105 State Street, Moonachie, New Jersey. Incorporated herein by reference to Exhibit 10.1 to the Registrant’s Quarterly Report on Form 10-Q for the quarter ended April 30, 2000. |
|
|
|
|
|
10.13 |
|
First Amendment dated as of February 27, 2009 to Lease dated May 22, 2000 between Forsgate Industrial Complex as Landlord and Movado Group, Inc. as Tenant for the premises known as 105 State Street, Moonachie, New Jersey. Incorporated herein by reference to Exhibit 10.42 to the Registrant’s Annual Report on Form 10-K for the year ended January 31, 2009. |
47
|
Exhibit Number |
|
Description |
|
|
|
|
|
10.14 |
|
Master Credit Agreement dated August 17, 2004 and August 20, 2004 between MGI Luxury Group S.A. and UBS AG. Incorporated herein by reference to Exhibit 10.2 to the Registrant’s Quarterly Report on Form 10-Q for the quarter ended July 31, 2004. |
|
|
|
|
|
10.15 |
|
Credit Agreement, dated as of January 30, 2015, by and among Movado Group, Inc., Movado Group Delaware Holdings Corporation, Movado Retail Group, Inc. and Movado LLC, as Borrowers, the lenders party thereto from time to time and Bank of America, N.A., as administrative agent. Incorporated herein by reference to Exhibit 10.1 to the Registrant’s Current Report on Form 8-K filed February 5, 2015. |
|
|
|
|
|
10.16 |
|
Security and Pledge Agreement, dated as of January 30, 2015, by and among Movado Group, Inc., Movado Group Delaware Holdings Corporation, Movado Retail Group, Inc. and Movado LLC, as Grantors, and Bank of America, N.A., as administrative agent. Incorporated herein by reference to Exhibit 10.2 to the Registrant’s Current Report on Form 8-K filed February 5, 2015. |
|
|
|
|
|
10.17 |
|
Amended and Restated License Agreement dated January 13, 2015 between the Registrant, Swissam Products Limited and Coach, Inc. Incorporated herein by reference to Exhibit 10.35 to the Registrant’s Annual Report on Form 10-K for the year ended January 31, 2015. |
|
|
|
|
|
10.18 |
|
Amended and Restated License Agreement between MGI Luxury Group, S.A., a wholly-owned Swiss subsidiary of Movado Group, Inc., Lacoste S.A., Sporloisirs S.A. and Lacoste Alligator S.A., dated March 28, 2014 with an effective date as of January 1, 2015. Incorporated herein by reference to Exhibit 10.1 to the Registrant’s Current Report on Form 8-K/A filed, December 30, 2014. |
|
|
|
|
|
10.19 |
|
License agreement dated January 1, 1992, between The Hearst Corporation and the Registrant, as amended on January 17, 1992. Incorporated herein by reference to Exhibit 10.8 to the Registrant’s Registration Statement on Form S-1 (Registration No. 33-666000). |
|
|
|
|
|
10.20 |
|
Letter Agreement between the Registrant and The Hearst Corporation dated October 24, 1994 executed October 25, 1995 amending License Agreement dated as of January 1, 1992, as amended. Incorporated herein by reference to Exhibit 10.1 to the Registrant’s Quarterly Report on Form 10-Q for the quarter ended October 31, 1995. |
|
|
|
|
|
10.21 |
|
Third Amendment to License Agreement dated as of January 1, 1992 between the Registrant and Hearst Magazines, a Division of Hearst Communications, Inc. (successor in interest to The Hearst Corporation), effective February 15, 2007. Incorporated herein by reference to Exhibit 10.1 to the Registrant’s Quarterly Report on Form 10-Q for the quarter ended April 30, 2007. |
|
|
|
|
|
10.22 |
|
Amended and Restated License Agreement among Tommy Hilfiger Licensing LLC, Movado Group, Inc. and Swissam Products Limited, dated as of September 16, 2009. Incorporated herein by reference to Exhibit 10.1 to the Registrant’s Quarterly Report on Form 10-Q for the quarter ended October 31, 2009. |
|
|
|
|
|
10.23 |
|
Second Amendment entered into as of September 30, 2012 to Amended and Restated License Agreement dated September 16, 2009 by and between the Registrant, Swissam Products Limited and Tommy Hilfiger Licensing, LLC. Incorporated herein by reference to Exhibit 10.1 to the Registrant’s Quarterly Report on Form 10-Q for the quarter ended October 31, 2012. |
|
|
|
|
|
10.24 |
|
Third Amendment entered into as of November 13, 2013 to Amended and Restated License Agreement dated September 16, 2009 by and between the Registrant, Swissam Products Limited and Tommy Hilfiger Licensing, LLC. Incorporated herein by reference to Exhibit 10.43 to the Registrant’s Annual Report on Form 10-K for the year ended January 31, 2014. |
|
|
|
|
|
10.25 |
|
Amended and Restated License Agreement, effective as of January 1, 2012 by and between MGI Luxury Group, S.A. and Hugo Boss Trademark Management GmbH & Co. KG. Incorporated herein by reference to Exhibit 10.39 to the Registrant’s Annual Report on Form 10-K for the year ended January 31, 2012. |
|
|
|
|
|
10.26 |
|
License Agreement entered into as of March 22, 2012 by and between the Registrant and Ferrari S.p.A. Incorporated herein by reference to Exhibit 10.40 to the Registrant’s Annual Report on Form 10-K for the year ended January 31, 2012. |
|
|
|
|
|
10.27 |
|
License Agreement entered into November 21, 2005 by and between the Registrant, Swissam Products Limited and L.C. Licensing, Inc. Incorporated herein by reference to Exhibit 10.37 to the Registrant’s Annual Report on Form 10-K for the year ended January 31, 2006. |
48
|
Exhibit Number |
|
Description |
|
|
|
|
|
10.28 |
|
Second Amendment to License Agreement between L.C. Licensing, Inc., Movado Group, Inc. and Swissam Products Limited dated as of December 6, 2010, further amending the License Agreement dated as of November 15, 2005. Incorporated herein by reference to Exhibit 10.35 to the Registrant’s Annual Report on Form 10-K for the year ended January 31, 2011. |
|
|
|
|
|
10.29 |
|
Third Amendment dated as of June 1, 2011 to the License Agreement dated as of November 15, 2005 by and between L.C. Licensing, Inc., Registrant and Swissam Products Limited. Incorporated herein by reference to Exhibit 10.1 to the Registrant’s Quarterly Report on Form 10-Q for the quarter ended July 31, 2011. |
|
|
|
|
|
10.30 |
|
Fourth Amendment dated as of September 28, 2012 to the License Agreement dated as of November 15, 2005 by and between L.C. Licensing, Inc. (now ABG Juicy Couture, LLC), Registrant and Swissam Products Limited. Incorporated herein by reference to Exhibit 10.2 to the Registrant’s Quarterly Report on Form 10-Q for the quarter ended October 31, 2012. |
|
|
|
|
|
10.31 |
|
Fifth Amendment effective as of January 1, 2014 to the License Agreement dated as of November 15, 2005 by and between ABG Juicy Couture, LLC (previously L.C. Licensing, Inc.), Registrant and Swissam Products Limited. Incorporated herein by reference to Exhibit 10.1 to the Registrant’s Quarterly Report on Form 10-Q for the quarter ended April 30, 2015. |
|
|
|
|
|
10.32 |
|
Movado Group, Inc. Executive Performance Plan, Amended and Restated as of February 1, 2014. Incorporated herein by reference to Appendix A to the Registrant’s Definitive Proxy Statement on Schedule 14A filed on May 8, 2014.* |
|
|
|
|
|
21.1 |
|
Subsidiaries of the Registrant.** |
|
|
|
|
|
23.1 |
|
Consent of PricewaterhouseCoopers LLP.** |
|
|
|
|
|
31.1 |
|
Certification of Chief Executive Officer.** |
|
|
|
|
|
31.2 |
|
Certification of Chief Financial Officer.** |
|
|
|
|
|
32.1 |
|
Certification of Chief Executive Officer pursuant to 18 U.S.C. Section 1350, as adopted pursuant to Section 906 of the Sarbanes-Oxley Act of 2002.** |
|
|
|
|
|
32.2 |
|
Certification of Chief Financial Officer pursuant to 18 U.S.C. Section 1350, as adopted pursuant to Section 906 of the Sarbanes-Oxley Act of 2002.** |
|
|
|
|
|
101 |
|
The following materials from the Company’s Form 10-K for the year ended January 31, 2016, formatted in XBRL (eXtensible Business Reporting Language), (i) Consolidated Balance Sheets, (ii) Consolidated Statements of Operations, (iii) the Consolidated Statements of Comprehensive Income, (iv) Consolidated Statements of Cash Flows, (v) Consolidated Statements of Changes in Equity, (vi) Notes to the Consolidated Financial Statements, (vii) Schedule II- Valuation and Qualifying Accounts and Reserves. |
|
* |
Constitutes a compensatory plan or arrangement |
|
** |
Filed herewith |
49
Report of Independent Registered Public Accounting Firm
To the Board of Directors and Shareholders of Movado Group, Inc.:
In our opinion, the consolidated financial statements listed in the index appearing under Item 15(a)1 present fairly, in all material respects, the financial position of Movado Group, Inc. and its subsidiaries (the “Company”) at January 31, 2016 and January 31, 2015, and the results of their operations and their cash flows for each of the three years in the period ended January 31, 2016 in conformity with accounting principles generally accepted in the United States of America. In addition, in our opinion, the financial statement schedule listed in the index appearing under Item 15(a)2 presents fairly, in all material respects, the information set forth therein when read in conjunction with the related consolidated financial statements. Also in our opinion, the Company maintained, in all material respects, effective internal control over financial reporting as of January 31, 2016, based on criteria established in Internal Control - Integrated Framework (2013) issued by the Committee of Sponsoring Organizations of the Treadway Commission (COSO). The Company's management is responsible for these financial statements and financial statement schedule, for maintaining effective internal control over financial reporting and for its assessment of the effectiveness of internal control over financial reporting, included in Management's Annual Report on Internal Control Over Financial Reporting, appearing under Item 9A. Our responsibility is to express opinions on these financial statements, on the financial statement schedule, and on the Company's internal control over financial reporting based on our integrated audits. We conducted our audits in accordance with the standards of the Public Company Accounting Oversight Board (United States). Those standards require that we plan and perform the audits to obtain reasonable assurance about whether the financial statements are free of material misstatement and whether effective internal control over financial reporting was maintained in all material respects. Our audits of the financial statements included examining, on a test basis, evidence supporting the amounts and disclosures in the financial statements, assessing the accounting principles used and significant estimates made by management, and evaluating the overall financial statement presentation. Our audit of internal control over financial reporting included obtaining an understanding of internal control over financial reporting, assessing the risk that a material weakness exists, and testing and evaluating the design and operating effectiveness of internal control based on the assessed risk. Our audits also included performing such other procedures as we considered necessary in the circumstances. We believe that our audits provide a reasonable basis for our opinions.
As discussed in Note 8 to the consolidated financial statements, the Company changed the manner in which it classifies deferred taxes.
A company’s internal control over financial reporting is a process designed to provide reasonable assurance regarding the reliability of financial reporting and the preparation of financial statements for external purposes in accordance with generally accepted accounting principles. A company’s internal control over financial reporting includes those policies and procedures that (i) pertain to the maintenance of records that, in reasonable detail, accurately and fairly reflect the transactions and dispositions of the assets of the company; (ii) provide reasonable assurance that transactions are recorded as necessary to permit preparation of financial statements in accordance with generally accepted accounting principles, and that receipts and expenditures of the company are being made only in accordance with authorizations of management and directors of the company; and (iii) provide reasonable assurance regarding prevention or timely detection of unauthorized acquisition, use, or disposition of the company’s assets that could have a material effect on the financial statements.
Because of its inherent limitations, internal control over financial reporting may not prevent or detect misstatements. Also, projections of any evaluation of effectiveness to future periods are subject to the risk that controls may become inadequate because of changes in conditions, or that the degree of compliance with the policies or procedures may deteriorate.
|
/s/ PricewaterhouseCoopers LLP |
New York, New York
March 31, 2016
50
CONSOLIDATED STATEMENTS OF OPERATIONS
(In thousands, except per share amounts)
|
|
Fiscal Year Ended January 31, |
|
|||||||||
|
|
2016 |
|
|
2015 |
|
|
2014 |
|
|||
|
Net sales |
$ |
594,923 |
|
|
$ |
586,980 |
|
|
$ |
570,255 |
|
|
Cost of sales |
|
277,993 |
|
|
|
276,998 |
|
|
|
264,994 |
|
|
Gross profit |
|
316,930 |
|
|
|
309,982 |
|
|
|
305,261 |
|
|
Selling, general and administrative |
|
246,823 |
|
|
|
238,495 |
|
|
|
237,519 |
|
|
Operating income |
|
70,107 |
|
|
|
71,487 |
|
|
|
67,742 |
|
|
Other income, net (Note 17) |
|
— |
|
|
|
— |
|
|
|
1,526 |
|
|
Interest expense |
|
(1,109 |
) |
|
|
(489 |
) |
|
|
(436 |
) |
|
Interest income |
|
127 |
|
|
|
166 |
|
|
|
86 |
|
|
Income before income taxes |
|
69,125 |
|
|
|
71,164 |
|
|
|
68,918 |
|
|
Provision for income taxes (Note 8) |
|
23,360 |
|
|
|
19,264 |
|
|
|
17,373 |
|
|
Net income |
|
45,765 |
|
|
|
51,900 |
|
|
|
51,545 |
|
|
Less: Net income attributed to noncontrolling interests |
|
671 |
|
|
|
124 |
|
|
|
668 |
|
|
Net income attributed to Movado Group, Inc. |
$ |
45,094 |
|
|
$ |
51,776 |
|
|
$ |
50,877 |
|
|
Basic income per share: |
|
|
|
|
|
|
|
|
|
|
|
|
Weighted basic average shares outstanding |
|
23,525 |
|
|
|
25,276 |
|
|
|
25,506 |
|
|
Net income per share attributed to Movado Group, Inc. |
$ |
1.92 |
|
|
$ |
2.05 |
|
|
$ |
1.99 |
|
|
Diluted income per share: |
|
|
|
|
|
|
|
|
|
|
|
|
Weighted diluted average shares outstanding |
|
23,774 |
|
|
|
25,581 |
|
|
|
25,849 |
|
|
Net income per share attributed to Movado Group, Inc. |
$ |
1.90 |
|
|
$ |
2.02 |
|
|
$ |
1.97 |
|
|
Dividends paid per share |
$ |
0.44 |
|
|
$ |
0.40 |
|
|
$ |
0.26 |
|
See Notes to Consolidated Financial Statements
51
CONSOLIDATED STATEMENTS OF COMPREHENSIVE INCOME
(In thousands)
|
|
Fiscal Year Ended January 31, |
|
|||||||||
|
|
2016 |
|
|
2015 |
|
|
2014 |
|
|||
|
Comprehensive income, net of taxes: |
|
|
|
|
|
|
|
|
|
|
|
|
Net income including noncontrolling interests |
$ |
45,765 |
|
|
$ |
51,900 |
|
|
$ |
51,545 |
|
|
Net unrealized (loss) / gain on investments, net of tax (benefit) of $(15), $18 and $77, respectively |
|
(22) |
|
|
|
29 |
|
|
|
213 |
|
|
Net change in effective portion of hedging contracts, net of tax of $10, $0 and $0, respectively |
|
50 |
|
|
|
- |
|
|
|
- |
|
|
Gain on available-for-sale securities, net of tax benefit of $0, $50 and $0, respectively |
|
- |
|
|
|
(81) |
|
|
|
- |
|
|
Foreign currency translation adjustments |
|
(30,314) |
|
|
|
(5,211) |
|
|
|
1,234 |
|
|
Comprehensive income including noncontrolling interests |
|
15,479 |
|
|
|
46,637 |
|
|
|
52,992 |
|
|
Less: Comprehensive income / (loss) attributed to noncontrolling interests |
|
734 |
|
|
|
(291) |
|
|
|
684 |
|
|
Total comprehensive income attributed to Movado Group, Inc. |
$ |
14,745 |
|
|
$ |
46,928 |
|
|
$ |
52,308 |
|
See Notes to Consolidated Financial Statements
52
(In thousands, except share and per share amounts)
|
|
January 31, |
|
|
January 31, |
|
|
||
|
|
2016 |
|
|
2015 |
|
|
||
|
ASSETS |
|
|
|
|
|
|
|
|
|
Current assets: |
|
|
|
|
|
|
|
|
|
Cash and cash equivalents |
$ |
228,188 |
|
|
$ |
199,852 |
|
|
|
Trade receivables, net |
|
71,030 |
|
|
|
74,106 |
|
|
|
Inventories |
|
162,465 |
|
|
|
170,788 |
|
|
|
Other current assets |
|
27,352 |
|
|
|
34,097 |
|
|
|
Total current assets |
|
489,035 |
|
|
|
478,843 |
|
|
|
|
|
|
|
|
|
|
|
|
|
Property, plant and equipment, net |
|
38,553 |
|
|
|
46,673 |
|
|
|
Deferred and non-current income taxes |
|
20,323 |
|
|
|
19,985 |
|
|
|
Other non-current assets |
|
37,259 |
|
|
|
37,522 |
|
|
|
Total assets |
$ |
585,170 |
|
|
$ |
583,023 |
|
|
|
LIABILITIES AND EQUITY |
|
|
|
|
|
|
|
|
|
Current liabilities: |
|
|
|
|
|
|
|
|
|
Loans payable to bank, current |
$ |
5,000 |
|
|
$ |
- |
|
|
|
Accounts payable |
|
27,308 |
|
|
|
27,767 |
|
|
|
Accrued liabilities |
|
28,570 |
|
|
|
25,921 |
|
|
|
Accrued payroll and benefits |
|
11,047 |
|
|
|
5,012 |
|
|
|
Income taxes payable |
|
6,257 |
|
|
|
7,147 |
|
|
|
Total current liabilities |
|
78,182 |
|
|
|
65,847 |
|
|
|
|
|
|
|
|
|
|
|
|
|
Loans payable to bank |
|
35,000 |
|
|
|
- |
|
|
|
Deferred and non-current income taxes payable |
|
2,640 |
|
|
|
3,695 |
|
|
|
Other non-current liabilities |
|
28,201 |
|
|
|
29,196 |
|
|
|
Total liabilities |
|
144,023 |
|
|
|
98,738 |
|
|
|
|
|
|
|
|
|
|
|
|
|
Commitments and contingencies (Note 10) |
|
|
|
|
|
|
|
|
|
Equity: |
|
|
|
|
|
|
|
|
|
Preferred Stock, $0.01 par value, 5,000,000 shares authorized; no shares issued |
|
— |
|
|
|
— |
|
|
|
Common Stock, $0.01 par value, 100,000,000 shares authorized; 26,962,656 and 26,849,080 shares issued, respectively |
|
270 |
|
|
|
268 |
|
|
|
Class A Common Stock, $0.01 par value, 30,000,000 shares authorized; 6,644,105 and 6,642,184 shares issued and outstanding, respectively |
|
66 |
|
|
|
66 |
|
|
|
Capital in excess of par value |
|
178,118 |
|
|
|
174,826 |
|
|
|
Retained earnings |
|
392,788 |
|
|
|
358,006 |
|
|
|
Accumulated other comprehensive income |
|
68,505 |
|
|
|
98,854 |
|
|
|
Treasury Stock, 10,664,512 and 8,784,497 shares, respectively, at cost |
|
(199,195 |
) |
|
|
(149,811 |
) |
|
|
Total Movado Group, Inc. shareholders' equity |
|
440,552 |
|
|
|
482,209 |
|
|
|
Noncontrolling interests |
|
595 |
|
|
|
2,076 |
|
|
|
Total equity |
|
441,147 |
|
|
|
484,285 |
|
|
|
Total liabilities and equity |
$ |
585,170 |
|
|
$ |
583,023 |
|
|
See Notes to Consolidated Financial Statements
53
CONSOLIDATED STATEMENTS OF CASH FLOWS
(In thousands)
|
|
Fiscal Year Ended January 31, |
|
|||||||||
|
|
2016 |
|
|
2015 |
|
|
2014 |
|
|||
|
Cash flows from operating activities: |
|
|
|
|
|
|
|
|
|
|
|
|
Net income including noncontrolling interests |
$ |
45,765 |
|
|
$ |
51,900 |
|
|
$ |
51,545 |
|
|
Adjustments to reconcile net income to net cash provided by operating activities: |
|
|
|
|
|
|
|
|
|
|
|
|
Depreciation and amortization |
|
13,156 |
|
|
|
12,469 |
|
|
|
12,233 |
|
|
Write-down of inventories |
|
3,108 |
|
|
|
2,514 |
|
|
|
5,586 |
|
|
Transactional (gains) / losses |
|
(2,388) |
|
|
|
2,493 |
|
|
|
1,403 |
|
|
Deferred income taxes |
|
(1,817) |
|
|
|
6,316 |
|
|
|
4,169 |
|
|
Gain on sale of asset held for sale |
|
— |
|
|
|
— |
|
|
|
(1,526) |
|
|
Gain on available-for-sale securities |
|
— |
|
|
|
(131) |
|
|
|
— |
|
|
Stock-based compensation |
|
6,123 |
|
|
|
5,753 |
|
|
|
3,787 |
|
|
Excess tax shortfall / (benefit) from stock-based compensation |
|
31 |
|
|
|
(1,270 |
) |
|
|
(915 |
) |
|
Operating efficiency initiatives and other items |
|
3,996 |
|
|
|
— |
|
|
|
— |
|
|
Loss on disposal of fixed assets |
|
310 |
|
|
|
— |
|
|
|
— |
|
|
Changes in assets and liabilities: |
|
|
|
|
|
|
|
|
|
|
|
|
Trade receivables |
|
(354) |
|
|
|
(9,334) |
|
|
|
(7,304) |
|
|
Inventories |
|
(3,133) |
|
|
|
4,523 |
|
|
|
(19,077) |
|
|
Other current assets |
|
2,808 |
|
|
|
(3,323) |
|
|
|
(5,141) |
|
|
Accounts payable |
|
774 |
|
|
|
(5,357) |
|
|
|
11,581 |
|
|
Accrued liabilities |
|
(94) |
|
|
|
(1,582) |
|
|
|
(4,171) |
|
|
Accrued payroll and benefits |
|
6,035 |
|
|
|
(9,443) |
|
|
|
(1,887) |
|
|
Income taxes payable |
|
(746) |
|
|
|
4,300 |
|
|
|
7,054 |
|
|
Other non-current assets |
|
1,864 |
|
|
|
(3,954) |
|
|
|
(5,752) |
|
|
Other non-current liabilities |
|
(848) |
|
|
|
3,722 |
|
|
|
2,931 |
|
|
Net cash provided by operating activities |
|
74,590 |
|
|
|
59,596 |
|
|
|
54,516 |
|
|
Cash flows from investing activities: |
|
|
|
|
|
|
|
|
|
|
|
|
Capital expenditures |
|
(8,070) |
|
|
|
(11,132) |
|
|
|
(16,707) |
|
|
Trademarks and other intangibles |
|
(650) |
|
|
|
(118) |
|
|
|
(285) |
|
|
Short-term investment |
|
— |
|
|
|
— |
|
|
|
(33,099) |
|
|
Long-term investment |
|
(435 |
) |
|
|
(1,200) |
|
|
|
— |
|
|
Proceeds from short-term investment |
|
— |
|
|
|
33,736 |
|
|
|
— |
|
|
Proceeds from available-for-sale securities |
|
— |
|
|
|
307 |
|
|
|
— |
|
|
Proceeds from asset held for sale |
|
— |
|
|
|
— |
|
|
|
2,196 |
|
|
Net cash (used in) / provided by investing activities |
|
(9,155) |
|
|
|
21,593 |
|
|
|
(47,895) |
|
|
Cash flows from financing activities: |
|
|
|
|
|
|
|
|
|
|
|
|
Proceeds from bank borrowings |
|
50,000 |
|
|
|
— |
|
|
|
— |
|
|
Repayments of bank borrowings |
|
(10,000) |
|
|
|
— |
|
|
|
— |
|
|
Stock options exercised and other changes |
|
(25) |
|
|
|
291 |
|
|
|
(305) |
|
|
Excess tax (shortfall) / benefit from stock-based compensation |
|
(31) |
|
|
|
1,270 |
|
|
|
915 |
|
|
Stock repurchase |
|
(48,748) |
|
|
|
(26,382) |
|
|
|
(10,488) |
|
|
Purchase of incremental ownership of joint venture with TWC |
|
(4,267) |
|
|
|
— |
|
|
|
— |
|
|
Debt issuance cost |
|
(339) |
|
|
|
(936) |
|
|
|
— |
|
|
Distribution of noncontrolling interests earnings |
|
— |
|
|
|
(319) |
|
|
|
— |
|
|
Dividends paid |
|
(10,312) |
|
|
|
(10,104 |
) |
|
|
(6,637 |
) |
|
Net cash (used in) financing activities |
|
(23,722) |
|
|
|
(36,180 |
) |
|
|
(16,515 |
) |
|
Effect of exchange rate changes on cash and cash equivalents |
|
(13,377) |
|
|
|
(2,816) |
|
|
|
(336) |
|
|
Net increase / (decrease) in cash and cash equivalents |
|
28,336 |
|
|
|
42,193 |
|
|
|
(10,230 |
) |
|
Cash and cash equivalents at beginning of year |
|
199,852 |
|
|
|
157,659 |
|
|
|
167,889 |
|
|
Cash and cash equivalents at end of year |
$ |
228,188 |
|
|
$ |
199,852 |
|
|
$ |
157,659 |
|
See Notes to Consolidated Financial Statements
54
CONSOLIDATED STATEMENTS OF CHANGES IN EQUITY
(In thousands, except per share amounts)
|
|
Movado Group, Inc. Shareholders’ Equity |
|
|
|
|
|
|
||||||||||||||||||||||||||||
|
|
Preferred |
|
|
Common |
|
|
Class A |
|
|
Capital in |
|
|
Retained |
|
|
Accumulated |
|
|
Treasury |
|
|
Noncontrolling |
|
|
Total |
|
|||||||||
|
Balance, January 31, 2013 |
$ |
— |
|
|
$ |
264 |
|
|
$ |
66 |
|
|
$ |
159,696 |
|
|
$ |
272,094 |
|
|
$ |
102,271 |
|
|
$ |
(110,701 |
) |
|
$ |
2,002 |
|
|
$ |
425,692 |
|
|
Net income |
|
|
|
|
|
|
|
|
|
|
|
|
|
|
|
|
|
50,877 |
|
|
|
|
|
|
|
|
|
|
|
668 |
|
|
|
51,545 |
|
|
Dividends ($0.26 per share) |
|
|
|
|
|
|
|
|
|
|
|
|
|
|
|
|
|
(6,637 |
) |
|
|
|
|
|
|
|
|
|
|
|
|
|
|
(6,637 |
) |
|
Stock options exercised, net of tax benefit of $915 |
|
|
|
|
|
2 |
|
|
|
|
|
|
|
1,825 |
|
|
|
|
|
|
|
|
|
|
|
(1,217 |
) |
|
|
|
|
|
|
610 |
|
|
Supplemental executive retirement plan |
|
|
|
|
|
|
|
|
|
|
|
|
|
34 |
|
|
|
|
|
|
|
|
|
|
|
|
|
|
|
|
|
|
|
34 |
|
|
Stock-based compensation expense |
|
|
|
|
|
|
|
|
|
|
|
|
|
3,787 |
|
|
|
|
|
|
|
|
|
|
|
|
|
|
|
|
|
|
|
3,787 |
|
|
Net unrealized gain on investments, net of tax of $77 |
|
|
|
|
|
|
|
|
|
|
|
|
|
|
|
|
|
|
|
|
|
213 |
|
|
|
|
|
|
|
|
|
|
|
213 |
|
|
Foreign currency translation adjustment (3) |
|
|
|
|
|
|
|
|
|
|
|
|
|
|
|
|
|
|
|
|
|
1,218 |
|
|
|
|
|
|
|
16 |
|
|
|
1,234 |
|
|
Stock repurchase |
|
|
|
|
|
|
|
|
|
|
|
|
|
|
|
|
|
|
|
|
|
|
|
|
|
(10,488 |
) |
|
|
|
|
|
|
(10,488 |
) |
|
Balance, January 31, 2014 |
|
— |
|
|
|
266 |
|
|
|
66 |
|
|
|
165,342 |
|
|
|
316,334 |
|
|
|
103,702 |
|
|
|
(122,406 |
) |
|
|
2,686 |
|
|
|
465,990 |
|
|
Net income |
|
|
|
|
|
|
|
|
|
|
|
|
|
|
|
|
|
51,776 |
|
|
|
|
|
|
|
|
|
|
|
124 |
|
|
|
51,900 |
|
|
Dividends ($0.40 per share) |
|
|
|
|
|
|
|
|
|
|
|
|
|
|
|
|
|
(10,104 |
) |
|
|
|
|
|
|
|
|
|
|
|
|
|
|
(10,104 |
) |
|
Stock options exercised, net of tax benefit of $1,270 |
|
|
|
|
|
2 |
|
|
|
|
|
|
|
2,967 |
|
|
|
|
|
|
|
|
|
|
|
(1,408 |
) |
|
|
|
|
|
|
1,561 |
|
|
Distribution of noncontrolling interest earnings |
|
|
|
|
|
|
|
|
|
|
|
|
|
|
|
|
|
|
|
|
|
|
|
|
|
|
|
|
|
(319 |
) |
|
|
(319 |
) |
|
Stock repurchase |
|
|
|
|
|
|
|
|
|
|
|
|
|
|
|
|
|
|
|
|
|
|
|
|
|
(26,382 |
) |
|
|
|
|
|
|
(26,382 |
) |
|
Supplemental executive retirement plan |
|
|
|
|
|
|
|
|
|
|
|
|
|
93 |
|
|
|
|
|
|
|
|
|
|
|
|
|
|
|
|
|
|
|
93 |
|
|
Stock-based compensation expense |
|
|
|
|
|
|
|
|
|
|
|
|
|
5,753 |
|
|
|
|
|
|
|
|
|
|
|
|
|
|
|
|
|
|
|
5,753 |
|
|
Stock donation |
|
|
|
|
|
|
|
|
|
|
|
|
|
671 |
|
|
|
|
|
|
|
|
|
|
|
385 |
|
|
|
|
|
|
|
1,056 |
|
|
Net unrealized gain on investments, net of tax of $18 |
|
|
|
|
|
|
|
|
|
|
|
|
|
|
|
|
|
|
|
|
|
29 |
|
|
|
|
|
|
|
|
|
|
|
29 |
|
|
Gain on available-for-sale securities, net of tax benefit of $50 |
|
|
|
|
|
|
|
|
|
|
|
|
|
|
|
|
|
|
|
|
|
(81 |
) |
|
|
|
|
|
|
|
|
|
|
(81 |
) |
|
Foreign currency translation adjustment (3) |
|
|
|
|
|
|
|
|
|
|
|
|
|
|
|
|
|
|
|
|
|
(4,796) |
|
|
|
|
|
|
|
(415 |
) |
|
|
(5,211 |
) |
|
Balance, January 31, 2015 |
|
— |
|
|
|
268 |
|
|
|
66 |
|
|
|
174,826 |
|
|
|
358,006 |
|
|
|
98,854 |
|
|
|
(149,811 |
) |
|
|
2,076 |
|
|
|
484,285 |
|
|
Net income |
|
|
|
|
|
|
|
|
|
|
|
|
|
|
|
|
|
45,094 |
|
|
|
|
|
|
|
|
|
|
|
671 |
|
|
|
45,765 |
|
|
Dividends ($0.44 per share) |
|
|
|
|
|
|
|
|
|
|
|
|
|
|
|
|
|
(10,312 |
) |
|
|
|
|
|
|
|
|
|
|
|
|
|
|
(10,312) |
|
|
Stock options exercised, net of tax of $31 |
|
|
|
|
|
2 |
|
|
|
|
|
|
|
578 |
|
|
|
|
|
|
|
|
|
|
|
(636 |
) |
|
|
|
|
|
|
(56) |
|
|
Joint venture incremental share purchase |
|
|
|
|
|
|
|
|
|
|
|
|
|
(3,613 |
) |
|
|
|
|
|
|
|
|
|
|
|
|
|
|
(2,215 |
) |
|
|
(5,828) |
|
|
Stock repurchase |
|
|
|
|
|
|
|
|
|
|
|
|
|
|
|
|
|
|
|
|
|
|
|
|
|
(48,748 |
) |
|
|
|
|
|
|
(48,748) |
|
|
Supplemental executive retirement plan |
|
|
|
|
|
|
|
|
|
|
|
|
|
204 |
|
|
|
|
|
|
|
|
|
|
|
|
|
|
|
|
|
|
|
204 |
|
|
Stock-based compensation expense |
|
|
|
|
|
|
|
|
|
|
|
|
|
6,123 |
|
|
|
|
|
|
|
|
|
|
|
|
|
|
|
|
|
|
|
6,123 |
|
|
Net unrealized loss on investments, net of tax benefit of $15 |
|
|
|
|
|
|
|
|
|
|
|
|
|
|
|
|
|
|
|
|
|
(22 |
) |
|
|
|
|
|
|
|
|
|
|
(22) |
|
|
Net change in effective portion of hedging contracts, net of tax of $10 |
|
|
|
|
|
|
|
|
|
|
|
|
|
|
|
|
|
|
|
|
|
50 |
|
|
|
|
|
|
|
|
|
|
|
50 |
|
|
Foreign currency translation adjustment (3) |
|
|
|
|
|
|
|
|
|
|
|
|
|
|
|
|
|
|
|
|
|
(30,377 |
) |
|
|
|
|
|
|
63 |
|
|
|
(30,314) |
|
|
Balance, January 31, 2016 |
$ |
— |
|
|
$ |
270 |
|
|
$ |
66 |
|
|
$ |
178,118 |
|
|
$ |
392,788 |
|
|
$ |
68,505 |
|
|
$ |
(199,195 |
) |
|
$ |
595 |
|
|
$ |
441,147 |
|
See Notes to Consolidated Financial Statement
|
(1) |
Each share of common stock is entitled to one vote per share. |
|
(2) |
Each share of class A common stock is entitled to 10 votes per share on all matters submitted to a vote of the shareholders. Each holder of class A common stock is entitled to convert, at any time, any and all of such shares into the same number of shares of common stock. Each share of class A common stock is converted automatically into common stock in the event that the beneficial or record ownership of such shares of class A common stock is transferred to any person, except to certain family members or affiliated persons deemed “permitted transferees” pursuant to the Company’s Restated Certificate of Incorporation as amended. The class A common stock is not publicly traded and consequently, there is currently no established public trading market for these shares. |
|
(3) |
The currency translation adjustment is not adjusted for income taxes to the extent that it relates to permanent investments of earnings in international subsidiaries. |
55
NOTES TO MOVADO GROUP, INC.’S CONSOLIDATED FINANCIAL STATEMENTS
NOTE 1 – RECLASSIFICATIONS
Certain reclassifications were made to prior years’ financial statement amounts and related note disclosures to conform to fiscal 2016 presentation. As a result of early adoption of ASU 2015-17, “Income Taxes: Balance Sheet Classification of Deferred Taxes,” current deferred tax liabilities and assets were reclassified to non-current in all periods presented.
NOTE 2 - SIGNIFICANT ACCOUNTING POLICIES
Organization and Business
Movado Group, Inc. (together with its subsidiaries, the “Company”) designs, sources, markets and distributes quality watches with prominent brands in almost every price category comprising the watch industry. In fiscal 2016, the Company marketed nine distinctive brands of watches: Coach, Concord, Ebel, Scuderia Ferrari, HUGO BOSS, Juicy Couture, Lacoste, Movado, and Tommy Hilfiger, which compete in most segments of the watch market.
Movado (with the exception of Movado BOLD), Ebel and Concord watches are manufactured in Switzerland by independent third party assemblers. All Movado (with the exception of Movado BOLD), Ebel and Concord watches are manufactured using Swiss movements. All of the Company’s products are manufactured using components obtained from third party suppliers. A majority of Movado BOLD watches are manufactured by independent contractors in Asia using Swiss movements. Coach, Tommy Hilfiger, HUGO BOSS, Juicy Couture, Lacoste and Scuderia Ferrari watches are manufactured by independent contractors in Asia.
In addition to its sales to trade customers and independent distributors, the Company also operates retail outlet locations throughout the United States, through which it sells discontinued models and factory seconds of all of the Company’s watches.
Principles of Consolidation
The consolidated financial statements include the accounts of the Company and its wholly-owned subsidiaries and a majority-owned joint venture. Intercompany transactions and balances have been eliminated.
Use of Estimates in the Preparation of Financial Statements
The preparation of financial statements in conformity with accounting principles generally accepted in the United States of America requires management to make estimates and assumptions that affect the reported amounts of assets and liabilities and disclosure of contingent assets and liabilities at the dates of the financial statements and the reported amounts of revenues and expenses during the reporting periods. Actual results could differ from those estimates. The Company uses estimates when accounting for sales discounts, returns, allowances and incentives, warranties, income taxes, depreciation, amortization, inventory write-downs, stock-based compensation, contingencies, impairments and asset and liability valuations.
Translation of Foreign Currency Financial Statements and Foreign Currency Transactions
The financial statements of the Company’s international subsidiaries have been translated into United States dollars by translating balance sheet accounts at year-end exchange rates and statement of operations accounts at average exchange rates for the year. Foreign currency transaction gains and losses are charged or credited to earnings as incurred. Foreign currency translation gains and losses are reflected in the equity section of the Company’s consolidated balance sheet in Accumulated Other Comprehensive Income. The balance of the foreign currency translation adjustment, included in Accumulated Other Comprehensive Income, was $68.3 million and $98.6 million as of January 31, 2016 and 2015, respectively.
Cash and Cash Equivalents
Cash equivalents include all highly liquid investments with original maturities at date of purchase of three months or less.
Trade Receivables
Trade receivables as shown on the consolidated balance sheets are net of various allowances. The allowance for doubtful accounts is determined through an analysis of the aging of accounts receivable, assessments of collectability based on historical trends, the financial condition of the Company’s customers and an evaluation of economic conditions. The Company writes off uncollectible trade receivables once collection efforts have been exhausted and third parties confirm the balance is not recoverable.
56
The Company’s trade customers include department stores, jewelry store chains and independent jewelers. All of the Company’s watch brands, except ESQ Movado, are also marketed outside the U.S. through a network of independent distributors. Accounts receivable are stated net of doubtful accounts, returns and allowances of $17.7 million (additionally $1.6 million was recorded in non-current assets), $16.6 million (additionally $0.5 million was recorded in non-current assets) and $23.1 million at January 31, 2016, 2015 and 2014, respectively. Accounts receivable are also stated net of co-operative advertising allowances of $9.8 million, $13.2 million, and $12.0 million at January 31, 2016, 2015, and 2014, respectively. Co-operative advertising allowances are credits taken by the customer at a future date on previously executed co-operative advertising. In fiscal 2014, the Company recorded return reserves of $7.8 million, for anticipated returns which resulted from the Company’s strategic decision to reduce the presence of ESQ Movado watches in certain retail doors while expanding the Movado brand offering.
The Company’s concentrations of credit risk arise primarily from accounts receivable related to trade customers during the peak selling seasons. The Company has significant accounts receivable balances due from major national chain and department stores. The Company’s results of operations could be materially adversely affected in the event any of these customers or a group of these customers defaulted on all or a significant portion of their obligations to the Company as a result of financial difficulties. As of January 31, 2016, except for those accounts provided for in the reserve for doubtful accounts, the Company knew of no situations with any of the Company’s major customers which would indicate any such customer’s inability to make its required payments.
In fiscal 2016, sales to Signet Jewelers Limited and Macy’s Inc., and their respective affiliates, represented approximately 20.7% of the Company’s total net sales, and approximately 23.2% of the Company’s net sales in the Wholesale segment.
Inventories
The Company values its inventory at the lower of cost or market. Cost is determined using the average cost method. The Company performs reviews of its on-hand inventory to determine amounts, if any, of inventory that is deemed discontinued, excess, or unsaleable. Inventory classified as discontinued, together with the related component parts which can be assembled into saleable finished goods, is sold primarily through the Company’s outlet stores. When management determines that finished product is unsaleable, could not be sold at net realizable value or that it is economically impractical to build the excess components into watches for sale, a charge is recorded to value those products and components at the lower of cost or market.
Property, Plant and Equipment
Property, plant and equipment are stated at cost less accumulated depreciation. Depreciation of buildings is provided using the straight-line method based on the useful life of 40 years. Depreciation of furniture and equipment is provided using the straight-line method based on the estimated useful lives of assets, which range from four to ten years. Computer software is amortized using the straight-line method over the useful life of five to ten years. Leasehold improvements are amortized using the straight-line method over the lesser of the term of the lease or the estimated useful life of the leasehold improvement. Design fees and tooling costs are amortized using the straight-line method based on the useful life of three years. Upon the disposition of property, plant and equipment, the accumulated depreciation is deducted from the original cost and any gain or loss is reflected in current earnings.
Intangibles
Intangible assets consist primarily of trademarks and developed technology and are recorded at cost. Trademarks and developed technology are amortized over a range from four to ten years. At January 31, 2016 and 2015, intangible assets at cost were $7.9 million and $13.0 million, respectively, and related accumulated amortization of intangibles was $6.4 million and $11.8 million, respectively. Amortization expense for fiscal 2016, 2015 and 2014 was $0.3 million, $0.3 million and $0.4 million, respectively.
Long-Lived Assets
The Company periodically reviews the estimated useful lives of its property, plant and equipment and intangible assets based on factors including historical experience, the expected beneficial service period of the asset, the quality and durability of the asset and the Company’s maintenance policy including periodic upgrades. Changes in useful lives are made on a prospective basis unless factors indicate the carrying amounts of the assets may not be recoverable and an impairment write-down is necessary.
The Company performs an impairment review of its long-lived assets once events or changes in circumstances indicate, in management’s judgment, that the carrying value of such assets may not be recoverable. When such a determination has been made, management compares the carrying value of the asset groups with their estimated future undiscounted cash flows. If it is determined that an impairment has occurred, the loss is recognized during that period. The impairment is calculated as the difference between asset carrying values and the fair value of the long-lived assets.
57
Deferred Rent Obligations and Contributions from Landlords
The Company accounts for rent expense under non-cancelable operating leases with scheduled rent increases on a straight-line basis over the lease term. The excess of straight-line rent expense over scheduled payments is recorded as a deferred liability. In addition, the Company receives build out contributions from landlords primarily as an incentive for the Company to lease retail store space from the landlords. This is also recorded as a deferred liability. Such amounts are amortized as a reduction of rent expense over the life of the related lease.
Capitalized Software Costs
The Company capitalizes certain computer software costs after technological feasibility has been established. The costs are amortized utilizing the straight-line method over the economic lives of the related products ranging from five to ten years.
Derivative Financial Instruments
The Company accounts for its derivative financial instruments in accordance with the accounting guidance which requires that an entity recognize all derivatives as either assets or liabilities in the statement of financial position and measure those instruments at fair value. A significant portion of the Company’s purchases are denominated in Swiss francs. The Company also sells to third-party customers in a variety of foreign currencies, most notably the Euro. The Company reduces its exposure to the Swiss franc and Euro exchange rate risks through a hedging program. Under the hedging program, the Company manages most of its foreign currency exposures on a consolidated basis, which allows it to net certain exposures and take advantage of natural offsets. In the event these exposures do not offset, the Company uses forward contracts to further reduce the net exposures to currency fluctuations. When entered into, the Company designates and documents these derivative instruments as a cash flow hedge of a specific underlying exposure, as well as the risk management objectives and strategies for undertaking the hedge transactions. Changes in the fair value of a derivative that is designated and documented as a cash flow hedge and is highly effective, are recorded in other comprehensive income until the underlying transaction affects earnings, and then are later reclassified into earnings in the same account as the hedged transaction. The earnings impact is mostly offset by the effects of currency movements on the underlying hedged transactions. The Company formally assesses, both at the inception and at each financial quarter thereafter, the effectiveness of the derivative instrument hedging the underlying forecasted cash flow transaction. The Company does not exclude any designated cash flow hedges from its effectiveness testing. Any ineffectiveness related to the derivative financial instruments’ change in fair value will be recognized as other income in the Consolidated Statements of Operations in the period in which the ineffectiveness was calculated.
The Company uses forward exchange contracts to offset its exposure to certain foreign currency receivables and liabilities. These forward contracts are not designated as qualified hedges and, therefore, changes in the fair value of these derivatives are recognized in earnings in the period they arise, thereby offsetting the current earnings effect resulting from the revaluation of the related foreign currency receivables and liabilities.
All of the Company’s derivative instruments have liquid markets to assess fair value. The Company does not enter into any derivative instruments for trading purposes.
Revenue Recognition
In the Wholesale segment, the Company recognizes its revenues upon transfer of title and risk of loss in accordance with its FOB shipping point terms of sale and after the sales price is fixed and determinable and collectability is reasonably assured. In the Retail segment, transfer of title and risk of loss occurs at the time of register receipt. The Company records estimates for sales returns, volume-based programs and sales and cash discount allowances as a reduction of revenue in the same period that the sales are recorded. These estimates are based upon historical analysis, customer agreements and/or currently known factors that arise in the normal course of business. While returns have historically been within the Company’s expectations and the provisions established, future return rates may differ from those experienced in the past.
58
During the fourth quarter of fiscal 2016, the Company announced the launch of two distinct smart watch collections with iOS and Android compatible software apps: Movado Motion (Swiss watches utilizing Silicon Valley’s Fullpower Technologies, Inc.’s Motion X-365 end to end solution) and Movado’s BOLD Motion (watches utilizing HP Inc.’s smart accessories technologies). Smart watches contain hardware and software components. Software components consist of both firmware embedded in the physical watch as well as an app that will run on iOS and Android mobile devices. The hardware and software components function together to deliver the watches’ essential functionality. As typical with numerous consumer products containing embedded or companion software, updates to the software will be provided from time to time, when and if available. Updates are generally limited to bug fixes or enhancements that incrementally improve on the existing functionality. Arrangements, including those that combine hardware (watch) with software that function together to deliver the watch’s essential functionality are considered multiple element arrangements and are subject to the accounting principles applicable to such arrangements.
For multiple element arrangements that include smart watches containing software essential to the smart watch’s functionality and undelivered software elements (cloud service updates and app upgrades) that relate to the smart watch’s essential software, the Company allocates revenue to all deliverables based on their relative selling prices. In such circumstances, the accounting principles establish a hierarchy to determine the selling price to be used for allocating revenue to deliverables as follows: (i) vendor-specific objective evidence of fair value (VSOE), (ii) third-party evidence of selling price (TPE), and (iii) best estimate of the selling price (ESP). Because the Company has neither VSOE nor TPE for the software elements, revenue is allocated to these rights and services based on the Company’s ESPs. ESPs for the software elements reflect the Company’s best estimate of the selling prices if they were sold regularly on a stand-alone basis.
The Company has identified multiple deliverables contained in its smart watch collections. The first deliverable is the watch along with the software essential to the functionality of the watch delivered at the time of sale. The second deliverable is the software included free of charge that enables users to sync and view data on the Company’s mobile app. The third deliverable is the embedded right included with the purchase to receive unspecified firmware and software upgrades, when and if available. The Company allocates revenue to all deliverables using the relative selling price method. Amounts allocated to the delivered smart watch collections and the related essential software are recognized at the time of sale, provided the other conditions for revenue recognition have been met. Amounts allocated to the cloud service and app updates are deferred and recognized on a straight-line basis over the estimated two year period the updates are expected to be provided. During the fourth quarter of fiscal 2016, the smart watches became available in limited quantities and in limited distribution, in time for the 2015 holiday season, and, as a result, these deferred amounts were immaterial as of January 31, 2016.
Cost of Sales
Cost of sales of the Company’s products consist primarily of component costs, royalties, depreciation, amortization, assembly costs and unit overhead costs associated with the Company’s supply chain operations in Switzerland and Asia. The Company’s supply chain operations consist of logistics management of assembly operations and product sourcing in Switzerland and Asia and minor assembly in Switzerland.
Cost of sales of the Company’s products includes costs for raw material and components, as well as labor for assembly of finished goods, all of which can be impacted by inflation.
Since a substantial amount of the Company’s product costs are incurred in Swiss francs, fluctuations in the U.S. dollar/Swiss franc exchange rate can impact the Company’s cost of goods sold and, therefore, its gross margins. The Company reduces its exposure to the Swiss franc exchange rate risk through a hedging program. Under the hedging program, the Company manages most of its foreign currency exposures on a consolidated basis, which allows it to net certain exposures and take advantage of natural offsets. In the event these exposures do not offset, the Company has the ability to hedge its Swiss franc purchases using a combination of forward contracts and purchased currency options.
Selling, General and Administrative (“SG&A”) Expenses
The Company’s SG&A expenses consist primarily of marketing, selling, distribution, general and administrative expenses.
Marketing expenditures are based principally on overall strategic considerations relative to maintaining or increasing market share in markets that management considers to be crucial to the Company’s continued success as well as on general economic conditions in the various markets around the world in which the Company sells its products. Marketing expenses include salaries, various forms of media advertising, digital advertising and co-operative advertising with customers and distributors and other point of sale marketing and promotion spending.
59
Selling expenses consist primarily of salaries, sales commissions, sales force travel and related expenses, depreciation and amortization, expenses associated with Baselworld Watch and Jewelry Show, the annual watch and jewelry trade show, and other industry trade shows and operating costs incurred in connection with the Company’s retail business. Sales commissions vary with overall sales levels. Retail selling expenses consist primarily of payroll and related expenses and store occupancy costs.
Distribution expenses consist primarily of salaries of distribution staff, rental and other occupancy costs, security, depreciation and amortization of furniture and leasehold improvements and shipping supplies.
General and administrative expenses consist primarily of salaries and other employee compensation including performance based compensation, employee benefit plan costs, office rent, management information systems costs, professional fees, bad debts, depreciation and amortization of furniture, computer software and leasehold improvements, patent and trademark expenses and various other general corporate expenses.
Warranty Costs
All watches sold by the Company come with limited warranties covering the movement against defects in material and workmanship for periods ranging from two to three years from the date of purchase, with the exception of Tommy Hilfiger watches, for which the warranty period is ten years. In addition, the warranty period is five years for the gold plating for Movado watch cases and bracelets. When changes in warranty costs are experienced, the Company will adjust the warranty liability as required. The Company records an estimate for future warranty costs based on historical repair costs. Warranty costs have historically been within the Company’s expectations and the provisions established.
Warranty liability for the fiscal years ended January 31, 2016, 2015 and 2014 was as follows (in thousands):
|
|
2016 |
|
|
2015 |
|
|
2014 |
|
|||
|
Balance, beginning of year |
$ |
2,710 |
|
|
$ |
2,660 |
|
|
$ |
2,584 |
|
|
Provision charged to operations |
|
1,630 |
|
|
|
2,710 |
|
|
|
2,660 |
|
|
Settlements made |
|
(1,784 |
) |
|
|
(2,660 |
) |
|
|
(2,584 |
) |
|
Balance, end of year |
$ |
2,556 |
|
|
$ |
2,710 |
|
|
$ |
2,660 |
|
Pre-opening Costs
Costs associated with the opening of retail stores are expensed in the period incurred.
Marketing
The Company expenses the production costs of an advertising campaign at the commencement date of the advertising campaign. Included in marketing expenses are costs associated with co-operative advertising, media advertising, digital advertising, production costs and costs of point of sale materials and displays. These costs are recorded as SG&A expenses. The Company participates in co-operative advertising programs on a voluntary basis and receives a “separately identifiable benefit in exchange for the consideration.” Since the amount of consideration paid to the retailer does not exceed the fair value of the benefit received by the Company, these costs are recorded as SG&A expenses as opposed to being recorded as a reduction of revenue. Marketing expense for fiscal 2016, 2015 and 2014 was $74.5 million, $71.9 million and $74.4 million, respectively.
Included in other current assets in the consolidated balance sheets as of January 31, 2016 and 2015 are prepaid advertising costs of $0.5 million and $0.5 million, respectively. These prepaid costs represent advertising costs paid to licensors in advance, pursuant to the Company’s licensing agreements and sponsorships.
Shipping and Handling Costs
Amounts charged to customers for shipping and handling were $2.2 million, $2.4 million and $2.6 million for fiscal years 2016, 2015 and 2014, respectively. The costs related to shipping and handling were $6.5 million, $6.3 million and $6.6 million for fiscal years 2016, 2015 and 2014, respectively. These amounts incurred by the Company related to shipping and handling are included in net sales and cost of goods sold.
60
Income Taxes
The Company follows the asset and liability method of accounting for income taxes under which deferred tax assets and liabilities are recognized for the future tax consequences attributable to differences between the financial statement carrying amounts of existing assets and liabilities and their respective tax bases. Deferred tax assets and liabilities are measured using enacted tax laws and tax rates, in each jurisdiction where the Company operates, and applied to taxable income in the years in which those temporary differences are expected to be recovered or settled. The effect on deferred tax assets and liabilities due to a change in tax rates is recognized in income in the period that includes the enactment date. In addition, the amounts of any future tax benefits are reduced by a valuation allowance to the extent such benefits are not expected to be realized on a more-likely-than-not basis. The Company calculates estimated income taxes in each of the jurisdictions in which it operates. This process involves estimating actual current tax expense along with assessing temporary differences resulting from differing treatment of items for both book and tax purposes.
The Company follows guidance for accounting for uncertainty in income taxes. This guidance clarifies the accounting for uncertainty in income taxes recognized in an enterprise’s financial statements and prescribes a recognition threshold and measurement standard for the financial statement recognition and measurement of an income tax position taken or expected to be taken in a tax return. This guidance also provides guidance on de-recognition, classification, interest and penalties, accounting in interim periods, disclosures and transitions.
Earnings Per Share
The Company presents net income per share on a basic and diluted basis. Basic earnings per share is computed using weighted-average shares outstanding during the period. Diluted earnings per share is computed using the weighted-average number of shares outstanding adjusted for dilutive common stock equivalents.
The weighted-average number of shares outstanding for basic earnings per share were approximately 23,525,000, 25,276,000 and 25,506,000 for fiscal 2016, 2015 and 2014, respectively. For the fiscal years ended January 31, 2016, 2015 and 2014, the number of shares outstanding for diluted earnings per share were approximately 23,774,000, 25,581,000 and 25,849,000, respectively. For the fiscal years ended January 31, 2016, 2015 and 2014, the number of shares outstanding for diluted earnings per share included approximately 249,000, 305,000 and 343,000 due to potentially dilutive common stock equivalents issuable under the Company’s stock compensation plans.
For the fiscal years ended January 31, 2016, 2015 and 2014 approximately 637,000, 102,000 and 85,000, respectively, of potentially dilutive common stock equivalents were excluded from the computation of dilutive earnings per share because their effect would have been antidilutive.
Stock-Based Compensation
Under the accounting guidance for share-based payments, the Company utilizes the Black-Scholes option-pricing model which requires that certain assumptions be made to calculate the fair value of each option at the grant date. The expected life of stock option grants is determined using historical data and represents the time period during which the stock option is expected to be outstanding until it is exercised. The risk free interest rate is the yield on the grant date of U.S. Treasury constant maturities with a maturity date closest to the expected life of the stock option. The expected stock price volatility is derived from historical volatility and calculated based on the estimated term structure of the stock option grant. The expected dividend yield is calculated using the Company’s historical average of annualized dividend yields and applied over the expected term of the option.
Compensation expense for equity instruments is accrued based on the estimated number of instruments for which the requisite service is expected to be rendered and expensed on a straight-line basis over the vesting term.
NOTE 3 – INVENTORIES
Inventories consisted of the following (in thousands):
|
|
As of January 31, |
|
|||||
|
|
2016 |
|
|
2015 |
|
||
|
Finished goods |
$ |
117,627 |
|
|
$ |
115,435 |
|
|
Component parts |
|
41,041 |
|
|
|
49,790 |
|
|
Work-in-process |
|
3,797 |
|
|
|
5,563 |
|
|
|
$ |
162,465 |
|
|
$ |
170,788 |
|
61
NOTE 4 – PROPERTY, PLANT AND EQUIPMENT
Property, plant and equipment, at cost, consisted of the following (in thousands):
|
|
As of January 31, |
|
|||||
|
|
2016 |
|
|
2015 |
|
||
|
Land and buildings |
$ |
1,574 |
|
|
$ |
2,000 |
|
|
Furniture and equipment |
|
58,617 |
|
|
|
66,414 |
|
|
Computer software |
|
31,747 |
|
|
|
28,968 |
|
|
Leasehold improvements |
|
31,646 |
|
|
|
30,905 |
|
|
Design fees and tooling costs |
|
1,399 |
|
|
|
2,559 |
|
|
|
|
124,983 |
|
|
|
130,846 |
|
|
Less: accumulated depreciation |
|
(86,430 |
) |
|
|
(84,173 |
) |
|
|
$ |
38,553 |
|
|
$ |
46,673 |
|
Depreciation and amortization expense from operations related to property, plant and equipment for fiscal 2016, 2015 and 2014 was $12.4 million, $11.9 million and $11.8 million, respectively, which includes computer software amortization expense for fiscal 2016, 2015 and 2014 of $3.5 million, $3.0 million and $3.8 million, respectively.
NOTE 5 – DEBT AND LINES OF CREDIT
On January 30, 2015, the Company, together with Movado Group Delaware Holdings Corporation, Movado Retail Group, Inc. and Movado LLC (collectively, the “Borrowers”), each a wholly-owned domestic subsidiary of the Company, entered into a Credit Agreement (the “Credit Agreement”) with the lenders party thereto and Bank of America, N.A. as administrative agent (in such capacity, the “Agent”). The Credit Agreement provides for a $100.0 million senior secured revolving credit facility (the “Facility”), including a $15.0 million letter of credit sub-facility, that matures on January 30, 2020, with provisions for uncommitted increases of up to $50.0 million in the aggregate, subject to customary terms and conditions. In connection with the Credit Agreement, the Borrowers also entered into a Security and Pledge Agreement dated as of January 30, 2015 in favor of the Agent (the “Security Agreement”).
As of January 31, 2016, $40.0 million in loans were drawn under the Facility. Additionally, approximately $3.6 million in letters of credit, which were outstanding under the Borrower’s pre-existing asset-based revolving credit facility that was concurrently terminated when the Credit Agreement became effective, are deemed to be issued and outstanding under the Facility. As of January 31, 2016, availability under the Facility was approximately $56.4 million.
Borrowings under the Facility bear interest at rates selected periodically by the Company at LIBOR plus a spread ranging from 1.25% to 1.75% per annum, based on the Company’s consolidated leverage ratio or at a base rate plus a spread ranging from 0.25% to 0.75% per annum based on the Company’s consolidated leverage ratio. At January 31, 2016, the Company’s spreads were 1.50% over LIBOR and 0.50% over the base rate. The Company has also agreed to pay certain fees and expenses and provide certain indemnities, all of which are customary for such financings.
The borrowings under the Facility are joint and several obligations of the Borrowers and are also cross-guaranteed by each Borrower. In addition, pursuant to the Security Agreement, the Borrowers’ obligations under the Facility are secured by first priority liens, subject to permitted liens, on substantially all of the Borrowers’ assets other than certain excluded assets. The Security Agreement contains representations, warranties and covenants, which are customary for pledge and security agreements of this type, relating to the creation and perfection of security interests in favor of the Agent over various categories of the Borrowers’ assets.
The Credit Agreement contains affirmative and negative covenants binding on the Borrowers and their subsidiaries that are customary for credit facilities of this type, including, but not limited to, restrictions and limitations on the incurrence of debt and liens, dispositions of assets, capital expenditures, dividends and other payments in respect of equity interests, the making of loans and equity investments, mergers, consolidations, liquidations and dissolutions, and transactions with affiliates (in each case, subject to various exceptions).
The Borrowers are also subject to a minimum consolidated EBITDA (as defined in the Credit Agreement) test of $50.0 million, measured at the end of each fiscal quarter based on the four most recent fiscal quarters and a consolidated leverage ratio (as defined in the Credit Agreement) covenant not to exceed 2.50 to 1.00, measured as of the last day of each fiscal quarter. As of January 31, 2016, the Company was in compliance with its covenants under the Credit Agreement.
62
The Credit Agreement contains events of default that are customary for facilities of this type, including, but not limited to, nonpayment of principal, interest, fees and other amounts when due, failure of any representation or warranty to be true in any material respect when made or deemed made, violation of covenants, cross default with material indebtedness, material judgments, material ERISA liability, bankruptcy events, asserted or actual revocation or invalidity of the loan documents, and change of control.
As of January 31, 2016, the Company classified $5.0 million of the outstanding balance under the Facility as current based on voluntary pre-payments estimated to be made in the next twelve months, with the remainder classified as long-term debt based on the 2020 maturity date of the Facility and the Company's intent and ability to refinance its obligations thereunder.
A Swiss subsidiary of the Company maintains unsecured lines of credit with an unspecified maturity with a Swiss bank. As of January 31, 2016 and 2015, these lines of credit totaled 5.0 million Swiss francs with a dollar equivalent of $4.9 million and $5.4 million, respectively. As of January 31, 2016 and 2015, there were no borrowings against these lines. As of January 31, 2016 and 2015, two European banks have guaranteed obligations to third parties on behalf of two of the Company’s foreign subsidiaries in the dollar equivalent of $1.0 million, of which $0.4 million is a restricted deposit as it relates to a lease agreement, and $1.3 million in various foreign currencies, respectively.
NOTE 6 – DERIVATIVE FINANCIAL INSTRUMENTS
As of January 31, 2016, the Company’s entire net forward contracts hedging portfolio consisted of 30.0 million Swiss francs equivalent and 5.0 million Euros equivalent for various expiry dates ranging through July 12, 2016.
The following table summarizes the fair value and presentation in the Consolidated Balance Sheets for derivatives as of January 31, 2016 and 2015 (in thousands):
|
|
Asset Derivatives |
|
|
Liability Derivatives |
|
||||||||||||||
|
|
Balance |
|
2016 |
|
|
2015 |
|
|
Balance |
|
2016 |
|
|
2015 |
|
||||
|
Derivatives not designated as hedging instruments: |
|
|
|
|
|
|
|
|
|
|
|
|
|
|
|
|
|
|
|
|
Foreign Exchange Contracts |
Other Current |
|
$ |
1 |
|
|
$ |
1,298 |
|
|
Accrued Liabilities |
|
$ |
1,163 |
|
|
$ |
71 |
|
|
Total Derivative Instruments |
|
|
$ |
1 |
|
|
$ |
1,298 |
|
|
|
|
$ |
1,163 |
|
|
$ |
71 |
|
|
|
Asset Derivatives |
|
|
Liability Derivatives |
|
||||||||||||||
|
|
Balance |
|
2016 |
|
|
2015 |
|
|
Balance |
|
2016 |
|
|
2015 |
|
||||
|
Derivatives designated as hedging instruments: |
|
|
|
|
|
|
|
|
|
|
|
|
|
|
|
|
|
|
|
|
Foreign Exchange Contracts |
Other Current |
|
$ |
63 |
|
|
$ |
- |
|
|
Accrued Liabilities |
|
$ |
- |
|
|
$ |
- |
|
|
Total Derivative Instruments |
|
|
$ |
63 |
|
|
$ |
- |
|
|
|
|
$ |
- |
|
|
$ |
- |
|
As of January 31, 2016, the balance of deferred net gains on derivative financial instruments documented as cash flow hedges included in accumulated other comprehensive income (“AOCI”) was $0.1 million, net of tax of $0.1 million. As of January 31, 2015, there was no balance of deferred net gains or losses on derivative financial instruments documented as cash flow hedges included in AOCI. The maximum length of time the Company hedges its exposure to the fluctuation in future cash flows for forecasted transactions is 24 months. For the fiscal year ended January 31, 2016, the amount the Company reclassified from AOCI to earnings was immaterial. For the fiscal year ended January 31, 2015, the Company had no reclassifications from AOCI to earnings. No ineffectiveness has been recorded in fiscal years 2016 and 2015, respectively.
63
NOTE 7 - FAIR VALUE MEASUREMENTS
Fair value is defined as the price that would be received to sell an asset or paid to transfer a liability in an orderly transaction between market participants at the measurement date. Accounting guidance establishes a fair value hierarchy which prioritizes the inputs used in measuring fair value into three broad levels as follows:
|
|
· |
Level 1 - Quoted prices in active markets for identical assets or liabilities. |
|
|
· |
Level 2 - Inputs, other than the quoted prices in active markets, that are observable either directly or indirectly. |
|
|
· |
Level 3 - Unobservable inputs based on the Company’s assumptions. |
The guidance requires the use of observable market data if such data is available without undue cost and effort.
The following tables present the fair value hierarchy for those assets and liabilities measured at fair value on a recurring basis as of January 31, 2016 and 2015 (in thousands):
|
|
|
|
Fair Value at January 31, 2016 |
|
|||||||||||||
|
|
Balance Sheet Location |
|
Level 1 |
|
|
Level 2 |
|
|
Level 3 |
|
|
Total |
|
||||
|
Assets: |
|
|
|
|
|
|
|
|
|
|
|
|
|
|
|
|
|
|
Available-for-sale securities |
Other current assets |
|
$ |
268 |
|
|
$ |
— |
|
|
$ |
— |
|
|
$ |
268 |
|
|
SERP assets - employer |
Other non-current assets |
|
|
1,168 |
|
|
|
— |
|
|
|
— |
|
|
|
1,168 |
|
|
SERP assets - employee |
Other non-current assets |
|
|
24,853 |
|
|
|
— |
|
|
|
— |
|
|
|
24,853 |
|
|
Hedge derivatives |
Other current assets |
|
|
— |
|
|
|
64 |
|
|
|
— |
|
|
|
64 |
|
|
Total |
|
|
$ |
26,289 |
|
|
$ |
64 |
|
|
$ |
— |
|
|
$ |
26,353 |
|
|
Liabilities: |
|
|
|
|
|
|
|
|
|
|
|
|
|
|
|
|
|
|
SERP liabilities - employee |
Other non-current liabilities |
|
$ |
24,853 |
|
|
$ |
— |
|
|
$ |
— |
|
|
$ |
24,853 |
|
|
Hedge derivatives |
Accrued liabilities |
|
|
— |
|
|
|
1,163 |
|
|
|
— |
|
|
|
1,163 |
|
|
Total |
|
|
$ |
24,853 |
|
|
$ |
1,163 |
|
|
$ |
— |
|
|
$ |
26,016 |
|
|
|
|
|
Fair Value at January 31, 2015 |
|
|||||||||||||
|
|
Balance Sheet Location |
|
Level 1 |
|
|
Level 2 |
|
|
Level 3 |
|
|
Total |
|
||||
|
Assets: |
|
|
|
|
|
|
|
|
|
|
|
|
|
|
|
|
|
|
Available-for-sale securities |
Other current assets |
|
$ |
314 |
|
|
$ |
— |
|
|
$ |
— |
|
|
$ |
314 |
|
|
Long-term investment |
Other non-current assets |
|
|
— |
|
|
|
— |
|
|
|
1,240 |
|
|
|
1,240 |
|
|
SERP assets - employer |
Other non-current assets |
|
|
1,351 |
|
|
|
— |
|
|
|
— |
|
|
|
1,351 |
|
|
SERP assets - employee |
Other non-current assets |
|
|
24,811 |
|
|
|
— |
|
|
|
— |
|
|
|
24,811 |
|
|
Hedge derivatives |
Other current assets |
|
|
— |
|
|
|
1,298 |
|
|
|
— |
|
|
|
1,298 |
|
|
Total |
|
|
$ |
26,476 |
|
|
$ |
1,298 |
|
|
$ |
1,240 |
|
|
$ |
29,014 |
|
|
Liabilities: |
|
|
|
|
|
|
|
|
|
|
|
|
|
|
|
|
|
|
SERP liabilities - employee |
Other non-current liabilities |
|
$ |
24,811 |
|
|
$ |
— |
|
|
$ |
— |
|
|
$ |
24,811 |
|
|
Hedge derivatives |
Accrued liabilities |
|
|
— |
|
|
|
71 |
|
|
|
— |
|
|
|
71 |
|
|
Total |
|
|
$ |
24,811 |
|
|
$ |
71 |
|
|
$ |
— |
|
|
$ |
24,882 |
|
The fair values of the Company’s available-for-sale securities are based on quoted prices. The fair value of the long-term investment at January 31, 2015 was based on the purchase price plus eight percent calculated annually. During the second quarter of fiscal 2016, this investment converted to common and preferred shares of a privately held company, accounted for under the cost method, with a carrying value of $1.3 million. This investment is tested quarterly for any impairment. During the fiscal year ended January 31, 2016 no impairment was recorded for this investment. The assets related to the Company’s defined contribution supplemental executive retirement plan (“SERP”) consist of both employer (employee unvested) and employee assets which are invested in investment funds with fair values calculated based on quoted market prices. The SERP liability represents the Company’s liability to the employees in the plan for their vested balances. The hedge derivatives are entered into by the Company principally to reduce its exposure to Swiss franc and Euro exchange rate risks. Fair values of the Company’s hedge derivatives are calculated based on quoted foreign exchange rates and quoted interest rates. The carrying amount of debt approximated fair value as of January 31, 2016.
64
NOTE 8 - INCOME TAXES
Income before provision for income taxes on a legal entity basis consists of the following (in thousands):
|
|
2016 |
|
|
2015 |
|
|
2014 |
|
|||
|
U.S. income before taxes |
$ |
44,384 |
|
|
$ |
34,099 |
|
|
$ |
26,591 |
|
|
Non-U.S. income before tax |
$ |
24,741 |
|
|
$ |
37,065 |
|
|
$ |
42,327 |
|
The Company conducts business globally and, as a result, is subject to income taxes in the U.S. federal, state, local and foreign jurisdictions. In the normal course of business, the Company is subject to examination by taxing authorities in many countries, such as Germany, Hong Kong, Switzerland and the United States. The Company is no longer subject to income tax examination in Switzerland and the rest of the world for years ended prior to January 31, 2006 and January 31, 2012, respectively, with few exceptions.
The provision for income taxes for the fiscal years ended January 31, 2016, 2015 and 2014 consists of the following components (in thousands):
|
|
2016 |
|
|
2015 |
|
|
2014 |
|
|||
|
Current: |
|
|
|
|
|
|
|
|
|
|
|
|
U.S. Federal |
$ |
17,776 |
|
|
$ |
8,412 |
|
|
$ |
7,296 |
|
|
U.S. State and Local |
|
1,434 |
|
|
|
770 |
|
|
|
866 |
|
|
Non-U.S. |
|
5,291 |
|
|
|
3,945 |
|
|
|
5,043 |
|
|
|
|
24,501 |
|
|
|
13,127 |
|
|
|
13,205 |
|
|
Deferred: |
|
|
|
|
|
|
|
|
|
|
|
|
U.S. Federal |
|
(1,995 |
) |
|
|
3,763 |
|
|
|
183 |
|
|
U.S. State and Local |
|
(228 |
) |
|
|
420 |
|
|
|
(888 |
) |
|
Non-U.S. |
|
1,082 |
|
|
|
1,954 |
|
|
|
4,873 |
|
|
|
|
(1,141 |
) |
|
|
6,137 |
|
|
|
4,168 |
|
|
Provision for income taxes |
$ |
23,360 |
|
|
$ |
19,264 |
|
|
$ |
17,373 |
|
Significant components of the Company’s deferred income tax assets and liabilities as of January 31, 2016 and 2015 are as follows (in thousands):
|
|
2016 Deferred Taxes |
|
|
2015 Deferred Taxes |
|
||||||||||
|
|
Assets |
|
|
Liabilities |
|
|
Assets |
|
|
Liabilities |
|
||||
|
Net operating loss carryforwards |
$ |
9,182 |
|
|
$ |
— |
|
|
$ |
9,231 |
|
|
$ |
— |
|
|
Inventory |
|
3,103 |
|
|
|
— |
|
|
|
3,112 |
|
|
|
— |
|
|
Unprocessed returns |
|
1,538 |
|
|
|
— |
|
|
|
1,565 |
|
|
|
— |
|
|
Receivables allowances |
|
847 |
|
|
|
— |
|
|
|
951 |
|
|
|
— |
|
|
Deferred compensation |
|
16,286 |
|
|
|
— |
|
|
|
14,098 |
|
|
|
— |
|
|
Unrepatriated earnings |
|
— |
|
|
|
2,877 |
|
|
|
— |
|
|
|
2,715 |
|
|
Capital loss carryforwards |
|
216 |
|
|
|
|
|
|
|
790 |
|
|
|
|
|
|
Depreciation/amortization |
|
— |
|
|
|
1,234 |
|
|
|
— |
|
|
|
307 |
|
|
Other provisions/accruals |
|
200 |
|
|
|
— |
|
|
|
91 |
|
|
|
— |
|
|
Miscellaneous |
|
992 |
|
|
|
— |
|
|
|
955 |
|
|
|
— |
|
|
|
|
32,364 |
|
|
|
4,111 |
|
|
|
30,793 |
|
|
|
3,022 |
|
|
Valuation allowance |
|
(8,089 |
) |
|
|
— |
|
|
|
(8,307 |
) |
|
|
— |
|
|
Total deferred tax assets and liabilities |
$ |
24,275 |
|
|
$ |
4,111 |
|
|
$ |
22,486 |
|
|
$ |
3,022 |
|
As of January 31, 2016, the Company had no U.S. federal net operating loss carryforwards and had U.S. state and foreign net operating loss carryforwards of approximately $17.6 million and $32.1 million, respectively, with expiration dates ranging from 2-20 years and some foreign jurisdictions with an indefinite carryforward period. Of the foreign net operating losses, $13.0 million are related to Switzerland and the remaining is primarily related to Germany and Canada.
A valuation allowance is required to be established unless management determines it is more likely than not that the Company will ultimately utilize the tax benefit associated with a deferred tax asset. During fiscal 2016, the Company released approximately $0.6 million of valuation allowance related to a capital loss carryforward due to the utilization of such loss to offset capital gains generated by the Company’s Supplemental Executive Retirement Plan. As of January 31, 2016, the Company had a deferred tax asset of
65
approximately $0.2 million related to a domestic capital loss carryforward for which a full valuation allowance has been recorded. Additionally, the Company has U.S. state and foreign valuation allowances of $0.1 million and $7.8 million, respectively, which are primarily related to net operating loss carryforwards.
Management will continue to evaluate the appropriate level of valuation allowance on all deferred tax assets considering such factors as prior earnings history, expected future earnings, carryback and carryforward periods, and tax and business strategies that could potentially enhance the likelihood of realization of the deferred tax assets.
The recognition of deductible windfall tax benefits related to stock-based compensation is prohibited until realized through a reduction to income taxes payable. Shortfall tax expense of $0.0 million and windfall tax benefits of $1.3 million and $0.9 million, were recorded in additional paid-in-capital during fiscal years 2016, 2015 and 2014, respectively.
The provision for income taxes differs from the U.S. federal statutory rate due to the following (in thousands):
|
|
Fiscal Year Ended January 31, |
|
|||||||||
|
|
2016 |
|
|
2015 |
|
|
2014 |
|
|||
|
Provision for income taxes at the U.S. statutory rate |
$ |
24,194 |
|
|
$ |
24,906 |
|
|
$ |
24,121 |
|
|
Lower effective non-U.S. income tax rate |
|
(4,463 |
) |
|
|
(7,257 |
) |
|
|
(6,950 |
) |
|
Change in valuation allowance |
|
986 |
|
|
|
1,298 |
|
|
|
(996 |
) |
|
U.S. tax provided on earnings of non-U.S. subsidiaries |
|
1,029 |
|
|
|
639 |
|
|
|
580 |
|
|
Change in liabilities for uncertain tax positions, net |
|
(98) |
|
|
|
179 |
|
|
|
(652) |
|
|
State and local taxes, net of federal benefit |
|
1,234 |
|
|
|
693 |
|
|
|
719 |
|
|
(Benefit) provided on intercompany transactions |
|
— |
|
|
|
(1,652 |
) |
|
|
— |
|
|
Other, net |
|
478 |
|
|
|
458 |
|
|
|
551 |
|
|
Total provision for income taxes |
$ |
23,360 |
|
|
$ |
19,264 |
|
|
$ |
17,373 |
|
The effective tax rate for fiscal 2016 was 33.8%, primarily as a result of foreign profits being taxed in lower taxing jurisdictions offset by U.S. tax provided on earnings of non-U.S. subsidiaries. The effective tax rate for fiscal 2015 was 27.1%, primarily as a result of foreign profits being taxed in lower taxing jurisdictions and the recognition of a tax benefit related to intercompany profit in certain jurisdictions. The effective tax rate for fiscal 2014 was 25.2%, primarily as a result of foreign profits being taxed in lower taxing jurisdictions and the release of liabilities for uncertain tax positions as a result of favorable U.S. and foreign audit settlements partially offset by no tax being realized on certain foreign net operating losses.
The Company performs a quarterly assessment reviewing its global cash projections and investment needs, and considers such factors as projected future results, continued need for investment in the overseas business as well as cash needs in the U.S., among other countries. The Company has recorded a federal income tax liability of $2.9 million related to $12.6 million of pre-2013 foreign earnings which have been earmarked for future repatriation. A deferred tax liability has not been recorded for the remaining undistributed foreign earnings of approximately $290 million, because the Company intends to permanently reinvest such earnings in its foreign operations. It is not practicable to estimate the amount of tax that may be payable on the eventual distribution of these earnings.
A reconciliation of the beginning and ending amounts of gross unrecognized tax benefits (exclusive of interest) for the fiscal years ended January 31, 2016, 2015 and 2014 are as follows (in thousands):
|
|
2016 |
|
|
2015 |
|
|
2014 |
|
|||
|
Beginning balance |
$ |
2,657 |
|
|
$ |
2,740 |
|
|
$ |
3,602 |
|
|
Additions for tax positions of prior years |
|
— |
|
|
|
— |
|
|
|
959 |
|
|
Additions for tax positions taken in the current year |
|
175 |
|
|
|
128 |
|
|
|
— |
|
|
Lapse of statute of limitations |
|
(311 |
) |
|
|
(34) |
|
|
|
(1,214 |
) |
|
Settlements |
|
— |
|
|
|
— |
|
|
|
(605 |
) |
|
Non U.S. currency exchange fluctuations |
|
(40 |
) |
|
|
(177) |
|
|
|
(2) |
|
|
Ending balance |
$ |
2,481 |
|
|
$ |
2,657 |
|
|
$ |
2,740 |
|
Included in the balances at January 31, 2016, January 31, 2015 and January 31, 2014 are $2.4 million, $2.5 million, and $2.6 million of unrecognized tax benefits which would impact the Company’s effective tax rate, if recognized. Interest and penalties, if any, related to unrecognized tax benefits are recorded as income tax expense in the consolidated statement of operations. As of January 31, 2016, January 31, 2015 and January 31, 2014, the Company had $0.6 million, $0.7 million and $0.7 million, respectively of accrued
66
interest (net of tax benefit) and penalties related to unrecognized tax benefits. During fiscal years 2016, 2015 and 2014, the Company accrued $0.1 million, $0.1 million and $0.1 million of interest (net of tax benefit) and penalties.
On November 20, 2015, FASB issued ASU 2015-17, “Income Taxes: Balance Sheet Classification of Deferred Taxes,” which eliminates the current requirement for companies to present deferred tax liabilities and assets as current and non-current in a classified balance sheet. Instead, companies will be required to classify all deferred tax assets and liabilities as non-current. For public companies, the amendments are effective for financial statements issued for annual periods beginning after December 15, 2016, and interim periods within those annual periods. Earlier application is permitted. The Company has elected to early adopt this requirement retrospectively in the current period. The Company reclassified $6.2 million of net current deferred income tax assets from current to noncurrent at January 31, 2015.
NOTE 9 – LEASES
The Company leases office, distribution, retail and manufacturing facilities, and office equipment under operating leases, which expire at various dates through February 2028. Certain leases include renewal options and the payment of real estate taxes and other occupancy costs. Some leases also contain rent escalation clauses (step rents) that require additional rent amounts in the later years of the term. Rent expense for leases with step rents is recognized on a straight-line basis over the minimum lease term. Likewise, capital funding and other lease concessions that are occasionally provided to the Company are recorded as deferred rent and amortized on a straight-line basis over the minimum lease term as adjustments to rent expense. Rent expense for equipment and distribution, factory and office facilities under operating leases was approximately $13.5 million, $13.5 million and $13.0 million in fiscal 2016, 2015 and 2014, respectively.
Minimum annual rentals under noncancelable operating leases as of January 31, 2016, excluding real estate taxes and operating costs, are as follows (in thousands):
|
Fiscal Year Ending January 31, |
|
||
|
2017 |
$ |
11,696 |
|
|
2018 |
|
9,121 |
|
|
2019 |
|
6,223 |
|
|
2020 |
|
3,159 |
|
|
2021 |
|
1,663 |
|
|
Thereafter |
|
5,288 |
|
|
|
$ |
37,150 |
|
NOTE 10 – COMMITMENTS AND CONTINGENCIES
As of January 31, 2016, the Company had outstanding letters of credit totaling $3.6 million with expiration dates through May 31, 2016 compared to $3.9 million with expiration dates through April 30, 2016 as of January 31, 2015. As of January 31, 2016, Bank of America, N.A. issued four irrevocable standby letters of credit in connection with a trademark license agreement, retail and operating facility leases to various landlords and for Canadian payroll to the Royal Bank of Canada.
As of January 31, 2016 and 2015, two European banks have guaranteed obligations to third parties on behalf of two of the Company’s foreign subsidiaries in the dollar equivalent of $1.0 million, of which $0.4 million is a restricted deposit as it relates to a lease agreement, and $1.3 million in various foreign currencies, respectively.
The Company has minimum commitments related to the Company’s license agreements and endorsement agreements with brand ambassadors. The Company sources, distributes, advertises and sells watches pursuant to its exclusive license agreements with unaffiliated licensors. Royalty amounts under the license agreements are generally based on a stipulated percentage of revenues, although most of these agreements contain provisions for the payment of minimum annual royalty amounts. The license agreements have various terms and some have additional renewal options, provided that minimum sales levels are achieved. Additionally, the license agreements require the Company to pay minimum annual advertising amounts. As of January 31, 2016, the total amount of the Company’s minimum commitments related to its license agreements and endorsement agreements was $149.7 million.
The Company had outstanding purchase obligations of $77.9 million with suppliers at the end of fiscal 2016 primarily for raw materials, finished watches and packaging in the normal course of business. These purchase obligation amounts do not represent total anticipated purchases but represent only amounts to be paid for items required to be purchased under agreements that are enforceable, legally binding and specify minimum quantity, price and term.
67
The Company believes that income tax reserves are adequate; however, amounts asserted by taxing authorities could be greater or less than amounts accrued and reflected in the consolidated balance sheet. Accordingly, the Company could record adjustments to the amounts for federal, state, and foreign liabilities in the future as the Company revises estimates or settles or otherwise resolves the underlying matters. In the ordinary course of business, the Company may take new positions that could increase or decrease unrecognized tax benefits in future periods.
The Company is involved in legal proceedings and claims from time to time, although there were no material legal proceedings and claims impacting the Company that were pending as of January 31, 2016. Legal contingencies are recorded in accordance with the accounting guidance for contingencies. Contingencies are inherently unpredictable and it is possible that results of operations or cash flows could be materially and adversely affected in any particular period by unfavorable developments in, or resolution or disposition of, such matters. For those legal proceedings and claims in respect of which the Company believes that it is reasonably possible that a loss may result that is materially in excess of the accrual (if any) established for the matter, the Company either discloses an estimate of such possible loss or range of loss or includes a statement that such an estimate cannot be made. The Company is party to legal proceedings and contingencies, the resolution of which is not expected to materially affect its financial condition or future results of operations beyond the amounts accrued.
A complaint that was filed on February 4, 2015 against the Company and several of its officers in the United States District Court for the District of New Jersey, which alleged that, between March 26, 2014 and November 13, 2014, the Company made false and misleading statements about the Company’s financial performance, was voluntarily dismissed with prejudice on June 30, 2015.
NOTE 11 – STOCK-BASED COMPENSATION
Under the Company’s Employee Stock Option Plan, as amended and restated as of April 4, 2013 (the “Plan”), the Compensation Committee of the Board of Directors, which consists of four of the Company’s non-employee directors, has the authority to grant incentive stock options and nonqualified stock options, as well as stock appreciation rights and stock awards, for up to 11,000,000 shares of common stock. Options granted to participants under the Plan generally become exercisable in equal installments over three or five years and remain exercisable until the tenth anniversary of the date of grant. The option price may not be less than the fair market value of the stock at the time the options are granted.
The weighted-average assumptions used with the Black-Scholes option-pricing model for the calculation of the fair value of stock option grants during fiscal 2016 were: expected term of 5.0 years; risk-free interest rate of 1.34%; expected volatility of 48.77% and dividend yield of 0.81%. The weighted-average grant date fair value of options granted during the fiscal year ended January 31, 2016 was $12.31. The weighted-average assumptions used with the Black-Scholes option-pricing model for the calculation of the fair value of stock option grants during fiscal 2015 were: expected term of 5.0 years; risk-free interest rate of 1.64%; expected volatility of 51.13% and dividend yield of 0.68%. The weighted-average grant date fair value of options granted during the fiscal year ended January 31, 2015 was $17.99. The weighted-average assumptions used with the Black-Scholes option-pricing model for the calculation of the fair value of stock option grants during fiscal 2014 were: expected term of 5.0 years; risk-free interest rate of 0.72%; expected volatility of 62.12% and dividend yield of 1.28%. The weighted-average grant date fair value of options granted during the fiscal year ended January 31, 2014 was $14.40.
Total compensation expense for stock option grants recognized during the fiscal years ended January 31, 2016, 2015 and 2014 was approximately $1.1 million, net of tax of $0.6 million and $1.2 million, net of tax of $0.7 million and $0.8 million, net of tax of $0.5 million, respectively. Expense related to stock option compensation is recognized on a straight-line basis over the vesting term. As of January 31, 2016, there was approximately $2.1 million of unrecognized compensation cost related to unvested stock options. These costs are expected to be recognized over a weighted-average period of 1.7 years. Total consideration received for stock option exercises during the fiscal years ended January 31, 2016, 2015 and 2014 was approximately $0.6 million, $1.7 million and $0.9 million, respectively. The tax shortfall realized on these exercises in fiscal 2016 was immaterial.
68
Transactions for stock options under the Plan since fiscal 2013 are summarized as follows:
|
|
Outstanding |
|
|
Weighted- |
|
||
|
January 31, 2013 |
|
561,489 |
|
|
$ |
24.67 |
|
|
Options granted |
|
106,440 |
|
|
$ |
30.34 |
|
|
Options exercised |
|
(52,023 |
) |
|
$ |
17.54 |
|
|
Options cancelled |
|
(16,500 |
) |
|
$ |
26.59 |
|
|
January 31, 2014 |
|
599,406 |
|
|
$ |
26.24 |
|
|
Options granted |
|
116,880 |
|
|
$ |
41.71 |
|
|
Options exercised |
|
(86,066 |
) |
|
$ |
19.75 |
|
|
Options cancelled |
|
(14,000 |
) |
|
$ |
26.59 |
|
|
January 31, 2015 |
|
616,220 |
|
|
$ |
30.08 |
|
|
Options granted |
|
126,880 |
|
|
$ |
30.36 |
|
|
Options exercised |
|
(28,450 |
) |
|
$ |
21.49 |
|
|
Options cancelled |
|
(15,050 |
) |
|
$ |
33.32 |
|
|
January 31, 2016 |
|
699,600 |
|
|
$ |
30.41 |
|
The total fair value of stock options exercised for the fiscal years ended January 31, 2016, 2015 and 2014 was approximately $0.2 million, $1.6 million and $1.1 million, respectively. The total fair value of the stock options vested for the fiscal years ended January 31, 2016 and 2014 was approximately $2.9 million and $0.1 million, respectively. There were no stock options vested for the fiscal year ended January 31, 2015.
The following table summarizes outstanding and exercisable stock options as of January 31, 2016:
|
Range of Exercise Prices |
|
Number |
|
|
Weighted- |
|
|
Weighted- |
|
|
Number |
|
|
Weighted- |
|
|||||
|
$18.03 - $21.02 |
|
|
4,500 |
|
|
|
0.3 |
|
|
$ |
18.41 |
|
|
|
4,500 |
|
|
$ |
18.41 |
|
|
$21.03 - $24.02 |
|
|
68,750 |
|
|
|
2.2 |
|
|
$ |
22.29 |
|
|
|
68,750 |
|
|
$ |
22.29 |
|
|
$24.03 - $27.02 |
|
|
219,700 |
|
|
|
6.2 |
|
|
$ |
26.59 |
|
|
|
219,700 |
|
|
$ |
26.59 |
|
|
$27.03 - $33.02 |
|
|
293,570 |
|
|
|
6.6 |
|
|
$ |
30.98 |
|
|
|
71,500 |
|
|
$ |
32.92 |
|
|
$33.03 - $42.02 |
|
|
29,780 |
|
|
|
8.4 |
|
|
$ |
40.52 |
|
|
|
9,927 |
|
|
$ |
40.52 |
|
|
$42.03 - $45.02 |
|
|
83,300 |
|
|
|
8.2 |
|
|
$ |
42.12 |
|
|
|
- |
|
|
$ |
- |
|
|
|
|
|
699,600 |
|
|
|
5.0 |
|
|
$ |
30.41 |
|
|
|
374,377 |
|
|
$ |
27.28 |
|
The total intrinsic value of outstanding stock options as of January 31, 2016, 2015 and 2014 was approximately $0.3 million, $0.2 million and $6.9 million, respectively. The total intrinsic value of exercisable stock options as of January 31, 2016, 2015 and 2014 was approximately $0.3 million, $0.2 million and $3.4 million, respectively.
Under the Plan, the Company has the ability to grant stock awards to employees. Stock awards generally vest three to five years from the date of grant. Expense for these grants is recognized on a straight-line basis over the vesting period. The fair value of stock awards is equal to the closing price of the Company’s publicly-traded common stock on the grant date.
For fiscal years 2016, 2015 and 2014, compensation expense for stock awards was approximately $2.7 million, net of tax of $1.7 million, $2.4 million, net of tax of $1.5 million and $1.6 million, net of tax of $0.9 million, respectively. Current accounting guidance requires forfeitures to be estimated at the time of grant in order to estimate the amount of share-based awards that will ultimately vest and thus, current period compensation expense has been adjusted for estimated forfeitures based on historical data. As of January 31, 2016, there was approximately $5.5 million of unrecognized compensation cost related to unvested stock awards. These costs are expected to be recognized over a weighted-average period of 1.6 years.
69
Transactions for stock award units under the Plan since fiscal 2013 are summarized as follows:
|
|
Number of Stock Award |
|
|
Weighted- |
|
||
|
January 31, 2013 |
|
343,381 |
|
|
$ |
17.10 |
|
|
Units granted |
|
140,922 |
|
|
$ |
31.33 |
|
|
Units vested |
|
(147,552 |
) |
|
$ |
14.55 |
|
|
Units forfeited |
|
(33,581 |
) |
|
$ |
18.17 |
|
|
January 31, 2014 |
|
303,170 |
|
|
$ |
24.84 |
|
|
Units granted |
|
164,122 |
|
|
$ |
41.32 |
|
|
Units vested |
|
(118,368 |
) |
|
$ |
18.66 |
|
|
Units forfeited |
|
(11,568 |
) |
|
$ |
33.58 |
|
|
January 31, 2015 |
|
337,356 |
|
|
$ |
34.72 |
|
|
Units granted |
|
136,310 |
|
|
$ |
29.48 |
|
|
Units vested |
|
(83,578 |
) |
|
$ |
29.99 |
|
|
Units forfeited |
|
(15,490 |
) |
|
$ |
35.70 |
|
|
January 31, 2016 |
|
374,598 |
|
|
$ |
33.83 |
|
Upon the vesting of a stock award, shares equal to the number of underlying stock award units are issued from the pool of authorized shares. The total fair value of stock award units that vested during fiscal 2016, 2015 and 2014 was approximately $2.5 million, $4.9 million, and $4.7 million, respectively. The tax shortfall realized on the vested stock awards for fiscal 2016 was immaterial. The weighted-average grant date fair values for stock awards for fiscal 2016, 2015, and 2014 were $29.48, $41.32 and $31.33, respectively. Unvested stock award units had a total fair value of approximately $9.6 million, $8.1 million, and $11.4 million for fiscal 2016, 2015 and 2014, respectively.
NOTE 12 – OTHER EMPLOYEE BENEFIT PLANS
The Company maintains an Employee Savings Plan under Section 401(k) of the Internal Revenue Code. In addition, the Company maintains defined contribution employee benefit plans for its employees located in Switzerland. Company contributions and expenses of administering the plans were $2.2 million, $3.3 million and $3.3 million in fiscal 2016, 2015 and 2014, respectively.
The Company maintains a defined contribution Deferred Compensation Plan (also known as a supplemental employee retirement plan or SERP). The SERP provides eligible executives with supplemental retirement benefits in addition to amounts received under the Company’s other retirement plans. The Company makes a matching contribution which vests equally over five years.
During fiscal 2016, 2015 and 2014, the Company recorded expenses related to the SERP of $0.4 million, $0.5 million and $0.4 million, respectively.
70
NOTE 13 – ACCUMULATED OTHER COMPREHENSIVE INCOME
The components of accumulated other comprehensive income at January 31, consisted of the following (in thousands):
|
|
Currency Translation |
|
|
Available- |
|
|
Net Unrealized |
|
|
Accumulated Other Income |
|
||||
|
Balance, January 31, 2015 |
$ |
98,642 |
|
|
$ |
211 |
|
|
$ |
1 |
|
|
$ |
98,854 |
|
|
Other comprehensive (loss) / |
|
(30,377) |
|
|
|
(22) |
|
|
|
50 |
|
|
|
(30,349) |
|
|
Amounts reclassified from |
|
- |
|
|
|
- |
|
|
|
- |
|
|
|
- |
|
|
Net current-period other |
|
(30,377) |
|
|
|
(22) |
|
|
|
50 |
|
|
|
(30,349) |
|
|
Balance, January 31, 2016 |
$ |
68,265 |
|
|
$ |
189 |
|
|
$ |
51 |
|
|
$ |
68,505 |
|
|
|
|
|
|
|
|
|
|
|
|
|
|
||||
|
|
Currency Translation |
|
|
Available- |
|
|
Net Unrealized |
|
|
Accumulated Other Income |
|
||||
|
Balance, January 31, 2014 |
$ |
103,438 |
|
|
$ |
263 |
|
|
$ |
1 |
|
|
$ |
103,702 |
|
|
Other comprehensive (loss) / |
|
(4,796 |
) |
|
|
29 |
|
|
|
- |
|
|
|
(4,767 |
) |
|
Amounts reclassified from |
|
- |
|
|
|
(81 |
) |
|
|
- |
|
|
|
(81 |
) |
|
Net current-period other |
|
(4,796 |
) |
|
|
(52 |
) |
|
|
- |
|
|
|
(4,848 |
) |
|
Balance, January 31, 2015 |
$ |
98,642 |
|
|
$ |
211 |
|
|
$ |
1 |
|
|
$ |
98,854 |
|
|
(1) |
Amounts in fiscal 2016 and 2015 were reclassified to earnings in the Consolidated Statements of Operations. |
NOTE 14 – SEGMENT AND GEOGRAPHIC INFORMATION
The Company follows accounting guidance related to disclosures about segments of an enterprise and related information. This guidance requires disclosure of segment data based on how management makes decisions about allocating resources to segments and measuring their performance.
The Company conducts its business in two operating segments: Wholesale and Retail. The Company’s Wholesale segment includes the designing, manufacturing and distribution of watches of quality luxury brands and licensed brands, in addition to revenue generated from after-sales service activities and shipping. The Retail segment includes the Company’s retail outlet locations.
The Company divides its business into two major geographic locations: United States operations, and International, which includes the results of all other Company operations. The allocation of geographic revenue is based upon the location of the customer. The Company’s International operations in Europe, the Americas (excluding the United States), the Middle East and Asia accounted for 21.2%, 10.5%, 7.4% and 6.1%, respectively, of the Company’s total net sales for fiscal 2016. For fiscal 2015, the Company’s International operations in Europe, the Americas (excluding the United States), Asia and the Middle East accounted for 18.9%, 11.4%, 8.0% and 7.1%, respectively, of the Company’s total net sales. For fiscal 2014, the Company’s International operations in Europe, the Americas (excluding the United States), Asia, and the Middle East accounted for 18.5%, 12.4%, 8.1% and 7.8%, respectively, of the Company’s total net sales. Substantially all of the Company’s International assets are located in Switzerland and Hong Kong.
71
Operating Segment Data as of and for the Fiscal Year Ended January 31, (in thousands):
|
|
Net Sales (2) (6) |
|
|||||||||
|
|
2016 |
|
|
2015 |
|
|
2014 |
|
|||
|
Wholesale: |
|
|
|
|
|
|
|
|
|
|
|
|
Luxury brands category |
$ |
219,012 |
|
|
$ |
212,684 |
|
|
$ |
220,267 |
|
|
Licensed brands category |
|
297,227 |
|
|
|
294,316 |
|
|
|
276,356 |
|
|
After-sales service and all other |
|
13,770 |
|
|
|
15,260 |
|
|
|
14,367 |
|
|
Total Wholesale |
|
530,009 |
|
|
|
522,260 |
|
|
|
510,990 |
|
|
Retail |
|
64,914 |
|
|
|
64,720 |
|
|
|
59,265 |
|
|
Consolidated total |
$ |
594,923 |
|
|
$ |
586,980 |
|
|
$ |
570,255 |
|
|
|
Operating Income |
|
|||||||||
|
|
2016 |
|
|
2015 |
|
|
2014 |
|
|||
|
Wholesale |
$ |
58,242 |
|
|
$ |
58,236 |
|
|
$ |
55,241 |
|
|
Retail |
|
11,865 |
|
|
|
13,251 |
|
|
|
12,501 |
|
|
Consolidated total |
$ |
70,107 |
|
|
$ |
71,487 |
|
|
$ |
67,742 |
|
|
|
Total Assets |
|
|
Capital Expenditures |
|
||||||||||||||
|
|
2016 |
|
|
2015 |
|
|
2016 |
|
|
2015 |
|
|
2014 |
|
|||||
|
Wholesale |
$ |
562,547 |
|
|
$ |
562,462 |
|
|
$ |
5,902 |
|
|
$ |
9,321 |
|
|
$ |
15,280 |
|
|
Retail |
|
22,623 |
|
|
|
20,561 |
|
|
|
2,168 |
|
|
|
1,811 |
|
|
|
1,427 |
|
|
Consolidated total |
$ |
585,170 |
|
|
$ |
583,023 |
|
|
$ |
8,070 |
|
|
$ |
11,132 |
|
|
$ |
16,707 |
|
|
|
Depreciation and Amortization |
|
|||||||||
|
|
2016 |
|
|
2015 |
|
|
2014 |
|
|||
|
Wholesale |
$ |
11,561 |
|
|
$ |
11,053 |
|
|
$ |
10,965 |
|
|
Retail |
|
1,595 |
|
|
|
1,416 |
|
|
|
1,268 |
|
|
Consolidated total |
$ |
13,156 |
|
|
$ |
12,469 |
|
|
$ |
12,233 |
|
Geographic Location Data as of and for the Fiscal Year Ended January 31, (in thousands):
|
|
Net Sales (2) (6) |
|
|
Operating Income |
|
||||||||||||||||||
|
|
2016 |
|
|
2015 |
|
|
2014 |
|
|
2016 |
|
|
2015 |
|
|
2014 |
|
||||||
|
United States |
$ |
326,206 |
|
|
$ |
320,425 |
|
|
$ |
303,095 |
|
|
$ |
29,867 |
|
|
$ |
18,811 |
|
|
$ |
11,036 |
|
|
International |
|
268,717 |
|
|
|
266,555 |
|
|
|
267,160 |
|
|
|
40,240 |
|
|
|
52,676 |
|
|
|
56,706 |
|
|
Consolidated total |
$ |
594,923 |
|
|
$ |
586,980 |
|
|
$ |
570,255 |
|
|
$ |
70,107 |
|
|
$ |
71,487 |
|
|
$ |
67,742 |
|
|
|
Total Assets |
|
|
Property, Plant and Equipment, Net |
|
||||||||||
|
|
2016 |
|
|
2015 |
|
|
2016 |
|
|
2015 |
|
||||
|
United States |
$ |
215,053 |
|
|
$ |
209,660 |
|
|
$ |
24,517 |
|
|
$ |
25,950 |
|
|
International |
|
370,117 |
|
|
|
373,363 |
|
|
|
14,036 |
|
|
|
20,723 |
|
|
Consolidated total |
$ |
585,170 |
|
|
$ |
583,023 |
|
|
$ |
38,553 |
|
|
$ |
46,673 |
|
|
(1) |
Fiscal 2016 Wholesale and United States and International operating income included a $4.0 million charge as a result of actions taken by the Company in fiscal 2016 to achieve greater operating efficiencies and streamline its operations. |
|
(2) |
Fiscal 2014 Wholesale and United States net sales included a $7.8 million sales reserve, for anticipated returns resulting from the Company’s decision to reduce the presence of ESQ Movado while expanding the Movado brand offering in certain retail doors. |
|
(3) |
Fiscal 2014 Wholesale and United States operating income included a charge of $8.3 million related to its strategy to reduce the presence of ESQ Movado while expanding the Movado brand offering in certain retail doors. The $8.3 million charge consists of anticipated sales returns from select customers, inventory reserves and writes down of excess displays and point of sale materials related to this strategy. |
|
(4) |
Fiscal 2014 Wholesale and United States operating income included a $2.0 million donation to the Movado Group Foundation. |
72
|
(5) |
Fiscal 2014 Wholesale and United States operating income included $2.5 million duty refund received relating to payments made by the Company in calendar years 2008 through 2011 for drawback claims filed with U.S. Customs & Border Protection. |
|
(6) |
The United States and International net sales are net of intercompany sales of $309.1 million, $305.1 million and $338.6 million for the fiscal years ended January 31, 2016, 2015 and 2014, respectively. |
|
(7) |
The United States operating income included $27.0 million, $19.3 million and $26.5 million of unallocated corporate expenses for the fiscal years ended January 31, 2016, 2015 and 2014, respectively. |
|
(8) |
The International operating income included $44.5 million, $47.1 million and $44.2 million of certain intercompany profits related to the Company’s supply chain operations for the fiscal years ended January 31, 2016, 2015 and 2014, respectively. |
NOTE 15 - QUARTERLY FINANCIAL DATA (UNAUDITED)
The following table presents unaudited selected interim operating results of the Company for fiscal 2016 and 2015 (in thousands, except per share amounts):
|
|
Quarter |
|
|||||||||||||
|
|
1st |
|
|
2nd |
|
|
3rd |
|
|
4th |
|
||||
|
Fiscal 2016 |
|
|
|
|
|
|
|
|
|
|
|
|
|
|
|
|
Net sales |
$ |
120,461 |
|
|
$ |
145,569 |
|
|
$ |
185,629 |
|
|
$ |
143,264 |
|
|
Gross profit |
$ |
62,449 |
|
|
$ |
79,038 |
|
|
$ |
100,092 |
|
|
$ |
75,351 |
|
|
Income before income taxes |
$ |
6,776 |
|
|
$ |
18,013 |
|
|
$ |
33,152 |
|
|
$ |
11,184 |
|
|
Net income |
$ |
3,641 |
|
|
$ |
11,933 |
|
|
$ |
21,910 |
|
|
$ |
8,282 |
|
|
Net income attributed to Movado Group, Inc. |
$ |
3,622 |
|
|
$ |
12,053 |
|
|
$ |
21,532 |
|
|
$ |
7,888 |
|
|
Basic income per share: |
|
|
|
|
|
|
|
|
|
|
|
|
|
|
|
|
Net income attributed to Movado Group, Inc. |
$ |
0.15 |
|
|
$ |
0.51 |
|
|
$ |
0.93 |
|
|
$ |
0.34 |
|
|
Diluted income per share: |
|
|
|
|
|
|
|
|
|
|
|
|
|
|
|
|
Net income attributed to Movado Group, Inc. |
$ |
0.15 |
|
|
$ |
0.50 |
|
|
$ |
0.92 |
|
|
$ |
0.34 |
|
|
Fiscal 2015 |
|
|
|
|
|
|
|
|
|
|
|
|
|
|
|
|
Net sales |
$ |
120,921 |
|
|
$ |
143,591 |
|
|
$ |
188,557 |
|
|
$ |
133,911 |
|
|
Gross profit |
$ |
65,151 |
|
|
$ |
77,606 |
|
|
$ |
99,842 |
|
|
$ |
67,383 |
|
|
Income before income taxes |
$ |
10,862 |
|
|
$ |
17,079 |
|
|
$ |
33,306 |
|
|
$ |
9,917 |
|
|
Net income |
$ |
7,429 |
|
|
$ |
12,170 |
|
|
$ |
22,417 |
|
|
$ |
9,884 |
|
|
Net income attributed to Movado Group, Inc. |
$ |
7,365 |
|
|
$ |
12,151 |
|
|
$ |
22,209 |
|
|
$ |
10,051 |
|
|
Basic income per share: |
|
|
|
|
|
|
|
|
|
|
|
|
|
|
|
|
Net income attributed to Movado Group, Inc. |
$ |
0.29 |
|
|
$ |
0.48 |
|
|
$ |
0.88 |
|
|
$ |
0.40 |
|
|
Diluted income per share: |
|
|
|
|
|
|
|
|
|
|
|
|
|
|
|
|
Net income attributed to Movado Group, Inc. |
$ |
0.29 |
|
|
$ |
0.47 |
|
|
$ |
0.87 |
|
|
$ |
0.40 |
|
As each quarter is calculated as a discrete period, the sum of the four quarters may not equal the calculated full year amount. This is in accordance with prescribed reporting requirements.
NOTE 16 - SUPPLEMENTAL CASH FLOW INFORMATION
The following is provided as supplemental information to the consolidated statements of cash flows (in thousands):
|
|
Fiscal Year Ended January 31, |
|
|||||||||
|
|
2016 |
|
|
2015 |
|
|
2014 |
|
|||
|
Cash paid during the year for: |
|
|
|
|
|
|
|
|
|
|
|
|
Interest |
$ |
797 |
|
|
$ |
226 |
|
|
$ |
282 |
|
|
Income taxes, net |
$ |
22,500 |
|
|
$ |
12,493 |
|
|
$ |
8,013 |
|
|
Supplemental disclosures of non-cash investing activities: |
|
|
|
|
|
|
|
|
|
|
|
|
Additions to property, plant and equipment included in accrued liabilities |
$ |
- |
|
|
$ |
127 |
|
|
$ |
- |
|
73
NOTE 17 – OTHER INCOME
Other income for the fiscal year ended January 31, 2014 consisted of a $1.5 million pre-tax gain on the sale of a building. The Company received cash proceeds from the sale of $2.2 million in the first quarter of fiscal year 2014. Prior to the sale, the building had been classified as an asset held for sale in other current assets.
NOTE 18 – NET INCOME ATTRIBUTED TO MOVADO GROUP, INC. AND TRANSFERS TO NONCONTROLLING INTEREST
|
|
For Fiscal Year Ended January 31, |
|
|||||||||
|
|
2016 |
|
|
2015 |
|
|
2014 |
|
|||
|
Net income attributed to Movado Group, Inc. |
$ |
45,094 |
|
|
$ |
51,776 |
|
|
$ |
50,877 |
|
|
Transfers to the noncontrolling interest |
|
|
|
|
|
|
|
|
|
|
|
|
Decrease in Movado Group, Inc.’s paid in capital for purchase of 49% of MGI-TWC B.V. common shares |
|
(3,613) |
|
|
|
- |
|
|
|
- |
|
|
Net transfers to noncontrolling interest |
|
(3,613) |
|
|
|
- |
|
|
|
- |
|
|
Change from net income attributed to Movado Group, Inc. and transfers to noncontrolling interest |
$ |
41,481 |
|
|
$ |
51,776 |
|
|
$ |
50,877 |
|
On January 6, 2016, Movado Group, Inc. and Financiere TWC SA (“TWC”), a French company with established distribution, marketing and sales operations in France and Germany, terminated the joint venture agreement they entered into on August 31, 2005 (the “JV Agreement”) relating to MGI-TWC B.V., a Dutch holding company that wholly owns MGI-TWC SAS, a French corporation, and MGI-TWC GmbH, a German corporation (collectively, the “Subsidiaries”). Under the JV Agreement, the Company and TWC controlled 51% and 49%, respectively, of MGI-TWC B.V. On January 6, 2016 the JV Agreement was terminated in connection with the acquisition by the Company of the outstanding 49% ownership interest in MGI-TWC B.V. Since that date, the Company has accounted for the Subsidiaries as wholly-owned entities. The Subsidiaries continue to be responsible for the marketing, distribution and sale in France and Germany of the Company's licensed HUGO BOSS, Lacoste, Scuderia Ferrari and Tommy Hilfiger brands, as well as future brands licensed to the Company, subject to the terms of the applicable license agreements. As of January 31, 2016, the Company had a remaining balance of $1.4 million regarding this purchase.
NOTE 19 – TREASURY STOCK
On March 31, 2016, the Board approved a share repurchase program under which the Company is authorized to purchase up to $50.0 million of its outstanding common stock from time to time, depending on market conditions, share price and other factors. The Company may purchase shares of its common stock through open market purchases, repurchase programs, block trades or otherwise. This authorization expires on September 30, 2017.
On March 21, 2013, the Board approved a share repurchase program under which the Company was authorized to purchase up to $50.0 million of its outstanding common stock from time to time, depending on market conditions, share price and other factors. The Company may purchase shares of its common stock through open market purchases, repurchase plans, block trades or otherwise. On November 25, 2014, the Board increased the amount of the share repurchase authorization to $100.0 million. This authorization expired on January 31, 2016. During the fiscal year ended January 31, 2016, the Company repurchased a total of 1,858,939 shares of its common stock at a total cost of approximately $48.7 million, or an average of $26.22 per share, which included 28,000 shares repurchased from the Movado Group Foundation at a total cost of approximately $0.8 million, or an average of $27.33 per share. During the fiscal year ended January 31, 2015, the Company repurchased a total of 833,973 shares of its common stock at a total cost of approximately $26.4 million, or an average of $31.63 per share.
There were 21,076 and 30,105 shares of common stock repurchased during the fiscal year ended January 31, 2016 and 2015, respectively, as a result of the surrender of shares in connection with the vesting of certain stock awards. At the election of an employee, shares having an aggregate value on the vesting date equal to the employee’s withholding tax obligation may be surrendered to the Company.
74
NOTE 20 – RECENT ACCOUNTING PRONOUNCEMENTS
On February 25, 2016, FASB issued ASU 2016-02, “Leases,” which requires lessees to recognize most leases on the balance sheet. This is expected to increase both reported assets and liabilities. The new lease standard does not substantially change lessor accounting. For public companies, the standard will be effective for the first interim reporting period within annual periods beginning after December 15, 2018, although early adoption is permitted. Lessees and lessors will be required to apply the new standard at the beginning of the earliest period presented in the financial statements in which they first apply the new guidance, using a modified retrospective transition method. The requirements of this standard include a significant increase in required disclosures. The Company is analyzing the impact of the adoption of this guidance on the Company’s consolidated financial statements, including assessing changes that might be necessary to information technology systems, processes and internal controls to capture new data and address changes in financial reporting.
On January 5, 2016, FASB issued ASU 2016-01, “Financial Instruments: Recognition and Measurement of Financial Assets and Financial Liabilities,” which enhances the reporting model for financial instruments and includes amendments to address aspects of recognition, measurement, presentation and disclosure. For public companies, the amendment is effective for annual periods beginning after December 15, 2017. Early adoption is permitted for only certain portions of the new guidance. The Company is evaluating the impact of the adoption of this guidance on the Company’s consolidated financial statements.
On November 20, 2015, FASB issued ASU 2015-17, “Income Taxes: Balance Sheet Classification of Deferred Taxes,” which eliminates the current requirement for companies to present deferred tax liabilities and assets as current and non-current in a classified balance sheet. Instead, companies will be required to classify all deferred tax assets and liabilities as non-current. For public companies, the amendments are effective for financial statements issued for annual periods beginning after December 15, 2016, and interim periods within those annual periods. Earlier application is permitted. The Company has elected to early adopt this requirement retrospectively in the current period. The Company reclassified $6.2 million of net current deferred income tax assets from current to noncurrent at January 31, 2015.
On July 22, 2015, FASB issued ASU 2015-11, “Inventory: Simplifying the Measurement of Inventory,” which affects reporting entities that measure inventory using first-in, first-out or average cost. Specifically, the guidance requires that inventory be measured at the lower of cost and net realizable value. Net realizable value is the estimated selling prices in the ordinary course of business, less reasonably predictable costs of completion, disposal, and transportation. The guidance is effective for annual periods beginning after December 15, 2016, with early adoption permitted. The Company is evaluating the effect of adopting this pronouncement, but the adoption is not expected to have a material impact on the Company’s consolidated financial statements.
On April 7, 2015, FASB issued ASU 2015-03, “Simplifying the Presentation of Debt Issuance Costs,” which states that debt issuance costs be presented in the balance sheet as a direct deduction from the debt liability, consistent with debt discounts. Under current accounting standards, such costs are recorded as an asset. On August 18, 2015, FASB clarified that the guidance in this pronouncement does not apply to line-of-credit arrangements. Accordingly, debt issuance costs for line-of-credit arrangements may continue to be presented as an asset that is amortized ratably over the term of the arrangement. The new guidance is effective for the beginning of the Company’s fiscal year 2017, with early adoption permitted. The Company is evaluating the effect of adopting this pronouncement, but the adoption is not expected to have a material impact on the Company’s consolidated financial statements.
On May 28, 2014, FASB issued ASU 2014-09, “Revenue from Contracts with Customers.” This pronouncement affects any entity that either enters into contracts with customers to transfer goods or services or enters into contracts for the transfer of nonfinancial assets, unless those contracts are within the scope of other standards (for example, insurance contracts or lease contracts). The core principle of the guidance is that an entity should recognize revenue to depict the transfer of promised goods or services to customers in an amount that reflects the consideration to which the entity expects to be entitled in exchange for those goods or services. In July 2015, FASB deferred the effective date of the guidance. The new revenue standard is effective for fiscal years, and interim periods within those years, beginning after December 15, 2017 and allows either a full retrospective adoption to all periods presented or a modified retrospective adoption approach with the cumulative effect of initial application of the revised guidance recognized at the date of initial application. Early adoption is permitted for periods beginning after December 15, 2016. The Company is evaluating the impact of the adoption of this guidance on the Company’s consolidated financial statements.
NOTE 21 – OPERATING EFFICIENCY INITIATIVES AND OTHER ITEMS
In fiscal 2016, the Company commenced an initiative to achieve greater operating efficiencies and streamline its operations, primarily at certain of its foreign subsidiaries. In the first quarter of fiscal 2016, the Company recorded $2.7 million of pre-tax expenses primarily for severance, occupancy charges, and fixed assets. In the fourth quarter of fiscal 2016, the Company recorded an additional pre-tax charge of $1.3 million primarily related to severance and the write-off of unamortized shop-in-shops with no expected future value.
75
A summary roll forward of costs related to the operating efficiency initiatives and other items is as follows (in thousands):
|
|
Balance at January 31, 2015 |
|
|
Fiscal 2016 charges (4) |
|
|
Cash payments |
|
|
Non-cash adjustments |
|
|
Foreign exchange |
|
|
Accrued balance at January 31, 2016 |
||||||
|
Severance (1) |
$ |
1,080 |
|
|
$ |
1,631 |
|
|
$ |
(1,836 |
) |
|
$ |
— |
|
|
$ |
(244 |
) |
|
$ |
631 |
|
Occupancy charges (2) |
|
— |
|
|
|
788 |
|
|
|
(249 |
) |
|
|
— |
|
|
|
(180 |
) |
|
|
359 |
|
Fixed assets (3) |
|
— |
|
|
|
1,577 |
|
|
|
— |
|
|
|
(1,577 |
) |
|
|
— |
|
|
|
— |
|
Total |
$ |
1,080 |
|
|
$ |
3,996 |
|
|
$ |
(2,085 |
) |
|
$ |
(1,577 |
) |
|
$ |
(424 |
) |
|
$ |
990 |
|
(1) |
The total severance charges of $1.6 million include $1.0 million in SG&A and $0.6 million in Cost of sales on the Consolidated Statement of Operations for the fiscal year ended January 31, 2016. |
|
(2) |
Occupancy charges include expenses for rent, office equipment and legal expenses. The occupancy charge of $0.8 million is included in SG&A on the Consolidated Statement of Operations for the fiscal year ended January 31, 2016. |
|
(3) |
Fixed asset charges of $1.6 million are related to closing of certain shop-in-shops that were no longer in use and have no future value in Asia. The fixed asset charge of $1.6 million is included in SG&A on the Consolidated Statement of Operations for the fiscal year ended January 31, 2016. |
|
(4) |
This pre-tax charge was the net of a $0.9 million transfer of the provision related to severance agreements and a charge of $4.9 million in the United States and International locations of the Wholesale segment, respectively. |
On March 31, 2016, the Board approved a share repurchase program under which the Company is authorized to purchase up to $50.0 million of its outstanding common stock from time to time, depending on market conditions, share price and other factors. The Company may purchase shares of its common stock through open market purchases, repurchase programs, block trades or otherwise. This authorization expires on September 30, 2017.
Also on March 31, 2016, the Company announced that Rick Coté, Vice Chairman and Chief Operating Officer, will retire in June 2016. He will remain on the Board of Directors of Movado Group, in which capacity he will continue to serve as a trusted advisor to the Company. The Company does not plan to replace the Chief Operating Officer role. The Company will record an approximate $2.0 million pre-tax charge for the immediate vesting of stock awards and certain other compensation related to Rick Coté’s retirement in fiscal 2017. The Company will record this charge in the first quarter of fiscal 2017.
76
MOVADO GROUP, INC.
VALUATION AND QUALIFYING ACCOUNTS
(In thousands)
|
|
Balance at |
|
|
Net provision |
|
|
Currency |
|
|
Net write-offs |
|
|
Balance at |
|
||||||
|
Year ended January 31, 2016: |
|
|
|
|
|
|
|
|
|
|
|
|
|
|
|
|
|
|
|
|
|
Doubtful accounts |
|
$ |
3,247 |
|
|
$ |
2,251 |
|
|
$ |
(190 |
) |
|
$ |
(1,034 |
) |
|
$ |
4,274 |
|
|
Returns |
|
|
8,736 |
|
|
|
27,433 |
|
|
|
(147 |
) |
|
|
(25,166 |
) |
|
|
10,856 |
|
|
Other sales allowances |
|
|
5,068 |
|
|
|
6,459 |
|
|
|
(65 |
) |
|
|
(7,283 |
) |
|
|
4,179 |
|
|
Total |
|
$ |
17,051 |
|
|
$ |
36,143 |
|
|
$ |
(402 |
) |
|
$ |
(33,483 |
) |
|
$ |
19,309 |
|
|
Year ended January 31, 2015: |
|
|
|
|
|
|
|
|
|
|
|
|
|
|
|
|
|
|
|
|
|
Doubtful accounts |
|
$ |
3,315 |
|
|
$ |
1,188 |
|
|
$ |
(132 |
) |
|
$ |
(1,124 |
) |
|
$ |
3,247 |
|
|
Returns |
|
|
16,323 |
|
|
|
25,194 |
|
|
|
(87 |
) |
|
|
(32,694 |
) |
|
|
8,736 |
|
|
Other sales allowances |
|
|
3,462 |
|
|
|
6,372 |
|
|
|
(105 |
) |
|
|
(4,661 |
) |
|
|
5,068 |
|
|
Total |
|
$ |
23,100 |
|
|
$ |
32,754 |
|
|
$ |
(324 |
) |
|
$ |
(38,479 |
) |
|
$ |
17,051 |
|
|
Year ended January 31, 2014: |
|
|
|
|
|
|
|
|
|
|
|
|
|
|
|
|
|
|
|
|
|
Doubtful accounts |
|
$ |
4,356 |
|
|
$ |
612 |
|
|
$ |
(27 |
) |
|
$ |
(1,626 |
) |
|
$ |
3,315 |
|
|
Returns (1) * |
|
|
7,448 |
|
|
|
35,515 |
|
|
|
(63 |
) |
|
|
(26,577 |
) |
|
|
16,323 |
|
|
Other sales allowances |
|
|
8,205 |
|
|
|
5,189 |
|
|
|
(52 |
) |
|
|
(9,880 |
) |
|
|
3,462 |
|
|
Total |
|
$ |
20,009 |
|
|
$ |
41,316 |
|
|
$ |
(142 |
) |
|
$ |
(38,083 |
) |
|
$ |
23,100 |
|
|
(1) |
In fiscal 2014, net provision and the ending balance for returns includes a $7.8 million sales reserve, for anticipated returns in fiscal 2015 which resulted from the Company’s decision to reduce the presence of ESQ Movado while expanding the Movado brand offering in certain retail doors. |
|
* |
Certain reclassifications were made to conform to the fiscal 2016 and 2015 presentation. |
|
Description |
|
Balance at |
|
|
Net provision |
|
|
Currency |
|
|
Adjustments |
|
|
Balance at |
|
|||||
|
Year ended January 31, 2016: |
|
|
|
|
|
|
|
|
|
|
|
|
|
|
|
|
|
|
|
|
|
Deferred tax asset valuation (1) |
|
$ |
8,307 |
|
|
$ |
— |
|
|
$ |
(636 |
) |
|
$ |
418 |
|
|
$ |
8,089 |
|
|
Year ended January 31, 2015: |
|
|
|
|
|
|
|
|
|
|
|
|
|
|
|
|
|
|
|
|
|
Deferred tax asset valuation (2) |
|
$ |
7,798 |
|
|
$ |
— |
|
|
$ |
(801 |
) |
|
$ |
1,310 |
|
|
$ |
8,307 |
|
|
Year ended January 31, 2014: |
|
|
|
|
|
|
|
|
|
|
|
|
|
|
|
|
|
|
|
|
|
Deferred tax asset valuation (3) |
|
$ |
11,491 |
|
|
$ |
— |
|
|
$ |
(201 |
) |
|
$ |
(3,492 |
) |
|
$ |
7,798 |
|
|
(1) The detail of adjustments is as follows: |
|
(2) The detail of adjustments is as follows: |
|
|||||
|
Prior year adjustments |
|
$ |
177 |
|
Prior year adjustments and tax rate changes |
$ |
29 |
|
|
Expired tax losses |
|
|
(745 |
) |
P&L adjustments |
|
1,281 |
|
|
P&L adjustments |
|
|
986 |
|
|
$ |
1,310 |
|
|
|
|
$ |
418 |
|
|
|
|
|
|
(3) The detail of adjustments is as follows: |
|
|
|
|
|
|
|
|
|
Prior year adjustments and tax rate changes |
|
$ |
238 |
|
|
|
|
|
|
Reversal due to merger / liquidations |
|
|
(2,302 |
) |
|
|
|
|
|
P&L adjustments |
|
|
(1,428 |
) |
|
|
|
|
|
|
|
$ |
(3,492 |
) |
|
|
|
|
S-1