Attached files
| file | filename |
|---|---|
| 8-K - FORM 8-K - Tecnoglass Inc. | v435538_8k.htm |
| EX-99.1 - EXHIBIT 99.1 - Tecnoglass Inc. | v435538_ex99-1.htm |
Exhibit 99.2

March 29. 2016 (Nasdaq: TGLS; OTCBB: TGLSW) 2015 Fourth Quarter Earnings Conference Call

2 Safe Harbor FORWARD LOOKING STATEMENTS This presentation includes certain forward-looking statements within the meaning of the Private Securities Litigation Reform Act of 1995. including statements regarding future financial performance. future growth and future acquisitions. These statements are based on Tecnoglass’ current expectations or beliefs and are subject to uncertainty and changes in circumstances. Actual results may vary materially from those expressed or implied by the statements herein due to changes in economic. business. competitive and/or regulatory factors. and other risks and uncertainties affecting the operation of Tecnoglass’ business. These risks. uncertainties and contingencies are indicated from time to time in Tecnoglass’ filings with the Securities and Exchange Commission. The information set forth herein should be read in light of such risks. Further. investors should keep in mind that Tecnoglass’ financial results in any particular period may not be indicative of future results. Tecnoglass is under no obligation to. and expressly disclaims any obligation to. update or alter its forward-looking statements. whether as a result of new information. future events. changes in assumptions or otherwise. FINANCIAL PRESENTATION Certain of the financial information contained herein is unaudited and does not conform to SEC Regulation S-X. Furthermore. it includes EBITDA (earnings before interest. taxes depreciation and amortization) which is a non-GAAP financial measure as defined by Regulation G promulgated by the SEC under the Securities Act of 1933. as amended. Accordingly. such information may be materially different when presented in Tecnoglass’ filings with the Securities and Exchange Commission. Tecnoglass believes that the presentation of this non-GAAP financial measure provides information that is useful to investors as it indicates more clearly the ability of Tecnoglass to meet capital expenditures and working capital requirements and otherwise meet its obligations as they become due. EBITDA was derived by taking earnings before interest. taxes. depreciation and amortization as adjusted for certain one-time non-recurring items and exclusions. NO OFFER OR SOLICITATION This announcement is not intended to and does not constitute an offer to sell or the solicitation of an offer to subscribe for or buy or an invitation to purchase or subscribe for any securities or the solicitation of any vote or approval in any jurisdiction. nor shall there be any sale. issuance or transfer of securities in any jurisdiction in contravention of applicable law. No offer of securities shall be made except by means of a prospectus meeting the requirements of Section 10 of the Securities Act of 1933. as amended.

3 FY 2015 Summary Overview 36% „Ï Record Q4 2015 and FY 2015 revenues and Adjusted EBITDA „Ï FY 2015 Revenue up 36.5% on constant currency basis „Ï U.S. sales mix up 800 bps „Ï Soft coat operations commenced in Sep. 2015 „Ï Capacity. industry position and talented workforce provide firm foundation for additional EBITDA gains Revenues Adj. EBITDA 21% 46% Operating Income Rising U.S. Sales FY 2015 v. FY 2014 Percentage of Total Sales 36% 51% 62% 36% $ in MMs 49.1 66.7 101.6 38% 142.4 36% 51% 59% 2012 2013 2014 2015
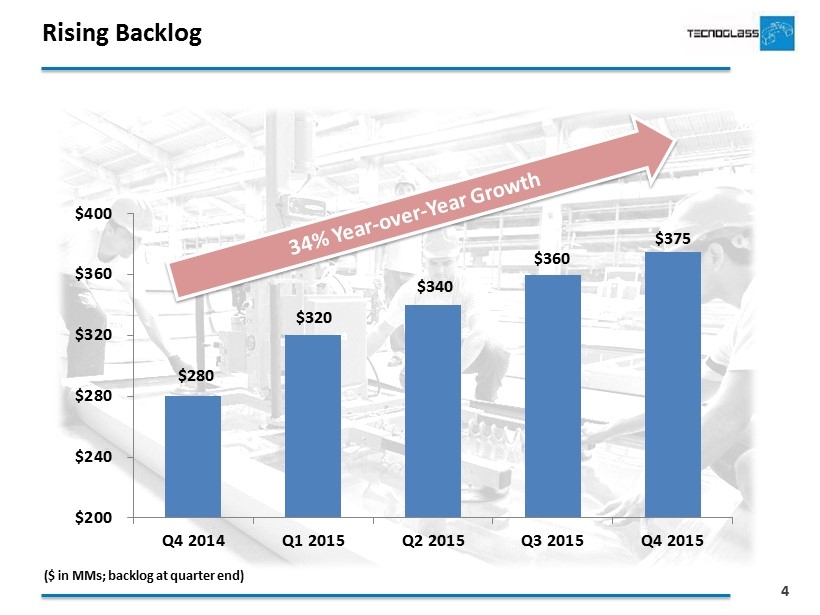
4 Rising Backlog ($ in MMs; backlog at quarter end) $280 $320 $340 $360 $375 $200 $240 $280 $320 $360 $400 Q4 2014 Q1 2015 Q2 2015 Q3 2015 Q4 2015

5 Capacity Expansion: New Soft Coat Line is a Game Changer ¡E New soft coat glass coating line „Ï Commenced operations September 2015 „Ï Places TGLS among a handful of manufacturers with this capability „Ï 2015-2016: expect to use 15% of capacity to fulfill internal requirements „Ï In the longer term. expect to generate an additional $200 - $250 million in external sales at full capacity „Ï $6 - $8 M in waste-related cost savings in the first year
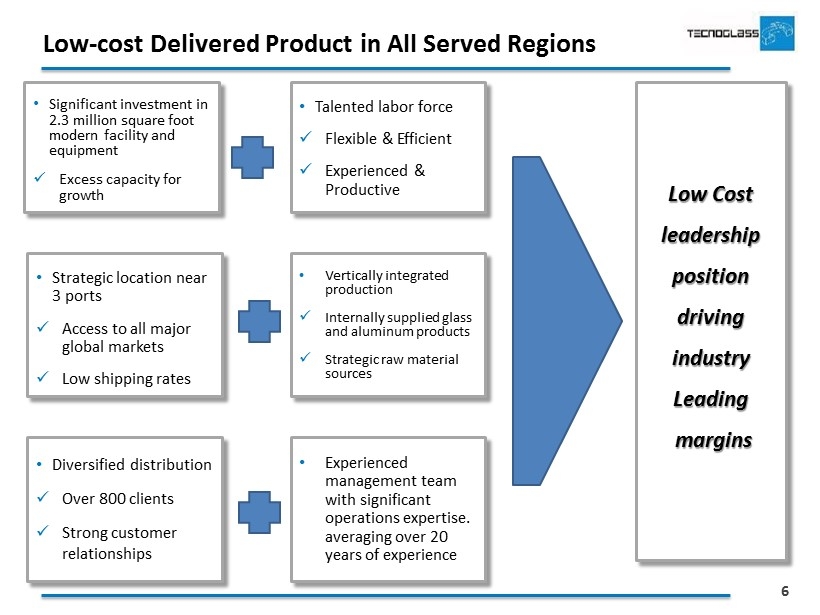
6 Low-cost Delivered Product in All Served Regions ¡E Significant investment in 2.3 million square foot modern facility and equipment „Ï Excess capacity for growth ¡E Strategic location near 3 ports „Ï Access to all major global markets „Ï Low shipping rates ¡E Diversified distribution „Ï Over 800 clients „Ï Strong customer relationships ¡E Talented labor force „Ï Flexible & Efficient „Ï Experienced & Productive ¡E Vertically integrated production „Ï Internally supplied glass and aluminum products „Ï Strategic raw material sources ¡E Experienced management team with significant operations expertise. averaging over 20 years of experience Low Cost leadership position driving industry Leading margins
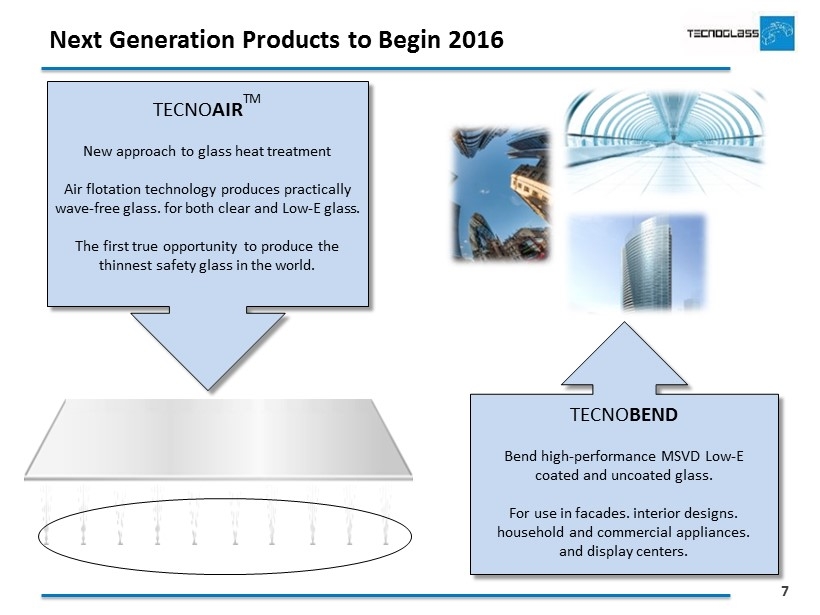
7 Next Generation Products to Begin 2016 TECNOAIRTM New approach to glass heat treatment Air flotation technology produces practically wave-free glass. for both clear and Low-E glass. The first true opportunity to produce the thinnest safety glass in the world. TECNOBEND Bend high-performance MSVD Low-E coated and uncoated glass. For use in facades. interior designs. household and commercial appliances. and display centers.

8 Q4 and FY 2015 Total Revenues Bridge 239,391 4,022 30,197 197,452 40,747 31,425 3,986 80,000 100,000 120,000 140,000 160,000 180,000 200,000 220,000 240,000 260,000 280,000 Q4 YTD 2014 Net Sales US Net Sales Colombia Net Sales Panama Net Sales Other Countries Net Sales Foreing Exchange Q4 YTD 2015 Net Sales USD$ 000 YTD 2015 Net Sales Bridge - - 66,403 - 7,982 44,222 7,503 17,473 3,550 0 10,000 20,000 30,000 40,000 50,000 60,000 70,000 80,000 Q4 2014 Net Revenues US net sales Colombia Net Sales Panama Net Sales Other Countries Net Sales Foreing Exchange Q4 2015 Net Revenues USD$000 Q4 Net Sales Bridge

9 Q4 and FY 2015 Adjusted EBITDA Bridge - - 1,416 10,975 12,825 295 13,180 9,332 - 3,119 5,000 7,000 9,000 11,000 13,000 15,000 17,000 19,000 21,000 23,000 25,000 Q4 QTD 2014 EBITDA Price/ Product Mix Volume SGA F/X Depreciation & Others Q4 QTD 2015 EBITDA Q4 QTD 2015 EBITDA Bridge - - 7,432 66 - 65,523 48,008 5,762 14,081 - 5,170 5,000 15,000 25,000 35,000 45,000 55,000 65,000 75,000 Q4 YTD 2014 EBITDA Price/ Product Mix Volume SGA F/X Depreciation & Others Q4 YTD 2015 EBITDA YTD 2015 EBITDA Bridge

10 Financial Highlights Financial Highlights (in MMs. except per share data) Q4 2015 (Unaudited) Q4 2014 FYE 2015 (Unaudited) FYE 2014 Total Revenues (1) $ 66.4 $ 44.2 $ 239.4 $197.4 Gross Profit $ 28.2 $ 18.6 $ 86.1 $ 66.3 Operating Income $ 11.5 $ 3.3 $ 39.6 $ 27.2 Change in Fair Value of Warrant Liability $ (3.4) $ 5.1 $ (24.9) $ (1.7) Non-operating Revenues $ (1.8) $ 0.1 $ 14.0 $ 2.1 Net (loss) Income $ (0.5) $ 13.3 $ (1.4) $ 20.3 Net (loss) Income per Diluted Share $ (0.02) $ 0.48 $ (0.05) $ 0.73 Net Income. excluding warrant liability $ 2.9 $ 8.2 $ 23.5 $ 22.0 Net Income p/s. excluding warrant liability $0.10 $0.30 $0.84 $0.79 (1) Revenues in 2014 /2015 reflect impact of depreciation of COP against the US Dollar

11 Balance Sheet Highlights (in MMs. except per share data) 12/31/15 12/31/14 Cash and equivalents $ 18.5 $ 15.9 Accounts receivable $ 53.0 $ 45.0 Total current assets $ 168.3 $ 141.5 Total assets $ 322.3 $ 255.9 Total current liabilities $ 149.1 $ 113.0 Total liabilities $ 254.6 $ 180.6 Total shareholders’ equity $ 67.7 $ 75.3

12 Public Company Initiatives: Focused on continuous improvement • Focused on generating shareholder value and capital returns • Industry leading Adjusted EBITDA growth and margins • Committed to initiating dividend in 2016 • Filed amended S3/S4 in March 2016 • Strategic distribution partners (ES Windows and Ventanas Solar) • Strong partnership contributed to rapid US growth • TGLS now firmly established in US and Panama • Pursuing strategic route (i.e. acquisition by TGLS) to simplify story • Internal Control Enhancements • Continue to work with Deloitte on additional controls • On track for SOX compliance by March 2017

13 Strong Growth Profile: Rising Revenues and Adjusted EBITDA (1) Excludes gains / losses related to change in fair value of warrant liability $130 $183 $197 $239 $288 $- $50 $100 $150 $200 $250 $300 $350 2012 2013 2014 2015 2016E Revenues $22 $39 $48 $66 $85 $- $20 $40 $60 $80 $100 2012 2013 2014 2015 2016E Consolidated Adjusted EBITDA (1) 22% 40% C A GR C A GR ($ in Millions)
THANK YOU QUESTIONS?

FULL YEAR FY 2015 FY 2014 FY 2015 FY 2014 Revenues 239,391 1 97,452 2 39,391 1 97,452 COGS 153,252 131,156 160,653 136,021 Gross Margin 86,139 66,296 78,738 61,431 Gross Margin % 36.0% 33.6% 32.9% 31.1% SGA 46,496 39,064 39,095 34,199 OP's Income 39,643 27,232 39,643 27,232 OP's Income % 16.6% 13.8% 16.6% 13.8% QUARTER Q4 '15 Q4 '14 Q4 '15 Q4 '14 Revenues 66,403 44,222 66,403 44,222 COGS 38,170 25,616 45,571 30,481 Gross Margin 28,233 18,606 20,832 13,741 Gross Margin % 42.5% 42.1% 31.4% 31.1% SGA 16,716 15,300 9,315 10,435 OP's Income 11,517 3,306 11,517 3,306 OP's Income % 17.3% 7.5% 17.3% 7.5% With Reclass Without Reclass With Reclass Without Reclass 15 Appendix: Shipping & Handling Cost Reclassification