Attached files
| file | filename |
|---|---|
| EX-32 - Tecnoglass Inc. | ex-32.htm |
| EX-31.2 - Tecnoglass Inc. | ex31-2.htm |
| EX-31.1 - Tecnoglass Inc. | ex31-1.htm |
| EX-21 - Tecnoglass Inc. | ex-21.htm |
UNITED STATES
SECURITIES AND EXCHANGE COMMISSION
WASHINGTON, D.C. 20549
FORM 10-K
(Mark One)
| [X] | ANNUAL REPORT PURSUANT TO SECTION 13 OR 15(d) OF THE SECURITIES EXCHANGE ACT OF 1934 |
For the fiscal year ended December 31, 2017
| [ ] | TRANSITION REPORT PURSUANT TO SECTION 13 OR 15(d) OF THE SECURITIES EXCHANGE ACT OF 1934 |
For the transition period from ______________ to ______________
Commission File Number 001-35436
TECNOGLASS INC.
(Exact Name of Registrant as Specified in Its Charter)
| Cayman Islands | 98-1271120 | |
| (State
or Other Jurisdiction of Incorporation or Organization) |
(I.R.S.
Employer Identification Number) |
| Avenida
Circunvalar a 100 mts de la Via 40 Barrio Las Flores, Barranquilla Colombia |
||
| (Address of Principal Executive Offices) | (Zip Code) |
(57)(5)3734000
(Registrant’s Telephone Number, Including Area Code)
Securities registered pursuant to Section 12(b) of the Act:
| Title of each class | Name of each exchange on which registered | |
| Ordinary Shares, par value $0.0001 per share | The NASDAQ Stock Market LLC |
Securities registered pursuant to Section 12(g) of the Act:
None
Indicate by check mark if the registrant is a well-known seasoned issuer, as defined in Rule 405 of the Securities Act.
Yes [ ] No [X]
Indicate by check mark if the registrant is not required to file reports pursuant to Section 13 or 15(d) of the Exchange Act.
Yes [ ] No [X]
Indicate by check mark whether the registrant (1) has filed all reports required to be filed by Section 13 or 15(d) of the Exchange Act of 1934 during the preceding 12 months (or for such shorter period that the registrant was required to file such reports), and (2) has been subject to such filing requirement for the past 90 days.
Yes [X] No [ ]
Indicate by check mark whether the registrant has submitted electronically and posted on its corporate Web site, if any, every Interactive Data File required to be submitted and posted pursuant to Rule 405 of Regulation S-T (§ 232 405 of this chapter) during the preceding 12 months (or for such shorter period that the registrant was required to submit and post such files).
Yes [X] No [ ]
Indicate by check mark if disclosure of delinquent filers in response to Item 405 of Regulation S-K is not contained herein, and will not be contained, to the best of the registrant’s knowledge, in definitive proxy or information statements incorporated by reference in Part III of this Form 10-K or any amendment to this Form 10-K.
[X]
Indicate by check mark whether the Registrant is a large accelerated filer, an accelerated filer, a non-accelerated filer or a smaller reporting company. See definition of “large accelerated filer”, “accelerated filer” and “smaller reporting company” in Rule 12b-2 of the Exchange Act.:
| Large accelerated filer [ ] | Accelerated filer [X] |
| Non-accelerated filer [ ] | Smaller reporting company [ ] |
| (Do not check if a smaller reporting company) | Emerging growth company [ ] |
If an emerging growth company, indicate by check mark if the registrant has elected not to use the extended transition period for complying with any new or revised financial accounting standards provided pursuant to Section 13(a) of the Exchange Act. [ ]
Indicate by check mark whether the registrant is a shell company (as defined in Rule 12b-2 of the Exchange Act).
Yes [ ] No [X]
As of June 30, 2017 (the last business day of the registrant’s most recently completed second fiscal quarter), the aggregate market value of the ordinary shares held by non-affiliates of the registrant was approximately $109,874,617 based on its last reported sales price of $9.32 on the NASDAQ Capital Market.
As of December 31, 2017, there were 34,836,575 ordinary shares, $0.0001 par value per share, outstanding.
Documents Incorporated by Reference: None.
TECNOGLASS INC.
FORM 10-K
TABLE OF CONTENTS
| 2 |
FORWARD LOOKING STATEMENTS AND INTRODUCTION
All statements other than statements of historical fact included in this Annual Report on Form 10-K (this “Form 10-K”) including, without limitation, statements under “Management’s Discussion and Analysis of Financial Condition and Results of Operations” regarding our financial position, business strategy and the plans and objectives of management for future operations, are forward looking statements. When used in this Form 10-K, words such as “anticipate,” “believe,” “estimate,” “expect,” “intend” and similar expressions, as they relate to us or our management, identify forward looking statements. Such forward looking statements are based on the beliefs of management, as well as assumptions made by, and information currently available to, our management. Actual results could differ materially from those contemplated by the forward looking statements as a result of certain factors detailed in our filings with the Securities and Exchange Commission. All subsequent written or oral forward looking statements attributable to us or persons acting on our behalf are qualified in their entirety by this paragraph.
Unless the context otherwise requires:
| ● | references to the “Company”, “TGI” and to “we, “ “us” or “our” are to Tecnoglass Inc., a Cayman Islands exempted company, and its subsidiaries; |
| ● | references to “Tecnoglass Holding” are to Tecno Corporation; |
| ● | references to “Tecnoglass” and “TG” are to Tecnoglass S.A.; |
| ● | references to “ES” are to C.I. Energía Solar S.A. E.S. Windows; |
| ● | references to “ESW” are to ES Windows LLC, our indirect wholly-owned subsidiary, based in Florida. |
| ● | References to “VS” are to Ventana Solar S.A., a Panama-based company with which we have a strategic commercial relationship |
| ● | references to “Tecno LLC” are to Tecnoglass LLC; |
| ● | references to “Tecno RE” are to Tecno RE LLC; and |
| ● | references to “GM&P” are to Giovanni Monti and Partners Consulting and Glazing Contractors. We recently acquired GM&P, which was formerly a customer of ours. |
| 3 |
| Item 1. | Business. |
Overview
Tecnoglass Inc. is a leading manufacturer of architectural glass, windows, and associated aluminum products for the global commercial and residential construction industries. Tecnoglass is the #1 architectural glass transformation company in Latin America and the second largest glass fabricator serving the United States. Headquartered in Barranquilla, Colombia, the Company operates out of a 2.7 million square foot vertically-integrated, state-of-the-art manufacturing complex that provides easy access to the Americas, the Caribbean, and the Pacific. Tecnoglass supplies over 900 customers in North, Central and South America, with the United States accounting for more than 70% of revenues. Tecnoglass’ tailored, high-end products are found on some of the world’s most distinctive properties, including the El Dorado Airport (Bogota), 50 United Nations Plaza (New York), Trump Plaza (Panama), Trump Tower (Miami), and The Woodlands (Houston).
In December 2016, as part of our strategy to vertically integrate our operations, we acquired 100% of the stock of ESW LLC, 85.06% of which was acquired directly by the Company and 14.94% by our subsidiary ES, for a total purchase price of $13.5 million, which consisted of (i) 734,400 ordinary shares issued in connection with the transaction for approximately $9.2 million based on a stock price of $12.50, (ii) approximately $2.3 million in cash, and (iii) approximately $2.0 million related to the assignment of certain accounts receivable.
As the Acquisition of ESW was deemed to be a transaction between entities under common control, the assets and liabilities were transferred at the historical cost of ESW, with prior periods retroactively adjusted to include the historical financial results of the acquired company for the period they were controlled by the previous owners of ESW LLC in the Company’s financial statements.
On March 1, 2017, the Company acquired a 100% controlling interest in GM&P, a South Florida glazing contracting company that sells and installs our products, acting as an “arm” to support a broader geographical reach to reach new clients while providing a comprehenvise offering. The primary reasons for the acquisitions were to expand into different markets in the U.S. while streamlining its distribution logistics of Company products, and to be able to carry out light fabrication in the United States when economically advantageous. The purchase price for the acquisition was $35,000, of which $6,000 was paid in cash by the Company on May 17, 2017, with the remaining amount to be payable by the Company in cash, stock of the Company or a combination of both at the Company´s sole discretion originally within 180 days after closing, and subsequently amended to be paid by May 15, 2018.
Our Business
General
We are a leading manufacturer of hi-spec architectural glass and windows for the western hemisphere residential and commercial construction industries, operating through our direct and indirect subsidiaries. Headquartered in Barranquilla, Colombia. We operate out of a 2.7 million square foot vertically-integrated, state-of-the-art manufacturing complex that provides easy access to the Americas, the Caribbean, and the Pacific.
| 4 |
The Company is a leading manufacturer of a variety of glass products installed primarily in commercial and residential buildings, including tempered safety, double thermo-acoustic and laminated glass. Tecnoglass products are installed in hotels, residential buildings, commercial and corporate centers, universities, airports and hospitals in a variety of applications such as floating facades, curtain walls, windows, doors, handrails, interior and bathroom spatial dividers. In 2015 Tecnoglass established its Solartec plant, to produce low emissivity glass with high thermal insulation specifications using soft coat technology. Tecnoglass also produces aluminum products such as profiles, rods, bars, plates and other hardware used in the manufacture of windows..
Furthermore, the Company is a leader in the production of high-end windows, with more than 33 years of experience in the glass and aluminum structure assembly market in Colombia. The Company designs, manufactures, markets and installs architectural systems for high, medium and low rise construction, glass and aluminum windows and doors, curtain walls, floating facades, office dividers and interiors, and commercial display windows.
Glass Magazine ranked Tecnoglass as the second largest Glass & Metal Fabricator serving the U.S. market in 2017. We believe that it is the leading glass transformation company in Colombia, capturing 51% of the market share in the country by sales and volume based on external sources.
The Company has an important and dominant presence in the Florida market, which has historically represented (and continues to represent) a substantial portion of our total sales and backlog. The Company grew in the Florida market not only through sustained organic growth, but also through the asset acquisitions of Glasswall LLC and RC Aluminum, both in 2014, the acquisition of ESW in 2016, and the acquisition of GM&P in March of 2017, which will continue to reinforce our expansion strategy into U.S. markets. The Company sought to proactively diversify its presence product offering by expanding its U.S. sales outside of the Florida market with high value-added products such as curtain walls and floating facades, products that are in high demand and we believe represent a new trend in architecture. As an example, these have been used in El Dorado Airport (Bogotá), University of Baltimore Law School (Baltimore) and Via 57 West (New York). Due to the sophistication of these new products, we believe that we can generate higher margins through the sale of these products as compared to traditional window frames or floor-to-ceiling windows.
In Panama, the Company sells products primarily to companies participating in large construction projects in the exclusive areas of Panama City. For example, Company products were supplied in the construction of the tallest building in Latin America, The Point, as well as in the construction of other modern hotels in the region, such as Megapolis, and in the development of the Soho Plaza, a complex consisting of a shopping mall and two skyscrapers.
Competitive Strengths
Vertical Integration
We believe we are unique in vertically integrating the purchase of raw materials, the manufacture and transformation of glass and aluminum products and the subsequent production and distribution of customized glass and windows for architectural and industrial settings. By vertically integrating these functions, we are able to price our products competitively while maintaining strict quality control measures to guarantee the high quality of our products. Additionally, we benefit from significant advantages in efficiency and time-to-market for new or customized products. This vertically integrated model provides attractive margins with significant operating leverage.
| 5 |
Ideally situated, with easy access to cost-efficient transport hubs
Our principal manufacturing facilities are located in Barranquilla, Colombia, which is strategically located near three of the country’s major ports: Barranquilla, Cartagena and Santa Marta. These ports, which are no more than a two hours’ drive from each other, provide us with maritime access to all major markets globally. The Barranquilla port is just 16 kilometers away from our production facilities, and shipping to Miami’s main port is a three-day journey, six days to New York and 11 days to Los Angeles (through the Panama Canal). Our location provides a significant competitive advantage in light of the relatively low cost of shipping our products from Barranquilla to the U.S. (particularly Florida) as compared to our main competitors located elsewhere, even including our competitors located in Midwest U.S., given the significant trade imbalance of Colombia with the U.S and the large number of containers coming into the country that would otherwise comeback empty. We believe that as compared to our main U.S competitors, we are able to ship very competitively while being able to be agile and responsive to our customer´s needs.
High Barriers to Entry
Entry into many of the markets that we serve is limited due to the technical certifications required on high specification building projects such as IGCC, IqNet Icontec 14001 and ISO9001. Our success in those markets is due in large part to our ability to produce sophisticated products, the breadth of our product offering and our reputation for delivering high quality, made-to-order architectural glass on time. These factors are required to compete successfully for multimillion dollar projects typical of our business. Given the vertically-integrated nature of our operations, including the aluminum extrusion products provided by TG, there is a more limited set of competitors and entry into these markets. In addition, the equipment needed to operate in the glass and window industry is expensive, requiring a significant upfront capital investment. In addition, our employee training program ensures a dedicated and loyal work force, giving us an advantage that potential competitors lack, as they may not be able to bear the cost of providing similar training or retaining similarly trained employees.
Innovation
We have made significant investments in machinery and equipment in order to deploy the latest technology in our production lines. We have state-of-the-art glass making equipment, glass laminating lines and high-volume insulating equipment, which allow for a more precise and high quality manufacturing less raw material waste and the chance of developing new products. Being able to employ state-of-the-art technology is a competitive differentiator that (i) allows us to produce higher-quality products creating a competitive pricing advantage that can translate into higher margins, (ii) allows for less material waste and a more energy efficient process, and (iii) enables the manufacturing of a broader array of products.
| ● | During the last three years, we acquired three aluminum extrusion presses that together added more than 1,000 tons of production capacity per month, along with related aluminum paint line and a new foundry. Overall capital expenditures totaled $80.2 million in 2015 and $42.5 million in the year ended December 31, 2016, and $8.8 million in 2017, completing a strong growth Capex phase that we believe, will allow us to grow into the future. | |
| ● | In 2017 we completed two phases of our solar panel project to generate approximately 5 megawatts of eco-friendly energy and save approximately 6%-8% on energy costs. | |
| ● | In August 2014, we entered into a contract to purchase equipment to produce soft coated low emissivity glass as part of our improvement plan, which started production in the last quarter of 2015 and was in production throughout 2016 and 2017. | |
| ● | We purchased two glass-laminating and tempering furnaces that use state-of the-art technologies to produce tempered glass with no distortion using air cushion technology (TecnoAir) and to produce curved glass in a broad range of easily modifiable curvatures (TecnoBend). TecnoAir technology glass sheets “float” on air pressing systems rather than running on metallic rolls. TecnoBend has a flexible mold that permits different curved shapes to be employed in architectural structures. | |
| ● | For certain of our products, we offer DuPont Sentryglass®, laminated glass interlayers recognized as industry-leading laminated glass solutions with five times the resistance strength of competing materials. | |
| ● | We also use a laminator and jumbo tempering oven capable of producing extra-large slabs of laminated glass, which are sought after in the high-end window market. For example, our extra-large glass slabs have been recently used in El Dorado Airport (Bogotá). |
These investments in machinery and equipment, together with our highly trained labor force, allow us to offer state-of-the-art custom designed products that are tailored to meet customer demands.
Competitive cost structure
We provide high quality products to our customers at competitive prices primarily as a result of the efficiencies we achieve through vertical integration and comparatively low labor costs. Our employee training program ensures a dedicated and loyal work force that works efficiently and also is less susceptible to workplace injuries. These competitive advantages give us greater flexibility in pricing without adversely affecting our profit margins and allow our products to be competitive in a variety of markets.
Superior Customer Service
In addition to manufacturing high quality products, our value proposition to our customers is based on industry-leading lead times, on-time delivery and superior after-sale support. Through the coordinated efforts of our sales teams, product specialists, and field service teams, we deliver high quality service to our customers, from the time the initial order is placed through the delivery and installation of our products. By providing an efficient flow of product from order through delivery, our manufacturing processes allow us to deliver made-to-order products consistently on time, which we believe is an important competitive strength.
| 6 |
Management Experience
José Daes, our chief executive officer, and Christian Daes, our chief operating officer, have more than 30 years of industry experience, respectively. In addition, our executive management teams have worked together for many years at our operating subsidiaries. This long tenure in the industry, and as a team, has enabled our management to build significant relationships with both clients and field level management. We believe that these relationships, coupled with management’s strong technical expertise, create a significant competitive advantage.
Strong relationship with local communities
For several decades, we have had committed resources to improving the quality of life of our employees and the local communities surrounding our plants. As a result of these initiatives, we have developed close and cooperative relationships with local communities in Colombia, which are supported by several social responsibility initiatives we have undertaken. We view our employees as key to our historical and future success and therefore have focused initiatives of our non-for-profit, Fundación Tecnoglass, on offering our employees and their families the resources to purchase or improve their homes through the Programa de Mejora de Vivienda. Additionally, our foundation offers educational stipends for higher education pursuits. During 2017, 40 families were benefited from our Programa de Mejora de Vivienda, and we sponsored 192 employees and their children through our scholarship program, Programa de Becas. Fundación Tecnoglass also supports a school for primary and secondary education in the La Paz neighborhood in Barranquilla, Colombia, and, in collaboration with Fundación Colombia Somos Todos and soccer star James Rodriguez, we support children in vulnerable neighborhoods to thrive through sports, where 400 children were benefited in 2017; among several other social welfare programs designed to lend support to the most vulnerable citizens in Barranquilla and its surrounding communities. All of these initiatives have allowed us to maintain an excellent relationship with our employees, in which we have been able to maintain a labor union free environment since our incorporation.
Strategy
We have identified the following items that we believe are important in advancing our business:
Development of additional high-value products supported by continued investments in equipment and state-of-the-art technology.
We have a track record of developing new products and will continue to focus on capitalizing on new product opportunities in the future. We constantly identify shifting global trends and growing marketplace needs, and design proposals to meet those needs. For instance, with the installation of our soft coating facility, we are now able to manufacture low emissivity glass that is energy efficient and will allow us to service a growing market that demands “green” initiatives. We will seek to leverage our existing platform of cutting-edge production facilities to adapt our products to evolving demands for structural architectural glass in our current markets and evaluate opportunities to enter new markets. We expect our reputation and proven track-record of innovation will position us well to take advantage of these opportunities.
We made investments of $80.2million during 2015, $42.5 million during 2016. Investments during the year ended December 31, 2017 amounted to $8.8 and were comprised of machinery and equipment to enhance our installed capacity and completion of two phases of our solar panel project to generate approximately 5 megawatts of eco-friendly energy which we expect will save us approximately 6%-8% on energy costs.
Additionally, we have implemented new technologies to produce tempered glass that offers notably more transparency with significantly less distortion than industry standard using air cushion technology, as well as new technology to produce curved glass in a broad range of easily modifiable curvatures. We further intend to expand our operation to provide value-added glass products such as our soft-coated low-emissivity window panes that minimize the effect of solar heat.
We believe these innovative products will provide us with a competitive edge. The continued development of new products with the corresponding investments in technology, allows us to support our track-record of innovation and allow for continued customer demand by fulfilling ever-changing needs.
| 7 |
Manufacture the highest quality products in the market through a rigorous quality assurance program
Our plants are organized internally by processes, each of which is independently and continually supervised by the Quality Assurance department. The Quality Assurance department maintains rigorous oversight over energy, water, recyclable waste and process optimization indicators, in order to produce high quality sustainable products. Our quality assurance control system has established the measures and indicators necessary for the inspections implemented over the reception of materials, production process and final products. Additionally, between 5% and 10% of our production, randomly chosen, is sent to our laboratories to verify compliance with a variety of quality standards, such as water leaks, functionality, manufacturing and accessories, through tests undertaken according to ASTM and AAMA rules. We have implemented these measures in order to reach an effective control in detecting potential issues and to take the specific actions to mitigate their occurrence. By providing the highest quality products and ensuring they meet the highest standards of quality, we seek to ensure customer satisfaction and loyalty.
Continued vertical integration provides added profitability and operational enhancement
We benefit from having our key operating companies and processes operating together at a combined facility, providing advantages in meeting customer and market needs, controlling supply chain issues and managing operating costs. By continuing to operate as a vertically integrated company, we seek to further enhance productivity, create cost efficiencies and increase operating margins. In recent developments, we strive to further vertically integrate the operations of the Company through the acquisition of ESW, an importer and distributor of Company products in the U.S in December 2016. Furthermore, on March 1, 2017, the Company acquired GM&P, acting as an “arm” to support a broader geographical sell to reach new clients while providing a comprehenvise offering. GM&P had a long-standing commercial relationship with the Company prior to the acquisition, working alongside it in different projects within the U.S.
Leverage strength in Florida market to further penetrate U.S.
We believe we have an established and leading presence in the Florida construction market as providers of high value, impact-resistant glass products. ES’s hurricane-proof products are certified in compliance with the stringent requirements of hurricane-proof windows in accordance with applicable U.S. regulations. With a quality of product proven by our success and compliance in the impact-resistant market, we have successfully entered the U.S. remodeling and replacement parts market. In addition, we have grown geographically in the U.S., particularly into other coastal markets on the East Coast which are affected by hurricanes, significant temperature fluctuations and other extreme weather. As we continue to explore opportunities in other markets in the U.S., we intend to leverage the strong reputation we have developed in markets such as Florida to take advantage of a resurgent commercial and residential real estate sector.
Continue to leverage strength in Colombia market to further penetrate Latin America
With a strong base in Colombia, we have already successfully expanded into nearby geographies. Our glass products are featured in major construction projects in Argentina, Aruba, Costa Rica, Panama and Puerto Rico. As the construction market throughout Latin America grows, we are positioned to capture new growth in the markets we have currently penetrated, as well as in new high growth countries. We will also take advantage of our geographical location to deliver products to South American markets at relatively low shipping and operating cost.
Maintain fast and reliable delivery to customers due to strategic location
From the Port of Barranquilla, products can be transported to Panama by air in one hour and to Houston and Miami within two hours, within two days by sea to Panama and within four days by sea to Houston and Miami. Our ability to deliver our products on a timely basis complements the relatively low cost of shipping our products from Barranquilla to Florida and supports the value of our strategic location. As a result of this strategic location, we are able to meet the requirements of architectures and developers who seek to obtain building products on a schedule that does not interfere with their construction progress. As we target different projects and markets, we will seek to take advantage of our unique delivery capabilities to satisfy demands of the construction industry.
Products
The Company manufactures and sells the following products:
Soft Coat Glass - manufactured by depositing metal particles on the surface of the glass inside a vacuum chamber. This product offers excellent thermal insulation designed to improve energy efficiency of buildings.
Laminated/Thermo-Laminated Glass - produced by bonding two glass sheets with an intermediate film in-between. As a safety feature, this product fractures into small pieces if it breaks.
| 8 |
Thermo-Acoustic Glass - manufactured with two or more glass sheets separated by an aluminum or micro-perforated steel profile. This product has a double-seal system that ensures the unit’s tightness, buffering noise and improving thermal control. This product serves as an excellent noise barrier, which is used especially in zones close to airports, traffic or wherever there are unpleasant sounds.
Tempered Glass - glass subject to a tempering process through elevated temperatures resulting in greater superficial elasticity and resistance than conventional glass.
Silk-Screened Glass - special paint is applied to glass using automatic machinery and numerical control which ensures paint homogeneity and an excellent finish.
Curved Glass - produced by bending a flat glass sheet over a mold, using an automated heat process, which maintains the glass’ physical properties.
Digital Print Glass - digital printing allows any kind of appearance required by the client, offering versatility to projects.
The Company’s aluminum products sold through its Alutions brand include bars, plates, profiles, rods and tubes used primarily in the manufacture of architectural glass settings including windows, doors, spatial separators and similar products.
Curtain Wall / Floating facades - a non-structural window screen suspended outside a building and are available in many technical specifications for high performance required in high-rise buildings, resistant to strong winds and ensuring high quality standards.
Stick façade systems – are glass and aluminum façade elements fixed to the structure of the building and the glass and spandrel are inserted in the grid on site available in many combinations to define colors, thickness, glass types and finishes, and types of ventilation and design complements.
Windows and Doors - line of window and door products defined by the different types of glass finish, such as normal, impact resistant, hurricane-proof, safety, soundproof and thermal. Additionally, they are available in numerous structures, including fixed body, sliding windows, casement windows, hung windows, sliding doors and swinging doors.
Interior dividers and Commercial display windows - commercial and interior display windows with a broad range of profiles, colors and crystal finishes, as well as bathroom stall dividers, office cubicle separators and closets Products combine functionality, aesthetics and elegance and are available in a broad range of structures and materials.
Hurricane-proof windows - combine heavy-duty aluminum or vinyl frames with special laminated glass to provide protection from hurricane-force winds up to 180 mph and wind-borne debris by maintaining their structural integrity and preventing penetration by impacting objects.
Other – awnings, structures, automatic doors and other components of architectural systems.
Brands and Trademarks
Our main brands are Tecnoglass, ESWindows and Alutions. Our registered trademarks include “Alutions by Tecnoglass”, “ECOMAX by ESWINDOWS”, “Tecnobend”, “Tecnoair”, “ESWINDOWS Interiors”, “ESW Windows and Walls”, “Solartec by Tecnoglass”, “Prestige by ESWINDOWS”, “Eli by ESWINDOWS”, “Alessia by ESWINDOWS”.
Sales, Marketing and Customer Service
Sales and marketing
Our sales strategy primarily focuses on attracting and retaining customers by consistently providing exceptional customer service, leading product quality, and competitive pricing. Our customers also value our shorter lead times, knowledge of building code requirements and technical expertise, which collectively generate significant customer loyalty. Our products are marketed using a combination of internal sales representatives, independent sales representatives and directly to distributors. Our internal sales representatives receive a portion of their performance-based compensation based on sales and profitability metrics. We primarily market our products based on product quality, outstanding service, shorter lead times and on-time delivery.
We employ a highly efficient number of in-house sales employees. Some of our sales and marketing efforts are handled by area sales representatives who work on a commission basis.
We do not rely on significant traditional advertising expenditures to drive net sales. We have established and maintain credibility primarily through the strength of our products, our customer service and quality assurance, the speed at which we deliver finished products and the attractiveness of our pricing. Our advertising expenditures consist primarily of maintaining our subsidiaries’ websites.
| 9 |
Customer Service
We believe that our ability to provide customers outstanding service quality serves as a strong competitive differentiator. Our customer relationships are established and maintained through the coordinated efforts of our sales and production teams. We employ a highly responsive and efficient team of professionals devoted to addressing customer support with the goal of resolving any issue in a timely manner. In order to promote customer loyalty and employee development, we developed an employee training program with the primary objectives of educating our staff to be aware of client and supplier needs and familiarizing them with our strategic goals in order to improve the competitiveness, productivity and quality of all products offered.
Working Capital Requirements
Trade accounts receivable generated $2.5 million in 2017 as we increased our focus on collection efforts and experienced a more moderate revenue growth during the year, however, the principal use of cash has historically been related to trade accounts receivable which amounted to $26.0 million and $29.4 million during the years ended December 31, 2016 and 2015, respectively. Such use is directly correlated with the company´s ongoing growth and an industry related longer cash cycle during these years.
Another use of cash is related to purchases of inventory requirements are not as the Company builds up work in progress and finished product inventories commensurate with expected future sales. During 2016, the Company spent a fair amount of time and resources undertaking “lean manufacturing” best practices with and external consultant and as a result, it was able to better manage inventory levels and improve turnover during the year. A substantial amount of our working capital requirements are satisfied by cash generated from trade accounts payable, which generated $13.1 million more during the year ended December 31, 2017, compared with a use of $1.0 million during 2016 and $14.8 million generated in 2015. Purchase of inventories was the main use of cash in operating activities in 2017 as the Company builds up work in progress and finished product commensurate with expected future sales.
Customers
Our customers include architects, building owners, general contractors and glazing subcontractors in the commercial construction market. We have over 900 customers. Of our 100 most representative customers, which represent over 82% of our sales, about 56% are located in North America, 2% in Central America and the Caribbean, and 42% in South America. Only one customer, GM&P, accounted for more than 10% or more of our net sales during 2016 and 2015 with 26% and 14% of sales, respectively. On March 1, 2017 the Company entered into and consummated a purchase agreement with Giovanni Monti, the owner of 100% of the outstanding shares of GM&P. With the acquisition of GM&P, the Company has reduced its customer risk concentration as no single customer accounted for more than 10% of our revenues during the year ended December 31, 2017.
Backlog
We had combined outstanding orders of $499 million as of December 31, 2017 as compared to $396 million and $375 million as of December 31, 2016 and 2015, respectively. We do not believe that backlog is indicative of our future results of operations or prospects. Although we seek commitments from customers well in advance of shipment dates, actual confirmed orders are typically not received until close to the required shipment dates.
Materials and Suppliers
Our primary manufacturing materials include glass, ionoplast, polyvinyl butyral, and aluminum and vinyl extrusions. Although in some instances we have agreements with our suppliers, these agreements are generally terminable by us or the supplier counterparties on limited notice. Typically, all of our materials are readily available from a number of sources, and no supplier delays or shortages are anticipated.
We source raw materials and glass necessary to manufacture our products from a variety of domestic and foreign suppliers. During the year ended December 31, 2017 two suppliers individually accounted for more than 10% of total raw material purchases, which in aggregate represent 30% of raw material purchases . For the year ended December 31, 2016, three suppliers individually accounted for more than 10% of total raw material purchases, which in aggregate represent 38% of raw material purchases. For the year ended December 31, 2015, no single supplier accounted for more than 10% of raw material purchases.
Warranties
We offer product warranties which we believe are competitive for the markets in which our products are sold. The nature and extent of these warranties depend upon the product. Our standard warranties are generally from five to ten years for architectural glass, curtain wall, laminated and tempered glass, window and door products. Warranties are not priced or sold separately and do not provide the customer with services or coverages in addition to the assurance that the product complies with original agreed-upon specifications. In the event of a claim against a product for which we have received a warranty from the supplier, we transfer the claim back to the supplier. The Company evaluated historical information regarding claims for replacements under warranties and concluded that the costs that the Company has incurred in relation to these warranties have not been material.
| 10 |
Certifications
Among our many designations and certifications, Tecnoglass has earned the Miami-Dade County Notice of Acceptance (“NOA”), one of the most demanding certificates in the industry and a requirement to market hurricane-resistant glass in Florida. Tecnoglass’ products comply with Miami-Dade county’s safety code standards as its laminated anti-hurricane glass resists impact, pressure, water and wind. Tecnoglass is also the only company in Latin America authorized by PPG Industries and Guardian Industries to manufacture floating glass facades.
Our subsidiaries have received a number of other certifications from other national and international standard-setting bodies.
TG Certifications include:
| ● | NTC-1578 |
| ● | ASTM E774 1997 |
| ● | ISO 9001: 2008 Certificate of Quality Assurance |
| ● | ISO 14001: 2004 Certificate of Environmental Management |
| ● | Safety Glazing Certification Council (SGCC) for tempered and laminated glass: ANZI |
| ● | Z97 1-2004 |
| ● | International Glass Certification Council (IGCC) for insulated glass: ASTM E774 - 97 |
| ● | Pittsburgh Plate Glass (PPG) certified supplier |
| ● | Member of ACOLVISE (Colombia Association of Safety Glass Transformers) |
| ● | OHSAS 18001:2007. Occupational Health and Safety managament System |
ES Certifications include:
| ● | NTC-ISO 9001: 2008 Certificate of Quality Assurance |
| ● | NTC-ISO 14001: 2004 Certificate of Environmental Management |
| ● | Member of the American Architectural Manufacturers Association (AAMA) |
| ● | Complies with Miami-Dade County’s stringent safety code regulations for hurricane-proof windows |
Competitors
We have local and international competitors that also focus on glass and aluminum transformation, window ensemble and installation and designing in the commercial and residential construction markets. The US Market in which we compete is mainly comprised of manufacturers, distributors and installers of glass curtain walls, windows and doors for commercial and residential buildings. Based on external sources, we estimate that we capture 1% of the US consolidated market (manufacturing and services), which represents an attractive opportunity for further penetration. In Colombia, we are the leading producer of high end windows, with more than 33 years of experience in the glass and aluminum structure assembly market, capturing approximately 51% of the market share. The industry has a few well-known players and is mostly atomized and comprised of small competitors.
The key factors on which we and our competitors compete for business include: quality, price and reputation, breadth of products and service offerings, and production speed. We face intense competition from both smaller and larger market players who compete against us in our various markets including glass, window and aluminum manufacturing.
The principal methods of competition in the window and door industry are the development of long-term relationships with window and door distributors and dealers, and the retention of customers by delivering a full range of high-quality customized products on demand with short turnaround times while offering competitive pricing. The vertical integration of our operations, our geographic scope, low labor costs and economies of scale have helped our subsidiaries consolidate their leading position in Colombia and bolstered their expansion in the U.S. and other foreign markets.
| 11 |
Government Regulations
We are subject to extensive and varied federal, state and local government regulation in the jurisdictions in which we operate, including laws and regulations relating to our relationships with our employees, public health and safety and fire codes. Additionally, certain of the jurisdictions in which we operate require that installation of doors and windows be approved by competent authorities that grant distribution licenses. Although our business and facilities are subject to federal, state and local environmental regulation, environmental regulation does not have a material impact on our operations.
Also, we are subject to a potential revision of the United States-Colombia Free Trade Agreement (“USCOFTA”), which allows Colombian entities to export to USA without any tariffs. Mr. Donald Trump, US President, has made public announcements about the intention to re-negotiate certain terms of free trade agreements, which could potentially implement a tariff. However, the Company can mitigate this risk by transferring the price to its consumers and diversifying its business operations.
Research and Development
During the years ended December 31, 2017, 2016 and 2015, we spent approximately $2.4 million, $2.2 million and $2.0 million, respectively, in research and development. The Company incurs in costs related to the development of new products and pays for external tests that need to be performed on our products in order to comply with strict building codes. The Company is fully permitted to commercialize hurricane windows in the Miami-Dade County, Florida, which has one of the most demanding certifications in the world of window frames.
Employees
As of December 31, 2017, we had a total of 5,326 employees, none of whom is represented by a union. As of December 31, 2016, and 2015 we had a total of 5,853 employees and 5,399 employees, respectively. Most of our employees are hired through seven temporary staffing companies and are employed under one-year fixed-term employment contracts. During 2017 went through a employee reduction plan related to some projects that were delayed into 2018 since they had overhired to meet those projects. This lead to a total reduction in the work force, despite the GM&P acquisition, as GM&P subcontracts a portion of its operational work. Management believes it has good relations with our employees. We provide ongoing training programs to our employees through the self-established programs.
Company History
We were formed under the name “Andina Acquisition Corporation” as an exempted company incorporated in the Cayman Islands on September 21, 2011 in order to effect a merger, share exchange, asset acquisition, share purchase, recapitalization, reorganization or other similar business combination with one or more businesses or entities.
In March, 2012, we closed our IPO of 4,200,000 units, with each unit consisting of one ordinary share and one warrant to purchase one ordinary share at an exercise price of $8.00 per share, at an offering price of $10.00 per unit, generating total gross proceeds of $42,000,000. Simultaneously with the consummation of the IPO, we consummated a private placement of 4,800,000 warrants (“private warrants”) at a price of $0.50 per warrant and, to the underwriters, options to purchase an aggregate of 900,000 units at a price of $500,100, generating total proceeds of $2,900,100. After deducting the underwriting discounts and commissions and the offering expenses, the total net proceeds to us were $43,163,000 of which $42,740,000 was deposited into a trust account. The remaining proceeds of $423,000 became available to be used as working capital to provide for business, legal and accounting due diligence on prospective business combinations and continuing general and administrative expenses. The IPO was conducted pursuant to a registration statement on Form S-1 (Reg. No. 333-178061), that became effective on March 16, 2012.
From the consummation of our IPO until August 17, 2013, we were searching for a suitable target business to acquire. On August 17, 2013, we entered into an agreement and plan of reorganization, pursuant to which agreement, as amended, we acquired Tecnoglass Holding, Tecnoglass and ES as direct and indirect subsidiaries. On December 20, 2013, we held an extraordinary general meeting of our shareholders, at which our shareholders approved the Merger and other related proposals. On the same date, we closed the Merger and Tecnoglass Holding and its indirect, wholly-owned subsidiaries, Tecnoglass and ES, became our direct and indirect subsidiaries.
Tecnoglass Holding is a corporation formed under the laws of the Cayman Islands that was founded in 2014 in connection with the Merger. Tecnoglass is a corporation formed under the laws of Colombia that was founded in 1994 by Jose M. Daes, our Chief Executive Officer, and Christian T. Daes, our Chief Operating Officer. ES is a corporation formed under the laws of Colombia that was founded in 1984 by Jose M. Daes and Christian T. Daes.
At the closing of the Business Combination, 2,251,853 of the 4,200,000 public shares sold in our IPO were converted to cash at a conversion price of approximately $10.18 per share, or an aggregate of approximately $22.9 million of the approximately $42.7 million held in the trust account. As consideration for the Business Combination, we issued Energy Holding Corp., a holding company and sole shareholder of Tecnoglass Holding, of which former shareholders of TG and ES were the sole shareholders, an aggregate of 20,567,141 ordinary shares, or approximately 87% of the outstanding ordinary shares. Pursuant to the agreement and plan of reorganization, we also issued to Energy Holding Corp. an additional 500,000 ordinary shares upon the achievement of the specified EBITDA targets in the fiscal year ended December 31, 2014, 1,000,000 ordinary shares upon achievement of the specified EBITDA target in the fiscal year ended December 31, 2015 and 1,500,000 ordinary shares upon the achievement of the specified EBITDA target in the fiscal year ended December 31, 2016.
| 12 |
In connection with the Business Combination, we changed our name to “Tecnoglass Inc.” We also changed our fiscal year end from February 28 to December 31 in order to coincide with the fiscal year end of Tecnoglass Holding and its subsidiaries.
In 2014, we established two entities in South Florida, Tecno LLC and Tecno RE, to acquire manufacturing and sales-related assets to support sales and customer service in the United States.
In September 2016, we completed a warrant exchange whereby each warrant holder was given the opportunity to exchange 2.5 outstanding warrants for one ordinary share. As a result of the warrant exchange, 5,479,049 warrants, or 82% of the outstanding warrants were validly tendered. As of September 30, 2016, 1,275,823 warrants remained outstanding following completion of the warrant exchange referenced above. Of these, 1,265,842 warrants were exercised prior to the December 20, 2016 expiration, resulting in the issuance of 478,218 Tecnoglass common shares. The remaining unexercised warrants expired by their own terms on December 20, 2016.
As part of our strategy to vertically integrate our operations, on December 2, 2016 we acquired 100% of the equity of ESW LLC, for a total purchase price of $13.5 million. The acquisition was recorded retroactively starting from the first date of common control. Instead of using fair value, the Company consolidates the financial statements of the entity acquired using the existing carrying values.
On March 1, 2017 the Company acquired 100% of the outstanding shares of GM&P. The Company acquired all of the shares of GM&P for a purchase price of $35 million, of which the Company paid $6 million within the 60 days following the closing date and the remaining $29 million of the purchase price to be payable on or before May 2018 in cash, our ordinary shares or a combination of both, at our sole option.
Additional Information About the Company
We maintain websites for our subsidiaries, TG, ES and GM&P, which can be found at www.tecnoglass.com, www.energiasolarsa.com, and www.gmpglazing.com, respectively. The corporate filings of Tecnoglass Inc., including our Annual Reports on Form 10-K, our Quarterly Reports on Form 10-Q, our Current Reports on Form 8-K, our proxy statements and reports filed by our executive officers and directors under Section 16(a) of the Securities Exchange Act, and any amendments to those filings, are available free of charge on the Investor Relations page at investors.tecnoglass.com, which are updated as soon as reasonably practicable after we electronically file (or furnish in certain cases) such material with the Securities and Exchange Commission, and can also be found at the SEC’s website at http://sec.gov. We do not intend for information contained in either subsidiary website, including the Investor Relations pages, to be a part of this Form 10-K. Also, the public may read and copy any materials the Company files with the SEC at the SEC’ public reference room at 100 F St NE, Washington D.C, 20549 or by calling 1-800-SEC-0330.
| Item 1A. | Risk Factors. |
Risks Related to Our Business Operation
We operate in competitive markets, and our business could suffer if we are unable to adequately address potential downward pricing pressures and other factors that may reduce operating margins.
The principal markets that our subsidiaries serve are highly competitive. Competition is based primarily on the precision and range of achievable tolerances, quality, price and the ability to meet delivery schedules dictated by customers. Our competition comes from companies of various sizes, some of which have greater financial and other resources than we do and some of which have more established brand names in the markets that we serve. We currently compete with companies such as Viracon (a subsidiary within the Apogee Enterprises Inc. Group), PGT, Cardinal Glass and Oldcastle Glass among others in the U.S. Market and companies such as Vidrio Andino, Vitro, Vitelco and others in the Colombian and Latin American markets. Any of these competitors may foresee the course of market development more accurately than we will, develop products that are superior to ours, have the ability to produce similar products at a lower cost than us or adapt more quickly than we can to new technologies or evolving customer requirements. Increased competition could force us to lower our prices or to offer additional services at a higher cost to us, which could reduce gross profit and net income. Accordingly, we may not be able to adequately address potential downward pricing pressures and other factors, which consequently may adversely affect our financial condition and results of operations.
| 13 |
Failure to maintain the performance, reliability and quality standards required by our customers could have a materially negative impact on our financial condition and results of operation.
If our products or services have performance, reliability or quality problems, or products are installed with incompatible glazing materials, we may experience additional warranty and service expenses, reduced or canceled orders, diminished pricing power, higher manufacturing or installation costs or delays in the collection of accounts receivable. Additionally, performance, reliability or quality claims from our customers, with or without merit, could result in costly and time-consuming litigation that could require significant time and attention of management and involve significant monetary damages that could negatively affect our financial results.
The volatility of the cost of raw materials used to produce our products could materially adversely affect our results of operations in the future.
The cost of raw materials included in our products, including aluminum extrusion and polyvinyl butyral, are subject to significant fluctuations derived from changes in price or volume. A variety of factors over which we have no control, including global demand for aluminum, fluctuations in oil prices, speculation in commodities futures and the creation of new laminates or other products based on new technologies, impact the cost of raw materials which we purchase for the manufacture of our products. We quote our prices of aluminum products based on the price of aluminum in the London Metal Exchange plus a premium, and our suppliers of glass and polyvinyl butyral provide us with price lists that are updated annually, thus reducing the risk of changing prices for orders in the short term. While we may attempt to minimize the risk from severe price fluctuations by entering into aluminum forward contracts to hedge these fluctuations in the purchase price of aluminum extrusion we use in production, substantial, prolonged upward trends in aluminum prices could significantly increase the cost of our aluminum needs and have an adverse impact on our results of operations. If we are not able to pass on significant cost increases to our customers, our results in the future may be negatively affected by a delay between the cost increases and price increases in our products. Accordingly, the price volatility of raw materials could adversely affect our financial condition and results of operations in the future.
Regarding the recently proposed tariffs on aluminum imports by the current U.S. Administration, we are analyzing the possible effects that such reform would have on the company´s ongoing margins and profitability. At this point in time, it is still uncertain as to whether the tariffs would be imposed on raw materials or finished goods (as we estimate opposite effects based on the outcome). If only raw materials are impacted, we estimate that the Company would not have any negative effects as it does not export raw aluminum into the U.S. On the other hand, if finished goods were to be impacted, our products could be tagged with the estimated 10% tariff that would increase our product costs. We estimate that the net effect under the second scenario would be largely offset by the fact that with raw materials being tariffed, there would be an increase in overall aluminum prices, softening the effect of having a greater cost.
| 14 |
We depend on third-party suppliers for our raw materials and any failure of such third-party suppliers in providing raw materials could negatively affect our ability to manufacture our products.
Our ability to offer a wide variety of products to our customers depends on receipt of adequate material supplies from manufacturers and other suppliers. It is possible in the future that our competitors or other suppliers may create products based on new technologies that are not available to us or are more effective than our products at surviving hurricane-force winds and wind-borne debris or that they may have access to products of a similar quality at lower prices. We do not have contracts with the suppliers of our raw materials. We have a fixed set of maximum price rates, and from those prices we negotiate with the supplier of the material depending on the project. We source raw materials and glass necessary to manufacture our products from a variety of domestic and foreign suppliers. For the year ended December 31, 2017, two suppliers individually accounted for more than 10% of total raw material purchases, which in aggregate represent 31% of raw material purchases. Failures of third-party suppliers to provide raw materials to us in the future could have an adverse impact on our operating results or our ability to manufacture our products.
The home building industry and the home repair and remodeling sector are regulated and any increased regulatory restrictions could negatively affect our sales and results of operations.
The home building industry and the home repair and remodeling sector are subject to various local, state and federal statutes, ordinances, rules and regulations concerning zoning, building design and safety, hurricane and floods, construction, and similar matters, including regulations that impose restrictive zoning and density requirements in order to limit the number of homes that can be built within the boundaries of a particular area. Increased regulatory restrictions could limit demand for new homes and home repair and remodeling products, which could negatively affect our sales and results of operations. We may not be able to satisfy any future regulations, which consequently could have a negative effect on our sales and results of operations.
Changes in building codes could lower the demand for our impact-resistant windows and doors.
The market for our impact-resistant windows and doors depends in large part on our ability to satisfy state and local building codes that require protection from wind-borne debris. If the standards in such building codes are raised, we may not be able to meet such requirements, and demand for our products could decline. Conversely, if the standards in such building codes are lowered or are not enforced in certain areas, demand for impact-resistant products may decrease. If we are unable to satisfy future regulations, including building code standards, it could negatively affect our sales and results of operations. Further, if states and regions that are affected by hurricanes but do not currently have such building codes fail to adopt and enforce hurricane protection building codes, our ability to expand our business in such markets may be limited.
Equipment failures, delays in deliveries and catastrophic loss at any of our manufacturing facilities could lead to production curtailments or shutdowns that prevent us from producing our products.
An interruption in production capabilities at any of our facilities because of equipment failure or other reasons could result in our inability to produce our products, which would reduce our sales and earnings for the affected period. In addition, we generally manufacture our products only after receiving the order from the customer and thus do not hold large inventories. If there is a stoppage in production at our manufacturing facilities, even if only temporarily, or if they experience delays because of events that are beyond our control, delivery times could be severely affected. Any significant delay in deliveries to our customers could lead to increased product returns or cancellations and cause us to lose future sales. Our manufacturing facilities are also subject to the risk of catastrophic loss due to unanticipated events such as fires, explosions or violent weather conditions. If we experience plant shutdowns or periods of reduced production because of equipment failure, delays in deliveries or catastrophic loss, it could have a material adverse effect on our results of operations or financial condition. Further, we may not have adequate insurance to compensate for all losses that result from any of these events.
| 15 |
Our business involves complex manufacturing processes that may result in costly accidents or other disruptions of our operations in the future.
Our business involves complex manufacturing processes. Some of these processes involve high pressures, temperatures, hot metal and other hazards that present certain safety risks to workers employed at our manufacturing facilities. The potential exists for accidents involving death or serious injury. Although our management is highly committed to health and safety, since January 2014, two fatalities have occurred at our operations. The potential liability resulting from any such accident, to the extent not covered by insurance, could result in unexpected cash expenditures, thereby reducing the cash available to operate our business. Such an accident could disrupt operations at any of our facilities, which could adversely affect our ability to deliver products to our customers on a timely basis and to retain our current business.
Our results may not match our provided guidance or the expectations of securities analysts or investors, which likely would have an adverse effect on the market price of our securities.
Our results may fall below provided guidance and the expectations of securities analysts or investors in future periods. Our results may vary depending on a number of factors, including, but not limited to, fluctuating customer demand, delay or timing of shipments, construction delays or cancellations due to lack of financing for construction projects or market acceptance of new products. Manufacturing or operational difficulties that may arise due to quality control, capacity utilization of our production equipment or staffing requirements may also adversely affect annual net sales and operating results. Moreover, where we participate in fixed-price contracts for installation services, changes in timing of construction projects or difficulties or errors in their execution caused by us or other parties, could result in a failure to achieve expected results. In addition, competition, including new entrants into our markets, the introduction of new products by competitors, adoption of improved technologies by competitors and competitive pressures on prices of products and services, could adversely affect our results. Finally, our results may vary depending on raw material pricing, the potential for disruption of supply and changes in legislation that could have an adverse impact on labor or other costs. Our failure to meet our provided guidance or the expectations of securities analysts or investors would likely adversely affect the market price of our securities.
If new construction levels and repair and remodeling markets decline, such market pressures could negatively affect our results of operations.
The architectural glass industry is subject to the cyclical market pressures of the larger new construction and repair and remodeling markets. In turn, these larger markets may be affected by adverse changes in economic conditions such as demographic trends, employment levels, interest rates, commodity prices, availability of credit and consumer confidence, as well as by changing needs and trends in the markets, such as shifts in customers’ preferences and architectural trends. Any future downturn or any other negative market pressures could negatively affect our results of operations in the future, as margins may decrease as a direct result of an overall decrease in demand for our products. Additionally, we may have idle capacity which may have a negative effect in our cost structure.
We may be adversely affected by disruptions to our manufacturing facilities or disruptions to our customer, supplier or employee base.
Any disruption to our facilities resulting from weather-related events, fire, an act of terrorism or any other cause could damage a significant portion of our inventory, affect our distribution of products and materially impair our ability to distribute products to customers. We could incur significantly higher costs and longer lead times associated with distributing our products to customers during the time that it takes for us to reopen or replace a damaged facility. In addition, if there are disruptions to our customer and supplier base or to our employees caused by weather-related events, acts of terrorism or any other cause, our business could be temporarily adversely affected by higher costs for materials, increased shipping and storage costs, increased labor costs, increased absentee rates and scheduling issues. Any interruption in the production or delivery of our supplies could reduce sales of our products and increase costs.
| 16 |
Customer concentration and related credit, commercial and legal risk may adversely impact our future earnings and cash flows.
Our ten largest third-party customers worldwide collectively accounted for 49% of our total sales revenue for the year ended December 31, 2017, though no single customer accounted for more than 10% of annual revenues. We also do not have any long-term requirements contracts pursuant to which we would be required to fulfill customers on an as-needed basis.
Although the customary terms of our arrangements with customers require a significant upfront payment ranging between 30% and 70% of the cost of an order, if a large customer were to experience financial difficulty, or file for bankruptcy or similar protection, or if we were unable to collect amounts due from customers that are currently under bankruptcy or similar protection, it could adversely impact our results of operations, cash flows and asset valuations. Therefore, the risk we face in doing business with these customers may increase. Financial problems experienced by our customers could result in the impairment of our assets, a decrease in our operating cash flows and may also reduce or curtail our customers’ future use of our products and services, which may have an adverse effect on our revenues.
Disagreements between the parties can arise as a result of the scope and nature of the relationship and ongoing negotiations. Although we do not have any disputes with any major customers as of the date hereof that are expected to have a material adverse effect on our financial position, results of operations or cash flows, we cannot predict whether such disputes will arise in the future.
The nature of our business exposes each of our subsidiaries to product liability and warranty claims that, if adversely determined, could negatively affect our financial condition and results of operations and the confidence of customers in our products.
Our subsidiaries are, from time to time, involved in product liability and product warranty claims relating to the products they manufacture and distribute that, if adversely determined, could adversely affect our financial condition, results of operations and cash flows. In addition, they may be exposed to potential claims arising from the conduct of homebuilders and home remodelers and their sub-contractors. We may not be able to maintain insurance on acceptable terms or insurance may not provide adequate protection against potential liabilities in the future. Product liability claims can be expensive to defend and can divert the attention of management and other personnel for significant periods, regardless of the ultimate outcome. Claims of this nature could also have a negative impact on customer confidence in our products and us. We are not aware of any such claims at this time.
Our operations are subject to special hazards that may cause personal injury or property damage, subjecting us to liabilities and possible losses which may not be covered by insurance.
Operating hazards inherent in our business, some of which may be outside of our control, can cause personal injury and loss of life, damage to or destruction of property, plant and equipment and environmental damage. We maintain insurance coverage in amounts and against the risks we believe are consistent with industry practice, but this insurance may not be adequate or available to cover all losses or liabilities we may incur in our operations. Our insurance policies are subject to varying levels of deductibles. Losses up to our deductible amounts are accrued based upon our estimates of the ultimate liability for claims incurred and an estimate of claims incurred but not reported. However, liabilities subject to insurance are difficult to estimate due to unknown factors, including the severity of an injury, the determination of our liability in proportion to other parties, the number of incidents not reported and the effectiveness of our safety programs. If we were to experience insurance claims or costs above our estimates, we might also be required to use working capital to satisfy these claims.
| 17 |
We are subject to potential exposure to environmental liabilities and are subject to environmental regulation and any such liabilities or regulation may negatively affect our costs and results of operations in the future.
Our subsidiaries are subject to various national, state and local environmental laws, ordinances and regulations that are frequently changing and becoming more stringent. Although we believe that our facilities are in material compliance with such laws, ordinances and regulations, we cannot be certain that we will, at all times, be able to maintain compliance. Furthermore, as owners of real property, our subsidiaries can be held liable for the investigation or remediation of contamination on such properties, in some circumstances, without regard to whether we knew of or were responsible for such contamination. Remediation may be required in the future because of spills or releases of petroleum products or hazardous substances, the discovery of unknown environmental conditions, or more stringent standards regarding existing residual contamination. Environmental regulatory requirements may become more burdensome, increase our general and administrative costs, and increase the risk that our subsidiaries incur fines or penalties or be held liable for violations of such regulatory requirements.
Weather can materially affect our business and we are subject to seasonality.
Seasonal changes and other weather-related conditions can adversely affect our business and operations through a decline in both the use and production of our products and demand for our services. Adverse weather conditions, such as extended rainy and cold weather in the spring and fall, can reduce demand for our products and reduce sales or render our distribution operations less efficient. Major weather events such as hurricanes, tornadoes, tropical storms and heavy snows with quick rainy melts could adversely affect sales in the near term.
Construction materials production and shipment levels follow activity in the construction industry, which typically occurs in the spring, summer and fall. Warmer and drier weather during the second and third quarters typically result in higher activity and revenue levels during those quarters. The first quarter typically has lower levels of activity partially due to inclement weather conditions. The activity level during the second quarter varies greatly with variations in temperature and precipitation.
Our success depends upon our ability to develop new products and services, integrate acquired products and services and enhance existing products and services through product development initiatives and technological advances; any failure to make such improvements could harm our future business and prospects.
We have continuing programs designed to develop new products and to enhance and improve our existing products. We are expending resources for the development of new products in all aspects of our business, including products that can reach a broader customer base. Some of these new products must be developed due to changes in legislative, regulatory or industry requirements or in competitive technologies that render certain of our existing products obsolete or less competitive. The successful development of our products and product enhancements are subject to numerous risks, both known and unknown, including unanticipated delays, access to significant capital, budget overruns, technical problems and other difficulties that could result in the abandonment or substantial change in the design, development and commercialization of these new products. The events could have a materially adverse impact on our results of operations.
Given the uncertainties inherent with product development and introduction, including lack of market acceptance, we cannot provide assurance that any of our product development efforts will be successful on a timely basis or within budget, if at all. Failure to develop new products and product enhancements on a timely basis or within budget could harm our business and prospects. In addition, we may not be able to achieve the technological advances necessary for us to remain competitive, which could have a materially negative impact on our financial condition.
| 18 |
We are dependent on sales to customers outside Colombia and any failure to make these sales may adversely affect our operating results in the future.
In the year ended December 31, 2017, 80% of our sales were to customers outside Colombia, including to Panama and the U.S., and we expect sales into the U.S and other foreign markets to continue to represent a significant portion of our net sales. Foreign sales and operations are subject to changes in local government regulations and policies, including those related to tariffs and trade barriers, investments, property ownership rights, taxation, exchange controls and repatriation of earnings. An increase in tariffs on products shipped to countries like the U.S., which President Trump has indicated is possible, or changes in the relative values of currencies occur from time to time and could affect our operating results. This risk and the other risks inherent in foreign sales and operations could adversely affect our operating results in the future.
We are dependent on certain key personnel, the loss of whom could materially affect our financial performance and prospects in the future.
Our continued success depends largely upon the continued services of our senior management and certain key employees. Each member of our senior management teams has substantial experience and expertise in his or her industry and has made significant contributions to our growth and success. We face the risk, however, that members of our senior management may not continue in their current positions and the loss of the services of any of these individuals could cause us to lose customers and reduce our net sales, lead to employee morale problems and the loss of other key employees or cause disruptions to production. In addition, we may be unable to find qualified individuals to replace any senior executive officers who leave our employ or that of our subsidiaries.
Our results of operations could be significantly affected by foreign currency fluctuations and currency regulations.
20% of our revenues and 44% of our expenses are in Colombian pesos. The remainder of our expenses and revenues are denominated, priced and realized in U.S. dollars. Accordingly, we are subject to risks relating to fluctuations in currency exchange rates that may affect our sales, cost of sales, operating margins and cash flows. In the future, and especially as we further expand our sales in other markets, our customers may increasingly make payments in non-U.S. currencies. In addition, currency devaluation can result in a loss to us if we hold monetary assets in that currency. Hedging foreign currencies can be difficult and costly, especially if the currency is not actively traded. We cannot predict the effect of future exchange rate fluctuations on our operating results.
In addition, we are subject to risks relating to governmental regulation of foreign currency, which may limit our ability to:
| ● | transfer funds from or convert currencies in certain countries; | |
| ● | repatriate foreign currency received in excess of local currency requirements; and | |
| ● | repatriate funds held by foreign subsidiaries to the United States at favorable tax rates. |
As we continue to increase our operations in foreign countries, there is an increased risk that foreign currency controls may create difficulty in repatriating profits from foreign countries in the form of taxes or other restrictions, which could restrict our cash flow.
| 19 |
We have entered into significant transactions with affiliates or other related parties, which may result in conflicts of interest.
We have entered into transactions with affiliates or other related parties in the past and may do so again in the future. While we believe such transactions have been and will continue to be negotiated on an arm’s length basis, giving us a competitive advantage with vertical integration, there can be no assurance that such transactions could not give rise to conflicts of interest that could adversely affect our financial condition and results of operations.
The interests of our controlling shareholders could differ from the interests of our other shareholders.
Energy Holding Corporation exercises significant influence over us as a result of its majority shareholder position and voting rights. As of December 31, 2017, Energy Holding Corporation beneficially owned approximately 65.4
% of our outstanding ordinary shares. Energy Holding Corporation, in turn, is controlled by members of the Daes family, who together own 100% of the shares of Energy Holding Corporation. See “Principal Securityholders.” Accordingly, our controlling shareholders would have considerable influence regarding the outcome of any transaction that requires shareholder approval. In addition, if we are unable to obtain requisite approvals from Energy Holding Corporation, we may be prevented from executing critical elements of our business strategy.
We conduct all of our operations through our subsidiaries, and will rely on payments from our subsidiaries to meet all of our obligations and may fail to meet our obligations if our subsidiaries are unable to make payments to us.
We are a holding company and derive substantially all of our operating income from our subsidiaries. All of our assets are held by our subsidiaries, and we rely on the earnings and cash flows of our subsidiaries to meet our debt service obligations or dividend payments. The ability of our subsidiaries to make payments to us will depend on their respective operating results and may be restricted by, among other things, the laws of their jurisdiction of organization (which may limit the amount of funds available for distributions to us), the terms of existing and future indebtedness and other agreements of our subsidiaries, including their credit facilities, and the covenants of any future outstanding indebtedness we or our subsidiaries incur. If our subsidiaries are unable to declare dividends, our ability to meet debt service or dividend payments may be impacted. The ability of our subsidiaries in Colombia to declare dividends up to the total amount of their capital is not restricted by current laws, covenants in debt agreements or other agreements.
We may be adversely affected by any disruption in our information technology systems. Our operations are dependent upon our information technology systems, which encompass all of our major business functions.
A disruption in our information technology systems for any prolonged period could result in delays in receiving inventory and supplies or filling customer orders and adversely affect our customer service and relationships.
We rely on third party transportation, which subjects us to risks and costs that we cannot control, and which risks and costs may materially adversely affect our operations.
We rely on third party trucking companies to transport raw materials to the manufacturing facilities used by each of our businesses and, to a lesser degree, to ship finished products to customers. These transport operations are subject to various hazards and risks, including extreme weather conditions, work stoppages and operating hazards, as well as interstate transportation regulations. In addition, the methods of transportation we utilize may be subject to additional, more stringent and more costly regulations in the future. If we are delayed or unable to ship finished products or unable to obtain raw materials as a result of any such new regulations or public policy changes related to transportation safety, or these transportation companies fail to operate properly, or if there were significant changes in the cost of these services due to new or additional regulations, or otherwise, we may not be able to arrange efficient alternatives and timely means to obtain raw materials or ship goods, which could result in a material adverse effect on our revenues and costs of operations. Transportation costs represent a significant part of our cost structure. If our transportation costs increased substantially, due to prolonged increases in fuel prices or otherwise, we may not be able to control them or pass the increased costs onto customers, and our profitability would be negatively impacted.
| 20 |
The success of our business depends, in part, on our ability to execute on our acquisition strategy, to successfully integrate acquisitions and to retain key employees of our acquired businesses.
A significant portion of our historical growth has occurred through acquisitions and we will likely enter into acquisitions in the future. We may at any time be engaged in discussions or negotiations with respect to possible acquisitions, including transactions that would be significant to us. We regularly make, and we expect to continue to make, acquisition proposals, and we may enter into letters of intent for acquisitions. We cannot predict the timing of any contemplated transactions. To successfully finance such acquisitions, we may need to raise additional equity capital and indebtedness, which could increase our leverage level above our leverage level at the time of, and prior to the contemplated use of proceeds of, this offering. We cannot assure you that we will enter into definitive agreements with respect to any contemplated transactions or that transactions contemplated by any definitive agreements will be completed on time or at all. Our growth has placed, and will continue to place, significant demands on our management and operational and financial resources. Acquisitions involve risks that the businesses acquired will not perform as expected and that business judgments concerning the value, strengths and weaknesses of acquired businesses will prove incorrect.
Acquisitions may require integration of acquired companies’ sales and marketing, distribution, purchasing, finance and administrative organizations, as well as exposure to different legal and regulatory regimes in jurisdictions in which we have not previously operated. We may not be able to integrate successfully any business we may acquire or have acquired into our existing business, and any acquired businesses may not be profitable or as profitable as we had expected. Our inability to complete the integration of new businesses in a timely and orderly manner could increase costs and lower profits. Factors affecting the successful integration of acquired businesses include, but are not limited to, the following:
| ● | We may become liable for certain liabilities of any acquired business, whether or not known to us. These risks could include, among others, tax liabilities, product liabilities, asbestos liabilities, environmental liabilities, pension liabilities and liabilities for employment practices and they could be significant. | |
| ● | Substantial attention from our senior management and the management of the acquired business may be required, which could decrease the time that they have to service and attract customers. | |
| ● | The complete integration of acquired companies depends, to a certain extent, on the full implementation of our financial systems and policies. | |
| ● | We may actively pursue a number of opportunities simultaneously and we may encounter unforeseen expenses, complications and delays, including difficulties in employing sufficient staff and maintaining operational and management oversight. |
| 21 |
Risks Related to Colombia and Other Countries Where We Operate
Our operations are located in Colombia, which may make it more difficult for U.S. investors to understand and predict how changing market and economic conditions will affect our financial results.
Our operations are located in Colombia and, consequently, are subject to the economic, political and tax conditions prevalent in that country. The economic conditions in Colombia are subject to different growth expectations, market weaknesses and business practices than economic conditions in the U.S. market. We may not be able to predict how changing market conditions in Colombia will affect our financial results.
On December 2017, Standard & Poor’s rating agency lowered Colombia’s long term foreign currency sovereign credit rating from BBB to BBB- and Colombia’s long term local sovereign currency credit rating from BBB+ to BBB. The outlook for the country’s rating is stable, indicating it expects the political and economic policies to continue to procure macroeconomic stability and comply with the fiscal regulation.
Colombia’s economy, just like most of Latin-American countries, continues suffering from the effects of lower commodity prices, mainly oil, reflected in its elevated level of external debt. Even though the country has taken measures to stabilize the economy, it is uncertain how will these measures be perceived and if the intended goal of increasing investor’s confidence, achieved.
Economic and political conditions in Colombia may have an adverse effect on our financial condition and results of operations.
Our financial condition and results of operations depend significantly on macroeconomic and political conditions prevailing in Colombia. Decreases in the growth rate, periods of negative growth, increases in inflation, changes in law, regulation, policy, or future judicial rulings and interpretations of policies involving exchange controls and other matters such as (but not limited to) currency depreciation, availability of foreign currency, inflation, interest rates, taxation, employment and labor laws, banking laws and regulations and other political or economic developments in or affecting Colombia may affect the overall business environment and may, in turn, adversely impact our financial condition and results of operations in the future. Colombia’s fiscal deficit and growing public debt could adversely affect the Colombian economy.
The Colombian government frequently intervenes in Colombia’s economy and from time to time makes significant changes in monetary, fiscal and regulatory policy. Our business and results of operations or financial condition may be adversely affected by changes in government or fiscal policies, and other political, diplomatic, social and economic developments that may affect Colombia. We cannot predict what policies the Colombian government will adopt and whether those policies would have a negative impact on the Colombian economy or on our business and financial performance in the future. We cannot assure you as to whether current stability in the Colombian economy will be sustained. If the condition of the Colombian economy were to deteriorate, our financial condition and results of operations would be adversely affected.
The Colombian government and the Central Bank may seek to implement new policies aimed at controlling further fluctuation of the Colombian peso against the U.S. Dollar and fostering domestic price stability. The Central Bank may impose certain mandatory deposit requirements in connection with foreign-currency denominated loans obtained by Colombian residents, including TeTG and ES. We cannot predict or control future actions by the Central Bank in respect of such deposit requirements, which may involve the establishment of a different mandatory deposit percentage. The U.S. dollar/Colombian peso exchange rate has shown some instability in recent years.
On 2018, Congress and Presidential Elections will take place in Colombia. We cannot assure you that measures adopted by the Colombian government under its new regime continue to be consistent with former policy and will not affect the country´s overall economic outlook and performance. The new leaderthisp under the elected government may have negative effects on macroecnomic stability and therefore on the construction industry as a whole and finally, on the company´s operations and future prospects. Although we don´t estimate a significant effect in the short term based on current backlog and ongoing activity, it is uncertain as to how a new regime could affect our business in the longer term. In addition, we cannot predict the effects that such policies will have on the Colombian economy. In addition, we cannot assure you that the Colombian peso will not depreciate relative to other currencies in the future, which could have a materially adverse effect on our financial condition.
| 22 |
We are subject to regional and national economic conditions in the United States.
The economy in Florida and throughout the United States could negatively impact demand for our products as it has in the past, and macroeconomic forces such as employment rates and the availability of credit could have an adverse effect on our sales and results of operations. Our U.S. business is concentrated geographically in Florida. Focusing operations into manufacturing locations in Florida optimizes manufacturing efficiencies and logistics, but such a focus further concentrates our business, and another prolonged decline in the economy of the state of Florida or of nearby coastal regions, a change in state and local building code requirements for hurricane protection, or any other adverse condition in the state or certain coastal regions, could cause a decline in the demand for our products, which could have an adverse impact on our sales and results of operations. Our strategy of continued geographic diversification seeks to reduce our exposure to such region-specific risks.
Economic instability in Colombia could negatively affect our ability to sell our products.
A significant decline in economic growth of any of Colombia’s major trading partners - in particular, the United States, China, Brazil and Venezuela - could have a material adverse effect on each country’s balance of trade and economic growth. In addition, a “contagion” effect, where an entire region or class of investments becomes less attractive to, or subject to outflows of funds by, international investors could negatively affect the Colombian economy.
The 2008 global economic and financial crisis, which began in the U.S. financial system and spread to different economic sectors and countries around the world, had negative effects on the Colombian economy. During 2009, the economies of the United States and most major European countries contracted, which, in turn, affected the Colombian economy. The economic recovery in the U.S. since 2013 has been fragile and at lower rates than in the past recoveries. Several European Union countries have been obliged to severely reduce their public expenditures due to their high indebtedness, which has severely affected the Eurozone’s economic growth. The ability of governments and companies in certain countries, such as Greece, Italy, Portugal, and Spain to repay their debt obligations or remain in the euro currency system remains uncertain. In addition, certain events, such as the outbreak of civil and political unrest in several countries in Africa and the Middle East, including, Libya, Syria, Iraq, and Yemen, might further strain and adversely affect the global economy and the global financial system.
Even though exports from Colombia, principally petroleum and petroleum products, and gold, have grown in recent years, fluctuations in commodity prices pose a significant challenge to their contribution to the country’s balance of payments and fiscal revenues. Unemployment continues to be high in Colombia compared to other economies in Latin America. Furthermore, recent political and economic actions in the Latin American region, including actions taken by the Argentine and Venezuelan governments, may negatively affect international investor perception of the region. We cannot assure you that growth achieved over the past decade by the Colombian economy will continue in future periods. The long-term effects of the global economic and financial crisis on the international financial system remain uncertain. In addition, the effect on consumer confidence of any actual or perceived deterioration of household incomes in the Colombian economy may have a material adverse effect on our results of operations and financial condition.
| 23 |
Political conditions in the United States may adversely affect our results of operations and financial condition.
The Colombian economy and the market value of securities issued by Colombian issuers and issuers with operations in Colombia may be, to varying degrees, affected by economic and market conditions in other emerging market countries and in the United States. Furthermore, economic conditions in Colombia are correlated with economic conditions in the United States as a result, among other things, of the United States-Colombia Free Trade Agreement (“USCOFTA”), and increased economic activity between the two countries. President Trump has made public announcements about the intention to re-negotiate certain terms of free trade agreements, but the content of any potential revisions has not been specified. For example, President Trump has stated that if Canada and Mexico do not agree to re-negotiate the North America Free Trade Agreement (“NAFTA”), the United States may withdraw from NAFTA. However, there can be no assurance as to what the U.S. administration will do, and the impact of these measures or any others adopted by the U.S. administration cannot be predicted.
On December 20, 2017, the Tax Cuts and Jobs Act (the “2017 Act”) was signed into law which reduces the federal corporate tax rate from 35% to 21%. As only a portion of our operations are in the U.S. our competitors in the U.S. market might be benefited more than us.
For the year ended December 31, 2017, 76% of our net operating revenue resulted from sales in the U.S. Adverse economic conditions in the United States, the termination or re-negotiation of free trade agreements, including USCOFTA, or other related events could have an adverse effect on the Colombian economy. Although economic conditions in other emerging market countries and in the United States may differ significantly from economic conditions in Colombia, investors’ reactions to developments in other countries may have an adverse effect on the market value of securities of Colombian assets. There can be no assurance that future developments in other emerging market countries and in the United States, over which we have no control, will not have a material adverse effect on our liquidity or our ability to service our debt.
Colombia has experienced and continues to experience internal security issues that have had or could have a negative effect on the Colombian economy and our financial condition
Colombia has experienced and continues to experience internal security issues, primarily due to the activities of guerrilla groups, such as the Revolutionary Armed Forces of Colombia (Fuerzas Armadas Revolucionarias de Colombia, or “FARC”) and the National Liberation Army (Ejercito de Liberación Nacional, or “ELN,”) paramilitary groups and drug cartels. In remote regions of the country with minimal governmental presence, these groups have exerted influence over the local population and funded their activities by protecting, and rendering services to, drug traffickers. Even though the Colombian government’s policies have reduced guerilla presence and criminal activity, particularly in the form of terrorist attacks, homicides, kidnappings and extortion, such activity persists in Colombia, and possible escalation of such activity and the effects associated with them have had and may have in the future a negative effect on the Colombian economy and on us, including on our customers, employees, results of operations and financial condition. The Colombian government commenced peace talks with the FARC in August 2012, and peace negotiations with the ELN began in November 2016. The Colombian government and the FARC signed a peace deal on September 26, 2016, which was amended after voters rejected it in the referendum held on October 2, 2016. The new agreement was signed on November 24, 2016 and was ratified by the Colombian Congress on November 30, 2016 and is being implemented after four years of negotiations. The new deal clarifies protection to private property, it is expected to increase government’s presence in rural areas and bans former rebels from running for office in certain newly created congressional districts in post-conflict zones. As a result, during the transition process, Colombia may experience an increase in internal security issues, and drug-related crime and guerilla and paramilitary activities, which may have a negative impact on the Colombian economy. Our business or financial condition could be adversely affected by rapidly changing economic or social conditions, including the Colombian government’s response to implementation of the agreement with FARC and ongoing peace negotiations, if any, which may result in legislation that increases the tax burden of Colombian companies.
| 24 |
Tensions with neighboring countries, including Venezuela and other Latin American countries such as Nicaragua may affect the Colombian economy and, consequently, our results of operations and financial condition in the future.
Diplomatic relations with Venezuela, one of Colombia’s main trading partners and neighboring countries, have from time to time been tense and affected by events surrounding the Colombian armed forces, particularly on Colombia’s borders with Venezuela and Ecuador. Moreover, in November 2012, the International Court of Justice placed a sizeable area of the Caribbean Sea within Nicaragua’s exclusive economic zone. Until then, Colombia had deemed this area as part of its own exclusive economic zone. A worsening of diplomatic relations between Colombia and Nicaragua involving the disputed waters could result in the Nicaraguan government taking measures, or a reaction among the Nicaraguan public, which is detrimental to Colombian-owned interests in that country. Any future deterioration in relations with Venezuela, Ecuador and Nicaragua may result in the closing of borders, the imposition of trade barriers or a breakdown of diplomatic ties, any of which could have a negative effect on Colombia’s trade balance, economy and general security situation, which may adversely affect our results of operations and financial condition.
Government policies and actions, and judicial decisions, in Colombia could significantly affect the local economy and, as a result, our results of operations and financial condition in the future.
Our results of operations and financial condition may be adversely affected by changes in Colombian governmental policies and actions, and judicial decisions, involving a broad range of matters, including interest rates, exchange rates, exchange controls, inflation rates, taxation, banking and pension fund regulations and other political or economic developments affecting Colombia. The Colombian government has historically exercised substantial influence over the economy, and its policies are likely to continue to have a significant effect on Colombian companies, including our subsidiaries. The president of Colombia has considerable power to determine governmental policies and actions relating to the economy, and may adopt policies that negatively affect our subsidiaries. Future governmental policies and actions, or judicial decisions, could adversely affect our results of operations or financial condition.
Changes in Colombia’s customs, import and export laws and foreign policy, may have an adverse effect on our financial condition and results of operations.
Our business depends significantly on Colombia’s customs and foreign exchange laws and regulations, including import and export laws, as well as on fiscal and foreign policies. In the past we have benefited from, and currently benefit from, certain customs and tax benefits granted by Colombian laws, such as free trade zones and Plan Vallejo which incentivates the import of machinery and equipment by providing tax breaks, as well as from Colombian foreign policy, such as free trade agreements with countries like the U.S. As a result, our business and results of operations or financial condition may be adversely affected by changes in government or fiscal policies, foreign policy or customs and foreign exchange laws and regulations. We cannot predict what policies the Colombian government will adopt and whether those policies would have a negative impact on the Colombian economy or on our business and financial performance in the future.
| 25 |
New or higher taxes resulting from changes in tax regulations or the interpretation thereof in Colombia could adversely affect our results of operations and financial condition in the future.
New tax laws and regulations, and uncertainties with respect to future tax policies, pose risks to us. In recent years, the Colombian Congress approved different tax reforms imposing additional taxes in a variety of areas, such as taxes on financial transactions, wealth taxes and taxes on dividends. Changes in tax-related laws and regulations, and interpretations thereof, can affect tax burdens by increasing tax rates and fees, creating new taxes, limiting tax deductions, and eliminating tax-based incentives and non-taxed income. In addition, tax authorities or courts may interpret tax regulations differently than we do, which could result in tax litigation and associated costs and penalties. In December 2012, the Colombian Congress approved a number of tax reforms that took effect on January 1, 2013. These changes include, among others, VAT rate consolidation, a reduction in the corporate income tax rate, changes to transfer pricing rules, the creation of a new special corporate income tax (CREE tax), new “thin capitalization” rules and a reduction of social contributions paid by certain employees. In December 2014, the Colombian Congress approved a number of significant tax reforms that took effect on January 1, 2015. These changes include among others, the creation of a net wealth tax for fiscal years 2015 through 2017 for both resident/domiciled entities and foreign non-resident/non-domiciled entities holding wealth in Colombia. Furthermore, in December 2016, the Colombian Congress approved a new “structural tax reform” that took effect on January 1, 2017. These changes include, among others, a reduction corporate income tax from 42% to 40% for fiscal year 2017, 37% in 2018 and 33% in 2019 and thereafter. removal of the tax rule that established the progressive clearance of the financial transactions tax, setting it as permanent, VAT rate increase, elimination of the special corporate income tax (CREE tax) and a corresponding increase of the corporate income tax rate, changes to the withholding tax rates on foreign payments, modifications and limitations of tax deductibility, introduction of Control Foreign Corporations (CFC) rules, introduction of International Financial Reporting Standards (IFRS) as a base for determining taxable basis for income tax purposes, taxation on dividends, and changes to the individual income tax rules, among others. We have not seen yet the effects of the tax reform, but we cannot assure its potential effects on our results and how it could affect our clients and operations.
The Company files income tax returns for TG and ES in the Republic of Colombia. On December 28, 2016, the Colombian congress enacted a structural tax reform that took effect on January 1, 2017 which reduces corporate income tax from 42% to 40% for fiscal year 2017, 37% in 2018 and 33% in 2019 and thereafter. As a result of the Colombian tax reform from December 28, 2016, the Company’s net deferred tax liability decreased $586 as of December 31, 2016.
Natural disasters in Colombia could disrupt our business and affect our results of operations and financial condition in the future.
Our operations are exposed to natural disasters in Colombia, such as earthquakes, volcanic eruptions, tornadoes, tropical storms and hurricanes. Heavy rains in Colombia, attributable in part to the La Niña weather pattern, have resulted in severe flooding and mudslides. La Niña is a recurring weather phenomenon, and it may contribute to flooding, mudslides or other natural disasters on an equal or greater scale in the future. In the event of a natural disaster, our disaster recovery plans may prove to be ineffective, which could have a material adverse effect on its ability to conduct our businesses. In addition, if a significant number of our employees and senior managers were unavailable because of a natural disaster, our ability to conduct our businesses could be compromised. Natural disasters or similar events could also result in substantial volatility in our results of operations for any fiscal quarter or year.
Risks Related to Us and Our Securities
Because we are incorporated under the laws of the Cayman Islands, you may face difficulties in protecting your interests, and your ability to protect your rights through the U.S. Federal courts may be limited.
We are a company incorporated under the laws of the Cayman Islands, and substantially all of our assets are located outside the United States. In addition, a majority of our directors and officers are nationals or residents of jurisdictions other than the United States and all or substantial portions of their assets are located outside the United States. As a result, it may be difficult for investors to effect service of process within the United States upon our directors or executive officers, or enforce judgments obtained in the United States courts against our directors or officers.
| 26 |
Our corporate affairs are governed by our third amended and restated memorandum and articles of association, the Companies Law (2013 Revision) of the Cayman Islands (as the same may be supplemented or amended from time to time) and the common law of the Cayman Islands. The rights of shareholders to take action against the directors, actions by minority shareholders and the fiduciary responsibilities of our directors to us under Cayman Islands law are largely governed by the common law of the Cayman Islands. The common law of the Cayman Islands is derived in part from comparatively limited judicial precedent in the Cayman Islands as well as from English common law, the decisions of whose courts are of persuasive authority, but are not binding on a court in the Cayman Islands. The rights of our shareholders and the fiduciary responsibilities of our directors under Cayman Islands law are different from what they would be under statutes or judicial precedent in some jurisdictions in the United States. In particular, the Cayman Islands has a different body of securities laws as compared to the United States, and certain states, such as Delaware, may have more fully developed and judicially interpreted bodies of corporate law. In addition, Cayman Islands companies may not have standing to initiate a shareholders derivative action in a Federal court of the United States.
We have been advised by our Cayman Islands legal counsel, Maples and Calder, that the courts of the Cayman Islands are unlikely (i) to recognize or enforce against us judgments of courts of the United States predicated upon the civil liability provisions of the securities laws of the United States or any State; and (ii) in original actions brought in the Cayman Islands, to impose liabilities against us predicated upon the civil liability provisions of the securities laws of the United States or any State, so far as the liabilities imposed by those provisions are penal in nature. In those circumstances, although there is no statutory enforcement in the Cayman Islands of judgments obtained in the United States, the courts of the Cayman Islands will recognize and enforce a foreign money judgment of a foreign court of competent jurisdiction without retrial on the merits based on the principle that a judgment of a competent foreign court imposes upon the judgment debtor an obligation to pay the sum for which judgment has been given provided certain conditions are met. For a foreign judgment to be enforced in the Cayman Islands, such judgment must be final and conclusive and for a liquidated sum, and must not be in respect of taxes or a fine or penalty, inconsistent with a Cayman Islands judgment in respect of the same matter, impeachable on the grounds of fraud or obtained in a manner, and or be of a kind the enforcement of which is, contrary to natural justice or the public policy of the Cayman Islands (awards of punitive or multiple damages may well be held to be contrary to public policy). A Cayman Islands Court may stay enforcement proceedings if concurrent proceedings are being brought elsewhere. There is recent Privy Council authority (which is binding on the Cayman Islands Court) in the context of a reorganization plan approved by the New York Bankruptcy Court which suggests that due to the universal nature of bankruptcy/insolvency proceedings, foreign money judgments obtained in foreign bankruptcy/insolvency proceedings may be enforced without applying the principles outlined above. However, a more recent English Supreme Court authority (which is highly persuasive but not binding on the Cayman Islands Court), has expressly rejected that approach in the context of a default judgment obtained in an adversary proceeding brought in the New York Bankruptcy Court by the receivers of the bankruptcy debtor against a third party, and which would not have been enforceable upon the application of the traditional common law principles summarized above and held that foreign money judgments obtained in bankruptcy/insolvency proceedings should be enforced by applying the principles set out above, and not by the simple exercise of the Courts’ discretion. Those cases have now been considered by the Cayman Islands Court. The Cayman Islands Court was not asked to consider the specific question of whether a judgment of a bankruptcy court in an adversary proceeding would be enforceable in the Cayman Islands, but it did endorse the need for active assistance of overseas bankruptcy proceedings. We understand that the Cayman Islands Court’s decision in that case has been appealed and it remains the case that the law regarding the enforcement of bankruptcy/insolvency related judgments is still in a state of uncertainty.
| 27 |
Risks Related to Ownership of our Ordinary Shares
Our ordinary share price may change significantly, and you may not be able to resell shares of our ordinary shares at or above the price you paid or at all, and you could lose all or part of your investment as a result.
The stock market recently has experienced significant volatility. This volatility often has been unrelated or disproportionate to the operating performance of particular companies. You may not be able to resell your shares at or above the offering price due to a number of factors such as those listed in “—Risks Related to Our Business and Our Industry” and the following:
| ● | results of operations that vary from the expectations of securities analysts and investors; | |
| ● | results of operations that vary from those of our competitors; | |
| ● | changes in expectations as to our future financial performance, including financial estimates and investment recommendations by securities analysts and investors; | |
| ● | announcements by us or our competitors of significant contracts, new products, acquisitions, joint marketing relationships, joint ventures, other strategic relationships or capital commitments; | |
| ● | changes in general economic or market conditions or trends in our industry or markets; | |
| ● | future sales of our ordinary shares or other securities; | |
| ● | changes in business or regulatory conditions; | |
| ● | the public’s response to press releases or other public announcements by us or third parties, including our filings with the SEC; | |
| ● | guidance, if any, that we provide to the public, any changes in this guidance or our failure to meet this guidance; | |
| ● | the development and sustainability of an active trading market for our stock; | |
| ● | other events or factors, including those resulting from natural disasters, war, acts of terrorism or responses to these events |
These broad market and industry fluctuations may adversely affect the market price of our ordinary shares, regardless of our actual operating performance. In addition, price volatility may be greater if the public float and trading volume of our ordinary shares is low.
In the past, following periods of market volatility, stockholders of public companies have often instituted securities class action litigation. If we were involved in securities litigation, it could have a substantial cost and divert resources and the attention of executive management from our business regardless of the outcome of such litigation.
| 28 |
We are a “controlled company,” controlled by Energy Holding Corp., whose interest in our business may be different from ours or yours.
We are a “controlled company” within the meaning of NASDAQ listing standards. Under these rules, a company of which more than 50% of the voting power is held by an individual, a group or another company is a “controlled company” and may elect not to comply with certain corporate governance requirements of NASDAQ, including (i) the requirement that a majority of the board of directors consist of independent directors, (ii) the requirement that we have a nominating and corporate governance committee that is composed entirely of independent directors with a written charter addressing the committee’s purpose and responsibilities and (iii) the requirement that we have a compensation committee that is composed entirely of independent directors with a written charter addressing the committee’s purpose and responsibilities. Although we meet the definition of a “controlled company,” we have determined at this time not to take advantage of this designation and comply with all the corporate governance rules applicable to listed companies that are not controlled companies. We may, however, determine to take advantage of these exemptions in the future. If we did, you would not have the same protections afforded to stockholders of companies subject to all of the corporate governance requirements of NASDAQ.
We cannot assure you that we will continue to pay dividends on our ordinary shares, and our indebtedness could limit our ability to continue to pay dividends on our ordinary shares.
Prior to April 2015, we had not paid any cash dividends on our ordinary shares. Since such time, we have paid regular quarterly dividends. We intend to continue to pay cash dividends on our ordinary shares, subject to our compliance with applicable law, and depending on, among other things, our results of operations, financial condition, level of indebtedness, capital requirements, contractual restrictions, restrictions in our debt agreements and in any preferred stock, business prospects and other factors that our Board of Directors may deem relevant. However, the payment of any future dividends will be at the discretion of our Board of Directors and there can be no assurance that we will continue to pay dividends in the future. For more information, see “Dividend Policy.”
| Item 1B. | Unresolved Staff Comments. |
Not Applicable.
| 29 |
| Item 2. | Properties. |
We own and operate a 2.7 million square foot manufacturing complex located in Barranquilla, Colombia. This manufacturing campus houses a glass production plant, aluminum plant and window and facade assembly plant. The glass plant has four lamination machines with independent assembly rooms, six specialized tempering furnaces and glass molding furnaces, a computer numerical-controlled profile bending machine, as well as five silk-screening machines. The Alutions plant has an effective installed capacity of 1,000 tons per month and can create a variety of shapes and forms for windows, doors and related products. We also own three natural gas power generation plants with a capacity of 1,750 kilowatts each which supply the electricity requirements of the entire manufacturing complex and are supported by three emergency generators. We also own and operate a 123,399 square foot manufacturing and warehousing facility in a 215,908 square foot lot size in Miami-Dade County, Florida, United States. The facility houses manufacturing and assembly equipment, warehouse space, and administrative and sales offices.
We believe that our existing properties are adequate for the current operating requirements of our business and that additional space will be available as needed.
| Item 3. | Legal Proceedings. |
From time to time, the Company is involved in legal matters arising in the regular course of business. Some disputes are derived directly from our construction projects, related to supply and installation, and even though deemed ordinary, they may involve significant monetary damages. We are also subject to other type of litigations arising from employment practices, worker’s compensation, automobile claims and general liability. It is very difficult to predict precisely what the outcome of these litigations might be. However, with the information at out disposition as this time, there are no indications that such claims will result in a material adverse effect on the business, financial condition or results of operations of the Company.
| Item 4. | Mine Safety Disclosures. |
Not Applicable.
| 30 |
| Item 5. | Market for Registrant’s Common Equity, Related Stockholder Matters and Issuer Purchases of Equity Securities. |
Market Information
Our ordinary shares are listed on the NASDAQ Capital Market under the symbol TGLS. Effective January 6, 2016, the Company’s shares also commenced trading on the Bolsa de Valores de Colombia (“BVC”), the principal stock exchange of Colombia, under the symbol TGLSC. The listing of the Company’s shares on the BVC is secondary to the primary listing on the NASDAQ Market. No new shares were issued in connection with the admission to trading on the BVC.
The following table sets forth the high and low sales prices for our ordinary shares for the periods indicated below and starting from the first quarter of 2015.
| Ordinary
Shares | ||||||||
| Period | High | Low | ||||||
| Fiscal 2018: | ||||||||
| First Quarter* | $ | 9.88 | $ | 7.06 | ||||
| Fiscal 2017: | ||||||||
| Fourth Quarter | $ | 8.34 | $ | 6.70 | ||||
| Third Quarter | $ | 9.55 | $ | 5.50 | ||||
| Second Quarter | $ | 11.00 | $ | 9.00 | ||||
| First Quarter | $ | 12.34 | $ | 10.57 | ||||
| Fiscal 2016: | ||||||||
| Fourth Quarter | $ | 12.70 | $ | 10.87 | ||||
| Third Quarter | $ | 12.93 | $ | 10.20 | ||||
| Second Quarter | $ | 12.49 | $ | 10.25 | ||||
| First Quarter | $ | 14.30 | $ | 9.82 | ||||
| Fiscal 2015: | ||||||||
| Fourth Quarter | $ | 15.59 | $ | 13.05 | ||||
| Third Quarter | $ | 15.95 | $ | 12.39 | ||||
| Second Quarter | $ | 13.74 | $ | 8.50 | ||||
| First Quarter | $ | 10.73 | $ | 9.16 | ||||
* Through March 1, 2018.
| 31 |
Comparative Stock Performance
The following graph compares the cumulative total shareholder return for Tecnoglass, Inc. Ordinary Shares on a $100 investment for the last five fiscal years with the cumulative total return on a $100 investment in the Standard & Poor’s Small Cap 600 Growth Index and the Russell 2000 Index. The graph assumes an investment at the close of trading on December 31, 2013, and also assumes the shareholder opted for share dividends during all periods.
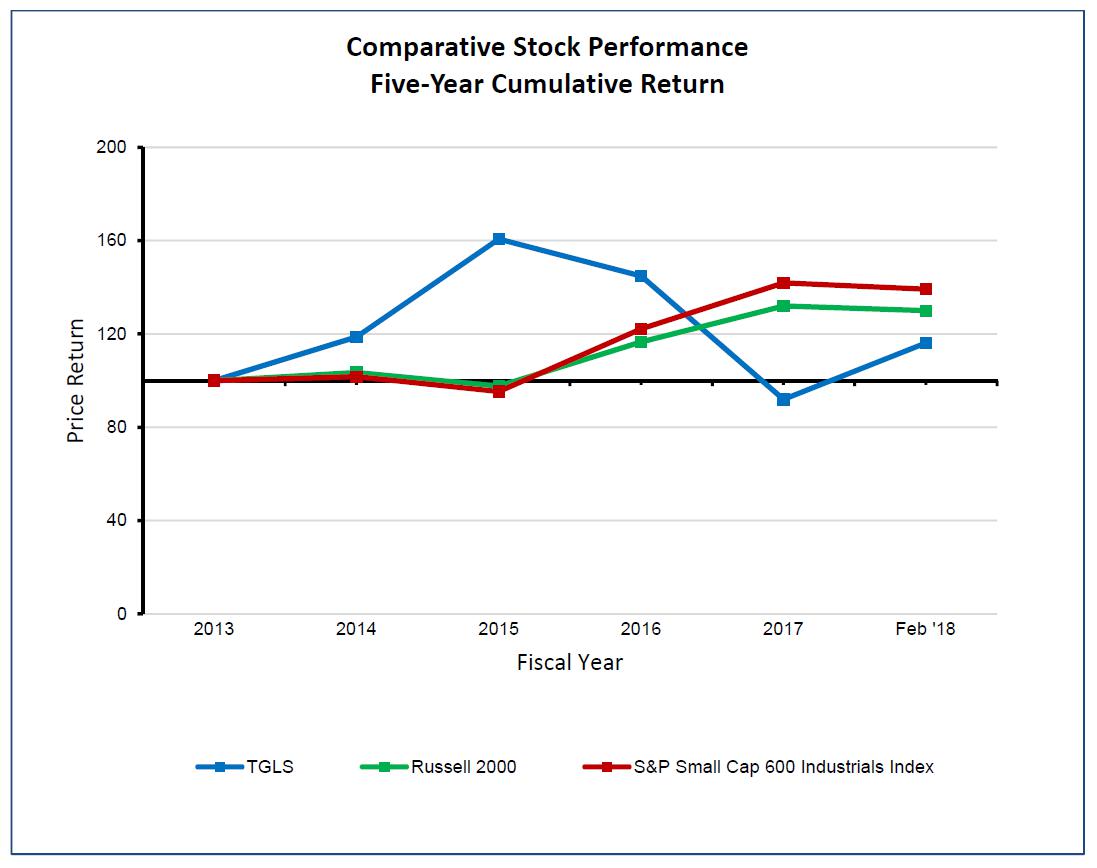
| 32 |
Holders
As of December 31, 2017, there were 330 holders of record of our ordinary shares.
Dividends
In August 2016, the Company’s Board of Directors authorized the payment of four regular quarterly dividends at a quarterly rate of $0.125 per share, or $0.50 per share on an annual basis. Subsequently, beginning with dividends paid to the holders of record at June 30, 2017 were increased to $0.14 per share, or $0.56 per share on an annual basis. The dividend is declared to be paid in the form of cash or ordinary shares at the option of record date shareholders during an election period shortly after the record date. The following table summarizes the dividends paid by the Company:
| Fiscal 2017: | ||||
| Fourth Quarter | $ | 0.14 | ||
| Third Quarter | $ | 0.14 | ||
| Second Quarter | $ | 0.125 | ||
| First Quarter | $ | 0.125 | ||
| Fiscal 2016: | ||||
| Fourth Quarter | $ | 0.125 | ||
| Third Quarter | $ | 0.125 | ||
| Second Quarter | $ | - | ||
| First Quarter | $ | - | ||
| Fiscal 2015: | ||||
| Fourth Quarter | $ | - | ||
| Third Quarter | $ | - | ||
| Second Quarter | $ | - | ||
| First Quarter | $ | - | ||
The dividends indicated above were paid to the holder of record on dates close to the end of the above referenced quarter, however, the dividend payments were made during the quarter immediately after.
Purchases of Equity Securities by Issuer and Affiliates
No purchases of our equity securities have been made by us or affiliated purchasers within the fourth quarter of the fiscal year ended December 31, 2017.
Information about our equity compensation plans
Information required by Item 5 of Form 10K regarding equity compensation plans is incorporated herein by reference to Item 12 of Part III of this Annual Report on Form 10-K.
| 33 |
| Item 6. | Selected Financial Data. |
The following Selected Financial Data should be read in conjunction with Management’s Discussion and Analysis of Financial Condition and Results of Operations, included in Item 7 of this Report, and our consolidated financial statements and related notes, included herein by reference.
| Years ended December 31, | ||||||||||||||||||||
| 2017 | 2016 | 2015 | 2014 (1) | 2013 (1) | ||||||||||||||||
| Net Revenue | $ | 314,456 | $ | 305,016 | $ | 242,239 | $ | 210,579 | $ | 195,812 | ||||||||||
| Cost of Sales | 215,274 | 192,369 | 151,381 | 139,647 | 136,718 | |||||||||||||||
| Gross profit | 99,182 | 112,647 | 90,858 | 70,932 | 59,094 | |||||||||||||||
| Operating Expenses | 64,818 | 64,799 | 51,267 | 41,751 | 30,635 | |||||||||||||||
| Operating Income | 34,364 | 47,848 | 39,591 | 29,181 | 28,459 | |||||||||||||||
| Other Expenses and losses, net | (28,639 | ) | 24,668 | 50,611 | 17,718 | 2,837 | ||||||||||||||
| Net Income (loss) | 5,725 | 23,180 | (11,020 | ) | 11,463 | 25,622 | ||||||||||||||
| Net Income (loss) attributable to parent | 5,449 | 23,180 | (11,020 | ) | 11,463 | 25,622 | ||||||||||||||
| Basic earnings per share | 0.16 | 0.75 | (0.38 | ) | 0.44 | 1.15 | ||||||||||||||
| Diluted earnings per share | 0.16 | 0.72 | (0.38 | ) | 0.38 | 1.12 | ||||||||||||||
| Current Assets | 261,898 | 210,736 | 171,167 | 138,025 | 158,774 | |||||||||||||||
| Total Assets | 468,000 | 394,730 | 321,411 | 253,849 | 253,386 | |||||||||||||||
| Current Liabilities | 121,449 | 78,386 | 133,903 | 110,342 | 109,169 | |||||||||||||||
| Long Term Liabilities | 224,886 | 202,779 | 149,695 | 91,655 | 92,924 | |||||||||||||||
| Total Liabilities | 346,335 | 281,165 | 283,598 | 201,997 | 202,093 | |||||||||||||||
| Total Shareholder’s Equity | 121,665 | 113,565 | 37,813 | 51,852 | 51,293 | |||||||||||||||
| Dividends per share (2) | $ | 0.73 | $ | 0.25 | $ | - | $ | - | $ | - | ||||||||||
(1) Figures here reported for Fiscal years 2013 and 2014 differ from previously reported audited amounts as they have been recast to include the consolidated results of ESW, an entity under common control which was acquired by the Company in December 2016.
(2) Dividends are payable in cash or ordinary shares, at the option of the shareholder.
| 34 |
| Item 7. | Management’s Discussion and Analysis of Financial Condition and Results of Operations. |
The following discussion of the Company’s financial condition and results of operations should be read in conjunction with the Company’s consolidated financial statements and notes to those statements included in this Form 10-K. This discussion contains forward-looking statements that involve risks and uncertainties. Please see the section entitled “Forward-Looking Statements and Introduction” in this Form 10-K.
Overview
We manufacture hi-specification architectural glass and windows for the global residential and commercial construction industries. Currently we offer design, production, marketing, and installation of architectural systems for buildings of high, medium and low elevation size. Products include windows and doors in glass and aluminum, floating façades, office partitions and interior divisions, and commercial window showcases.
In recent years, we have expanded our US sales outside of the Florida market, entering into market-seeking curtain wall technology, entering a niche market access since this product is in high demand and marks a new trend in architecture. This is a very sophisticated product and therefore garners high margins for us. These products involve high performance materials that are produced by Alutions and TG with state of the art technology.
We sell products in Panama primarily to companies participating in large construction projects in the most exclusive areas of the city. For example, the Company’s products were supplied in the construction of the tallest building in Central and South America, The Point, as well as in the construction of the most modern hotels in the region such as Megapolis.
How We Generate Revenue
The Company is a leading manufacturer of hi-spec architectural glass and windows for the western hemisphere residential and commercial construction industries, operating through our direct and indirect subsidiaries. Headquartered in Barranquilla, Colombia, we operate out of a 2.7 million square foot vertically-integrated, state-of-the-art manufacturing complex that provides easy access to the Americas, the Caribbean, and the Pacific.
The Company’ glass products include tempered glass, laminated glass, thermo-acoustic glass, curved glass, silk-screened glass, and digital print glass as well as mill finished, anodized, painted aluminum profiles and produces rods, tubes, bars and plates. Window production lines are defined depending on the different types of windows: normal, impact resistant, hurricane-proof, safety, soundproof and thermal. The Company produces fixed body, sliding windows, projecting windows, guillotine windows, sliding doors and swinging doors. ES produces façade products which include: floating facades, automatic doors, bathroom dividers and commercial display windows.
The Company sells to over 900 customers using several sales teams based out of Colombia and the U.S. to specifically target regional markets in South, Central and North America. The United States accounted for approximately 76%, 62% and 60% of our combined revenues in 2017, 2016 and 2015, respectively, while Colombia accounted for approximately 20%, 32% and 34%, and Panama for approximately 1%, 3% and 3% of our combined revenues in those years, respectively. Our tailored, high-end products are found on some of the world’s most distinctive properties, including the 50 UN Plaza (New York), UB Law (Baltimore) Fordham University Law School (New York), Soho Mall (Panama), Brickell City Centre (Miami), Wesleyan (Houston) and the El Dorado Airport (Bogota).
The Company sells its products through its main offices/sales teams based out of Colombia and the US. The Colombia sales team is our largest sales group, which has deep contacts throughout the construction industry. The Colombia sales team markets both the Company’s products as well as installation services. In the US, the Company sells out of subsidiaries established in Florida which have an expanding customer base and provide installation service in addition to Company Products. Sales forces in Panama are not via subsidiaries but under agreements with sales representatives. In 2017 the Company established two branches in Bolivia and Italy to expand geographical reach into South America, Europe and the Middle East. The Company has two types of sales operations: Contract sales, which are the high-dollar, specifically-tailored customer projects; and Standard Form Sales.
| 35 |
The U.S. market represents approximately 76% of our overall sales and is expected to continue being our most important market going forward. The U.S. construction market has been experiencing a growth cycle as evidenced by the ABI (“Architectural Billing Index”) during the twelve months leading to December 2017, and is showing expansion in the states where Tecnoglass mainly operates (Florida and Texas). Our strategy going forward will be to continue to focus on the U.S. as our main geographical target given its significant size and business activity. The recent acquisition of ESW and GM&P reinforces this strategy. See the “Overview” section in Item 1 of this Form 10-K. Within the U.S., Tecnoglass is seeking to continue diversifying its presence across a broader footprint in order to mitigate its concentration risk, while searching for new partnerships and commercial relationships in large metropolitan areas other than those in Florida (where it has historically had a strong market position). Our relationship with distributors, installers and general contractors continue to be key in our market penetration strategy and in our sales efficiency in order to target a broad variety of end clients. Construction activity in both the commercial and the residential markets within the U.S. has a direct impact in our ability to grow sales and profit margins. Although our efficient cost structure enables us to better withstand fluctuations and cycles in construction activity, our overall results could be significantly correlated with such cycles.
As part of our strategy to vertically integrate our operations, on December 2, 2016 we acquired 100% of the stock of ESW. Since 2004, we have a strategic commercial relationship with ESW, a Florida-based company partially owned by Christian T. Daes and José M. Daes, who are also our executive officers and directors, up onto recent acquisition. ESW acts as one of ES’s importers and distributors in the U.S. and is a member of the American Architectural Manufacturers Association, a technical information center for the architecture industry with highest standards. ESW sends project specifications and orders from its clients to ES, and in turn, receives pricing quotes from ES which are conveyed to the client.
On March 1, 2017, the Company entered into and consummated a purchase agreement with Giovanni Monti, the owner of 100% of the outstanding shares of GM&P. GM&P is a consulting and glazing contracting company located in Miami, Florida with over 15 years of experience in the design and installation of various building enclosure systems such as curtain window walls and a long-standing commercial relationship with the Company, working alongside it in different projects within the U.S, by providing engineering and installation services to those projects.
Liquidity
As of December 31, 2017 and 2016, the Company had cash and cash equivalent of approximately $40.9 million and $26.9 respectively.
On January 23, 2017, the Company successfully issued a U.S. dollar denominated, $210 million offering of 5-year senior unsecured notes at a coupon rate of 8.2% in the international debt capital markets under Rule 144A of the Securities Act to qualified institutional investors. The Company used approximately $179 million of the proceeds to repay the then outstanding indebtedness and as a result has achieved a lower cost of debt and strengthen its capital structure given the non-amortizing structure of the new bond. The Company’s consolidated balance sheet as of December 31, 2016 reflects the effect of this refinance of the Company’s current portion of long term debt and other current borrowings into long term debt based on the Company’s intent as of that date.
During the years ended December 31, 2017 and 2016, $14.2 million and $3.1 million were provided by and used in operating activities, respectively. A discussion of our cash flow from operations is included below in the sub-section headed “Cash flow from Operations, Investing and Financing Activities” under the Results of Operation section of this management discussion and analysis.
As of December 31, 2017 the company has significant availability under a number of bank facilities.
Capital Resources
We transform glass and aluminum into high specification architectural glass and custom made aluminum profiles which require significant investments in state of the art technology. During the years ended December 31, 2017, 2016 and 2015, we made investments primarily in building and construction, and machinery and equipment in the amount of $8.8 million, $42.5 million and $80.2 million, respectively.
| 36 |
In August 2014, we entered into a contract to purchase equipment from Magnetron Sputter Vacuum Deposition to produce soft coated low emissivity glass as part of our improvements plan that entered production in the last quarter of 2015. The investment for this project was approximately $45 million for the equipment and facilities, and was financed primarily with a credit facility with an export credit guarantee by the German Federal Government.
We expect that current installed capacity will be enough to service our backlog and expected sales through the year 2018. Capital expenditures in the near future are expected to be limited to maintaining installed capacity.
Results of Operations (Amounts in thousands)
| For the Years ended | ||||||||||||
| December 31, | ||||||||||||
| 2017 | 2016 | 2015 | ||||||||||
| Net operating revenue | $ | 314,456 | $ | 305,016 | $ | 242,239 | ||||||
| Cost of sales | 215,274 | 192,369 | 151,381 | |||||||||
| Gross Profit | 99,182 | 112,647 | 90,858 | |||||||||
| Operating expenses | 64,818 | 64,799 | 51,267 | |||||||||
| Operating income | 34,364 | 47,848 | 39,591 | |||||||||
| Change in fair value of warrant liability | - | 776 | (24,901 | ) | ||||||||
| Change in fair value of earnout share liability | - | 4,674 | (10,858 | ) | ||||||||
| Non-operating income, net | 3,190 | 4,155 | 5,054 | |||||||||
| Foreign currency transaction gains (losses) | (3,028 | ) | (1,387 | ) | 10,059 | |||||||
| Interest expense | (19,872 | ) | (16,814 | ) | (9,274 | ) | ||||||
| Loss on extinguishment of debt | (3,136 | ) | - | - | ||||||||
| Income tax provision | (5,793 | ) | (16,072 | ) | (20,691 | ) | ||||||
| Non-controlling interest | (276 | ) | - | - | ||||||||
| Net income (loss) | $ | 5,449 | $ | 23,180 | $ | (11,020 | ) | |||||
Revenue
Comparison of years ended December 31, 2017 and December 31, 2016
Our operating revenue increased from $305.0 million in 2016 to $314.5 million in 2017, or 3%. The increase was mostly driven by the GM&P acquisition and successfully executing our strategy to continue increasing our participation in the U.S. market. Sales in the U.S. market increased $48.5 million, or 26%.
The Company’s sales in the North American market continue to be key for the Company, mainly the South Florida region but continuously increasing and diversifying into other regions. Our increase in sales in overall terms and into the U.S market were mainly derived from the recent acquisition of GM&P which contributed its results from the March 1, 2017 date of acquisition. The acquisition of GM&P is in line with our strategy to strengthen our presence in U.S Markets.
Sales in the Colombian market decreased $35.2 million, or 36%, partly due to overall market conditions and to the postponements of construction as the country underwent a structural tax reform which was preceded by a high inflation and high interest rate period. It is expected that this pent-up activity will result in an upward shift of activity during 2018. Sales to Panama decreased $5.2 million or 55% in the year ended December 31, 2017 compared to the year ended December 31, 2016.
Comparison of years ended December 31, 2016 and December 31, 2015
Our operating revenue increased from $242.2 million in 2015 to $305.0 million in 2016, or 26%. The increase was mostly driven by a successful executing of our strategy to continue increasing our participation in the U.S. market as well as by construction growth in the other markets in which we participate.
The increase was partially due to high quality, reliability, and competitive prices which allowed us to further penetrate our existing markets and sell a larger volume of Company products. Sales in the U.S. market amounted to $190.0 million, an increase of $44.8 million or 31% over 2015. The increase is also partially due to a successful penetration of different markets within the country, especially the North east, going from a more Florida based business into a more diversified effort. Sales in Colombia, priced in Colombian pesos, increased by $17.5 million, or approximately 21%, however, in terms of local currency represented a 35% increase, offset by unfavorable exchange rates. Sales in Panama increased by $2.1 million, or 28.9%, and sales to other territories decreased by $1.6 million, which represents a 19% decrease, mainly related to a larger focus into the U.S market.
| 37 |
Cost of sales and gross profit margins
Comparison of years ended December 31, 2017 and December 31, 2016
Gross profit margins calculated by dividing the gross profit by operating revenues decreased from 37% to 32% between the fiscal year 2017 and 2016. The reduction in margins resulted from a number of different factors, including (i) higher depreciation and amortization expense associated with the capital expenditure investment phase that concluded in 2016, (ii) carrying a more robust fixed cost structure which were put in place based on a higher amount of anticipated sales, and (iii) by the acquisition of GM&P, which despite increasing gross profit, lowers gorss profit margin in line with the cost structure related to the installation and design of our products.
Comparison of years ended December 31, 2016 and December 31, 2015
Cost of sales increased $41.0 million or 27% from $151.4 million during the year ended December 31, 2015 to $192.4 million during the year ended December 31, 2016, partially proportional to the growth in the Company’s operating revenue. Gross margins calculated by dividing the gross profit by operating revenue decreased slightly from 37.5% to 36.9% between the years ended December 31, 2016 and 2015, respectively. While the cost of raw material as a percentage of revenues decreased slightly, the improvement in raw material efficiency was offset by a $5.6 million increase in labor cost related to the hiring of new employees to be trained into the new lines and for the Low Emissivity glass plant and a $4.0 million increase in depreciation charged to the cost of goods sold as a result of the Company’s growth capital expenditure phase completed during 2016 and further discussed above in the capital resources section of this discussion.
Operating Expenses
Comparison of years ended December 31, 2017 and December 31, 2016
Operating expenses remained stable at $64.8 million in 2017. Selling expense decreased $1.6 million, or 5%, from $32.3 million in 2016 to $30.7 million in 2017. The principal reduction was shipping expense which decreased $2.5 million, despite sales increasing 3%. This resulted from added efficiencies in our logistical process and from deriving revenues from designing and installation through GM&P (which do not carry shipping expenses). This was partially offset by higher personnel expense associated with the GM&P acquisition and by a higher cost of packaging.
General and Administrative expenses increased $3.2 million, or 11%, from $27.8 million to $31.0 million between the years ended December 31, 2016 and 2017. The main increase was related to personnel expense up $2.7 million, or 34% as the Company prepared itself for higher than realized sales, and also including $1.1 million personnel expense associated to GM&P Additionally, the Company recorded $2.6 million higher depreciation and amortization expense related to the intangible assets acquired through the acquisition of GM&P. These increases were partially offset by a decrease in bank charges and professional fees.
Comparison of years ended December 31, 2016 and December 31, 2015
Operating expenses increased 26%, or $13.5 million, from the year ended December 31, 2015 to December 31, 2016. Selling expense increased $4.6 million, or 17%, from $27.6 million in 2015 to $32.3 million in 2016. The principal reasons associated to this increase were an increase of $3.6 million in shipping expense associated with incremental business in more distant markets within the United States and personnel expenses which increased $0.6 million or 11%. The Company’s provision for bad debt and write off increased $3.2 million, from $1.5 million to $4.7 million.
General and Administrative expenses increased $5.7 million, or 26%, from $22.2 million to $27.9 million between the years ended December 31, 2015 and 2016. The main change was associated with an a $1.9 million increase in personnel expenses, a $0.8 million increase in professional fees associated with higher, accounting, legal and consulting expenses. Additionally, the Company incurred in $1.4 million higher expenses associated with bank charges, fees and an increase in a Colombian tax on financial transactions associated with the refinance of a significant portion of the Company’s debt in January of 2016.
| 38 |
Change in Fair Value of Warrant Liability
We had a non-cash, non-operating gain of $0.8 related to the change in fair value of warrant liability during the year before its expiration on December 20, 2016. The Company had a loss of $24.9 million in the year ended December 31, 2015 from the change in fair value of the warrant liability. The change in fair value of the warrants is associated to external market factors such as the market price of our shares and the volatility index of comparable companies. There are no income tax effects of this warrant liability due to our Company being registered in the Cayman Islands.
Change in Fair Value of Earnout share liability
We had a non-cash, non-operating gain of $4.7 million related to the change in fair value of the earnout liability during the year before the extinguishment of the liability on December 20, 2016. Through November 30, 2016, the Company had achieved an EBITDA substantially higher than the required EBITDA to release the shares. As a result, the Company instructed the Escrow Agent to release the remaining 1,500,000 ordinary shares of the Company held in escrow to Energy Holding Corp., the former stockholder of Tecnoglass, in accordance with the terms of the Escrow Agreement governing the EBITDA shares. The release of the shares under the Escrow Agreement prior to December 31, 2016 resulted in the reclassification of the earnout share liability to equity, once adjusted to fair value at the date of the release. In conjunction with the release of the shares, the Escrow Agreement has been terminated. The Company had a loss of $10.9 million in the year ended December 31, 2015 from the change in fair value of earnout share liability. The fair value of the earnout shares changes in response to market factors such as the market price of our shares and the volatility index of comparable companies and the Company’s forecasted EBITDA. There are no income tax effects of this earnout liability due to our Company being registered in the Cayman Islands.
Interest Expense
Interest expense increased to $19.9 million in 2017, compared with $16.8 million in 2016 as a result of debt increase to finance 2016 capital expenditures and one month of double interest expense between the issuance of the bond discussed below and repayment of previous debt (as the Company sought favorable FX rates to repay its local currency debt). Between the years ended December 31, 2015 and 2016, interest expense increased by $7.5 million, or approximately 81%, from $9.3 million to $16.8 million as our debt increased from $139.1 million as of December 31, 2015 to $199.6 million in December 31, 2016 mainly as a result of our growth capital expenditure initiatives geared toward increasing our installed capacity. The growth in debt was accompanied by incremental revenues and operating income to support the added leverage.
Non-Operating Income and Foreign Currency Transaction Gains and Losses
Non-operating income decreased $1.0 million from $4.2 million in 2016 to $3.2 million in 2017, compared with a previous year decrease of $0.9 million between $5.1 million in the year ended December 31, 2015 to $4.2 million in the year ended December 31, 2016, primarily as a result of a decrease in interest income and scrap recoveries. During the years ended December 31, 2017 and 2016, the Company recorded a foreign currency transaction loss of $3.0 million and $1.4 million, respectively, compared with a gain of $10.1 million during the year ended December 31, 2015, related to the Company’s Colombian subsidiaries ES and TG which have the Colombian Peso as functional currency but a substantial portion of their monetary assets and liabilities denominated in US Dollars., Foreign currency transaction gains during the year ended December 31, 2015 were associated with a net US Dollar asset position which coupled with a 32% devaluation of the Colombian Peso, ended up signifying a higher amount of assets in Pesos when translated to the functional currency. The foreign exchange rate has remained somewhat stable since the first quarter of 2016.
Income Tax Expense
Income tax for the year ended December 31, 2017 was $5.8 million, approximately $10.2 million lower than 2016 as a result of lower taxable income. In the year ended December 31, 2017, also included within income tax expense is a $2,824 withholding tax, which under Colombian regulation, is assessed when local companies make certain foreign payments, including interests on foreign debt. Income tax expense decreased $4.6 million in 2016 relative to 2015. This was primarily due to a lower taxable income in the Colombian subsidiaries which prior to the ESW acquisition, generated all of the Company’s pre-tax income. The Company’s effective tax rate of 261% for the year ended December 31, 2015 differs widely from the statutory rate of 39% because of the non-taxable non-operating losses due to changes in the fair value of warrant liability and earnout shares.
| 39 |
Cash flow from Operations, Investing and Financing Activities
Despite lower net income for the year, operating activities generated $14.2 million during fiscal 2017, an increase of $17.2 million from a use of $3.1 million in 2016. The change is mostly due to trade accounts receivable providing $2.4 million in 2017 in contrast to a use of $26.0 million in 2016 and $29.4 million in 2015 as a result of better collection efforts during 2017 and a more tapered growth during 2017 versus the preceding years. Despite the cash generated by accounts receivables, the balance of Trade account receivable increased due to $41.8 million receivables acquired from GM&P in March 2017 that do not impact cash flows. It is expected that given the industry related longer cash cycle, during periods of accelerated growth, accounts receivable may remain the main use of operating cashflow.
Trade accounts payable generated $13.1 million more during the year ended December 31, 2017, compared with a use of $1.0 million during 2016 and $14.8 million generated in 2015. The increase is associated with inventory purchases which increased $12.1 million between 2016 and 2017, though cash used in 2017 for purchase of inventories remains well below 2015 level. Purchase of inventories was the main use of cash in operating activities in 2017 as the Company builds up work in progress and finished product commensurate with expected future sales. The accrual of interests on the $210 million unsecured senior note issued in January 2017 described above at December 31, 2017 which are payable semi-annually in January and July generated $7.2 million during the year ended December 31, 2017. During 2017, $8.5 million were used in taxes payable, as the balance of taxes payable as of December 31, 2017 decreased $9.1 million between 2016 and 2017 due to lower income during fiscal 2017.
During the year ended December 31, 2017, cash used in investing activities decreased to $14.9 million compared with $24.7 million and $9.4 million during 2016 and 2015 respectively, primarily as a result of a $15.0 million decrease in acquisition of property and equipment paid for with cash but partially offset by the $6 million GM&P cash payment. In 2017, the Company purchased assets with credit amounting to $1.8 million which are not reflected in cash flow from operating activities. In 2016 the increase relative to 2015 was primarily related to a $8.0 million increase in the acquisition of property, plant and equipment paid for with cash, while total acquisitions of property, and equipment, including property acquired through debt and capital leases decreased $37.7 million when comparing the year ended December 31, 2016 and 2015. During the year ended December 31, 2016, and in addition to the cash capital expenditures of $22.9 million during the period, the Company made capital expenditures for $19.6 million that were financed with bank loans and capital leases. The decrease in capital expenditures is related to the completion of the company´s growth phase to get its installed capacity to a more appropriate level to address future growth.
Cash provided by financing activities decreased to $14.8 million, down $16.7 million from 2016 when it increased from $9.5 million during the year ended December 31, 2015 to $31.5 million the year ended December 31, 2016, primarily due to increases in proceeds from debt related to a credit facility issued in 2016 and an unsecured senior note issued in 2017 discussed above in the liquidity section.
Off-Balance Sheet Arrangements
We did not have any material off-balance sheet arrangements as of December 31, 2017.
Contractual Obligations
Future contractual obligations represent an impact to future cash flows as shown in the table as of December 31, 2017:
| Payments Due by Period (In thousands) | ||||||||||||||||||||
| Contractual Obligations | TOTAL | Less
than 1 year | 1-3 years | 3-5 years | More
than 5 years | |||||||||||||||
| Long Term Debt Obligations | $ | 230,930 | $ | 3,166 | $ | 4,654 | $ | 214,679 | $ | 8,430 | ||||||||||
| Minimum lease payments | 245 | 93 | 134 | 19 | - | |||||||||||||||
| Interest Obligations | 73,497 | 17,892 | 35,531 | 19,415 | 659 | |||||||||||||||
| Raw Material Purchase Obligations | 40,537 | 4,500 | 9,000 | 9,000 | 18,037 | |||||||||||||||
| Total | $ | 345,209 | $ | 25651 | $ | 49,319 | $ | 243,113 | $ | 27,126 | ||||||||||
Future interest obligations are estimated assuming constant reference rates for obligations with variable interest rates in addition to stable rates related to fixed interest debt. The average interest rate is approximately 7.77% per annum for long term debt obligations respectively, and varies up or down in accordance with Central Bank rates.
Forward Outlook
Looking forward, we believe our strategy to further penetrate U.S. markets as well as our incursion into new territories will lead to a revenue growth of between $345 million and $365 million in 2018. As we see our vertically integrated operation dilute our fixed costs over higher sales, we expect to improvement in our profit margins.
We had $40.9 million in Cash as of December 31, 2017 and expect our cash held and cash generated from operating activities to satisfy our working capital needs and service our debt.
These forward looking statements are based on the beliefs of management, as well as assumptions made by, and information currently available to, our management. Actual results could differ materially from those contemplated by the forward-looking statements.
| 40 |
Critical Accounting Policies
The preparation of financial statements in conformity with U.S. GAAP requires that management make significant estimates and assumptions that affect the assets, liabilities, revenues and expenses, and other related amounts during the periods covered by the financial statements. Management routinely makes judgments and estimates about the effect of matters that are inherently uncertain. As the number of variables and assumptions affecting the future resolution of the uncertainties increases, these judgments become more subjective and complex. We have identified the following accounting policies as the most important to the portrayal of our current financial condition and results of operations.
Revenue Recognition
Our principal sources of revenue are derived from product sales of manufactured glass and aluminum products. Delivery to the customer is deemed to have occurred when the title is passed to the customer. Generally, the title passes to the customer upon shipment, but could occur when the customer receives the product based on the terms of the agreement with the customer. The selling prices of all goods that the Company sells are fixed, and agreed to with the customer, prior to shipment. Selling prices are generally based on established list prices. The Company recognizes revenues from two type of sales: standard form sales and fixed price contracts.
The Company recognizes revenue for standard form sales. Standard form sales are customer sales comprising low value installations that are of short duration. A standard form agreement is executed between the Company and its customer. Services are performed by the Company during the installation process. The price quote is determined by the Company, based on the requested installation, and approved by the customer before the Company proceeds with the installation. The customer’s credit worthiness and payment capacity is evaluated before the Company will proceed with the initial order process.
Revenues from fixed price contracts, which represent approximately 47%, 16.0% and 21.6% of the Company’s sales for the year ended December 31, 2017, 2016 and 2015, respectively, are recognized using the percentage-of-completion method, measured by the percentage of costs incurred to date to total estimated costs for each contract. Revenues from fixed price contracts include the entirety of the revenues generated by GM&P acquired in 2017. These contracts typically have a duration ranging between one and three years. Revenues recognized in advance of amounts billable pursuant to contracts terms are recorded as unbilled receivables on uncompleted contracts based on work performed and costs to date. Unbilled receivables on uncompleted contracts are billable upon various events, including the attainment of performance milestones, delivery and installation of product, or completion of the contract. Revisions to cost estimates as contracts progress have the effect of increasing or decreasing expected profits each period. Changes in contract estimates occur for a variety of reasons, including changes in contract scope, estimated revenue and cost estimates. Change in contract estimates have not had a material effect on our financial statements.
Related party transactions
The Company has related party transactions such as sales, purchases, leases, guarantees, and other payments done during the ordinary course of business and at arm´s length. We perform a related party analysis to identify transactions to disclose quarterly, and depending on those transactions, we aggregate the information by party so the relationship with the Company is properly understood.
Foreign currency transactions
The functional currency of most of the Company’s foreign subsidiaries and branches is the applicable local currency. Assets and liabilities are translated into U.S. dollars using the current exchange rates in effect at the balance sheet date, while revenues and expenses are translated at the average exchange rates during the period. The resulting translation adjustments are recorded as a component of accumulated other comprehensive earnings within stockholders’ equity. The Company also recognizes gains and losses associated with transactions that are denominated in foreign currencies within non-operating income in the Company’s consolidated statement of operations.
| 41 |
Income taxes
The Company is subject to income taxes in some jurisdictions. Significant judgment is required in determining the worldwide provision for income taxes. The provision for income taxes is determined using the asset and liability approach of accounting for income taxes. Under this approach, deferred taxes represent the future tax consequences expected to occur when the reported amounts of assets and liabilities are recovered or paid. The provision for income taxes represents income taxes paid or payable for the current year plus the change in deferred taxes during the year. Deferred taxes result from differences between the financial and tax basis of the Company’s assets and liabilities and are adjusted for changes in tax rates and tax laws when changes are enacted. For each tax jurisdiction in which the Company operates, deferred tax assets and liabilities are offset against one another and are presented as a single noncurrent amount within the consolidated balance sheets.
There are many transactions and calculations for which the ultimate tax determination is uncertain. The Company recognizes liabilities for anticipated tax audit issues based on estimates of whether additional taxes will be due. Where the final tax outcome of these matters is different from the amounts that were initially recorded, such differences will impact the current and deferred income tax assets and liabilities in the period in which such determination is made.
The Company recognizes the financial statement effects of uncertain income tax positions when it is more likely than not, based on the technical merits, that the position will be sustained upon examination. The Company accrues for other tax contingencies when it is probable that a liability to a taxing authority has been incurred and the amount of the contingency can be reasonably estimated. Interest accrued related to unrecognized tax and income tax related penalties are included in the provision for income taxes. The uncertain income taxes positions is recorded in “Taxes payable” in the consolidated balance sheets.
Business combinations
We allocate the total purchase price of the acquired tangible and intangible assets acquired and liabilities assumed based on their estimated fair values as of the business combination date, with the excess purchase price recorded as goodwill. The purchase price allocation process required us to use significant estimates and assumptions, including fair value estimates, as of the business combination date. Although we believe the assumptions and estimates we have made are reasonable and appropriate, they are based in part on historical experience and information obtained from management of the acquired company, in part based on valuation models that incorporate projections of expected future cash flows and operating plans and are inherently uncertain. Valuations are performed by management or third party valuation specialists under management’s supervision. In determining the fair value of assets acquired and liabilities assumed in business combinations, as appropriate, we may use one of the following recognized valuation methods: the income approach (including the cost saving method and the discounted cash flows from relief from royalty), the market approach and/or the replacement cost approach.
Examples of significant estimates used to value certain intangible assets acquired include but are not limited to:
| ● | sales volume, pricing and future cash flows of the business overall |
| 42 |
| ● | future expected cash flows from customer relationships, and other identifiable intangible assets, including future price levels, rates of increase in revenue and appropriate attrition rate |
| ● | the acquired company’s brand and competitive position, royalty rate, as well as assumptions about the period of time the acquired brand will continue to benefit to the combined company’s product portfolio |
| ● | cost of capital, risk-adjusted discount rates and income tax rates |
However, different assumptions regarding projected performance and other factors associated with the acquired assets may affect the amount recorded under each type of assets and liabilities, mainly between property, plant and equipment, intangibles assets, goodwill and deferred income tax liabilities and subsequent assessment could result in future impairment charges. The purchase price allocation process also entails us to refine these estimates over a measurement period not to exceed one year to reflect new information obtained surrounding facts and circumstances existing at acquisition date.
Acquisitions of entities under common control are recorded retroactively starting from the first date of common control. Instead of using fair value, the Company consolidates the financial statements of the entity acquired using the existing carrying values.
Dividend payments
We account for dividends declared as a liability under ASC 480, Distinguishing Liabilities from Equity, since our shareholders has the option to elect cash or stock. When the dividend is declared, we record the transaction as a reduction to retained earnings and an increase to dividends payable. We then reclassify stock dividends from dividends payable to additional paid-in capital when the shareholder elects a stock dividend instead of cash. The dividend payable is not subject to remeasurement at each balance sheet date since the dividend is a fixed monetary amount known at inception and thus no change in fair value adjustment is necessary.
| Item 7A. | Quantitative and Qualitative Disclosures About Market Risk. |
We are exposed to ongoing market risk related to changes in interest rates and foreign currency exchange rates.
A rise in interest rates could negatively affect the cost of financing for a portion of our debt with variable interest rates. If interest rates were to increase over the next 12 months by 200 basis points, net earnings would be decrease by approximately $0.1 million. Conversely, if interest rates were to decrease over the next 12 months by 200 basis points, net earnings would be increase by approximately $0.1 million. We currently do not use derivative financial instruments to manage interest rate risk.
We are also subject to market risk due to changes in the value of foreign currencies in relation to our reporting currency, the U.S. dollar. Two of our subsidiaries with significant operations are based in Colombia, and primarily transact business in local currency. A significant portion of the revenues and costs of these subsidiaries are generally denominated in Colombian pesos, thereby mitigating some of the risk associated with changes in foreign exchange rates. A 1% devaluation of the Colombian Peso would result in our revenues decreasing by $0.6 million and our expenses decreasing by approximately $1.1 million, resulting in a $0.5 million increase to net earnings. A strengthening of the Colombian Peso by 1% would increase our revenues by $0.6 million and expenses by $1.1 million resulting in $0.5 lower earnings.
| 43 |
Similarly, a significant portion of the monetary assets and liabilities of these subsidiaries are generally denominated in US Dollars, while their functional currency is the Colombian peso, thereby resulting in gains or losses from remeasurement of assets and liabilities using end of period spot exchange rate. These subsidiaries have both monetary assets and monetary liabilities denominated in US Dollars, thereby mitigating some of the risk associated with changes in foreign exchange rate. However, the Colombian subsidiaries’ US Dollar denominated monetary liabilities exceed their monetary assets by $149.5 million, such that a 1% devaluation of the Colombian peso will result in a loss of $1.5 million recorded in the Company’s Consolidated Statement of Operations.
Additionally, the results of the foreign subsidiaries have to be translated into US Dollar, our reporting currency, in the Company’s consolidated financial statements. The currency translation of the financial statements using different exchange rates, as appropriate, for different parts of the financial statements generates a translation adjustment which is recorded within other comprehensive income on the Company’s Consolidated Statement of Comprehensive Income and Consolidated Balance Sheet.
| Item 8. | Financial Statements and Supplementary Data. |
This information appears following Item 15 of this Report and is included herein by reference.
| Item 9. | Changes in and Disagreements with Accountants on Accounting and Financial Disclosures. |
None.
| Item 9A. | Controls and Procedures |
Evaluation of Disclosure Controls and Procedures
We performed an evaluation required by Rules 13a-15 and 15d-15 of the Securities Exchange Act of 1934, as amended, under the supervision and with the participation of our management, including our principal executive officer and principal financial officer, of Tecnoglass, Inc.´s design and operating effectiveness of the internal controls over financial reporting as of the end of the period covered by this Annual Report. Based on this evaluation, our principal executive officer and principal financial officer concluded that our disclosure controls and procedures as defined in Rules 13a-15(e) and 15d-15(e) under the Securities Exchange Act of 1934, as amended, were effective as of December 31, 2017, in order to provide reasonable assurance that the information disclosed in our reports is recorded, processed, summarized, and reported within the time periods specified in the SEC’s rules and forms and to provide reasonable assurance that such information is accumulated and communicated to our management, including our principal executive officer and principal financial officer, as appropriate to allow timely decisions regarding required disclosure.
Management’s Report on Internal Control over Financial Reporting
Our management is responsible for establishing and maintaining adequate internal control over financial reporting, as that term is defined in Rules 13a-15(f) and 15d-15(f) under the Securities Exchange Act of 1934, as amended.
A company’s internal control over financial reporting includes policies and procedures that: (i) pertain to the maintenance of records that, in reasonable detail, accurately and fairly reflect the transactions and dispositions of the assets of the company, (ii) provide reasonable assurance that transactions are recorded as necessary to permit preparation of financial statements in accordance with generally accepted accounting principles in the United States, and that receipts and expenditures of the Company are being made only in accordance with authorizations of management and directors of the company, and (iii) provide reasonable assurance regarding prevention or timely detection of unauthorized acquisition, use or disposition of the company’s assets that could have a material effect on the financial statements.
| 44 |
Our management, including the participation of our principal executive officer and principal financial officer, conducted an evaluation of the effectiveness of our internal control over financial reporting, as of December 31, 2017, based on criteria set forth in the “Internal Control - Integrated Framework (2013) issued by the Committee of Sponsoring Organizations of the Treadway Commission (COSO)”.
Based on this evaluation, our management concluded that our internal control over financial reporting was effective in providing reasonable assurance regarding the reliability of financial reporting and the preparation of financial statements for external purposes in accordance with generally accepted accounting principles. PriceWaterhouseCoopers Ltda. has independently assessed the effectiveness of our internal control over financial reporting and its report is included below.
Remediation of Material Weakness regarding Entity-Level Controls
As stated in our annual report on Form 10K, for the fiscal year ended December 31, 2016, management identified a material weakness regarding Entity-Level Controls.
During 2017, the Company implemented the required controls and performed additional procedures in order to determine the effectiveness of the design and operation of such controls. The Company’s remediation actions included:
| ● | Design and communication our Code of Conduct to our employees and other stakeholders. | |
| ● | Assessment of Conflict of Interest of our employees. | |
| ● | Implementation of the confidential reporting channel. | |
| ● | Creation of the Ethics and Compliance and Financial Planning and Analysis divisions. | |
| ● | Implementation of controls to prevent and deter Fraud, Corruption, Money Laundering and other illegal acts. | |
| ● | Enhancement of the USGAAP training program for our finance and accounting personnel considering relevant topics according the company´s transactions. | |
| ● | Approval by the Board of Directors of the budget for the year 2017. | |
| ● | Development of the internal audit plan for strengthening our independent oversight of internal controls over financial reporting. | |
| ● | Design and communication of the Authority Delegation Manual. | |
| ● | Design of a contract data base. |
Internal Control Over Financial Reporting for recent acquisitions
As stated in Item 1 - “Our business”, during March, 2017, we acquired complete ownership of GM&P. For purposes of evaluating internal controls over financial reporting, we determined that the internal controls of the acquired company would be excluded from our internal control assessment as of December 31, 2017, due to the timing of the closing of this acquisition. For the year ended December 31, 2017, GM&P contributed approximately 11% of total assets, and 19% of total revenues.
Changes in Internal Control Over Financial Reporting
As discussed in the section “Remediation of Material Weaknesses regarding Entity-Level Controls”, there were changes in our internal control over financial reporting during the year 2017.
| Item 9B. | Other Information. |
None.
| 45 |
| Item 10. | Directors, Executive Officers and Corporate Governance. |
Directors and Executive Officers
Our current directors and executive officers are as follows:
| Name | Age | Position | ||
| José M. Daes | 57 | Chief Executive Officer and Director | ||
| Christian T. Daes | 53 | Chief Operating Officer and Director | ||
| Santiago Giraldo | 42 | Chief Financial Officer | ||
| A. Lorne Weil | 67 | Non-Executive Chairman of the Board | ||
| Samuel R. Azout | 58 | Independent Director | ||
| Juan Carlos Vilariño | 55 | Independent Director | ||
| Martha (Stormy) L. Byorum | 63 | Independent Director | ||
| Julio A. Torres | 50 | Independent Director |
José M. Daes has served as our chief executive officer and a director since December 2013 and has been involved with TG and ES since its inception. Mr. Daes has over 30 years’ experience starting and operating various businesses in Colombia and the U.S. Mr. Daes has served as chief executive officer of ES since its inception in 1984, responsible for all aspects of ES’s operations. Mr. Daes began his career in textiles, importing textiles from Japan to Colombia and later owned and operated an upscale clothing store with multiple locations in Miami. Mr. Daes is the older brother of Christian T. Daes, our chief operating officer and director.
We believe Mr. Daes is well-qualified to serve as a member of our board of directors due to his operational experience with ES and TG and his knowledge of the industry within which they operate.
Christian T. Daes has served as our chief operating officer and a director since December 2013 and has been involved with TG and ES since their inception. Mr. Daes has served as the chief executive officer of Tecnoglass since its inception in 1994, responsible for all aspects of Tecnoglass’ operations. Mr. Daes’ philanthropic activities include founding the Tecnoglass-ES Windows Foundation, which promotes local development, health and social programs in Barranquilla, Colombia. Mr. Daes is the younger brother of José M. Daes, our chief executive officer and director.
We believe Mr. Daes is well-qualified to serve as a member of our board of directors due to his operational experience with ES and TG and his knowledge of the industry within which they operate.
Santiago Giraldo currently serves as Chief Financial Officer and Head of Investor Relations where he has been since the beginning of 2016, during which time he has managed all global financial and accounting activities of the Company. Mr. Giraldo joined Tecnoglass with significant financial experience, having served as Chief Financial Officer and Head of Business Development and Strategy at Ocensa, a subsidiary within Ecopetrol S.A., Colombia’s largest publicly traded company, listed in both the New York Stock Exchange and the Colombian Stock Exchange. Prior to Ocensa, Mr. Giraldo spent four years as a Vice-President within the Corporate Bank group in Citibank Colombia and prior to that, 10 years in the United States, working with JPMorgan Chase and Wells Fargo within their Corporate Bank Units. Mr. Giraldo has considerable experience in capital markets, bank debt, derivatives, treasury, M&A, and equity related transactions.
A. Lorne Weil has served as a member of our board of directors and non-executive chairman of the board since our inception. He has also served as a director of Sportech Plc, one of the largest suppliers and operators of pools/tote (often also referred to as pari-mutuel) betting in the world, since October 2010. From October 1991 to November 2013, Mr. Weil served as chairman of the board of Scientific Games Corporation, a supplier of technology-based products, systems and services to gaming markets worldwide, and served as its chief executive officer from April 1992 until November 2013. Mr. Weil also served as president of Scientific Games from August 1997 to June 2005. From 1979 to November 1992, Mr. Weil was president of Lorne Weil, Inc., a firm providing strategic planning and corporate development services to high technology industries. Previously, Mr. Weil was vice president of corporate development at General Instrument Corporation, working with wagering and cable systems.
We believe Mr. Weil is well-qualified to serve as a member of our board of directors due to his extensive business experience in strategic planning and corporate development, his contacts he has fostered throughout his career, as well as his operational experience.
| 46 |
Samuel R. Azout has served on our board of directors since December 2013 and on the board of TG since February 2009. Since March 2013, Mr. Azout has served as an investment manager for Abacus Real Estate. From January 2012 to March 2013, Mr. Azout served as the chief executive officer of the National Agency for Overcoming Extreme Poverty in Colombia, an organization formed by the government of Colombia to assist families in poverty. From September 2008 to January 2012, Mr. Azout was the senior presidential advisor for Social Prosperity, employed by the administration of the President of Colombia. Prior to this, Mr. Azout served as chief executive officer of Carulla Vivero S.A., the second largest retailer in Colombia, for 10 years, until he led its sale to Grupo Exito in 2006.
Juan Carlos Vilariño has served on our board of directors since December 2013, on the board of TG since November 1995 and on the board of ES since March 1997. Mr. Vilariño has worked as the general manager of various business highway concession consortiums in Colombia including the Malla Vial del Atlántico Highway Concession Consortium since 1993 and the Barranquilla-Ciénaga Highway Concession consortium since 1999. Mr. Vilariño began his career as the assistant vice president in the general consulting department of Finance Corporation of the North, S.A. We believe Mr. Vilariño is well-qualified to serve as a member of our board of directors due to his contacts and business relationships in Colombia.
Martha (Stormy) L. Byorum has served as a member of our board of directors since November 2011. Ms. Byorum is founder and chief executive officer of Cori Investment Advisors, LLC (Cori Capital), a financial services entity that was most recently (January 2005 through August 2013) a division of Stephens Inc., a private investment banking firm founded in 1933. Ms. Byorum was also an executive vice president of Stephens Inc. from January 2005 until August 2013. From March 2003 to December 2004, Ms. Byorum served as chief executive officer of Cori Investment Advisors, LLC, which was spun off from VB&P in 2003. Ms. Byorum co-founded VB&P in 1996 and served as a Partner until February 2003. Prior to co-founding VB&P in 1996, Ms. Byorum had a 24-year career at Citibank, where, among other things, she served as chief of staff and chief financial officer for Citibank’s Latin American Banking Group from 1986 to 1990, overseeing $15 billion of loans and coordinating activities in 22 countries. She was later appointed the head of Citibank’s U.S. Corporate Banking Business and a member of the bank’s Operating Committee and a Customer Group Executive with global responsibilities.
Ms. Byorum is a Life Trustee of Amherst College and a chairman of the finance committee of the board of directors of Northwest Natural Gas, a large distributor of natural gas services in the Pacific Northwest.
We believe Ms. Byorum is well-qualified to serve as a member of the board of directors due to her operational experience with Cori Capital Advisors, VB&P and Citibank and her financial background, which includes having served on the audit committees of four publicly-traded companies.
Julio A. Torres has served on our board of directors since October 2011. He previously served as our co-chief executive officer from October 2011 through January 2013. Since March 2008, Mr. Torres has served as managing director of Nexus Capital Partners, a private equity firm. From April 2006 to February 2008, Mr. Torres served with the Colombian Ministry of Finance acting as general director of public credit and the treasury. From June 2002 to April 2006, Mr. Torres served as managing director of Diligo Advisory Group, an investment banking firm. From September 1994 to June 2002, Mr. Torres served as vice president with JPMorgan Chase Bank.
We believe Mr. Torres is well-qualified to serve as a member of our board of directors due to his operational experience with Nexus Capital Partners, his work with the Colombian government and his extensive contacts he has fostered while working at Nexus Capital Partners, JPMorgan Chase Bank and in the Colombian government.
Section 16(a) Beneficial Ownership Reporting Compliance
Section 16(a) of the Securities Exchange Act of 1934 requires our officers, directors and persons who own more than ten percent of a registered class of our equity securities to file reports of ownership and changes in ownership with the Securities and Exchange Commission. Officers, directors and ten percent shareholders are required by regulation to furnish us with copies of all Section 16(a) reports they file. Based solely on a review of such reports received by us and written representations from certain reporting persons that no Form 5s were required for those persons, we believe that, during the fiscal year ended December 31, 2017, all reports required to be filed by our officers, directors and persons who own more than ten percent of a registered class of our equity securities were filed on a timely basis.
Code of Conduct
In March 2012, we adopted a code of ethics that applies to all of our executive officers, directors and employees setting forth the business and ethical principles that govern all aspects of our business. This Code of Ethics was subsequently updated and transformed into a Code of Conduct, based on the same principles but with additional requirements of the expected behavior of our stakeholders. The Code of Conduct is available at http://investors.tecnoglass.com/corporate-governance.cfm. We will also provide, without charge, upon request, copies of our Code of Ethics. Requests for copies of our Code of Ethics should be sent in writing to Tecnoglass Inc., Avenida Circunvalar a 100 mts de la Via 40, Barrio Las Flores, Barranquilla, Colombia, Attn: Corporate Secretary.
| 47 |
Corporate Governance
As part of our constant commitment to improve our corporate governance and entity level controls, in August and December 2017 we made certain adjustments to our guidelines, functions and corporate bodies. As a result, we established Corporate Governance Guidelines which contain Board specific functions, Committee Charters, Officer’s responsibilities and authority delegations, our sustainability policy and ethics and compliance hotline. The Corporate Governance Guidelines are available at http://investors.tecnoglass.com/corporate-governance.cfm.
Audit Committee
We have a standing audit committee of the board of directors, which consists of Martha L. Byorum, Samuel R. Azout and Julio Torres, with Martha L. Byorum serving as chairman. Each of the members of the audit committee is independent under the applicable NASDAQ listing standards.
The audit committee has a written charter, a copy of which was filed with our Definitive Proxy Statement on Schedule 14A filed with the SEC on October 5, 2016 and included in our compendium of Corporate Governance Guidelines with latest version approved on December, 2017. The purpose of the audit committee is to assist the Board in monitoring the integrity of the Company’s financial statements, to appoint, retain, set compensation of, and supervise our independent accountants, review the results and scope of the audit and other accounting related services and review our accounting practices and systems of internal accounting and disclosure controls. The audit committee’s duties, which are specified in the audit committee charter, include, but are not limited to:
| ● | reviewing and discussing with management and the independent auditor the annual audited financial statements, and recommending to the board whether the audited financial statements should be included in our Form 10-K, and 10-Qs; |
| ● | discussing with management and the independent auditor significant financial reporting issues and judgments made in connection with the preparation of our financial statements; |
| ● | discussing with management major risk assessment and risk management policies; |
| ● | monitoring the independence of the independent auditor; |
| ● | verifying the rotation of the lead (or coordinating) audit partner having primary responsibility for the audit and the audit partner responsible for reviewing the audit as required by law; |
| ● | reviewing and approving all related-party transactions; |
| ● | inquiring and discussing with management our compliance with applicable laws and regulations; |
| ● | pre-approving all audit services and permitted non-audit services to be performed by our independent auditor, including the fees and terms of the services to be performed; |
| ● | appointing or replacing the independent auditor; |
| ● | determining the compensation and oversight of the work of the independent auditor (including resolution of disagreements between management and the independent auditor regarding financial reporting) for the purpose of preparing or issuing an audit report or related work; and |
| ● | establishing procedures for the receipt, retention and treatment of complaints received by us regarding accounting, internal accounting controls or reports which raise material issues regarding its financial statements or accounting policies. |
The audit committee has discussed with the independent auditors the matters required by the Public Company Accounting Oversight Board (“PCAOB”) auditing standard No. 16 - Communication with Audit Committees, including independent accountant’s independence.
Financial Experts on Audit Committee
The audit committee will at all times be composed exclusively of “independent directors,” as defined for audit committee members under the NASDAQ listing standards and the rules and regulations of the Securities and Exchange Commission, who are “financially literate,” as defined under NASDAQ’s listing standards. NASDAQ’s listing standards define “financially literate” as being able to read and understand fundamental financial statements, including a company’s balance sheet, statement of operations and cash flow statement. The board of directors has determined that Martha Byorum satisfies NASDAQ’s definition of financial sophistication and also qualifies as an “audit committee financial expert” as defined under rules and regulations of the Securities and Exchange Commission.
Nominating Committee
We have a standing nominating committee, which consists of A. Lorne Weil, Martha L. Byorum, Samuel R. Azout and Juan Carlos Vilariño, with A. Lorne Weil serving as chairperson. Each member of the nominating committee is an “independent director” as defined under NASDAQ listing standards. Pursuant to its written charter, a copy of which was filed with our Definitive Proxy Statement on Schedule 14A filed with the SEC on October 5, 2016 and included in our compendium of Corporate Governance Guidelines with latest version approved on December, 2017, our nominating committee is responsible for overseeing the selection of persons to be nominated to serve on our board of directors.
| 48 |
Guidelines for Selecting Director Nominees
The nominating committee considers persons identified by its members, management, shareholders, investment bankers and others. Currently, the guidelines for selecting nominees, which are specified in the nominating committee charter, generally provide that persons to be nominated:
| ● | should have demonstrated notable or significant achievements in business, education or public service, that is consistent with the image and reputation of the Company;; |
| ● | should possess the requisite intelligence, education and experience to make a significant contribution to the board of directors and bring a range of skills, diverse perspectives and backgrounds to its deliberations; and |
| ● | should have the highest ethical standards, a strong sense of professionalism and intense dedication to serving the interests of the shareholders. |
The nominating committee will consider a number of qualifications relating to management and leadership experience, background and integrity and professionalism in evaluating a person’s candidacy for membership on the board of directors. The nominating committee may require certain skills or attributes, such as financial or accounting experience, to meet specific board needs that arise from time to time and will also consider the overall experience and makeup of its members to obtain a broad and diverse mix of board members. The nominating committee does not distinguish among nominees recommended by shareholders and other persons.
There have been no material changes to the procedures by which shareholders may recommend nominees to the nominating committee.
Compensation Committee
We have a standing compensation committee consisting of Julio Torres, Samuel R. Azout and Juan Carlos Vilariño, with Julio Torres serving as chairperson. Pursuant to the compensation committee charter, a copy of which was filed with our Definitive Proxy Statement on Schedule 14A filed with the SEC on October 5, 2016 and included in our compendium of Corporate Governance Guidelines with latest version approved on December, 2017 The compensation committee oversees our compensation and employee benefit plans and practices, including our executive, director and other incentive and equity-based compensation plans. The specific responsibilities of the compensation committee include making recommendations to the board regarding executive compensation of our executive officers and non-employee directors, approving a corporate compensation policy, and preparing and reviewing compensation-related disclosure, including a compensation discussion and analysis and compensation committee report (if required), for our filings with the Securities and Exchange Commission.
Indemnification of Directors and Officers
Cayman Islands law does not limit the extent to which a company’s memorandum and articles of association may provide for indemnification of officers and directors, except to the extent any such provision may be held by the Islands courts to be contrary to public policy, such as to provide indemnification against willful fraud, willful misconduct, civil fraud or the consequences of committing a crime. Our third amended and restated memorandum and articles of association provides for indemnification of our officers and directors to the maximum extent permitted by law, including for any liability incurred in their capacities as such, except through their own actual fraud or willful neglect or willful default.
Insofar as indemnification for liabilities arising under the Securities Act may be permitted to our directors, officers, and controlling persons pursuant to the foregoing provisions, or otherwise, we have been advised that, in the opinion of the SEC, such indemnification is against public policy as expressed in the Securities Act and is, therefore, unenforceable.
| Item 11. | Executive Compensation. |
Overview; Compensation Discussion and Analysis
Our policies with respect to the compensation of our executive officers are administered by our board in consultation with our compensation committee. Our compensation policies are intended to provide for compensation that is sufficient to attract, motivate and retain executives of outstanding ability and potential and to establish an appropriate relationship between executive compensation and the creation of shareholder value. To meet these goals, the compensation committee is charged with recommending executive compensation packages to our board.
Prior to consummation of the Business Combination in December 2013, none of our executive officers or directors received compensation for services rendered to the Company. No compensation or fees of any kind, including finders, consulting or other similar fees, were paid to any of our initial shareholders, including our officers and directors, or any of their respective affiliates, prior to, or for any services they rendered in order to effectuate, the consummation of the initial business combination.
| 49 |
We seek to provide total compensation packages that are competitive in terms of potential value to our executives, and which are tailored to the unique characteristics and needs of our company in order to create an executive compensation program that will adequately reward our executives for their roles in creating value for our shareholders.
The compensation decisions regarding our executives is on our need to attract individuals with the skills necessary for us to achieve our business plan, to reward those individuals fairly over time, and to retain those individuals who continue to perform at or above our expectations.
Our compensation committee is charged with performing an annual review of our executive officers’ cash compensation and equity holdings to determine whether they provide adequate incentives and motivation to executive officers and whether they adequately compensate the executive officers relative to comparable officers in other companies.
We believe it is important when making compensation-related decisions to be informed as to current practices of similarly situated publicly held companies in our industry. Our compensation committee stays apprised of the cash and equity compensation practices of publicly held companies in the glass and aluminum industries through the review of such companies’ public reports and through other resources. The companies chosen for inclusion in any benchmarking group would have business characteristics comparable to our company, including revenues, financial growth metrics, stage of development, employee headcount and market capitalization. While benchmarking may not always be appropriate as a stand-alone tool for setting compensation due to the aspects of our business and objectives, we generally believe that gathering this information is an important part of our compensation-related decision-making process.
Summary Compensation Table
The following table summarizes the total compensation for the years ended December 31, 2016 and 2015 of each of our named executive officers.
| Name
and principal position | Year | Salary | Bonus | Total | ||||||||||||
| Jose M. Daes (1) | 2017 | $ | 965,805 | $ | - | $ | 965,805 | |||||||||
| Chief Executive Officer | 2016 | $ | 720,000 | $ | 412,213 | $ | 1,132,213 | |||||||||
| 2015 | $ | 720,000 | $ | 132,000 | $ | 852,000 | ||||||||||
| Christian T. Daes (2) | 2017 | $ | 873,262 | $ | - | $ | 873,262 | |||||||||
| Chief Operating Officer | 2016 | $ | 720,000 | $ | 288,723 | $ | 1,008,723 | |||||||||
| 2015 | $ | 438,000 | $ | - | $ | 438,000 | ||||||||||
| Santiago Giraldo | 2017 | $ | 160,000 | $ | 11,451 | $ | 171,451 | |||||||||
| Joaquin Fernández (3) | 2016 | $ | 133,897 | $ | - | $ | 133,897 | |||||||||
| Chief Financial Officer | 2015 | $ | 142,200 | $ | 12,000 | $ | 154,200 | |||||||||
| (1) | Mr. Daes was appointed Chief Executive Officer in December 2013 in connection with the Business Combination. Mr. Daes also serves as Chief Executive Officer of ES. |
| (2) | Mr. Daes was appointed Chief Operating Officer in December 2013 in connection with the Business Combination. Mr. Daes also serves as Chief Executive Officer of Tecnoglass. |
| (3) | Mr. Fernández was appointed Chief Financial Officer in December 2013 in connection the Business Combination and replaced by Mr. Giraldo on July, 2017. Mr. Fernández also serves as Chief Financial Officer of TG and ES. |
Compensation Arrangements with Named Executive Officers
On January 9, 2018, the Board of Directors of the Company approved the following compensation arrangements for 2018 for each of Jose Daes, the Company’s Chief Executive Officer, Christian Daes, the Company’s Chief Operating Officer, and Santiago Giraldo, the Company’s Chief Financial Officer: (i) with respect to each of Messrs. Daes and Daes, a base salary of $1,020,000 plus a bonus of up to $102,000; and (ii) with respect to Mr. Giraldo, a base salary of $180,000 plus CPI adjustment and a bonus of up to $50,000 per year to be paid out quarterly. Each of the bonuses will be based on the Company’s 2018 financial performance and achievement of certain to-be-agreed upon targets throughout the year.
The Company estimates median annual total compensation of employees to be $10,714. The ratio of the annual total compensation of the Chief Executive Officer to that of the median employee is 90:1.
Equity Awards at Fiscal Year End
As of December 31, 2017, we had not granted any share options, share appreciation rights or any other awards under long-term incentive plans to any of our executive officers.
Director Compensation
For the year ended December 31, 2017, we granted each non-employee director an annual award of ordinary shares of the Company of $50,000 based on the closing price per share of our ordinary shares on October 2, 2017. On January 2, 2018, we granted our chairwoman of the Audit Committee and each other member of our Audit Committee, ordinary shares for value equal to $18,000 and $8,000, respectively, based on the closing price per share of our ordinary shares on January 2, 2018 representing payment for board service provided in 2017.
Compensation Committee Interlocks and Insider Participation
During 2017, each of of Julio Torres, Samuel R. Azout and Juan Carlos Vilariño, with Julio Torres served on our compensation committee. No member of the compensation committee during 2017 was an officer, employee or former officer of ours or any of our subsidiaries or had any relationship that would be considered a compensation committee interlock and would require disclosure pursuant to SEC rules and regulations. None of our executive officers served as a member of a compensation committee or a director of another entity under the circumstances requiring disclosure pursuant to SEC rules and regulations.
| 50 |
| Item 12. | Security Ownership of Certain Beneficial Owners and Management and Related Stockholder Matters. |
The following table sets forth information as of December 31, 2017 regarding the beneficial ownership of our ordinary shares by:
| ● | Each person known to be the beneficial owner of more than 5% of our outstanding ordinary shares; |
| ● | Each director and each named executive officer; and |
| ● | All current executive officers and directors as a group. |
Unless otherwise indicated, we believe that all persons named in the table have sole voting and investment power with respect to all ordinary shares beneficially owned by them. This table is prepared based on registered shareholders and information supplied to us by the listed beneficial owners, any Schedules 13D or 13G and other public documents filed with the SEC. The percentage of beneficial ownership is calculated based on 34,836,575 ordinary shares outstanding as of December 31, 2017.
| Amount and | Approximate | |||||||
| Nature | Percentage of | |||||||
| of Beneficial | Beneficial | |||||||
| Name and Address of Beneficial Owner(1) | Ownership | Ownership | ||||||
| Directors and Named Executive Officers | ||||||||
| Jose M. Daes | 240,642 | (2) | * | |||||
| Chief Executive Officer and Director | ||||||||
| Christian T. Daes | 178,540 | (2) | * | |||||
| Chief Operating Officer and Director | ||||||||
| Samuel R. Azout | 12,520 | * | ||||||
| Director | ||||||||
| Juan Carlos Vilariño | 28,475 | * | ||||||
| Director | ||||||||
| A. Lorne Weil | 107,005 | (3) | * | |||||
| Chairman of the Board | ||||||||
| Julio A. Torres | 105,520 | * | ||||||
| Director | ||||||||
| Martha L. Byorum | 94,167 | * | ||||||
| Director | ||||||||
| All directors and executive officers as a group (8 persons) | 766,869 | 2.2 | % | |||||
| Five Percent Holders: | ||||||||
| Energy Holding Corporation | 22,775,121 | (4) | 65.4 | % | ||||
| 51 |
* Less than 1%
| (1) | Unless otherwise indicated, the business address of each of the individuals is Avenida Circunvalar a 100 mts de la Via 40, Barrio Las Flores, Barranquilla, Colombia. | ||
| (2) | Does not include shares held by Energy Holding Corporation, in which this person has an indirect ownership interest. | ||
| (3) | Does not include 253,000 ordinary shares held by Child’s Trust f/b/o Francesca Weil u/a dated March 4, 2010 and 253,000 ordinary shares held by Child’s Trust f/b/o Alexander Weil u/a dated March 4, 2010, irrevocable trusts established for the benefit of Mr. Weil’s children. | ||
| (4) | Represents all ordinary shares held by Energy Holding Corporation, of which Messrs. Joaquin Fernandez and Alberto Velilla Becerra are directors and may be deemed to share voting and dispositive power over such shares. |
Equity Compensation Plans
| Category | Number
of securities to be issued upon exercise of outstanding options, warrants and rights | Weighted- average exercise price of outstanding options, warrants and rights | Number
of securities remaining available for future issuance under equity compensation plans (excluding securities reflected in first column | |||||||||
| Equity compensation plans approved by security holders | - | - | 1,593,917 | |||||||||
| Equity compensation plans not approved by security holders | - | - | - | |||||||||
| Total | - | - | 1,593,917 | |||||||||
On December 20, 2013, our shareholders approved our 2013 Long-Term Equity Incentive Plan (“2013 Plan”). Under the 2013 Plan, 1,593,917 ordinary shares are reserved for issuance in accordance with the plan’s terms to eligible employees, officers, directors and consultants. As of December 31, 2017, no awards had been made under the 2013 Plan.
| 52 |
| Item 13. | Certain Relationships and Related Transactions, and Director Independence. |
Related Transactions
Ventanas Solar S.A.
Ventanas Solar S.A., a Panama sociedad anonima, is an importer and installer of the Company’s products in Panama. Family members of the Company’s CEO and COO and other related parties own 100% of the equity in VS. The Company’s sales to VS for the year ended December 31, 2017, 2016 and 2015 were $3.7 million, $8.3 million and $5.4 million, respectively. Outstanding receivables from VS at December 31, 2017, 2016 and 2015 were $6.3 million, $9.1 million and $9.4 million, respectively.
Indemnification Agreements
Effective March 5, 2014, we entered into indemnification agreements with each of our executive officers and members of our board of directors. The indemnification agreements supplement our Third Amended and Restated Memorandum and Articles of Association and Cayman Islands law in providing certain indemnification rights to these individuals. The indemnification agreements provide, among other things that we will indemnify these individuals to the fullest extent permitted by Cayman Islands law and to any greater extent that Cayman Islands law may in the future permit, including the advancement of attorneys’ fees and other expenses incurred by such individuals in connection with any threatened, pending or completed action, suit or other proceeding, whether of a civil, criminal, administrative, regulatory, legislative or investigative nature, relating to any occurrence or event before or after the date of the indemnification agreements, by reason of the fact that such individuals is or were our directors or executive officers, subject to certain exclusions and procedures set forth in the indemnification agreements, including the absence of fraud or willful default on the part of the indemnitee and, with respect to any criminal proceeding, that the indemnitee had no reasonable cause to believe his conduct was unlawful.
| 53 |
Related Person Policy
Our Code of Ethics requires us to avoid, wherever possible, all related party transactions that could result in actual or potential conflicts of interests, except under guidelines approved by the board of directors (or the audit committee). Related-party transactions are defined as transactions in which (1) the aggregate amount involved will or may be expected to exceed $120,000 in any calendar year, (2) we or any of our subsidiaries are a participant, and (3) any (a) executive officer, director or nominee for election as a director, (b) greater than 5% beneficial owner of our ordinary shares, or (c) immediate family member, of the persons referred to in clauses (a) and (b), has or will have a direct or indirect material interest (other than solely as a result of being a director or a less than 10% beneficial owner of another entity). A conflict of interest situation can arise when a person takes actions or has interests that may make it difficult to perform his or her work objectively and effectively. Conflicts of interest may also arise if a person, or a member of his or her family, receives improper personal benefits as a result of his or her position.
Our audit committee, pursuant to its written charter, is responsible for reviewing and approving related-party transactions to the extent we enter into such transactions. The audit committee will consider all relevant factors when determining whether to approve a related party transaction, including whether the related party transaction is on terms no less favorable than terms generally available to an unaffiliated third-party under the same or similar circumstances and the extent of the related party’s interest in the transaction. No director may participate in the approval of any transaction in which he is a related party, but that director is required to provide the audit committee with all material information concerning the transaction. Additionally, we require each of our directors and executive officers to complete directors’ and officers’ questionnaires that elicit information about related party transactions.
These procedures are intended to determine whether any such related party transaction impairs the independence of a director or presents a conflict of interest on the part of a director, employee or officer.
Director Independence
We adhere to the NASDAQ listing standards in determining whether a director is independent. Our board of directors consults with its counsel to ensure that the board’s determinations are consistent with those rules and all relevant securities and other laws and regulations regarding the independence of directors.
The NASDAQ listing standards define an “independent director” as a person, other than an executive officer of a company or any other individual having a relationship which, in the opinion of the issuer’s board of directors, would interfere with the exercise of independent judgment in carrying out the responsibilities of a director. Consistent with these considerations, we have affirmatively determined that Messrs. Weil, Azout, Vilariño, Torres and Ms. Byorum qualify as independent directors. Our independent directors have regularly scheduled meetings at which only independent directors are present.
| Item 14. | Principal Accounting Fees and Services. |
Effective December 30, 2014, the firm of PricewaterhouseCoopers Ltda. acts as our independent registered public accounting firm. The Company paid $0.6 million, $0.9 million, and $0.6 million to PricewaterhouseCoopers Ltda for audit fees during 2017,2016 and 2015, respectively.
Audit Committee Approval
Our audit committee pre-approved all the services performed by PricewaterhouseCoopers Ltda. In accordance with Section 10A(i) of the Securities Exchange Act of 1934, before we engage our independent accountant to render audit or non-audit services on a going-forward basis, the engagement will be approved by our audit committee.
| 54 |
| Item 15. | Exhibits, Financial Statement Schedules. |
| (a) | The following documents are filed as part of this Form 10-K: |
| (1) | Consolidated Financial Statements: |
| (2) | Financial Statement Schedules: |
None.
| (3) | The following exhibits are filed as part of this Form 10-K |
| 55 |
| Exhibit No. |
Description | Included | Form | Filing Date | ||||
| 31.1 | Certification of Principal Executive Officer pursuant to Section 302 of the Sarbanes-Oxley Act of 2002. | Herewith | ||||||
| 31.2 | Certification of Principal Financial and Accounting Officer pursuant to Section 302 of the Sarbanes-Oxley Act of 2002. | Herewith | ||||||
| 32 | Certification Pursuant to 18 U.S.C. Section 1350, as Adopted Pursuant to Section 906 of the Sarbanes-Oxley Act of 2002 | Herewith |
| 101.INS | XBRL Instance Document | Herewith | |||
| 101.SCH | XBRL Taxonomy Extension Schema | Herewith | |||
| 101.CAL | XBRL Taxonomy Extension Calculation Linkbase | Herewith | |||
| 101.DEF | XBRL Taxonomy Extension Definition Linkbase | Herewith | |||
| 101.LAB | XBRL Taxonomy Extension Label Linkbase | Herewith | |||
| 101.PRE | XBRL Taxonomy Extension Presentation Linkbase | Herewith |
| Item 16. | Form 10-K Summary. |
None.
| 56 |
SIGNATURES
Pursuant to the requirements of the Section 13 or 15 or 15(d) of the Securities Exchange Act of 1934, the registrant has duly caused this report to be signed on its behalf by the undersigned, thereunto duly authorized on the 14th day of March, 2018.
| TECNOGLASS INC. | ||
| By: | /s/ Santiago Giraldo | |
| Name: | Santiago Giraldo | |
| Title: | Chief Financial Officer (Principal | |
| Financial and Accounting Officer) | ||
The undersigned directors and officers of Tecnoglass Inc. hereby constitute and appoint Jose Daes and Santiago Giraldo with full power to act as our true and lawful attorney-in-fact with full power to execute in our name and behalf in the capacities indicated below, this annual report on Form 10-K and any and all amendments thereto and to file the same, with all exhibits thereto and other documents in connection therewith, with the Securities and Exchange Commission, and hereby ratify and confirm all that such attorneys-in-fact, or any of them, or their substitutes shall lawfully do or cause to be done by virtue hereof.
In accordance with the Securities Exchange Act of 1934, this report has been signed below by the following persons on behalf of the registrant and in the capacities and on the dates indicated.
| Name | Title | Date | ||
| /s/ Jose M. Daes | Chief Executive Officer | March 14, 2018 | ||
| Jose M. Daes | (Principal Executive Officer) | |||
| /s/ Christian T. Daes | Chief Operating Officer | March 14, 2018 | ||
| Christian T. Daes | ||||
| /s/ Santiago Giraldo | Chief Financial Officer | March 14, 2018 | ||
| Santiago Giraldo | (Principal Financial and Accounting Officer) | |||
| /s/ A. Lorne Weil | Director (Non-Executive Chairman) | March 14, 2018 | ||
| A. Lorne Weil | ||||
| /s/ Samuel R. Azout | Director | March 14, 2018 | ||
| Samuel R. Azout | ||||
| /s/ Juan Carlos Vilariño | Director | March 14, 2018 | ||
| Juan Carlos Vilariño | ||||
| /s/ Martha Byorum | Director | March 14, 2018 | ||
| Martha Byorum | ||||
| /s/ Julio A. Torres | Director | March 14, 2018 | ||
| Julio A. Torres |
| 57 |
Tecnoglass Inc.
INDEX TO CONSOLIDATED FINANCIAL STATEMENTS
| F-1 |
Report of Independent Registered Public Accounting Firm
To the Board of Directors and Shareholders
of Tecnoglass Inc.
March 14, 2018
Opinions on the Financial Statements and Internal Control over Financial Reporting
We have audited the accompanying consolidated balance sheets of Tecnoglass Inc. and its subsidiaries as of December 31, 2017 and 2016, and the related consolidated statements of operations and comprehensive income, of changes in shareholders’ equity and of cash flows, for each of the three years in the period ended December 31, 2017, including the related notes (collectively referred to as the “consolidated financial statements”). We also have audited the Company’s internal control over financial reporting as of December 31, 2017, based on criteria established in Internal Control - Integrated Framework (2013) issued by the Committee of Sponsoring Organizations of the Treadway Commission (COSO).
In our opinion, the consolidated financial statements referred to above present fairly, in all material respects, the financial position of the Company as of December 31, 2017 and 2016, and the results of their operations and their cash flows for each of the three years in the period ended December 31, 2017 in conformity with accounting principles generally accepted in the United States of America. Also in our opinion, the Company maintained in all material respects, effective internal control over financial reporting as of December 31, 2017, based on criteria established in Internal Control - Integrated Framework (2013) issued by the COSO.
Basis for Opinions
The Company’s management is responsible for these consolidated financial statements, for maintaining effective internal control over financial reporting, and for its assessment of the effectiveness of internal control over financial reporting, included in Management’s Report on Internal Control over Financial Reporting appearing under Item 9A.
Our responsibility is to express opinions on the Company’s consolidated financial statements and on the Company’s internal control over financial reporting based on our audits. We are a public accounting firm registered with the Public Company Accounting Oversight Board (United States) (“PCAOB”) and are required to be independent with respect to the Company in accordance with the U.S. federal securities laws and the applicable rules and regulations of the Securities and Exchange Commission and the PCAOB.
We conducted our audits in accordance with the standards of the PCAOB and in accordance with auditing standards generally accepted in the United States of America. Those standards require that we plan and perform the audits to obtain reasonable assurance about whether the consolidated financial statements are free of material misstatement, whether due to error or fraud, and whether effective internal control over financial reporting was maintained in all material respects.
| F-2 |
Our audits of the consolidated financial statements included performing procedures to assess the risks of material misstatement of the consolidated financial statements, whether due to error or fraud, and performing procedures that respond to those risks. Such procedures included examining, on a test basis, evidence regarding the amounts and disclosures in the consolidated financial statements. Our audits also included evaluating the accounting principles used and significant estimates made by management, as well as evaluating the overall presentation of the consolidated financial statements. Our audit of internal control over financial reporting included obtaining an understanding of internal control over financial reporting, assessing the risk that a material weakness exists, and testing and evaluating the design and operating effectiveness of internal control based on the assessed risk. Our audits also included performing such other procedures as we considered necessary in the circumstances. We believe that our audits provide a reasonable basis for our opinions.
As described in Management’s Annual Report on Internal Control over Financial Reporting], management has excluded GM&P from its assessment of internal control over financial reporting as of December 31, 2017 because it was acquired by the Company in a purchase business combination during 2017. We have also excluded GM&P from our audit of internal control over financial reporting. GM&P is a wholly-owned subsidiary whose total assets and total revenues excluded from management’s assessment and our audit of internal control over financial reporting represent 11% and 19%, respectively, of the related consolidated financial statement amounts as of and for the year ended December 31, 2017.
Definition and Limitations of Internal Control over Financial Reporting
A company’s internal control over financial reporting is a process designed to provide reasonable assurance regarding the reliability of financial reporting and the preparation of financial statements for external purposes in accordance with generally accepted accounting principles. A company’s internal control over financial reporting includes those policies and procedures that (i) pertain to the maintenance of records that, in reasonable detail, accurately and fairly reflect the transactions and dispositions of the assets of the company; (ii) provide reasonable assurance that transactions are recorded as necessary to permit preparation of financial statements in accordance with generally accepted accounting principles, and that receipts and expenditures of the company are being made only in accordance with authorizations of management and directors of the company; and (iii) provide reasonable assurance regarding prevention or timely detection of unauthorized acquisition, use, or disposition of the company’s assets that could have a material effect on the financial statements.
Because of its inherent limitations, internal control over financial reporting may not prevent or detect misstatements. Also, projections of any evaluation of effectiveness to future periods are subject to the risk that controls may become inadequate because of changes in conditions, or that the degree of compliance with the policies or procedures may deteriorate.
| /s/ PricewaterhouseCoopers Ltda. | |
| Bogotá, Colombia | |
| March 14, 2018 | |
| We have served as the Company’s auditor since 2014. |
| F-3 |
Tecnoglass Inc. and Subsidiaries
(In thousands, except share and per share data)
| December 31, 2017 | December 31, 2016 | |||||||
| ASSETS | ||||||||
| Current assets: | ||||||||
| Cash and cash equivalents | $ | 40,923 | $ | 26,918 | ||||
| Investments | 1,680 | 1,537 | ||||||
| Trade accounts receivable, net | 110,464 | 92,297 | ||||||
| Unbilled receivables on uncompleted contracts | 9,996 | 6,625 | ||||||
| Due from related parties | 8,500 | 10,995 | ||||||
| Other assets | 17,514 | 16,089 | ||||||
| Inventories | 71,656 | 55,092 | ||||||
| Prepaid expenses | 1,165 | 1,183 | ||||||
| Total current assets | 261,898 | 210,736 | ||||||
| Long term assets: | ||||||||
| Property, plant and equipment, net | 168,701 | 170,797 | ||||||
| Intangible assets | 11,517 | 4,555 | ||||||
| Goodwill | 23,130 | 1,330 | ||||||
| Other long term assets | 2,754 | 7,312 | ||||||
| Total long term assets | 206,102 | 183,994 | ||||||
| Total assets | $ | 468,000 | $ | 394,730 | ||||
| LIABILITIES AND SHAREHOLDERS’ EQUITY | ||||||||
| Current liabilities | ||||||||
| Short-term debt and current portion of long-term debt | $ | 3,260 | $ | 2,651 | ||||
| Trade accounts payable | 55,182 | 38,981 | ||||||
| Accrued interest expense | 7,392 | 3,565 | ||||||
| Dividend Payable | 585 | 3,486 | ||||||
| Due to related parties | 975 | 3,668 | ||||||
| Payable associated to GM&P acquisition | 29,000 | - | ||||||
| Taxes payable | 12,076 | 16,845 | ||||||
| Labor liabilities | 1,550 | 1,410 | ||||||
| Current portion of customer advances on uncompleted contracts | 11,429 | 7,780 | ||||||
| Total current liabilities | 121,449 | 78,386 | ||||||
| Deferred income taxes | 2,317 | 3,523 | ||||||
| Customer advances on uncompleted contracts | 1,571 | 2,310 | ||||||
| Long-term debt | 220,998 | 196,946 | ||||||
| Total long term liabilities | 224,886 | 202,779 | ||||||
| Total liabilities | $ | 346,335 | $ | 281,165 | ||||
| Commitments and contingencies | ||||||||
| Shareholders’ equity | ||||||||
| Preferred shares, $0.0001 par value, 1,000,000 shares authorized, 0 shares issued and outstanding at December 31, 2017 and 2016 | $ | - | $ | - | ||||
| Ordinary shares, $0.0001 par value, 100,000,000 shares authorized, 34,836,575 and 33,172,144 shares issued and outstanding at December 31, 2017 and 2016, respectively | 3 | 3 | ||||||
| Legal reserves | 1,367 | 1,367 | ||||||
| Additional paid capital | 125,317 | 114,847 | ||||||
| Retained earnings | 22,212 | 26,548 | ||||||
| Accumulated other comprehensive income (loss) | (28,587 | ) | (29,200 | ) | ||||
| Shareholders’ equity attributable to contolling interest | 120,248 | 113,565 | ||||||
| Shareholders’ equity attributable to non-contolling interest | 1,417 | - | ||||||
| Total shareholders’ equity | 121,665 | 113,565 | ||||||
| Total liabilities and shareholders’ equity | $ | 468,000 | $ | 394,730 | ||||
The accompanying notes are an integral part of these consolidated financial statements.
| F-4 |
Tecnoglass Inc. and Subsidiaries
Consolidated Statements of Operations and Comprehensive Income
(In thousands, except share and per share data)
| Years ended December 31, | ||||||||||||
| 2017 | 2016 | 2015 | ||||||||||
| Operating revenue: | ||||||||||||
| Customers | $ | 309,375 | $ | 295,274 | $ | 232,297 | ||||||
| Related Parties | 5,081 | 9,742 | 9,942 | |||||||||
| Total Operating Revenue | 314,456 | 305,016 | 242,239 | |||||||||
| Cost of sales | 215,274 | 192,369 | 151,381 | |||||||||
| Gross profit | 99,182 | 112,647 | 90,858 | |||||||||
| Operating expenses: | ||||||||||||
| Selling | 30,656 | 32,267 | 27,603 | |||||||||
| Provision for bad debts and write offs | 3,128 | 4,686 | 1,477 | |||||||||
| General and administration | 31,034 | 27,846 | 22,187 | |||||||||
| Operating expenses | 64,818 | 64,799 | 51,267 | |||||||||
| Operating income | 34,364 | 47,848 | 39,591 | |||||||||
| Change in fair value of warrant liability | - | 776 | (24,901 | ) | ||||||||
| Change in fair value of earnout shares liability | - | 4,674 | (10,858 | ) | ||||||||
| Non-operating income, net | 3,190 | 4,155 | 5,054 | |||||||||
| Foreign currency transaction gains (losses) | (3,028 | ) | (1,387 | ) | 10,059 | |||||||
| Loss on extinguishment of debt | (3,136 | ) | - | - | ||||||||
| Interest expense | (19,872 | ) | (16,814 | ) | (9,274 | ) | ||||||
| Income before taxes | 11,518 | 39,252 | 9,671 | |||||||||
| Income tax provision | 5,793 | 16,072 | 20,691 | |||||||||
| Net income (loss) | $ | 5,725 | $ | 23,180 | $ | (11,020 | ) | |||||
| Less: Net income attributable to non-controlling interest | (276 | ) | - | - | ||||||||
| Net income (loss) attributable to parent | 5,449 | 23,180 | (11,020 | ) | ||||||||
| Comprehensive income: | ||||||||||||
| Net income (loss) | $ | 5,725 | $ | 23,180 | $ | (11,020 | ) | |||||
| Foreign currency translation adjustments | 549 | 1,969 | (19,738 | ) | ||||||||
| Total comprehensive income (loss) | $ | 6,274 | $ | 25,149 | $ | (30,758 | ) | |||||
| Basic income (loss) per share | $ | 0.16 | $ | 0.75 | $ | (0.38 | ) | |||||
| Diluted income (loss) per share | $ | 0.16 | $ | 0.72 | $ | (0.38 | ) | |||||
| Basic weighted average common shares outstanding | 34,822,313 | 30,850,866 | 29,081,196 | |||||||||
| Diluted weighted average common shares outstanding | 35,321,393 | 32,371,960 | 29,081,196 | |||||||||
The accompanying notes are an integral part of these consolidated financial statements.
| F-5 |
Tecnoglass, Inc. and Subsidiaries
Consolidated Statements of Shareholders’ Equity
For the Years Ended December 31, 2017, 2016 and 2015
(In thousands, except share data)
| Ordinary
Shares, $0.0001 Par Value | Additional Paid in | Legal | Retained Earnings (Accumulated | Accumulated Other Comprehensive | Total Shareholders’ Equity Arreibutable | Non- Controlling | Total Shareholders’ | |||||||||||||||||||||||||||||
| Shares | Amount | Capital | Reserve | Deficit) | Loss | to Parent | Interest | Equity | ||||||||||||||||||||||||||||
| Balance at January 1, 2015 | 24,801,132 | $ | 2 | $ | 26,140 | $ | 1,367 | $ | 34,458 | $ | (11,431 | ) | $ | 50,536 | $ | - | $ | 50,536 | ||||||||||||||||||
| Issuance of common stock | 500,000 | 5,765 | - | - | - | 5,765 | - | 5,765 | ||||||||||||||||||||||||||||
| Exercise of warrants | 1,001,848 | 1 | 13,679 | - | - | - | 13,680 | - | 13,680 | |||||||||||||||||||||||||||
| Exercise of Unit Purchase Options | 592,656 | - | - | - | - | - | - | - | - | |||||||||||||||||||||||||||
| ESWindows Acuisition | - | - | - | - | (1,409 | ) | - | (1,409 | ) | - | (1,409 | ) | ||||||||||||||||||||||||
| Foreign currency translation | - | - | - | - | (19,738 | ) | (19,738 | ) | - | (19,738 | ) | |||||||||||||||||||||||||
| Net income | - | - | - | - | (11,020 | ) | - | (11,020 | ) | - | (11,020 | ) | ||||||||||||||||||||||||
| Balance at December 31, 2015 | 26,895,636 | $ | 3 | $ | 45,584 | $ | 1,367 | $ | 22,028 | $ | (31,169 | ) | $ | 37,813 | $ | - | $ | 37,813 | ||||||||||||||||||
| Issuance of common stock | 2,500,000 | - | 30,279 | - | - | - | 30,279 | - | 30,279 | |||||||||||||||||||||||||||
| Cash Dividend | - | - | - | - | (4,226 | ) | - | (4,226 | ) | - | (4,226 | ) | ||||||||||||||||||||||||
| Stock dividend | 272,505 | - | 12,171 | - | (12,171 | ) | - | (0 | ) | - | (0 | ) | ||||||||||||||||||||||||
| Exercise of warrants | 2,690,261 | - | 30,437 | - | - | - | 30,437 | - | 30,437 | |||||||||||||||||||||||||||
| Exercise of Unit Purchase Options | 58,297 | - | 404 | - | - | - | 404 | - | 404 | |||||||||||||||||||||||||||
| Share based compensation | 21,045 | - | 292 | - | - | - | 292 | - | 292 | |||||||||||||||||||||||||||
| ESWindows Distribution prior to acquisiiton | 734,400 | - | (4,320 | ) | - | (2,263 | ) | - | (6,583 | ) | - | (6,583 | ) | |||||||||||||||||||||||
| Foreign currency translation | - | - | - | - | - | 1,969 | 1,969 | - | 1,969 | |||||||||||||||||||||||||||
| Net income | - | - | - | - | 23,180 | - | 23,180 | - | 23,180 | |||||||||||||||||||||||||||
| Balance at December 31, 2016 | 33,172,144 | $ | 3 | $ | 114,847 | $ | 1,367 | $ | 26,548 | $ | (29,200 | ) | $ | 113,565 | $ | - | $ | 113,565 | ||||||||||||||||||
| Dividend | 1,619,812 | - | 10,212 | - | (9,785 | ) | - | 427 | - | 427 | ||||||||||||||||||||||||||
| Exercise of Unit Purchase Options | 8,559 | - | - | - | - | - | - | - | - | |||||||||||||||||||||||||||
| Share based compensation | 36,060 | - | 258 | - | - | - | 258 | - | 258 | |||||||||||||||||||||||||||
| Non Controlling Interest GM&P | - | - | - | - | - | - | - | 1,141 | 1,141 | |||||||||||||||||||||||||||
| Foreign currency translation | - | - | - | - | - | 549 | 549 | - | 549 | |||||||||||||||||||||||||||
| Net income | - | - | - | - | 5,449 | - | 5,449 | 276 | 5,725 | |||||||||||||||||||||||||||
| Balance at December 31, 2017 | 34,836,575 | $ | 3 | $ | 125,317 | $ | 1,367 | $ | 22,212 | $ | (28,651 | ) | $ | 120,248 | $ | 1,417 | $ | 121,665 | ||||||||||||||||||
The accompanying notes are an integral part of these consolidated financial statements.
| F-6 |
Tecnoglass Inc. and Subsidiaries
Consolidated Statements of Cash Flows
(In thousands)
| Years Ended December 31, | ||||||||||||
| 2017 | 2016 | 2015 | ||||||||||
| CASH FLOWS FROM OPERATING ACTIVITIES | ||||||||||||
| Net income (loss) | $ | 5,725 | $ | 23,180 | $ | (11,020 | ) | |||||
| Adjustments to reconcile net income (loss) to net cash (used in) provided by operating activities: | ||||||||||||
| Depreciation and amortization | 20,969 | 15,522 | 12,464 | |||||||||
| Provision for bad debts | 3,128 | 4,686 | 1,477 | |||||||||
| Provision for obsolete inventory | 80 | 238 | (255 | ) | ||||||||
| Other fair value adjustments, net | (72 | ) | (54 | ) | (59 | ) | ||||||
| (Gain) Loss on disposition of assets | 17 | (477 | ) | 232 | ||||||||
| Change in fair value of earnout share liability | - | (4,674 | ) | 10,858 | ||||||||
| Change in fair value of warrant liability | - | (776 | ) | 24,901 | ||||||||
| Director Stock compensation | 284 | 300 | - | |||||||||
| Deferred income taxes | (6,137 | ) | (247 | ) | (119 | ) | ||||||
| Extinguishment of Debt | 2,558 | - | - | |||||||||
| Amortization of deferred financing costs | 1,204 | - | - | |||||||||
| Changes in operating assets and liabilities, net of effects from acquisitions: | ||||||||||||
| Trade Accounts Receivable | 2,497 | (25,979 | ) | (29,394 | ) | |||||||
| Inventories | (16,447 | ) | (4,305 | ) | (29,185 | ) | ||||||
| Prepaid expenses | 22 | 799 | (1,503 | ) | ||||||||
| Other assets | (2,004 | ) | 1,343 | (9,535 | ) | |||||||
| Unbilled receivables | (10,653 | ) | (7,768 | ) | (2,668 | ) | ||||||
| Trade accounts payable | 13,055 | (985 | ) | 14,761 | ||||||||
| Accrued interest expense | 3,769 | 2,559 | 662 | |||||||||
| Taxes payable | (8,542 | ) | (2,299 | ) | 14,055 | |||||||
| Labor liabilities | 134 | 439 | 221 | |||||||||
| Related parties | 1,815 | 2,259 | 295 | |||||||||
| Advances from customers | 2,807 | (6,846 | ) | 6,323 | ||||||||
| CASH PROVIDED BY (USED IN) OPERATING ACTIVITIES | $ | 14,209 | $ | (3,085 | ) | $ | 2,511 | |||||
| CASH FLOWS FROM INVESTING ACTIVITIES | ||||||||||||
| Acquisition of property and equipment | (7,027 | ) | (22,906 | ) | (14,901 | ) | ||||||
| Proceeds from sale of property and equipment | - | 686 | 4,470 | |||||||||
| Acquisition of businesses and intangible assets | (7,873 | ) | - | - | ||||||||
| Proceeds from sale of investments | 571 | 24,486 | 1,913 | |||||||||
| Purchase of investments | (600 | ) | (26,975 | ) | (877 | ) | ||||||
| CASH USED IN INVESTING ACTIVITIES | $ | (14,929 | ) | $ | (24,709 | ) | $ | (9,395 | ) | |||
| CASH FLOWS FROM FINANCING ACTIVITIES | ||||||||||||
| Proceed from bond issuance | 201,801 | - | - | |||||||||
| Repayments of debt and capital leases | (205,330 | ) | (163,126 | ) | (102,356 | ) | ||||||
| Proceeds from debt | 20,761 | 196,468 | 113,274 | |||||||||
| Proceeds from the exercise of unit purchase options | - | 404 | - | |||||||||
| Dividends paid | (2,471 | ) | (741 | ) | - | |||||||
| Subsidiary distributions prior to acquisition | - | (2,263 | ) | (1,409 | ) | |||||||
| Proceeds from the exercise of warrants | - | 800 | - | |||||||||
| CASH PROVIDED BY FINANCING ACTIVITIES | $ | 14,761 | $ | 31,542 | $ | 9,509 | ||||||
| Effect of exchange rate changes on cash and cash equivalents | (36 | ) | 499 | 720 | ||||||||
| NET INCREASE IN CASH | 14,005 | 4,247 | 3,345 | |||||||||
| CASH - Beginning of year | 26,918 | 22,671 | 19,326 | |||||||||
| CASH - End of year | $ | 40,923 | $ | 26,918 | $ | 22,671 | ||||||
| SUPPLEMENTAL DISCLOSURES OF CASH FLOW INFORMATION | ||||||||||||
| Cash paid during the year for: | ||||||||||||
| Interest | $ | 15,774 | $ | 8,696 | $ | 6,916 | ||||||
| Taxes | $ | 17,834 | $ | 25,825 | $ | 13,212 | ||||||
| NON-CASH INVESTING AND FINANCING ACTIVITES: | ||||||||||||
| Assets acquired under capital lease, financial obligations or credit | $ | 1,751 | $ | 19,641 | $ | 65,319 | ||||||
The accompanying notes are an integral part of these consolidated financial statements.
| F-7 |
Tecnoglass Inc. and Subsidiaries
Notes to Consolidated Financial Statements
(Amounts in thousands, except share and per share data)
| Note 1. | General |
Business Description
The Company manufactures hi-specification, architectural glass and windows for the global residential and commercial construction industries. Currently the Company offers design, production, marketing, and installation of architectural systems for buildings of high, medium and low elevation size. Products include windows and doors in glass and aluminum, office partitions and interior divisions, floating façades and commercial window showcases. The Company sells to customers in North, Central and South America, and exports about half of its production to foreign countries.
The Company manufactures both glass and aluminum products. Its glass products include tempered glass, laminated glass, thermo-acoustic glass, curved glass, silk-screened glass, acoustic glass and digital print glass. Its Alutions plant produces mill finished, anodized, painted aluminum profiles and rods, tubes, bars and plates. Alutions’ operations include extrusion, smelting, painting and anodizing processes, and exporting, importing and marketing aluminum products.
The Company also designs, manufactures, markets and installs architectural systems for high, medium and low rise construction, glass and aluminum windows and doors, office dividers and interiors, floating facades and commercial display windows.
In 2014, the Company established two Florida limited liability companies, Tecnoglass LLC (“Tecno LLC”) and Tecnoglass RE LLC (“Tecno RE”) to acquire manufacturing facilities, manufacturing machinery and equipment, customer lists and exclusive design permits.
In December 2016, as part of our strategy to vertically integrate our operations, we acquired 100% of the stock of ESW LLC, 85.06% of which was acquired directly by Tecnoglass and 14.94% by our subsidiary ES, for a total purchase price of $13.5 million, which consisted of (i) 734,400 ordinary shares issued in connection with the transaction for approximately $9.2 million based on a stock price of $12.50, (ii) approximately $2.3 million in cash, and (iii) approximately US$2.0 million related to the assignment of certain accounts receivable. The Acquisition is deemed to be a transaction between entities under common control, which, under applicable accounting guidelines, requires the assets and liabilities to be transferred at historical cost of the entity, with prior periods retroactively adjusted to furnish comparative information.
On March 1, 2017, the Company entered into and consummated a purchase agreement with Giovanni Monti, the owner of 100% of the outstanding shares of GM&P. GM&P is a consulting and glazing contracting company located in Miami, Florida with over 15 years of experience in the design and installation of various building enclosure systems such as curtain window walls and a long-standing commercial relationship with the Company, working alongside it in different projects within the U.S, by providing engineering and installation services to those projects. The Company acquired all of the shares of GM&P for a purchase price of $35 million, of which the Company paid $6 million of the purchase price in cash within 60 days following the closing date and the remaining $29 million of the purchase price to be originally payable on or before September 1, 2017 in cash, our ordinary shares or a combination of both, at our sole option; subsequently modified to be payable by May 2018.
| Note 2. | Basis of Presentation and Summary of Significant Accounting Policies |
Basis of Presentation and Management’s Estimates
The accompanying consolidated financial statements have been prepared in accordance with accounting principles generally accepted in the United States of America (“US GAAP”) and pursuant to the accounting and disclosure rules and regulations of the Securities and Exchange Commission (“SEC”).
Prior year financial information has been retroactively adjusted for an acquisition under common control. As the acquisition of ESW LLC was deemed to be a transaction between entities under common control, the assets and liabilities were transferred at the historical cost of ESW LLC, with prior periods retroactively adjusted to include the historical financial results of the acquired company for the period they were controlled by ESW LLC in the Company’s financial statements. The accompanying financial statements and related notes have been retroactively adjusted to include the historical results and financial position of the acquired company prior to the acquisition date during the periods the assets were under common control. All financial information presented for the periods after the ESW LLC acquisition represent the consolidated results of operations, financial position and cash flows of the Company with retroactive adjustments of the results of operations, financial position and cash flows of the acquired company during the periods the assets were under common control.
| F-8 |
The preparation of the accompanying consolidated financial statements requires the Company to make estimates and judgments that affect the reported amounts of assets and liabilities, revenues and expenses, and related disclosures of contingent assets and liabilities at the date of the Company’s financial statements. Actual results may differ from these estimates under different assumptions and conditions. Estimates inherent in the preparation of these consolidated financial statements relate to the collectability of account receivables, the valuation of inventories, estimated earnings on uncompleted contracts, useful lives and potential impairment of long-lived assets, and valuation of warrants and other derivative financial instruments.
Principles of Consolidation
These financial statements consolidate TGI, its indirect wholly-owned subsidiaries TG, ES and ESW LLC, its direct wholly owned subsidiaries GM&P, Tecno LLC and Tecno RE, and majority owned subsidiary Componenti, which are entities in which we have a controlling financial interest because we hold a majority voting interest. To determine if we hold a controlling financial interest in an entity, we first evaluate if we are required to apply the variable interest entity (“VIE”) model to the entity, otherwise the entity is evaluated under the voting interest model. All significant intercompany accounts and transactions are eliminated in consolidation.
Foreign Currency Translation and Transactions
The consolidated financial statements are presented in U.S. Dollars, the reporting currency. Our foreign subsidiaries’ local currency is the Colombian Peso, which is also their functional currency as determined by the market analysis, costs and expenses, assets, liabilities, financing and cash flow indicators. As such, our subsidiaries’ assets and liabilities are translated at the exchange rate in effect at the balance sheet date, with equity being translated at the historical rates. Revenues and expenses of our foreign subsidiaries are translated at the average exchange rates for the period. The resulting cumulative foreign currency translation adjustments from this process are included as a component of accumulated other comprehensive income (loss). Therefore, the U.S. Dollar value of these items in our financial statements fluctuates from period to period.
Cash and Cash Equivalents
Cash and cash equivalents include investments with original maturities of three months or less. As of December 31, 2017, 2016 and 2015, cash and cash equivalents were primarily comprised of deposits held in operating accounts in Colombia, Panama and United States. As of December 31, 2017, 2016 and 2015 the Company had no restricted cash.
Investments
The Company’s investments are comprised of marketable securities, short term deposits and income producing real estate.
Investments which are held for trading are recorded at fair value and fluctuations in value are recorded as a non-operating income or expense. In addition, we have investments in long-term marketable equity securities which are classified as available-for-sale securities and are recorded at fair value.
Short- term deposits and other financial instruments with maturities greater than 90 days and shares in other companies that do not meet the requirements for equity method treatment are recorded for at cost.
We also have investments in income-producing real estate. This real estate is recorded at cost and is depreciated using the straight-line method over its estimated useful life. The depreciation and rental income associated with this real estate are recognized in the consolidated statement of operations. These investments are recorded within long term assets on the Company’s balance sheet.
Trade Accounts Receivable
Trade accounts receivable are recorded net of allowances for cash discounts for prompt payment, doubtful accounts and sales returns. The Company’s policy is to reserve for uncollectible accounts based on its best estimate of the amount of probable credit losses in its existing accounts receivable. The Company periodically reviews its accounts receivable to determine whether an allowance for doubtful accounts is necessary based on an analysis of past due accounts and other factors that may indicate that the collectability of an account may be in doubt. Other factors that the Company considers include its existing contractual obligations, historical payment patterns of its customers and individual customer circumstances, and a review of the local economic environment and its potential impact on the collectability of accounts receivable. Account balances deemed to be uncollectible are written off after all means of collection have been exhausted and the potential for recovery is considered remote.
On certain fixed price contracts, a portion of the amounts billed are withheld by the customer as a retainage which typically amount to 10% of the invoiced amount and can remain outstanding for several months until a final good receipt of the complete project to the customers satisfaction.
| F-9 |
Concentration of Risks and Uncertainties
Financial instruments which potentially subject the Company to credit risk consist primarily of cash and trade accounts receivable. The Company mitigates its cash risk by maintaining its cash deposits with major financial institutions in the United States and Colombia. As discussed above, the Company mitigates its risk to trade accounts receivable by performing on-going credit evaluations of its customers.
Related party transactions
The Company has related party transactions such as sales, purchases, leases, guarantees, and other payments. We periodically performed a related party analysis to identify transactions to disclose. Depending on the transactions, we aggregate some related party information by type.
Inventories
Inventories of raw materials, which consist primarily of purchased and processed glass, aluminum, parts and supplies held for use in the ordinary course of business, are valued at the lower of cost or market. Cost is determined using a weighted-average method. Inventory consisting of certain job specific materials not yet installed (work in process) are valued using the specific identification method. Cost for finished product inventory are recorded and maintained at the lower of cost or market. Cost includes raw materials and direct and applicable indirect manufacturing overheads. Also, inventories related to contracts in progress are included within work in process and finished goods, and are stated at using the specific identification method and lower of cost or market, respectively, and are expected to turn over in less than one year.
Reserves for excess or slow-moving raw materials inventories are updated based on historical experience of a variety of factors including sales volume and levels of inventories at the end of the period. The Company does not maintain allowances for the lower of cost or market for inventories of finished products as its products are manufactured based on firm orders rather than built-to-stock.
Property, Plant and Equipment
Property, plant and equipment are recorded at cost. Significant improvements and renewals that extend the useful life of the asset are capitalized. Interest caused while acquired property is under construction and installation are capitalized. Repairs and maintenance are charged to expense as incurred. When property is retired or otherwise disposed of, the cost and related accumulated depreciation are removed from the accounts and any related gains or losses are included in income as a reduction to or increase in selling, general and administrative expenses. Depreciation is computed on a straight-line basis, based on the following estimated useful lives:
| Buildings | 20 years | |
| Machinery and equipment | 10 years | |
| Furniture and fixtures | 10 years | |
| Office equipment and software | 5 years | |
| Vehicles | 5 years |
The Company also records within fixed assets all the underlying assets of a capital lease. Initial recognition of these assets are done at the present value of all future lease payments. A capital lease is a lease in which the lessor transferred substantially all of the benefits and risks associated with the ownership of the property.
Long Lived Assets
The Company periodically reviews the carrying values of its long lived assets when events or changes in circumstances would indicate that it is more likely than not that their carrying values may exceed their realizable values, and record impairment charges when considered necessary.
When circumstances indicate that an impairment may have occurred, the Company tests such assets for recoverability by comparing the estimated undiscounted future cash flows expected to result from the use of such assets and their eventual disposition to their carrying amounts. If the undiscounted future cash flows are less than the carrying amount of the asset, an impairment loss, measured as the excess of the carrying value of the asset over its estimated fair value, is recognized. Fair value is determined through various valuation techniques, including discounted cash flow models, quoted market values and third-party independent appraisals, as considered necessary.
| F-10 |
Goodwill
We review goodwill for impairment each year on December 31st or more frequently when events or significant changes in circumstances indicate that the carrying value may not be recoverable. Under ASC 350-20-35-4 through 35-8A, the goodwill impairment test requires a comparison of the fair value of the reporting unit with its carrying amount, including goodwill. If the carrying amount of the reporting unit is greater than zero and its fair value exceeds its carrying amount, goodwill of the reporting unit is considered not impaired. The Company has only one reporting unit and as such the impairment analysis was done by comparing the Company’s market capitalization with its book value of equity. As of our December 31, 2017, the Company’s market capitalization exceeded its book value of equity and as such no impairment of goodwill was indicated. See Note 7- Goodwill and Intangible Assets for additional information.
Intangible Assets
Intangible assets with definite lives subject to amortization are amortized on a straight-line basis. We also review these intangibles for impairment when events or significant changes in circumstance indicate that the carrying value may not be recoverable. Events or circumstances that indicate that impairment testing may be required include changes in building codes and regulation, loss of key personnel or a significant adverse change in business climate or regulations. There were no triggering events or circumstances noted and as such no impairment was needed for the intangible assets subject to amortization. See Note 7 - Goodwill and Intangible Assets for additional information.
Common Stock Purchase Warrants
The Company classifies as equity any warrants contracts that (i) require physical settlement or net-share settlement or (ii) gives the Company a choice of net-cash settlement or settlement in its own shares (physical settlement or net-share settlement). The Company classifies as assets or liabilities any contracts that (i) require net-cash settlement (including a requirement to net cash settle the contract if an event occurs and if that event is outside the Company’s control) or (ii) gives the counterparty a choice of net-cash settlement or settlement in shares (physical settlement or net-share settlement).
The Company assesses classification of its common stock purchase warrants and other freestanding derivatives, if any, at each reporting date to determine whether a change in classification between assets and liabilities is required. As of December 20, 2016, the Company no longer has warrants outstanding.
Financial Liabilities
Financial liabilities correspond to the financing obtained by the Company through bank credit facilities and accounts payable to suppliers and creditors. Financial liabilities are initially recognized based on their fair value, which is usually equal to the transaction value less directly attributable costs. Subsequently, such financial liabilities are carried at their amortized cost according to the effective interest rate method determined at initial recognition, and recognized in the results of the period during the time of amortization of the financial obligation.
| F-11 |
Stock-Based Compensation
We account for stock-based compensation in accordance with ASC 718, Compensation - Stock Compensation. ASC 718 requires compensation costs related to share-based transactions, including employee stock options, to be recognized based on fair value. The Company accounts for share-based awards exchanged for employee services at the estimated grant date fair value of the award. In October 2015, the Company authorized to grant each non-employee director $50 worth of ordinary shares of the Company payable annually and first payment was made in October 2016. In November 2016 the Company authorized additional payment of $8 on an annual basis to members of the Company´s Audit Committee members and $18 on an annual basis to the Chair of the Audit Committee, all of whom are members of the board of directors. The Company recorded director stock compensation of $284 and $247 during the years ended December 31, 2017 and 2016. No expense was recorded in 2015.
Fair Value of Financial Instruments
ASC 820, Fair Value Measurements, establishes a fair value hierarchy which requires us to maximize the use of observable inputs and minimize the use of unobservable inputs when measuring fair value. We primarily apply the market approach for financial assets and liabilities measured at fair value on a recurring basis. Fair value is the price we would receive to sell and asset or pay to transfer a liability in an orderly transaction with a market participant at the measurement date. In the absence of active markets for identical assets or liabilities, such measurements involve developing assumptions based on market observable data and, in the absence of such data, internal information that is consistent with what market participants would use in a hypothetical transaction that occurs at the measurement date.
The standard describes three level of inputs that may be used to measure fair value:
Level 1: Quoted prices in active markets for identical assets or liabilities.
Level 2: Observable inputs other than Level 1 prices, such as quoted prices for similar assets or liabilities; quoted prices in markets that are not active; or other inputs that are observable by observable market data for substantially the full term of the assets or liabilities.
Level 3: Unobservable inputs that are supported by little or no market activity and that are significant to the fair value of the assets or liabilities.
See Note 12 - Fair Value Measurements.
| F-12 |
Revenue Recognition
Our principal sources of revenue are derived from product sales of manufactured glass and aluminum products. Revenue is recognized when (i) persuasive evidence of an arrangement exists in the form of a signed purchase order or contract, (ii) delivery has occurred per contracted terms, (iii) fees and prices are fixed and determinable, and (iv) collectability of the sale is reasonably assured. All revenue is recognized net of discounts, returns and allowances. Delivery to the customer is deemed to have occurred when the title is passed to the customer. Generally, title passes to the customer upon shipment, but title transfer may occur when the customer receives the product based on the terms of the agreement with the customer.
Revenues from fixed price contracts, which amount to approximately 47.0%, 16.0% and 21.6% of the Company’s sales for the year ended December 31, 2017, 2016 and 2015, respectively, are recognized using the percentage-of-completion method, measured by the percentage of costs incurred to date to total estimated costs for each contract. Revenues recognized in advance of amounts billable pursuant to contracts terms are recorded as unbilled receivables on uncompleted contracts based on work performed and costs to date. Unbilled receivables on uncompleted contracts are billable upon various events, including the attainment of performance milestones, delivery and installation of products, or completion of the contract. Revisions to cost estimates as contracts progress have the effect of increasing or decreasing expected profits each period. Changes in contract estimates occur for a variety of reasons, including changes in contract scope, estimated revenue and estimated costs to complete. Provisions for estimated losses on uncompleted contracts are made in the period in which such losses are determined. Changes in contract performance and estimated profitability may result in revisions to costs and income and are recognized in the period in which the revisions are determined and do not have a material effect on the Company’s financial statements.
Shipping and Handling Costs
The Company classifies amounts billed to customers related to shipping and handling as product revenues. The Company records and presents shipping and handling costs in selling expenses.
Sales Tax and Value Added Taxes
The Company accounts for sales taxes and value added taxes imposed on its goods and services on a net basis - value added taxes paid for goods and services purchased is netted against value added tax collected from customers and the net amount is paid to the government. The current value added tax rate in Colombia for all of the Company’s products is 19%. A municipal industry and commerce tax (ICA) sales tax of 0.7% is payable on all of the Company’s products sold in the Colombian market.
Product Warranties
The Company offers product warranties in connection with the sale and installation of its products that are competitive in the markets in which the products are sold. Standard warranties depend upon the product and service, and are generally from five to ten years for architectural glass, curtain wall, laminated and tempered glass, window and door products. Warranties are not priced or sold separately and do not provide the customer with services or coverages in addition to the assurance that the product complies with original agreed-upon specifications. Claims are settled by replacement of the warrantied products.
The Company evaluated historical information regarding claims for replacements under warranties and concluded that the costs that the Company has incurred in relation to these warranties have not been material.
Advertising Costs
Advertising costs are expensed as they are incurred and are included in general and administrative expenses. Advertising costs for the years ended December 31, 2017, 2016 and 2015 amounted to approximately $1,385, $1,293 and $958, respectively.
Employee Benefits
The Company provides benefits to its employees in accordance with Colombian labor laws. Employee benefits do not give rise to any long term liability.
Income Taxes
The Company’s operations in Colombia are subject to the taxing jurisdiction of the Republic of Colombia. Tecnoglass LLC and Tecnoglass RE LLC are subject to the taxing jurisdiction of the United States. TGI and Tecnoglass Holding are subject to the taxing jurisdiction of the Cayman Islands. Annual tax periods prior to December 2014 are no longer subject to examination by taxing authorities in Colombia. GM&P, Componenti and ESW LLC are U.S. entities based in Florida subject to U.S. federal and state income taxes.
| F-13 |
The Company accounts for income taxes using the asset and liability approach of accounting for income taxes (ASC 740 “Income Taxes”). Under this approach, deferred taxes represent the future tax consequences expected to occur when the reported amounts of assets and liabilities are recovered or paid. The provision for income taxes represents income taxes paid or payable for the current year plus the change in deferred taxes during the year. Deferred taxes result from differences between the financial and tax basis of the Company’s assets and liabilities and are adjusted for changes in tax rates and tax laws when changes are enacted. For each tax jurisdiction in which the Company operates, deferred tax assets and liabilities are offset against one another and are presented as a single noncurrent amount within the consolidated balance sheets.
The Company presents deferred tax assets and liabilities net as either a non-current asset or liability, depending on the net deferred tax position. The Company recognizes the financial statement effects of uncertain income tax positions when it is more likely than not, based on the technical merits, that the position will be sustained upon examination. The Company accrues for other tax contingencies when it is probable that a liability to a taxing authority has been incurred and the amount of the contingency can be reasonably estimated. Interest accrued related to unrecognized tax and income tax related penalties are included in the provision for income taxes. The uncertain income taxes positions are recorded in “Taxes payable” in the consolidated balance sheets.
Earnings per Share
The Company computes basic earnings per share by dividing net income by the weighted-average number of ordinary shares outstanding during the period. Income per share assuming dilution (diluted earnings per share) would give effect to dilutive options, warrants, and other potential ordinary shares outstanding during the period. See Note 16 - Shareholders’ Equity for further detail on the calculation of earnings per share.
Recently Issued Accounting Pronouncements
In January 2017, the FASB issued ASU No. 2017-01, “Clarifying the Definition of a Business” (“ASU 2017-01”). ASU 2017-01 provides amendments to ASC No. 805, “Business Combinations,” which clarify the definition of a business with the objective of adding guidance to assist entities with evaluating whether transactions should be accounted for as acquisitions (or disposals) of assets or businesses. The amendments in this update are effective prospectively during interim and annual periods beginning after December 15, 2017, with early adoption permitted. We evaluated the effect of this ASU and thise standard had no impact on our consolidated financial statements.
In January 2017, the FASB issued ASU No. 2017-04, “Simplifying the Test for Goodwill Impairment” (“ASU 2017-04”). ASU 2017-04 provides amendments to ASC No. 350, “Intangibles - Goodwill and Other” (“ASC 350”), which eliminate Step 2 from the goodwill impairment test. Entities should perform their goodwill impairment tests by comparing the fair value of a reporting unit with its carrying amount and recognize an impairment charge for the amount by which the carrying amount exceeds the reporting unit’s fair value. The amendments in this update are effective prospectively during interim and annual periods beginning after December 15, 2019, with early adoption permitted. We evaluated the effect of this ASU and this standard had no material impact on our consolidated financial statements.
In August 2016, the FASB issued ASU 2016-15, Statement of Cash Flows (Topic 230): Classification of Certain Cash Receipts and Cash Payments (“ASU 2016-15”). ASU 2016-15 reduces diversity in practice by providing guidance on the classification of certain cash receipts and payments in the statement of cash flows. ASU 2016-15 clarifies that when cash receipts and cash payments have aspects of more than one class of cash flows and cannot be separated, classification will depend on the predominant source or use. ASU 2016-15 is effective on a retrospective basis for fiscal years, and for interim periods within those fiscal years, beginning after December 15, 2017, with early adoption permitted. Adoption of this ASU has no material impact our consolidated financial statements.
In May 2016, the FASB also issued ASU 2016-12, Revenue from Contracts with Customers - Narrow-Scope Improvements and Practical Expedients (“ASU 2016-12”), which provides clarification on certain topics within ASU 2014-09, Revenue from Contracts with Customers (Topic 606) (“ASU 2014-09”), including assessing collectability, presentation of sales taxes, the measurement date for non-cash consideration and completed contracts at transition, as well as providing a practical expedient for contract modifications at transition. The effective date and transition requirements for the amendments in ASU 2016-08, ASU 2016-10 and ASU 2016-12 are the same as the effective date and transition requirements of ASU 2014-09, which is effective for fiscal years, and for interim periods within those years, beginning after December 15, 2017. The Company has evaluated the effect of adopting this ASU and these standards had no impact on our consolidated financial statements.In August 2015, the FASB issued ASU No. 2015-14, “Revenue from Contracts with Customers - Deferral of the Effective Date.” ASU 2015-14 defers the effective date of Update 2014-09 for all entities by one year. Early adoption is permitted. Below is the description of ASU 2014-09 which the Company has evaluated.
| F-14 |
In May 2014, the FASB issued ASU No. 2014-09, “Revenue from Contracts with Customers” (ASU 2014-09). ASU 2014-09 provides guidance for revenue recognition and affects any entity that either enters into contracts with customers to transfer goods or services or enters into contracts for the transfer of nonfinancial assets and supersedes the revenue recognition requirements in Topic 605, “Revenue Recognition,” and most industry-specific guidance. The core principle of ASU 2014-09 is the recognition of revenue when a company transfers promised goods or services to customers in an amount that reflects the consideration to which the company expects to be entitled in exchange for those goods or services. ASU 2014-09 defines a five-step process to achieve this core principle and, in doing so, companies will need to use more judgment and make more estimates than under the current guidance. These may include identifying performance obligations in the contract, estimating the amount of variable consideration to include in the transaction price and allocating the transaction price to each separate performance obligation. ASU 2014-09 is effective for fiscal years beginning after December 15, 2017 and interim periods therein, using either of the following transition methods: (i) a full retrospective approach reflecting the application of the standard in each prior reporting period with the option to elect certain practical expedients, or (ii) a retrospective approach with the cumulative effect of initially adopting ASU 2014-09 recognized at the date of adoption (which includes additional footnote disclosures). The Company has identified all of its contracts, identified its performance obligations, determined transaction prices and allocated the transaction price to performance obligations as well as determining the amount of revenues to recognize under the new standatrd ASC 606. The Company compared the results of this analysis and the results under the prior standard ASC 605 and does not result in material differences on the Company’s financial statments. The Company continues to work on this analysis to ensure that in fact no differences need to be recognized; nevertheless, it does not expect to reach a different conclusion once the analysis has been fully completed.
In February 2016, the FASB issued ASU 2016-02 “Leases (Topic 842)” (“ASU 2016-02”). The FASB issued ASU 2016-02 to increase transparency and comparability among organizations by recognizing lease assets and lease liabilities on the balance sheet and disclosing key information about leasing arrangements. Under ASU 2016-02, a lessee will recognize in the statement of financial position a liability to make lease payments (the lease liability) and a right-to-use asset representing its right to use the underlying asset for the lease term. The recognition, measurement, and presentation of expenses and cash flows arising from a lease by a lessee have not significantly changed from current GAAP. ASU 2016-02 retains a distinction between finance leases (i.e. capital leases under current GAAP) and operating leases. The classification criteria for distinguishing between finance leases and operating leases will be substantially similar to the classification criteria for distinguishing between capital leases and operating leases under current GAAP. The amendments of this ASU are effective for reporting periods beginning after December 15, 2018, with early adoption permitted. An entity will be required to recognize and measure leases at the beginning of the earliest period presented using a modified retrospective approach. The Company is currently evaluating the potential effect of this ASU on its consolidated financial statements.
| Note 3. | Acquisitions |
ESWindows Acquisition
On December 2, 2016, we acquired 100% of the stock of ESW LLC, 85.06% of which was acquired directly by Tecnoglass and 14.94% by our subsidiary ES, for a total purchase price of $13.5 million, which consisted of (i) 734,400 ordinary shares issued in connection with the transaction for approximately $9.2 million based on a stock price of $12.50, (ii) approximately $2.3 million in cash, and (iii) approximately $2.0 million related to the assignment of certain accounts receivable.
| F-15 |
The Company incurred expenses for $82 of acquisition related costs which are recorded in operating expenses in the Company’s results of operations. Of the 734,400 shares paid in consideration for the acquisition of ESW LLC, 80,000 shares were placed in Escrow for indemnification to the Company for a period of 18 months after the closing date.
As the Acquisition of ESW LLC was deemed to be a transaction between entities under common control, the assets and liabilities were transferred at the historical cost of ESW LLC, with prior periods retroactively adjusted to include the historical financial results of the acquired company for the period they were controlled by the previous owners of ESW LLC in the Company’s financial statements.
GM&P Acquisition
On March 1, 2017, the Company acquired a 100% controlling interest in GM&P, a Florida-based commercial consulting, glazing and engineering company, specializing in windows and doors for commercial contractors. The primary reasons for the acquisitions are to penetrate different markets in the U.S. to streamline its distribution logistics, and to fabricate in the United States when economically advantageous. The purchase price for the acquisition was $35,000, of which $6,000 of the purchase price was paid in cash by the Company on May 17, 2017, with the remaining amount to be originally payable by the Company in cash, stock of the Company or a combination of both at the Company´s sole discretion within 180 days after closing, subsequently amended to be paid by May 15, 2018. The total amount of acquisition-related costs was $189, which is included in the Statement of Operations for the period ending December 31, 2016.
With the acquisition of GM&P, the Company also acquired a 60% equity interest in Componenti USA LLC, a subsidiary of GM&P that provides architectural specialties in the US, specializing in design-build systems for individual projects and with experience in value engineering to create products that comply with the architects’ original design intent, while maintaining focus on affordable construction methods and materials.
The following table summarizes the consideration transferred to acquire GM&P and the amounts of identified assets acquired and liabilities assumed at the acquisition date, as well as the fair value of the non-controlling interest in Componenti USA LLC as of the acquisition date. Under ASC 805, a company can apply measurement period adjustments during the twelve-month period after the date of acquisition. During this period, the acquirer may adjust preliminary amounts recognized at the acquisition date to their subsequently determined final fair values. The allocation of the consideration transferred was based on management’s judgment after evaluation of several factors, including a preliminary valuation assessment. Finalization of the analysis has not been completed and could result in measurement periods adjustments that could change the composition of current asset, fixed assets, intangible assets, goodwill, and liabilities. The goodwill is not expected to be deductible for tax purposes. The goodwill from the GM&P acquisition represents the expected synergies from combining operations with Tecnoglass Inc.
The following table summarizes the purchase price allocation of the total consideration transferred:
| Consideration Transferred: | ||||
| Notes payable (Cash or Stock) | $ | 35,000 | ||
| Fair value of the non-controlling interest in Componenti | 1,141 | |||
| Recognized amounts of identifiable assets acquired and liabilities assumed: | Preliminary Purchase Price Allocation | Measurement Period Adjustments | Final Purchase Price Allocation | |||||||||
| Cash and equivalents | $ | 509 | 509 | |||||||||
| Accounts receivable | 42,314 | 42,314 | ||||||||||
| Other current assets | 5,287 | 242 | 5,529 | |||||||||
| Property, plant, and equipment | 684 | 684 | ||||||||||
| Other non-current tangible assets | 59 | 59 | ||||||||||
| Trade name | 980 | 980 | ||||||||||
| Non-compete agreement | 165 | 165 | ||||||||||
| Contract backlog | 3,090 | 3,090 | ||||||||||
| Customer relationships | 4,140 | 4,140 | ||||||||||
| Accounts payable | (22,330 | ) | 275 | (22,055 | ) | |||||||
| Other current liabilities assumed | (13,967 | ) | (242 | ) | (14,209 | ) | ||||||
| Non-current liabilities assumed | (3,634 | ) | (3,231 | ) | (6,865 | ) | ||||||
| Total identifiable net assets | 17,297 | (2,956 | ) | 14,341 | ||||||||
| Goodwill (including Workforce) | $ | 18,844 | 2,956 | $ | 21,800 | |||||||
| F-16 |
The adjustment made to the preliminary purchase price allocation to Non-current liabilities assumed is related to an adjustment in deferred tax liability. The excess of the consideration transferred over the estimated fair values of assets acquired and liabilities assumed was recorded as goodwill. The identifiable intangible asset subject to amortization was the tradename, customer relationships, non-compete agreement, and backlog, which have a remaining useful life of two to five years. See Note 7 – Goodwill and Intangible Assets for additional information.
The following unaudited pro forma financial information assumes the acquisition had occurred as of January 1, 2015 which does not include GM&P actual results for the entire period. Pro forma results have been prepared by adjusting our historical results to include the results of GM&P adjusted for the amortization expense related to the intangible assets arising from the acquisition. The unaudited pro forma results below do not necessarily reflect the results of operations that would have resulted had the acquisition been completed at the beginning of the earliest periods presented, nor does it indicate the results of operations in future periods. The unaudited pro forma results do not include the impact of synergies, nor any potential impacts on current or future market conditions which could alter the following unaudited pro forma results.
| Pro-Forma | Pro-Forma | |||||||
| Twelve months | Twelve months | |||||||
| Ended | Ended | |||||||
| (in thousands, except per share amounts) | December 31, 2017 | December 31, 2016 | ||||||
| Pro Forma Results | ||||||||
| Net sales | $ | 324,523 | $ | 365,047 | ||||
| Net (loss) income attributable to parent | $ | 4,719 | $ | 27,600 | ||||
| Net income per common share: | ||||||||
| Basic | $ | 0.14 | $ | 0.89 | ||||
| Diluted | $ | 0.13 | $ | 0.85 | ||||
Non-controlling interest
With the acquisition of GM&P, the Company also acquired a 60% equity interest in Componenti USA LLC, a subsidiary of GM&P that provides architectural specialties in the US, specializing in design-build systems for individual projects and with experience in value engineering to create products that comply with the architects’ original design intent, while maintaining focus on affordable construction methods and materials. The 40% non-controlling interest in Componenti is included in the opening balance sheet as of the acquisition date and its fair value amounted to $1,141. When the company owns a majority (but less than 100%) of a subsidiary’s stock, the Company includes in its Consolidated Financial Statements the non-controlling interest in the subsidiary. The non-controlling interest in the Condensed Consolidated Statements of Operations and Other Comprehensive Income is equal to the non-controlling interests’ proportionate share of the subsidiary’s net income and, as included in Shareholders’ Equity on the Condensed Consolidated Balance Sheet, is equal to the non-controlling interests’ proportionate share of the subsidiary’s net assets. In determining the fair value we used the income approach amd the market approach which was performed by third party valuation specialists under management.
| F-17 |
| Note 4. | Trade Accounts Receivable |
Trade accounts receivable consists of the following:
| December 31, | ||||||||
| 2017 | 2016 | |||||||
| Current accounts receivable | $ | 85,255 | $ | 87,704 | ||||
| Retainage | 27,938 | 6,676 | ||||||
| Trade accounts receivable | 113,193 | 94,380 | ||||||
| Less: Allowance for doubtful accounts | (2,729 | ) | (2,083 | ) | ||||
| $ | 110,464 | $ | 92,297 | |||||
GM&P’s contractual amounts and fair value of its accounts receivable as of the acquisition date amounted to $42,314 of which $15,116 represent retainage. This is the best estimate at the acquisition date of the contractual cash flows expected to be collected.
The changes in allowances for doubtful accounts for the years ended December 31, 2017 and 2016 are as follows:
| December 31, | ||||||||
| 2017 | 2016 | |||||||
| Balance at beginning of year | $ | 2,083 | $ | 189 | ||||
| Provision for bad debts | 3,128 | 4,686 | ||||||
| Deductions and write-offs, net of foreign currency adjustment | (2,482 | ) | (2,792 | ) | ||||
| Balance at end of year | $ | 2,729 | $ | 2,083 | ||||
| Note 5. | Other Assets |
Other assets consists of the following:
| December 31, | ||||||||
| 2017 | 2016 | |||||||
| Advances to Suppliers and Loans | $ | 795 | $ | 716 | ||||
| Prepaid Income Taxes | 15,573 | 14,080 | ||||||
| Employee Receivables | 455 | 489 | ||||||
| Other Creditors | 691 | 804 | ||||||
| $ | 17,514 | $ | 16,089 | |||||
| F-18 |
| Note 6. | Other Long Term Assets |
Other long term assets are comprised of the following:
| December 31, | ||||||||
| 2017 | 2016 | |||||||
| Real estate investments | $ | 2,069 | $ | 5,125 | ||||
| Cost method investment | 500 | 500 | ||||||
| Deferred tax assets | 103 | - | ||||||
| Other long term assets | 82 | 1,687 | ||||||
| $ | 2,752 | $ | 7,312 | |||||
| Note 7. | Goodwill and Intangible Assets |
Goodwill
The table below provides a reconciliation of the beginning and ending balances of the Goodwill recorded on the Company’s balance sheet:
| Beginning balance - December 31, 2016 | $ | 1,330 | ||
| GM&P Acquisition | 21,800 | |||
| Ending balance – December 31, 2017 | $ | 23,130 |
Intangible Assets, Net
Intangible assets include Miami-Dade County Notices of Acceptances (NOA’s), which are certificates in the required to market hurricane- resistant glass in Florida. Also, it includes the intangibles acquired from the acquisition of GM&P.
| December 31, 2017 | ||||||||||||
| Gross | Acc. Amort. | Net | ||||||||||
| Trade Names | $ | 980 | $ | (163 | ) | $ | 817 | |||||
| Notice of Acceptances (NOAs), product designs and other intellectual property | 10,826 | (5,467 | ) | 5,359 | ||||||||
| Non-compete Agreement | 165 | (28 | ) | 137 | ||||||||
| Contract Backlog | 3,090 | (1,287 | ) | 1,803 | ||||||||
| Customer Relationships | 4,140 | (739 | ) | 3,401 | ||||||||
| Total | $ | 19,201 | $ | (7,684 | ) | $ | 11,517 | |||||
| December 31, 2016 | ||||||||||||
| Gross | Acc. Amort. | Net | ||||||||||
| Notice of Acceptances (NOAs) and product designs | 8,524 | (3,969 | ) | 4,555 | ||||||||
| December 31, 2015 | ||||||||||||
| Gross | Acc. Amort. | Net | ||||||||||
| Notice of Acceptances (NOAs) and product designs | 6,446 | (3,102 | ) | 3,344 | ||||||||
The weighted average amortization period is 4.8 years.
During the twelve months ended December 31, 2017, 2016 and 2015, the amortization expense amounted to $3,497, $1,014 and $1,658, respectively, and was included within the general and administration expenses in our consolidated statement of operations.
| F-19 |
The estimated aggregate amortization expense for each of the five succeeding years as of December 31, 2017 is as follows:
| Year ending | (in thousands) | |||
| 2018 | $ | 3,736 | ||
| 2019 | 2,406 | |||
| 2020 | 2,026 | |||
| 2021 | 1,996 | |||
| 2022 | 997 | |||
| Thereafter | 356 | |||
| $ | 11,517 | |||
| Note 8. | Inventories |
Inventories are comprised of the following
| December 31, 2017 | December 31, 2016 | |||||||
| Raw materials | $ | 40,509 | $ | 40,219 | ||||
| Work in process | 11,468 | 5,606 | ||||||
| Finished goods | 13,236 | 4,124 | ||||||
| Stores and spares | 6,134 | 5,016 | ||||||
| Packing material | 438 | 284 | ||||||
| 71,785 | 55,249 | |||||||
| Less: inventory allowances | (129 | ) | (157 | ) | ||||
| $ | 71,656 | $ | 55,092 | |||||
There are no third party liens or pledges on our inventories as of December 31, 2017.
| F-20 |
| Note 9. | Property, Plant and Equipment |
Property, plant and equipment is comprised of the following:
| December 31, 2017 | December 31, 2016 | |||||||
| Building | $ | 59,237 | $ | 50,887 | ||||
| Machinery and equipment | 134,536 | 132,333 | ||||||
| Office equipment and software | 5,936 | 4,980 | ||||||
| Vehicles | 1,834 | 1,648 | ||||||
| Furniture and fixtures | 2,274 | 2,141 | ||||||
| Total property, plant and equipment | 203,817 | 191,989 | ||||||
| Accumulated depreciation | (66,083 | ) | (49,277 | ) | ||||
| Net book value of property and equipment | 137,734 | 142,712 | ||||||
| Land | 30,967 | 28,085 | ||||||
| Total property, plant and equipment, net | $ | 168,701 | $ | 170,797 | ||||
As of December 31, 2017, the Company had $231 of machinery and equipment under capital lease included within property plant and equipment. Differences between capital lease obligations and the value of property, plant and equipment under capital lease arises from differences between the maturities of capital lease obligations and the useful lives of the underlying assets.
Depreciation expense was $17,472, $14,508 and $10,806 for the years ended December 31, 2017, 2016 and 2015, respectively.
The roll forward of Property, plant and equipment for the years ended December 31, 2017, 2016 and 2015 is as follows:
| December 31, | ||||||||
| 2017 | 2016 | |||||||
| Property, Plant and Equipment | ||||||||
| Beginning balance | $ | 220,074 | $ | 168,992 | ||||
| GM&P Acquisition | 961 | - | ||||||
| Additions | 8,782 | 42,719 | ||||||
| Disposals | (17 | ) | (381 | ) | ||||
| Reclassifications | 5,459 | - | ||||||
| Effect of Foreign currency translation | (475 | ) | 8,744 | |||||
| Ending Balance | $ | 234,784 | $ | 220,074 | ||||
| Accumulated Depreciation | ||||||||
| Beginning Balance | $ | (49,277 | ) | $ | (33,018 | ) | ||
| GM&P Acquisition | (277 | ) | - | |||||
| Depreciation Expense | (17,472 | ) | (14,508 | ) | ||||
| Reclassification to investment property | (585 | ) | - | |||||
| Effect of Foreign Currency Translation | 1,528 | (1,751 | ) | |||||
| Ending balance | $ | (66,083 | ) | $ | (49,277 | ) | ||
| Property, plant and Equipment, Net | $ | 168,701 | $ | 170,797 | ||||
The effect of foreign currency translation is the adjustment resulting from translating the amounts from Colombian Pesos, functional currency of some of the Company’s subsidiaries, into U.S. Dollars, the reporting currency.
| F-21 |
| Note 10. | Debt |
The Company’s debt is comprised of the following:
| December 31, 2017 | December 31, 2016 | |||||||
| Revolving lines of credit | $ | 638 | $ | 13,168 | ||||
| Capital lease | 245 | 23,696 | ||||||
| Unsecured senior note | 210,000 | - | ||||||
| Other loans | 20,293 | 165,330 | ||||||
| Less: Deferred cost of financing | (6,918 | ) | (2,597 | ) | ||||
| Total obligations under borrowing arrangements | 224,258 | 199,597 | ||||||
| Less: Current portion of long-term debt and other current borrowings | 3,260 | 2,651 | ||||||
| Long-term debt | $ | 220,998 | $ | 196,946 | ||||
As of December 31, 2017, the Company owed approximately $224,258 under its various borrowing arrangements. This balance includes $6,918 of deferred transaction costs which are reducing the debt balance. As of December 31, 2017 and 2016, the Company had $224,041 and $114,198 of debt denominated in US Dollars with the remaining amounts denominated in Colombian Pesos.
The Company’s Other loans amounting to $20,293 have maturities ranging from twelve month to a 15 years Export Credit Agency Facility. Our credit facilities bear interest at rates ranging from 3.3% to 8.2% and weighted average of 7.7%. Short term borrowings outstanding bear a weighted average interest rate of 7.2%.
On January 23, 2017, the Company issued a U.S. dollar denominated, $210 million offering of 5-year senior unsecured notes at a coupon rate of 8.2% in the international debt capital markets under Rule 144A of the Securities Act to Qualified Institutional Buyers. The Company used approximately $179 million of the proceeds to repay outstanding indebtedness, including Capital leases, and as a result will achieve a lower cost of debt and strengthen its capital structure given the non-amortizing structure of the new bond. Of these repayments, $59,444 were used to refinance short term debt into long term debt. The senior note does not have negative covenants with an acceleration clause, however requires the Company to meet certain performance indicators in order to take on more debt.
The Company had $4,758 and $8,366 of property, plant and equipment as well as $0 and $4,757 of other long-term assets pledged to secure $3,337 and $109,193 under various lines of credit as of December 31, 2017 and December 31, 2016, respectively. Differences between pledged assets and the amount secured is related to the difference between carrying value of such assets recorded at historical cost and the guarantees issued to the banks which are based on the market value of the real estate. The Company also has a revolving line of credit for up to $4,250 in name of GM&P, of which $95 were outstanding as of December 31, 2017 secured by up to $50,548 of all of GM&P’s assets. Pursuant to the issuance of the unsecured senior note issued in January of 2017 and repayment of $176,899 million of outstanding indebtedness, $8,366 of pledged property plant and equipment were released to the Company.
| F-22 |
Maturities of long term debt and other current borrowings are as follows as of December 31, 2017:
| Year Ending December 31, | ||||
| 2018 | $ | 3,260 | ||
| 2019 | 2,400 | |||
| 2020 | 2,379 | |||
| 2021 | 2,348 | |||
| 2022 | 212,350 | |||
| Thereafter | 8,439 | |||
| Total | $ | 231,176 | ||
The Company had $4,250 and $638 available and outstanding in several lines of credit under a revolving note arrangement as of December 31, 2017. The floating interest rates on the revolving notes range between DTF+4.2% and DTF+7%. DTF is the primary measure of interest rates in Colombia. The notes are secured by all assets of the Company. At December 31, 2016 $13,168 were outstanding under these lines, respectively.
Pursuant to the issuance of the senior unsecured note issued in January 2017, the Company repaid the majority of outstanding balances at the time and maintains available lines of credit with its relationship banks. As of December 31, 2017, the company had additional $27.7 million available under a short term line of Credit.
As of December 31, 2017, the Company was obligated under various capital leases under which the aggregate present value of the minimum lease payments amounted to $245. The present vale of the minimum lease payments was calculated using discount rates ranging from 5.0% to 6.7% and maturities ranging from 3 years to 5 years. Differences between capital lease obligations and the value of property, plant and equipment under capital lease arises from differences between the maturities of capital lease obligations and the useful lives of the underlying assets.
Interest expense for the year ended December 31, 2017, 2016 and 2015 was $19,872, $16,814 and 9,274, respectively. The increase is associated to the added debt to address the company´s growth capital expenditure requirements. During the years ended December 31, 2017, 2016 and 2015, the Company capitalized interests in the amounts of $10, $377 and $1,383, respectively.
| Note 11. | Income Taxes |
The Company files income tax returns for TG and ES in the Republic of Colombia. On December 28, 2016, the Colombian congress enacted a structural tax reform that took effect on January 1, 2017 which reduces corporate income tax from 42% to 40% for fiscal year 2017, 37% in 2018 and 33% in 2019 and thereafter. As a result of the Colombian tax reform from December 28, 2016, the Company’s net deferred tax liability decreased $586 as of December 31, 2016.
GM&P, Componenti and ESW LLC are U.S. entities based in Florida subject to U.S. federal and state income taxes. The estimated comined state and federal income tax rate ranges between 34% and 39.5%. Tecnoglass Inc. as well as all the other subsidiaries in the Cayman Islands and Panama do not currently have any tax obligations. On December 20, 2017, the Tax Cuts and Jobs Act (the “2017 Act”) was signed into law. On December 22, 2017, the SEC staff issued Staff Accounting Bulletin No. 118 (SAB 118) to address the application of US GAAP in situations when a registrant does not have the necessary information available, prepared, or analyzed (including computations) in reasonable detail to complete the accounting for certain income tax effects of the 2017 act. Registrants must report provisional amounts for those specific income tax effects of the 2017 Act for which the accounting is incomplete but a reasonable estimate can be determined. Provisional amounts or adjustments to provisional amounts identified in the measurement period, as defined, should be included as an adjustment to tax expense or benefit from continuing operations in the period the amounts are determined. We analyzed the impact of the 2017 Act on our accounting for income taxes, including the remeasurement of our deferred tax assets and liabilities, and expect to see a reduction in U.S. tax expense as the new reform reduces the federal corporate tax rate from 35% to 21%.
ESW is an LLC that was not subject to income taxes during the year 2015 and the eleven months period ending December 2, 2016, since it was a pass-through entity for tax purposes. ESW was converted to a C-Corporation and will be subject to income taxes starting on December 3, 2016.
The components of income tax expense (benefit) are as follows:
| December 31, | ||||||||||||
| 2017 | 2016 | 2015 | ||||||||||
| Current income tax | ||||||||||||
| United States | $ | 4,558 | $ | - | $ | - | ||||||
| Colombia | 7,372 | 16,318 | 20,809 | |||||||||
| 11,930 | 16,318 | 20,809 | ||||||||||
| Deferred income Tax | ||||||||||||
| United States | (2,328 | ) | - | - | ||||||||
| Colombia | (3,809 | ) | (246 | ) | (118 | ) | ||||||
| (6,137 | ) | (246 | ) | (118 | ) | |||||||
| Total Provision for Income Tax | $ | 5,793 | $ | 16,072 | $ | 20,691 | ||||||
| F-23 |
A reconciliation of the statutory tax rate in Colombia to the Company’s effective tax rate is as follows:
| December 31, | ||||||||||||
| 2017 | 2016 | 2015 | ||||||||||
| Income tax expense at statutory rates | 37.0 | % | 40.0 | % | 39.0 | % | ||||||
| Change in fair value of warrant liability | - | % | -0.8 | % | 122.5 | % | ||||||
| Change in fair value of Earnout shares | - | % | -4.8 | % | 53.4 | % | ||||||
| Other non-deductible expenses | 14,7 | % | -4.2 | % | 48.4 | % | ||||||
| Withholding tax on debt payments | 9.3 | % | - | % | - | % | ||||||
| Other non-taxable income | -9.5 | % | 10.7 | % | -2.2 | % | ||||||
| Effective tax rate | 51.5 | % | 40.9 | % | 261.1 | % | ||||||
The Company has the following deferred tax assets and liabilities:
| December 31, | ||||||||
| 2017 | 2016 | |||||||
| Deferred tax assets: | ||||||||
| Accounts Receivable Clients - not delivered FOB | $ | - | $ | 930 | ||||
| Property, plant and equipment adjustments | 483 | 564 | ||||||
| Financial Liabilities | - | 24 | ||||||
| Deferred profit on other assets | 108 | 107 | ||||||
| Foreign currency transactions | 1,551 | |||||||
| Provision Inventory obsolescence | 35 | 36 | ||||||
| Total deferred tax assets | $ | 2,178 | $ | 1,661 | ||||
| Deferred tax liabilities: | ||||||||
| Inventory - not delivered FOB | $ | 1,134 | $ | 1,507 | ||||
| Unbilled receivables uncompleted contracts | 726 | 2,649 | ||||||
| Depreciation and Amortization | 2,532 | 1,028 | ||||||
| Total deferred tax liabilities | $ | 2,124 | $ | 5,184 | ||||
| Net deferred tax | $ | 2,214 | $ | 3,523 | ||||
Net deferred tax is presented on the balance sheet as follows:
| December 31, | ||||||||
| 2017 | 2016 | |||||||
| Long term deferred income tax asset | $ | 103 | $ | - | ||||
| Less: long term deferred income tax liability | $ | 2,317 | $ | 3,523 | ||||
As of December 31, 2017, the Company has an uncertain tax position amounting to $2,041 related to $8,351 gross unrecognized tax benefit associated with a conversion of GM&P’s cash basis accounting for tax purposed to accrual basis for Fiscal years 2016 and 2015. Before 2015, GM&P was using the cash method of accounting and due to IRS regulations it needed to convert to accrual method and pay the IRS taxes over the gross unrecognized tax benefit associated with the conversion. The unrecognized tax benefits may increase or change during the next year for items that arise in the ordinary course of business and may be subject to inspection by the Colombian tax authorities for a period of up to two years until the statute of limitations period elapses and US tax authorities for a period of up to six years until the statute of limitations period elapses.
| F-24 |
| Note 12. | Fair Value Measurements |
The Company accounts for financial assets and liabilities in accordance with accounting standards that define fair value and establish a framework for measuring fair value. The hierarchy prioritizes the inputs into three broad levels. Level 1 inputs are quoted prices (unadjusted) in active markets for identical assets or liabilities. Level 2 inputs are quoted prices for similar assets and liabilities in active markets or inputs that are observable for the asset or liability, either directly or indirectly through market corroboration, for substantially the full term of the financial instrument. Level 3 inputs are unobservable inputs based on the Company’s assumptions used to measure assets and liabilities at fair value. A financial asset’s or liability’s classification within the hierarchy is determined based on the lowest level input that is significant to the fair value measurement.
The carrying amounts of the Company’s financial instruments, including cash and cash equivalents, accounts receivable, accounts payable and advances from customers approximate their fair value due to their relatively short-term maturities. The Company bases its fair value estimate for long term debt obligations on its internal valuation that all debt is floating rate debt based on current interest rates in Colombia.
As of December 31, 2017, financial instruments carried at amortized cost that do not approximate fair value consist of long-term debt. See Note 10 - Debt. The fair value of long term debt was calculated based on an analysis of future cash flows discounted with our average cost of debt which is based on market rates, which are level 2 inputs.
The following table summarizes the fair value and carrying amounts of our long-term debt:
| December 31 | ||||||||
| 2017 | 2016 | |||||||
| Fair Value | 240,057 | 190,190 | ||||||
| Carrying Value | 220,998 | 196,786 | ||||||
| Note 13. | Related Parties |
The following is a summary of assets, liabilities, and income and expense transactions with all related parties, shareholders, directors and managers:
| December 31, | December 31, | |||||||
| 2017 | 2016 | |||||||
| Assets | ||||||||
| Current Assets | ||||||||
| Due from VS | $ | 6,240 | $ | 9,143 | ||||
| Due from other related parties | 2,260 | 1,852 | ||||||
| $ | 8,500 | $ | 10,995 | |||||
| Long Term Trade receivable from VS | $ | - | $ | - | ||||
| Investments | - | - | ||||||
| Liabilities | ||||||||
| Due to related parties | $ | (975 | ) | $ | (3,668 | ) | ||
| F-25 |
| December 31, 2017 | December 31, 2016 | December 31, 2015 | ||||||||||
| Revenues | $ | 5,081 | $ | 9,742 | $ | 9,942 | ||||||
| Interest Income | - | 235 | 451 | |||||||||
| Expenses- | ||||||||||||
| Paid to other related parties | 2,880 | 2,395 | 3,036 | |||||||||
Ventanas Solar S.A. (“VS”), a Panama sociedad anonima, is an importer and installer of the Company’s products in Panama. Family members of the Company’s CEO and COO and other related parties own 100% of the equity in VS. The Company’s sales to VS for the year ended December 31, 2017, 2016 and 2015 were $3,670, $8,269 and $5,437, respectively.
During 2015 and 2014, the Company and VS executed a short-term payment agreement and a three-year payment agreement that were mainly created to fund working capital to VS due the timing difference between the collections from VS’s customers. The interest rate of these payment agreements is Libor + 4.7% paid semiannually and Libor +6.5% paid monthly for the short-term agreement and the three-year agreement, respectively. On December 2, 2016 the outstanding amount of $2,016 was reassigned to the former shareholders of ESW LLC as part of the consideration paid for the acquisition of ESW. As a result, the Company does not have any outstanding receivable under these payment agreements as of December 31, 2016.
Due to related party as of December 31, 2016 includes a $2,303 payable to the former shareholders of ESW LLC as part of the consideration paid for the acquisition (See Note 3 – ESWindows for further details). During the years ended December 31, 2016 and 2015, ESW made distributions to its former shareholders amounting to $2,263 and 1,409, respectively, which are distributions made prior to acquisition date, as further described in Note 3 – ESWindows Acquisition.
The balance of receivables due from VS at the end of 2017 is higher than the revenues invoiced during the year, given the fact that a large component of those receivables is associated with retainage that is due from VS´s clients to VS, and that becomes payable when projects are fully completed and certain conditions have been met. We expect that a large portion of those receivables will be paid during 2018 given the stages of the aforementioned projects.
Paid to other related parties during the year ended December 31, 2017, 2016 and 2015 include charitable contributions to the Company’s foundation for $2,787, $1,340, and $1,234, respectively, and sales commissions for $691, $392, and $1,107, respectively.
| F-26 |
| Note 14. | Warrant Liability and Earnout Shares Liability |
Warrant Liability
On August 4, 2016, the Company commenced a warrant exchange offer, under which each Tecnoglass warrant holder had the opportunity to receive one Tecnoglass ordinary share in exchange for every 2.5 of the Company’s outstanding warrants tendered by the holder and exchanged pursuant to the offer. As of the expiration of the exchange offer period on September 8, 2016, 5,479,049 outstanding warrants, or approximately 82% of the outstanding warrants, were tendered. Those tenders were accepted by Tecnoglass, which issued 2,191,608 new ordinary shares on September 14, 2016. As a result, the warrant liability decreased by $26,300 and the additional paid in capital increased by the same amount.
On December 20, 2016, the ordinary warrants expired by their terms. There were 1,275,823 warrants outstanding as of September 30, 2016 following completion of the Company’s September 2016 warrant exchange offer. Of such amount, 1,265,842 warrants were exercised prior to the expiration of the warrants, resulting in 478,218 ordinary shares being issued, with the remaining unexercised warrants expiring by their terms. The warrant liability associated with the warrants was reclassified into equity once adjusted to fair value at the date of expiration.
Earnout Shares Liability
Pursuant to the business combination closed on December 20, 2012, the Company issued 500,000 ordinary shares upon achievement of the EBITDA target for the year ended December 31, 2014 and 1,000,000 ordinary shares upon achievement of the EBITDA target for the year ended December 31, 2015. Additionally, on December 20, 2016, we notified the Escrow Agent that the earnout target for the year ended December 31, 2016 had been met in full, notwithstanding the fact that the audit of such period had not yet been completed. Through November 30, 2016, Tecnoglass had achieved an EBITDA substantially higher than the one between $40 million and $45 million required to trigger the release of the shares from escrow. As a result, Tecnoglass instructed the Escrow Agent to release the remaining 1,500,000 ordinary shares held in escrow to Energy Holding Corp., the former stockholder of Tecnoglass prior to the Business Combination and an affiliate of Jose M. Daes, our Chief Executive Officer, and Christian T. Daes, our Chief Operating Officer.
| F-27 |
| Note 15. | Commitments and Contingencies |
Commitments
As of December 31, 2017, the Company has an outstanding obligation to purchase an aggregate of at least $40,537 of certain raw materials from a specific supplier before May 2026.
Guarantees
As of December 31, 2017, the Company does not have guarantees on behalf of other parties.
General Legal Matters
From time to time, the Company is involved in legal matters arising in the regular course of business. Some disputes are derived directly from our construction projects, related to supply and installation, and even though deemed ordinary, they may involve significant monetary damages. We are also subject to other type of litigations arising from employment practices, worker’s compensation, automobile claims and general liability. It is very difficult to predict precisely what the outcome of these litigations might be. However, with the information at out disposition as this time, there are no indications that such claims will result in a material adverse effect on the business, financial condition or results of operations of the Company.
| Note 16. | Shareholders’ Equity |
Preferred Shares
TGI is authorized to issue 1,000,000 preferred shares with a par value of $0.0001 per share with such designation, rights and preferences as may be determined from time to time by the Company’s board of directors.
As of December 31, 2017, there are no preferred shares issued or outstanding.
Ordinary Shares
The Company is authorized to issue 100,000,000 ordinary shares with a par value of $0.0001 per share. As of December 31, 2017, a total of 34,836,575 Ordinary shares were issued and outstanding.
Legal Reserve
Colombian regulation requires that companies retain 10% of net income until it accumulates at least 50% of subscribed and paid in capital.
Earnings per Share
The following table sets forth the computation of the basic and diluted earnings per share for the years ended December 31, 2017, 2016 and 2015:
| December 31, | ||||||||||||
| 2017 | 2016 | 2015 | ||||||||||
| Numerator for basic and diluted earnings per shares | ||||||||||||
| Net Income (Loss) | $ | 5,725 | $ | 23,180 | $ | (11,020 | ) | |||||
| Denominator | ||||||||||||
| Denominator for basic earnings per ordinary share - weighted average shares outstanding | 34,822,313 | 30,850,866 | 29,081,196 | |||||||||
| Effect of dilutive securities and stock dividend | 499,080 | 1,521,094 | - | |||||||||
| Denominator for diluted earnings per ordinary share - weighted average shares outstanding | 35,321,393 | 32,371,866 | 29,081,196 | |||||||||
| Basic earnings per ordinary share | $ | 0.16 | $ | 0.75 | $ | (0.38 | ) | |||||
| Diluted earnings per ordinary share | $ | 0.16 | $ | 0.72 | $ | (0.38 | ) | |||||
| F-28 |
The weighted average number for shares outstanding for calculation of basic earnings per share for the year ended December 31, 2015 considers 734,400 ordinary shares issued in December 2016 as part of the consideration paid the acquisition of ESW LLC, acquisition of an entity under common control as further described in Note 3. As per ASC 260 – Earnings Per Share, 2,626,727 and 3,125,807 ordinary shares issued in connection with the share dividend paid since December 31, 2015 and 2016 are considered in the denominator for basic and diluted earnings per ordinary share, respectively.
The effect of dilutive securities includes 499,080 and 1,521,094 as of December 31, 2017 and 2016, respectively, for shares potentially issued in relation to the dividends declared.
Long Term Incentive Compensation Plan
On December 20, 2013, our shareholders approved our 2013 Long-Term Equity Incentive Plan (“2013 Plan”). Under the 2013 Plan, 1,593,917 ordinary shares are reserved for issuance in accordance with the plan’s terms to eligible employees, officers, directors and consultants. As of December 31, 2017, no awards had been made under the 2013 Plan.
Dividend
The Company has authorized the payment of four regular quarterly dividends to holders of ordinary shares at a quarterly rate of $0.125 per share, or $0.50 per share on an annual basis, with the first quarterly dividend being payable on November 1, 2016. The dividends are payable in cash or ordinary shares, at the option of the holders of ordinary shares. On May 11, 2017, the Company announced that commencing with the declared quarterly dividend for the third quarter of 2017 through any future dividends to be declared and paid through the second quarter of 2018, a 12% increase to $0.14 per share, or $0.56 per share on an annual basis would apply.
As a result, the Company has a dividend payable amounting to $585 as of December 31, 2017. The Company issued 1,619,812 shares for the share dividends paid during the year ended December 31, 2017.
The Company analyzed the accounting guidance under ASC 505 and determined that this guidance is not applicable since the dividend are shares of the same class in which each shareholder is given an election to receive cash or shares. As such, the Company analyzed the dividend under ASC 480 — Distinguishing Liabilities from Equity and concluded that the dividend should be accounted for as a liability since the dividend is a fixed monetary amount known at inception. A reclassification from dividend payable to additional paid-in capital was done for the stocks dividend elections.
Energy Holding Corp., the majority shareholder of the Company, has irrevocably elected to receive any quarterly dividends declared through the second quarter of 2018 in ordinary shares, as opposed to cash.
Dividend declarations and the establishment of future record and payment dates are subject to the Board of Directors’ continuing determination that the dividend policy is in the best interests of the Company and its shareholders. The dividend policy may be changed or cancelled at the discretion of the Board of Directors at any time.
| F-29 |
| Note 17. | Segment and Geographic Information |
The Company has one operating segment, Architectural Glass and Windows, which is also its reporting segment, comprising the design, manufacturing, distribution, marketing and installation of high-specification architectural glass and windows products sold to the construction industry.
In reviewing the Company’s segmentation, the Company followed guidance under ASC 280-10-50-1 which states that “an operating segment is a component of a public entity that has all of the following characteristics: (i) it engages in business activities from which it may earn revenues and incur expenses (including revenues and expenses relating to transactions with other components of the same public entity), (ii) its operating results are regularly reviewed by the public entity’s chief operating decision maker (CODM) to make decisions about resources to be allocated to the segment and assess its performance, and (iii) its discrete financial information is available. Based on the Company’s review discussed below, the Company believes that its identification of a single operating and reportable segment - Architectural Glass and Windows - is consistent with the objectives and basic principles of Segment Reporting, which are to “help financial statement readers better understand the public entity’s performance, better assess its prospects for future net cash flows and make more informed judgments about the public entity as a whole.”
The Company analyzed the Company’s segmentation after the acquisition of ESW LLC and GM&P and concluded that the operations of ESW LLC and GM&P fall within our single operating segment, Architectural Glass and Windows. The CODM reviews financial information of the Company on a consolidated basis including GM&P and ESW LLC on a comparative basis including an analysis with the consolidated budget and forecast. These acquisitions have not changed the products and services offered in prior years and as such the Company believes that there is no need of an additional segment due to the aforementioned above. Furthermore, a large part of the strategy behind the acquisition of GM&P was to use this entity as a platform to sell the Company´s products into the U.S, serving our clients by providing a ful “end to end” portafolio of products and services integrated into one.
The following tables present geographical information about external customers and revenues from external customer by product groups. Geographical information is based on the location where there the customer is located.
| December 31, | ||||||||||||
| 2017 | 2016 | 2015 | ||||||||||
| Colombia | $ | 63,539 | $ | 98,758 | $ | 81,290 | ||||||
| United States | 238,529 | 189,985 | 145,207 | |||||||||
| Panama | 4,259 | 9,444 | 7,329 | |||||||||
| Other | 8,129 | 6,829 | 8,413 | |||||||||
| Total Revenues | $ | 314,456 | $ | 305,016 | $ | 242,239 | ||||||
| December 31, | ||||||||||||
| 2017 | 2016 | 2015 | ||||||||||
| Glass and framing components | $ | 67,311 | $ | 89,850 | $ | 85,034 | ||||||
| Windows and architectural systems | 247,144 | 215,166 | 157,205 | |||||||||
| Total Revenues | $ | 314,456 | $ | 305,016 | $ | 242,239 | ||||||
| F-30 |
During the year ended December 31, 2017, no single customer accounted for more than 10% of our revenues. Only GM&P before being acquired by the Company in 2017 accounted for more than 10% or more of our net sales, amounting to $80.0 million, or 26% of total sales, and $32.0 million, or 13% of sales during the years ended December 31, 2016 and 2015.
The Company’s long-lived assets are distributed geographically as follows:
| December 31, | ||||||||||||
| 2017 | 2016 | 2015 | ||||||||||
| Colombia | $ | 166,380 | $ | 172,478 | $ | 137,080 | ||||||
| United States | 39,037 | 5,631 | 5,314 | |||||||||
| Total long lived assets | $ | 205,417 | $ | 178,109 | $ | 142,394 | ||||||
| Note 18. | Operating Expenses |
Selling expenses for the years ended December 31, 2017, 2016 and 2015 were comprised of the following:
| December 31, | ||||||||||||
| 2017 | 2016 | 2015 | ||||||||||
| Shipping and Handling | $ | 13,068 | $ | 15,568 | $ | 11,955 | ||||||
| Personnel | 6,219 | 5,679 | 5,128 | |||||||||
| Sales commissions | 4,527 | 4,346 | 4,298 | |||||||||
| Services | 2,024 | 1,723 | 1,571 | |||||||||
| Packaging | 1,306 | 950 | 1,093 | |||||||||
| Other Selling Expenses | 3,512 | 4,001 | 3,558 | |||||||||
| Total Selling Expense | $ | 30,656 | $ | 32,267 | $ | 27,603 | ||||||
General and administrative expenses for the years ended December 31, 2017, 2016 and 2015 were comprised of the following:
| December 31, | ||||||||||||
| 2017 | 2016 | 2015 | ||||||||||
| Personnel | $ | 10,631 | $ | 7,938 | $ | 6,015 | ||||||
| Professional Fees | 4,207 | 5,395 | 4,596 | |||||||||
| Taxes | 895 | 1,302 | 1,628 | |||||||||
| Services | 2,850 | 2,302 | 1,685 | |||||||||
| Depreciation and Amortization | 4,404 | 1,788 | 2,684 | |||||||||
| Bank charges and tax on financial transactions | 1,647 | 2,881 | 1,499 | |||||||||
| Charitable contributions | 1,537 | 1,504 | 1,425 | |||||||||
| Other expenses | 4,867 | 4,736 | 2,654 | |||||||||
| Total General and administrative expenses | $ | 31,038 | $ | 27,846 | $ | 22,186 | ||||||
| F-31 |
| Note 19. | Non-Operating Income and Expenses |
Non-operating income (net) on our consolidated statement of operations amounted to $3,190, $4,155 and $5,054 for the years ended December 31, 2017, 2016 and 2015, respectively. These amounts are primarily comprised of income from interests on receivables and short-term investments, rent income and recoveries on scrap materials.
| Note 20. | Selected Quarterly Financial Data (unaudited) |
The following tables contain (unaudited) quarterly financial statement information for the years ended December 31, 2017 and 2016.
| 2017 Quarters Ended | ||||||||||||||||
| March 31, | June 30, | September 30, | December 31, | |||||||||||||
| Operating revenue | $ | 65,817 | $ | 80,976 | $ | 83,384 | $ | 84,279 | ||||||||
| Gross profit | 22,252 | 22,544 | 27,184 | 27,202 | ||||||||||||
| Net income (loss) | 1,031 | (3,500 | ) | 7,025 | 1,169 | |||||||||||
| Net income (loss) attributable to parent | 1,019 | (3,560 | ) | 6,924 | 1,066 | |||||||||||
| Basic income (loss) per share* | 0.03 | (0.10 | ) | 0.20 | 0.03 | |||||||||||
| Diluted income (loss) per share* | $ | 0.03 | $ | (0.10 | ) | $ | 0.20 | $ | 0.03 | |||||||
| 2016 Quarters Ended | ||||||||||||||||
| March 31, | June 30, | September 30, | December 31, | |||||||||||||
| Operating revenue | $ | 63,855 | $ | 79,813 | $ | 81,073 | $ | 80,275 | ||||||||
| Gross profit | 24,690 | 27,990 | 31,295 | 28,672 | ||||||||||||
| Net income (loss) | 14,356 | 14,679 | (8,783 | ) | 2,928 | |||||||||||
| Net income (loss) attributable to parent | 14,356 | 14,679 | (8,783 | ) | 2,928 | |||||||||||
| Basic income (loss) per share* | 0.49 | 0.47 | (0.28 | ) | 0.09 | |||||||||||
| Diluted income (loss) per share* | $ | 0.44 | $ | 0.40 | $ | (0.28 | ) | $ | 0.09 | |||||||
*Per share amounts have been retroactively adjusted to include the dilutive effect of shares issued in relation to a share dividend payment .
| Note 21. | Subsequent Events |
On March 8, 2018, Tecnoglass Inc. (the “Company”) announced the timing for the payment of its declared regular quarterly dividend of $0.14 per share for the first quarter of 2018. The dividend will be payable on April 30, 2018 to shareholders of record as of the close of business on March 29, 2018. The dividend will be paid in cash or ordinary shares, to be chosen at the option of holders of ordinary shares during an election period beginning April 2, 2018 and lasting until 5:00 P.M. Eastern Time on April 18, 2018. The value of the ordinary shares to be used to calculate the number of shares to be issued with respect to that portion of the dividend payable in ordinary shares shall be the average of the closing price of the Company’s ordinary shares on NASDAQ during the period from April 5, 2018 through April 18, 2018. If no choice is made during this election period, the dividend for this election period will be paid in ordinary shares of the Company.
| F-32 |