Attached files
| file | filename |
|---|---|
| 8-K - 8-K - Venoco, Inc. | a16-7162_18k.htm |
| EX-99.2 - EX-99.2 - Venoco, Inc. | a16-7162_1ex99d2.htm |
| EX-10.1 - EX-10.1 - Venoco, Inc. | a16-7162_1ex10d1.htm |
| EX-10.2 - EX-10.2 - Venoco, Inc. | a16-7162_1ex10d2.htm |
Exhibit 99.1
Venoco Financial Projections December 2015

This presentation contains information that was previously provided to certain investors on a confidential basis. Information contained herein is as of December 2015 and has not been updated for any changes since the date of such information. As a result, investors should not place undue reliance on such information. Statements included in this presentation, other than statements of historical fact, are forward-looking statements. Forward looking statements include, but are not limited to, projected revenues, expenses, cash flow, income, Adjusted EBITDA and other financial information and projected production, capital expenditures, capital projects and other operational information. Venoco, Inc. (“Venoco” or “the Company”) cautions that assumptions, expectations, projections, intentions, or beliefs about future events may, and often do, vary from actual results and the differences can be material. Some of the key factors which could cause actual results to vary from those Venoco expects include changes in natural gas and oil prices, the timing and cost of planned capital expenditures, the timing of permits and/or approvals, availability of acquisitions, uncertainties in estimating proved reserves and forecasting production results, reserve estimates, cash flows and production and other costs, the availability and cost of gathering and transportation facilities and transportation arrangements, operational factors affecting the commencement or maintenance of producing wells, the condition of the capital markets generally, as well as the Company’s ability to access them, a potential inability to complete production sales and other transactions on the terms, and in the time periods, Venoco expects, and uncertainties regarding environmental regulations or litigation and other legal or regulatory developments affecting Venoco’s business. More information about the risks and uncertainties relating to Venoco's forward-looking statements may be found in the Company’s SEC filings, including under the heading "Risk Factors" in Venoco's Annual Report on Form 10-K for the year ended December 31, 2014, and are incorporated herein by reference. You should not place undue reliance on these forward-looking statements, which speak only as of the date of this presentation. Forward looking statements made about the Hastings Complex and the contract with Denbury Resources are subject to business risks and uncertainties not in Venoco’s control including, but not limited to the full implementation of a CO2 flood and the production results and reserves of the flood as implemented. The Company’s activities with respect to the Monterey shale are subject to numerous operating, geological and other risks and may not be successful. The Company’s results in the onshore Monterey will be subject to greater risks than results in areas where it has more data and drilling experience. Results from the onshore Monterey project will depend on, among other things, the Company’s ability to identify productive intervals and drilling and completion techniques necessary to achieve commercial production from those intervals. Except as otherwise required by law, Venoco does not undertake any obligation to update any forward-looking or other statements as a result of new information, future events or otherwise. Estimates of unproved reserves or resources which may potentially be recoverable through additional drilling or recovery techniques are by their nature more uncertain than estimates of proved reserves and accordingly are subject to substantially greater risk of not actually being realized by the Company. The term discovery, as used in this presentation, refers to a petroleum accumulation or accumulations for which one or several exploratory wells have, in the company’s judgment, established through testing, sampling and/or logging the existence of a significant quantity of potentially moveable hydrocarbons. 1P Reserves refer to Proved Reserves as defined by the SEC. 2P Reserves are defined as Proved plus Probable Reserves as defined by the SEC. 3P Reserves are defined as Proved plus Probable plus Possible reserves defined by the SEC. Contingent Resources are those quantities of petroleum estimated, as of a given date, to be potentially recoverable from known accumulations using established technology or technology under development, but are not currently considered to be commercially recoverable due to one or more contingencies. Important Notice

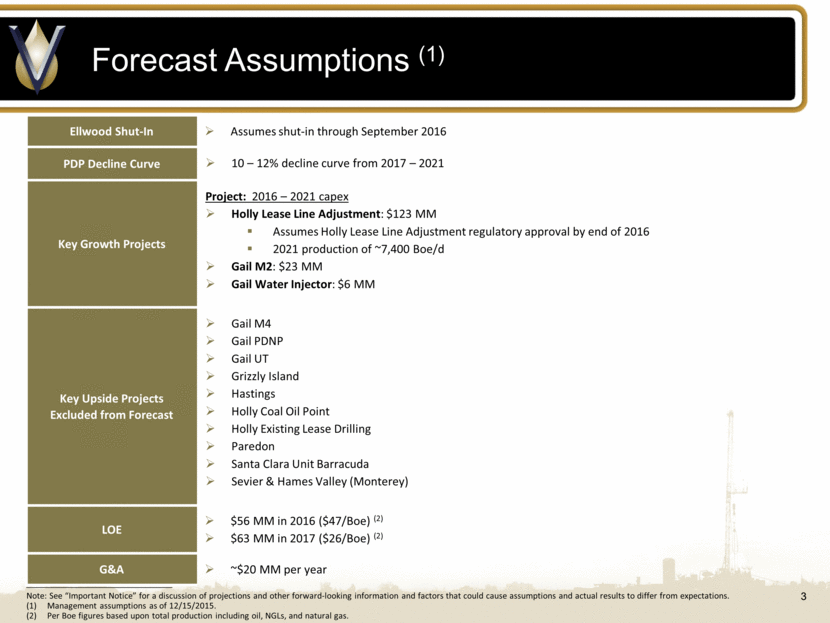
Forecast Assumptions (1) Ellwood Shut-In Assumes shut-in through September 2016 PDP Decline Curve 10 – 12% decline curve from 2017 – 2021 Key Growth Projects Project: 2016 – 2021 capex Holly Lease Line Adjustment: $123 MM Assumes Holly Lease Line Adjustment regulatory approval by end of 2016 2021 production of ~7,400 Boe/d Gail M2: $23 MM Gail Water Injector: $6 MM Key Upside Projects Excluded from Forecast Gail M4 Gail PDNP Gail UT Grizzly Island Hastings Holly Coal Oil Point Holly Existing Lease Drilling Paredon Santa Clara Unit Barracuda Sevier & Hames Valley (Monterey) LOE $56 MM in 2016 ($47/Boe) (2) $63 MM in 2017 ($26/Boe) (2) G&A ~$20 MM per year ________________________________________________ Note: See “Important Notice” for a discussion of projections and other forward-looking information and factors that could cause assumptions and actual results to differ from expectations. Management assumptions as of 12/15/2015. Per Boe figures based upon total production including oil, NGLs, and natural gas.

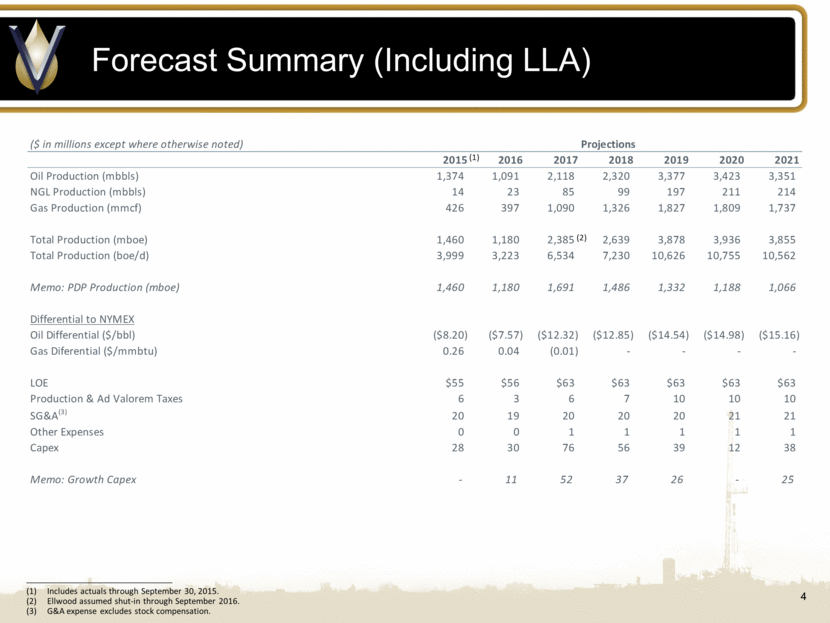
Forecast Summary (Including LLA) ________________________________________________ Includes actuals through September 30, 2015. Ellwood assumed shut-in through September 2016. G&A expense excludes stock compensation. ($ in millions except where otherwise noted) Projections 2015 2016 2017 2018 2019 2020 2021 Oil Production (mbbls) 1,374 1,091 2,118 2,320 3,377 3,423 3,351 NGL Production (mbbls) 14 23 85 99 197 211 214 Gas Production (mmcf) 426 397 1,090 1,326 1,827 1,809 1,737 Total Production (mboe) 1,460 1,180 2,385 2,639 3,878 3,936 3,855 Total Production (boe/d) 3,999 3,223 6,534 7,230 10,626 10,755 10,562 Memo: PDP Production (mboe) 1,460 1,180 1,691 1,486 1,332 1,188 1,066 Differential to NYMEX Oil Differential ($/bbl) ($8.20) ($7.57) ($12.32) ($12.85) ($14.54) ($14.98) ($15.16) Gas Diferential ($/mmbtu) 0.26 0.04 (0.01) - - - - LOE $55 $56 $63 $63 $63 $63 $63 Production & Ad Valorem Taxes 6 3 6 7 10 10 10 SG&A (3) 20 19 20 20 20 21 21 Other Expenses 0 0 1 1 1 1 1 Capex 28 30 76 56 39 12 38 Memo: Growth Capex - 11 52 37 26 - 25 (2) (1)

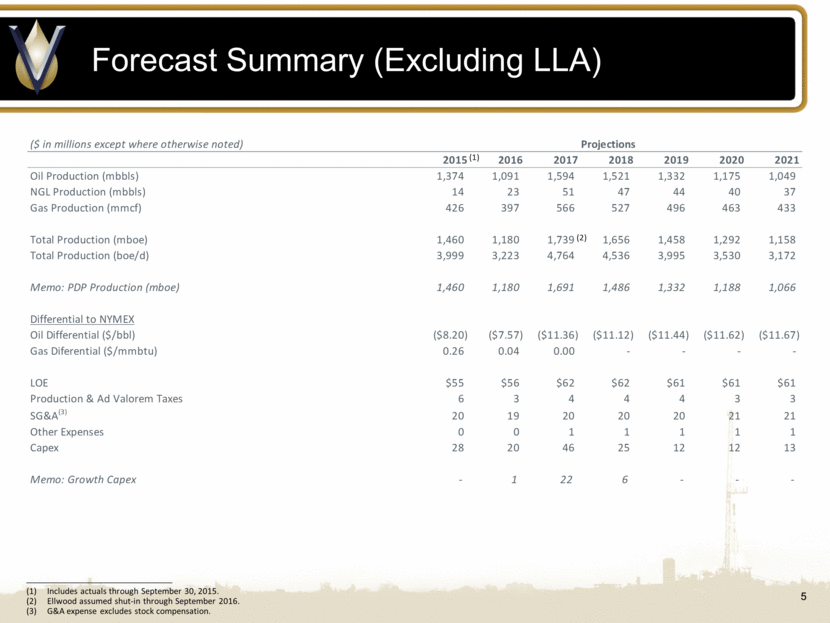
Forecast Summary (Excluding LLA) ________________________________________________ Includes actuals through September 30, 2015. Ellwood assumed shut-in through September 2016. G&A expense excludes stock compensation. ($ in millions except where otherwise noted) Projections 2015 2016 2017 2018 2019 2020 2021 Oil Production (mbbls) 1,374 1,091 1,594 1,521 1,332 1,175 1,049 NGL Production (mbbls) 14 23 51 47 44 40 37 Gas Production (mmcf) 426 397 566 527 496 463 433 Total Production (mboe) 1,460 1,180 1,739 1,656 1,458 1,292 1,158 Total Production (boe/d) 3,999 3,223 4,764 4,536 3,995 3,530 3,172 Memo: PDP Production (mboe) 1,460 1,180 1,691 1,486 1,332 1,188 1,066 Differential to NYMEX Oil Differential ($/bbl) ($8.20) ($7.57) ($11.36) ($11.12) ($11.44) ($11.62) ($11.67) Gas Diferential ($/mmbtu) 0.26 0.04 0.00 - - - - LOE $55 $56 $62 $62 $61 $61 $61 Production & Ad Valorem Taxes 6 3 4 4 4 3 3 SG&A (3) 20 19 20 20 20 21 21 Other Expenses 0 0 1 1 1 1 1 Capex 28 20 46 25 12 12 13 Memo: Growth Capex - 1 22 6 - - - (2) (1)

