Attached files
| file | filename |
|---|---|
| EX-23.3 - EX-23.3 - Venoco, Inc. | a2196543zex-23_3.htm |
| EX-99.1 - EX-99.1 - Venoco, Inc. | a2196543zex-99_1.htm |
| EX-32 - EX-32 - Venoco, Inc. | a2196543zex-32.htm |
| EX-23.1 - EX-23.1 - Venoco, Inc. | a2196543zex-23_1.htm |
| EX-10.7.3 - EX-10.7.3 - Venoco, Inc. | a2196543zex-10_73.htm |
| EX-23.2 - EX-23.2 - Venoco, Inc. | a2196543zex-23_2.htm |
| EX-31.1 - EX-31.1 - Venoco, Inc. | a2196543zex-31_1.htm |
| EX-31.2 - EX-31.2 - Venoco, Inc. | a2196543zex-31_2.htm |
| EX-10.7.6 - EX-10.7.6 - Venoco, Inc. | a2196543zex-10_76.htm |
UNITED STATES
SECURITIES AND EXCHANGE COMMISSION
Washington, D.C. 20549
FORM 10-K
| ý | ANNUAL REPORT PURSUANT TO SECTION 13 OR 15(d) OF THE SECURITIES EXCHANGE ACT OF 1934 | |
For the fiscal year ended December 31, 2009 |
||
o |
TRANSITION REPORT PURSUANT TO SECTION 13 OR 15(d) OF THE SECURITIES EXCHANGE ACT OF 1934 |
|
For the transition period from to |
||
Commission file number 333-123711
VENOCO, INC.
(Exact Name of Registrant as Specified in its Charter)
| Delaware | 77-0323555 | |
| (State or other jurisdiction of incorporation or organization) |
(I.R.S. Employer Identification No.) |
|
| 370 17th Street, Suite 3900 Denver, Colorado |
80202-1370 | |
| (Address of principal executive offices) | (Zip Code) |
(303) 626-8300
(Registrant's telephone number, including area code)
Securities Registered Pursuant to Section 12(b) of the Act:
| Title of Each Class | Name of Exchange on Which Registered | |
|---|---|---|
| Common Stock, par value $0.01 per share | New York Stock Exchange |
Securities Registered Pursuant to Section 12(g) of the Act: None
Indicate by check mark if the registrant is a well-known seasoned issuer, as defined in Rule 405 of the Securities Act. Yes o No ý
Indicate by check mark if the registrant is not required to file reports pursuant to Section 13 or Section 15(d) of the Exchange Act. Yes o No ý
Indicate by check mark whether the registrant: (1) has filed all reports required to be filed by Section 13 or 15(d) of the Securities Exchange Act of 1934 during the preceding 12 months (or for such shorter period that the registrant was required to file such reports), and (2) has been subject to such filing requirements for the past 90 days. Yes ý No o
Indicate by check mark whether the registrant has submitted electronically and posted on its corporate Web site, if any, every Interactive Data File required to be submitted and posted pursuant to Rule 405 of Regulation S-T (§ 232.405 of this chapter) during the preceding 12 months (or for such shorter period that the registrant was required to submit and post such files). Yes o No o
Indicate by check mark if disclosure of delinquent filers pursuant to Item 405 of Regulation S-K is not contained herein, and will not be contained, to the best of registrant's knowledge, in definitive proxy or information statements incorporated by reference in Part III of this Form 10-K or any amendment to this Form 10-K. ý
Indicate by check mark whether the registrant is a large accelerated filer, an accelerated filer, a non-accelerated filer, or a smaller reporting company. See the definitions of "large accelerated filer," "accelerated filer" and "smaller reporting company" in Rule 12b-2 of the Exchange Act.
| Large accelerated filer o | Accelerated filer ý | Non-accelerated filer o (Do not check if a smaller reporting company) |
Smaller reporting company o |
Indicate by check mark whether the registrant is a shell company (as defined in Rule 12b-2 of the Exchange Act). Yes o No ý
The aggregate market value of the registrant's common stock held by non-affiliates of the registrant on June 30, 2009 was $154.2 million, based on the closing price as reported on the New York Stock Exchange (treating, for this purpose, all executive officers and directors of the registrant, and a charitable foundation associated with the registrant's chief executive officer, as affiliates). There were 52,513,397 shares of common stock outstanding as of December 31, 2009.
DOCUMENTS INCORPORATED BY REFERENCE
Part III is incorporated by reference from the registrant's definitive Proxy Statement for its 2010 Annual Meeting of Stockholders to be filed, pursuant to Regulation 14A, no later than 120 days after the close of the registrant's fiscal year.
VENOCO, INC. 2009 ANNUAL REPORT ON FORM 10-K
TABLE OF CONTENTS
i
This report on Form 10-K contains forward-looking statements as defined in the Private Securities Litigation Reform Act of 1995. The use of any statements containing the words "anticipate," "intend," "believe," "estimate," "project," "expect," "plan," "should," "could" or similar expressions are intended to identify such statements. Forward-looking statements may relate to, among other things:
- •
- our future financial position, including cash flow and anticipated liquidity;
- •
- amounts and nature of future capital expenditures;
- •
- acquisitions and other business opportunities, including those relating to the proposed lease extension and pipeline
projects in the South Ellwood field and our onshore Monterey shale development project;
- •
- our ability to raise capital through debt or equity offerings, borrowings under our revolving credit facility or other
transactions, including lenders' willingness and ability to fund amounts under the revolving credit facility and our ability to comply with covenants set forth in the revolving credit agreement;
- •
- operating costs and other expenses;
- •
- wells to be drilled, reworked or recompleted and the results of those activities;
- •
- oil and natural gas prices and demand;
- •
- exploitation, development and exploration prospects;
- •
- the amount and timing of expenses relating to asset retirement obligations;
- •
- the ability and willingness of counterparties to our commodity derivative contracts to perform their obligations;
- •
- expiration of oil and natural gas leases that are not held by production;
- •
- declines in the values of our natural gas and oil properties that may result in write-downs;
- •
- estimates of proved oil and natural gas reserves, PV-10 and related cash flows;
- •
- reserve potential;
- •
- development and infill drilling potential;
- •
- business strategy;
- •
- future production of oil and natural gas;
- •
- the receipt of governmental permits and approvals relating to our operations, including permits and approvals relating to
the proposed lease extension and pipeline projects in the South Ellwood field and to the availability of the new barge we plan to use to deliver oil production from the South Ellwood field;
- •
- transportation of the oil and natural gas we produce;
- •
- planned or possible asset sales or dispositions, including our potential sale of Texas assets (and the use of proceeds
from any such sale); and
- •
- expansion and growth of our business and operations.
The expectations reflected in such forward-looking statements may prove to be incorrect. Disclosure of important factors that could cause actual results to differ materially from our expectations, or cautionary statements, are included under the heading "Risk Factors" and elsewhere in
1
this report, including, without limitation, in conjunction with the forward-looking statements. All forward-looking statements speak only as of the date made. All subsequent written and oral forward-looking statements attributable to us, or persons acting on our behalf, are expressly qualified in their entirety by the cautionary statements. Except as required by law, we undertake no obligation to update any forward-looking statement to reflect events or circumstances after the date on which it is made or to reflect the occurrence of anticipated or unanticipated events or circumstances.
Factors that could cause actual results to differ materially from our expectations include, among others, such things as:
- •
- changes in oil and natural gas prices, including reductions in prices that would adversely affect our revenues, income,
cash flow from operations, liquidity and reserves;
- •
- adverse conditions in global credit markets and in economic conditions generally;
- •
- risks related to our level of indebtedness;
- •
- our ability to replace oil and natural gas reserves;
- •
- risks arising out of our hedging transactions;
- •
- our inability to access oil and natural gas markets due to operational impediments;
- •
- uninsured or underinsured losses in, or operational problems affecting, our oil and natural gas operations;
- •
- inaccuracy in reserve estimates and expected production rates;
- •
- exploitation, development and exploration results, including from enhanced recovery activities;
- •
- our ability to manage expenses, including expenses associated with asset retirement obligations;
- •
- a lack of available capital and financing, including as a result of a reduction in the borrowing base under our revolving
credit facility;
- •
- the potential unavailability of drilling rigs and other field equipment and services;
- •
- the existence of unanticipated liabilities or problems relating to acquired businesses or properties;
- •
- difficulties involved in the integration of operations we have acquired or may acquire in the future;
- •
- factors affecting the nature and timing of our capital expenditures;
- •
- the impact and costs related to compliance with or changes in laws or regulations governing our oil and natural gas
operations;
- •
- delays, denials or other problems relating to our receipt of operational consents and approvals from governmental entities
and other parties;
- •
- environmental liabilities;
- •
- loss of senior management or technical personnel;
- •
- acquisitions and other business opportunities (or the lack thereof) that may be presented to and pursued by us;
- •
- risk factors discussed in this report; and
- •
- other factors, many of which are beyond our control.
2
3D and 2D seismic |
3D seismic data is geophysical data that depicts the subsurface strata in three dimensions. 3D seismic data typically provides a more detailed and accurate interpretation of the subsurface strata than two dimensional, or 2D, seismic data. | |
Anticline |
An arch-shaped fold in rock in which rock layers are upwardly convex. |
|
Bbl |
One stock tank barrel, or 42 U.S. gallons liquid volume, used in reference to oil or other liquid hydrocarbon. |
|
Bcf |
One billion cubic feet of natural gas. |
|
Bcfe |
One billion cubic feet of natural gas equivalent, using the ratio of one barrel of crude oil, condensate or natural gas liquids to six Mcf of natural gas. |
|
BOE |
One stock tank barrel of oil equivalent, using the ratio of six Mcf of natural gas to one barrel of crude oil, condensate or natural gas liquids. |
|
Btu |
British thermal unit, the quantity of heat required to raise the temperature of one pound of water by one degree Fahrenheit. |
|
Completion |
The installation of permanent equipment for the production of oil or natural gas or, in the case of a dry well, reporting to the appropriate authority that the well has been abandoned. |
|
Condensate |
A mixture of hydrocarbons that exists in the gaseous phase at original reservoir temperature and pressure, but that, when produced, is in the liquid phase at surface pressure and temperature. |
|
/d |
Per day. |
|
Developed acreage |
The number of acres which are allocated or assignable to producing wells or wells capable of production. |
|
Development drilling or development wells |
Drilling or wells drilled within the proved area of an oil or natural gas reservoir to the depth of a stratigraphic horizon known to be productive. |
|
Dry well |
A well found to be incapable of producing either oil or natural gas in sufficient quantities to justify completion of the well. |
|
Exploitation and development activities |
Drilling, facilities and/or production-related activities performed with respect to proved and probable reserves. |
|
Exploration activities |
The initial phase of oil and natural gas operations that includes the generation of a prospect and/or play and the drilling of an exploration well. |
3
Exploration well |
Means "exploratory well" as defined in Rule 4-10 of SEC Regulation S-X and refers to a well drilled to find a new field or to find a new reservoir in a field previously found to be productive of oil or gas in another reservoir. |
|
Finding and development costs |
Capital costs incurred in the acquisition, exploration, development and revision of proved oil and natural gas reserves divided by proved reserve additions. |
|
Gross acres or gross wells |
The total acres or wells, as applicable, in which a working interest is owned. |
|
Infill drilling |
Drilling of an additional well or wells at less than existing spacing to more adequately drain a reservoir. |
|
Injection well |
A well in which water is injected, the primary objective typically being to maintain reservoir pressure. |
|
MBbl |
One thousand barrels. |
|
MBOE |
One thousand BOEs. |
|
Mcf |
One thousand cubic feet of natural gas. For the purposes of this report, this volume is stated at the legal pressure base of the state or area in which the reserves are located and at 60 degrees Fahrenheit. |
|
MMcf |
One million cubic feet of natural gas. For the purposes of this report, this volume is stated at the legal pressure base of the state or area in which the reserves are located and at 60 degrees Fahrenheit. |
|
MMcfe |
One million cubic feet of natural gas equivalent, using the ratio of one barrel of crude oil, condensate or natural gas liquids to 6 Mcf of natural gas. |
|
MMBbl |
One million barrels. |
|
MMBOE |
One million BOEs. |
|
MMBtu |
One million British thermal units. |
|
Natural gas liquids |
Hydrocarbons found in natural gas which may be extracted as liquefied petroleum gas and natural gasoline. |
|
Net acres or net wells |
The gross acres or wells, as applicable, multiplied by the working interests owned. |
|
NYMEX |
The New York Mercantile Exchange. |
|
Oil |
Crude oil, condensate and natural gas liquids. |
|
Pay zone |
A geological deposit in which oil and natural gas is found in commercial quantities. |
|
Producing well or productive well |
A well that is capable of production in sufficient quantities to justify completion, including producing wells and wells mechanically capable of production. |
4
Proved developed non-producing reserves |
Proved developed reserves that do not qualify as proved developed producing reserves, including reserves that are expected to be recovered from (i) completion intervals that are open at the time of the estimate, but have not started producing, (ii) wells that are shut in because pipeline connections are unavailable or (iii) wells not capable of production for mechanical reasons. |
|
Proved developed reserves |
This term means "proved developed oil and gas reserves" as defined in Rule 4-10 of SEC Regulation S-X, and refers to reserves that can be expected to be recovered through existing wells with existing equipment and operating methods. |
|
Proved developed reserves to production ratio |
The ratio of proved developed reserves to total net production for the fourth quarter of the relevant year or other specified period. |
|
Proved developed producing reserves |
Reserves that are being recovered through existing wells with existing equipment and operating methods. |
|
Proved reserves or proved oil and gas reserves |
This term means "proved oil and gas reserves" as defined in Rule 4-10 of SEC Regulation S-X and refers to the quantities of oil and gas, which, by analysis of geoscience and engineering data, can be estimated with reasonable certainty to be economically producible—from a given date forward, from known reservoirs, and under existing economic conditions, operating methods, and government regulations—prior to the time at which contracts providing the right to operate expire, unless evidence indicates that renewal is reasonably certain, regardless of whether deterministic or probabilistic methods are used for the estimation. |
|
Proved reserves to production ratio |
The ratio of total proved reserves to total net production for the fourth quarter of the relevant year or other specified period. |
|
PV-10 |
The PV-10 of reserves is the present value of estimated future revenues to be generated from the production of the reserves net of estimated production and future development costs and future plugging and abandonment costs, using the twelve-month arithmetic average of the first of the month prices (except that for periods prior to December 31, 2009, the period end price was used), without giving effect to hedging activities or future escalation, costs as of the date of estimate without future escalation, without non-property related expenses such as general and administrative expenses, debt service and depreciation, depletion, amortization and impairment and income taxes, and discounted using an annual discount rate of 10%. |
5
Recompletion |
The completion for production of an existing wellbore in a different formation or producing horizon, either deeper or shallower, from that in which the well was previously completed. |
|
Reserves |
This term is defined in Rule 4-10 of SEC Regulation S-X and refers to estimated remaining quantities of oil and gas and related substances anticipated to be economically producible, as of a given date, by application of development projects to known accumulations. In addition, there must exist, or there must be a reasonable expectation that there will exist, the legal right to produce or a revenue interest in the production, installed means of delivering oil and gas or related substances to market, and all permits and financing required to implement the project. |
|
Secondary recovery |
The second stage of hydrocarbon production during which an external fluid such as water or gas is injected into the reservoir through injection wells located in rock that has fluid communication with production wells. The purpose of secondary recovery is to maintain reservoir pressure and to displace hydrocarbons toward the wellbore. |
|
Shut in |
A well suspended from production or injection but not abandoned. |
|
Spacing |
The number of wells which can be drilled on a given area of land under applicable regulations. |
|
Undeveloped acreage |
Acreage on which wells have not been drilled or completed to a point that would permit the production of economic quantities of oil and natural gas regardless of whether the acreage contains proved oil and natural gas reserves. |
|
Undeveloped reserves |
This term is defined in Rule 4-10 of SEC Regulation S-X and refers to reserves that are expected to be recovered from new wells on undrilled acreage, or from existing wells where a relatively major expenditure is required for recompletion. |
|
Waterflood |
A method of secondary recovery in which water is injected into the reservoir formation to displace residual oil. |
|
Working interest |
The operating interest that gives the owner the right to drill, produce and conduct operating activities on the property and to receive a share of production, subject to all royalties, overriding royalties and other burdens, all costs of exploration, development and operations and all risks in connection therewith. |
|
Workover |
Remedial operations on a well conducted with the intention of restoring or increasing production from the same zone, including by plugging back, squeeze cementing, reperforating, cleanout and acidizing. |
6
ITEM 1. AND ITEM 2. Business and Properties
We are an independent energy company primarily engaged in the acquisition, exploration, exploitation and development of oil and natural gas properties. Since our founding in 1992, our core areas of focus have been offshore and onshore California. Our principal properties are located both onshore and offshore Southern California, onshore in California's Sacramento Basin and onshore along the Gulf Coast of Texas, and are characterized by long reserve lives, predictable production profiles and substantial opportunities for further exploitation and development.
We are one of the largest independent oil and natural gas companies in California based on production volumes. According to a reserve report prepared by DeGolyer & MacNaughton, we had proved reserves of approximately 98.3 MMBOE as of December 31, 2009, based on assumed prices of $61.04 per Bbl for oil and $3.87 per MMBtu for natural gas. As of that date, 53% of our proved reserves were oil and 51% were proved developed, and the PV-10 of those reserves was approximately $801.1 million. Our definition of PV-10, and a reconciliation of a standardized measure of discounted future net cash flows to PV-10, is set forth in "Management's Discussion and Analysis of Financial Condition and Results of Operation—PV-10." Our average net production in the fourth quarter of 2009 was 20,079 BOE/d.
The following table summarizes certain information concerning our production in 2009 and our reserves and inventory of drilling locations as of December 31, 2009.
| |
2009 Net Production | Proved Reserves(1) | |
|||||||||||||||||||
|---|---|---|---|---|---|---|---|---|---|---|---|---|---|---|---|---|---|---|---|---|---|---|
| |
Oil (MBbl) |
Gas (MMCF) |
(MBOE) | Total (MMBOE) |
% Oil |
PV-10 ($MM) |
Drilling Locations(2) |
|||||||||||||||
Southern California |
2,962 | 896 | 3,111 | 50.0 | 93.6 | % | $ | 585.8 | 49 | |||||||||||||
Sacramento Basin |
3 | 22,387 | 3,734 | 40.5 | 0.0 | % | $ | 136.4 | 680 | |||||||||||||
Texas |
437 | 1,465 | 682 | 7.8 | 66.4 | % | $ | 78.9 | 32 | |||||||||||||
Total |
3,402 | 24,748 | 7,527 | 98.3 | 52.9 | % | $ | 801.1 | 761 | |||||||||||||
- (1)
- Based
on unescalated twelve month average of the first day of the month spot prices of $61.04 per Bbl for oil and natural gas liquids and $3.87 per MMBtu
for natural gas, in each case adjusted for regional price differentials and similar factors.
- (2)
- Represents total gross drilling locations identified by management as of December 31, 2009. Of the total, 363 locations are classified as proved.
Our Strengths
We believe that the following strengths provide us with significant competitive advantages:
High quality asset base with a long reserve life. Most of our reserves are located in fields that have large volumes of hydrocarbons in place in multiple geologic horizons. One of our primary objectives is to use our engineering expertise to improve recovery rates from these fields and thereby increase our production and reserves. Our offshore Southern California fields and our Texas Gulf Coast fields generally have well-established production histories and exhibit relatively moderate production declines. As of December 31, 2009, our proved reserves to production ratio was 13 years based on production during the fourth quarter of 2009. We believe that this relatively stable base of long-lived production is a strong platform to support further growth in our reserves and production.
Significant drilling inventory and growth potential. We operate properties with substantial volumes of remaining hydrocarbons and, consequently, significant potential upside in proved reserves. We
7
believe that we can develop additional reserves from these properties on a cost effective basis with relatively limited risk. As of December 31, 2009, we had identified 761 drilling locations on our properties, and we anticipate identifying additional locations on those properties as we pursue our exploitation and development activities. We believe that the continued exploitation and development of our properties will allow us to develop significant additional reserves even if we do not make additional acquisitions, and that by continuing to focus on our core geographic areas, we can leverage our technical expertise and manage our capital resources efficiently. Growth projects that we expect to pursue include (i) infill drilling of 20 and ten acre spacing as well as step-out wells to test and expand the boundaries of producing fields in the Sacramento Basin, (ii) development activities in Southern California, in particular at the Sockeye, South Ellwood and West Montalvo fields, and (iii) expanded leasing and development of our nearly 90,000 net acres that target the onshore Monterey shale formation.
Extensive knowledge of the Monterey shale formation. A substantial portion of our production is from offshore wells targeting the fractured Monterey shale formation. Our technical team has extensive offshore experience with the evaluation and exploitation of this reservoir. We believe that there are significant exploration, exploitation and development opportunities relating to the Monterey shale formation onshore as well, and that our offshore expertise will help us take advantage of those opportunities.
Substantial operational flexibility. We have substantial flexibility in adapting our activities to respond to changes in commodity prices and business conditions generally. We have relatively few medium and long-term drilling commitments and are therefore capable of deferring a large portion of our capital expenditures and/or shifting those expenditures between natural gas and oil-oriented projects as commodity prices dictate. In addition, we have operating control of substantially all of our properties, which allows us to manage overhead, production and drilling costs and capital expenditures and to control the timing of exploration, exploitation and development activities. Our flexibility is further enhanced by our robust hedging position covering a portion of our production from 2010 to 2012. For 2010, we have floors covering 88% of our production guidance, with a weighted-average NYMEX floor price for oil production of $56.22 per Bbl and a weighted-average NYMEX floor price for natural gas production of $6.48 per MMBtu.
Efficient cost structure. Our lease operating expenses declined substantially to $12.65 per BOE in 2009 from $16.86 per BOE in 2008, due in large part to the sale of a relatively high-cost field and increased efficiencies in a variety of operating areas. We expect that an increased focus on oil projects will result in a small increase in our per BOE production expenses in 2010 relative to 2009, as oil projects tend to have higher operating costs than natural gas projects. However, we will continue to focus on our operating cost structure in order to create additional production and processing efficiencies and reduce operational downtime.
Reputation for environmental, safety and regulatory compliance. We believe that we have established a reputation among regulators and other oil and natural gas companies as having a commitment to safe environmental practices. For example, the state of California has presented us with awards for outstanding lease maintenance at our Beverly Hills and Santa Clara Avenue fields and the onshore facility that services the South Ellwood field. Additionally, the Minerals Management Service presented us with the Safety Award for Excellence for our offshore operations in the Santa Clara Federal Unit, recognizing us as the top operator in the Pacific Outer Continental Shelf in 2008. We believe that our reputation is an important advantage for us when we are competing to acquire properties, particularly those in environmentally sensitive areas, because sellers are often concerned that they could be held responsible for environmental problems caused by the purchaser.
Strong position in the Sacramento Basin. We have considerable expertise in the exploration, exploitation and development of properties in the Sacramento Basin, where we have operated since
8
1996. We have drilled over 380 wells in the basin in the last five years and we are currently one of the largest operators there in terms of production and acreage. We believe that our experience, expertise and substantial presence in the basin will allow us to take advantage of attractive acquisition, exploration, exploitation and development opportunities there. In addition, we believe that the basin's proximity to northern California natural gas markets, its substantial gathering infrastructure and pipeline capacity and the relatively small historical differential to NYMEX prices received for natural gas produced there contribute to the value of our position.
Experienced, proven management and operations team. The members of our management team have an average of over 25 years of experience in the oil and natural gas industry. Prior to founding our company in 1992, our CEO, Timothy Marquez, worked for Unocal for 13 years in both engineering and managerial positions. Our operations team has significant experience in the California and Texas oil and natural gas industry across a broad range of disciplines, including geology, drilling and operations, and regulatory and environmental matters. Our team includes 65 engineers and geoscientists as of December 31, 2009. We believe that our experience and knowledge of the California oil and natural gas industry are important competitive advantages for us.
Our Strategy
We intend to continue to use our competitive strengths to advance our corporate strategy. The following are key elements of that strategy:
Make opportunistic acquisitions of underdeveloped properties. We pursue acquisitions that we believe will add reserves and production on a cost-effective basis. Our primary focus is on operated interests in large, mature fields that are located in our core operating regions and have significant production histories, established proved reserves and potential for further exploitation and development. We intend to continue to pursue acquisition opportunities to selectively expand our portfolio of properties.
Continue development of the Sacramento Basin. We intend to continue to pursue an active drilling and acreage acquisition program in the Sacramento Basin. In 2009, our net production in the basin was 22,405 MMcfe (3,734 MBOE), up 9% from our net production there in 2008, and up 38% from our net production there in 2007. We believe the basin presents significant exploration, exploitation and development opportunities from both conventional and unconventional reservoirs. As one of the largest operators in the basin, we believe that we are well positioned to identify and exploit these opportunities.
Explore and develop the onshore Monterey shale formation. We plan to use the expertise we have developed with the fractured Monterey shale formation from our work in the South Ellwood and Sockeye fields to facilitate our acquisition, exploration, exploitation and development of onshore properties with similar characteristics. We plan to devote approximately 14% of our $180 million capital expenditure budget for 2010, or $26 million, on activities targeting the onshore Monterey shale, including the drilling of five wells and the acquisition of additional acreage and 3D seismic data. We expect a further expansion of our activities in the area in subsequent years.
Continue to focus on the California market. Historically, we have focused primarily on properties onshore and offshore California. We believe the California market will continue to provide us with attractive growth opportunities. Many properties in California are characterized by significant hydrocarbons in place with multiple pay zones and long reserve lives—characteristics that our technical expertise makes us well-suited to exploit. We intend to continue to take advantage of development opportunities in the Sockeye, South Ellwood, West Montalvo and other California fields that have these characteristics. In addition, competition for the acquisition of properties in California is limited relative to many other markets because of the state's unique operational and regulatory environment. We
9
believe that our technical capabilities, environmental record and experience with California regulatory requirements will allow us to grow in the California market. We are currently marketing for sale all of our Texas assets, which collectively represented approximately 7.9% of our proved reserves as of December 31, 2009. We would expect to use a portion of the proceeds of any completed sale transaction to further our acquisition, exploration and development activities in California.
Description of Properties
Southern California
South Ellwood Field. The South Ellwood field is located in state waters approximately two miles offshore California in the Santa Barbara channel. We conduct our operations in the field from platform Holly and own related onshore processing facilities. We acquired our interest in the field from Mobil Oil Corporation in 1997. Since that time, we have made numerous operational enhancements to the field, including redrills, sidetracks and reworks of existing wells and upgrades at the platform and the onshore treatment facility. We operate the field and have a 100% working interest.
The South Ellwood field is approximately seven miles long and is part of a regional east-west trend of similar geologic structures running along the northern flank of the Santa Barbara channel and extending to the Ventura basin. This trend encompasses several fields that, over their respective lifetimes, are each expected to produce over 100 million barrels of oil, according to the California Division of Oil, Gas, and Geothermal Resources. The Monterey shale formation is the primary oil reservoir in the field, producing sour oil with a gravity of approximately 22 degrees. As of December 31, 2009, there were 15 producing wells and two injection wells in the field.
Our processing and transportation facilities at South Ellwood include a common carrier pipeline, an onshore facility, a pier and a marine terminal. We conduct two-phase separation on the drilling platform and the oil/water emulsion is transported by pipeline to the onshore facility for further separation. The oil is then transported to the marine terminal via the common carrier pipeline. From the marine terminal, the oil is transported by a barge that is owned and operated by a third party. Title to the oil is transferred when the barge completes delivery. Beginning in March 2010, we will sell oil production from the field to a major oil company pursuant to a contract that will be terminable by either party with 60 days notice after August 2010. Natural gas produced at the field is transported by common carrier pipeline.
Our subsidiary, Ellwood Pipeline, Inc. is pursuing the permits necessary to build a common carrier pipeline that would allow us to transport our oil to refiners without the use of a barge or the marine terminal. We anticipate that approval hearings for the project will not be held before the second half of 2010. While we believe the pipeline should be approved, the outcome of these hearings cannot be predicted. Pending regulatory approvals and completion of the pipeline, we expect to use our current barge and a second, double-hulled barge (the "new barge") to transport oil production from the field. We have obtained permits that will allow us to use the new barge through May 2010, on a limited basis and subject to its other delivery commitments, if the current barge is out of service. We are pursuing the permits necessary to use the new barge on a full-time basis, and expect to receive them no later than May 2010. Subject to the receipt of those permits and approvals, we expect to transition to use of the new barge in connection with the termination of the contract for the current barge, which will occur contemporaneously with the availability of the new barge. The new sales contract for oil production from the field will allow us to use the current barge until the new barge is available. We are also pursuing the permits necessary for a lease extension in the field that would effectively double the size of the existing lease area. Development of the lease extension area can be accomplished from the field's existing platform.
It will be important for us that Ellwood Pipeline, Inc. complete the proposed common carrier pipeline by 2016 at the latest, as our lease for the site where our oil storage tanks are located, which is
10
held by the University of California, Santa Barbara, will expire at that time, and the current barging operation will likely not be feasible if that lease is not extended or renewed. Moreover, it is possible that pursuit of the lease extension project will complicate the efforts of Ellwood Pipeline, Inc. to obtain the necessary permits for the pipeline project. Accordingly, we may withdraw the application for the lease extension project if we determine that continuing the permitting process for that project is likely to significantly impede the permitting of the pipeline.
Santa Clara Federal Unit. The Santa Clara Federal Unit is located approximately ten miles offshore in the Santa Barbara channel near Oxnard, California. Our operations in the unit are conducted from two platforms, platform Gail in the Sockeye field and platform Grace in the Santa Clara field. We acquired our interest in the unit and the associated facilities from Chevron in February 1999. Production is transported via pipeline to Los Angeles, California. We operate the unit and have a 100% working interest.
The Sockeye field structure is a northwest/southeast trending anticline bounded to the north and south by fault systems. The field produces from multiple stacked reservoirs ranging from the Monterey shale, at about 4,000 feet, to the Middle Sespe at approximately 7,000 feet. Other formations include the Upper Topanga, Lower Topanga and Sespe. As of December 31, 2009, there were 19 producing wells and 12 injection wells in the field. The oil produced from the Monterey shale and Upper Topanga is sour with gravities ranging from 12 to 18 degrees. The Lower Topanga and Sespe horizons produce sweet crude with gravities of 26 to 30 degrees. Chevron shut in production at platform Grace in the Santa Clara field in 1997, and we currently use the platform as a launching and receiving facility for pipeline cleaning devices and as an interconnecting pipeline to transport oil and natural gas produced from platform Gail to our onshore plant.
West Montalvo. We acquired the West Montalvo field in Ventura County, California in May 2007. We operate the field and have a 100% working interest. The field, which includes an offshore portion that is reachable from onshore locations, produces from the Sespe formation. As of December 31, 2009, there were 31 producing wells in the field. Since acquiring the field, our activities have focused on returning idle wells to production, working over and recompleting existing wells, and upgrading well lift systems and processing facilities.
Dos Cuadras Field. The Dos Cuadras field is located in federal waters approximately five miles offshore California in the Santa Barbara channel. We acquired our 25% non-operated working interest in the western two-thirds of the field from Chevron in February 1999. We have working interests ranging from approximately 17.5% to 25% in the associated onshore facility and pipelines. The field is operated by an unaffiliated third party. Production is transported via pipeline to Los Angeles, California. As of December 31, 2009, there were 88 producing wells and 21 injection wells in the field.
Onshore Southern California. Our onshore properties in the Southern California region include the Beverly Hills West field, the Santa Clara Avenue field and the Cat Canyon field. The Beverly Hills West field is located in Beverly Hills, California. All drilling and production operations at the field are conducted from a 0.6 acre surface location adjacent to the campus of Beverly Hills high school. We acquired our interest in the field in 1995. We operate the field and have a 100% working interest. The Santa Clara Avenue field is located in Ventura County, California. We acquired our interest in this field in 1994 and 1996. We operate the field and have working interests ranging from 43% to 100%. The Cat Canyon field, which we acquired in December 2007, is located in Santa Barbara County, California. We operate the field and have a 100% working interest. As of December 31, 2009, there were a total of 47 producing wells in these onshore Southern California fields.
11
Sacramento Basin
In terms of historical production, the Sacramento Basin is one of California's most prolific onshore natural gas producing areas not associated with oil production. It is approximately 210 miles long and 60 miles wide and contains a variety of different geologic plays. We own 3D seismic data covering over 1,100 square miles in the basin, and 2D seismic data covering approximately 20,000 line miles. We continue to analyze this data to identify additional exploration, exploitation and development opportunities on our properties. We believe this data will also help us assess acquisition opportunities in the basin.
Willows and Greater Grimes Fields. The Willows and Greater Grimes fields are located in Colusa, Glenn and Sutter Counties north of Sacramento, California. Our combined lease position in these fields was approximately 185,000 net acres as of December 31, 2009. We operate substantially all of the fields and have a volume-weighted average working interest of 86% (based on production during the fourth quarter of 2009). On June 30, 2009, we closed on the acquisition of certain natural gas producing properties in the Sacramento Basin, which we purchased from Aspen Exploration Corporation and certain other parties. The majority of the producing wells purchased are located in the Willows and Greater Grimes area.
Natural gas production in the Greater Grimes field is from the Forbes, Kione and Guinda formations and production in the Willows field is from the Forbes and Kione formations. Depths range from 2,800 feet in the Willows field to 8,900 feet in the Greater Grimes field. There were 507 producing wells in the fields as of December 31, 2009.
Other Sacramento Basin. We own interests in a number of other fields in Solano, Contra Costa, San Joaquin and Colusa Counties. We operate substantially all of these fields and have a volume-weighted average working interest of 81% (based on production during the fourth quarter of 2009). As of December 31, 2009, there were a total of 42 producing wells in these fields. We believe that the fields will provide us with exploration, exploitation and development opportunities that are similar to those found in the Willows and Greater Grimes fields.
Texas
We are currently engaged in actively marketing all of our oil and natural gas interests in the Texas properties discussed below. Net production from our Texas properties for the fourth quarter of 2009 averaged 1,505 BOE/d. The Texas properties comprised 7.9% of our proved reserves at December 31, 2009 or 7.8 MMBOE. We expect to use the proceeds from the sale of the Texas assets to fund capital expenditures, reduce debt and fund operations.
Hastings Complex. The Hastings complex encompasses approximately 4,550 net or 4,800 gross acres located 30 miles south of Houston in Brazoria County. The complex is comprised of the West Hastings Unit, the East Hastings field and the Hastings field. The complex produces light, sweet crude oil with a gravity of approximately 30 degrees and is characterized by long-life, stable production. The fields in the complex produce from multiple Miocene and Frio reservoirs at depths ranging from 2,000 to 6,100 feet.
In February 2009, we sold our interest in properties producing from the Frio formation in the Hastings complex to Denbury for approximately $197.7 million, after certain post-closing adjustments, pursuant to an option agreement we entered into with Denbury in November 2006. The purchase price was in addition to the $50.0 million option payment Denbury previously made to us under the agreement. We retained certain interests in the complex not related to the Frio formation. Substantially all of the current production from the complex is from the Frio formation.
12
Pursuant to the agreement, Denbury has committed to a plan to pursue a CO2 enhanced recovery project at properties it acquired. The plan calls for Denbury to make capital expenditures of at least $178.7 million by the end of 2014. As part of the plan, Denbury is responsible for providing the necessary CO2. We have retained an overriding royalty interest of 2.0% in production from the properties. We will also have the right to back in to a working interest of approximately 22.3% in the CO2 project after Denbury recoups (i) its operating costs relating to the project and a portion of the purchase price and (ii) 130% of its capital expenditures made on the project. If CO2 recovery operations do not meet certain development milestones by January 2013, Denbury will be required to either resell the properties to us at a discount or make additional payments to us. The agreement also establishes an area of mutual interest with respect to us and Denbury in specified areas adjacent to the properties. The success of the planned CO2 enhanced recovery project will be subject to numerous risks and uncertainties, including those relating to the geologic suitability of the properties for such a project and the availability of an economic and reliable supply of CO2.
Manvel. We acquired the Manvel field in Brazoria County, Texas, and certain related properties, in April 2007. We operate the field and have a 100% working interest. The field produces from the Frio formation. As of December 31, 2009, there were 45 producing wells in the field. We believe that the field provides us with exploitation and development opportunities, including potential CO2 enhanced recovery opportunities, that are similar to those in the Hastings complex, which is nearby and geologically similar.
Constitution Field. The Constitution field is located in Jefferson County, Texas. We operate part of the field and have working interests ranging from 25% to 100%. The field produces oil with a gravity of approximately 50 degrees and natural gas from the Yegua reservoir at depths ranging from 13,500 feet to 15,300 feet. As of December 31, 2009, there were two producing wells in the field.
South Liberty Field. The South Liberty field is located in Liberty County, Texas. The field produces from the Miocene, Frio, and Yegua formations. Currently all of our production in the field is from the Yegua formation at depths ranging from 7,400 feet to 10,000 feet. We operate the field and have a 100% working interest. As of December 31, 2009, there were 18 producing wells in the field.
Other. Our other Texas properties encompass approximately 9,900 net acres in the southern Gulf Coast region. We operate substantially all of our production in these fields and have a volume-weighted average working interest of 85% (based on production during the fourth quarter of 2009). As of December 31, 2009, there were a total of 57 producing wells in these fields.
Exploration Activities
We intend to allocate a portion, typically 10 to 20 percent, of our annual capital expenditure budget to exploration activities. Our exploration portfolio includes numerous prospects across our core operating regions, and occasionally we pursue ventures in other areas that we believe align with our corporate strengths and strategy.
Onshore Monterey Shale Formation. We have developed an extensive knowledge of the Monterey shale formation and believe the formation holds significant exploration opportunities onshore. A significant portion of our exploration projects target that formation. In 2006 we began actively leasing onshore acreage in Southern California targeting the Monterey shale formation. Our leasing strategy has focused on areas where we believe the Monterey shale will produce light, sweet oil and where the quality and depth of the Monterey shale is expected to be advantageous. To date, our onshore Monterey shale acreage position is approximately 90,000 net acres, and we intend to aggressively add to this position in 2010.
13
Sacramento Basin. We drill a significant number of wells on non-proved locations in the Sacramento Basin. These wells are considered "exploratory wells" as defined in SEC Regulation S-X. See "—Drilling Activity." The majority of the wells in the basin that are "exploratory wells" under SEC Regulation S-X are wells drilled on the border of existing fields in an attempt to test and expand the limits of a producing area. We generally do not distinguish between those wells and development wells from an operating perspective and generally do not include them in our exploration budget.
Oil and Natural Gas Reserves
The following table sets forth our net proved reserves as of the dates indicated. Our reserves as of December 31, 2009 are set forth in a reserve report prepared by DeGolyer & MacNaughton. DeGolyer & MacNaughton reviews production histories and other geological, economic, ownership and engineering data related to our properties in arriving at their reserve estimates. Proved reserves as of each date indicated reflect all acquisitions and dispositions completed as of that date. The reserve estimates at December 31, 2008 are based on unescalated year-end posted prices. The reserve estimates at December 31, 2009 are based on the unescalated twelve month arithmetic average of the first day of the month prices. A report of DeGolyer & MacNaughton regarding its estimates of our proved reserves as of December 31, 2009 has been filed as Exhibit 99.1 to this report.
| |
Years ended December 31, |
||||||||
|---|---|---|---|---|---|---|---|---|---|
| |
2008(1) | 2009(2) | |||||||
Net proved reserves (end of period) |
|||||||||
Oil (MBbl) |
|||||||||
Developed |
34,468 | 29,309 | |||||||
Undeveloped |
23,691 | 22,657 | |||||||
Total |
58,159 | 51,966 | |||||||
Natural gas (MMcf) |
|||||||||
Developed |
107,417 | 126,671 | |||||||
Undeveloped |
128,749 | 151,411 | |||||||
Total |
236,166 | 278,082 | |||||||
Total proved reserves (MBOE) |
97,520 | 98,313 | |||||||
% Oil |
60 | % | 53 | % | |||||
% Proved Developed |
54 | % | 51 | % | |||||
Proved Reserves to Production Ratio |
12 years | 13 years | |||||||
- (1)
- Based
on unescalated year-end posted prices of (i) $44.60 per Bbl for oil and natural gas liquids, and adjusted for quality,
transportation fees and regional price differentials and (ii) $5.62 per MMBtu for natural gas, and adjusted for energy content, transportation fees and regional price differentials.
- (2)
- Based on unescalated twelve month arithmetic average of the first day of the month prices of $61.04 per Bbl for oil and natural gas liquids and $3.87 per MMBtu for natural gas, and adjusted, in each case, as described in note (1) above.
14
Reserves Sensitivity Analysis
The following table sets forth our net proved reserves at December 31, 2009 based on alternative price scenarios as identified below in the footnotes to the table. The following price scenarios illustrate the sensitivity of our estimated reserve quantities under various price assumptions.
| |
Price Case | ||||||||||||||
|---|---|---|---|---|---|---|---|---|---|---|---|---|---|---|---|
| |
A (SEC) | B (Strip) | C (SEC -10%) | D (SEC +10%) | |||||||||||
Net proved reserves (end of period) |
|||||||||||||||
Oil (MBbl) |
|||||||||||||||
Developed |
29,309 | 30,118 | 28,945 | 29,580 | |||||||||||
Undeveloped |
22,657 | 22,671 | 22,651 | 22,661 | |||||||||||
Total |
51,966 | 52,789 | 51,596 | 52,241 | |||||||||||
Natural gas (MMcf) |
|||||||||||||||
Developed |
126,671 | 134,786 | 123,572 | 129,173 | |||||||||||
Undeveloped |
151,411 | 156,141 | 150,238 | 152,409 | |||||||||||
Total |
278,082 | 290,927 | 273,810 | 281,582 | |||||||||||
Total proved reserves (MBOE) |
98,313 | 101,277 | 97,231 | 99,171 | |||||||||||
- A.
- Represents
reserves based on pricing prescribed by the SEC, effective December 31, 2009. Prices are based on unescalated twelve month arithmetic
average of the first day of the month prices of (i) $61.04 per Bbl for oil and natural gas liquids, and adjusted for quality, transportation fees and regional price differentials and
(ii) $3.87 per MMBtu for natural gas, and adjusted for energy content, transportation fees and regional price differentials. Production costs were held constant for the life of the wells.
- B.
- Prices
based on the five year NYMEX forward strip at December 31, 2009, which ranges (i) from $81.16 per Bbl in 2010 increasing to $91.09 per
Bbl in 2014 and held constant thereafter for oil and natural gas liquids and (ii) from $5.79 per MMBtu in 2010 increasing to $6.84 per MMBtu in 2014 and held constant thereafter for natural
gas, and adjusted, in each case, as described in note (A) above. Production costs were held constant with the costs as determined in the year-end unescalated SEC reserve case. (The
five year NYMEX forward strip represents the futures prices for oil and natural gas as reported on the New York Mercantile Exchange as of a specific date.)
- C.
- Prices
based on a 10% reduction of the prices used in the year-end unescalated SEC case, resulting in $54.94 per Bbl for oil and natural gas
liquids and $3.48 per MMbtu for natural gas, and adjusted, in each case as described in note (A) above. Production costs were held constant with the costs as determined in the
year-end unescalated SEC reserve case.
- D.
- Prices based on a 10% increase of the prices used in the year-end unescalated SEC case, resulting in $67.14 per Bbl for oil and natural gas liquids and $4.26 per MMbtu for natural gas, and adjusted, in each case as described in note (A) above. Production costs were held constant with the costs as determined in the year-end unescalated SEC reserve case.
Changes in Proved Reserves
Our net proved reserves of 98,313 MBOE as of December 31, 2009 increased 1% from 97,520 MBOE as of December 31, 2008 (reserves as of December 31, 2009 increased 9% from 89,834 MBOE
15
as of December 31, 2008, pro forma for the sale of Hastings). Our estimated oil and natural gas reserves were principally affected by the following during 2009:
- •
- Revisions of previous estimates increased reserves by 5,051 MBOE (primarily due to (i) improved performance and
cost savings in a number of fields including Sockeye, South Ellwood, West Montalvo and in the Sacramento Basin, and (ii) price changes that resulted in a negative impact of approximately
1,100 MBOE);
- •
- Extensions and discoveries increased reserves by 7,296 MBOE (primarily as a result of (i) drilling in the
Sacramento Basin, which provided supporting evidence to record additional proved undeveloped locations in the same area, and (ii) identification of new zones within existing wells);
- •
- Purchases of reserves in place increased reserves by 3,425 MBOE (primarily related to the Sacramento Basin asset
acquisition);
- •
- Current year production decreased reserves by 7,527 MBOE; and
- •
- Sales of reserves in place decreased reserves by 7,452 MBOE (related to the Hastings sale).
Our proved undeveloped reserves of 47,892 MBOE as of December 31, 2009 increased 6% from 45,149 MBOE as of December 31, 2008. Our estimated proved undeveloped reserves were principally affected by the following during 2009:
- •
- 3,716 MBOE of proved undeveloped reserves were developed (primarily as a result of drilling in the Sacramento
Basin—capital expenditures on those projects during 2009 were approximately $35 million);
- •
- Extensions, discoveries and improved recovery increased proved undeveloped reserves by 5,145 MBOE (primarily as a result
of drilling in the Sacramento Basin, which provided supporting evidence to record additional proved undeveloped locations in the same area);
- •
- Purchases of proved undeveloped reserves in place increased those reserves by 862 MBOE (primarily related to the
Sacramento Basin asset acquisition); and
- •
- Revisions of previous estimates increased proved undeveloped reserves by 452 MBOE.
None of our proved undeveloped reserves as of December 31, 2009 have remained undeveloped for more than five years. All proved undeveloped locations are within one spacing offset of proved locations.
Costs incurred to develop reserves in 2009 declined from 2008, primarily due to the sale of Hastings. Uncertainties with respect to future acquisition and development of reserves include (i) the success of our development programs, including with respect to the development of the onshore Monterey shale formation, (ii) our ability to obtain permits from relevant regulatory bodies to pursue development projects, (iii) changes in commodity prices, (iv) the availability of sufficient cash flow from operations or external financing to fund our capital expenditure program, (v) the effect of legislative or regulatory changes on our ability to pursue our hedging strategy, and (vi) the availability and cost of viable acquisition candidates.
Controls Over Reserve Report Preparation, Technical Qualifications and Technologies Used
Our year-end reserve report is prepared by DeGolyer & MacNaughton based upon a review of property interests being appraised, production from such properties, current costs of operation and development, current prices for production, agreements relating to current and future operations and sale of production, geoscience and engineering data, and other information we provide to them. This information is reviewed by knowledgeable members of our company to ensure accuracy and completeness of the data prior to submission to DeGolyer & MacNaughton. Upon analysis and evaluation of data provided, DeGolyer & MacNaughton issues a preliminary appraisal report of our
16
reserves. The preliminary appraisal report and changes in our reserves are reviewed by our Reserves Manager, relevant Reservoir Engineers, our Vice President of Acquisitions and our President for completeness of the data presented and reasonableness of the results obtained. Once all questions have been addressed, DeGolyer & MacNaughton issues the final appraisal report, reflecting their conclusions.
Our reserve estimates are prepared by DeGolyer & MacNaughton. A letter which identifies the professional qualifications of the individual at DeGolyer & MacNaughton who was responsible for overseeing the preparation of our reserve estimates as of December 31, 2009 has been filed as an addendum to Exhibit 99.1 to this report.
A variety of methodologies are used to determine our proved reserve estimates. The principal methodologies employed are reservoir simulation, decline curve analysis, volumetrics, material balance, advance production type curve matching, petrophysics/log analysis and analogy. Some combination of these methods is used to determine reserve estimates in substantially all of our fields.
Production, Prices, Costs and Balance Sheet Information
The following table sets forth certain information regarding our net production volumes, average sales prices realized, and certain expenses associated with sales of oil and natural gas for the periods indicated. We urge you to read this information in conjunction with the information contained in our
17
financial statements and related notes included elsewhere in this report. The information set forth below is not necessarily indicative of future results.
| |
Years ended December 31, | ||||||||||
|---|---|---|---|---|---|---|---|---|---|---|---|
| |
2007 | 2008 | 2009 | ||||||||
Production Volume(1): |
|||||||||||
Oil (MBbls)(2) |
3,981 | 4,091 | 3,402 | ||||||||
Natural gas (MMcf) |
18,895 | 23,050 | 24,748 | ||||||||
MBOE |
7,130 | 7,933 | 7,527 | ||||||||
Daily Average Production Volume: |
|||||||||||
Oil (Bbls/d) |
10,907 | 11,178 | 9,321 | ||||||||
Natural gas (Mcf/d) |
51,767 | 62,978 | 67,803 | ||||||||
BOE/d |
19,535 | 21,674 | 20,622 | ||||||||
Oil Price per Bbl Produced (in dollars): |
|||||||||||
Realized price |
$ | 64.06 | $ | 89.69 | $ | 51.10 | |||||
Realized commodity derivative loss and amortization of commodity derivative premiums |
(4.35 | ) | (20.71 | ) | (0.95 | ) | |||||
Net realized price |
$ | 59.71 | $ | 68.98 | $ | 50.15 | |||||
Natural Gas Price per Mcf Produced (in dollars): |
|||||||||||
Realized price |
$ | 6.61 | $ | 8.21 | $ | 3.84 | |||||
Realized commodity derivative gain (loss) and amortization of commodity derivative premiums |
0.23 | 0.08 | 2.58 | ||||||||
Net realized price |
$ | 6.84 | $ | 8.29 | $ | 6.42 | |||||
Expense per BOE: |
|||||||||||
Lease operating expenses(3) |
$ | 15.05 | $ | 16.86 | $ | 12.65 | |||||
Production and property taxes(3) |
$ | 1.69 | $ | 1.98 | $ | 1.35 | |||||
Transportation expenses |
$ | 0.85 | $ | 0.75 | $ | 0.65 | |||||
Depletion, depreciation and amortization |
$ | 13.86 | $ | 16.95 | $ | 11.46 | |||||
General and administrative expense, net(4) |
$ | 4.46 | $ | 5.43 | $ | 4.91 | |||||
Interest expense |
$ | 8.43 | $ | 6.81 | $ | 5.44 | |||||
- (1)
- The
South Ellwood field comprised more than 15% of our total proved reserves as of December 31, 2009. Production from the field was 1,013 MBbls and
674 MMcf in 2007, 825 MBbls and 447 MMcf in 2008 and 806 MBbls and 252 MMcf in 2009.
- (2)
- Amounts
shown are oil production volumes for offshore properties and sales volumes for onshore properties (differences between onshore production and sales
volumes are minimal). Revenue accruals for offshore properties are adjusted for actual sales volumes since offshore oil inventories can vary significantly from month to month based on the timing of
barge deliveries, oil in tank and pipeline inventories, and oil pipeline sales nominations.
- (3)
- Lease
operating expenses and property and production taxes are combined to comprise oil and natural gas production expense on the consolidated statements of
operations.
- (4)
- Net of amounts capitalized.
Drilling Activity
The following table sets forth information with respect to development and exploration wells we completed from January 1, 2007 through December 31, 2009. The number of gross wells is the total
18
number of wells we participated in, regardless of our ownership interest in the wells. Fluid injection wells for waterflood and other enhanced recovery projects are not included as gross or net wells.
| |
Development Wells Drilled |
||||||||||
|---|---|---|---|---|---|---|---|---|---|---|---|
| |
2007 | 2008 | 2009 | ||||||||
Productive |
|||||||||||
Gross |
45.0 | 24.0 | 24.0 | ||||||||
Net |
41.0 | 22.0 | 22.8 | ||||||||
Dry |
|||||||||||
Gross |
9.0 | 4.0 | 2.0 | ||||||||
Net |
6.8 | 3.8 | 1.8 | ||||||||
| |
Exploration Wells Drilled |
||||||||||
|---|---|---|---|---|---|---|---|---|---|---|---|
| |
2007 | 2008 | 2009 | ||||||||
Productive |
|||||||||||
Gross |
67.0 | 69.0 | 43.0 | ||||||||
Net |
60.6 | 59.1 | 39.7 | ||||||||
Dry |
|||||||||||
Gross |
15.0 | 19.0 | 10.0 | ||||||||
Net |
12.0 | 17.2 | 9.3 | ||||||||
The information above should not be considered indicative of future drilling performance, nor should it be assumed that there is any correlation between the number of productive wells drilled and the amount of oil and natural gas that may ultimately be recovered. Of the gross productive exploration wells drilled in 2009, 42 were drilled in the Sacramento Basin, none of which were allocated to the exploration component of our capital expenditure budget. See "—Exploration Activities."
Present Activities
See "Management's Discussion and Analysis of Financial Condition and Results of Operation—Overview—Capital Expenditures" for a discussion of our present development activities.
Oil and Natural Gas Wells
The following table details our working interests in producing wells as of December 31, 2009. A well with multiple completions in the same bore hole is considered one well. Wells are classified as oil or natural gas wells according to the predominant production stream, except that a well with multiple completions is considered an oil well if one or more is an oil completion.
| |
Gross Producing Wells |
Net Producing Wells |
Average Working Interest |
||||||||
|---|---|---|---|---|---|---|---|---|---|---|---|
Oil |
300.0 | 229.4 | 76.5 | % | |||||||
Natural gas |
571.0 | 462.8 | 81.0 | % | |||||||
Total(1) |
871.0 | 692.2 | 79.5 | % | |||||||
- (1)
- Amounts shown include 17 oil wells and 11 natural gas wells with multiple completions.
19
Acreage
The following table summarizes our estimated developed and undeveloped leasehold acreage as of December 31, 2009. We have excluded acreage in which our interest is limited to a royalty or overriding royalty interest.
| |
Developed | Undeveloped(1) | Total | |||||||||||||||||
|---|---|---|---|---|---|---|---|---|---|---|---|---|---|---|---|---|---|---|---|---|
Area
|
Gross | Net | Gross | Net | Gross | Net | ||||||||||||||
Southern California |
||||||||||||||||||||
South Ellwood |
7,682 | 7,682 | — | — | 7,682 | 7,682 | ||||||||||||||
Santa Clara Federal Unit |
36,000 | 27,360 | — | — | 36,000 | 27,360 | ||||||||||||||
Dos Cuadras |
5,400 | 1,350 | — | — | 5,400 | 1,350 | ||||||||||||||
West Montalvo (offshore portion) |
540 | 540 | 5,110 | 5,110 | 5,650 | 5,650 | ||||||||||||||
Paredon(2) |
— | — | 4,111 | 4,095 | 4,111 | 4,095 | ||||||||||||||
Onshore |
5,546 | 4,639 | 117,093 | 77,456 | 122,639 | 82,095 | ||||||||||||||
Total Southern California |
55,168 | 41,571 | 126,314 | 86,661 | 181,482 | 128,232 | ||||||||||||||
Sacramento Basin |
125,213 | 108,187 | 142,752 | 115,799 | 267,965 | 223,986 | ||||||||||||||
Texas |
26,232 | 18,963 | 17,052 | 372 | 43,284 | 19,335 | ||||||||||||||
Other |
— | — | 59,032 | 49,930 | 59,032 | 49,930 | ||||||||||||||
Total |
206,613 | 168,721 | 345,150 | 252,762 | 551,763 | 421,483 | ||||||||||||||
- (1)
- The
percentage of undeveloped acreage held under leases due to expire in 2010, 2011 and 2012 unless production commences is approximately 10%, 9% and 7%,
respectively.
- (2)
- Paredon is a non-producing prospect and there are no proved reserves associated with the property.
Operating Hazards and Insurance
The oil and natural gas business involves numerous operating risks, such as those described under "Risk Factors—Our business involves significant operating risks that could adversely affect our production and could be expensive to remedy. We do not have insurance to cover all the risks that we may face." In accordance with industry practice, we maintain insurance against some, but not all, potential risks and losses. For some risks, we may not obtain insurance if we believe the cost of available insurance is excessive relative to the risks presented. In addition, pollution and other environmental risks are generally not fully insurable. If a significant accident or similar event occurs and is not fully covered by insurance, it would adversely affect us.
20
Title to Properties
We believe that we have satisfactory title to all of our material assets. Title to our properties is subject to encumbrances in some cases, such as customary interests generally retained in connection with the acquisition of real property, customary royalty interests and contract terms and restrictions, liens under operating agreements, liens related to environmental liabilities associated with historical operations, liens for current taxes and other burdens, easements, restrictions and minor encumbrances customary in the oil and natural gas industry. However, we believe that none of these liens, restrictions, easements, burdens and encumbrances materially detract from the value of our properties or from our interest in those properties or materially interfere with our use of those properties, in each case in the operation of our business as currently conducted. We believe that we have obtained sufficient right-of-way grants and permits from public authorities and private parties for us to operate our current business in all material respects as described in this report. As is customary in the oil and natural gas industry, we typically make minimal investigation of title at the time we acquire undeveloped properties. We make title investigations and receive title opinions of local counsel only before we commence drilling operations.
Our credit facilities are secured by liens on substantially all of our oil and natural gas properties and other assets. See "Management's Discussion and Analysis of Financial Condition and Results of Operation—Liquidity and Capital Resources—Capital Resources and Requirements."
Marketing and Major Customers
Markets for oil and natural gas are volatile and are subject to wide fluctuations depending on numerous factors beyond our control, including seasonality, economic conditions, foreign imports, political conditions in other energy producing countries, OPEC market actions, and domestic government regulations and policies. All of our production is sold to competing buyers, including large oil refining companies and independent marketers. In the year ended December 31, 2009, approximately 83% of our revenues were generated from sales to four purchasers: ConocoPhillips (41%), Enserco Energy (27%), Tesoro Refining and Marketing Company (10%), and Gulfmark Energy Inc. (5%). Substantially all of our production is sold pursuant to agreements with pricing based on prevailing commodity prices, subject to adjustment for regional differentials and similar factors.
Competition
The oil and natural gas business is highly competitive in the search for and acquisition of additional reserves and in the sale of oil and natural gas. Our competitors principally consist of major and intermediate sized integrated oil and natural gas companies, independent oil and natural gas companies and individual producers and operators. Our competitors include Occidental Petroleum Corporation, Plains Exploration & Production Company, Berry Petroleum Company and Breitburn Energy Partners L.P. In particular, we compete for property acquisitions and for the equipment and labor required to operate and develop our properties. These competitors may be able to pay more for properties and may be able to define, evaluate, bid for and purchase a greater number of properties than we can. Ultimately, our future success will depend on our ability to develop or acquire additional reserves at costs that allow us to remain competitive.
Offices
We currently lease approximately 52,800 net square feet of office space in Denver, Colorado, where our principal office is located. The lease for the Denver office expires in 2014. We lease an additional 30,000 net square feet of office space in Carpinteria, California from 6267 Carpinteria Avenue, LLC. The lease for the Carpinteria office will expire in 2019. 6267 Carpinteria Avenue, LLC was a wholly owned subsidiary of ours prior to March 2006, when we paid a dividend consisting of
21
100% of the membership interests in 6267 Carpinteria Avenue, LLC to our then-sole stockholder. The lease has remained in effect following the payment of the dividend. We also lease approximately 28,500 square feet of office space in Houston, Texas, where we maintain a regional office. The lease will expire in July 2010. We believe that our office facilities are adequate for our current needs and that additional office space can be obtained if necessary.
Employees
As of December 31, 2009, we had approximately 382 full-time employees, none of whom were party to collective bargaining arrangements.
Regulatory Environment
Our oil and natural gas exploration, production and transportation activities are subject to extensive regulation at the federal, state and local levels. These regulations relate to, among other things, environmental and land-use matters, conservation, safety, pipeline use, drilling and spacing of wells, well stimulation, transportation, and forced pooling and protection of correlative rights among interest owners. The following is a summary of some key regulations that affect our operations.
Environmental and Land Use Regulation
A wide variety of environmental and land use regulations apply to companies engaged in the production and sale of oil and natural gas. These regulations have been changed frequently in the past and, in general, these changes have imposed more stringent requirements that increase operating costs and/or require capital expenditures to remain in compliance. Failure to comply with these requirements can result in civil and/or criminal penalties and liability for non-compliance, clean-up costs and other environmental damages. It also is possible that unanticipated developments or changes in the law could require us to make environmental expenditures significantly greater than those we currently expect.
California Environmental Quality Act ("CEQA"). CEQA is California legislation that requires consideration of the environmental impacts of proposed actions that may have a significant effect on the environment. CEQA requires the responsible governmental agency to prepare an environmental impact report that is made available for public comment. The responsible agency also is required to consider mitigation measures. The party requesting agency action bears the expense of the report.
We currently are in the CEQA process in connection with, among other things, our proposed lease extension project at the South Ellwood field and Ellwood Pipeline, Inc.'s proposed common carrier pipeline project. See "Description of Properties—Southern California—South Ellwood field."
We may be required to undergo the CEQA process for other lease renewals and other proposed actions by state and local governmental authorities that meet specified criteria. At a minimum, the CEQA process delays and adds expense to the process of obtaining new leases, permits and lease renewals.
Discharges to Waters. The Federal Water Pollution Control Act of 1972, as amended (the "Clean Water Act"), and comparable state statutes impose restrictions and controls on the discharge of produced waters and other oil and natural gas wastes into regulated waters and wetlands. These controls generally have become more stringent over time, and it is possible that additional restrictions will be imposed in the future. These laws prohibit the discharge of produced water and sand, drilling fluids, drill cuttings and other substances related to the oil and natural gas industry into onshore, coastal and offshore waters without appropriate permits. Violation of the Clean Water Act and similar state regulatory programs can result in civil, criminal and administrative penalties for unauthorized discharges of oil, hazardous substances and other pollutants. They also can impose substantial liability for the costs of removal or remediation associated with discharges of oil or hazardous substances.
22
The Clean Water Act also regulates stormwater discharges from industrial properties and construction activities, and requires separate permits and implementation of a Stormwater Pollution Prevention Plan ("SWPPP") establishing best management practices, training, and periodic monitoring of covered activities. Certain operations also are required to develop and implement Spill Prevention, Control, and Countermeasure ("SPCC") plans or facility response plans to address potential oil spills. Certain exemptions from some Clean Water Act requirements have been created or broadened pursuant to the Energy Policy Act of 2005.
Oil Spill Regulation. The Oil Pollution Act of 1990, as amended ("OPA"), amends and augments the Clean Water Act as it relates to oil spills. It imposes potentially unlimited liability on responsible parties without regard to fault for the costs of cleanup and other damages resulting from an oil spill in federal waters. Responsible parties include (i) owners and operators of onshore facilities and pipelines and (ii) lessees or permittees of offshore facilities. In addition, OPA requires parties responsible for offshore facilities to provide financial assurance in the amount of $35.0 million, which can be increased to $150.0 million in some circumstances, to cover potential OPA liabilities.
Regulations imposed by the Minerals Management Service ("MMS") also require oil-spill response plans and oil-spill financial assurance from offshore oil and natural gas operations, whether operating in state or federal offshore waters. These regulations were designed to be consistent with OPA and other similar requirements. Under MMS regulations, operators must join a cooperative that makes oil-spill response equipment available to its members. The California Department of Fish and Game's Office of Oil Spill Prevention and Response ("OSPR") has adopted oil-spill prevention regulations that overlap with federal regulations. We have complied with these OPA, MMS and OSPR requirements by adopting an offshore oil spill contingency plan and becoming a member of Clean Seas, LLC, a cooperative entity operated with other offshore operators to prevent and respond to oil spills in the offshore region in which we operate.
Air Emissions. Our operations are subject to local, state and federal regulations governing emissions of air pollutants. Local air-quality districts are responsible for much of the regulation of air-pollutant sources in California. California requires new and modified stationary sources of air pollutants to obtain permits prior to commencing construction. Major sources of air pollutants are subject to more stringent, federally-based permitting requirements. Because of the severity of ozone levels in portions of California, the state has the most severe restrictions on emissions of volatile organic compounds ("VOCs") and nitrogen oxides ("NOX") of any state. Producing wells, natural gas plants and electric generating facilities all generate VOCs and NOX. Some of our producing wells are in counties that are designated as non-attainment for ozone and, therefore, potentially are subject to restrictive emission limitations and permitting requirements. California also operates a stringent program to control hazardous (toxic) air pollutants, and this program could require the installation of additional controls. Administrative enforcement actions for failure to comply strictly with air pollution regulations or permits generally are resolved by payment of monetary fines and correction of any identified deficiencies. Alternatively, regulatory agencies could require us to forego construction, modification or operation of certain air-emission sources. Air emissions from oil and natural gas operations also are regulated by oil and natural gas permitting agencies, including the MMS, the State Lands Commission and other local agencies.
Waste Disposal. We currently own or lease a number of properties that have been used for production of oil and natural gas for many years. Although we believe the prior owners and/or operators of those properties generally utilized operating and disposal practices that were standard in the industry at the time, hydrocarbons or other wastes may have been disposed of or released on or under the properties we currently own or lease. State and federal laws applicable to oil and natural gas wastes have become more stringent. Under new laws, we could be required to remediate property, including groundwater, containing or impacted by previously disposed wastes (including wastes disposed
23
of or released by prior owners or operators) or to perform remedial well-plugging operations to prevent future, or mitigate existing, contamination.
We may generate wastes, including "solid" wastes and "hazardous" wastes that are subject to the federal Resource Conservation and Recovery Act, as amended ("RCRA") and comparable state statutes, although certain oil and natural gas exploration and production wastes currently are exempt from regulation as hazardous wastes under RCRA. The federal Environmental Protection Agency (the "EPA") has limited the disposal options for certain wastes that are designated as hazardous wastes under RCRA. Furthermore, it is possible that certain wastes generated by our oil and natural gas operations that currently are exempt from regulation as hazardous wastes may in the future be designated as hazardous wastes, and therefore be subject to more rigorous and costly management, disposal and clean-up requirements. State and federal oil and natural gas regulations also provide guidelines for the storage and disposal of solid wastes resulting from the production of oil and natural gas, both onshore and offshore.
Superfund. Under the Comprehensive Environmental Response, Compensation, and Liability Act of 1980, as amended, also known as CERCLA or the Superfund law, and similar state laws, responsibility for the entire cost of cleanup of a contaminated site, as well as natural resource damages, can be imposed upon current or former site owners or operators, or upon any party who released one or more designated "hazardous substances" at the site, regardless of the lawfulness of the original activities that led to the contamination. CERCLA also authorizes the EPA and, in some cases, third parties to take actions in response to threats to public health or the environment and to seek to recover from the potentially responsible parties the costs of such action. Although CERCLA generally exempts petroleum from the definition of hazardous substances, in the course of our operations we may have generated and may generate wastes that fall within CERCLA's definition of hazardous substances. We may also be an owner or operator of facilities at which hazardous substances have been released by previous owners or operators. We may be responsible under CERCLA for all or part of the costs of cleaning up facilities at which such substances have been released and for natural resource damages. We have not, to our knowledge, been identified as a potentially responsible party under CERCLA, nor are we aware of any prior owners or operators of our properties that have been so identified with respect to their ownership or operation of those properties.
Abandonment, Decommissioning and Remediation Requirements. Federal, state and local regulations provide detailed requirements for the abandonment of wells, closure or decommissioning of production and transportation facilities and the environmental restoration of operations sites. MMS regulations, coupled with applicable lease and permit requirements and each property's specific development and production plan, prescribe the requirements for decommissioning our federally leased offshore facilities. The California State Lands Commission ("CSLC"), and the California Department of Conservation, Division of Oil, Gas and Geothermal Resources ("DOGGR") are the principal state agencies responsible for regulating the drilling, operation, maintenance and abandonment of all oil and natural gas wells in the state, whether onshore or offshore. In Texas, the Railroad Commission of Texas regulates these activities. MMS regulations require federal leaseholders to post performance bonds. See "—Potentially Material Costs Associated with Environmental Regulation of Our Oil and Natural Gas Operations—Plugging and Abandonment Costs" for a discussion of our principal obligations relating to the abandonment and decommissioning of our facilities.
California Coastal Act. The California Coastal Act regulates the conservation and development of California's coastal resources. The California Coastal Commission (the "Coastal Commission") works with local governments to make permit decisions for new developments in certain coastal areas and reviews local coastal programs, such as land-use restrictions. The Coastal Commission also works with the OSPR to protect against and respond to coastal oil spills. The Coastal Commission has direct regulatory authority over offshore oil and natural gas development within the state's three mile
24
jurisdiction and has authority, through the Federal Coastal Zone Management Act, over federally permitted projects that affect the state's coastal zone resources. We conduct activities that may be subject to the California Coastal Act and the jurisdiction of the Coastal Commission.
Marine Protected Areas ("MPAs"). In 2000, President Clinton issued Executive Order 13158, which directs federal agencies to strengthen management, protection and conservation of existing MPAs and to establish new MPAs. The executive order requires federal agencies to avoid causing harm to MPAs through federally conducted, approved, or funded activities. The order also directs the EPA to propose new regulations under its Clean Water Act authority to ensure protection of the marine environment. This order and related Clean Water Act regulations have the potential to adversely affect our operations by restricting areas in which we may engage in future exploration, development, and production operations and by causing us to incur increased expenses.
Naturally Occurring Radioactive Materials ("NORM"). Our operations my generate wastes containing NORM. Certain oil and gas exploration and production activities can enhance the radioactivity of NORM. NORM primarily is regulated by state radiation control regulations. The Occupational Safety and Health Administration also has promulgated regulations addressing the handling and management of NORM. These regulations impose certain requirements regarding worker protection, the treatment, storage, and disposal of NORM waste, the management of NORM containers, tanks, and waste piles, and certain restrictions on the uses of land with NORM contamination.
Other Environmental Regulation. Our leases in federal waters on the Outer Continental Shelf are administered by the MMS and require compliance with detailed MMS regulations and orders. Under certain circumstances, the MMS may require any of our operations on federal leases to be suspended or terminated. Any such suspension or termination could materially and adversely affect our financial condition and operations.
Our offshore leases in state waters or "tidelands" (within three miles of the coastline) are administered by the state of California and require compliance with certain regulations of the CLSC and DOGGR. The CSLC serves as the lessor of our state offshore leases and is charged with overseeing leasing, exploration, development and environmental protection of the state tidelands.
Commencing with the Cunningham Shell Act of 1955, California has enacted several pieces of legislation that withhold state tidelands from oil and natural gas leasing. The Cunningham Shell Act protected an area of tidelands offshore Santa Barbara County that stretches west from Summerland Bay to Coal Oil Point, and included waters offshore the unincorporated area of Montecito, the City of Santa Barbara and the University of California at Santa Barbara. It also protected the state tidelands around the islands of Anacapa, Santa Cruz, Santa Rosa and San Miguel. In 1994, California enacted the California Sanctuary Act which, with three exceptions, prohibits leasing of any state tidelands for oil and natural gas development. Oil and natural gas leases in effect as of January 1, 1995 are unaffected by this legislation until such leases revert back to the state, at which time they will become part of the California Coastal Sanctuary. This legislation does not restrict our existing state offshore leases or our current or planned future operations.
Recent and future environmental regulations, including additional federal and state restrictions on greenhouse gas ("GHG") emissions that have been or may be passed in response to climate change concerns, may increase our operating costs and also reduce the demand for the oil and natural gas we produce. The EPA has issued a notice of finding and determination that emissions of carbon dioxide, methane and other GHGs present an endangerment to human health and the environment, which allows EPA to begin regulating emissions of GHGs under existing provisions of the federal Clean Air Act. The EPA has begun to implement GHG-related reporting and permitting rules. Similarly, the U.S. Congress is considering "cap and trade" legislation that would establish an economy-wide cap on
25
emissions of GHGs in the United States and would require most sources of GHG emissions to obtain GHG emission "allowances" corresponding to their annual emissions of GHGs. On September 27, 2006, California's governor signed into law Assembly Bill (AB) 32, known as the "California Global Warming Solutions Act of 2006," which establishes a statewide cap on GHGs that will reduce the state's GHG emissions to 1990 levels by 2020 and establishes a "cap and trade" program. The California Air Resources Board has been designated as the lead agency to establish and adopt regulations to implement AB 32 by January 1, 2012. We will continue to monitor the establishment of these regulations through industry trade groups and other organizations in which we are a member. Similar regulations may be adopted by other states in which we operate or by the federal government.
Other environmental protection statutes that may impact our operations included the Marine Mammal Protection Act, the Marine Life Protection Act, the Marine Protection, Research, and Sanctuaries Act of 1972, the Endangered Species Act, the Fish and Wildlife Coordination Act, the Fishery Conservation and Management Act, the Migratory Bird Treaty Act and the National Historic Preservation Act.
Potentially Material Costs Associated with Environmental Regulation of Our Oil and Natural Gas Operations
Significant potential costs relating to environmental and land-use regulations associated with our existing properties and operations include those relating to (i) plugging and abandonment of facilities, (ii) clean-up costs and damages due to spills or other releases and (iii) penalties imposed for spills, releases or non-compliance with applicable laws and regulations. As is customary in the oil and natural gas industry, we typically have contractually assumed, and may assume in the future, obligations relating to plugging and abandonment, clean-up and other environmental costs in connection with our acquisition of operating interests in fields, and these costs can be significant.
Plugging and Abandonment Costs. Our operations, and in particular our offshore platforms and related facilities, are subject to stringent abandonment and closure requirements imposed by the MMS and the state of California. With respect to the Santa Clara Federal Unit, Chevron retained most of the abandonment obligations relating to the platforms and facilities when it sold the fields to us in 1999. We are responsible for abandonment costs relating to the wells and to any expansions or modifications we made following our acquisition of the fields. We also agreed to assume from Chevron all abandonment obligations associated with its 25% interest in the infrastructure (but not the wells) in the Dos Cuadras field. We agreed to assume all of the abandonment costs relating to the operations, including platform Holly, in the South Ellwood field when we purchased it from Mobil Oil Corporation in 1997.
As described in note 6 to our financial statements, we have estimated the present value of our aggregate asset retirement obligations to be $93.0 million as of December 31, 2009. This figure reflects the expected future costs associated with site reclamation, facilities dismantlement and plugging and abandonment of wells. The discount rates used to calculate the present value varied depending on the estimated timing of the obligation, but typically ranged between 4% and 9%. Actual costs may differ from our estimates. Our financial statements do not reflect any liabilities relating to other environmental obligations.
Under a variety of applicable laws and regulations, including CERCLA, RCRA and MMS regulations, we could in some circumstances be held responsible for abandonment and clean-up costs relating to our operations, both onshore and offshore, notwithstanding contractual arrangements that assign responsibility for those costs to other parties.
26
Clean-up Costs. We currently have two onshore facilities with known environmental contamination. Our onshore facility at the South Ellwood field is known to have hydrocarbon contamination. We currently are required to provide quarterly monitoring reports to the county. Because oil occurs naturally in the area, regulators have not yet determined the applicable cleanup requirements for this facility. We expect that we will be permitted to defer remedial actions at the facility until we cease operations there, and our present intention is to continue using it for the foreseeable future. We currently estimate that the cost of a clean-up of the facility will be between $6.0 million and $11.0 million. This cost is included in the asset retirement obligations shown in our financial statements. For the purpose of calculating the asset retirement obligation, we estimated that the facility will be abandoned in 24 years (as of 2009). The onshore oil and natural gas plant associated with the Santa Clara Federal Unit is also known to have hydrocarbon contamination. Chevron is contractually obligated to remediate the contamination that was present at the time we purchased the property upon the closure of that facility. We will be responsible for the clean-up of any additional contamination. To our knowledge, no such additional contamination has occurred. Accordingly, we currently do not expect to incur any remediation costs in connection with this facility.
Penalties for Non-Compliance. We believe that our operations are in material compliance with all applicable oil and natural gas, safety, environmental and land-use laws and regulations. However, from time to time we receive notices of noncompliance with Clean Air Act and other requirements from relevant regulatory agencies. We received a number of minor notices of violation ("NOVs") from regulatory agencies in 2009. We do not expect to incur significant penalties with respect to any outstanding NOV. See "Legal Proceedings."
Other Regulation
The pipelines we use to gather and transport our oil and natural gas are subject to regulation by the U.S. Department of Transportation ("DOT") under the Hazardous Liquids Pipeline Safety Act of 1979, as amended ("HLPSA"), and the Pipeline Safety Act of 1992, which relate to the design, installation, testing, construction, operation, replacement and management of pipeline facilities. Under the Pipeline Safety Act, the Research and Special Programs Administration of DOT is authorized to require certain pipeline modifications as well as operational and maintenance changes. We believe our pipelines are in substantial compliance with HLPSA and the Pipeline Safety Act. Nonetheless, significant expenses could be incurred if new or additional safety requirements are implemented.
The rates, terms and conditions applicable to the interstate transportation of natural gas by pipelines are regulated by the Federal Energy Regulatory Commission ("FERC") under the Natural Gas Act and the Natural Gas Policy Act. Since 1985, FERC has implemented regulations intended to increase competition within the natural gas industry by making natural gas transportation more accessible to natural gas buyers and sellers on an open-access, non-discriminatory basis.
The rates, terms, and conditions applicable to the interstate transportation of oil by pipelines also are regulated by FERC under the Interstate Commerce Act. FERC has implemented a simplified and generally applicable ratemaking methodology for interstate oil pipelines to fulfill the requirements of Title VIII of the Energy Policy Act of 1992, comprised of an indexing system to establish ceilings on interstate oil pipeline rates. FERC has announced several important transportation related policy statements and rule changes, including a statement of policy and final rule issued February 25, 2000 concerning alternatives to its traditional cost-of-service rate-making methodology to establish the rates interstate pipelines may charge for their services. The final rule revises FERC's pricing policy and current regulatory framework to improve the efficiency of the market and further enhance competition in natural gas markets. With respect to transportation of natural gas on the Outer Continental Shelf, FERC requires, as a part of its regulation under the Outer Continental Shelf Lands Act, that all pipelines provide open and non-discriminatory access to both owner and non-owner shippers.
27
The safety of our operations primarily is regulated by the MMS, the CSLC, the Coast Guard and the Occupational Safety and Health Administration. We believe our facilities and operations are in substantial compliance with the applicable requirements of those agencies. In the event different or additional safety measures are required in the future, we could incur significant expenses to meet those requirements.
Executive Officers of the Registrant
The following table sets forth certain information with respect to our executive officers as of December 31, 2009.
Name
|
Age | Position | |||
|---|---|---|---|---|---|
Timothy Marquez |
51 | Chairman and Chief Executive Officer | |||
William Schneider |
48 | President | |||
Timothy A. Ficker |
42 | Chief Financial Officer | |||
Terry L. Anderson |
62 | General Counsel and Secretary | |||
Timothy Marquez co-founded Venoco in September 1992 and served as our CEO from our formation until June 2002. He founded Marquez Energy in 2002 and served as its CEO until we acquired it in March 2005. Mr. Marquez returned as our Chairman, CEO and President in June 2004. Mr. Marquez has a B.S. in petroleum engineering from the Colorado School of Mines. Mr. Marquez began his career with Unocal Corporation, where he worked for 13 years managing assets offshore California and in the North Sea and performing other managerial and engineering functions.
William Schneider became our President in January 2005. Prior to joining us, Mr. Schneider was a managing director at BMO Capital Markets (formerly known as Harris Nesbitt), an investment bank, where he focused on mergers and acquisitions in the energy industry. He joined BMO Capital Markets in February 2001. From January 1998 to January 2001, he worked in the Energy Investment Banking division of Donaldson, Lufkin & Jenrette. Mr. Schneider's experience also includes service in Smith Barney's Energy Investment Banking division. Before entering investment banking, Mr. Schneider held a variety of engineering and corporate positions at Unocal for over 12 years. Mr. Schneider holds an M.B.A. in Finance from U.C.L.A. and a B.S. in petroleum engineering from the Colorado School of Mines.
Timothy A. Ficker became our CFO in April 2007. Prior to joining us, Mr. Ficker was Vice President, CFO and Secretary of Infinity Energy Resources, Inc., a NASDAQ-listed energy company, having been appointed to those positions in May 2005. From October 2003 through April 2005, Mr. Ficker served as an audit partner in KPMG LLP's Denver office, and from June 2002 through September 2003, he served as an audit director for KPMG LLP. From September 1989 through June 2002, he worked for Arthur Andersen LLP, including as an audit partner after September 2001, where he served clients primarily in the energy industry. Mr. Ficker is a certified public accountant and received a B.B.A. in accounting from Texas A&M University.
Terry L. Anderson is our General Counsel and Secretary. Mr. Anderson joined us in March 1998 and served as General Counsel until June 2002. From July 2002 to August 2004, Mr. Anderson was in private practice in Santa Barbara, California. He returned in his current capacities in August 2004. Mr. Anderson holds a B.S. in petroleum engineering and a J.D. from the University of Southern California. Mr. Anderson was Vice President and General Counsel of Monterey Resources, Inc., a NYSE-listed company, from August 1996 to January 1998. Prior to that, he was chief transactional attorney for Santa Fe Energy Resources in Houston, Texas. Mr. Anderson is licensed to practice law in Texas and California.
28
Available Information
We maintain a link to investor relations information on our website, www.venocoinc.com, where we make available, free of charge, our filings with the SEC, including our annual reports on Form 10-K, quarterly reports on Form 10-Q, current reports on Form 8-K, and all amendments to those reports filed or furnished pursuant to Section 13(a) or 15(d) of the Securities Exchange Act of 1934, or Exchange Act, as soon as reasonably practicable after we electronically file such material with, or furnish it to, the SEC. We also make available on our website copies of the charters of the audit, compensation and corporate governance/nominating committees of our board of directors, our code of business conduct and ethics and our corporate governance guidelines. Stockholders may request a printed copy of these governance materials or any exhibit to this report by writing to the Corporate Secretary, Venoco, Inc., 6267 Carpinteria Avenue, Carpinteria, CA 93013-1423. You may also read and copy any materials we file with the SEC at the SEC's Public Reference Room, which is located at 100 F Street, NE, Room 1580, Washington, D.C. 20549. Information regarding the Public Reference Room may be obtained by calling the SEC at 1-800-SEC-0330. In addition, the SEC maintains a website at www.sec.gov that contains the documents we file with the SEC. Our website and the information contained on or connected to our website is not incorporated by reference herein and our web address is included as an inactive textual reference only.
29
Oil and natural gas prices are volatile and change for reasons that are beyond our control. Decreases in the price we receive for our oil and natural gas production adversely affect our business, financial condition, results of operations and liquidity.
Declines in the prices we receive for our oil and natural gas production adversely affect many aspects of our business, including our financial condition, revenues, results of operations, liquidity, rate of growth and the carrying value of our oil and natural gas properties, all of which depend primarily or in part upon those prices. For example, due in significant part to lower commodities prices, our revenues from oil and natural gas sales and cash flow from operations declined 52% and 44%, respectively, in 2009 compared to 2008. Declines in the prices we receive for our oil and natural gas also adversely affect our ability to finance capital expenditures, make acquisitions, raise capital and satisfy our financial obligations. In addition, declines in prices reduce the amount of oil and natural gas that we can produce economically and, as a result, adversely affect our quantities of proved reserves. Among other things, a reduction in our reserves can limit the capital available to us, as the maximum amount of available borrowing under the revolving credit facility is, and the availability of other sources of capital likely will be, based to a significant degree on the estimated quantities of those reserves.
Oil and natural gas are commodities and their prices are subject to wide fluctuations in response to relatively minor changes in supply and demand. Prices have historically been volatile and are likely to continue to be volatile in the future. The prices of oil and natural gas are affected by a variety of factors that are beyond our control, including changes in global supply and demand for oil and natural gas, domestic and foreign governmental regulations and taxes, the level of global oil and natural gas exploration activity and inventories, the price, availability and consumer acceptance of alternative fuel sources, the availability of refining capacity, technological advances affecting energy consumption, weather conditions, speculative activity, financial and commercial market uncertainty and worldwide economic conditions.
In addition to factors affecting the price of oil and natural gas generally, the prices we receive for our oil and natural gas production is affected by factors specific to us and to the local markets where the production occurs. Pricing can be influenced by, among other things, local or regional supply and demand factors (such as refinery or pipeline capacity issues, trade restrictions and governmental regulations) and the terms of our sales contracts. For example, the termination in 2006 of the sales arrangement pursuant to which we historically sold oil from the South Ellwood field required us to enter into a new contract with a new purchaser which priced our oil at a significantly greater discount to the NYMEX price.
The prices we receive for our production are also affected by the specific characteristics of the production relative to production sold at benchmark prices. For example, our California oil typically has a lower gravity, and a portion has higher sulfur content, than oil sold at the NYMEX price. Therefore, because our oil requires more complex refining equipment to convert it into high value products, it sells at a discount to the NYMEX price. This discount, or differential, varies over time and can be affected by factors that do not have the same impact on the price of premium grade light oil. We cannot predict how the differential applicable to our production will change in the future, and it is possible that it will increase. The difficulty involved in predicting the differential also makes it more difficult for us to effectively hedge our production. Many of our hedging arrangements are based on benchmark prices, and therefore do not fully protect us from adverse changes in the differential applicable to our production. We recently changed the terms of sale of our South Ellwood field oil production from pricing based on a fixed differential to NYMEX to pricing with a variable differential, a change that increases the risk to us of unfavorable changes in differentials. In addition, the oil we produce from our Texas properties typically sells at a smaller discount to NYMEX than our California oil. Because we sold our largest producing property in Texas in February 2009 and may sell some or all
30
of our remaining Texas properties in the near future, the risks associated with the differential are currently greater, relative to our overall production, than they have been in some prior years.
Our planned operations will require additional capital that may not be available. If we are unable to complete a capital raising transaction in 2010 on acceptable terms, we expect to reduce our capital expenditures for the year, which would likely result in production that is less than our forecast.
Our business is capital intensive, and requires substantial expenditures to maintain currently producing wells, to make the acquisitions and/or conduct the exploration, exploitation and development activities necessary to replace our reserves, to pay expenses and to satisfy our other obligations. In recent years, we have chosen to pursue projects that required capital expenditures in excess of cash flow from operations. That fact has made us dependent on external financing to a greater degree than many of our competitors. Our substantial existing indebtedness increases the risk that external financing will not be available to us when needed.
We expect to fund our 2010 capital expenditure budget primarily with cash flow from operations, supplemented with proceeds from capital raising transactions that may include asset sales, joint venture transactions and/or an issuance of equity. In particular, we will seek to finance part of the planned capital expenditures relating to our Monterey shale development project through a joint venture, and will seek to fund additional expenditures and/or reduce indebtedness through the sale of some or all of our Texas properties. If we are unable to complete one or more of those transactions on terms acceptable to us, we would currently expect to reduce our capital expenditure budget. A reduction in our capital spending would likely result in production being lower than we currently anticipate, and may result in reduced revenues, cash flow from operations and income. Moreover, there would be costs and risks associated with any completed capital raising transaction. For example, an issuance of equity securities would dilute the interests of our existing stockholders, and new investors could demand rights that are senior to those of existing stockholders.
It may be difficult or impossible for us to finance our operations through the incurrence of additional indebtedness.
We have relied on borrowings under our revolving credit facility to finance our operations in some recent periods. Lenders may not fund borrowings under the facility when we request them to do so. A previous lender under the facility, Lehman Commercial Paper, Inc. ("LCP"), ceased funding amounts under the facility as a result of the bankruptcy of its parent company, Lehman Brothers Holdings Inc. Current lenders under the facility may face similar issues. Our ability to borrow under the facility may also be limited if we are unable, or run a significant risk of becoming unable, to comply with the financial covenants that we are required to satisfy under the facility. It may be difficult to maintain compliance with the maximum debt to EBITDA (as defined in the agreement) ratio in the future if we borrow a significant portion of the available capacity under the facility and/or our EBITDA is adversely affected by operational problems, counterparties' failure to perform under hedge agreements or other factors. In addition, the borrowing base under the facility is subject to redetermination periodically and from time to time in the lenders' discretion. Due in significant part to lower commodity prices, the borrowing base was reduced in early 2009 from $200 million to $125 million. In addition to reducing the capital available to finance our operations, a reduction in the borrowing base could cause us to be required to repay amounts outstanding under the facility in excess of the reduced borrowing base, and the funds necessary to do so may not be available at that time. A sale of some or all of our Texas assets may result in a reduction in the borrowing base.
Sources of external debt financing other than revolving credit facility borrowings may not be available when needed on acceptable terms or at all, especially during periods in which financial market conditions are unfavorable. Our ability to incur additional indebtedness is limited under the terms of our revolving credit facility, our second lien term loan facility and the indenture governing our 11.50%
31
senior notes, which we refer to collectively as our debt agreements. In addition, if we finance our operations through borrowings under our credit facility or other additional indebtedness, the risks that we now face relating to our current debt level would intensify, and it may be more difficult to satisfy our existing financial obligations.
Our debt level and the covenants in the agreements governing our debt could negatively impact our financial condition, results of operations, business prospects and ability to finance our operations.
We have a substantial amount of indebtedness. As of February 22, 2010, we had total indebtedness under our debt agreements of approximately $695.1 million, and this indebtedness bore interest at a weighted average rate of 8.23%. Our interest expense in 2009 was $41 million. Our ability to make required principal and interest payments on our indebtedness and comply with the other terms of our debt agreements will depend to a significant extent on our financial and operating performance, which is subject to prevailing economic conditions, commodity prices and a variety of other factors. The breach of any of the terms of our debt agreements could result in a default under the applicable agreement that would permit the affected lenders or noteholders, as the case may be, to declare all amounts outstanding thereunder to be due and payable, together with accrued and unpaid interest, and to foreclose on substantially all of our assets. A foreclosure could result in a complete loss of our stockholders' investment in our company. It may not be possible to obtain a waiver from lenders or noteholders in the event of a breach of a debt agreement.
Our level of indebtedness, and the covenants contained in our debt agreements, could have important consequences for our operations, including by:
- •
- making it more difficult for us to satisfy our obligations under our debt agreements and increasing the risk that we may
default on our debt obligations;
- •
- making it more difficult for us to conduct the exploration, exploitation and development activities necessary to extend
our leases beyond their respective primary terms;
- •
- requiring us to dedicate a substantial portion of our cash flow from operations and certain types of transactions to
required payments on debt, thereby reducing the availability of cash flow for working capital, capital expenditures, acquisition opportunities and other general business activities;
- •
- limiting our ability to obtain additional financing in the future for working capital, capital expenditures, acquisitions
and other activities;
- •
- limiting management's discretion in operating our business;
- •
- limiting our flexibility in planning for, or reacting to, changes in commodity prices, our business or the industry in
which we operate;
- •
- impairing our ability to withstand successfully a downturn in commodity prices, our business or the economy generally;
- •
- placing us at a competitive disadvantage against less leveraged competitors; and
- •
- making us vulnerable to increases in interest rates.
If our cash flow and other capital resources are insufficient to fund our obligations under our debt agreements or we are otherwise unable to comply with those agreements, we could attempt to refinance or repay the debt with the proceeds from additional borrowings, equity offerings or sales of assets. The proceeds of future borrowings, equity financings and asset sales may not be sufficient to refinance or repay the debt, and we may be unable to complete such transactions in a timely manner or at all. In addition, our credit agreements contain provisions that would limit our flexibility in responding to a shortfall in our expected liquidity by selling assets or taking certain other actions. For
32
example, we could be required to use some or all of the proceeds of an asset sale to reduce amounts outstanding under one or both of our credit facilities in some circumstances. See "Management's Discussion and Analysis of Financial Condition and Results of Operation—Liquidity and Capital Resources—Capital Resources and Requirements."
We also face a refinancing risk. Significant amounts of our indebtedness do not require current payments of principal, but are payable in full on maturity. Cash flow from operations is unlikely to be sufficient to repay the outstanding balance on the second lien term loan facility when it matures in 2014. Global capital markets experienced a severe contraction in the availability of debt financing in the recent past, and similar events may occur in the future. The ability to pay principal and interest on our debt, and to refinance our debt upon maturity, will depend not only upon our financial and operating performance, but on the state of the global economy, credit markets and commodity prices during the period through the time of refinancing, many of which are factors over which we have no control. There can be no assurances that we will be able to make principal and interest payments on our indebtedness and to refinance our indebtedness at maturity. In addition, any refinancing that requires the use of cash could require us to curtail planned capital expenditures.
Our estimated reserves are based on many assumptions that may turn out to be inaccurate. Any material inaccuracies in these reserve estimates or the relevant underlying assumptions will materially affect the quantity and present value of our reserves.
The reserve data included in this report represent estimates only. Estimating quantities of proved oil and natural gas reserves is a complex process. It requires interpretations of available technical data and various estimates, including estimates based upon assumptions relating to economic factors, such as future commodity prices, production costs, severance and excise taxes and availability of capital, estimates of required capital expenditures and workover and remedial costs, and the assumed effect of governmental regulation. The assumptions underlying our estimates of our proved reserves could prove to be inaccurate, and any significant inaccuracy could materially affect, among other things, future estimates of our reserves, the economically recoverable quantities of oil and natural gas attributable to our properties, the classifications of reserves based on risk of recovery and estimates of our future net cash flows.
At December 31, 2009, 49% of our estimated proved reserves were proved undeveloped and 7% were proved developed non-producing. Estimation of proved undeveloped reserves and proved developed non-producing reserves is almost always based on analogy to existing wells as contrasted with the performance data used to estimate producing reserves. Recovery of proved undeveloped reserves requires significant capital expenditures and successful drilling operations. Revenues from estimated proved developed non-producing reserves will not be realized until some time in the future, if at all.
You should not assume that the present values referred to in this report represent the current market value of our estimated oil and natural gas reserves. The timing and success of the production and the expenses related to the development of oil and natural gas properties, each of which is subject to numerous risks and uncertainties, will affect the timing and amount of actual future net cash flows from our proved reserves and their present value. In addition, our PV-10 estimates are based on assumed future prices and costs. Actual future prices and costs may be materially higher or lower than the assumed prices and costs. Further, the effect of derivative instruments is not reflected in these assumed prices. Also, the use of a 10% discount factor to calculate PV-10 may not necessarily represent the most appropriate discount factor given actual interest rates and risks to which our business or the oil and natural gas industry in general are subject.
33
Oil and natural gas exploration, exploitation and development activities may not be successful and could result in a complete loss of a significant investment.
Exploration, exploitation and development activities are subject to many risks. For example, new wells we drill may not be productive and we may not recover all or any portion of our investment in such wells. Similarly, previously producing wells that are returned to production after a period of being shut in may not produce at levels that justify the expenditures made to bring the wells back on line. Drilling for oil and natural gas often involves unprofitable efforts, not only from dry holes but also from wells that are productive but do not produce sufficient oil or natural gas to return a profit at then realized prices after deducting drilling, operating and other costs. The seismic data and other technologies we use do not allow us to know conclusively prior to drilling a well that oil or natural gas is present or that it can be produced economically. In addition, the cost of exploration, exploitation and development activities is subject to numerous uncertainties, and cost factors can adversely affect the economics of a project. Further, our development activities may be curtailed, delayed or canceled as a result of numerous factors, including:
- •
- title problems;
- •
- problems in delivery of our oil and natural gas to market;
- •
- pressure or irregularities in geological formations;
- •
- equipment failures or accidents;
- •
- adverse weather conditions;
- •
- reductions in oil and natural gas prices;
- •
- compliance with environmental and other governmental requirements, including with respect to permitting issues; and
- •
- costs of, or shortages or delays in the availability of, drilling rigs, equipment, qualified personnel and services.
Dry holes and other unsuccessful or uneconomic exploration, exploitation and development activities adversely affect our cash flow, profitability and financial condition, and can adversely affect our reserves.
The marketability of our production is dependent upon gathering systems, transportation facilities and processing facilities that we do not control. For our largest field, we rely to a significant degree on one barge to transport production from the field. When these facilities or systems, including the barge, are unavailable, our operations can be interrupted and our revenues reduced.
The marketability of our oil and natural gas production depends in part upon the availability, proximity and capacity of pipelines, natural gas gathering systems, transportation barges and processing facilities owned by third parties. In general, we do not control these facilities and our access to them may be limited or denied due to circumstances beyond our control. A significant disruption in the availability of these facilities could adversely impact our ability to deliver to market the oil and natural gas we produce and thereby cause a significant interruption in our operations. In some cases, our ability to deliver to market our oil and natural gas is dependent upon coordination among third parties who own transportation and processing facilities we use, and any inability or unwillingness of those parties to coordinate efficiently could also interrupt our operations. These are risks for which we generally do not maintain insurance.
We are at particular risk with respect to oil produced at our South Ellwood field, which is our largest field in terms of proved reserves. Our average net oil production from the field during the fourth quarter of 2009 was 2,319 Bbl/d, or approximately 26% of our aggregate net oil production for
34
the quarter. The oil produced at the field is delivered via a single-hulled barge owned and operated by an unaffiliated third party. Our loss of the use of the barge, in the absence of a satisfactory alternative delivery arrangement, would have an adverse effect on our financial condition and results of operations. Our ability to use the new barge described in "Business and Properties—Description of Properties—Southern California—South Ellwood Field" at any given time is currently subject to its other delivery commitments. Accordingly, we may not have access to the new barge on short notice.
From time to time, the barge is unavailable due to maintenance and repair requirements. It has been out of service, sometimes for several weeks at a time, for scheduled and unscheduled maintenance and repairs on multiple occasions in the past three years. Because we have limited storage capacity for oil produced from the field, we were required to significantly curtail production at the field during the periods in which the barge was unavailable. In addition, the owner of the refinery to which we historically delivered oil production from the field informed us in August 2006 that it was unwilling to accept further deliveries from the barge. If another purchaser of oil production from the field were to make a similar decision, we would have to find a new purchaser and/or enter into an alternative delivery arrangement for the production. Any new delivery or sales arrangement would require time to implement and could require us to accept lower prices for our production and/or incur higher transportation costs. In addition, if we are unable, for any sustained period, to implement an acceptable delivery or sales arrangement, we will be required to shut in or curtail production from the field. Any such shut in or curtailment, or an inability to obtain favorable terms for delivery of the oil produced from the field, would adversely affect our financial condition and results of operations. Moreover, we expect that it may not be feasible to continue the barging operation after 2016. If Ellwood Pipeline, Inc. is unable to complete the proposed common carrier pipeline to transport oil production from the field by that time, we will likely be required to shut in the field. We would be similarly affected if any of the other transportation, gathering and processing facilities we use became unavailable or unable to provide services.
Our hedging arrangements involve credit risk and may limit future revenues from price increases, result in financial losses or reduce our income.
To reduce our exposure to fluctuations in the prices of oil and natural gas, we enter into hedging arrangements with respect to a substantial portion of our oil and natural gas production. See "Quantitative and Qualitative Disclosures About Market Risk" for a summary of our hedging activity. Hedging arrangements expose us to risk of financial loss in some circumstances, including when:
- •
- production is less than expected;
- •
- a counterparty to a hedging contract fails to perform under the contract; or
- •
- there is a change in the expected differential between the underlying price in the hedging contract and the actual prices received.
A significant percentage of our cash flow during 2009 resulted from payments made to us by our hedge counterparties. We previously maintained some hedge positions with Lehman Brothers Commodity Services, Inc., which we terminated in connection with the bankruptcy of Lehman Brothers Holdings Inc. in 2008. If other hedge counterparties are unable to make payments to us under our hedging arrangements, our results of operation, financial condition and liquidity would be adversely affected.
In addition, the uncertainties associated with our hedging programs are greater than those of many of our competitors because the price of the heavy oil that we produce in California is subject to risks that are in addition to the price risk associated with premium grade light oil. Also, our working capital could be impacted if we enter into derivative arrangements that require cash collateral and commodity
35
prices subsequently change in a manner adverse to us. The obligation to post cash or other collateral could, if imposed, adversely affect our liquidity.
Moreover, we have experienced, and may continue to experience, substantial realized and unrealized losses relating to our hedging arrangements. Realized commodity derivative gains or losses represent the difference between the strike prices set forth in hedging contracts settled during the relevant period and the ultimate settlement prices. We incur a realized commodity derivative loss when a contract is settled at a price above the strike price. Losses of this type reflect the limit our hedging arrangements impose on the benefits we would otherwise have received from an increase in the price of oil or natural gas during the period. Unrealized commodity derivative gains and losses represent the change in the fair value of our open derivative contracts from period to period. We incur an unrealized commodity derivative loss when the futures price used to estimate the fair value of a contract at the end of the period rises. Increases in oil prices have caused us to incur substantial realized and unrealized commodity derivative losses in some recent periods, and we may experience similar or greater losses of these types in future periods. We may experience more volatility in our commodity derivative gains and losses than many of our competitors because we discontinued the use of hedge accounting in 2007 and because we hedge a larger percentage of our production than some of our competitors. As discussed in "Management's Discussion and Analysis of Results of Operation and Financial Condition—Liquidity and Capital Resources—Capital Resources and Requirements," our second lien term loan agreement requires us to hedge a significant percentage of our anticipated production.
Also, proposed legislation, if enacted, may make it more difficult or impossible for us to implement our hedging strategy. See "—Changes in applicable laws and regulations could increase our costs, reduce demand for our production, impede our ability to conduct operations or have other adverse effects on our business."
We are subject to complex laws and regulations, including environmental laws and regulations, that can adversely affect the cost, manner and feasibility of doing business and limit our growth.
Our operations and facilities are subject to extensive federal, state and local laws and regulations relating to exploration for, and the exploitation, development, production and transportation of, oil and natural gas, as well as environmental and safety matters. Existing laws or regulations, as currently interpreted or reinterpreted in the future, or future laws or regulations, may harm our business, results of operations and financial condition. Laws and regulations applicable to us include those relating to:
- •
- land use restrictions, which are particularly strict along the coast of southern California where many of our operations
are located;
- •
- drilling bonds and other financial responsibility requirements;
- •
- spacing of wells;
- •
- emissions into the air (including emissions from ships in the Santa Barbara channel);
- •
- unitization and pooling of properties;
- •
- habitat and endangered species protection, reclamation and remediation;
- •
- the containment and disposal of hazardous substances, oil field waste and other waste materials;
- •
- the use of underground storage tanks;
- •
- transportation and drilling permits;
- •
- the use of underground injection wells, which affects the disposal of water from our wells;
- •
- safety precautions;
36
- •
- the prevention of oil spills;
- •
- the closure of production facilities;
- •
- operational reporting; and
- •
- taxation and royalties.
Under these laws and regulations, we could be liable for:
- •
- personal injuries;
- •
- property and natural resource damages;
- •
- releases or discharges of hazardous materials;
- •
- well reclamation costs;
- •
- oil spill clean-up costs;
- •
- other remediation and clean-up costs;
- •
- plugging and abandonment costs, which may be particularly high in the case of offshore facilities;
- •
- governmental sanctions, such as fines and penalties; and
- •
- other environmental damages.
Any noncompliance with these laws and regulations could subject us to material administrative, civil or criminal penalties or other liabilities, including suspension or termination of operations. We are a defendant in a series of lawsuits alleging, among other things, that air, soil and water contamination from the oil and natural gas facility at our Beverly Hills field caused the plaintiffs to develop cancer or other diseases or to sustain related injuries. See "Legal Proceedings—Beverly Hills Litigation." These suits and/or related indemnity claims could have a material adverse effect on our financial condition. Moreover, compliance with applicable laws and regulations could require us to delay, curtail or terminate existing or planned operations.
Some environmental laws and regulations impose strict liability. Strict liability means that in some situations we could be exposed to liability for clean-up costs and other damages as a result of conduct that was lawful at the time it occurred or for the conduct of prior operators of properties we have acquired or other third parties. Similarly, some environmental laws and regulations impose joint and several liability, meaning that we could be held responsible for more than our share of a particular reclamation or other obligation, and potentially the entire obligation, where other parties were involved in the activity giving rise to the liability. In addition, we may be required to make large and unanticipated capital expenditures to comply with applicable laws and regulations, for example by installing and maintaining pollution control devices. Similarly, our plugging and abandonment obligations will be substantial and may be more than our estimates. Compliance costs are relatively high for us because many of our properties are located offshore California and in other environmentally sensitive areas and because California environmental laws and regulations are generally very strict. It is not possible for us to estimate reliably the amount and timing of all future expenditures related to environmental matters, but they will be material. Environmental risks are generally not fully insurable.
We may not be able to obtain the permits and approvals necessary for us to continue and expand our operations.
Our operations could be adversely affected by environmental and other laws and regulations that require us to obtain permits before commencing drilling or other activities. For example, as discussed in
37
"Business and Properties—Southern California," we are pursuing a development project in the South Ellwood field that contemplates a proposed extension of the area covered by our lease. We will be required to obtain numerous permits from governmental agencies prior to commencing work on the project, including from the U.S. Coast Guard, the California State Lands Commission, the California Coastal Commission, the California Division of Oil, Gas, and Geothermal Resources, the Santa Barbara County Air Pollution Control District, Santa Barbara County and the City of Goleta. We may not be able to obtain these permits as quickly as we expect or at all. In addition, the necessary permits may be granted subject to conditions which impose delays on the project, increase its costs or reduce its benefits to us. In addition, we may withdraw the application for the project if we determine that continuing the permitting process is likely to impede significantly the permitting for the pipeline project being pursued by Ellwood Pipeline, Inc. Other projects we pursue will typically be subject to similar risks. These risks are high for us relative to many of our competitors because oil and natural gas projects are frequently the source of considerable political controversy in California, and political opposition may make it more difficult for us to obtain consents and approvals for our projects. A recent attempt by another energy company to obtain an offshore lease in Southern California was rejected by the California State Lands Commission.
Changes in applicable laws and regulations could increase our costs, reduce demand for our production, impede our ability to conduct operations or have other adverse effects on our business.
Future changes in the laws and regulations to which we are subject may make it more difficult or expensive to conduct our operations and may have other adverse effects on us. For example, the EPA has issued a notice of finding and determination that emissions of carbon dioxide, methane and other GHGs present an endangerment to human health and the environment, which allows the EPA to begin regulating emissions of GHGs under existing provisions of the federal Clean Air Act. The EPA has begun to implement GHG-related reporting and permitting rules. Similarly, the U.S. Congress is considering "cap and trade" legislation that would establish an economy-wide cap on emissions of GHGs in the United States and would require most sources of GHG emissions to obtain GHG emission "allowances" corresponding to their annual emissions of GHGs. On September 27, 2006, California's governor signed into law Assembly Bill (AB) 32, known as the "California Global Warming Solutions Act of 2006," which establishes a statewide cap on GHGs that will reduce the state's GHG emissions to 1990 levels by 2020 and establishes a "cap and trade" program. The California Air Resources Board has been designated as the lead agency to establish and adopt regulations to implement AB 32 by January 1, 2012. Similar regulations may be adopted by other states in which we operate or by the federal government. Any laws or regulations that may be adopted to restrict or reduce emissions of GHGs would likely require us to incur increased operating costs and could have an adverse effect on demand for our production.
The U.S. Congress and various regulatory agencies are also considering legislation or regulation to impose restrictions on certain derivatives, including in some cases energy derivatives, which could affect our use of commodity derivatives. These proposals could result in capital, margin and position limits being imposed on traders and require on-exchange trading of derivatives. Any laws or regulations that may be adopted that address capital or margin requirements relating to, or impose restrictions on, our commodity derivative positions could have an adverse effect on our ability to implement our hedging strategy and/or the costs of pursuing that strategy. We are more vulnerable to the adverse consequences of changes in laws and regulations relating to derivatives than many of our competitors because we hedge a relatively large proportion of our expected production and are required to do so under the terms of our credit facilities, and because our hedging strategy is integral to our overall business strategy.
In addition, some of our activities involve the use of hydraulic fracturing, which is a process that creates a fracture extending from the well bore in a rock formation to enable oil or natural gas to
38
move more easily through the rock pores to a production well. Fractures are typically created through the injection of water and chemicals into the rock formation. Legislative and regulatory efforts at the federal level and in some states have been made to render permitting and compliance requirements more stringent for hydraulic fracturing. These proposals, if adopted, would likely increase our costs and make it more difficult, or impossible, to pursue some of our development projects.
We could also be adversely affected by future changes to applicable tax laws and regulations. For example, proposals have been made to amend federal and/or California law to impose "windfall profits," severance or other taxes on oil and natural gas companies and to eliminate certain deductions taken by such companies. If any of these proposals become law, our costs would increase, possibly materially. Significant financial difficulties currently facing the State of California may increase the likelihood that one or more of these proposals will become law.
Our business involves significant operating risks that could adversely affect our production and could be expensive to remedy. We do not have insurance to cover all of the risks that we may face.
Our operations are subject to all the risks normally incident to the operation and development of oil and natural gas properties and the drilling of oil and natural gas wells, including:
- •
- well blowouts;
- •
- cratering and explosions;
- •
- pipe failures and ruptures;
- •
- pipeline accidents and failures;
- •
- casing collapses;
- •
- fires;
- •
- mechanical and operational problems that affect production;
- •
- formations with abnormal pressures;
- •
- uncontrollable flows of oil, natural gas, brine or well fluids; and
- •
- releases of contaminants into the environment.
Our offshore operations are further subject to a variety of operating risks specific to the marine environment, including a dependence on a limited number of gas and water injection wells and electrical transmission lines as well as risks associated with barge transport such as collisions or capsizing. Moreover, because we operate in California, we are also susceptible to risks posed by natural disasters such as earthquakes, mudslides, fires and floods.
In addition to lost production and increased costs, these hazards could cause serious injuries, fatalities, contamination or property damage for which we could be held responsible. The potential consequences of these hazards are particularly severe for us because a significant portion of our operations are conducted offshore and in other environmentally sensitive areas, including areas with significant residential populations. We do not maintain insurance in amounts that cover all of the losses to which we may be subject, and the insurance we have may not continue to be available on acceptable terms. Moreover, some risks we face are not insurable. The occurrence of an uninsured or underinsured loss could result in significant costs that could have a material adverse effect on our financial condition and liquidity. In addition, maintenance activities undertaken to reduce operational risks can be costly and can require exploration, exploitation and development operations to be curtailed while those activities are being completed.
39
A failure to complete successful acquisitions would limit our growth.
Because our oil and natural gas properties are depleting assets, our future oil and natural gas reserves, production volumes and cash flows depend on our success in developing and exploiting our current reserves efficiently and finding or acquiring additional recoverable reserves economically. Acquiring additional oil and natural gas properties, or businesses that own or operate such properties, when attractive opportunities arise is an important component of our strategy. Our focus on the California market reduces the pool of suitable acquisition opportunities. If we do identify an appropriate acquisition candidate, we may be unable to negotiate mutually acceptable terms with the seller, finance the acquisition or obtain the necessary regulatory approvals. Our substantial level of indebtedness will limit our ability to make future acquisitions. If we are unable to complete suitable acquisitions, it will be more difficult to replace our reserves, and an inability to replace our reserves would have a material adverse effect on our financial condition and results of operations.
Acquisitions involve a number of risks, including the risk that we will discover unanticipated liabilities or other problems associated with the acquired business or property.
In assessing potential acquisitions, we typically rely to a significant extent on information provided by the seller. We independently review only a portion of that information. In addition, our review of the business or property to be acquired will not be comprehensive enough to uncover all existing or potential problems that could affect us as a result of the acquisition. Accordingly, it is possible that we will discover problems with an acquired business or property that we did not anticipate at the time we completed the transaction. These problems may be material and could include, among other things, unexpected environmental problems, title defects or other liabilities. When we acquire properties on an "as-is" basis, we have limited or no remedies against the seller with respect to these types of problems.
The success of any acquisition we complete will depend on a variety of factors, including our ability to accurately assess the reserves associated with the acquired properties, future oil and natural gas prices and operating costs, potential environmental and other liabilities and other factors. These assessments are necessarily inexact. As a result, we may not recover the purchase price of a property from the sale of production from the property or recognize an acceptable return from such sales. In addition, we may face greater risks to the extent we acquire properties in areas outside of California and the Gulf Coast of Texas, because we may be less familiar with operating, regulatory and other issues specific to those areas.
Our ability to achieve the benefits we expect from an acquisition will also depend on our ability to efficiently integrate the acquired operations with ours. Our management may be required to dedicate significant time and effort to the integration process, which could divert its attention from other business concerns. The challenges involved in the integration process may include retaining key employees and maintaining key employee morale, addressing differences in business cultures, processes and systems and developing internal expertise regarding the acquired properties.
40
Competition in the oil and natural gas industry is intense and may adversely affect our results of operations.
We operate in a competitive environment for acquiring properties, marketing oil and natural gas, integrating new technologies and employing skilled personnel. Many of our competitors possess and employ financial, technical and personnel resources substantially greater than ours. Those companies may be willing and able to pay more for oil and natural gas properties than our financial resources permit, and may be able to define, evaluate, bid for and purchase a greater number of properties. Our competitors may also enjoy technological advantages over us and may be able to implement new technologies more rapidly than we can. Also, there is substantial competition for capital available for investment in the oil and natural gas industry. We may not be able to compete successfully in the future with respect to acquiring prospective reserves, developing reserves, marketing our production, attracting and retaining qualified personnel, implementing new technologies and raising additional capital.
Enhanced recovery techniques may not be successful, which could adversely affect our financial condition or results of operations.
Certain of our properties may provide opportunities for a CO2 enhanced recovery project. Risks associated with enhanced recovery techniques include, but are not limited to, the following:
- •
- geologic unsuitability of the properties subject to the enhanced recovery project;
- •
- unavailability of an economic and reliable supply of CO2, or other shortages of equipment;
- •
- lower than expected production;
- •
- longer response times;
- •
- higher operating and capital costs; and
- •
- lack of technical expertise.
If any of these risks occur, it could adversely affect the results of the affected project, our financial condition and our results of operations. We may pursue other enhanced recovery activities from time to time as well, and those activities may be subject to the same or similar risks.
Drilling results in emerging plays are subject to heightened risks.
Part of our strategy is to pursue acquisition, exploration and development activities in emerging plays such as our onshore Monterey shale development project. Our drilling results in these areas are more uncertain than drilling results in areas that are developed and producing. Because emerging plays have limited or no production history, we are unable to use past drilling results in those areas to help predict our future drilling results. In addition, part of our drilling strategy to maximize recoveries from the onshore Monterey shale formation may involve the drilling of horizontal wells and/or using completion techniques that have proven to be successful in other shale formations. We have drilled a limited number of these types of onshore wells to the Monterey shale formation. The ultimate success of these drilling and completion strategies and techniques will be better evaluated over time as more wells are drilled and production profiles are better established. If drilling success rates or production are less than anticipated or we are unable to execute our drilling program because of capital constraints, lease expirations or other operational problems, the value of our position in the affected area will decline, our results of operations, financial condition and liquidity will be adversely impacted and we could incur material write-downs of unevaluated properties.
41
Our operations are subject to a variety of contractual, regulatory and other constraints that can limit our production and increase our operating costs and thereby adversely affect our results of operations.
We are subject to a variety of contractual, regulatory and other operating constraints that limit the manner in which we conduct our business. These constraints affect, among other things, the permissible uses of our facilities, the availability of pipeline capacity to transport our production and the manner in which we produce oil and natural gas. These constraints can change to our detriment without our consent. These events, many of which are beyond our control, could have a material adverse effect on our results of operations and financial condition and could reduce estimates of our proved reserves.
The loss of our CEO or other key personnel could adversely affect our business.
We believe our continued success depends in part on the collective abilities and efforts of Timothy Marquez, our CEO, and other key personnel, including the executive officers listed in "Business and Properties—Executive Officers of the Registrant." We do not maintain key man life insurance policies. The loss of the services of Mr. Marquez or other key management personnel could have a material adverse effect on our results of operations. Additionally, if we are unable to find, hire and retain needed key personnel in the future, our results of operations could be materially and adversely affected.
Shortages of qualified operational personnel or field equipment and services could affect our ability to execute our plans on a timely basis, increase our costs and adversely affect our results of operations.
The demand for qualified and experienced field personnel to drill wells and conduct field operations, geologists, geophysicists, engineers and other professionals in the oil and natural gas industry can fluctuate significantly, often in correlation with oil and natural gas prices, causing periodic shortages. From time to time, there have also been shortages of drilling rigs and other field equipment, as demand for rigs and equipment has increased with the number of wells being drilled. These factors can also result in significant increases in costs for equipment, services and personnel. Higher oil and natural gas prices generally stimulate increased demand and result in increased prices for drilling rigs, crews and associated supplies, equipment and services. From time to time, we have experienced some difficulty in obtaining drilling rigs, experienced crews and related services and may continue to experience these difficulties in the future. In part, these difficulties arise from the fact that the California market is not as attractive for oil field workers and equipment operators as mid-continent and Gulf Coast areas where drilling activities are more widespread. In addition, the cost of drilling rigs and related services has increased significantly over the past several years. If shortages persist or prices continue to increase, our profit margin, cash flow and operating results could be adversely affected and our ability to conduct our operations in accordance with current plans and budgets could be restricted.
Because we cannot control activities on properties we do not operate, we cannot control the timing of those projects. If we are unable to fund required capital expenditures with respect to non-operated properties, our interests in those properties may be reduced or forfeited.
Other companies operated approximately 3% of our production in the fourth quarter of 2009. Our ability to exercise influence over operations for these properties and their associated costs is limited. Our dependence on the operator and other working interest owners for these projects and our limited ability to influence operations and associated costs could prevent the realization of our targeted returns on capital with respect to exploration, exploitation, development or acquisition activities. The success and timing of exploration, exploitation and development activities on properties operated by others depend upon a number of factors that may be outside our control, including:
- •
- the timing and amount of capital expenditures;
- •
- the operator's expertise and financial resources;
42
- •
- approval of other participants in drilling wells; and
- •
- selection of technology.
Where we are not the majority owner or operator of a particular oil and natural gas project, we may have no control over the timing or amount of capital expenditures associated with the project. If we are not willing and able to fund required capital expenditures relating to a project when required by the majority owner or operator, our interests in the project may be reduced or forfeited. Also, we could be responsible for plugging and abandonment and other liabilities in excess of our proportionate interest in the property.
Changes in the financial condition of any of our large oil and natural gas purchasers or other significant counterparties could adversely affect our results of operations and liquidity.
For the year ended December 31, 2009, approximately 83% of our oil and natural gas revenues were generated from sales to four purchasers: ConocoPhillips, Enserco Energy, Tesoro Refining and Marketing Company and Gulfmark Energy Inc. ConocoPhillips is also the purchaser of oil production from the South Ellwood field under a new contract that will be effective March 2010. Subsequent to the effectiveness of that contract, we expect to derive a majority of our revenues from sales to ConocoPhillips. A material adverse change in the financial condition of any of our largest purchasers could adversely impact our future revenues and our ability to collect current accounts receivable from such purchasers. We face similar counterparty risks in connection with other contracts under which we may be entitled to receive cash payments, including insurance policies and commodity derivative agreements. Major counterparties may also seek price or other concessions from us if they perceive us to be dependent on them or to lack viable alternatives.
We were required to write down the carrying value of our properties as of December 31, 2008 and may be required to do so again in the future.
We use the full cost method of accounting for oil and natural gas exploitation, development and exploration activities. Under full cost accounting rules, we perform a "ceiling test." This test is an impairment test and generally establishes a maximum, or "ceiling," of the book value of our oil and natural gas properties that is equal to the expected after-tax present value of the future net cash flows from proved reserves, calculated using the twelve month arithmetic average of the first of the month prices (for periods prior to December 31, 2009, the prevailing price on the last day of the relevant period was used). If the net book value of our properties (reduced by any related net deferred income tax liability) exceeds the ceiling, we write down the book value of the properties. At December 31, 2008, our net capitalized costs exceeded the ceiling by $641 million, net of income tax effects, and we recorded an impairment of our oil and gas properties in that amount. We could recognize further impairments in the future. To the extent our finding and development costs increase, we will become more susceptible to ceiling test write downs in low price environments.
We are controlled by Timothy Marquez, who is able to determine the outcome of matters submitted to a vote of our stockholders. This limits the ability of other stockholders to influence our management and policies.
Timothy Marquez, our Chairman and CEO, beneficially owned approximately 60% of our outstanding common stock as of February 22, 2010. Through this ownership, Mr. Marquez is able to control the composition of our board of directors and direct our management and policies. Accordingly, Mr. Marquez has the direct or indirect power to:
- •
- elect all of our directors and thereby control our policies and operations;
- •
- amend our bylaws and some provisions of our certificate of incorporation;
- •
- appoint our management;
43
- •
- approve future issuances of our common stock or other securities;
- •
- approve the payments of dividends, if any, on our common stock;
- •
- approve the incurrence of debt by us; and
- •
- agree to or prevent mergers, consolidations, sales of all or substantially all our assets or other extraordinary transactions.
Mr. Marquez's significant ownership interest could adversely affect investors' perceptions of our corporate governance. In addition, Mr. Marquez may have an interest in pursuing acquisitions, divestitures and other transactions that involve risks to us and you. For example, Mr. Marquez could cause us to make acquisitions that increase our indebtedness or to sell revenue generating assets. Mr. Marquez may from time to time acquire and hold interests in businesses that compete directly or indirectly with us. Also, we have engaged, and may continue to engage, in related party transactions involving Mr. Marquez. For example, we purchased certain real property interests from an affiliate of Mr. Marquez for $5.3 million in December 2008.
Some of our directors have relationships with other companies in the oil and natural gas industry that could result in conflicts of interest.
Some of our directors serve as directors and/or officers of other companies engaged in the oil and natural gas industry and may have other relationships with such companies. For example, Mac McFarland provides consulting services to various energy-related companies from time to time, Joel Reed is the lead principal of a firm that provides investment banking services to such companies from time to time and Rick Walker provides executive search services to such companies from time to time. To the extent those companies are involved in ventures in which we may participate, or compete for acquisitions or financial resources with us, the relevant director will face a conflict of interest. In the event such a conflict arises, the relevant director will be required to disclose the nature and extent of the conflict and abstain from voting for or against any action of the board that is or could be affected by the conflict.
The market price of our common stock could be adversely affected by sales of substantial amounts of our common stock in the public markets or the issuance of additional shares of common stock in future acquisitions.
Sales of a substantial number of shares of our common stock in the public market, or the perception that these sales may occur, could cause the market price of our common stock to decline. In addition, the sale of these shares in the public market, or the possibility of such sales, could impair our ability to raise capital through the sale of additional common or preferred stock. As of February 22, 2010, Timothy Marquez beneficially owned approximately 60% of our common stock, primarily through the Marquez Trust. As of December 31, 2009, we had granted options to purchase an aggregate of approximately 3.3 million shares of our common stock and 1.6 million shares of restricted stock to certain of our directors and employees. The Marquez Trust and these other holders, subject to compliance with applicable securities laws, are permitted to sell shares they own or acquire upon the exercise of options in the public market. Sales of a substantial number of shares of our common stock by those holders could cause our stock price to fall.
In addition, in the future, we may issue shares of our common stock in connection with acquisitions of assets or businesses. If we use our shares for this purpose, the issuances could have a dilutive effect on the market value of shares of our common stock, depending on market conditions at the time of an acquisition, the price we pay, the value of the business or assets acquired, our success in exploiting the properties or integrating the businesses we acquire and other factors.
44
Our certificate of incorporation and bylaws and Delaware law contain provisions that may prevent, discourage or frustrate attempts to replace or remove our current management by our stockholders, even if such replacement or removal may be in our stockholders' best interests.
Our certificate of incorporation and bylaws and Delaware law contain provisions that could enable our management, including Mr. Marquez, to resist a takeover attempt (even if Mr. Marquez ceases to beneficially own a controlling block of our common shares). These provisions:
- •
- restrict various types of business combinations with significant stockholders (other than the Marquez Trust,
Mr. Marquez and his wife);
- •
- provide for a classified board of directors;
- •
- limit the right of stockholders to remove directors or change the size of the board of directors;
- •
- limit the right of stockholders to fill vacancies on the board of directors;
- •
- limit the right of stockholders to act by written consent or call a special meeting of stockholders;
- •
- require a higher percentage of stockholders than would otherwise be required to amend, alter, change or repeal certain
provisions of our certificate of incorporation; and
- •
- authorize the issuance of preferred stock with any voting rights, dividend rights, conversion privileges, redemption rights and liquidation rights and other rights, preferences, privileges, powers, qualifications, limitations or restrictions as may be specified by our board of directors.
These provisions could discourage, delay or prevent a change in the control of our company or a change in our management, even if the change would be in the best interests of our stockholders, adversely affect the voting power of holders of common stock and limit the price that investors might be willing to pay in the future for shares of our common stock. Similarly, our debt agreements have provisions relating to a change of control of our company that could have a similar effect.
ITEM 1B. Unresolved Staff Comments
None.
In the ordinary course of our business we are named from time to time as a defendant in various legal proceedings. We maintain liability insurance and believe that our coverage is reasonable in view of the legal risks to which our business ordinarily is subject.
Beverly Hills Litigation
Between June 2003 and April 2005, six lawsuits were filed against us and certain other energy companies in Los Angeles County Superior Court by persons who attended Beverly Hills High School or who were or are citizens of Beverly Hills/Century City or visitors to that area during the time period running from the 1930s to date. There are approximately 1,000 plaintiffs (including plaintiffs in two related lawsuits in which we have not been named) who claimed to be suffering from various forms of cancer or other illnesses, fear they may suffer from such maladies in the future, or are related to persons who have suffered from cancer or other illnesses. Plaintiffs alleged that exposure to substances in the air, soil and water that originated from either oil-field or other operations in the area were the cause of the cancers and other maladies. We have owned an oil and natural gas facility adjacent to the school since 1995. For the majority of the plaintiffs, their alleged exposures occurred before we acquired the facility. All cases were consolidated before one judge. Twelve "representative" plaintiffs were selected to have their cases tried first, while all of the other plaintiffs' cases were stayed. In November 2006, the judge entered summary judgment in favor of all defendants in the test cases,
45
including us. The judge dismissed all claims by the test case plaintiffs on the grounds that they offered no evidence of medical causation between the alleged emissions and the plaintiffs' alleged injuries. Plaintiffs appealed the ruling. A decision on the appeal is expected in 2010. We vigorously defended the actions, and will continue to do so until they are resolved. Certain defendants have made claims for indemnity for events occurring prior to 1995, which we are disputing. We cannot predict the cost of these indemnity claims at the present time.
One of our insurers currently is paying for the defense of these lawsuits under a reservation of its rights. Three other insurers that provided insurance coverage to us (the "Declining Insurers") took the position that they were not required to provide coverage for losses arising out of, or to defend against, the lawsuits because of a pollution exclusion contained in their policies. In February 2006, we filed a declaratory relief action against the Declining Insurers in Santa Barbara County Superior Court seeking a determination that those insurers have a duty to defend us in the lawsuits. Two of the three Declining Insurers settled with us. The third Declining Insurer disputed our position and in November 2007 the Santa Barbara Court granted that insurer's motion for summary judgment, in part on the basis that the pollution exclusion provision in the policy did not require that insurer to provide a defense for us. That decision was upheld on appeal. We have no reason to believe that the insurer currently providing defense of these actions will cease providing such defense. If it does, and we are unsuccessful in enforcing our rights in any subsequent litigation, we may be required to bear the costs of the defense, and those costs may be material. If it ultimately is determined that the pollution exclusion or another exclusion contained in one or more of our policies applies, we will not have the protection of those policies with respect to any damages or settlement costs ultimately incurred in the lawsuits.
We have not accrued for a loss contingency relating to the Beverly Hills litigation because we believe that, although unfavorable outcomes in the proceedings may be reasonably possible, we do not consider them to be probable or reasonably estimable. If one or more of these matters are resolved in a manner adverse to us, and if insurance coverage is determined not to be applicable, their impact on our results of operations, financial position and/or liquidity could be material.
State Lands Commission Royalty Audit
In 2004 the California State Lands Commission (the "SLC") initiated an audit of our royalty payments for the period from August 1, 1997 through December 31, 2003 on oil and gas produced from the South Ellwood Field, State Leases 3120 and 3240 (the "Leases"). The audit period was subsequently extended through September 2009. In December 2009 we were notified that the SLC's audit for the period January 2004 through September 2009 (the "Audit Period") indicates that we underpaid royalties due on oil and gas production from the Leases during the Audit Period by approximately $5.8 million. Based on our initial review of the SLC's audit contentions and additional historical records we believe that we may have overpaid royalties due on oil and gas production during the Audit Period and for prior periods and may be owed a refund of such overpayments. We believe the position of the SLC is without merit and intend to vigorously contest the audit findings and to enforce our rights for refunds of royalties we may have overpaid during the Audit Period and prior periods. We have not accrued any amounts related to the SLC audit contentions or potential refunds.
ITEM 4. Submission of Matters to a Vote of Security Holders
No matters were submitted to a vote of stockholders during the fourth quarter of the fiscal year covered by this report.
46
ITEM 5. Market for Registrant's Common Equity, Related Stockholder Matters and Issuer Purchases of Equity Securities
Price Range of Common Stock and Number of Holders
Our common stock is listed on the New York Stock Exchange under the symbol "VQ".
The following table sets forth the high and the low sale prices per share of our common stock for the periods indicated. The closing price of the common stock on February 22, 2010 was $11.90.
| |
2008 | 2009 | |||||||||||
|---|---|---|---|---|---|---|---|---|---|---|---|---|---|
Period
|
High | Low | High | Low | |||||||||
1st Quarter |
$ | 19.86 | $ | 11.50 | $ | 4.38 | $ | 2.15 | |||||
2nd Quarter |
$ | 23.99 | $ | 11.90 | $ | 9.54 | $ | 3.39 | |||||
3rd Quarter |
$ | 23.96 | $ | 12.33 | $ | 11.80 | $ | 6.74 | |||||
4th Quarter |
$ | 12.59 | $ | 2.07 | $ | 15.87 | $ | 10.49 | |||||
As of February 22, 2010, there were 396 record holders of our common stock.
Unregistered Sales of Equity Securities
Not applicable.
Dividend Policy
We have not declared any cash dividends on our common stock during the two most recent fiscal years and have no plans to do so in the foreseeable future. The ability of our board of directors to declare any dividend is subject to limits imposed by the terms of our debt agreements, which currently prohibit us from paying dividends on our common stock. Our ability to pay dividends is also subject to limits imposed by Delaware law. In determining whether to declare dividends, the board will consider the limits imposed by our debt agreements, our financial condition, results of operations, working capital requirements, future prospects and other factors it considers relevant.
47
Comparison of Cumulative Return
The following graph compares the cumulative return on a $100 investment in our common stock from November 17, 2006, the date the common stock trading began on the New York Stock Exchange, through December 31, 2009, to that of the cumulative return on a $100 investment in the Russell 2000 Index and the S&P 1500 Oil and Gas Consumable Fuels Index for the same period. In calculating the cumulative return, reinvestment of dividends, if any, is assumed. The indices are included for comparative purpose only. This graph is not "soliciting material," is not deemed filed with the SEC and is not to be incorporated by reference in any of our filings under the Securities Act of 1933 or the Exchange Act, whether made before or after the date hereof and irrespective of any general incorporation language in any such filing.
COMPARISON OF CUMULATIVE TOTAL RETURN
AMONG VENOCO, INC., THE RUSSELL 2000 INDEX,
AND THE S&P 1500 OIL AND GAS CONSUMABLE FUELS INDEX
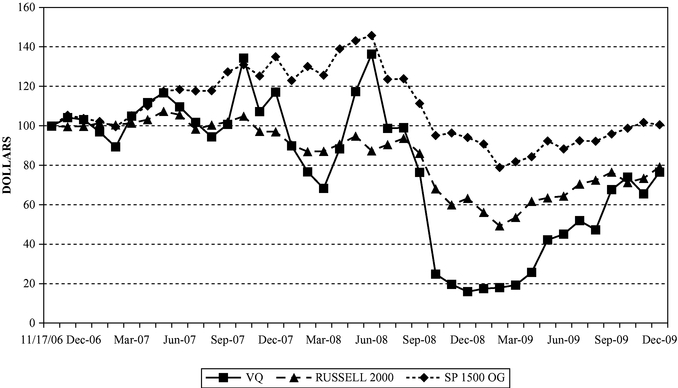
48
ITEM 6. Selected Financial Data
The table below contains selected consolidated financial data. The statement of operations, cash flow, balance sheet and other financial data for each year has been derived from our consolidated financial statements. You should read this information together with "Management's Discussion and Analysis of Financial Condition and Results of Operation" and our consolidated financial statements and the related notes included elsewhere in this report. Amounts are in thousands, except per share data.
| |
Years ended December 31, | |||||||||||||||||
|---|---|---|---|---|---|---|---|---|---|---|---|---|---|---|---|---|---|---|
| |
2005 | 2006 | 2007 | 2008 | 2009 | |||||||||||||
| |
(in thousands, except per share data) |
|||||||||||||||||
Statement of Operations Data: |
||||||||||||||||||
Oil and natural gas sales |
$ | 191,772 | $ | 268,822 | $ | 373,155 | $ | 555,917 | $ | 268,865 | ||||||||
Other |
4,456 | 5,470 | 3,355 | 3,603 | 3,331 | |||||||||||||
Total revenues |
196,228 | 274,292 | 376,510 | 559,520 | 272,196 | |||||||||||||
Oil and natural gas production |
54,038 | 87,505 | 119,321 | 149,504 | 105,341 | |||||||||||||
Transportation expense |
2,596 | 3,533 | 6,061 | 5,958 | 4,865 | |||||||||||||
Depletion, depreciation and amortization |
21,680 | 63,259 | 98,814 | 134,483 | 86,226 | |||||||||||||
Impairment of oil and natural gas properties |
— | — | — | 641,000 | — | |||||||||||||
Accretion of asset retirement obligations |
1,752 | 2,542 | 3,914 | 4,203 | 5,765 | |||||||||||||
General and administrative, net of amounts capitalized |
16,007 | 28,317 | 31,770 | 43,101 | 36,939 | |||||||||||||
Total expenses |
96,073 | 185,156 | 259,880 | 978,249 | 239,136 | |||||||||||||
Income (loss) from operations |
100,155 | 89,136 | 116,630 | (418,729 | ) | 33,060 | ||||||||||||
Interest expense, net |
13,673 | 48,795 | 60,115 | 54,049 | 40,984 | |||||||||||||
Amortization of deferred loan costs |
1,755 | 3,776 | 4,197 | 3,344 | 2,862 | |||||||||||||
Interest rate derivative losses (gains), net |
— | 590 | 17,177 | 20,567 | 16,676 | |||||||||||||
Loss on extinguishment of debt |
— | — | 12,063 | — | 8,493 | |||||||||||||
Commodity derivative losses (gains), net |
58,275 | (3,626 | ) | 142,650 | (116,757 | ) | 25,743 | |||||||||||
Total financing costs and other |
73,703 | 49,535 | 236,202 | (38,797 | ) | 94,758 | ||||||||||||
Income (loss) before income taxes |
26,452 | 39,601 | (119,572 | ) | (379,932 | ) | (61,698 | ) | ||||||||||
Income tax provision (benefit) |
10,300 | 15,650 | (46,200 | ) | 11,200 | (14,400 | ) | |||||||||||
Net income (loss) |
16,152 | 23,951 | (73,372 | ) | (391,132 | ) | (47,298 | ) | ||||||||||
Less: Net income attributable to noncontrolling interests |
42 | — | — | — | — | |||||||||||||
Net income (loss) attributable to Venoco, Inc. |
$ | 16,110 | $ | 23,951 | $ | (73,372 | ) | $ | (391,132 | ) | $ | (47,298 | ) | |||||
Earnings per common share: |
||||||||||||||||||
Basic |
$ | 0.49 | $ | 0.71 | $ | (1.58 | ) | $ | (7.75 | ) | $ | (0.93 | ) | |||||
Diluted |
$ | 0.49 | $ | 0.69 | $ | (1.58 | ) | $ | (7.75 | ) | $ | (0.93 | ) | |||||
Cash Flow Data: |
||||||||||||||||||
Cash provided (used) by: |
||||||||||||||||||
Operating activities |
$ | 39,931 | $ | 89,090 | $ | 160,863 | $ | 212,379 | $ | 118,691 | ||||||||
Investing activities |
(58,695 | ) | (595,204 | ) | (433,363 | ) | (332,861 | ) | (1,953 | ) | ||||||||
Financing activities |
(26,562 | ) | 505,089 | 273,871 | 110,938 | (116,510 | ) | |||||||||||
Other Financial Data: |
||||||||||||||||||
Capital expenditures |
$ | 79,470 | $ | 174,613 | $ | 322,283 | $ | 318,582 | $ | 176,812 | ||||||||
Balance Sheet Data (end of period): |
||||||||||||||||||
Cash and cash equivalents |
$ | 9,389 | $ | 8,364 | $ | 9,735 | $ | 191 | $ | 419 | ||||||||
Plant, property and equipment, net |
233,776 | 774,253 | 1,131,032 | 702,734 | 619,430 | |||||||||||||
Total assets |
302,558 | 893,193 | 1,265,485 | 864,254 | 739,543 | |||||||||||||
Long-term debt, excluding current portion |
178,943 | 529,616 | 691,896 | 797,670 | 695,029 | |||||||||||||
Total Venoco, Inc. stockholders' equity (deficit) |
4,334 | 190,316 | 245,602 | (135,167 | ) | (174,496 | ) | |||||||||||
49
ITEM 7. Management's Discussion and Analysis of Financial Condition and Results of Operation
The following discussion and analysis should be read in conjunction with our financial statements and related notes and the other information appearing in this report. As used in this report, unless the context otherwise indicates, references to "we," "our," "ours," and "us" refer to Venoco, Inc. and its subsidiaries collectively.
Overview
We are an independent energy company primarily engaged in the acquisition, exploration, exploitation and development of oil and natural gas properties. Our strategy is to grow through exploration, exploitation and development projects we believe to be relatively low risk and through selective acquisitions of underdeveloped properties. Our average net production was 20,622 BOE/d in 2009 compared to 21,674 BOE/d in 2008 and 19,535 BOE/d in 2007. Excluding production from the Hastings complex, which we sold on February 2, 2009 (see "—Acquisitions and Divestitures"), our average net production was 20,397 BOE/d in 2009, compared to 19,088 BOE/d in 2008 and 17,015 BOE/d in 2007. Our proved reserves were 98.3 MMBOE at December 31, 2009, compared to 97.5 MMBOE at December 31, 2008 and 99.9 MMBOE at December 31, 2007. Excluding reserves attributable to the Hastings complex, our reserves increased from 85.5 MMBOE at December 31, 2007 and 89.8 MMBOE at December 31, 2008 to 98.3 MMBOE at December 31, 2009.
In the execution of our strategy, our management is principally focused on developing additional reserves of oil and natural gas and on maximizing production levels through exploration, exploitation and development activities on a cost-effective basis and in a manner consistent with preserving adequate liquidity and financial flexibility.
Capital Expenditures
We have developed an active capital expenditure program to take advantage of our extensive inventory of drilling prospects and other projects. Our development, exploitation and exploration capital expenditures were $161.3 million in 2009, down from $301.8 million in 2008. Our 2010 development, exploitation and exploration capital expenditure budget is $180.0 million, of which approximately 41% is expected to be deployed in the Southern California region, 40% in the Sacramento Basin, 5% in Texas and the remaining 14% going towards onshore Monterey shale exploration in Southern California. We have entered into hedging arrangements to secure floors on approximately 88% of our forecast 2010 production. The price floors are intended to ensure a minimum cash flow stream to sustain an active capital expenditure program and satisfy our other obligations. The aggregate levels of capital expenditures for 2010, and the allocation of those expenditures, are dependent on a variety of factors, including the availability of capital resources to fund the expenditures and changes in our business assessments as to where our capital can be most profitably employed. Accordingly, the actual levels of capital expenditures and the allocation of those expenditures may vary materially from our estimates. We expect to finance part of our 2010 capital expenditures with proceeds from one or more capital raising transactions, and would expect to reduce our capital expenditure budget for the year if we do not complete such a transaction. The following summarizes certain significant aspects of our 2009 capital spending program and the outlook for 2010:
Southern California—Exploitation and Development
Our primary focus in Southern California in 2009 was on development activities in the West Montalvo field, where we continued the workover, recompletion and return to production program that we began when we acquired the field in May 2007. We have more than doubled production at West Montalvo since acquiring the field and anticipate an active development program in the coming years as we drill the 15 locations we have identified in the field. The field has not been fully delineated
50
offshore or fully developed onshore so the number of drilling locations could increase as our development continues. During 2009, we completed two wells that were spud during the fourth quarter of 2008, and also spud two additional wells, one late in the third quarter and the other in the fourth quarter, that had not been completed by year end. We expect both wells spud during the latter part of 2009 to be completed and online during the first quarter of 2010. We plan to drill three additional wells in the field later in 2010, but will not realize a full year's production from successful drilling until 2011.
In the Sockeye field, we continue to optimize our waterflood program from platform Gail. During 2009, we drilled a dual completion well that produces from the Monterey shale formation and expands the waterflood by injecting into the Upper Topanga formation. In 2010, we plan to drill two wells, including another dual completion well. If the dual completion well is successful, it would produce from the Monterey shale formation and inject into the Lower Topanga formation, increasing the sweep of the waterflood in that zone. The second new well will be a redrill of a Monterey shale well in which the casing has collapsed. We also completed our first hydraulic fracture in the offshore Monterey shale in January 2010, and are currently evaluating the results of the fracture. Depending on its success, we may opt to perform a second fracture on the planned redrill.
We also have a number of development opportunities in the South Ellwood field. In 2010, we expect to perform workovers and recompletions on five wells at the field. We also plan to advance the permitting process for three of the five proved undeveloped locations on our existing leases and perform the facilities work in order to begin drilling those locations in 2011.
In addition, our subsidiary Ellwood Pipeline, Inc. is pursuing the permits necessary to build a common carrier pipeline that would allow us to transport our oil from the South Ellwood field to refiners without the use of a barge or the marine terminal. We anticipate that approval hearings for the project will not be held before the second half of 2010. While we believe the pipeline should be approved, the outcome of these hearings cannot be predicted. Pending regulatory approvals and completion of the pipeline, we expect to use our current barge and a second, double-hulled barge (the "new barge") to transport oil production from the field. We recently obtained permits that will allow us to use the new barge through May 2010, on a limited basis and subject to its other delivery commitments, if the current barge is out of service. We are pursuing the permits necessary to use the new barge on a full-time basis, and expect to receive them no later than May 2010. Subject to the receipt of those permits, we expect to transition to use of the new barge in connection with the termination of the contract for the current barge, which will occur contemporaneously with the availability of the new barge. We have entered into a new sales agreement with a major oil company, effective March 2010, which allows us to use the current barge until the new barge is available to transport production. The sales contract is terminable by either party with 60 days notice after August 2010.
We also continue to pursue a major lease extension in the South Ellwood field. The lease extension would effectively double the size of the existing lease area. Development of the lease extension area can be accomplished from the field's existing platform. As described in "Business and Properties—Description of Properties—Southern California—South Ellwood Field," however, we may withdraw the application for the lease extension project if we determine that continuing the permitting process for that project is likely to impede significantly the permitting of the pipeline project.
51
Sacramento Basin—Exploitation and Development
In the Sacramento Basin, we continue to pursue our infill drilling program in the greater Grimes and Willows fields. During 2009, we spud 65 wells, completed 63 (including wells spud in 2008), and performed 197 recompletions in the basin. Due in part to declining natural gas prices, our focus in the basin in 2009 was on drilling relatively low-risk locations rather than testing the boundary of producing areas as in prior years. Our 2010 budget contemplates similar levels of drilling and workover activity. As of December 31, 2009, we had identified 680 drilling locations in the basin, and we anticipate identifying additional locations as we pursue exploitation and development opportunities there.
We continue to test and evaluate potential downspacing opportunities in the basin as well as new methods of improving productivity and reducing drilling costs. Of the 63 wells completed in the basin during 2009, all but one were drilled on 20-acre spacing. We also continue to pursue our hydraulic fracturing program in the basin, a program that we initiated in November 2007. We believe our analysis of the results to date will enable us to identify consistent targets for future fracture stimulations in the basin. We fractured two wells during 2009, and plan to fracture six wells in 2010. We have been encouraged by the results and continue to analyze those results in order to optimize future fracture simulations in the basin. As of December 31, 2009, our acreage position in the basin had grown to approximately 225,000 net acres (270,000 gross).
Texas—Exploitation and Development
We are currently engaged in actively marketing all of our oil and gas interests in the Texas properties. We expect to use the proceeds from the sale of the Texas assets to fund capital expenditures, reduce debt and fund operations.
Following the sale of the Hastings complex, our largest operated field in Texas is the Manvel field. We have utilized the knowledge and experience we gained operating the Hastings complex to implement a redevelopment program for this field. This program consists mainly of returning idle wells to production, increasing the lift capacity of existing wells, working over and recompleting existing wells in different producing sands, upgrading surface facility fluid handling capacity and increasing water injection capabilities. In addition, we are in the process of unitizing the Manvel field and believe it is a solid candidate for a CO2 flood operation.
During 2009, we performed five workovers at the Manvel field and 20 workovers at our other Texas properties. We also completed a well in the South Liberty field. Our 2010 capital budget includes capital to participate in four new development wells and return five wells to production in Texas. If our efforts to sell our Texas assets are successful, we intend to reallocate any remaining portion of the Texas capital budget to other projects.
Exploration Activities
In 2006, we began actively leasing onshore acreage in Southern California targeting the Monterey shale formation. Our leasing strategy has focused on areas where we believe the Monterey shale will produce light, sweet oil and where the quality and depth of the Monterey shale is expected to be advantageous. We plan to devote approximately 14% of our $180 million capital expenditure budget for 2010, or $26 million, on activities targeting the onshore Monterey shale formation. To date, our onshore Monterey shale acreage position is approximately 90,000 net acres, and we intend to aggressively add to this position in 2010. We also plan to acquire 3D seismic data during the year and drill five vertical test wells targeting the formation. We spud the first of these test wells in January.
52
Acquisitions and Divestitures
Sacramento Basin Asset Acquisition. On June 30, 2009, we closed on the acquisition of certain natural gas producing properties in the Sacramento Basin, which we purchased from Aspen Exploration Corporation and certain other parties for approximately $21.4 million. We paid for this acquisition with cash on hand and approximately $18.9 million in borrowings under our revolving credit facility.
Hastings Sale. In February 2009, we completed the sale of our principal interests in the Hastings complex to Denbury for approximately $197.7 million. As a result of the sale, we repaid all amounts then outstanding under our revolving credit facility and $5.5 million of the outstanding principal balance on our second lien term loan facility.
West Montalvo and Manvel Acquisitions. We acquired the West Montalvo field in Ventura County, California in May 2007 for approximately $61.3 million. We acquired the Manvel field in Brazoria County, Texas, and certain other fields in Texas, in April 2007 for $44.5 million.
Potential Sale of Texas Assets. We are currently engaged in actively marketing all of our properties in Texas. Net production from our Texas properties for the fourth quarter of 2009 averaged 1,505 BOE/d. The Texas properties comprised 7.9% of our proved reserves at December 31, 2009 or 7.8 MMBOE. We expect to use the proceeds from the sale of the Texas assets to fund capital expenditures, reduce debt and fund operations.
Other. We have an active acreage acquisition program and we regularly engage in acquisitions (and, to a lesser extent, dispositions) of oil and natural gas properties, primarily in and around our existing core areas of operations, including several transactions in each of 2007, 2008 and 2009.
Trends Affecting our Results of Operations
Oil and Natural Gas Prices. Historically, prices received for our oil and natural gas production have been volatile and unpredictable, and that volatility is expected to continue. Changes in the market prices for oil and natural gas directly impact many aspects of our business, including our financial condition, revenues, results of operations, liquidity, rate of growth, the carrying value of our oil and natural gas properties and borrowing capacity under our revolving credit facility, all of which depend primarily or in part upon those prices. For example, due primarily to lower commodities prices, our revenues from oil and gas sales and cash flow from operations declined 52% and 44%, respectively, in 2009 compared to 2008. In order to reduce the variability of the prices we receive for our production and provide a minimum revenue stream, we employ a hedging strategy. As of February 22, 2010 we had hedge contract floors covering approximately 88% of our 2010 annual production guidance and a significant portion of our expected production in 2011. We have also begun to secure hedge contracts for our 2012 production. All of our derivatives counterparties are members, or affiliates of members, of our revolving credit facility syndicate. See "Quantitative and Qualitative Disclosures About Market Risk—Commodity Derivative Transactions" for further details concerning our hedging activities.
Expected Production. In 2010, we intend to emphasize the development of our robust inventory of oil projects, primarily at our Southern California properties. Because some of these projects will require significant time for implementation, much of the production growth we expect from those projects will not be realized until after 2010. Accordingly, while we believe that these projects, if successful, will result in significant production growth in subsequent years, we expect our average daily production in 2010 will be similar to our 2009 production levels, or approximately 20,250 BOE/d. This estimate assumes (i) a full year of production from our Texas properties, some or all of which we may sell during the year and (ii) a capital expenditure budget for 2010 of $180 million, a budget that could be reduced if we do not complete one or more capital raising transactions. Additional uncertainties relating to our expectations for future production rates include those associated with third party
53
services, oil and natural gas prices, events resulting in unexpected downtime, permitting issues, drilling success rates, pipeline capacity and other factors, including those referenced in "Risk Factors".
Production Expenses. Production expenses consist of lease operating expenses ("LOE") and production and property taxes. LOE per BOE decreased from $16.86 per BOE in 2008 to $12.65 per BOE in 2009, primarily due to the sale of the relatively high cost Hastings properties in the first quarter of 2009. We expect our 2010 LOE per BOE to increase slightly relative to 2009 due to our expected focus on oil projects, which tend to have higher operating costs than natural gas projects. We expect 2010 production/property taxes to remain relatively flat on a per BOE basis compared to our 2009 results. Our expectations with respect to future expenses are subject to numerous risks and uncertainties, including those described and referenced in the preceding paragraph.
General and Administrative Expenses. General and administrative expenses decreased from $4.79 per BOE for 2008 (excluding share-based compensation charges of $0.30 per BOE and non-recurring charges of $0.34 per BOE relating to the termination of a planned master limited partnership ("MLP") offering), to $4.63 per BOE (excluding share-based compensation charges of $0.28 per BOE) in 2009. Excluding share-based compensation charges, on a per BOE basis, we expect our 2010 G&A costs to be similar to our 2009 results. As with production expenses, our expectations with respect to G&A costs are subject to numerous risks and uncertainties.
Depreciation, Depletion and Amortization (DD&A). DD&A decreased from $16.95 per BOE in 2008 to $11.46 per BOE in 2009. The decrease is principally due to a reduced amortizable base as a result of the full cost ceiling write down recorded at December 31, 2008 and the application of proceeds from the sale of the Hastings complex in February 2009 to reduce the full cost pool. We expect our 2010 DD&A expenses to increase slightly on a per BOE basis compared to our 2009 results. As with production and G&A expenses, our expectations with respect to DD&A expenses are subject to numerous risks and uncertainties.
Unrealized Derivative Gains and Losses. Decreases in both oil and natural gas prices led to significant unrealized commodity derivative gains in the first quarter of 2009, while increases in commodity prices (primarily oil) resulted in unrealized commodity derivative losses in the last three quarters of 2009. These unrealized gains and losses resulted from mark-to-market valuations of derivative positions that are not accounted for as cash flow hedges and are reflected as unrealized commodity derivative gains or losses in our income statement. Payments actually due to or from counterparties in the future on these derivatives will typically be offset by corresponding changes in prices ultimately received from the sale of our production. We have incurred significant gains and losses of this type in recent periods and may continue to incur these types of gains and losses in the future. We may also have significant unrealized interest rate derivative gains and losses in subsequent periods due to changes in market interest rates.
54
Results of Operations
The following table reflects the components of our oil and natural gas production and sales prices, and our operating revenues, costs and expenses, for the periods indicated.
| |
Years ended December 31, | ||||||||||
|---|---|---|---|---|---|---|---|---|---|---|---|
| |
2007 | 2008 | 2009 | ||||||||
Production Volume: |
|||||||||||
Oil (MBbls)(1) |
3,981 | 4,091 | 3,402 | ||||||||
Natural gas (MMcf) |
18,895 | 23,050 | 24,748 | ||||||||
MBOE |
7,130 | 7,933 | 7,527 | ||||||||
Daily Average Production Volume: |
|||||||||||
Oil (Bbls/d) |
10,907 | 11,178 | 9,321 | ||||||||
Natural gas (Mcf/d) |
51,767 | 62,978 | 67,803 | ||||||||
BOE/d |
19,535 | 21,674 | 20,622 | ||||||||
Oil Price per Bbl Produced (in dollars): |
|||||||||||
Realized price |
$ | 64.06 | $ | 89.69 | $ | 51.10 | |||||
Realized commodity derivative gain (loss) and amortization of commodity derivative premiums |
(4.35 | ) | (20.71 | ) | (0.95 | ) | |||||
Net realized price |
$ | 59.71 | $ | 68.98 | $ | 50.15 | |||||
Natural Gas Price per Mcf Produced (in dollars): |
|||||||||||
Realized price |
$ | 6.61 | $ | 8.21 | $ | 3.84 | |||||
Realized commodity derivative gain (loss) and amortization of commodity derivative premiums |
0.23 | 0.08 | 2.58 | ||||||||
Net realized price |
$ | 6.84 | $ | 8.29 | $ | 6.42 | |||||
Expense per BOE: |
|||||||||||
Lease operating expenses(2) |
$ | 15.05 | $ | 16.86 | $ | 12.65 | |||||
Production and property taxes(2) |
$ | 1.69 | $ | 1.98 | $ | 1.35 | |||||
Transportation expenses |
$ | 0.85 | $ | 0.75 | $ | 0.65 | |||||
Depletion, depreciation and amortization |
$ | 13.86 | $ | 16.95 | $ | 11.46 | |||||
General and administrative expense, net(3) |
$ | 4.46 | $ | 5.43 | $ | 4.91 | |||||
Interest expense |
$ | 8.43 | $ | 6.81 | $ | 5.44 | |||||
- (1)
- Amounts
shown are oil production volumes for offshore properties and sales volumes for onshore properties (differences between onshore production and sales
volumes are minimal). Revenue accruals are adjusted for actual sales volumes since offshore oil inventories can vary significantly from month to month based on the timing of barge deliveries, oil in
tanks and pipeline inventories, and oil pipeline sales nominations.
- (2)
- Lease
operating expenses are combined with property and production taxes to comprise oil and natural gas production expense on the consolidated statements
of operations.
- (3)
- Net of amounts capitalized.
Comparison of Year Ended December 31, 2009 to Year Ended December 31, 2008
Oil and Natural Gas Sales. Oil and natural gas sales decreased $287.0 million (52%) to $268.9 million in 2009 from $555.9 million in 2008. The decrease was due to a decline in average sales prices in addition to lower production in 2009 as compared to 2008, which resulted from the Hastings sale as described below.
55
Oil sales decreased by $192.8 million (53%) in 2009 to $173.8 million compared to $366.6 million in 2008. Oil production decreased by 17%, with production of 3,402 MBbl in 2009 compared to 4,091 MBbl in 2008. The production decrease was due to the sale of the Hastings complex in early February 2009. Excluding Hastings, production increased 167 MBbl (5%) from 3,154 MBbl in 2008 to 3,321 MBbl in 2009. The increase is primarily due to increased production at the West Montalvo field as a result of drilling and recompletion activities in the latter half of 2008 and 2009. Our average realized price for oil decreased $38.59 (43%) to $51.10 per Bbl for 2009.
Natural gas sales decreased $94.2 million (50%) in 2009 to $95.1 million compared to $189.3 million in 2008. Natural gas production increased 7%, with production of 24,748 MMcf in 2009 compared to 23,050 MMcf in 2008. The increase was due primarily to drilling and recompletion activities in the Sacramento Basin as well as production from wells acquired in the Sacramento Basin asset acquisition in June 2009. Our average realized price for natural gas decreased $4.37 (53%) to $3.84 per Mcf for 2009.
Other Revenues. Other revenues were relatively consistent at $3.6 million in 2008 and $3.3 million in 2009.
Production Expenses. Production expenses, which consist of lease operating expenses ("LOE") and production/property taxes, decreased $44.2 million (30%) to $105.3 million in 2009 from $149.5 million in 2008. The decrease was primarily due to the sale of Hastings, which was historically a relatively high cost field. On a per unit basis, LOE decreased to $12.65 per BOE in 2009 from $16.86 per BOE in 2008. Excluding Hastings, LOE per BOE decreased $1.75 from $14.32 per BOE in 2008 to $12.57 per BOE in 2009. In 2008, we incurred relatively high non-recurring maintenance costs related to certain wells in the Sockeye field, which were not incurred in 2009. Additionally, we incurred scheduled maintenance costs in 2008 related to Platform Gail in the Sockeye field that we did not incur in 2009. We were also able to achieve certain price/cost reductions from external contractors and suppliers during 2009 which reduced our overall LOE costs.
Transportation Expenses. Transportation expenses decreased $1.1 million (18%) to $4.9 million in 2009 from $6.0 million in 2008. On a per BOE basis, transportation expenses decreased $0.10 per BOE, from $0.75 per BOE in 2008 to $0.65 per BOE in 2009. The decrease is primarily due to maintenance costs incurred in 2008 related to the barge that transports South Ellwood oil production, which were not incurred in 2009.
Depletion, Depreciation and Amortization (DD&A). DD&A expense decreased $48.3 million (36%) to $86.2 million in 2009 from $134.5 million in 2008. DD&A expense decreased $5.49 per BOE, from $16.95 per BOE in 2008 to $11.46 per BOE in 2009. The decrease is principally due to a reduced depletable base as a result of the full cost ceiling write down recorded at December 31, 2008 and the application of proceeds from the Hastings sale in February 2009 to reduce the full cost pool.
Accretion of Abandonment Liability. Accretion expense increased $1.6 million (37%) to $5.8 million in 2009 from $4.2 million in 2008. The increase was due to revisions to estimated liabilities recorded in the fourth quarter of 2008 and accretion from new wells drilled and completed in 2008 and 2009.
56
General and Administrative (G&A). The following table summarizes the components of general and administrative expense incurred during the periods indicated (in thousands):
| |
Years Ended December 31, |
|||||||
|---|---|---|---|---|---|---|---|---|
| |
2008 | 2009 | ||||||
Other general and administrative costs |
$ | 56,157 | $ | 57,435 | ||||
Share-based compensation costs |
5,710 | 4,590 | ||||||
General and administrative costs capitalized |
(18,766 | ) | (25,086 | ) | ||||
General and administrative expense |
$ | 43,101 | $ | 36,939 | ||||
G&A expense decreased $6.2 million (14%) to $36.9 million in 2009 from $43.1 million in 2008. The decrease is primarily related to $2.7 million of costs that were expensed in the second quarter of 2008 related to the cancellation of a planned MLP offering. The decrease also resulted from an increase in the G&A costs that were capitalized in 2009 for payroll and related overhead for activities that are directly involved in our development, exploitation, exploration and acquisition efforts. Additionally, we incurred lower legal/professional fees and travel costs in 2009 compared to 2008. Non-cash share-based compensation expense charged to G&A decreased $0.3 million (11%) from $2.4 million in 2008 to $2.1 million in 2009, primarily as a result of certain awards that became fully vested in the first quarter of 2009. Excluding the effect of the non-cash share-based compensation expense charges and MLP write-off charges, G&A expense decreased $0.16 from $4.79 per BOE in 2008 to $4.63 per BOE in 2009.
Interest Expense, Net. Interest expense, net of interest income, decreased $13.0 million (24%) from $54.0 million in 2008 to $41.0 million in 2009. The decrease was primarily the result of a reduction in our average debt outstanding and lower interest rates realized during 2009.
Amortization of Deferred Loan Costs. Amortization of deferred loan costs decreased $0.4 million from $3.3 million in 2008 to $2.9 million in 2009. The decrease was primarily due to amendments to the revolving credit facility in May 2008 and December 2009 which extended the maturity date of the facility. The decrease was partially offset by increases to deferred loan costs incurred in connection with the refinancing of our $150 million senior notes in October 2009.
Interest Rate Derivative (Gains) Losses, Net. Changes in the fair value of our interest rate swap derivative instruments resulted in unrealized gains of $1.8 million in 2009 and unrealized losses of $10.3 million in 2008. Unrealized interest rate (gains) losses represent the change in the fair value of our interest rate derivative contracts from period to period based on estimated future interest rates at the end of the reporting period. Realized interest rate swap losses were $18.5 million in 2009 compared to realized losses of $10.2 million in 2008.
Loss on Extinguishment of Debt. We recognized losses on extinguishment of debt in 2009 of $8.5 million related to repayment of the financed derivative premiums balance in May 2009 and the refinancing of our $150 million senior notes in October 2009.
57
Commodity Derivative (Gains) Losses, Net. The following table sets forth the components of commodity derivative (gains) losses, net in our consolidated statements of operations for the periods indicated (in thousands):
| |
Years Ended December 31, |
|||||||
|---|---|---|---|---|---|---|---|---|
| |
2008 | 2009 | ||||||
Realized commodity derivative (gains) losses |
$ | 61,446 | $ | (68,429 | ) | |||
Amortization of commodity derivative premiums |
6,256 | 22,661 | ||||||
Unrealized commodity derivative (gains) losses for changes in fair value |
(184,459 | ) | 71,511 | |||||
Commodity derivative (gains) losses |
$ | (116,757 | ) | $ | 25,743 | |||
Realized commodity derivative gains or losses represent the difference between the strike prices in the contracts settled during the period and the ultimate settlement prices. The realized commodity derivative gains in 2009 reflect the settlement of contracts at prices below the relevant strike prices, while the realized derivative losses in the 2008 period reflect the settlement of contracts at prices above the relevant strike prices. In addition, in the first quarter of 2009, we unwound certain oil collars and purchased oil swaps with the proceeds. We also unwound certain 2009 gas puts to bring our hedge position in line with our production guidance. As a result of these transactions, we realized non-recurring gains of $7.7 million which are reflected in the 2009 realized commodity derivative gains. Unrealized commodity derivative (gains) losses represent the change in the fair value of our open derivative contracts from period to period. Derivative premiums are amortized over the term of the underlying derivative contracts.
Income Tax Expense (Benefit). We incurred losses before income taxes in 2008 and 2009. These losses were a key consideration that led us to provide a valuation allowance against our net deferred tax assets at December 31, 2008 and 2009 since we could not conclude that it is more likely than not that the net deferred tax assets will be recognized. The current tax benefit for 2009 of $14.4 million reflects a reduction of prior year current tax expense (a $6.0 million benefit) and, due to the temporary five-year carryback period that became available in 2009, a carryback of net operating losses (a $8.4 million benefit). The valuation allowance resulted in income tax expense of $11.2 million in 2008.
Net Income (Loss). Net loss for 2009 was $47.3 million compared to net loss of $391.1 million for 2008. The change between years is the result of the items discussed above.
Comparison of Year Ended December 31, 2008 to Year Ended December 31, 2007
Oil and Natural Gas Sales. Oil and natural gas sales increased $182.7 million (49%) to $555.9 million in 2008 from $373.2 million in 2007. The increase was primarily due to a 11% increase in production and an increase in average sales prices as described below.
Oil sales increased by $116.8 million in 2008 (47%) to $366.6 million compared to $249.8 million in 2007. Oil production rose 3%, with production of 4,091 MBbl in 2008 compared to 3,981 MBbl in 2007. The production increase was attributable primarily to a full year of production from the Manvel field, which was acquired in April 2007, and the West Montalvo field, which was acquired in May 2007, and to our workover program in the Hastings complex, offset by the natural decline of production. Our average realized price for oil increased $25.63 (40%) to $89.69 per Bbl for the period.
Natural gas sales increased $66.0 million in 2008 (54%) to $189.3 million compared to $123.3 million in 2007. Natural gas production increased 22%, with production of 23,050 MMcf compared to 18,895 MMcf in 2007. The increase was due primarily to drilling and recompletion
58
activities in the Sacramento Basin. Our average realized price for natural gas increased $1.60 (24%) to $8.21 per Mcf for the period.
Other Revenues. Other revenue was relatively constant at $3.6 million in 2008 compared to $3.4 million in 2007.
Production Expenses. Production expenses, which consist of lease operating expenses ("LOE") and production/property taxes, increased $30.2 million (25%) to $149.5 million in 2008 from $119.3 million in 2007. The increase was due to (i) a significant increase in electricity usage and rates in Texas in 2008, (ii) non-recurring maintenance costs incurred at Sockeye in 2008, (iii) the effect of twelve full months of expense related to the Manvel and West Montalvo acquisitions, which occurred in April and May 2007, respectively, and (iv) an increase in secured and supplemental property taxes related to our California properties. On a per unit basis, LOE increased to $16.86 per BOE in 2008 from $15.05 per BOE in 2007.
Transportation Expenses. Transportation expenses remained relatively flat at $6.0 million in 2008 compared to $6.1 million in 2007. On a per BOE basis, transportation expenses decreased $0.10 per BOE, from $0.85 per BOE in 2007 to $0.75 per BOE in 2008.
Depletion, Depreciation and Amortization (DD&A). DD&A expense increased $35.7 million (36%) to $134.5 million in 2008 from $98.8 million in 2007. DD&A expense per BOE rose $3.09, from $13.86 per BOE in 2007 to $16.95 per BOE in 2008. The increase was primarily due to a higher depletion expense resulting from increases in oil and natural gas property costs resulting from our capital expenditure program.
Impairment. During the fourth quarter of 2008, we recorded an impairment charge to the net book value of oil and gas properties of $641 million as the result of the required full cost ceiling test. The impairment was caused principally by lower year-end oil and natural gas prices.
Accretion of Abandonment Liability. Accretion expense increased $0.3 million (7%) to $4.2 million in 2008 from $3.9 million in 2007. The increase was due to accretion from the properties acquired in the Manvel and West Montalvo acquisitions and from new wells drilled and completed in 2007 and 2008.
General and Administrative (G&A). The following table summarizes the components of general and administrative expense incurred during the periods indicated (in thousands):
| |
Years Ended December 31, |
|||||||
|---|---|---|---|---|---|---|---|---|
| |
2007 | 2008 | ||||||
Other general and administrative costs |
$ | 38,894 | $ | 56,157 | ||||
Share-based compensation costs |
4,680 | 5,710 | ||||||
General and administrative costs capitalized |
(11,804 | ) | (18,766 | ) | ||||
General and administrative expense |
$ | 31,770 | $ | 43,101 | ||||
G&A expense, net of amounts capitalized, increased $11.3 million (36%) to $43.1 million in 2008 from $31.8 million in 2007. The increase was a result of $2.7 million of costs that were expensed in the second quarter of 2008 related to the cancellation of the planned MLP offering, and an increase in our professional staff and related infrastructure. Non-cash share-based compensation expense included in G&A was $3.0 million in 2007 and $2.4 million in 2008. The increase was primarily due to the increase in our professional staff. Excluding the effect of the non-cash SFAS 123R charges and the non-recurring MLP charges, G&A increased $0.75 per BOE from $4.04 per BOE in 2007 to $4.79 per BOE in 2008.
59
Interest Expense, Net. Interest expense, net of interest income, decreased $6.1 million (10%) from $60.1 million in 2007 to $54.0 million in 2008, primarily as a result of a decrease in interest rates during 2008, partially offset by an increase in average debt outstanding in 2008.
Amortization of Deferred Loan Costs. Amortization of deferred loan costs decreased $0.9 million (20%), from $4.2 million in 2007 to $3.3 million in 2008. The decrease was primarily due to the write-off of deferred loan costs in connection with the refinancing of our term loan facility in 2007, as well as the amendment to the revolving credit facility in May 2008 which extended the maturity date of the facility.
Interest Rate Derivative Losses (Gains), Net. Changes in the fair value of our interest rate swap derivative instruments resulted in unrealized losses of $10.3 million in 2008 and $17.3 million in 2007. The change between years is the result of an increase in the notional amount of debt covered by the interest rate swap and a more significant decrease in expected future interest rates in 2007 than in 2008. We realized an interest rate swap loss of $10.2 million in 2008 compared to a realized gain of $0.1 million in 2007.
Loss on the Extinguishment of Debt. We incurred a loss on extinguishment of debt of $12.1 million in the second quarter of 2007 when we prepaid the prior second lien term loan facility and replaced it with the new term loan facility. We paid a premium of $3.5 million and wrote off related deferred loan costs of $8.6 million in connection with the prepayment.
Commodity Derivative Losses (Gains), Net. The following table sets forth the components of commodity derivative (gains) losses, net in our consolidated statements of operations for the years indicated (in thousands):
| |
Years Ended December 31, |
|||||||
|---|---|---|---|---|---|---|---|---|
| |
2007 | 2008 | ||||||
Realized commodity derivative (gains) losses |
$ | 13,041 | $ | 61,446 | ||||
Unrealized commodity derivative (gains) losses |
122,779 | (184,459 | ) | |||||
Amortization of commodity derivative premiums |
6,830 | 6,256 | ||||||
Total |
$ | 142,650 | $ | (116,757 | ) | |||
Realized commodity derivative gains or losses represent the difference between the strike prices in the contracts settled during the period and the ultimate settlement prices. The realized commodity derivative losses in 2007 and 2008 reflect the settlement of contracts at prices above the relevant strike prices. Unrealized commodity derivative (gains) losses represent the change in the fair value of our open derivative contracts from period to period. The change in unrealized commodity derivative (gains) losses reflects an increase in the notional volumes under derivative contracts outstanding in 2008 and a decrease in the futures prices used to estimate the fair value of those contracts at the end of the period. Derivative premiums are amortized over the term of the underlying derivative contracts.
Income Tax Expense. We provided a valuation allowance against our net deferred tax assets of $156.9 million as of December 31, 2008, since we cannot conclude that is more likely than not that the net deferred tax assets will be realized. The valuation allowance resulted in income tax expense of $11.2 million in 2008, even though we incurred a loss before taxes. In 2007, the loss before taxes resulted in an income tax benefit of $46.2 million.
Net Income (Loss). Our net loss for 2008 was $391.1 million compared to net loss of $73.4 million in 2007. The change between periods is the result of the items discussed above.
60
Liquidity and Capital Resources
Our primary sources of liquidity are cash generated from our operations and amounts available under our revolving credit facility.
Cash Flows
| |
Years ended December 31, | |||||||||
|---|---|---|---|---|---|---|---|---|---|---|
| |
2007 | 2008 | 2009 | |||||||
| |
(in thousands) |
|||||||||
Cash provided by (used in) operating activities |
$ | 160,863 | $ | 212,379 | $ | 118,691 | ||||
Cash provided by (used in) investing activities |
(433,363 | ) | (332,861 | ) | (1,953 | ) | ||||
Cash provided by (used in) financing activities |
273,871 | 110,938 | (116,510 | ) | ||||||
Net cash provided by operating activities was $118.7 million in 2009, down from $212.4 million in 2008 and $160.9 million in 2007. Cash flows from operating activities in 2009 were unfavorably impacted by significant decreases in commodity prices.
Net cash used in investing activities was $2.0 million in 2009 compared to $332.9 million in 2008 and $433.4 million in 2007. The primary investing activities in 2009 were $174.8 million in capital expenditures for our oil and gas exploration and development programs together with $21.3 million paid to acquire certain Sacramento Basin assets. These total expenditures of $196.1 million were offset by the receipt of $197.7 in cash proceeds from the sale of our Hastings complex in Texas. The primary investing activities in 2008 include $311.2 million in expenditures for oil and gas properties and $14.3 million for acquisitions. The primary investing activities in 2007 include $316.9 million in expenditures for oil and gas properties and $121.8 million paid to acquire the West Montalvo and Manvel fields and other properties.
Net cash used in financing activities was $116.5 million in 2009 compared to net cash provided by financing activities of $110.9 million in 2008 and $273.9 million in 2007. The primary financing activities in 2009 were as follows: (i) we made net repayments of $77.2 million on our revolving credit facility and $5.5 million of principal payments on the second lien term loan, both of which were primarily funded with proceeds from the Hastings sale, (ii) we paid approximately $15.3 million in May 2009 to settle financed derivative premiums, (iii) in October 2009, we refinanced our 8.50% senior notes with the issuance of our 11.50% senior notes, which resulted in a principal repayment of $150 million and a premium payment of $3.3 million. From the issuance of the 11.50% notes, we received cash of $142.5 million, net of the $7.5 million original issue discount. We incurred $2.9 million in debt issuance costs related to the senior notes refinancing. Additionally, we incurred $1.9 million of debt issuance costs related to the third amendment and restatement of the agreement governing the revolving credit facility, which we entered into in December 2009. The primary financing activities in 2008 were $93.1 million in net borrowings under the revolving credit facility to fund capital expenditures and working capital needs. The primary financing activities in 2007 were $151.1 million in net borrowings under the second lien term loan facility to fund capital expenditures and working capital needs and $11.4 million in net borrowings under the revolving credit facility. Net proceeds from an additional offering of common stock completed in July 2007 were $116.0 million, of which $95.0 million was used to reduce amounts outstanding under our revolving credit facility; the remainder was used to fund our capital expenditure program.
Capital Resources and Requirements
We plan to make substantial capital expenditures in the future for the acquisition, exploration, exploitation and development of oil and natural gas properties. We expect that our exploration, exploitation and development capital expenditures, which were $161.3 million in 2009, will be approximately $180 million in 2010. We expect to fund our 2010 capital expenditure budget primarily
61
with cash flow from operations, supplemented with proceeds from capital raising transactions that may include asset sales, joint venture transactions and/or an issuance of equity. In particular, we will seek to finance part of the planned capital expenditures relating to our Monterey shale development project through a joint venture, and will seek to fund additional expenditures and/or reduce indebtedness through the sale of some or all of our Texas properties. If we are unable to complete one or more of those transactions on terms acceptable to us, however, we would currently expect to reduce our capital expenditure budget to approximate our cash flow from operations. In some circumstances, we would be required to use proceeds from the sale of Texas assets to reduce amounts outstanding under our credit facilities. Also, a sale of some or all of our Texas assets could result in a reduction in the borrowing base under our revolving credit facility. Additional uncertainties relating to our capital resources and requirements in 2010 include the possibility that one or more of the counterparties to our hedging arrangements may fail to perform under the contracts, the effects of changes in commodity prices and differentials and the possibility that we will pursue one or more significant acquisitions that would require additional debt or equity financing.
Amended Revolving Credit Facility. In December 2009, we entered into the third amended and restated credit agreement governing our revolving credit facility, which now has a maturity date of January 15, 2013. The agreement contains customary representations, warranties, events of default, indemnities and covenants, including covenants that restrict our ability to incur indebtedness, require us to maintain derivative contracts covering a portion of our anticipated production and require us to maintain specified ratios of current assets to current liabilities and debt to EBITDA. The minimum ratio of current assets to current liabilities (as those terms are defined in the agreement) is one to one; the maximum ratio of debt to EBITDA (as defined in the agreement) is four to one. While we do not expect to be in violation of any of our debt covenants during 2010, we believe that it will be important to monitor the debt to EBITDA ratio requirement, especially if our EBITDA is less than we expect due to operational problems or other factors, or if our borrowing needs are greater than we expect. The agreement requires us to reduce amounts outstanding under the facility with the proceeds of certain transactions or events, including sales of assets, in certain circumstances. The revolving credit facility is secured by a first priority lien on substantially all of our assets.
Loans under the revolving credit facility designated as "Base Rate Loans" bear interest at a floating rate equal to (i) the greater of (x) Bank of Montreal's announced base rate, (y) the overnight federal funds rate plus 0.50% and (z) the one-month LIBOR plus 1.5%, plus (ii) an applicable margin ranging from 0.75% to 1.50%, based upon utilization. Loans designated as "LIBO Rate Loans" under the revolving credit facility bear interest at (i) LIBOR plus (ii) an applicable margin ranging from 2.25% to 3.00%, based upon utilization. A commitment fee of 0.5% per annum is payable with respect to unused borrowing availability under the facility.
The revolving credit facility has a total capacity of $300.0 million, but is limited by a borrowing base currently established at $125.0 million. The borrowing base is subject to redetermination twice each year, and may be redetermined at other times at our request or at the request of the lenders. Lending commitments under the facility have been allocated at various percentages to a syndicate of ten banks. Certain of the institutions included in the syndicate have received support from governmental agencies in connection with events in the credit markets. A failure of any members of the syndicate to fund under the facility, or a reduction in the borrowing base, would adversely affect our liquidity. As a result of the Hastings sale in February 2009, we repaid the then outstanding balance of the facility in full. Since repayment of the facility in February 2009, we have borrowed approximately $57.9 million (net of principal repayments) through February 22, 2010, to finance certain derivative premiums, to fund the Sacramento Basin asset acquisition, to satisfy and discharge our 8.75% senior notes and to fund other operating needs.
Second Lien Term Loan. We entered into a $500.0 million senior secured second lien term loan agreement in May 2007. The term loan agreement contains customary representations, warranties,
62
events of default and indemnities and certain customary operational covenants, including covenants that restrict our ability to incur additional indebtedness. The agreement requires us to maintain derivative contracts covering at least 70% of our projected oil and natural gas production attributable to proved developed producing reserves through May 8, 2010, and at least 50% of such production on an annual basis until the maturity date of the term loan. We cannot, however, enter into derivative contracts (other than certain put contracts) covering more than 80% of such projected oil and gas production in any month. The agreement also prohibits us from paying dividends on our common stock. The agreement will require us to make offers to prepay amounts outstanding under the second lien term loan facility with the proceeds of certain transactions or events, including sales of assets, in certain circumstances. Amounts prepaid under the facility may not be reborrowed. The term loan facility is secured by a second priority lien on substantially all of our assets. We repaid $5.5 million of principal under the facility in February 2009 after the Hastings sale. As a result of the refinancing of our 8.75% senior notes, the maturity date of the principal on the second lien term loan was extended to May 8, 2014.
Loans under the second lien term loan facility designated as "Base Rate Loans" bear interest at a floating rate equal to (i) the greater of the overnight federal funds rate plus 0.50% and the administrative agent's announced base rate, plus (ii) 3.00%. Loans designated as "LIBO Rate Loans" bear interest at LIBOR plus 4.00%.
Senior Notes. We issued $150.0 million of our 8.75% senior notes in December 2004 which bore interest at 8.75% per year and were due to mature on December 15, 2011. In October 2009, we issued $150.0 million in 11.50% senior notes due October 2017 at a price of 95.03% of par. Concurrently with the sale of the 11.50% senior notes, we irrevocably deposited $159.8 million in cash with the trustee under the indenture governing the 8.75% secured senior notes, thus effecting a satisfaction and discharge of the 8.75% senior notes. Additionally, we issued an irrevocable notice of redemption to call the 8.75% senior notes for redemption at 102.188% on December 15, 2009. Accordingly, the 8.75% senior notes were fully repaid on December 15, 2009 along with all accrued interest as of the redemption date.
We may redeem the 11.50% senior notes prior to October 1, 2013 at a "make-whole price" defined in the indenture. Beginning October 1, 2013, we may redeem the notes at a redemption price equal to 105.75% of the principal amount and declining to 100% by October 1, 2016. The 11.50% senior notes are senior unsecured obligations. The indenture governing the notes contains operational covenants that, among other things, limit our ability to make investments, incur additional indebtedness or create liens on our assets.
Because we must dedicate a substantial portion of our cash flow from operations to the payment of amounts due under our debt agreements, that portion of our cash flow is not available for other purposes. Our ability to make scheduled interest payments on our indebtedness and pursue our capital expenditure plan will depend to a significant extent on our financial and operating performance, which is subject to prevailing economic conditions, commodity prices and a variety of other factors. If our cash flow and other capital resources are insufficient to fund our debt service obligations and our capital expenditure budget, we may be forced to reduce or delay scheduled capital projects, sell material assets or operations and/or seek additional capital. Needed capital may not be available on acceptable terms or at all. Our ability to raise funds through the incurrence of additional indebtedness and certain other means is limited by covenants in our debt agreements. In addition, pursuant to mandatory prepayment provisions in our credit facilities, our ability to respond to a shortfall in our expected liquidity by selling assets or incurring additional indebtedness would be limited by provisions in the facilities that require us to use some or all of the proceeds of such transactions to reduce amounts outstanding under one or both of the facilities in some circumstances. If we are unable to obtain funds when needed and on acceptable terms, we may not be able to complete acquisitions that
63
may be favorable to us, meet our debt obligations or finance the capital expenditures necessary to replace our reserves.
Commitments and Contingencies
As of December 31, 2009, the aggregate amounts of contractually obligated payment commitments for the next five years were as follows (in thousands):
| |
Less than One Year |
1 to 3 Years |
3 to 5 Years |
After 5 years |
Total(1) | ||||||||||||
|---|---|---|---|---|---|---|---|---|---|---|---|---|---|---|---|---|---|
Long-term debt |
$ | — | $ | — | $ | 552,345 | $ | 142,684 | $ | 695,029 | |||||||
Interest on senior notes |
17,250 | 34,500 | 34,500 | 47,402 | 133,652 | ||||||||||||
Rental of office space |
2,444 | 4,607 | 3,833 | 6,474 | 17,358 | ||||||||||||
Total |
$ | 19,694 | $ | 39,107 | $ | 590,678 | $ | 196,560 | $ | 846,039 | |||||||
- (1)
- Total
contractually obligated payment commitments do not include the anticipated settlement of derivative contracts, obligations to taxing authorities or
amounts relating to our asset retirement obligations, which include plugging and abandonment obligations, due to the uncertainty surrounding the ultimate settlement amounts and timing of these
obligations. Our total asset retirement obligations were $93.0 million at December 31, 2009.
- (2)
- Amounts related to interest expense on our revolving credit facility and second lien term loan facility are not included in the table above because the interest rates on those debt instruments are variable. During the years ended December 31, 2007, 2008 and 2009, we incurred interest expense on those debt instruments of $50.0 million, $40.3 million and $25.3 million, respectively.
Off-Balance Sheet Arrangements
At December 31, 2009, we had no existing off-balance sheet arrangements, as defined under SEC rules, that have or are reasonably likely to have a material current or future effect on our financial condition, revenues or expenses, results of operations, liquidity, capital expenditures or capital resources.
Critical Accounting Policies and Estimates
Our discussion and analysis of our financial condition and results of operations are based upon financial statements that have been prepared in accordance with accounting principles generally accepted in the United States, or GAAP. The preparation of these financial statements requires us to make estimates and judgments that affect the reported amounts of assets, liabilities, revenues and expenses. We have identified certain accounting policies as being of particular importance to the presentation of our financial position and results of operations and which require the application of significant judgment by our management. We analyze our estimates, including those related to oil and natural gas revenues, oil and natural gas properties, fair value of derivative instruments, income taxes and contingencies and litigation, and base our estimates on historical experience and various other assumptions that we believe to be reasonable under the circumstances. Actual results may differ from these estimates under different assumptions or conditions. We believe the following critical accounting policies and estimates affect our more significant judgments and estimates used in the preparation of our financial statements.
64
Reserve Estimates
Our estimates of oil and natural gas reserves are, by necessity, projections based on geologic and engineering data, and there are uncertainties inherent in the interpretation of such data as well as in the projection of future rates of production and the timing of development expenditures. Reserve engineering is a subjective process of estimating underground accumulations of oil and natural gas that are difficult to measure. The accuracy of any reserve estimate is a function of the quality of available data, engineering and geological interpretation and judgment. Estimates of economically recoverable oil and natural gas reserves and future net cash flows necessarily depend upon a number of variable factors and assumptions, such as historical production from the area compared with production from other producing areas, the assumed effects of regulation by governmental agencies and assumptions governing future oil and natural gas prices, future operating costs, severance, ad valorem and excise taxes, development costs and workover and remedial costs, all of which may vary considerably from actual results. For these reasons, estimates of the economically recoverable quantities of oil and natural gas attributable to any particular group of properties, classifications of such reserves based on the likelihood of recovery and estimates of the future net cash flows expected from them may vary substantially. Any significant variance in the assumptions could materially affect the estimated quantity and value of the reserves, which could affect the carrying value and the rate of depletion of the oil and natural gas properties. For example, oil and natural gas price changes affect the estimated economic lives of oil and natural gas properties and therefore cause reserve revisions. Our December 31, 2009 estimate of net proved oil and natural gas reserves totaled 98.3 MMBOE. Had oil and natural gas prices been 10% lower as of the date of the estimate, our total oil and natural gas reserves would have been approximately 1% lower. In addition, our proved reserves are concentrated in a relatively small number of wells. At December 31, 2009, 17% of our proved reserves were concentrated in our 20 largest wells. As a result, any changes in proved reserves attributable to such individual wells could have a significant effect on our total reserves. Actual production, revenues and expenditures with respect to our reserves will likely vary from estimates, and such variances may be material.
Effective December 31, 2009, the SEC and the Financial Accounting Standards Board ("FASB") revised guidance regarding oil and gas reserves. The significant revisions involve revised definitions of oil and gas producing activities and changing the pricing used to estimate reserves at period end to a twelve-month arithmetic average of the first of the month prices from a period end price. In accordance with this revised guidance, our reserves at December 31, 2009 have been prepared using the twelve month arithmetic average of the first of the month prices.
Oil and Natural Gas Properties, Depletion and Full Cost Ceiling Test
We follow the full cost method of accounting for oil and natural gas properties. Under this method, all productive and nonproductive costs incurred in connection with the acquisition of, exploration for and exploitation and development of oil and natural gas reserves are capitalized. Such capitalized costs include costs associated with lease acquisition, geological and geophysical work, delay rentals, drilling, completing and equipping oil and natural gas wells, and salaries, benefits and other internal salary related costs directly attributable to these activities. Proceeds from the disposition of oil and natural gas properties are generally accounted for as a reduction in capitalized costs, with no gain or loss recognized. Depletion of the capitalized costs of oil and natural gas properties, including estimated future development and capitalized asset retirement costs, is provided for using the equivalent unit-of-production method based upon estimates of proved oil and natural gas reserves. The capitalized costs are amortized over the life of the reserves associated with the assets, with the amortization being expensed as depletion in the period that the reserves are produced. This depletion expense is calculated by dividing the period's production volumes by the estimated volume of reserves associated with the investment and multiplying the calculated percentage by the sum of the capitalized investment and estimated future development costs associated with the investment. Changes in our
65
reserve estimates will therefore result in changes in our depletion expense per unit. For example, a 10% reduction in our estimated reserves as of December 31, 2009 would have resulted in an increase of approximately $0.92 per BOE in our average 2009 depletion expense rate. We calculated fourth quarter depletion expense based on the year-end reserve report. Therefore, the reserves used to calculate the fourth quarter of 2009 depletion expense are determined on a different basis than the reserves used for the first three quarters of 2009 due to the change to pricing applied to year-end reserves pursuant to the revised SEC and FASB oil and gas reserves guidance. The prices used to determine the reserves at December 31, 2009 are based on the unescalated twelve month arithmetic average of the prices in effect on the first of the month, whereas the prior quarters were based on the price in effect at the end of the period. The impact of the change in pricing methodology is immaterial. Costs associated with production and general corporate activities are expensed in the period incurred. Interest costs related to unproved properties and properties under development are also capitalized to oil and natural gas properties. Unproved property costs not subject to amortization consist primarily of leasehold and seismic costs related to unproved areas. Costs are transferred into the amortization base on an ongoing basis as the properties are evaluated and proved reserves established or impairment determined. We will continue to evaluate these properties and costs will be transferred into the amortization base as undeveloped areas are tested. Unproved oil and natural gas properties are not amortized, but are assessed, at least annually, for impairment either individually or on an aggregated basis to determine whether we are still actively pursuing the project and whether the project has been proven, either to have economic quantities of reserves or that economic quantities of reserves do not exist.
Under full cost accounting rules, capitalized costs of oil and natural gas properties, excluding costs associated with unproved properties, may not exceed the present value of estimated future net revenues from proved reserves, discounted at 10%. Effective for all annual reports for fiscal years ending on or after December 31, 2009, application of the ceiling test generally requires pricing future revenue at the unescalated twelve month arithmetic average of the prices in effect on the first day of each month of the relevant period and requires a write down for accounting purposes if the ceiling is exceeded.
We did not have a ceiling test write down during 2009. At December 31, 2008, our net capitalized costs exceeded the ceiling by $641 million, net of income tax effects, and we recorded a write down of our oil and natural gas properties in that amount. Per the guidance in effect at the time, the year-end prices were used to determine reserves at December 31, 2008. We could be required to recognize additional impairments of oil and gas properties in future periods if market prices of oil and natural gas decline.
Asset Retirement Obligations
The accounting standards set forth by the FASB with respect to accounting for asset retirement obligations provide that, if the fair value for asset retirement obligations can be reasonably estimated, the liability should be recognized in the period when it is incurred. Oil and natural gas producing companies incur this liability upon acquiring or drilling a well. Under this method, the retirement obligation is recorded as a liability at its estimated present value at the asset's inception, with the offsetting charge to property cost. Periodic accretion of discount of the estimated liability is recorded in the income statement. Our asset retirement obligation primarily represents the estimated present value of the amount we will incur to plug, abandon and remediate our properties at the end of their productive lives, in accordance with applicable laws. We have determined our asset retirement obligation by calculating the present value of estimated cash flows related to each liability. The discount rates used to calculate the present value varied depending on the estimated timing of the relevant obligation, but typically ranged between 4% and 9%. We periodically review the estimate of costs to plug, abandon and remediate our properties at the end of their productive lives. This includes a review of both the estimated costs and the expected timing to incur such costs. We believe most of these costs
66
can be estimated with reasonable certainty based upon existing laws and regulatory requirements and based upon wells and facilities currently in place. Any changes in regulatory requirements, which changes cannot be predicted with reasonable certainty, could result in material changes in such costs. Changes in reserve estimates and the economic life of oil and natural gas properties could affect the timing of such costs and accordingly the present value of such costs.
Income Tax Expense
Income taxes reflect the tax effects of transactions reported in the financial statements and consist of taxes currently payable plus deferred income taxes related to certain income and expenses recognized in different periods for financial and income tax reporting purposes. Deferred income tax assets and liabilities represent the future tax return consequences of those differences, which will either be taxable or deductible when assets are recovered or settled. Deferred income taxes are also recognized for tax credits that are available to offset future income taxes. Deferred income taxes are measured by applying current tax rates to the differences between financial statement and income tax reporting. We have recognized a valuation allowance against our net deferred taxes because we cannot conclude that it is more likely than not that the net deferred tax assets will be realized as a result of estimates of our future operating income based on current oil and natural gas commodity pricing. In assessing the realization of deferred tax assets, we consider whether it is more likely than not that some portion or all of the deferred tax assets will be realized. The ultimate realization of deferred tax assets is dependent upon the generation of future taxable income during the periods in which those temporary differences become deductible. We consider the scheduled reversal of deferred tax liabilities, available taxes in carryback periods, projected future taxable income and tax planning strategies in making this assessment. We will continue to evaluate whether the valuation allowance is needed in future reporting periods.
Derivative Instruments
We reflect the fair market value of our derivative instruments on our balance sheet. Our estimates of fair value are determined by obtaining independent market quotes, as well as utilizing a Black-Scholes option valuation model that is based upon underlying forward price curve data, risk-free interest rates, credit adjusted discount rates and estimated volatility factors. Changes in commodity prices will result in substantially similar changes in the fair value of our commodity swap agreements, and in substantially similar changes in the fair value of our commodity collars to the extent the changes are outside the floor or cap of our collars. We do not apply hedge accounting to any of our derivative contracts, therefore we recognize mark-to-market gains and losses in earnings currently.
Recent Accounting Pronouncements
In December 2008, the SEC published revised rules regarding oil and gas reserves reporting requirements. The objective of the rules is to provide readers of financial statements with more meaningful and comprehensive understanding of oil and gas reserves. Key elements of the revised rules include a change in the pricing used to estimate reserves at period end, certain revised definitions, optional disclosure of probable and possible reserves, allowance of the use of new technologies in the determination of reserves and additional disclosure requirements. The rules also revise the prices used for reserves in determining depletion and the full cost ceiling test from a period end price to a twelve month arithmetic average price. The revised rules are effective for annual reporting periods for fiscal years ending on or after December 31, 2009. Application of the revised rules has resulted in changes to the prices used to determine proved reserves at December 31, 2009, as well as additional disclosures.
In January 2010, the FASB issued an Accounting Standards Update ("ASU") to amend existing oil and gas reserve accounting and disclosure guidance to align its requirements with the SEC's revised rules discussed above. The significant revisions involve revised definitions of oil and gas producing
67
activities, changing the pricing used to estimate reserves at period end to a twelve month arithmetic average and additional disclosure requirements. In contrast to the SEC rule, the FASB does not permit the disclosure of probable and possible reserves in the supplemental oil and gas information in the notes to the financial statements. The amendments are effective for annual reporting periods ending on or after December 31, 2009. Application of the revised rules is prospective and companies are not required to change prior period presentation to conform to the amendments. Application of the amended guidance has resulted in changes to the prices used to determine proved reserves at December 31, 2009, which did not result in a significant change to our oil and natural gas reserves.
PV-10
The pre-tax present value of future net cash flows, or PV-10, is a non-GAAP measure because it excludes income tax effects. Management believes that pre-tax cash flow amounts are useful for evaluative purposes since future income taxes, which are affected by a company's unique tax position and strategies, can make after-tax amounts less comparable. We derive PV-10 based on the present value of estimated future revenues to be generated from the production of proved reserves, net of estimated production and future development costs and future plugging and abandonment costs, using the twelve-month arithmetic average of the first of the month prices (except that for periods prior to December 31, 2009, the period end price was used), without giving effect to hedging activities or future escalation, costs as of the date of estimate without future escalation, non-property related expenses such as general and administrative expenses, debt service and depreciation, depletion, amortization and impairment and income taxes, and discounted using an annual discount rate of 10%. The following table reconciles the standardized measure of future net cash flows to PV-10 as of the dates shown (in thousands):
| |
December 31, | |||||||||
|---|---|---|---|---|---|---|---|---|---|---|
| |
2007(1) | 2008(2) | 2009(3) | |||||||
Standardized measure of discounted future net cash flows |
$ | 1,655,641 | $ | 610,096 | $ | 692,805 | ||||
Add: Present value of future income tax discounted at 10% |
703,674 | 6,585 | 108,248 | |||||||
PV-10 |
$ | 2,359,315 | $ | 616,681 | $ | 801,053 | ||||
- (1)
- Based
on unescalated year-end posted prices of (i) $95.97 per Bbl for oil and natural gas liquids, and adjusted for quality,
transportation fees and regional price differentials and (ii) $7.48 per MMBtu for natural gas, and adjusted for energy content, transportation fees and regional price differentials.
- (2)
- Based
on unescalated year-end posted prices of $44.60 per Bbl for oil and natural gas liquids and $5.62 per MMBtu for natural gas, and adjusted,
in each case, as described in note (1) above.
- (3)
- Based on unescalated twelve month average of the first day of the month posted prices of $61.04 per Bbl for oil and natural gas liquids and $3.87 per MMBtu for natural gas, and adjusted, in each case, as described in note (1) above.
ITEM 7A. Quantitative and Qualitative Disclosures About Market Risk
This section provides information about derivative financial instruments we use to manage commodity price volatility. Due to the historical volatility of crude oil and natural gas prices, we have implemented a hedging strategy aimed at reducing the variability of the prices we receive for our production and providing a minimum revenue stream. Currently, we purchase puts and enter into other derivative transactions such as collars and fixed price swaps in order to hedge our exposure to changes
68
in commodity prices. All contracts are settled with cash and do not require the delivery of a physical quantity to satisfy settlement. While this hedging strategy may result in us having lower revenues than we would have if we were unhedged in times of higher oil and natural gas prices, management believes that the stabilization of prices and protection afforded us by providing a revenue floor on a portion of our production is beneficial. We may, from time to time, opportunistically restructure existing derivative contracts or enter into new transactions to effectively modify the terms of current contracts in order to improve the pricing parameters in existing contracts or realize the current value of our existing positions and use the proceeds from such transactions to secure additional contracts for periods in which we believe there is additional unmitigated commodity price risk.
This section also provides information about derivative financial instruments we use to manage interest rate risk. See "—Interest Rate Derivative Transactions."
Commodity Derivative Transactions
Commodity Derivative Agreements. As of December 31, 2009, we had entered into swap, collar and option agreements related to our oil and natural gas production as summarized below. Location and quality differentials attributable to our properties are not included in the following prices. The agreements provide for monthly settlement based on the differential between the agreement price and the actual NYMEX WTI (oil) or NYMEX Henry Hub (natural gas) price.
| |
Oil (NYMEX WTI) | Natural Gas (NYMEX Henry Hub) |
||||||||||||
|---|---|---|---|---|---|---|---|---|---|---|---|---|---|---|
| |
Barrels/day | Weighted Avg. Prices per Bbl |
MMBtu/day | Weighted Avg. Prices per MMBtu |
||||||||||
2010: |
||||||||||||||
Swaps |
1,000 | $66.75 | — | $— | ||||||||||
Collars(1) |
5,150 | $60.00/$86.53 | 17,900 | $7.19/$7.00 | ||||||||||
Calls(1) |
— | $— | 10,000 | $7.00 | ||||||||||
Puts |
1,850 | $40.00 | 41,000 | $6.00 | ||||||||||
2011: |
||||||||||||||
Collars(1) |
7,000 | $50.00/$141.64 | 12,000 | $7.50/$10.00 | ||||||||||
Puts |
— | $— | 24,000 | $6.00 | ||||||||||
2012: |
||||||||||||||
Collars(1) |
— | $— | 15,500 | $6.00/$9.10 | ||||||||||
Puts |
— | $— | 7,800 | $6.00 | ||||||||||
- (1)
- Reflects impact of call spreads, which are transactions we entered into for the purpose of modifying the ceiling (or call) portion of certain collar arrangements.
We also use natural gas basis swaps to fix the differential between the NYMEX Henry Hub price and the PG&E Citygate price, the index on which the majority of our natural gas is sold. Our natural gas basis swaps as of December 31, 2009 are presented below:
| |
Floating Index |
MMBtu/Day | Weighted Avg. Basis Differential to NYMEX HH (per MMBtu) |
|||||||
|---|---|---|---|---|---|---|---|---|---|---|
Basis Swaps: |
||||||||||
2010 |
PG&E Citygate |
51,618 |
$ |
0.14 |
||||||
2011 |
PG&E Citygate |
45,624 |
$ |
0.07 |
||||||
69
Portfolio of Derivative Transactions
Our portfolio of commodity derivative transactions as of December 31, 2009 is summarized below:
Oil
Type of Contract
|
Counterparty | Basis | Quantity (Bbl/d) |
Strike Price ($/Bbl) |
Term | ||||||||
|---|---|---|---|---|---|---|---|---|---|---|---|---|---|
Swap |
Fortis Bank | NYMEX | 1,000 | $66.75 | Jan 1 - Dec 31, 10 | ||||||||
Collar |
Bank of Oklahoma | NYMEX | 3,500 | $60.00/$73.00 | Jan 1 - Dec 31, 10 | ||||||||
Collar |
Fortis Bank | NYMEX | 1,000 | $60.00/$72.80 | Jan 1 - Dec 31, 10 | ||||||||
Collar |
Bank of Montreal | NYMEX | 650 | $60.00/$81.75 | Jan 1 - Dec 31, 10 | ||||||||
Call Spread |
Scotia Capital | NYMEX | 1,000 | $72.80/$95.00 | Jan 1 - Dec 31, 10 | ||||||||
Call Spread |
Credit Suisse | NYMEX | 3,500 | $73.00/$85.00 | Jan 1 - Dec 31, 10 | ||||||||
Put |
Scotia Capital | NYMEX | 1,850 | $40.00 | Jan 1 - Dec 31, 10 | ||||||||
Collar |
Key Bank | NYMEX | 2,000 | $50.00/$141.00 | Jan 1 - Dec 31, 11 | ||||||||
Collar |
Key Bank | NYMEX | 2,000 | $50.00/$144.75 | Jan 1 - Dec 31, 11 | ||||||||
Collar |
Credit Suisse | NYMEX | 3,000 | $50.00/$140.00 | Jan 1 - Dec 31, 11 | ||||||||
Natural Gas
Type of Contract
|
Counterparty | Basis | Quantity (MMBtu/d) |
Strike Price ($/MMBtu) |
Term | ||||||||
|---|---|---|---|---|---|---|---|---|---|---|---|---|---|
Collar |
Bank of Montreal | NYMEX | 1,000 | $7.00/$9.10 | Jan 1 - Dec 31, 10 | ||||||||
Collar |
Bank of Montreal | NYMEX | 900 | $7.50/$12.20 | Jan 1 - Dec 31, 10 | ||||||||
Collar |
Bank of Oklahoma | NYMEX | 10,000 | $7.00/$10.35 | Jan 1 - Dec 31, 10 | ||||||||
Collar |
Credit Suisse | NYMEX | 6,000 | $7.50/$11.95 | Jan 1 - Dec 31, 10 | ||||||||
Call |
RBS | NYMEX | 10,000 | $9.00 | Jan 1 - Dec 31, 10 | ||||||||
Call Spread |
RBS | NYMEX | 10,000 | $10.35/$9.00 | Jan 1 - Dec 31, 10 | ||||||||
Call Spread |
RBS | NYMEX | 900 | $12.20/$9.00 | Jan 1 - Dec 31, 10 | ||||||||
Call Spread |
Credit Suisse | NYMEX | 6,000 | $11.95/$9.00 | Jan 1 - Dec 31, 10 | ||||||||
Call Spread |
RBS | NYMEX | 26,900 | $9.00/$7.00 | Jan 1 - Dec 31, 10 | ||||||||
Call Spread |
RBS | NYMEX | 1,000 | $9.10/$7.00 | Jan 1 - Dec 31, 10 | ||||||||
Put |
Bank of Montreal | NYMEX | 41,000 | $6.00 | Jan 1 - Dec 31, 10 | ||||||||
Basis Swap |
Bank of Montreal | PG&E Citygate | 7,718 | $0.09 | Jan 1 - Dec 31, 10 | ||||||||
Basis Swap |
Bank of Oklahoma | PG&E Citygate | 10,000 | $0.22 | Jan 1 - Dec 31, 10 | ||||||||
Basis Swap |
Credit Suisse | PG&E Citygate | 7,900 | $0.05 | Jan 1 - Dec 31, 10 | ||||||||
Basis Swap |
Credit Suisse | PG&E Citygate | 12,000 | $0.20 | Jan 1 - Dec 31, 10 | ||||||||
Basis Swap |
Key Bank | PG&E Citygate | 14,000 | $0.10 | Jan 1 - Dec 31, 10 | ||||||||
Collar |
Credit Suisse | NYMEX | 12,000 | $7.50/$13.50 | Jan 1 - Dec 31, 11 | ||||||||
Call Spread |
RBS | NYMEX | 12,000 | $13.50/$10.00 | Jan 1 - Dec 31, 11 | ||||||||
Put |
Credit Suisse | NYMEX | 10,000 | $6.00 | Jan 1 - Dec 31, 11 | ||||||||
Put |
Key Bank | NYMEX | 14,000 | $6.00 | Jan 1 - Dec 31, 11 | ||||||||
Basis Swap |
Credit Suisse | PG&E Citygate | 12,000 | $0.03 | Jan 1 - Dec 31, 11 | ||||||||
Basis Swap |
Credit Suisse | PG&E Citygate | 16,000 | $0.14 | Jan 1 - Dec 31, 11 | ||||||||
Basis Swap |
RBS | PG&E Citygate | 11,000 | $0.04 | Jan 1 - Dec 31, 11 | ||||||||
Basis Swap |
Scotia Capital | PG&E Citygate | 6,624 | $0.03 | Jan 1 - Dec 31, 11 | ||||||||
Collar |
Credit Suisse | NYMEX | 15,500 | $6.00/$9.10 | Jan 1 - Dec 31, 12 | ||||||||
Put |
RBS | NYMEX | 7,800 | $6.00 | Jan 1 - Dec 31, 12 | ||||||||
70
In February 2010, we entered into the following series of transactions which modified certain of our existing derivative contracts and added additional derivative contracts to our hedging portfolio:
- •
- Repurchased the call option on our calendar 2011 $50.00/$144.75 oil collar (2,000 Bbl/d), thereby creating a $50.00 put on
2,000 Bbl/d for calendar 2011.
- •
- Repurchased the lower call option on our calendar 2011 $13.50/$10.00 natural gas call spread (12,000 MMbtu/d). This call
spread was previously paired with our calendar 2011 $7.50/$13.50 natural gas collar, creating a $7.50/$10.00 "net collar" on 12,000 MMbtu/d. The recent transaction effectively removes the ceiling on
the net collar, resulting in a $7.50 put on 12,000 MMbtu/d for calendar 2011.
- •
- Entered into the following costless natural gas collars:
- •
- 24,000 MMbtu/d at $5.75/$7.12 for calendar 2011
- •
- 14,000 MMbtu/d at $5.50/$8.00 for calendar 2012
- •
- Entered into the following natural gas basis swaps:
- •
- 11,600 MMbtu/d at $0.27 for calendar 2011
- •
- 47,400 MMbtu/d at $0.275 for calendar 2012
The following table summarizes the contracts added to our portfolio of commodity derivative transactions discussed above:
Natural Gas
Type of Contract
|
Counterparty | Basis | Quantity (MMBtu/d) |
Strike Price ($/MMBtu) |
Term | ||||||||
|---|---|---|---|---|---|---|---|---|---|---|---|---|---|
Collar |
BMO | NYMEX | 24,000 | $5.75/$7.12 | Jan 1 - Dec 31, 11 | ||||||||
Basis Swap |
Scotia Capital | PG&E Citygate | 11,600 | $0.27 | Jan 1 - Dec 31, 11 | ||||||||
Collar |
Credit Suisse | NYMEX | 14,000 | $5.50/$8.00 | Jan 1 - Dec 31, 12 | ||||||||
Basis Swap |
Credit Suisse | PG&E Citygate | 36,000 | $0.275 | Jan 1 - Dec 31, 12 | ||||||||
Basis Swap |
Key Bank | PG&E Citygate | 11,400 | $0.275 | Jan 1 - Dec 31, 12 | ||||||||
We enter into derivative contracts, primarily collars, swaps and option contracts, to hedge future crude oil and natural gas production in order to mitigate the risk of market price fluctuations. Most of our derivative contracts relate to changes in the market price relative to the applicable benchmark price; basis swap contracts relate to changes in the applicable differential. The objective of our hedging activities and the use of derivative financial instruments is to achieve more predictable cash flows. Our hedging activities seek to mitigate our exposure to price declines and allow us more flexibility to continue to execute our capital expenditure plan even if prices decline. Our collar and swap contracts, however, prevent us from receiving the full advantage of increases in oil or natural gas prices above the maximum fixed amount specified in the hedge agreement. Also, if production is less than the amount we have hedged and the price of oil or natural gas exceeds a fixed price in a hedge contract, we will be required to make payments against which there are no offsetting sales of production. This could impact our liquidity and our ability to fund future capital expenditures. If we were unable to satisfy such a payment obligation, that default could result in a cross-default under our revolving credit agreement. In addition, we have incurred, and may incur in the future, substantial unrealized commodity derivative losses in connection with our hedging activities, although we do not expect such losses to have a material effect on our liquidity or our ability to fund expected capital expenditures.
In addition, the use of derivatives involves the risk that the counterparties to such instruments will be unable to meet the financial terms of such contracts. Our derivative contracts are with multiple counterparties to minimize our exposure to any individual counterparty. We generally have netting
71
arrangements with our counterparties that provide for the offset of payables against receivables from separate derivative arrangements with that counterparty in the event of contract termination. The derivative contracts may be terminated by a non-defaulting party in the event of default by one of the parties to the agreement. All of the counterparties to our derivative contracts are also lenders, or affiliates of lenders, under our revolving credit facility. Therefore, we are not required to post collateral when we are in a derivative liability position. Our revolving credit facility and our derivative contracts contain provisions that provide for cross defaults and acceleration of those debt and derivative instruments in certain situations.
Lehman Brothers Commodity Services, Inc. ("LBCS") was a counterparty to several derivative contracts with us entered into between August 2006 and May 2008. In September 2008, Lehman Brothers Holdings Inc. ("LBH"), credit support provider for LBCS, filed for bankruptcy. The bankruptcy filing of LBH constituted an event of default under the ISDA Master Agreement between us and LBCS. Accordingly, we notified LBCS that we were terminating each of the outstanding transactions, effective immediately. Subsequent to our notification of termination, LBCS filed for bankruptcy protection. Similar issues could affect other hedge counterparties in the future.
Because a large portion of our commodity derivatives do not qualify for hedge accounting and to increase clarity in our financial statements, we elected to discontinue hedge accounting effective April 1, 2007. Consequently, from that date forward, we have recognized mark-to-market gains and losses in earnings currently, rather than deferring such amounts in accumulated other comprehensive income for those commodity derivatives that qualify as cash flow hedges.
All derivative instruments are recorded on the balance sheet at fair value. Fair value is generally determined based on the difference between the fixed contract price and the underlying market price at the determination date. Changes in the fair value of derivatives are recorded in commodity derivative gains (losses) on the consolidated statement of operations. As of December 31, 2009, the fair value of our commodity derivatives was a net asset of $14.9 million.
Interest Rate Derivative Transactions
We are subject to interest rate risk with respect to amounts borrowed under our credit facilities because those amounts bear interest at variable rates. As of February 22, 2010, there was approximately $552.3 million outstanding under those facilities. We entered into an interest rate swap transaction to limit our exposure to changes in interest rates with respect to $500.0 million of variable rate borrowings through September 2011 whereby we paid a fixed interest rate of 4.035% and received a floating interest rate based on the three-month LIBO rate. In connection with the extension of the maturity on our second lien term loan facility to May 2014, we entered into a revised interest rate swap agreement in October 2009 to extend the terms of the existing interest rate swap agreement from September 2011 to May 2014 and reduce the rate from 4.035% to a weighted average rate of 3.840%. As a result, $500 million of our variable rate debt will effectively bear interest at a fixed rate of approximately 7.8% until May 2014. Accordingly, we expect to be subject to interest rate risk until that time only with respect to variable rate borrowings in excess of $500.0 million. As of February 22, 2010, there was approximately $52.3 million borrowed in excess of the aforementioned $500.0 million. A 1.0% increase in interest rates on unhedged variable rate borrowings of $52.3 million at December 31, 2009 would result in additional annualized interest expense of $0.5 million. As of December 31, 2009, the fair value of our interest rate derivatives was a liability of $26.3 million.
See notes to our consolidated financial statements for a discussion of our long-term debt as of December 31, 2009.
ITEM 8. Financial Statements and Supplementary Data
See "Index to Financial Statements" on page F-1 of this report.
72
ITEM 9. Changes in and Disagreements With Accountants on Accounting and Financial Disclosure
None.
ITEM 9A. Controls and Procedures
Attached as exhibits to this report are certifications of our CEO and CFO required pursuant to Rule 13a-14 under the Exchange Act. This section includes information concerning the controls and procedures evaluation referred to in the certifications. Included in this report is the report of Ernst & Young LLP, our independent registered public accounting firm, regarding its audit of our internal control over financial reporting. This section should be read in conjunction with the certifications and the Ernst & Young LLP report for a more complete understanding of the topics presented.
Evaluation of Disclosure Controls and Procedures. We conducted an evaluation of the effectiveness of the design and operation of our disclosure controls and procedures (as defined in Rule 13a-15(e) under the Exchange Act) as of December 31, 2009. This evaluation was conducted under the supervision and with the participation of management, including our CEO and CFO. Based on this evaluation, our CEO and CFO have concluded that, subject to the limitations noted in this section, as of December 31, 2009, our disclosure controls and procedures were effective to provide reasonable assurance that information required to be disclosed by us in reports filed or submitted under the Exchange Act is recorded, processed, summarized and reported within the time periods specified by the rules and forms of the SEC. We also concluded that our disclosure controls and procedures are effective to provide reasonable assurance that information required to be disclosed in the reports filed or submitted under the Exchange Act is accumulated and communicated to our management, including our CEO and CFO, to allow timely decisions regarding required disclosure.
Management's Annual Report on Internal Control over Financial Reporting. Our management is responsible for establishing and maintaining adequate internal control over financial reporting (as defined in Rule 13a-15(f) under the Exchange Act) to provide reasonable assurance regarding the reliability of our financial reporting and the preparation of financial statements for external purposes in accordance with generally accepted accounting principles. Internal control over financial reporting includes those policies and procedures that (i) pertain to the maintenance of records that in reasonable detail accurately and fairly reflect the transactions and dispositions of assets of the company, (ii) provide reasonable assurance that transactions are recorded as necessary to permit preparation of financial statements in accordance with generally accepted accounting principles, and that receipts and expenditures of the company are being made only in accordance with authorizations of management and directors of the company and (iii) provide reasonable assurance regarding prevention or timely detection of unauthorized acquisition, use or disposition of the company's assets that could have a material effect on the financial statements.
Under the supervision and with the participation of our management, including our CEO and CFO, we assessed our internal control over financial reporting as of December 31, 2009, the end of our fiscal year. This assessment was based on criteria established in Internal Control—Integrated Framework issued by the Committee of Sponsoring Organizations of the Treadway Commission. Based on our assessment, management has concluded that our internal control over financial reporting was effective as of December 31, 2009.
The effectiveness of our internal control over financial reporting as of December 31, 2009 has been audited by Ernst & Young LLP, our independent registered public accounting firm, as stated in their report which is included herein.
Changes in Internal Control over Financial Reporting. There have been no changes in our internal control over financial reporting during the fourth quarter of 2009 that have materially affected, or are reasonably likely to materially affect, our internal control over financial reporting.
73
Inherent Limitations on Effectiveness of Controls. Because of its inherent limitations, internal control over financial reporting may not prevent or detect misstatements. All internal control systems, no matter how well designed, have inherent limitations. Therefore, even those systems determined to be effective can provide only reasonable assurance with respect to financial statement preparation and presentation. Additionally, projections of any evaluation of effectiveness to future periods are subject to the risk that controls may become inadequate because of changes in conditions, or that the degree of compliance with the policies or procedures may deteriorate.
None.
74
ITEM 10. Directors, Executive Officers and Corporate Governance
Information relating to this item will be included in an amendment to this report or in the proxy statement for our 2010 annual stockholders' meeting and is incorporated by reference in this report. Certain information concerning our executive officers is set forth in "Business and Properties—Executive Officers of the Registrant."
ITEM 11. Executive Compensation
Information relating to this item will be included in an amendment to this report or in the proxy statement for our 2010 annual stockholders' meeting and is incorporated by reference in this report.
ITEM 12. Security Ownership of Certain Beneficial Owners and Management and Related Stockholder Matters
Information relating to this item will be included in an amendment to this report or in the proxy statement for our 2010 annual stockholders' meeting and is incorporated by reference in this report.
ITEM 13. Certain Relationships and Related Transactions, and Director Independence
Information relating to this item will be included in an amendment to this report or in the proxy statement for our 2010 annual stockholders' meeting and is incorporated by reference in this report.
ITEM 14. Principal Accounting Fees and Services
Information relating to this item will be included in an amendment to this report or in the proxy statement for our 2010 annual stockholders' meeting and is incorporated by reference in this report.
ITEM 15. Exhibits and Financial Statement Schedules
Financial Statements and Financial Statement Schedules
See "Index to Consolidated Financial Statements" on page F-1.
Exhibits
| Exhibit Number |
Exhibit | ||
|---|---|---|---|
| 3.1 | Restated Certificate of Incorporation of Venoco, Inc. (incorporated by reference to Exhibit 3.1 to the Quarterly Report on Form 10-Q of Venoco, Inc. filed on November 17, 2005). | ||
3.2 |
Amended and Restated Bylaws of Venoco, Inc. (incorporated by reference to Exhibit 3.2 to the Current Report on Form 8-K of Venoco, Inc. filed on September 5, 2008). |
||
4.1 |
Indenture, dated as of October 7, 2009, by and among Venoco, Inc., the Guarantors named therein and U.S. Bank Trust National Association, as Trustee, relating to the 11.50% Senior Notes due 2017 (incorporated by reference to Exhibit 4.1 to the Current Report on Form 8-K of Venoco, Inc. filed on October 7, 2009). |
||
75
| Exhibit Number |
Exhibit | ||
|---|---|---|---|
| 10.1 | Third Amended and Restated Credit Agreement, dated as of December 21, 2009, by and among Venoco, Inc., the Guarantors identified therein, the Lenders party thereto, Bank of Montreal, as Administrative Agent, BMO Capital Markets, as Lead Arranger, The Bank of Nova Scotia and The Royal Bank of Scotland PLC, as Co-Syndication Agents and Key Bank National Association and Union Bank, N.A., as Co-Documentation Agents. (incorporated by reference to Exhibit 10.1 to the Current Report on Form 8-K of Venoco, Inc. filed on December 23, 2009). | ||
10.2 |
Term Loan Agreement, dated as of May 7, 2007, by and among Venoco, Inc., the Guarantors identified therein, the Lenders party thereto, Credit Suisse, Cayman Islands Branch, as Administrative Agent, UBS Securities LLC, as Syndication Agent, Credit Suisse Securities (USA) LLC and UBS Securities LLC, as Joint Lead Arrangers, Lehman Commercial Paper Inc. and Bank of Montreal, as Co-Documentation Agents, and Lehman Brothers Inc. and BMO Capital Markets Corp., as Co-Arrangers, and First Amendment to Term Loan Agreement, dated as of November 7, 2007 (incorporated by reference to Exhibit 10.2 to the Annual Report on Form 10-K of Venoco, Inc. filed on March 17, 2008). |
||
10.3 |
Collateral Trust Agreement, dated as of March 30, 2006, by and between Venoco, Inc. and Credit Suisse, Cayman Islands Branch, as Administrative Agent and Collateral Trustee (incorporated by reference to Exhibit 10.3 to the Annual Report on Form 10-K of Venoco, Inc. filed on April 5, 2006). |
||
10.4 |
Option Agreement, dated as of November 1, 2006, by and between TexCal Energy South Texas, L.P. and Denbury Onshore, LLC (incorporated by reference to Exhibit 10.1 to the Current Report on Form 8-K of Venoco, Inc. filed on November 9, 2006). |
||
10.4.1 |
First Amendment to Option Agreement, by and between TexCal Energy South Texas, L.P. and Denbury Onshore, LLC, dated as of August 29, 2008 (incorporated by reference to Exhibit 10.1 to the Current Report on Form 8-K of Venoco, Inc. filed on September 2, 2008). |
||
10.5 |
Venoco, Inc. 2008 Employee Stock Purchase Plan, dated as of November 18, 2008, as amended as of December 31, 2008 (incorporated by reference to Exhibit 10.6 to the Annual Report on Form 10-K of Venoco, Inc. filed on March 5, 2009). |
||
10.6 |
Venoco, Inc. 2000 Stock Incentive Plan (incorporated by reference to Exhibit 10.12 to the Registration Statement on Form S-4 of Venoco, Inc. filed on March 31, 2005). |
||
10.6.1 |
Amendment No. 1 to the Venoco, Inc. 2000 Stock Incentive Plan, dated as of November 17, 2008 (incorporated by reference to Exhibit 10.2 to the Current Report on Form 8-K of Venoco, Inc. filed on November 20, 2008). |
||
10.6.2 |
Form of Non-Qualified Stock Option Agreement for Non-Employee Directors Pursuant to the 2000 Stock Incentive Plan (incorporated by reference to Exhibit 10.3 to the Quarterly Report on Form 10-Q of Venoco, Inc. filed on November 17, 2005). |
||
10.6.3 |
Form of Non-Qualified Stock Option Agreement for Non-Executive Officer Employees Pursuant to the 2000 Stock Incentive Plan (incorporated by reference to Exhibit 10.4 to the Quarterly Report on Form 10-Q of Venoco, Inc. filed on November 17, 2005). |
||
10.6.4 |
Form of Amendment to Nonqualified Stock Option Agreement Pursuant to the 2000 Stock Incentive Plan (incorporated by reference to Exhibit 10.1 to the Current Report on Form 8-K of Venoco, Inc. filed on June 12, 2006). |
||
76
| Exhibit Number |
Exhibit | ||
|---|---|---|---|
| 10.6.5 | Form of Bonus Payment Agreement Relating to the 2000 Stock Incentive Plan (incorporated by reference to Exhibit 10.2 to the Current Report on Form 8-K of Venoco, Inc. filed on June 12, 2006). | ||
10.7 |
Venoco, Inc. Amended and Restated 2005 Stock Incentive Plan (incorporated by reference to Exhibit 10.1 to the Current Report on Form 8-K of Venoco, Inc. filed on May 12, 2006). |
||
10.7.1 |
Amendment No. 1 to the Venoco, Inc. Amended and Restated 2005 Stock Incentive Plan (incorporated by reference to Exhibit 10.1 to the Quarterly Report on Form 10-Q of Venoco, Inc. filed on May 15, 2007). |
||
10.7.2 |
Amendment No. 2 to the Venoco, Inc. Amended and Restated 2005 Stock Incentive Plan, dated as of November 17, 2008 (incorporated by reference to Exhibit 10.3 to the Current Report on Form 8-K of Venoco, Inc. filed on November 20, 2008). |
||
10.7.3 |
Amendment No. 3 to the Venoco, Inc. Amended and Restated 2005 Stock Incentive Plan. |
||
10.7.4 |
Form of Non-Qualified Stock Option Agreement Pursuant to the 2005 Stock Incentive Plan (incorporated by reference to Exhibit 10.2 the Current Report on Form 8-K of Venoco, Inc. filed on May 12, 2006). |
||
10.7.5 |
Form of Notice of Stock Award Pursuant to the Venoco, Inc. Amended and Restated 2005 Stock Incentive Plan and Stock Award Agreement, as amended (incorporated by reference to Exhibit 10.8.4 to the Annual Report on Form 10-K of Venoco, Inc. filed on March 5, 2009). |
||
10.7.6 |
2010 Form of Notice of Stock Award Pursuant to the Venoco, Inc. Amended and Restated 2005 Stock Incentive Plan. |
||
10.7.7 |
Venoco, Inc. 2007 Long-Term Incentive Program (incorporated by reference to Exhibit 10.2 to the Quarterly Report on Form 10-Q of Venoco, Inc. filed on May 15, 2007). |
||
10.8 |
Venoco, Inc. 2007 Senior Executive Bonus Plan, as amended (incorporated by reference to Exhibit 10.1 to the Quarterly Report on Form 10-Q of Venoco, Inc. filed on May 12, 2008). |
||
10.9 |
Employment Agreement, dated as of May 4, 2005, by and between Venoco, Inc. and Timothy Marquez (incorporated by reference to Exhibit 10.1 to the Quarterly Report on Form 10-Q of Venoco, Inc. filed on May 16, 2005). |
||
10.10.1 |
Employment Agreement, dated as of January 25, 2005, by and between Venoco, Inc. and William Schneider (incorporated by reference to Exhibit 10.11 to the Registration Statement on Form S-4 of Venoco, Inc. filed on March 31, 2005). |
||
10.10.2 |
Non-Qualified Stock Option Agreement, dated as of May 4, 2005, by and between Venoco, Inc. and William Schneider (incorporated by reference to Exhibit 10.6 to the Quarterly Report on Form 10-Q of Venoco, Inc. filed on May 16, 2005). |
||
10.11 |
Employment Agreement, dated as of March 19, 2007, by and between Venoco, Inc. and Timothy A. Ficker (incorporated by reference to Exhibit 10.14 to the Annual Report on Form 10-K of Venoco, Inc. filed on April 2, 2007). |
||
10.12.1 |
Employment Agreement, dated as of May 4, 2005, by and between Venoco, Inc. and Terry Anderson (incorporated by reference to Exhibit 10.5 to the Quarterly Report on Form 10-Q of Venoco, Inc. filed on May 16, 2005). |
||
10.12.2 |
Non-Qualified Stock Option Agreement, dated as of May 4, 2005, by and between Venoco, Inc. and Terry Anderson (incorporated by reference to Exhibit 10.10 to the Quarterly Report on Form 10-Q of Venoco, Inc. filed on May 16, 2005). |
||
77
| Exhibit Number |
Exhibit | ||
|---|---|---|---|
| 10.13 | Form of Amendment to Employment Agreement (incorporated by reference to Exhibit 10.1 to the Current Report on Form 8-K of Venoco, Inc. filed on July 12, 2006). | ||
10.14 |
Form of Indemnification Agreement (incorporated by reference to Exhibit 10.1 to the Current Report on Form 8-K of Venoco, Inc. filed on October 31, 2005). |
||
10.15 |
Registration Rights Agreement, dated as of August 25, 2006, by and between Venoco, Inc. and the Marquez Trust (incorporated by reference to Exhibit 10.1 to the Current Report on Form 8-K of Venoco, Inc. filed on August 31, 2006). |
||
10.15.1 |
Amendment to Registration Rights Agreement and Joinder, dated as of May 23, 2007, by and among Venoco, Inc., the Marquez Trust and the Marquez Foundation (incorporated by reference to Exhibit 10.1 to the Current Report on Form 8-K of Venoco, Inc. filed on May 25, 2007). |
||
10.16 |
Assignment and Subordination of Master Lease and Consent of Master Tenant, dated as of December 9, 2004, by and among 6267 Carpinteria Avenue, LLC, Venoco, Inc. and German American Capital Corporation (incorporated by reference to Exhibit 10.29 to the Annual Report on Form 10-K of Venoco, Inc. filed on April 5, 2006). |
||
10.17 |
Purchase and Sale Agreement, dated as of December 23, 2008, by and between Carpinteria Bluffs, LLC and Venoco, Inc. (incorporated by reference to Exhibit 10.1 to the Current Report on Form 8-K of Venoco, Inc. filed on December 29, 2008). |
||
21.1 |
Subsidiaries of the Registrant (incorporated by reference to Exhibit 21.1 to the Annual Report on Form 10-K of Venoco, Inc. filed on March 5, 2009). |
||
23.1 |
Consent of Ernst & Young LLP. |
||
23.2 |
Consent of Deloitte & Touche LLP. |
||
23.3 |
Consent of DeGolyer & MacNaughton. |
||
31.1 |
Certification of the Chief Executive Officer Pursuant to Section 302 of the Sarbanes-Oxley Act of 2002. |
||
31.2 |
Certification of the Chief Financial Officer Pursuant to Section 302 of the Sarbanes-Oxley Act of 2002. |
||
32 |
Certification of the Chief Executive Officer and Chief Financial Officer Pursuant to Section 906 of the Sarbanes-Oxley Act of 2002. |
||
99.1 |
Report of DeGolyer & MacNaughton Regarding the Registrant's Reserves as of December 31, 2009 and Addendum thereto. |
||
78
Pursuant to the requirements of Section 13 or 15(d) of the Securities Exchange Act of 1934, the registrant has duly caused this report to be signed on its behalf by the undersigned, thereunto duly authorized.
VENOCO, INC. |
||||
By: |
/s/ TIMOTHY M. MARQUEZ |
|||
| Name: | Timothy M. Marquez | |||
| Title: | Chairman and Chief Executive Officer | |||
| Date: | February 24, 2010 | |||
Pursuant to the requirements of the Securities Exchange Act of 1934, this report has been signed below by the following persons on behalf of the registrant and in the capacities and on the dates indicated.
Signature
|
Title
|
Date
|
||
|---|---|---|---|---|
| /s/ TIMOTHY M. MARQUEZ Timothy M. Marquez |
Chairman and Chief Executive Officer (Principal Executive Officer) |
February 24, 2010 | ||
/s/ TIMOTHY A. FICKER Timothy A. Ficker |
Chief Financial Officer (Principal Financial Officer) |
February 24, 2010 |
||
/s/ DOUGLAS J. GRIGGS Douglas J. Griggs |
Chief Accounting Officer (Principal Accounting Officer) |
February 24, 2010 |
||
/s/ DONNA L. LUCAS Donna L. Lucas |
Director |
February 24, 2010 |
||
/s/ J. C. MCFARLAND J. C. McFarland |
Director |
February 24, 2010 |
||
/s/ JOEL L. REED Joel L. Reed |
Director |
February 24, 2010 |
||
/s/ M. W. SCOGGINS M. W. Scoggins |
Director |
February 24, 2010 |
||
/s/ MARK A. SNELL Mark A. Snell |
Director |
February 24, 2010 |
||
/s/ RICHARD S. WALKER Richard S. Walker |
Director |
February 24, 2010 |
79
INDEX TO CONSOLIDATED FINANCIAL STATEMENTS
F-1
REPORT OF INDEPENDENT
REGISTERED PUBLIC ACCOUNTING FIRM
To
the Board of Directors and Stockholders of
Venoco, Inc.
Denver, Colorado
We have audited the accompanying consolidated balance sheet of Venoco, Inc. and subsidiaries (the "Company") as of December 31, 2009 and 2008, and the related consolidated statements of operations, comprehensive income (loss), changes in stockholders' equity, and cash flows for the years then ended. These financial statements are the responsibility of the Company's management. Our responsibility is to express an opinion on these financial statements based on our audits.
We conducted our audits in accordance with the standards of the Public Company Accounting Oversight Board (United States). Those standards require that we plan and perform the audits to obtain reasonable assurance about whether the financial statements are free of material misstatement. An audit includes examining, on a test basis, evidence supporting the amounts and disclosures in the financial statements. An audit also includes assessing the accounting principles used and significant estimates made by management, as well as evaluating the overall financial statement presentation. We believe that our audits provide a reasonable basis for our opinion.
In our opinion, the financial statements referred to above present fairly, in all material respects, the consolidated financial position of Venoco, Inc. and subsidiaries at December 31, 2009 and 2008, and the consolidated results of their operations and their cash flows for the years then ended, in conformity with U.S. generally accepted accounting principles.
As discussed in Note 1 to the consolidated financial statements, the Company has changed its reserve estimates and related disclosures as a result of adopting new oil and gas reserve estimation and disclosure requirements.
We have also audited, in accordance with the standards of the Public Company Accounting Oversight Board (United States), the Company's internal control over financial reporting as of December 31, 2009, based on the criteria established in Internal Control-Integrated Framework issued by the Committee of Sponsoring Organizations of the Treadway Commission and our report dated February 24, 2010 expressed an unqualified opinion thereon.
/s/ ERNST & YOUNG LLP
Denver,
Colorado
February 24, 2010
F-2
REPORT OF INDEPENDENT
REGISTERED PUBLIC ACCOUNTING FIRM
To
the Board of Directors and Stockholders of
Venoco, Inc.
Denver, Colorado
We have audited the accompanying consolidated statements of operations, comprehensive income (loss), changes in stockholders' equity, and cash flows of Venoco, Inc. and subsidiaries (the "Company") for the year ended December 31, 2007. These financial statements are the responsibility of the Company's management. Our responsibility is to express an opinion on these financial statements based on our audit.
We conducted our audit in accordance with the standards of the Public Company Accounting Oversight Board (United States). Those standards require that we plan and perform the audit to obtain reasonable assurance about whether the financial statements are free of material misstatement. An audit includes examining, on a test basis, evidence supporting the amounts and disclosures in the financial statements. An audit also includes assessing the accounting principles used and significant estimates made by management, as well as evaluating the overall financial statement presentation. We believe that our audit provides a reasonable basis for our opinion.
In our opinion, such consolidated financial statements present fairly, in all material respects, the results of operations and cash flows of Venoco, Inc. and subsidiaries for the year ended December 31, 2007, in conformity with accounting principles generally accepted in the United States of America.
/s/ DELOITTE & TOUCHE LLP
Denver,
Colorado
March 14, 2008
F-3
REPORT OF INDEPENDENT
REGISTERED PUBLIC ACCOUNTING FIRM
To
the Board of Directors and Stockholders of
Venoco, Inc.
Denver, Colorado
We have audited Venoco, Inc.'s (the "Company") internal control over financial reporting as of December 31, 2009, based on criteria established in Internal Control—Integrated Framework issued by the Committee of Sponsoring Organizations of the Treadway Commission (the COSO criteria). The Company's management is responsible for maintaining effective internal control over financial reporting, and for its assessment of the effectiveness of internal control over financial reporting included in the accompanying Management's Report on Internal Control Over Financial Reporting. Our responsibility is to express an opinion on the company's internal control over financial reporting based on our audit.
We conducted our audit in accordance with the standards of the Public Company Accounting Oversight Board (United States). Those standards require that we plan and perform the audit to obtain reasonable assurance about whether effective internal control over financial reporting was maintained in all material respects. Our audit included obtaining an understanding of internal control over financial reporting, assessing the risk that a material weakness exists, and testing and evaluating the design and operating effectiveness of internal control based on the assessed risk and performing such other procedures as we considered necessary in the circumstances. We believe that our audit provides a reasonable basis for our opinion.
A company's internal control over financial reporting is a process designed to provide reasonable assurance regarding the reliability of financial reporting and the preparation of financial statements for external purposes in accordance with generally accepted accounting principles. A company's internal control over financial reporting includes those policies and procedures that (1) pertain to the maintenance of records that, in reasonable detail, accurately and fairly reflect the transactions and dispositions of the assets of the company; (2) provide reasonable assurance that transactions are recorded as necessary to permit preparation of financial statements in accordance with generally accepted accounting principles, and that receipts and expenditures of the company are being made only in accordance with authorizations of management and directors of the company; and (3) provide reasonable assurance regarding prevention or timely detection of unauthorized acquisition, use, or disposition of the company's assets that could have a material effect on the financial statements.
Because of the inherent limitations, internal control over financial reporting may not prevent or detect misstatements. Also, projections of any evaluation of effectiveness to future periods are subject to the risk that controls may become inadequate because of changes in conditions, or that the degree of compliance with the policies or procedures may deteriorate.
In our opinion, the Company maintained, in all material respects, effective internal control over financial reporting as of December 31, 2009, based on the COSO criteria.
We also have audited, in accordance with the standards of the Public Company Accounting Oversight Board (United States), the consolidated balance sheets of the Company as of December 31, 2009 and 2008, and the related consolidated statements of operations, comprehensive income (loss), changes in stockholders' equity, and cash flows for the years then ended and our report dated February 24, 2010 expressed an unqualified opinion thereon.
/s/ ERNST & YOUNG LLP
Denver,
Colorado
February 24, 2010
F-4
VENOCO, INC. AND SUBSIDIARIES
CONSOLIDATED BALANCE SHEETS
(In thousands, except shares amounts)
| |
December 31, | |||||||||
|---|---|---|---|---|---|---|---|---|---|---|
| |
2008 | 2009 | ||||||||
ASSETS |
||||||||||
CURRENT ASSETS: |
||||||||||
Cash and cash equivalents |
$ | 191 | $ | 419 | ||||||
Accounts receivable, net of allowance for doubtful accounts of $750 and $900 at December 31, 2008 and 2009, respectively |
41,306 | 33,853 | ||||||||
Inventories |
12,361 | 6,139 | ||||||||
Prepaid expenses and other current assets |
4,314 | 4,276 | ||||||||
Income tax receivable |
546 | 3,116 | ||||||||
Deferred income taxes |
— | 8,400 | ||||||||
Commodity derivatives |
57,247 | 34,611 | ||||||||
Total current assets |
115,965 | 90,814 | ||||||||
PROPERTY, PLANT AND EQUIPMENT, AT COST: |
||||||||||
Oil and natural gas properties (full cost method, of which $30,228 and $31,934 for unproved properties were excluded from amortization at December 31, 2008 and 2009, respectively) |
1,671,799 | 1,672,901 | ||||||||
Drilling equipment |
14,460 | 14,460 | ||||||||
Other property and equipment |
22,932 | 20,608 | ||||||||
Total property, plant and equipment |
1,709,191 | 1,707,969 | ||||||||
Accumulated depletion, depreciation and amortization |
(1,006,457 | ) | (1,088,539 | ) | ||||||
Net property, plant and equipment |
702,734 | 619,430 | ||||||||
OTHER ASSETS: |
||||||||||
Commodity derivatives |
35,314 | 18,720 | ||||||||
Deferred loan costs |
7,458 | 7,908 | ||||||||
Other |
2,783 | 2,671 | ||||||||
Total other assets |
45,555 | 29,299 | ||||||||
TOTAL ASSETS |
$ | 864,254 | $ | 739,543 | ||||||
LIABILITIES AND STOCKHOLDERS' EQUITY |
||||||||||
CURRENT LIABILITIES: |
||||||||||
Accounts payable and accrued liabilities |
$ | 75,400 | $ | 48,709 | ||||||
Undistributed revenue payable |
8,277 | 8,146 | ||||||||
Interest payable |
5,325 | 4,885 | ||||||||
Current maturities of long-term debt |
2,598 | — | ||||||||
Commodity and interest derivatives |
21,284 | 49,709 | ||||||||
Total current liabilities |
112,884 | 111,449 | ||||||||
LONG-TERM DEBT |
797,670 | 695,029 | ||||||||
COMMODITY AND INTEREST DERIVATIVES |
9,363 | 15,076 | ||||||||
ASSET RETIREMENT OBLIGATIONS |
79,504 | 92,485 | ||||||||
Total liabilities |
999,421 | 914,039 | ||||||||
COMMITMENTS AND CONTINGENCIES |
||||||||||
STOCKHOLDERS' EQUITY: |
||||||||||
Common stock, $.01 par value (200,000,000 shares authorized; 51,548,990 and 52,513,397 shares issued and outstanding at December 31, 2008 and 2009, respectively) |
515 | 525 | ||||||||
Additional paid-in capital |
319,336 | 325,871 | ||||||||
Retained earnings (accumulated deficit) |
(453,594 | ) | (500,892 | ) | ||||||
Accumulated other comprehensive loss |
(1,424 | ) | — | |||||||
Total stockholders' equity |
(135,167 | ) | (174,496 | ) | ||||||
TOTAL LIABILITIES AND STOCKHOLDERS' EQUITY |
$ | 864,254 | $ | 739,543 | ||||||
See notes to consolidated financial statements.
F-5
VENOCO, INC. AND SUBSIDIARIES
CONSOLIDATED STATEMENTS OF OPERATIONS
(In thousands, except per share amounts)
| |
Years Ended December 31, | |||||||||||
|---|---|---|---|---|---|---|---|---|---|---|---|---|
| |
2007 | 2008 | 2009 | |||||||||
REVENUES: |
||||||||||||
Oil and natural gas sales |
$ | 373,155 | $ | 555,917 | $ | 268,865 | ||||||
Other |
3,355 | 3,603 | 3,331 | |||||||||
Total revenues |
376,510 | 559,520 | 272,196 | |||||||||
EXPENSES: |
||||||||||||
Oil and natural gas production |
119,321 | 149,504 | 105,341 | |||||||||
Transportation |
6,061 | 5,958 | 4,865 | |||||||||
Depletion, depreciation and amortization |
98,814 | 134,483 | 86,226 | |||||||||
Impairment of oil and natural gas properties |
— | 641,000 | — | |||||||||
Accretion of asset retirement obligations |
3,914 | 4,203 | 5,765 | |||||||||
General and administrative, net of amounts capitalized |
31,770 | 43,101 | 36,939 | |||||||||
Total expenses |
259,880 | 978,249 | 239,136 | |||||||||
Income (loss) from operations |
116,630 | (418,729 | ) | 33,060 | ||||||||
FINANCING COSTS AND OTHER: |
||||||||||||
Interest expense, net |
60,115 | 54,049 | 40,984 | |||||||||
Amortization of deferred loan costs |
4,197 | 3,344 | 2,862 | |||||||||
Interest rate derivative losses (gains), net |
17,177 | 20,567 | 16,676 | |||||||||
Loss on extinguishment of debt |
12,063 | — | 8,493 | |||||||||
Commodity derivative losses (gains), net |
142,650 | (116,757 | ) | 25,743 | ||||||||
Total financing costs and other |
236,202 | (38,797 | ) | 94,758 | ||||||||
Income (loss) before income taxes |
(119,572 | ) | (379,932 | ) | (61,698 | ) | ||||||
INCOME TAXES: |
||||||||||||
Current |
1,100 | 6,300 | (6,000 | ) | ||||||||
Deferred |
(47,300 | ) | 4,900 | (8,400 | ) | |||||||
Income tax provision (benefit) |
(46,200 | ) | 11,200 | (14,400 | ) | |||||||
Net income (loss) |
$ | (73,372 | ) | $ | (391,132 | ) | $ | (47,298 | ) | |||
Earnings per common share: |
||||||||||||
Basic |
$ | (1.58 | ) | $ | (7.75 | ) | $ | (0.93 | ) | |||
Diluted |
$ | (1.58 | ) | $ | (7.75 | ) | $ | (0.93 | ) | |||
Weighted average common shares outstanding: |
||||||||||||
Basic |
46,372 | 50,486 | 50,805 | |||||||||
Diluted |
46,372 | 50,486 | 50,805 | |||||||||
See notes to consolidated financial statements.
F-6
VENOCO, INC. AND SUBSIDIARIES
CONSOLIDATED STATEMENTS OF COMPREHENSIVE INCOME (LOSS)
(In thousands)
| |
Years Ended December 31, | |||||||||||
|---|---|---|---|---|---|---|---|---|---|---|---|---|
| |
2007 | 2008 | 2009 | |||||||||
Net income (loss) |
$ | (73,372 | ) | $ | (391,132 | ) | $ | (47,298 | ) | |||
OTHER COMPREHENSIVE INCOME (LOSS), NET OF INCOME TAX: |
||||||||||||
Hedging activities: |
||||||||||||
Reclassification adjustments for settled contracts(1) |
2,877 | 905 | 1,424 | |||||||||
Changes in fair value of outstanding hedging positions(2) |
(2,740 | ) | — | — | ||||||||
Other comprehensive income (loss) |
137 | 905 | 1,424 | |||||||||
Comprehensive income (loss) |
$ | (73,235 | ) | $ | (390,227 | ) | $ | (45,874 | ) | |||
- (1)
- Net
of income tax expense (benefit) of $1,840, $532 and $899 for the years ended December 31, 2007, 2008 and 2009, respectively.
- (2)
- Net
of income tax expense (benefit) of $(1,722), $0 and $0 for the years ended December 31, 2007, 2008 and 2009, respectively.
See notes to consolidated financial statements.
F-7
VENOCO, INC. AND SUBSIDIARIES
CONSOLIDATED STATEMENTS OF CHANGES IN STOCKHOLDERS' EQUITY
(In thousands)
| |
Common Stock | |
|
Accumulated Other Comprehensive Income (Loss) |
|
||||||||||||||||
|---|---|---|---|---|---|---|---|---|---|---|---|---|---|---|---|---|---|---|---|---|---|
| |
Additional Paid-in Capital |
Retained Earnings (Deficit) |
|
||||||||||||||||||
| |
Shares | Amount | Total | ||||||||||||||||||
BALANCE AT DECEMBER 31, 2006 |
42,783 | $ | 428 | $ | 181,444 | $ | 10,910 | $ | (2,466 | ) | $ | 190,316 | |||||||||
Comprehensive income: |
|||||||||||||||||||||
Reclassification adjustment for settled contracts, net of tax |
— | — | — | — | 2,877 | 2,877 | |||||||||||||||
Change in value of derivatives, net of tax |
— | — | — | — | (2,740 | ) | (2,740 | ) | |||||||||||||
Issuance of stock, net of underwriters' discounts |
6,565 | 65 | 116,530 | — | — | 116,595 | |||||||||||||||
Stock issuance costs |
— | — | (561 | ) | — | — | (561 | ) | |||||||||||||
Issuance of stock for acquisition of oil and gas properties |
171 | 2 | 3,028 | — | — | 3,030 | |||||||||||||||
Issuance of stock for cash upon exercise of options |
703 | 7 | 4,770 | — | — | 4,777 | |||||||||||||||
Issuance of restricted shares |
371 | 4 | (4 | ) | — | — | — | ||||||||||||||
Share-based compensation |
— | — | 4,680 | — | — | 4,680 | |||||||||||||||
Net income (loss) |
— | — | — | (73,372 | ) | — | (73,372 | ) | |||||||||||||
BALANCE AT DECEMBER 31, 2007 |
50,593 | 506 | 309,887 | (62,462 | ) | (2,329 | ) | 245,602 | |||||||||||||
Comprehensive income: |
|||||||||||||||||||||
Reclassification adjustment for settled contracts, net of tax |
— | — | — | — | 905 | 905 | |||||||||||||||
Issuance of stock for cash upon exercise of options |
451 | 5 | 2,951 | — | — | 2,956 | |||||||||||||||
Issuance of restricted shares, net of cancellations |
516 | 5 | (5 | ) | — | — | — | ||||||||||||||
Restricted stock used for tax withholding |
(11 | ) | (1 | ) | (156 | ) | — | — | (157 | ) | |||||||||||
Share-based compensation |
— | — | 5,710 | — | — | 5,710 | |||||||||||||||
Disgorgement of stock sale profits |
— | — | 949 | — | — | 949 | |||||||||||||||
Net income (loss) |
— | — | — | (391,132 | ) | — | (391,132 | ) | |||||||||||||
BALANCE AT DECEMBER 31, 2008 |
51,549 | 515 | 319,336 | (453,594 | ) | (1,424 | ) | (135,167 | ) | ||||||||||||
Comprehensive income: |
|||||||||||||||||||||
Reclassification adjustment for settled contracts, net of tax |
— | — | 899 | — | 1,424 | 2,323 | |||||||||||||||
Issuance of stock for cash upon exercise of options |
66 | 1 | 680 | — | — | 681 | |||||||||||||||
Issuance of restricted shares, net of cancellations |
835 | 8 | (8 | ) | — | — | — | ||||||||||||||
Share-based compensation |
— | — | 4,590 | — | — | 4,590 | |||||||||||||||
Issuance of common stock pursuant to Employee Stock Purchase Plan |
63 | 1 | 359 | — | — | 360 | |||||||||||||||
Disgorgement of stock sale profits |
— | — | 15 | — | — | 15 | |||||||||||||||
Net income (loss) |
— | — | — | (47,298 | ) | — | (47,298 | ) | |||||||||||||
BALANCE AT DECEMBER 31, 2009 |
52,513 | $ | 525 | $ | 325,871 | $ | (500,892 | ) | $ | — | $ | (174,496 | ) | ||||||||
See notes to consolidated financial statements.
F-8
VENOCO, INC. AND SUBSIDIARIES
CONSOLIDATED STATEMENTS OF CASH FLOWS
(In thousands)
| |
Years Ended December 31, | ||||||||||||
|---|---|---|---|---|---|---|---|---|---|---|---|---|---|
| |
2007 | 2008 | 2009 | ||||||||||
CASH FLOWS FROM OPERATING ACTIVITIES: |
|||||||||||||
Net income (loss) |
$ | (73,372 | ) | $ | (391,132 | ) | $ | (47,298 | ) | ||||
Adjustments to reconcile net income (loss) to net cash provided by operating activities: |
|||||||||||||
Depletion, depreciation and amortization |
98,814 | 134,483 | 86,226 | ||||||||||
Impairment of oil and natural gas properties |
— | 641,000 | — | ||||||||||
Accretion of asset retirement obligations |
3,914 | 4,203 | 5,765 | ||||||||||
Deferred income tax provision (benefit) |
(47,300 | ) | 4,900 | (8,400 | ) | ||||||||
Share-based compensation |
4,680 | 3,064 | 2,824 | ||||||||||
Amortization of deferred loan costs |
4,197 | 3,344 | 2,862 | ||||||||||
Loss on extinguishment of debt |
12,063 | — | 8,493 | ||||||||||
Amortization of bond discounts and other non-cash interest |
700 | 519 | 479 | ||||||||||
Unrealized interest rate swap derivative (gains) losses |
17,312 | 10,336 | (1,803 | ) | |||||||||
Unrealized commodity derivative (gains) losses and amortization of premiums and other comprehensive loss |
134,325 | (176,768 | ) | 96,496 | |||||||||
Changes in operating assets and liabilities: |
|||||||||||||
Accounts receivable |
(10,055 | ) | 14,291 | 7,491 | |||||||||
Inventories |
(7,166 | ) | (1,984 | ) | (2,205 | ) | |||||||
Prepaid expenses and other current assets |
2,606 | (63 | ) | 81 | |||||||||
Income tax receivable |
1,373 | 6,179 | (2,570 | ) | |||||||||
Other assets |
(2,551 | ) | 1,558 | 112 | |||||||||
Accounts payable and accrued liabilities |
29,632 | 3,695 | (11,629 | ) | |||||||||
Undistributed revenue payable |
(4,298 | ) | (3,021 | ) | 769 | ||||||||
Net premiums paid on derivative contracts |
(4,011 | ) | (42,225 | ) | (19,002 | ) | |||||||
Net cash provided by (used in) operating activities |
160,863 | 212,379 | 118,691 | ||||||||||
CASH FLOWS FROM INVESTING ACTIVITIES: |
|||||||||||||
Expenditures for oil and natural gas properties |
(316,894 | ) | (311,173 | ) | (174,824 | ) | |||||||
Acquisitions of oil and natural gas properties |
(121,822 | ) | (14,279 | ) | (22,794 | ) | |||||||
Expenditures for drilling equipment |
(847 | ) | — | — | |||||||||
Expenditures for other property and equipment |
(4,542 | ) | (7,409 | ) | (1,988 | ) | |||||||
Proceeds from sale of oil and natural gas properties |
10,742 | — | 197,653 | ||||||||||
Net cash provided by (used in) investing activities |
(433,363 | ) | (332,861 | ) | (1,953 | ) | |||||||
CASH FLOWS FROM FINANCING ACTIVITIES: |
|||||||||||||
Proceeds from long-term debt |
777,421 | 260,052 | 276,562 | ||||||||||
Principal payments on long-term debt |
(619,729 | ) | (169,892 | ) | (382,280 | ) | |||||||
Payments for deferred loan costs |
(4,923 | ) | (963 | ) | (5,221 | ) | |||||||
Payments to retire debt |
(3,489 | ) | — | (6,627 | ) | ||||||||
Proceeds from derivative premium financing |
3,780 | 17,993 | — | ||||||||||
Proceeds from issuance of common stock and other stock activity |
116,034 | (162 | ) | 360 | |||||||||
Proceeds from exercise of stock options |
4,777 | 2,961 | 681 | ||||||||||
Proceeds from disgorgement of stock sale profits |
— | 949 | 15 | ||||||||||
Net cash provided by (used in) financing activities |
273,871 | 110,938 | (116,510 | ) | |||||||||
Net (decrease) increase in cash and cash equivalents |
1,371 | (9,544 | ) | 228 | |||||||||
Cash and cash equivalents, beginning of period |
8,364 | 9,735 | 191 | ||||||||||
Cash and cash equivalents, end of period |
$ | 9,735 | $ | 191 | $ | 419 | |||||||
Supplemental Disclosure of Cash Flow Information— |
|||||||||||||
Cash paid for interest |
$ | 58,650 | $ | 55,350 | $ | 40,990 | |||||||
Cash paid (received) for income taxes |
$ | (273 | ) | $ | 124 | $ | (3,430 | ) | |||||
Supplemental Disclosure of Noncash Activities— |
|||||||||||||
(Decrease) increase in accrued capital expenditures |
$ | 3,165 | $ | (12,477 | ) | $ | (14,968 | ) | |||||
Common stock issued for the acquisition of oil and natural gas properties |
$ | 3,030 | $ | — | $ | — | |||||||
Write off of deferred financing costs related to 8.75% senior notes |
$ | — | $ | — | $ | 1,866 | |||||||
See notes to consolidated financial statements.
F-9
VENOCO, INC. AND SUBSIDIARIES
NOTES TO CONSOLIDATED FINANCIAL STATEMENTS
YEARS ENDED DECEMBER 31, 2007, 2008 AND 2009
1. SUMMARY OF SIGNIFICANT ACCOUNTING POLICIES
Description of Operations Venoco, Inc. ("Venoco" or the "Company"), a Delaware corporation, is engaged in the acquisition, exploration, exploitation and development of oil and natural gas properties with a focus on properties offshore and onshore in California and onshore in Texas.
Principles of Consolidation The consolidated financial statements include the accounts of the Company and its subsidiaries, all of which are wholly owned. All intercompany balances and transactions have been eliminated in consolidation.
Use of Estimates The preparation of financial statements in conformity with accounting principles generally accepted in the United States of America requires management to make estimates and assumptions that affect the reported amounts of assets and liabilities and disclosure of contingent assets and liabilities at the date of the financial statements and the reported amounts of revenues and expenses during the reporting period. Items subject to such estimates and assumptions include (1) oil and gas reserves; (2) cash flow estimates used in impairment tests of long-lived assets; (3) depreciation, depletion and amortization; (4) asset retirement obligations; (5) assigning fair value and allocating purchase price in connection with business combinations; (6) accrued revenue and related receivables; (7) valuation of commodity and interest derivative instruments; (8) accrued liabilities; (9) valuation of share-based payments and (10) income taxes. Although management believes these estimates are reasonable, actual results could differ from these estimates. The Company has evaluated subsequent events and transactions through February 24, 2010, which is the date these financial statements were issued, for matters that require recognition or disclosure in these financial statements.
Business Segment Information The Company has evaluated how it is organized and managed and has identified only one operating segment, which is the exploration and production of crude oil, natural gas and natural gas liquids. The Company considers its gathering, processing and marketing functions as ancillary to its oil and gas producing activities. All of the Company's operations and assets are located in the United States, and all of its revenues are attributable to United States customers.
Concentration of Credit Risk The Company's accounts receivable result from (i) oil and natural gas sales to oil and intrastate gas pipeline companies and (ii) billings to joint working interest partners in properties operated by the Company. The Company's trade and accrued production receivables are dispersed among various customers and purchasers and most of the Company's significant purchasers are large companies with solid credit ratings. If customers are considered a credit risk, letters of credit are the primary security obtained to support the extension of credit. For most joint working interest partners, the Company may have the right of offset against related oil and natural gas revenues. The Company recorded an allowance for doubtful accounts as of December 31, 2008 and 2009 of $0.8 million and $0.9 million, respectively, for customer and joint working interest partner accounts. As of December 31, 2009, 41%, 25%, 13% and 10% of the total accounts receivable balance was receivable from the Company's four major customers.
F-10
VENOCO, INC. AND SUBSIDIARIES
NOTES TO CONSOLIDATED FINANCIAL STATEMENTS (Continued)
YEARS ENDED DECEMBER 31, 2007, 2008 AND 2009
1. SUMMARY OF SIGNIFICANT ACCOUNTING POLICIES (Continued)
The following table provides the percentage of revenue derived from oil and natural gas sales to the Company's top four customers (the customers in each year are not necessarily the same from year to year):
| |
Years Ended December 31, |
|||||||||
|---|---|---|---|---|---|---|---|---|---|---|
| |
2007 | 2008 | 2009 | |||||||
Customer A |
30 | % | 32 | % | 41 | % | ||||
Customer B |
29 | % | 27 | % | 27 | % | ||||
Customer C |
17 | % | 16 | % | 10 | % | ||||
Customer D |
12 | % | 12 | % | 5 | % | ||||
Revenue Recognition and Gas Imbalances Revenues from the sale of natural gas and crude oil are recognized when the product is delivered at a fixed or determinable price, title has transferred, collectability is reasonably assured and evidenced by a contract. This generally occurs when a barge completes delivery, oil or natural gas has been delivered to a refinery or a pipeline, or has otherwise been transferred to a customer's facilities or possession. Oil revenues are generally recognized based on actual volumes of completed deliveries where title has transferred. Title to oil sold is typically transferred at the wellhead, except in the case of the South Ellwood field, where title is transferred when the barge that transports production from the field completes delivery.
The Company uses the entitlement method of accounting for natural gas revenues. Under this method, revenues are recognized based on actual production of natural gas. The Company incurs production gas volume imbalances in the ordinary course of business. Net deliveries in excess of entitled amounts are recorded as liabilities, while net under-deliveries are reflected as assets. Imbalances are reduced either by subsequent recoupment of over- and under- deliveries or by cash settlement, as required by applicable contracts. The Company's production imbalances were not material at December 31, 2008 and 2009.
Other revenues primarily include pipeline revenues and amounts received from purchasers of oil production to reimburse the Company for transportation and barge expenses.
Cash and Cash Equivalents Cash and cash equivalents consist of cash and liquid investments with an original maturity of three months or less.
Inventories Included in inventories are oil field materials and supplies, stated at the lower of cost or market, cost being determined by the first-in, first-out method.
Crude Oil Inventories Crude oil inventories are carried at the lower of current market value or cost. Inventory costs include expenditures and other charges incurred in bringing the inventory to its existing condition and location.
Recent Accounting Pronouncements Regarding Oil and Natural Gas Resources
In December 2008, the SEC published revised rules regarding oil and gas reserves reporting requirements. The objective of the revised rules is to provide readers of financial statements with more meaningful and comprehensive understanding of oil and gas reserves. Key elements of the revised rules
F-11
VENOCO, INC. AND SUBSIDIARIES
NOTES TO CONSOLIDATED FINANCIAL STATEMENTS (Continued)
YEARS ENDED DECEMBER 31, 2007, 2008 AND 2009
1. SUMMARY OF SIGNIFICANT ACCOUNTING POLICIES (Continued)
include a change in the pricing used to estimate reserves at period end, certain revised definitions, optional disclosure of probable and possible reserves, allowance of the use of new technologies in the determination of reserves and additional disclosure requirements. The rules also revise the prices used for reserves in determining depletion and the full cost ceiling test from a period end price to a twelve month average of the first day of the month prices. The revised rules are effective for annual reporting periods ending on or after December 31, 2009. Application of the revised rules has resulted in changes to the prices used to determine proved reserves at December 31, 2009, as well as additional disclosures.
In January 2010, the Financial Accounting Standards Board ("FASB") issued an Accounting Standards Update ("ASU") to amend existing oil and gas reserve accounting and disclosure guidance to align its requirements with the SEC's revised rules discussed above. The significant revisions involve revised definitions of oil and gas producing activities, changing the pricing used to estimate reserves at period end to a twelve month average of the first day of the month prices and additional disclosure requirements. In contrast to the SEC rule, the FASB does not permit the disclosure of probable and possible reserves in the supplemental oil and gas information in the notes to the financial statements. The amendments are effective for annual reporting periods ending on or after December 31, 2009. Application of the revised rules is prospective and companies are not required to change prior period presentation to conform to the amendments.
Oil and Natural Gas Properties The Company's oil and natural gas producing activities are accounted for using the full cost method of accounting. Accordingly, the Company capitalizes all costs incurred in connection with the acquisition of oil and natural gas properties and with the exploration for and development of oil and natural gas reserves. Proceeds from the disposition of oil and natural gas properties are accounted for as adjustments to the full cost pool, with no gain or loss recognized unless the adjustment would significantly alter the relationship between capitalized costs and proved reserves.
Depletion of the capitalized costs of oil and natural gas properties, including estimated future development and abandonment costs, is provided for using the equivalent unit-of-production method based upon estimates of proved oil and natural gas reserves. Depletion expense for the years ended December 31, 2007, 2008, and 2009 was $94.7 million, $129.4 million, and $81.3 million, respectively ($13.29, $16.31, and $10.80, respectively, per equivalent barrel of oil). The Company calculated fourth quarter depletion expense based on the year-end reserve report. Therefore the reserves used to calculate the fourth quarter of 2009 depletion expense are determined on a different basis than the reserves used for the first three quarters of 2009 due to the change to pricing applied to year-end reserves pursuant to the revised FASB oil and gas reserves guidance. The prices used to determine the reserves at December 31, 2009 are based on the unescalated twelve month arithmetic average of the prices in effect on the of the month, whereas the reserves used in the prior quarters were based on the prices in effect at period end. The impact of the change in pricing methodology is immaterial.
Unproved property costs not subject to amortization consist primarily of leasehold costs related to unproved areas. Costs are transferred into the amortization base on an ongoing basis as the properties are evaluated and proved reserves are established or impairment is determined. Costs of dry holes are transferred to the amortization base immediately upon determination that the well is unsuccessful. The Company will continue to evaluate these properties and costs which will be transferred into the amortization base as the undeveloped areas are tested. The Company did not transfer any unproved
F-12
VENOCO, INC. AND SUBSIDIARIES
NOTES TO CONSOLIDATED FINANCIAL STATEMENTS (Continued)
YEARS ENDED DECEMBER 31, 2007, 2008 AND 2009
1. SUMMARY OF SIGNIFICANT ACCOUNTING POLICIES (Continued)
costs to the amortization base as a result of impairment in 2007 and transferred $2.4 million and $9.7 million into the amortization base in 2008 and 2009, respectively, due to impairment. No interest costs were capitalized in 2007, 2008 or 2009 because the Company did not have any unusually significant investments in unproved properties that qualify for interest capitalization.
In accordance with the full cost method of accounting, the net capitalized costs of oil and natural gas properties are subject to a ceiling based upon the related estimated future net revenues, discounted at 10 percent, net of tax considerations, plus the lower of cost or estimated fair value of unproved properties. Effective December 31, 2009, the ceiling test is calculated using proved reserves based on a twelve month arithmetic average of the oil and natural gas prices in effect on the first of each month. For all periods prior to December 31, 2008, the ceiling test was calculated using proved reserves valued at the applicable year-end oil and natural gas prices. Due to lower oil and natural gas prices at December 31, 2008, the Company's net capitalized costs exceeded the ceiling by $641.0 million, net of income tax effects, and the Company recorded an impairment of oil and natural gas properties in the same amount. The Company did not record an impairment at December 31, 2009; however, the Company could be required to recognize additional impairments of oil and natural gas properties in future periods if market prices of oil and natural gas decline.
General and Administrative Expenses Under the full cost method of accounting, the Company capitalizes a portion of general and administrative expenses that are directly identified with acquisition, exploration and development activities. These capitalized costs include salaries, employee benefits, costs of consulting services and other specifically identifiable costs and do not include costs related to production operations, general corporate overhead or similar activities. The Company capitalized general and administrative costs of $11.8 million, $18.8 million, and $25.1 million directly related to its acquisition, exploration and development activities during 2007, 2008 and 2009, respectively.
Drilling Equipment and Other Property and Equipment Drilling equipment and other property and equipment, which includes buildings, leasehold improvements, office and other equipment, are stated at cost. Depreciation and amortization are calculated using the straight-line method over the estimated useful lives of the related assets, ranging from 3 to 25 years. Depreciation and amortization expense for the years ended December 31, 2007, 2008 and 2009 was $4.1 million, $5.1 million and $4.9 million, respectively.
Derivative Financial Instruments The Company enters into derivative contracts, primarily collars, swaps and option contracts, to hedge future crude oil and natural gas production in order to mitigate the risk of market price fluctuations. All derivative instruments are recorded on the balance sheet at fair value. All of the Company's derivative counterparties are commercial banks that are parties to its revolving credit facility.
If the derivative does not qualify as a hedge or is not designated as a hedge, the gain or loss on the derivative is recognized currently in earnings as a component of financing costs and other. If the derivative qualifies for cash flow hedge accounting, the gain or loss on the derivative is deferred in Accumulated Other Comprehensive Income (Loss) ("OCI"), a component of Stockholders' Equity, to the extent the hedge is effective. Gains and losses are reclassified from OCI to the income statement as a component of revenues in the period the hedged production occurs.
F-13
VENOCO, INC. AND SUBSIDIARIES
NOTES TO CONSOLIDATED FINANCIAL STATEMENTS (Continued)
YEARS ENDED DECEMBER 31, 2007, 2008 AND 2009
1. SUMMARY OF SIGNIFICANT ACCOUNTING POLICIES (Continued)
Because a large portion of the Company's commodity derivatives did not qualify for hedge accounting, the Company elected to discontinue hedge accounting prospectively for its commodity derivatives beginning April 1, 2007. Consequently, from that date forward, the Company has recognized mark-to-market gains and losses in earnings currently, rather than deferring such amounts in OCI for those commodity derivatives that qualify as cash flow hedges.
The Company has also entered into interest rate swap contracts to mitigate the risk of interest rate fluctuations on $500 million of borrowings under its variable rate credit facilities. The Company does not designate the interest rate swap contacts as hedges.
Deferred Loan Costs Deferred loan costs, included in Other Assets, are amortized over the estimated lives of the related obligations or, in certain circumstances, accelerated if the obligation is refinanced, using the straight line method, which approximates the effective interest method.
Asset Retirement Obligations The Company recognizes estimated liabilities for future costs associated with the abandonment of its oil and natural gas properties. A liability for the fair value of an asset retirement obligation and corresponding increase to the carrying value of the related long-lived asset are recorded at the time the well is spud or acquired.
Environmental The Company is subject to extensive federal, state and local environmental laws and regulations. These laws and regulations, which regularly change, regulate the discharge of materials into the environment and may require the Company to remove or mitigate the environmental effects of the disposal or release of petroleum or chemical substances at various sites. Environmental expenditures are expensed or capitalized depending on their future economic benefit. Expenditures that relate to an existing condition caused by past operations and that have no future economic benefits are expensed. Liabilities for expenditures of a non-capital nature are recorded when environmental assessment and/or remediation is probable and the costs can be reasonably estimated. Such liabilities are generally recorded at their undiscounted amounts unless the amount and timing of payments is fixed or reliably determinable. The Company believes that it is in material compliance with existing laws and regulations.
Income Taxes Deferred income tax assets and liabilities are recognized for the future income tax consequences attributable to differences between the financial statement carrying amounts of existing assets and liabilities and their respective income tax bases. Deferred income tax assets and liabilities are measured using enacted tax rates expected to apply to taxable income in the years in which those temporary differences are expected to be recovered or settled. The effect on deferred income tax assets and liabilities of a change in income tax rates is recognized in income in the period that includes the enactment date. The measurement of deferred income tax assets is reduced, if necessary, by a valuation allowance if management believes that it is more likely than not that some portion or all of the net deferred tax assets will not be fully realized on future income tax returns. The ultimate realization of deferred tax assets is dependent upon the generation of future taxable income during the periods in which those temporary differences become deductible. Management considers the scheduled reversal of deferred tax liabilities, available taxes in carryback periods, projected future taxable income and tax planning strategies in making this assessment.
F-14
VENOCO, INC. AND SUBSIDIARIES
NOTES TO CONSOLIDATED FINANCIAL STATEMENTS (Continued)
YEARS ENDED DECEMBER 31, 2007, 2008 AND 2009
1. SUMMARY OF SIGNIFICANT ACCOUNTING POLICIES (Continued)
In June 2006, the FASB issued an interpretation related to the existing accounting for income tax guidance regarding how tax benefits claimed or expected to be claimed on a tax return should be recorded in the financial statements. Under this guidance, the Company may recognize the tax benefit from an uncertain tax position only if it is more likely than not that the tax position will be sustained on examination by the taxing authorities based on the technical merits of the position. The tax benefits recognized in the financial statements from such a position should be measured based on the largest benefit that has a greater than fifty percent likelihood of being realized upon ultimate settlement.
The Company adopted guidance regarding accounting for uncertain tax positions on January 1, 2007, and has analyzed filing positions in all of the federal and state jurisdictions where it is required to file income tax returns, as well as all open tax years in these jurisdictions. As a result of the implementation of the guidance regarding accounting for uncertain tax positions on January 1, 2007, the Company recognized a $3.8 million reduction in prepaid income taxes for unrecognized tax benefits which was offset by a corresponding reduction to deferred income tax liabilities. There was no cumulative adjustment made to the opening balance of retained earnings at January 1, 2007.
Earnings Per Share Basic earnings (loss) per share is calculated by dividing net earnings (loss) attributable to common stock by the weighted average number of shares outstanding for the period (unvested restricted stock is excluded from the weighted average shares outstanding used in the basic earnings per share calculation). Under the treasury stock method, diluted earnings per share is calculated by dividing net earnings (loss) by the weighted average number of shares outstanding including all potentially dilutive common shares (unvested restricted stock and unexercised stock options). In the event of a net loss, no potential common shares are included in the calculation of shares outstanding, as their inclusion would be anti-dilutive.
Effective January 1, 2009, unvested share-based payment awards that contain nonforfeitable rights to dividends or dividend equivalents are considered participating securities and are included in the computation of earnings per share pursuant to the two-class method. The Company's unvested restricted stock awards contain nonforfeitable dividend rights and participate equally with common stock with respect to dividends issued or declared. However, the Company's unvested restricted stock does not have a contractual obligation to share in losses of the Company. The Company's unexercised stock options do not contain rights to dividends. Under the two-class method, the earnings used to determine basic earnings per common share are reduced by an amount allocated to participating securities. When the Company records a net loss, none of the loss is allocated to the participating securities since the securities are not obligated to share in Company losses. Consequently, in periods of net loss, the two class method will not have an effect on the Company's basic earnings per share.
Unvested restricted stock and unexercised options were not included in the calculation of diluted loss per share for the years ended December 31, 2007, 2008 and 2009, as their inclusion would have been anti-dilutive.
F-15
VENOCO, INC. AND SUBSIDIARIES
NOTES TO CONSOLIDATED FINANCIAL STATEMENTS (Continued)
YEARS ENDED DECEMBER 31, 2007, 2008 AND 2009
1. SUMMARY OF SIGNIFICANT ACCOUNTING POLICIES (Continued)
The following table details the weighted average dilutive and anti-dilutive securities, which consist of options and unvested restricted stock, for the periods presented (in thousands):
| |
Years ended December 31, |
|||||||||
|---|---|---|---|---|---|---|---|---|---|---|
| |
2007 | 2008 | 2009 | |||||||
Dilutive |
— | — | — | |||||||
Anti-dilutive |
4,713 | 4,608 | 4,914 | |||||||
The following table sets forth the calculation of basic and diluted earnings per share (in thousands except per share amounts):
| |
Years ended December 31, | ||||||||||
|---|---|---|---|---|---|---|---|---|---|---|---|
| |
2007 | 2008 | 2009 | ||||||||
Net income (loss) |
$ | (73,372 | ) | $ | (391,132 | ) | $ | (47,298 | ) | ||
Allocation of net income to unvested restricted stock |
— | — | — | ||||||||
Net earnings (loss) attributable to common stock |
$ | (73,372 | ) | $ | (391,132 | ) | $ | (47,298 | ) | ||
Basic weighted average common shares outstanding |
46,372 | 50,486 | 50,805 | ||||||||
Add: dilutive effect of stock options and non-vested restricted shares |
— | — | — | ||||||||
Diluted weighted average common shares outstanding |
46,372 | 50,486 | 50,805 | ||||||||
Basic earnings per common share |
$ | (1.58 | ) | $ | (7.75 | ) | $ | (0.93 | ) | ||
Diluted earnings per common share |
$ | (1.58 | ) | $ | (7.75 | ) | $ | (0.93 | ) | ||
Stock-Based Compensation Stock-based compensation is measured at the grant date based on the value of the awards and is recognized on a straight-line basis over the requisite service period (usually the vesting period). The Company estimates forfeitures in calculating the cost related to stock-based compensation as opposed to recognizing these forfeitures and the corresponding reduction in expense as they occur. Compensation expense is then adjusted based on the actual number of awards for which the requisite service period is rendered. A market condition is not considered to be a vesting condition with respect to compensation expense. Therefore, an award is not deemed to be forfeited solely because a market condition is not satisfied.
2. ACQUISITIONS AND SALES OF PROPERTIES
Sacramento Basin Asset Acquisition. In February 2009, the Company entered into a purchase and sale agreement pursuant to which it agreed to buy certain natural gas producing properties in the Sacramento Basin from Aspen Exploration Corporation and certain other parties. The properties acquired are in close proximity to the Company's existing operations in the Sacramento Basin and, therefore, complement the Company's current natural gas portfolio. The transaction closed on June 30, 2009, with an effective date of December 1, 2008. The purchase price of $21.4 million consisted of cash
F-16
VENOCO, INC. AND SUBSIDIARIES
NOTES TO CONSOLIDATED FINANCIAL STATEMENTS (Continued)
YEARS ENDED DECEMBER 31, 2007, 2008 AND 2009
2. ACQUISITIONS AND SALES OF PROPERTIES (Continued)
paid of $21.3 million and certain payables related to the properties acquired of $0.1 million assumed by the Company.
The Sacramento Basin asset acquisition qualifies as a business combination, and therefore, the Company was required to estimate the fair value of the assets acquired and liabilities assumed as of the acquisition date (June 30, 2009) to record the acquisition. Fair value is defined as the price that would be received to sell an asset or paid to transfer a liability in an orderly transaction between market participants at the measurement date.
The fair value of the acquired properties was determined based upon numerous inputs, many of which were unobservable (which are defined as Level 3 inputs). The significant inputs used in estimating the fair value were: (1) NYMEX natural gas futures prices at June 30, 2009 (observable), (2) projections of the estimated quantities of natural gas reserves, (3) projections regarding rates and timing of production, (4) projections regarding amounts and timing of future development and abandonment costs, (5) projections regarding the amounts and timing of operating costs and property taxes, (6) estimated risk adjusted discount rates and (7) estimated inflation rates. As a result of applying the above assumptions, the Company estimated the aggregate fair value of the acquisition at $21.4 million. The estimated fair value of the acquisition was assigned to the assets acquired and liabilities assumed as follows: $22.9 million to proved properties, $1.5 million to unevaluated properties, $1.1 million to operating equipment and $4.1 million to asset retirement obligation. Because the estimated fair value and purchase price were equivalent, the Company did not record goodwill or a gain related to the acquisition.
Hastings Complex Sale. In February 2009, the Company closed the sale of its principal interests in the Hastings complex ("Hastings Sale") to a subsidiary of Denbury Resources Inc. ("Denbury") for approximately $197.7 million. The Company used the proceeds from the sale to repay fully the then outstanding balance of the revolving credit facility of $187.1 million and related interest of $0.5 million. In addition, the Company paid $5.5 million toward the principal balance on the second lien term loan. The Company did not recognize a gain for financial reporting purposes, but applied the proceeds from the Hastings Sale to reduce the capitalized cost of its oil and natural gas properties.
As a result of the sale, Denbury has committed to a development plan related to a CO2 enhanced recovery project that will require it to make minimum capital expenditures in the amount of $178.7 million by the end of 2014. As part of the plan, Denbury is responsible for providing the necessary CO2. The Company retained an overriding royalty interest of 2.0% in the production from the properties. In addition, the Company has the right to back-in to a working interest of approximately 22.3% in the CO2 project after Denbury recoups certain costs.
Marketing of Texas Assets. The Company is currently engaged in actively marketing all of its oil and natural gas interests held in Texas.
F-17
VENOCO, INC. AND SUBSIDIARIES
NOTES TO CONSOLIDATED FINANCIAL STATEMENTS (Continued)
YEARS ENDED DECEMBER 31, 2007, 2008 AND 2009
3. LONG-TERM DEBT
As of the dates indicated, the Company's long-term debt consisted of the following (in thousands):
| |
December 31, | |||||||
|---|---|---|---|---|---|---|---|---|
| |
2008 | 2009 | ||||||
Revolving credit agreement due January 2013 |
$ | 135,052 | $ | 57,860 | ||||
Second lien term loan due May 2014 |
500,000 | 494,485 | ||||||
8.75% senior notes |
149,590 | — | ||||||
11.50% senior notes due October 2017 |
— | 142,684 | ||||||
Financed derivative premiums |
15,626 | — | ||||||
Total long-term debt |
800,268 | 695,029 | ||||||
Less: current portion of long-term debt |
2,598 | — | ||||||
Long-term debt, net of current portion |
$ | 797,670 | $ | 695,029 | ||||
Revolving credit facility. In December 2009, the Company entered into the Third Amended and Restated Credit Agreement related to its $300 million revolving credit facility with a syndicate of banks ("revolving credit facility"). The facility has a maturity date of January 15, 2013 and the borrowing base (currently established at $125 million) is subject to redetermination twice each year, and may be redetermined at other times at the Company's request or at the request of the lenders. The facility is secured by a first priority lien on substantially all of the Company's oil and natural gas properties and other assets, including the equity interests in all of the Company's subsidiaries, and is unconditionally guaranteed by each of the Company's operating subsidiaries other than Ellwood Pipeline, Inc. The collateral also secures the Company's obligations to hedging counterparties that are also lenders, or affiliates of lenders, under the facility. Loans designated as Base Rate Loans under the facility bear interest at a floating rate equal to (i) the greater of (x) the Bank of Montreal's announced base rate, (y) the overnight federal funds rate plus 0.50% and (z) the one-month LIBOR plus 1.5%, plus (ii) an applicable margin ranging from 0.75% to 1.50%, based upon utilization. Loans designated as LIBO Rate Loans under the facility bear interest at (i) LIBOR plus (ii) an applicable margin ranging from 2.25% to 3.00%, based upon utilization. A commitment fee of 0.50% per annum is payable with respect to unused borrowing availability under the facility. The agreement governing the facility contains customary representations, warranties, events of default, indemnities and covenants, including operational covenants that restrict the Company's ability to incur indebtedness and financial covenants that require the Company to maintain specified ratios of current assets to current liabilities and debt to EBITDA.
The borrowing base under the revolving credit facility has been allocated at various percentages to a syndicate of ten banks. Certain of the institutions included in the syndicate have received support from governmental agencies in connection with events in the credit markets. As of February 22, 2010, the Company had available borrowing capacity of $63.2 million under the facility, net of the outstanding balance of $57.9 million and $3.9 million in outstanding letters of credit.
Second lien term loan facility. The Company entered into its $500.0 million senior secured second lien term loan facility in May 2007 (the "second lien term loan facility"). Loans made under the second lien term loan facility are designated, at the Company's option, as either "Base Rate Loans" or "LIBO Rate Loans." Loans designated as Base Rate Loans bear interest at a floating rate equal to (i) the
F-18
VENOCO, INC. AND SUBSIDIARIES
NOTES TO CONSOLIDATED FINANCIAL STATEMENTS (Continued)
YEARS ENDED DECEMBER 31, 2007, 2008 AND 2009
3. LONG-TERM DEBT (Continued)
greater of the overnight federal funds rate plus 0.50% and a market base rate, plus (ii) 3.00%. Loans designated as LIBO Rate Loans bear interest at LIBOR plus 4.00%.
The agreement governing the second lien term loan facility contains customary representations, warranties, events of default and indemnities and certain customary covenants, including covenants that restrict the Company's ability to incur additional indebtedness. The facility is secured by second priority liens on substantially all of the Company's oil and natural gas properties and other assets, including the equity interests in all of its subsidiaries, and is unconditionally guaranteed by each of the Company's subsidiaries other than Ellwood Pipeline, Inc. As a result of the Company's refinancing of the 8.75% senior notes described below, the maturity date of the principal on the second lien term loan facility has been extended to May 8, 2014.
The Company may from time to time make optional prepayments of amounts borrowed under the second lien term loan facility (at par) if no amounts are outstanding under the revolving credit facility. Amounts prepaid under the second lien term loan facility may not be reborrowed. As a result of the Hastings Sale in February 2009, the Company was required to repay $5.5 million of the outstanding principal balance on the second lien term loan facility.
Senior notes. In December 2004, the Company issued $150.0 million in 8.75% senior notes due December 2011. Prior to the satisfaction and discharge of the 8.75% senior secured notes described below, interest was due each June 15 and December 15.
In October 2009, the Company issued $150.0 million in 11.50% senior notes due October 2017 at a price of 95.03% of par. The 11.50% senior notes are senior unsecured obligations and contain covenants that, among other things, limit the Company's ability to make investments, incur additional debt, issue preferred stock, pay dividends, repurchase its stock, create liens or sell assets. The senior notes were sold in a private offering under SEC Rule 144A and Regulation S under the Securities Act of 1933 (the "Securities Act"). Concurrently with the sale of the 11.50% senior notes, the Company irrevocably deposited $159.8 million in cash with the trustee under the indenture governing the 8.75% senior notes, thus effecting a satisfaction and discharge of the 8.75% senior notes. Additionally, the Company issued an irrevocable notice of redemption to call the 8.75% senior notes for redemption at 102.188% on December 15, 2009. The funds deposited with the trustee, comprised of net proceeds of the 11.50% senior notes offering of $141.0 million, $14.3 million of additional borrowings under the Company's revolving credit facility and $4.5 million of cash on hand, were sufficient to pay the aggregate redemption price and all accrued interest on the 8.75% senior notes as of the redemption date.
The Company may redeem the 11.50% senior notes prior to October 1, 2013 at a "make-whole price" defined in the indenture. Beginning October 1, 2013, the Company may redeem the notes at a redemption price equal to 105.75% of the principal amount and declining to 100% by October 1, 2016.
The Company recorded a loss on the extinguishment of debt of $7.9 million in connection with the repayment of the 8.75% senior notes. In February 2010, the Company completed an exchange of the private notes for notes with substantially identical terms that are registered under the Securities Act.
The Company was in compliance with all debt covenants at December 31, 2009.
F-19
VENOCO, INC. AND SUBSIDIARIES
NOTES TO CONSOLIDATED FINANCIAL STATEMENTS (Continued)
YEARS ENDED DECEMBER 31, 2007, 2008 AND 2009
3. LONG-TERM DEBT (Continued)
Financed Derivative Premiums. The Company previously entered into derivative contracts that contained provisions for the deferral of the payment or receipt of premiums until the period of production for which the derivative contract relates. Both the derivative and the net liability for the payment of premiums were recorded at their fair values at the inception of the derivative contracts. The Company paid the balance of all outstanding financed derivative premiums during the second quarter of 2009. The Company recognized a loss on extinguishment of debt of $0.6 million in connection with the settlement of the financed derivative premiums.
Scheduled annual maturities of long-term debt were as follows at December 31, 2009 (in thousands):
Year Ending December 31 (in thousands):
|
|
|||
|---|---|---|---|---|
2010 |
$ | — | ||
2011 |
— | |||
2012 |
— | |||
2013 |
57,860 | |||
2014 |
494,485 | |||
2015 and after |
142,684 | |||
|
$ | 695,029 | ||
4. HEDGING AND DERIVATIVE FINANCIAL INSTRUMENTS
Commodity Derivative Agreements. The Company utilizes swap and collar agreements and option contracts to hedge the effect of price changes on a portion of its future oil and natural gas production. The objective of the Company's hedging activities and the use of derivative financial instruments is to achieve more predictable cash flows. While the use of these derivative instruments limits the downside risk of adverse price movements, they also may limit future revenues from favorable price movements. The Company may, from time to time, opportunistically restructure existing derivative contracts or enter into new transactions to effectively modify the terms of current contracts in order to improve the pricing parameters in existing contracts or realize the current value of the Company's existing positions and use the proceeds from such transactions to secure additional contracts for periods in which the Company believes it has additional unmitigated commodity price risk.
The use of derivatives involves the risk that the counterparties to such instruments will be unable to meet the financial terms of such contracts. The Company's derivative contracts are with multiple counterparties to minimize exposure to any individual counterparty. The Company generally has netting arrangements with the counterparties that provide for the offset of payables against receivables from separate derivative arrangements with that counterparty in the event of contract termination. The derivative contracts may be terminated by a non-defaulting party in the event of default by one of the parties to the agreement. All of the counterparties to the Company's derivative contracts are also lenders, or affiliates of lenders, under its revolving credit facility. Therefore, the Company is not required to post collateral when the Company is in a derivative liability position. The Company's revolving credit facility and derivative contracts contain provisions that provide for cross defaults and acceleration of those debt and derivative instruments in certain situations.
F-20
VENOCO, INC. AND SUBSIDIARIES
NOTES TO CONSOLIDATED FINANCIAL STATEMENTS (Continued)
YEARS ENDED DECEMBER 31, 2007, 2008 AND 2009
4. HEDGING AND DERIVATIVE FINANCIAL INSTRUMENTS (Continued)
Lehman Brothers Commodity Services, Inc. ("LBCS") was a counterparty to several derivative contracts with the Company entered into between August 2006 and May 2008. In September 2008, Lehman Brothers Holdings Inc. ("LBH"), credit support provider for LBCS, filed for bankruptcy. The bankruptcy filing of LBH constituted an event of default under the ISDA Master Agreement between the Company and LBCS. Accordingly, the Company notified LBCS that the Company was terminating each of the outstanding transactions, effective immediately. Subsequent to the Company's notification of termination, LBCS filed for bankruptcy protection. Similar issues could affect other hedge counterparties in the future.
Because a large portion of the Company's commodity derivatives did not qualify for hedge accounting and to increase clarity in its financial statements, the Company elected to discontinue hedge accounting prospectively for its commodity derivatives beginning April 1, 2007. Consequently, from that date forward, the Company has recognized mark-to-market gains and losses in earnings currently, rather than deferring such amounts in accumulated other comprehensive income (loss) for those commodity derivatives that qualify as cash flow hedges. As of December 31, 2009, the Company has recognized all of the unrealized derivative fair value loss for derivative contracts previously designated as cash flow hedges which were recorded in accumulated other comprehensive loss.
The Company has paid premiums related to certain of its outstanding derivative contracts. These premiums are amortized over the period for which the contracts are effective. At December 31, 2009, the balance of unamortized derivative premiums was $38.5 million, of which $22.6 million, $12.2 million and $3.7 million will be amortized in 2010, 2011 and 2012, respectively.
The components of commodity derivative losses (gains) in the consolidated statements of operations are as follows (in thousands):
| |
Years ended December 31, | ||||||||||
|---|---|---|---|---|---|---|---|---|---|---|---|
| |
2007 | 2008 | 2009 | ||||||||
Realized commodity derivative losses (gains) |
$ | 13,041 | $ | 61,446 | $ | (68,429 | ) | ||||
Amortization of commodity derivative premiums |
6,830 | 6,256 | 22,661 | ||||||||
Unrealized commodity derivative losses (gains) for changes in fair value |
122,779 | (184,459 | ) | 71,511 | |||||||
Commodity derivative losses (gains), net |
$ | 142,650 | $ | (116,757 | ) | $ | 25,743 | ||||
As of December 31, 2009, the Company had entered into swap, collar and option agreements related to its oil and natural gas production as summarized below. Location and quality differentials attributable to the Company's properties are not included in the following prices. The agreements
F-21
VENOCO, INC. AND SUBSIDIARIES
NOTES TO CONSOLIDATED FINANCIAL STATEMENTS (Continued)
YEARS ENDED DECEMBER 31, 2007, 2008 AND 2009
4. HEDGING AND DERIVATIVE FINANCIAL INSTRUMENTS (Continued)
provide for monthly settlement based on the differential between the agreement price and the actual NYMEX WTI (oil) or NYMEX Henry Hub (natural gas) price.
| |
Oil (NYMEX WTI) | Natural Gas (NYMEX Henry Hub) |
|||||||||
|---|---|---|---|---|---|---|---|---|---|---|---|
| |
Barrels/day | Weighted Avg. Prices per Bbl |
MMBtu/day | Weighted Avg. Prices per MMBtu |
|||||||
2010: |
|||||||||||
Swaps |
1,000 | $66.75 | — | $— | |||||||
Collars(1) |
5,150 | $60.00/$86.53 | 17,900 | $7.19/$7.00 | |||||||
Calls(1) |
— | $— | 10,000 | $7.00 | |||||||
Puts |
1,850 | $40.00 | 41,000 | $6.00 | |||||||
2011: |
|||||||||||
Collars(1) |
7,000 | $50.00/$141.64 | 12,000 | $7.50/$10.00 | |||||||
Puts |
— | $— | 24,000 | $6.00 | |||||||
2012: |
|||||||||||
Collars(1) |
— | $— | 15,500 | $6.00/$9.10 | |||||||
Puts |
— | $— | 7,800 | $6.00 | |||||||
- (1)
- Reflects impact of call spreads, which are transactions entered into for the purpose of modifying the ceiling (or call) portion of certain collar arrangements.
The Company also uses natural gas basis swaps to fix the differential between the NYMEX Henry Hub price and the PG&E Citygate price, the index on which the majority of the Company's natural gas is sold. The Company's natural gas basis swaps as of December 31, 2009 are presented below:
| |
Floating Index |
MMBtu/Day | Weighted Avg. Basis Differential to NYMEX HH (per MMBtu) |
|||||||
|---|---|---|---|---|---|---|---|---|---|---|
Basis Swaps: |
||||||||||
January 1 - December 31, 2010 |
PG&E Citygate | 51,618 | $ | 0.14 | ||||||
January 1 - December 31, 2011 |
PG&E Citygate | 45,624 | $ | 0.07 | ||||||
In February 2010, the Company entered into the following series of transactions which modified certain of its existing derivative contracts and added additional derivative contracts to its hedging portfolio:
- •
- Repurchased the call option on our calendar 2011 $50.00/$144.75 oil collar (2,000 Bbl/d), thereby creating a $50.00 put on
2,000 Bbl/d for calendar 2011
- •
- Repurchased the lower call option on our calendar 2011 $13.50/$10.00 natural gas call spread (12,000 MMbtu/d). This call spread was previously paired with our calendar 2011 $7.50/$13.50 natural gas collar, creating a $7.50/$10.00 "net collar" on 12,000 MMbtu/d. The recent transaction effectively removes the ceiling on the net collar, resulting in a $7.50 put on 12,000 MMbtu/d for calendar 2011.
F-22
VENOCO, INC. AND SUBSIDIARIES
NOTES TO CONSOLIDATED FINANCIAL STATEMENTS (Continued)
YEARS ENDED DECEMBER 31, 2007, 2008 AND 2009
4. HEDGING AND DERIVATIVE FINANCIAL INSTRUMENTS (Continued)
- •
- Entered into the following natural gas costless collars:
- •
- 24,000 MMbtu/d at $5.75/$7.12 for calendar 2011
- •
- 14,000 MMbtu/d at $5.50/$8.00 for calendar 2012
- •
- Entered into the following natural gas basis swaps:
- •
- 11,600 MMbtu/d at $0.27 for calendar 2011
- •
- 47,400 MMbtu/d at $0.275 for calendar 2012
Interest Rate Swap. The Company previously entered into interest rate swap transactions to lock in its interest cost on $500.0 million of variable rate borrowings through September 2011. The Company paid a fixed interest rate of 4.035% and received a floating interest rate based on the three-month LIBO rate, with settlements made quarterly. In connection with the extension of the maturity of the Company's second lien term loan facility to May 2014, the Company entered into a revised interest rate swap agreement in October 2009 to extend the terms of the existing interest rate swap agreement from September 2011 to May 2014 and reduced the rate from 4.035% to a weighted average rate of 3.840%. As a result of the revised agreement, $500 million of the Company's variable rate debt will effectively bear interest at a fixed rate of approximately 7.8%. The Company did not designate the interest rate swap as a hedge.
The components of interest rate derivative losses (gains) in the consolidated statements of operations are as follows (in thousands):
| |
Years ended December 31, | |||||||||
|---|---|---|---|---|---|---|---|---|---|---|
| |
2007 | 2008 | 2009 | |||||||
Realized interest rate derivative losses (gains) |
$ | (135 | ) | $ | 10,231 | $ | 18,479 | |||
Unrealized interest rate derivative losses (gains) |
17,312 | 10,336 | (1,803 | ) | ||||||
Interest rate derivative losses (gains), net |
$ | 17,177 | $ | 20,567 | $ | 16,676 | ||||
Fair Value of Derivative Instruments. The estimated fair values of derivatives included in the consolidated balance sheets at December 31, 2008 and 2009 are summarized below. The net fair value of the Company's derivatives decreased by $73.4 million from a net asset of $61.9 million at December 31, 2008 to a net liability of $11.5 million at December 31, 2009, primarily due to higher futures prices for oil and natural gas, which are used in the calculation of the fair value of commodity derivatives. The Company does not offset asset and liability positions with the same counterparties within the financial statements, rather, all contracts are presented at their gross estimated fair value. As of the dates indicated, the Company's derivative assets and liabilities are presented below (in thousands). These balances represent the estimated fair value of the contracts. The Company has not
F-23
VENOCO, INC. AND SUBSIDIARIES
NOTES TO CONSOLIDATED FINANCIAL STATEMENTS (Continued)
YEARS ENDED DECEMBER 31, 2007, 2008 AND 2009
4. HEDGING AND DERIVATIVE FINANCIAL INSTRUMENTS (Continued)
designated any of its derivative contracts as hedging instruments. The main headings represent the balance sheet captions for the contracts presented.
| |
December 31, | ||||||||
|---|---|---|---|---|---|---|---|---|---|
| |
2008 | 2009 | |||||||
Current Assets—Commodity derivatives: |
|||||||||
Oil derivative contracts |
$ | 23,970 | $ | 12,461 | |||||
Gas derivative contracts |
33,277 | 22,150 | |||||||
|
57,247 | 34,611 | |||||||
Other Assets—Commodity derivatives: |
|||||||||
Oil derivative contracts |
11,660 | 296 | |||||||
Gas derivative contracts |
23,654 | 18,424 | |||||||
|
35,314 | 18,720 | |||||||
Current Liabilities—Commodity and interest derivatives: |
|||||||||
Oil derivative contracts |
(1,672 | ) | (25,690 | ) | |||||
Gas derivative contracts |
(652 | ) | (7,787 | ) | |||||
Interest rate derivative contracts |
(18,960 | ) | (16,232 | ) | |||||
|
(21,284 | ) | (49,709 | ) | |||||
Commodity and interest rate derivatives: |
|||||||||
Oil derivative contracts |
— | — | |||||||
Gas derivative contracts |
(180 | ) | (4,968 | ) | |||||
Interest rate derivative contracts |
(9,183 | ) | (10,108 | ) | |||||
|
(9,363 | ) | (15,076 | ) | |||||
Net derivative asset (liability) |
$ | 61,914 | $ | (11,454 | ) | ||||
5. FAIR VALUE MEASUREMENTS
Fair value is defined as the price that would be received in the sale of an asset or paid to transfer a liability in an orderly transaction between market participants at the measurement date (exit price). The Company utilizes market data or assumptions that market participants would use in pricing the asset or liability, including assumptions about risk and the risks inherent in the inputs to the valuation technique. These inputs can be readily observable, market corroborated, or generally unobservable. The Company classifies fair value balances based on the observability of those inputs. The FASB has established a fair value hierarchy that prioritizes the inputs used to measure fair value. The hierarchy gives the highest priority to unadjusted quoted prices in active markets for identical assets or liabilities (level 1 measurement) and the lowest priority to unobservable inputs (level 3 measurement).
The three levels of the fair value hierarchy are as follows:
Level 1—Quoted prices are available in active markets for identical assets or liabilities as of the reporting date. Active markets are those in which transactions for the asset or liability occur in sufficient frequency and volume to provide pricing information on an ongoing basis. Level 1 primarily consists of financial instruments such as exchange-traded derivatives and listed equities.
F-24
VENOCO, INC. AND SUBSIDIARIES
NOTES TO CONSOLIDATED FINANCIAL STATEMENTS (Continued)
YEARS ENDED DECEMBER 31, 2007, 2008 AND 2009
5. FAIR VALUE MEASUREMENTS (Continued)
Level 2—Pricing inputs are other than quoted prices in active markets included in level 1, but are either directly or indirectly observable as of the reported date. Level 2 includes those financial instruments that are valued using models or other valuation methodologies. These models are primarily industry-standard models that consider various assumptions, including quoted forward prices for interest rates and commodities, time value, volatility factors, and current market and contractual prices for the underlying instruments, as well as other relevant economic measures. Substantially all of these assumptions are observable in the marketplace throughout the full term of the instrument, can be derived from observable data or are supported by observable levels at which transactions are executed in the marketplace. Instruments in this category generally include non-exchange-traded derivatives such as commodity swaps, interest rate swaps, options and collars.
Level 3—Pricing inputs include significant inputs that are generally less observable from objective sources. These inputs may be used with internally developed methodologies that result in management's best estimate of fair value. Instruments in this category generally include non-exchange-traded derivatives such as commodity swaps, options and collars that are valued similar to the industry-standard models described above, however, these derivatives are classified in Level 3 because of inputs that may not be observable.
Financial assets and liabilities are classified in their entirety based on the lowest level of input that is significant to the fair value measurement. The Company's assessment of the significance of a particular input to the fair value measurement requires judgment, and may affect the valuation of fair value assets and liabilities and their placement within the fair value hierarchy levels. The following table sets forth by level within the fair value hierarchy the Company's financial assets and liabilities that were accounted for at fair value as of December 31, 2009 (in thousands).
| |
Level 1 | Level 2 | Level 3 | Fair Value as of December 31, 2009 |
||||||||||
|---|---|---|---|---|---|---|---|---|---|---|---|---|---|---|
Assets (Liabilities): |
||||||||||||||
Commodity derivatives |
$ | — | $ | 53,331 | $ | — | $ | 53,331 | ||||||
Commodity derivatives |
— | (38,445 | ) | — | (38,445 | ) | ||||||||
Interest rate swaps |
— | (26,340 | ) | — | (26,340 | ) | ||||||||
Fair Value of Financial Instruments. The Company's financial instruments consist primarily of cash and cash equivalents, accounts receivable and payable, derivatives (discussed above) and long-term debt. The carrying values of cash equivalents and accounts receivable and payable are representative of their fair values due to their short-term maturities. The carrying amount of the Company's revolving credit facility approximated fair value because the interest rate of the facility is variable. The fair value of the second lien term loan facility listed in the tables below was derived from available market data. The 11.50% senior notes, which were issued in the fourth quarter and were not traded in active
F-25
VENOCO, INC. AND SUBSIDIARIES
NOTES TO CONSOLIDATED FINANCIAL STATEMENTS (Continued)
YEARS ENDED DECEMBER 31, 2007, 2008 AND 2009
5. FAIR VALUE MEASUREMENTS (Continued)
markets at December 31, 2009, are stated at their issue price. This disclosure does not impact our financial position, results of operations or cash flows.
| |
December 31, 2008 | December 31, 2009 | |||||||||||
|---|---|---|---|---|---|---|---|---|---|---|---|---|---|
Long Term Debt (in thousands):
|
Carrying Value |
Estimated Fair Value |
Carrying Amount |
Estimated Fair Value |
|||||||||
Revolving credit agreement |
$ | 135,052 | $ | 135,052 | $ | 57,860 | $ | 57,860 | |||||
Second lien term loan |
500,000 | 315,000 | 494,485 | 445,037 | |||||||||
8.75% senior notes |
149,590 | 67,500 | — | — | |||||||||
11.50% senior notes |
— | — | 142,684 | 142,545 | |||||||||
Financed derivative premiums |
15,626 | 15,159 | — | — | |||||||||
6. ASSET RETIREMENT OBLIGATIONS
The Company's asset retirement obligations primarily represent the estimated present value of the amounts expected to be incurred to plug, abandon and remediate producing and shut-in properties (including removal of certain onshore and offshore facilities) at the end of their productive lives in accordance with applicable state and federal laws. The Company determines the estimated fair value of its asset retirement obligations by calculating the present value of estimated cash flows related to plugging and abandonment liabilities. The significant inputs used to calculate such liabilities include estimates of costs to be incurred, credit adjusted discount rates, inflation rates and estimated dates of abandonment. The asset retirement liability is accreted to its present value each period and the capitalized asset retirement cost is depleted as a component of the full cost pool using the units-of-production method.
The following table summarizes the activities for the Company's asset retirement obligations for the years ended December 31, 2008 and 2009 (in thousands):
| |
2008 | 2009 | ||||||
|---|---|---|---|---|---|---|---|---|
Asset retirement obligations at beginning of period |
$ | 52,220 | $ | 80,579 | ||||
Revisions of estimated liabilities |
20,838 | 3,221 | ||||||
Liabilities incurred/acquired |
3,795 | 7,736 | ||||||
Liabilities settled |
(478 | ) | (1,323 | ) | ||||
Disposition of properties |
— | (2,993 | ) | |||||
Accretion expense |
4,204 | 5,765 | ||||||
Asset retirement obligations at end of period |
80,579 | 92,985 | ||||||
Less: current asset retirement obligations (classified with accounts payable and accrued liabilities) |
(1,075 | ) | (500 | ) | ||||
Long-term asset retirement obligations |
$ | 79,504 | $ | 92,485 | ||||
Discount rates used to calculate the present value vary depending on the estimated timing of the obligation, but typically range between 4% and 9%. The 2008 and 2009 revisions primarily relate to updated estimates for expected cash outflows and changes in the timing of obligations.
F-26
VENOCO, INC. AND SUBSIDIARIES
NOTES TO CONSOLIDATED FINANCIAL STATEMENTS (Continued)
YEARS ENDED DECEMBER 31, 2007, 2008 AND 2009
7. INCOME TAXES
The Company accounts for income taxes under the asset and liability approach prescribed by GAAP, which requires the recognition of deferred tax assets and liabilities for the expected future tax consequences of events that have been recognized in the Company's consolidated financial statements or tax returns.
The Company's income tax provision (benefit) is composed of the following (in thousands):
| |
Years ended December 31, | ||||||||||
|---|---|---|---|---|---|---|---|---|---|---|---|
| |
2007 | 2008 | 2009 | ||||||||
Current: |
|||||||||||
Federal |
$ | 1,200 | $ | 2,700 | $ | (3,550 | ) | ||||
State |
(100 | ) | 3,600 | (2,450 | ) | ||||||
|
1,100 | 6,300 | (6,000 | ) | |||||||
Deferred: |
|||||||||||
Federal |
(43,465 | ) | 4,500 | (8,400 | ) | ||||||
State |
(3,835 | ) | 400 | — | |||||||
|
(47,300 | ) | 4,900 | (8,400 | ) | ||||||
Total income tax provision (benefit) |
$ | (46,200 | ) | $ | 11,200 | $ | (14,400 | ) | |||
A reconciliation of the income tax provision (benefit) computed by applying the federal statutory rate of 35% to the Company's income tax provision (benefit) is as follows (in thousands):
| |
2007 | 2008 | 2009 | |||||||
|---|---|---|---|---|---|---|---|---|---|---|
Income tax expense (benefit) at federal statutory rate |
$ | (41,850 | ) | $ | (132,976 | ) | $ | (21,594 | ) | |
State income taxes |
(3,693 | ) | (12,837 | ) | (1,864 | ) | ||||
Other |
(657 | ) | 68 | 2,103 | ||||||
Valuation allowance |
— | 156,945 | 6,955 | |||||||
|
$ | (46,200 | ) | $ | 11,200 | $ | (14,400 | ) | ||
F-27
VENOCO, INC. AND SUBSIDIARIES
NOTES TO CONSOLIDATED FINANCIAL STATEMENTS (Continued)
YEARS ENDED DECEMBER 31, 2007, 2008 AND 2009
7. INCOME TAXES (Continued)
The components of deferred tax assets and (liabilities) are as follows (in thousands):
| |
December 31, | |||||||
|---|---|---|---|---|---|---|---|---|
| |
2008 | 2009 | ||||||
Deferred income tax assets: |
||||||||
Bad debts |
$ | 112 | $ | 168 | ||||
Accrued liabilities |
1,300 | 1,624 | ||||||
Unrealized commodity derivative losses |
— | 8,926 | ||||||
Unrealized interest rate swap losses |
10,801 | 10,015 | ||||||
Share-based compensation |
1,648 | 3,384 | ||||||
Net operating losses |
26,394 | 47,606 | ||||||
State tax benefit |
1,912 | — | ||||||
Alternative minimum tax credits |
3,549 | 99 | ||||||
Charitable contributions |
736 | 1,587 | ||||||
Oil and gas properties |
129,411 | 100,091 | ||||||
Valuation allowance |
(156,945 | ) | (163,900 | ) | ||||
|
18,918 | 9,600 | ||||||
Deferred income tax liabilities: |
||||||||
Unrealized commodity derivative gains |
(17,543 | ) | — | |||||
Prepaid expenses |
(1,375 | ) | (1,200 | ) | ||||
|
(18,918 | ) | (1,200 | ) | ||||
Net deferred income tax assets (liabilities) |
— | 8,400 | ||||||
Net current deferred tax asset |
— | 8,400 | ||||||
Noncurrent deferred tax asset |
$ | — | $ | — | ||||
The Company has net operating loss carryovers as of December 31, 2009 of $139.8 million for federal income tax purposes and $127.4 million for financial reporting purposes. The difference of $12.4 million relates to tax deductions for compensation expense for financial reporting purposes for which the benefit will not be recognized until the related deductions reduce taxes payable. The net operating loss carryovers may be carried back two years and forward twenty years from the year the net operating loss was generated. The net operating losses may be used to offset taxable income through 2029. The Company provided a valuation allowance against its net deferred tax assets of $163.9 million as of December 31, 2009, since it cannot conclude that it is more likely than not that $163.9 million of the net deferred tax assets will be fully realized on future income tax returns. The ultimate realization of deferred tax assets is dependent upon the generation of future taxable income during the periods in which those temporary differences become deductible. Management considers the scheduled reversal of deferred tax liabilities, available taxes in carryback periods, projected future taxable income and tax planning strategies in making this assessment. Due to the temporary five year carryback period that became available in 2009, the Company released $8.4 million of its valuation allowance as of December 31, 2009 based on its intent to carryback net operating losses generated in the 2006, 2007, and 2008 tax years to the 2003, 2004, and 2005 tax years. The Company expects to file the carryback claims in the first quarter of 2010. As a result of the carryback claims, the Company recognized a net
F-28
VENOCO, INC. AND SUBSIDIARIES
NOTES TO CONSOLIDATED FINANCIAL STATEMENTS (Continued)
YEARS ENDED DECEMBER 31, 2007, 2008 AND 2009
7. INCOME TAXES (Continued)
income tax benefit of $8.4 million. The Company will continue to evaluate whether the remaining valuation allowance is needed in future reporting periods.
The Company's federal income tax returns for the 2003 and 2004 tax years have been examined by the U.S. Internal Revenue Service ("IRS"). In April 2009, the Company received from the IRS Appeals Office a letter and forms to close both examination years. In summary, the IRS Appeals Office agreed with the Company with respect to all adjustments protested by the Company in the 2003 and 2004 formal protests. As a result, the net increase in federal income tax settled with the IRS Appeals Office for both the 2003 and 2004 tax years was $0.9 million, which was reflected in the financial statements for the year ended December 31, 2008.
The California Department of Revenue previously notified the Company that it intends to examine the Company's 2003 and 2004 California tax returns. Due to the 2009 finalization of the federal examinations, the Company anticipates the examination of the 2003 and 2004 California tax returns to begin during 2010.
The Company adopted the provisions of accounting for uncertain tax positions on January 1, 2007, and has analyzed filing positions in all of the federal and state jurisdictions where it is required to file income tax returns, as well as all open tax years in these jurisdictions. As of December 31, 2008, the Company reduced the balance of unrecognized tax benefits due to the settlement with the IRS related to the 2003 and 2004 examinations. The remaining balance of uncertain tax positions relates to the pending examination of the 2003 and 2004 California tax returns. These uncertain tax positions relate primarily to timing differences and management does not believe any such uncertain tax positions will materially impact the Company's effective tax rate in future periods. The Company anticipates that none of the uncertain tax positions will be recognized within the next twelve months.
A rollforward of changes in the Company's unrecognized tax benefits is shown below (in thousands).
| |
Years ended December 31, |
|||||||
|---|---|---|---|---|---|---|---|---|
| |
2008 | 2009 | ||||||
Balance at beginning of period |
$ | 2,400 | $ | 200 | ||||
Additions based on tax positions related to the current year |
— | — | ||||||
Additions for tax positions of prior years |
— | — | ||||||
Reductions for tax positions of prior years |
(1,300 | ) | — | |||||
Settlements |
(900 | ) | — | |||||
Balance at end of period |
$ | 200 | $ | 200 | ||||
The Company is subject to taxation in federal and various state jurisdictions. The Company's tax years for 2003 and forward are subject to examination by state tax authorities. The Company's 2005 federal income tax return was examined by the IRS in 2009. The IRS has completed its field work and has represented that no adjustments will be proposed. Therefore, the Company believes that there are no additional adjustments for uncertain tax positions that need to be recorded.
F-29
VENOCO, INC. AND SUBSIDIARIES
NOTES TO CONSOLIDATED FINANCIAL STATEMENTS (Continued)
YEARS ENDED DECEMBER 31, 2007, 2008 AND 2009
7. INCOME TAXES (Continued)
The Company's policy is to recognize interest and/or penalties related to uncertain tax positions in interest expense. The Company recognized interest expense of $0.3 million during the year ended December 31, 2009 related to the settlement of the 2003 and 2004 IRS examinations. The Company did not recognize any interest or penalties during the year ended December 31, 2008.
8. CAPITAL STOCK AND TRANSACTIONS WITH SHAREHOLDER
All of the Company's outstanding common stock was controlled by the Company's CEO from December 2004 until August 2006, when the Company's then sole stockholder, a trust affiliated with the CEO, donated shares of stock to two charitable institutions. The Company issued and sold 10,090,800 shares of its common stock in the fourth quarter of 2006 in an initial public offering and received net proceeds of $160.4 million. In July 2007, the Company completed an additional public offering of common stock in which it issued and sold 6,565,000 shares of stock and received net proceeds of $116.0 million. The majority of the net proceeds from the offerings were used to repay the outstanding balance under the Company's revolving credit facility.
The Company has 61.3 million shares of common stock issued or reserved for issuance at December 31, 2009. At December 31, 2009, the Company has 52.5 million common shares issued and outstanding, of which 1.6 million shares are restricted stock granted under the Company's 2005 stock incentive plan. At December 31, 2009, the Company had approximately 3.3 million options outstanding and 5.2 million shares available to be issued pursuant to awards under its stock incentive plans, including the 2008 Employee Stock Purchase Plan.
Venoco operates a property located in Carpinteria, California as a transit point for several of the Company's offshore oil and gas producing properties in the Santa Barbara Channel (the "Bluffs Property"). During the third quarter of 2006, the Company declared and paid a dividend on its common stock of 51 acres of real property at the Bluffs Property and entered into certain agreements with its then-sole stockholder and an affiliate of the stockholder, including a ground lease and a development agreement relating to the property. Independent third party appraisals were obtained which valued the unencumbered value of the land in excess of the Company's historical cost of $10.3 million. In addition, the fair value of the property was appraised at $5.0 million after taking into account the encumbrance for the ground lease and the time value of money for a requirement of the Company to consolidate its operations on the property. Therefore, the Company recorded a dividend of $5.0 million for the appraised value of the interest conveyed and a retained leasehold interest of $5.3 million which was to be amortized over the expected life of the ground lease of 20 years.
In December 2008, the Company repurchased the Bluffs Property from the affiliate of the stockholder for $5.3 million. The Company intends to continue its oil and gas operations on the property and also plans to pursue a drilling project from the property. An independent third party appraisal was obtained which valued the unencumbered land in excess of the purchase price. As a result of the transaction, the ground lease and the consolidation requirement were both cancelled and the remaining unamortized leasehold interest of $4.7 million was recorded to land.
In December 2008, the Company entered into an agreement with an affiliate of its Chief Executive Officer, pursuant to which the affiliate paid to the Company $0.9 million which equaled the amount of
F-30
VENOCO, INC. AND SUBSIDIARIES
NOTES TO CONSOLIDATED FINANCIAL STATEMENTS (Continued)
YEARS ENDED DECEMBER 31, 2007, 2008 AND 2009
8. CAPITAL STOCK AND TRANSACTIONS WITH SHAREHOLDER (Continued)
profits the affiliate was deemed to have realized under Section 16(b) of the Securities and Exchange Act of 1934, as amended, with respect to transactions involving the Company's common stock.
In March, 2006, the Company paid a dividend consisting of 100% of its membership interest in 6267 Carpinteria Avenue, LLC ("6267 Carpinteria") to its then sole stockholder, a trust controlled by the Company's CEO. 6267 Carpinteria owns the office building and related land used by the Company in Carpinteria, California. The Company makes lease payments to 6267 Carpinteria under a lease for the office building entered into prior to the dividend. The lease provides for minimum lease payments of approximately $1.2 million per year through 2019.
9. SHARE-BASED PAYMENTS
The Company has granted options to directors, certain employees and officers of the Company other than its CEO, under its 2000 and 2005 Stock Plans (the "Stock Plans"). As of December 31, 2009, there are a total of 3,301,903 options outstanding with a weighted average exercise price of $8.92 ($6.00 to $20.00). The options vest over a four year period, with 20% vesting on the grant date and 20% vesting on each subsequent anniversary of the grant date. The options typically have a maximum life of 10 years. The options will generally vest upon a change in control of the Company. Unexercised options expire when an option holder elects to terminate employment or if the Company terminates the holder's employment for misconduct. If the Company terminates a holder's employment other than for misconduct, unvested options generally terminate and the holder has a limited period of time within which to exercise vested options, unless the award agreement provides otherwise.
Effective February 1, 2009, the Company implemented a non-compensatory 2008 Employee Stock Purchase Plan (the "ESPP"), which has been approved by the Company's Board of Directors and shareholders. In connection with the approval of the ESPP, the Board authorized 1.5 million shares of common stock to be issued under the ESPP. Participation in the ESPP is open to all employees, other than executive officers, who meet limited qualifications. Under the terms of the ESPP, employees are able to purchase Company stock at a 5% discount as determined by the fair market value of the Company's stock on the last trading day of each purchase period. Individual employees are limited to $25,000 of common stock purchased in any calendar year.
As of December 31, 2009, there were a total of 1,594,156 shares of restricted stock outstanding under the Company's 2005 stock incentive plan, including 632,737 shares granted to its CEO. The restricted shares generally have a requisite service period of four years. The grant date fair value of restricted stock subject to service conditions only is determined by the Company's closing stock price on the day prior to the date of grant. The vesting of 943,291 shares is also subject to market conditions based on the Company's total shareholder return in comparison to peer group companies for each calendar year. The weighted-average fair value of the restricted shares subject to market conditions was derived using a Monte Carlo technique and the fair value of awards granted in March 2009 was estimated to be $2.61 per share. The estimated grant date fair values of restricted share awards are recognized as expense over the requisite service periods. The Company's total shareholder return for the measurement period of December 31, 2008 through December 31, 2009 exceeded the minimum level required for the eligible restricted shares to vest. On February 2, 2010, the Compensation Committee certified that the required total shareholder return had been met in accordance with the criteria established in the restricted stock agreements and 410,888 shares vested on that date.
F-31
VENOCO, INC. AND SUBSIDIARIES
NOTES TO CONSOLIDATED FINANCIAL STATEMENTS (Continued)
YEARS ENDED DECEMBER 31, 2007, 2008 AND 2009
9. SHARE-BASED PAYMENTS (Continued)
The Company recognized total share-based compensation costs as follows (in thousands):
| |
Years Ended December 31, | ||||||||||
|---|---|---|---|---|---|---|---|---|---|---|---|
| |
2007 | 2008 | 2009 | ||||||||
General and administrative expense |
$ | 4,380 | $ | 5,030 | $ | 3,890 | |||||
Oil and natural gas production expense |
300 | 680 | 700 | ||||||||
Total share-based compensation costs |
4,680 | 5,710 | 4,590 | ||||||||
Less: share-based compensation costs capitalized |
(1,402 | ) | (2,646 | ) | (1,766 | ) | |||||
Share-based compensation expensed |
$ | 3,278 | $ | 3,064 | $ | 2,824 | |||||
As of December 31, 2009, there was $0.8 million of total unrecognized compensation cost related to stock options which is expected to be amortized over a weighted-average period of 1.1 years and $6.0 million of total unrecognized compensation cost related to restricted stock which is expected to be amortized over a weighted-average period of 2.3 years.
The following summarizes the Company's stock option activity for the years ended December 31, 2007, 2008 and 2009:
| |
Years Ended December 31, | |||||||||||||||||||||
|---|---|---|---|---|---|---|---|---|---|---|---|---|---|---|---|---|---|---|---|---|---|---|
| |
2007 | 2008 | 2009 | |||||||||||||||||||
| |
Shares | Weighted Average Exercise Price |
Shares | Weighted Average Exercise Price |
Shares | Weighted Average Exercise Price |
Aggregate Intrinsic Value of Options(1) |
|||||||||||||||
| |
|
|
|
|
|
|
(in thousands) |
|||||||||||||||
Outstanding, start of period |
4,740,663 | $ | 8.55 | 4,159,463 | $ | 9.19 | 3,504,263 | $ | 9.16 | |||||||||||||
Granted |
265,000 | $ | 16.93 | — | — | — | — | |||||||||||||||
Exercised |
(702,690 | ) | $ | 6.80 | (450,460 | ) | $ | 6.59 | (66,560 | ) | $ | 10.23 | ||||||||||
Cancelled |
(143,510 | ) | $ | 13.85 | (204,740 | ) | $ | 15.50 | (135,800 | ) | $ | 11.46 | ||||||||||
Outstanding, end of period |
4,159,463 | $ | 9.19 | 3,504,263 | $ | 9.16 | 3,301,903 | $ | 8.92 | $ | 13,588 | |||||||||||
Exercisable, end of period |
2,296,318 | $ | 8.62 | 2,683,110 | $ | 8.77 | 3,128,153 | $ | 8.50 | $ | 14,214 | |||||||||||
Weighted average grant-date fair value of options granted during the period |
$ | 7.54 | — | — | ||||||||||||||||||
- (1)
- The intrinsic value of a stock option is the amount by which the market value exceeds the exercise price.
F-32
VENOCO, INC. AND SUBSIDIARIES
NOTES TO CONSOLIDATED FINANCIAL STATEMENTS (Continued)
YEARS ENDED DECEMBER 31, 2007, 2008 AND 2009
9. SHARE-BASED PAYMENTS (Continued)
Additional information related to options outstanding at December 31, 2009 is as follows:
| |
Options Outstanding | Options Exercisable | |||||||||||||||||
|---|---|---|---|---|---|---|---|---|---|---|---|---|---|---|---|---|---|---|---|
Range of Exercise Prices
|
Number Outstanding |
Weighted Average Remaining Contractual Life |
Weighted- Average Exercise Prices |
Number Exercisable |
Weighted Average Remaining Contractual Life |
Weighted Average Exercise Prices |
|||||||||||||
$6.00–$7.33 |
2,008,390 | 5.0 | $ | 6.13 | 2,008,390 | 5.0 | $ | 6.13 | |||||||||||
$8.00–$8.68 |
404,613 | 5.0 | $ | 8.33 | 404,613 | 5.0 | $ | 8.33 | |||||||||||
$10.67–$14.97 |
362,750 | 5.2 | $ | 12.54 | 312,750 | 5.0 | $ | 12.22 | |||||||||||
$15.00–$20.00 |
526,150 | 6.6 | $ | 17.58 | 402,400 | 6.4 | $ | 17.60 | |||||||||||
|
3,301,903 | 5.3 | $ | 8.92 | 3,128,153 | 5.1 | $ | 8.50 | |||||||||||
The aggregate intrinsic value of options exercised in 2007, 2008 and 2009 was $8.4 million, $7.1 million and $0.2 million, respectively.
The following summarizes the Company's unvested stock option award activity for the year ended December 31, 2009.
Non-vested stock options
|
Shares | Weighted- Average Grant-Date Fair Value |
|||||
|---|---|---|---|---|---|---|---|
Non-vested at January 1, 2009 |
821,153 | $ | 4.42 | ||||
Granted |
— | — | |||||
Vested |
(635,483 | ) | $ | 3.50 | |||
Forfeited |
(11,920 | ) | $ | 7.98 | |||
Non-vested at December 31, 2009 |
173,750 | $ | 7.54 | ||||
The fair value of each option is estimated on the grant date using the Black-Scholes option valuation model. Option valuation models require the input of highly subjective assumptions, including the expected volatility of the price of the underlying stock. The Company's stock options have characteristics significantly different from those of traded options, and because changes in the subjective input assumptions can materially affect the fair value estimate, it is management's opinion that the valuations afforded by the existing models are different from the value that the options would realize if traded in the market.
The following assumptions were used during 2007 to compute the weighted average fair market value of options granted during the periods presented. No options were granted in 2008 or 2009.
| |
Year Ended December 31, 2007 |
|||
|---|---|---|---|---|
Expected option life |
6 years | |||
Risk free interest rates |
4.3%—5.1% | |||
Estimated volatility |
37% | |||
Dividend yield |
0.0% | |||
F-33
VENOCO, INC. AND SUBSIDIARIES
NOTES TO CONSOLIDATED FINANCIAL STATEMENTS (Continued)
YEARS ENDED DECEMBER 31, 2007, 2008 AND 2009
9. SHARE-BASED PAYMENTS (Continued)
The expected life of the options is based, in part, on historical exercise patterns of the holders of options with similar terms with consideration given to how historical patterns may differ from future exercise patterns based on current or expected market conditions and employee turnover. For the period presented above, the Company calculated the expected life of all options granted using the "simplified" method set forth in Staff Accounting Bulletin 107 (average of vesting period and the term of the option) due to the limited exercise history of options that have been granted. The risk free interest rate was based on the U.S. Treasury yield curve in effect at the time of grant. The expected volatility was based on the historical volatility of other public companies with characteristics similar to the Company for the previous six years.
The following summarizes the Company's unvested restricted stock award activity for the years ended December 31, 2007, 2008 and 2009.
| |
Years Ended December 31, | ||||||||||||||||||
|---|---|---|---|---|---|---|---|---|---|---|---|---|---|---|---|---|---|---|---|
| |
2007 | 2008 | 2009 | ||||||||||||||||
Non-vested restricted stock
|
Shares | Weighted- Average Grant-Date Fair Value |
Shares | Weighted- Average Grant-Date Fair Value |
Shares | Weighted Average Grant Date Fair Value |
|||||||||||||
Non-vested, start of period |
— | — | 370,785 | $ | 14.32 | 851,545 | $ | 12.65 | |||||||||||
Granted |
371,785 | $ | 14.24 | 553,693 | $ | 11.74 | 895,376 | $ | 2.94 | ||||||||||
Vested |
(1,000 | ) | $ | 15.34 | (36,891 | ) | $ | 15.52 | (92,410 | ) | $ | 13.82 | |||||||
Forfeited |
— | — | (36,042 | ) | $ | 13.37 | (60,355 | ) | $ | 10.86 | |||||||||
Non-vested, end of period |
370,785 | $ | 14.24 | 851,545 | $ | 12.65 | 1,594,156 | $ | 7.20 | ||||||||||
10. COMMITMENTS
Leases—The Company has entered into lease agreements for office space and an office building. As of December 31, 2009, future minimum lease payments under operating leases that have initial or remaining non-cancelable terms in excess of one year are $2.4 million in 2010, $2.3 million in 2011, $2.3 million in 2012, $2.3 million in 2013, $1.5 million in 2014 and $6.5 million thereafter. Net rent expense incurred for office space and the office building was $2.7 million, $3.4 million and $3.8 million in 2007, 2008 and 2009, respectively.
11. CONTINGENCIES
Beverly Hills Litigation
Between June 2003 and April 2005, six lawsuits were filed against the Company and certain other energy companies in Los Angeles County Superior Court by persons who attended Beverly Hills High School or who were or are citizens of Beverly Hills/Century City or visitors to that area during the time period running from the 1930s to date. There are approximately 1,000 plaintiffs (including plaintiffs in two related lawsuits in which the Company has not been named) who claimed to be suffering from various forms of cancer or other illnesses, fear they may suffer from such maladies in the future, or are related to persons who have suffered from cancer or other illnesses. Plaintiffs alleged that exposure to substances in the air, soil and water that originated from either oil-field or other operations in the area
F-34
VENOCO, INC. AND SUBSIDIARIES
NOTES TO CONSOLIDATED FINANCIAL STATEMENTS (Continued)
YEARS ENDED DECEMBER 31, 2007, 2008 AND 2009
11. CONTINGENCIES (Continued)
were the cause of the cancers and other maladies. The Company has owned an oil and natural gas facility adjacent to the school since 1995. For the majority of the plaintiffs, their alleged exposures occurred before the Company acquired the facility. All cases were consolidated before one judge. Twelve "representative" plaintiffs were selected to have their cases tried first, while all of the other plaintiffs' cases were stayed. In November 2006, the judge entered summary judgment in favor of all defendants in the test cases, including the Company. The judge dismissed all claims by the test case plaintiffs on the grounds that they offered no evidence of medical causation between the alleged emissions and the plaintiffs' alleged injuries. Plaintiffs appealed the ruling. A decision on the appeal is expected in 2010. The Company vigorously defended the actions, and will continue to do so until they are resolved. Certain defendants have made claims for indemnity for events occurring prior to 1995, which the Company is disputing. The Company cannot predict the cost of these indemnity claims at the present time.
One of the Company's insurers currently is paying for the defense of these lawsuits under a reservation of its rights. Three other insurers that provided insurance coverage to the Company (the "Declining Insurers") took the position that they were not required to provide coverage for losses arising out of, or to defend against, the lawsuits because of a pollution exclusion contained in their policies. In February 2006, the Company filed a declaratory relief action against the Declining Insurers in Santa Barbara County Superior Court seeking a determination that those insurers have a duty to defend the Company in the lawsuits. Two of the three Declining Insurers settled with the Company. The third Declining Insurer disputed the Company's position and in November 2007 the Santa Barbara Court granted that insurer's motion for summary judgment, in part on the basis that the pollution exclusion provision in the policy did not require that insurer to provide a defense for the Company. That decision was upheld on appeal. The Company has no reason to believe that the insurer currently providing defense of these actions will cease providing such defense. If it does, and the Company is unsuccessful in enforcing its rights in any subsequent litigation, the Company may be required to bear the costs of the defense, and those costs may be material. If it ultimately is determined that the pollution exclusion or another exclusion contained in one or more of the Company's policies applies, the Company will not have the protection of those policies with respect to any damages or settlement costs ultimately incurred in the lawsuits.
The Company has not accrued for a loss contingency relating to the Beverly Hills litigation because the Company believes that, although unfavorable outcomes in the proceedings may be reasonably possible, the Company does not consider them to be probable or reasonably estimable. If one or more of these matters are resolved in a manner adverse to the Company, and if insurance coverage is determined not to be applicable, their impact on the Company's results of operations, financial position and/or liquidity could be material.
State Lands Commission Royalty Audit
In 2004 the California State Lands Commission (the "SLC") initiated an audit of the Company's royalty payments for the period from August 1, 1997 through December 31, 2003 on oil and gas produced from the South Ellwood Field, State Leases 3120 and 3240 (the "Leases"). The audit period was subsequently extended through September 2009. In December 2009, the Company was notified that the SLC's audit for the period January 2004 through September 2009 (the "Audit Period") indicates that the Company underpaid royalties due on oil and gas production from the Leases during the Audit
F-35
VENOCO, INC. AND SUBSIDIARIES
NOTES TO CONSOLIDATED FINANCIAL STATEMENTS (Continued)
YEARS ENDED DECEMBER 31, 2007, 2008 AND 2009
11. CONTINGENCIES (Continued)
Period by approximately $5.8 million. Based on the Company's initial review of the SLC's audit contentions and additional historical records, the Company believes that it may have overpaid royalties due on oil and gas production during the Audit Period and for prior periods and may be owed a refund of such overpayments. The Company believes the position of the SLC is without merit and it intends to vigorously contest the audit findings and to enforce its rights for refunds of royalties it may have overpaid during the Audit Period and prior periods. The Company has not accrued any amounts related to the SLC audit contentions or potential refunds.
Other
In addition, the Company is a party from time to time to other claims and legal actions that arise in the ordinary course of business. The Company believes that the ultimate impact, if any, with respect to these other claims and legal actions will not have a material effect on its consolidated financial position, results of operations or liquidity.
12. QUARTERLY FINANCIAL DATA (UNAUDITED)
The following is a summary of the unaudited financial data for each quarter for the years ended December 31, 2008 and 2009 (in thousands, except per share data):
| |
Three Months Ended | |||||||||||||
|---|---|---|---|---|---|---|---|---|---|---|---|---|---|---|
| |
March 31, 2008 |
June 30, 2008 |
September 30, 2008 |
December 31, 2008 |
||||||||||
Year Ended December 31, 2008: |
||||||||||||||
Revenues |
$ | 137,450 | $ | 168,047 | $ | 159,153 | $ | 94,870 | ||||||
Income (loss) from operations |
62,839 | 90,464 | 70,870 | (642,902 | ) | |||||||||
Net income (loss) |
(25,456 | ) | (172,569 | ) | 220,937 | (414,044 | ) | |||||||
Basic earnings per common share |
$ | (0.51 | ) | $ | (3.43 | ) | $ | 4.29 | $ | (8.17 | ) | |||
Diluted earnings per common share |
$ | (0.51 | ) | $ | (3.43 | ) | $ | 4.19 | $ | (8.17 | ) | |||
| |
Three Months Ended | |||||||||||||
|---|---|---|---|---|---|---|---|---|---|---|---|---|---|---|
| |
March 31, 2009 |
June 30, 2009 |
September 30, 2009 |
December 31, 2009 |
||||||||||
Year Ended December 31, 2009: |
||||||||||||||
Revenues |
$ | 58,316 | $ | 62,814 | $ | 70,143 | $ | 80,923 | ||||||
Income (loss) from operations |
(1,494 | ) | 5,956 | 7,974 | 20,624 | |||||||||
Net income (loss) |
25,205 | (59,477 | ) | (5,272 | ) | (7,754 | ) | |||||||
Basic earnings per common share |
$ | 0.49 | $ | (1.17 | ) | $ | (0.10 | ) | $ | (0.15 | ) | |||
Diluted earnings per common share |
$ | 0.49 | $ | (1.17 | ) | $ | (0.10 | ) | $ | (0.15 | ) | |||
During the quarter ended December 31, 2009, the Company recognized a loss on the extinguishment of debt of $7.9 million related to the refinancing of the $150 million senior notes which occurred in October 2009.
During the quarter ended December 31, 2008, the Company recognized an impairment of $641.0 million as a result of the ceiling test performed pursuant to the full cost method of accounting for oil and natural gas properties.
F-36
VENOCO, INC. AND SUBSIDIARIES
NOTES TO CONSOLIDATED FINANCIAL STATEMENTS (Continued)
YEARS ENDED DECEMBER 31, 2007, 2008 AND 2009
13. SUPPLEMENTAL INFORMATION ON OIL AND NATURAL GAS EXPLORATION, DEVELOPMENT AND PRODUCTION ACTIVITIES (UNAUDITED)
The following information concerning the Company's natural gas and oil operations has been provided pursuant to the FASB guidance regarding Oil and Gas Reserve Estimation and Disclosures. At December 31, 2009, the Company's oil and natural gas producing activities were conducted onshore within the continental United States and offshore in federal and state waters off the coast of California. The evaluations of the oil and natural gas reserves at December 31, 2007, 2008 and 2009 were prepared by DeGolyer and MacNaughton, independent petroleum reserve engineers.
Capitalized Costs of Oil and Natural Gas Properties
| |
As of December 31, | ||||||||||
|---|---|---|---|---|---|---|---|---|---|---|---|
| |
2007 | 2008 | 2009 | ||||||||
| |
(in thousands) |
||||||||||
Unevaluated properties(1) |
$ | 12,034 | $ | 30,228 | $ | 31,934 | |||||
Properties subject to amortization |
1,319,496 | 1,641,571 | 1,640,968 | ||||||||
Total capitalized costs |
1,331,530 | 1,671,799 | 1,672,902 | ||||||||
Accumulated depreciation, depletion and amortization |
(221,953 | ) | (351,334 | ) | (1,073,664 | ) | |||||
Impairment |
— | (641,000 | ) | — | |||||||
Net capitalized costs |
$ | 1,109,577 | $ | 679,465 | $ | 599,238 | |||||
- (1)
- Unevaluated costs represent amounts the Company excludes from the amortization base until proved reserves are established or impairment is determined. The Company estimates that the remaining costs will be evaluated within three years.
Capitalized Costs Incurred
Costs incurred for oil and natural gas exploration, development and acquisition are summarized below. Costs incurred during the years ended December 31, 2007, 2008 and 2009 include capitalized general and administrative costs related to acquisition, exploration and development of natural gas and oil properties of $11.8 million, $18.8 million and $25.1 million, respectively. Costs incurred also include asset retirement costs of $6.3 million, $24.2 million and $6.6 million during the years ended December 31, 2007, 2008 and 2009, respectively.
| |
Years ended December 31, | ||||||||||
|---|---|---|---|---|---|---|---|---|---|---|---|
| |
2007 | 2008 | 2009 | ||||||||
| |
(in thousands) |
||||||||||
Property acquisition and leasehold costs: |
|||||||||||
Unevaluated property |
$ | 4,985 | $ | 20,561 | $ | 8,972 | |||||
Proved property |
134,890 | 23,035 | 22,784 | ||||||||
Exploration costs |
99,822 | 117,905 | 61,547 | ||||||||
Development costs |
210,264 | 178,767 | 97,782 | ||||||||
Total costs incurred |
$ | 449,961 | $ | 340,268 | $ | 191,085 | |||||
F-37
VENOCO, INC. AND SUBSIDIARIES
NOTES TO CONSOLIDATED FINANCIAL STATEMENTS (Continued)
YEARS ENDED DECEMBER 31, 2007, 2008 AND 2009
13. SUPPLEMENTAL INFORMATION ON OIL AND NATURAL GAS EXPLORATION, DEVELOPMENT AND PRODUCTION ACTIVITIES (UNAUDITED) (Continued)
Estimated Net Quantities of Natural Gas and Oil Reserves
In January 2010, the FASB issued an ASU to amend existing oil and gas reserve accounting and disclosure guidance to align its requirements with the SEC's revised rules discussed in footnote 1. The significant revisions involve revised definitions of oil and gas producing activities, changing the pricing used to estimate reserves at period end to a twelve month arithmetic average of the first day of the month prices and additional disclosure requirements. In contrast to the SEC rule, the FASB does not permit the disclosure of probable and possible reserves in the supplemental oil and gas information in the notes to the financial statements. The amendments are effective for annual reporting periods ending on or after December 31, 2009. Application of the revised rules is prospective and companies are not required to change prior period presentation to conform to the amendments. Application of the amended guidance has only resulted in changes to the prices used to determine proved reserves at December 31, 2009, which did not result in a significant change to the Company's proved oil and natural gas reserves.
The following table sets forth the Company's net proved reserves, including changes, proved developed reserves and proved undeveloped reserves (all within the United States) at the end of each of the three years in the periods ended December 31, 2007, 2008 and 2009.
| |
Crude Oil, Liquids and Condensate (MBbls) |
Natural Gas (MMcf) | ||||||||||||||||||
|---|---|---|---|---|---|---|---|---|---|---|---|---|---|---|---|---|---|---|---|---|
| |
2007(1) | 2008(2) | 2009(3) | 2007(1) | 2008(2) | 2009(3) | ||||||||||||||
Beginning of the year reserves |
49,607 | 64,176 | 58,159 | 229,952 | 214,605 | 236,166 | ||||||||||||||
Revisions of previous estimates |
9,759 | (5,202 | ) | 3,723 | (28,201 | ) | (4,880 | ) | 7,965 | |||||||||||
Extensions and discoveries(4) |
4 | 3,177 | 874 | 13,359 | 47,223 | 38,532 | ||||||||||||||
Purchases of reserves in place |
8,787 | 99 | — | 18,390 | 2,268 | 20,548 | ||||||||||||||
Production |
(3,981 | ) | (4,091 | ) | (3,402 | ) | (18,895 | ) | (23,050 | ) | (24,748 | ) | ||||||||
Sales of reserves in place |
— | — | (7,388 | ) | — | — | (381 | ) | ||||||||||||
End of year reserves |
64,176 | 58,159 | 51,966 | 214,605 | 236,166 | 278,082 | ||||||||||||||
Proved developed reserves: |
||||||||||||||||||||
Beginning of year |
37,497 | 44,730 | 34,468 | 79,796 | 96,522 | 107,418 | ||||||||||||||
End of year |
44,730 | 34,468 | 29,309 | 96,522 | 107,418 | 126,671 | ||||||||||||||
Proved undeveloped reserves: |
||||||||||||||||||||
Beginning of year |
12,110 | 19,446 | 23,691 | 150,156 | 118,083 | 128,749 | ||||||||||||||
End of year |
19,446 | 23,691 | 22,657 | 118,083 | 128,749 | 151,411 | ||||||||||||||
- (1)
- Based
on unescalated year-end posted prices of (i) $95.97 per Bbl for oil and natural gas liquids, and adjusted for quality,
transportation fees and regional price differentials and (ii) $7.48 per MMBtu for natural gas, and adjusted for energy content, transportation fees and regional price differentials.
- (2)
- Based on unescalated year-end posted prices of $44.60 per Bbl for oil and natural gas liquids and $5.62 per MMBtu for natural gas, and adjusted, in each case, as described in note (1) above.
F-38
VENOCO, INC. AND SUBSIDIARIES
NOTES TO CONSOLIDATED FINANCIAL STATEMENTS (Continued)
YEARS ENDED DECEMBER 31, 2007, 2008 AND 2009
13. SUPPLEMENTAL INFORMATION ON OIL AND NATURAL GAS EXPLORATION, DEVELOPMENT AND PRODUCTION ACTIVITIES (UNAUDITED) (Continued)
- (3)
- Based
on unescalated twelve month arithmetic average of the first day of the month prices of $61.04 per Bbl for oil and natural gas liquids and $3.87 per
MMBtu for natural gas, and adjusted, in each case, as described in note (1) above.
- (4)
- Extensions for the years ended December 31, 2007, 2008 and 2009 include 1,939 MMcf, 4,962 MMcf, and 32,001 MMcf, respectively, resulting from the Company's infill program in the Sacramento Basin.
Standardized Measure of Discounted Future Net Cash Flows Relating to Proved Oil and Natural Gas Reserves
The following summarizes the policies used in the preparation of the accompanying oil and natural gas reserve disclosures, standardized measures of discounted future net cash flows from proved oil and natural gas reserves and the reconciliations of standardized measures from year to year. The information disclosed, as prescribed by the Oil and Gas Reserve Estimation and Disclosure guidance issued by the FASB, is an attempt to present the information in a manner comparable with industry peers.
The information is based on estimates of proved reserves attributable to the Company's interest in oil and natural gas properties as of December 31 of the years presented. These estimates were prepared by independent petroleum reserve engineers. Proved reserves are estimated quantities of crude oil and natural gas which geological and engineering data demonstrate with reasonable certainty to be recoverable in future years from known reservoirs under existing economic and operating conditions.
The standardized measure of discounted future net cash flows from production of proved reserves was developed as follows:
(1) Estimates are made of quantities of proved reserves and future periods during which they are expected to be produced based on year-end economic conditions.
(2) The estimated future cash flows are compiled by applying the twelve month average of the first of the month prices of crude oil and natural gas relating to the Company's proved reserves to the year-end quantities of those reserves for reserves as of December 31, 2009. The estimated future cash flows for periods prior to December 31, 2009 are compiled by applying the year-end crude oil and natural gas prices relating to the Company's proved reserves to the year-end quantities of those reserves.
(3) The future cash flows are reduced by estimated production costs, costs to develop and produce the proved reserves and abandonment costs, all based on year-end economic conditions.
(4) Future income tax expenses are based on year-end statutory tax rates giving effect to the remaining tax basis in the oil and natural gas properties, other deductions, credits and allowances relating to the Company's proved oil and natural gas reserves.
(5) Future net cash flows are discounted to present value by applying a discount rate of 10%.
The standardized measure of discounted future net cash flows does not purport, nor should it be interpreted, to present the fair value of the Company's oil and natural gas reserves. An estimate of fair
F-39
VENOCO, INC. AND SUBSIDIARIES
NOTES TO CONSOLIDATED FINANCIAL STATEMENTS (Continued)
YEARS ENDED DECEMBER 31, 2007, 2008 AND 2009
13. SUPPLEMENTAL INFORMATION ON OIL AND NATURAL GAS EXPLORATION, DEVELOPMENT AND PRODUCTION ACTIVITIES (UNAUDITED) (Continued)
value would also take into account, among other things, the recovery of reserves not presently classified as proved, anticipated future changes in prices and costs and a discount factor more representative of the time value of money and the risks inherent in reserve estimates.
The standardized measure of discounted future net cash flows relating to proved oil and natural gas reserves is as follows and does not include cash flows associated with hedges outstanding at each of the respective reporting dates.
| |
As of December 31, | ||||||||||
|---|---|---|---|---|---|---|---|---|---|---|---|
| |
2007 | 2008 | 2009 | ||||||||
| |
(in thousands) |
||||||||||
Future cash inflows |
$ | 7,027,334 | $ | 3,387,228 | $ | 3,682,214 | |||||
Future production costs |
(2,155,902 | ) | (1,652,888 | ) | (1,490,694 | ) | |||||
Future development costs |
(562,852 | ) | (636,285 | ) | (676,801 | ) | |||||
Future income taxes |
(1,275,076 | ) | (10,576 | ) | (229,549 | ) | |||||
Future net cash flows |
3,033,504 | 1,087,479 | 1,285,170 | ||||||||
10% annual discount for estimated timing of cash flows |
(1,377,863 | ) | (477,383 | ) | (592,365 | ) | |||||
Standardized measure of discounted future net cash flows |
$ | 1,655,641 | $ | 610,096 | $ | 692,805 | |||||
The following table summarizes changes in the standardized measure of discounted future net cash flows.
| |
Years ended December 31, | ||||||||||
|---|---|---|---|---|---|---|---|---|---|---|---|
| |
2007 | 2008 | 2009 | ||||||||
| |
(in thousands) |
||||||||||
Beginning of the year |
$ | 819,302 | $ | 1,655,641 | $ | 610,096 | |||||
Changes in prices and production costs |
1,145,648 | (1,599,448 | ) | 214,179 | |||||||
Revisions of previous quantity estimates |
179,148 | (60,099 | ) | 59,878 | |||||||
Changes in future development costs |
(132,166 | ) | (92,391 | ) | (11,270 | ) | |||||
Development costs incurred during the period |
58,393 | 56,328 | 49,194 | ||||||||
Extensions, discoveries and improved recovery, net of related costs |
49,055 | 110,378 | 47,177 | ||||||||
Sales of oil and natural gas, net of production costs |
(252,796 | ) | (400,456 | ) | (158,659 | ) | |||||
Accretion of discount |
112,108 | 238,875 | 61,011 | ||||||||
Net change in income taxes |
(401,902 | ) | 697,089 | (101,663 | ) | ||||||
Sale of reserves in place |
— | — | (55,600 | ) | |||||||
Purchases of reserves in place |
168,210 | 4,766 | 15,737 | ||||||||
Production timing and other |
(89,359 | ) | (587 | ) | (37,275 | ) | |||||
End of year |
$ | 1,655,641 | $ | 610,096 | $ | 692,805 | |||||
F-40
VENOCO, INC. AND SUBSIDIARIES
NOTES TO CONSOLIDATED FINANCIAL STATEMENTS (Continued)
YEARS ENDED DECEMBER 31, 2007, 2008 AND 2009
14. GUARANTOR FINANCIAL INFORMATION
All subsidiaries of the Company other than Ellwood Pipeline Inc. ("Guarantors") have fully and unconditionally guaranteed, on a joint and several basis, the Company's obligations under its 11.50% senior notes. Ellwood Pipeline, Inc. is not a Guarantor (the "Non-Guarantor Subsidiary"). The condensed consolidating financial information for prior periods has been revised to reflect the guarantor and non-guarantor status of the Company's subsidiaries as of December 31, 2009. All Guarantors are 100% owned by the Company. Presented below are the Company's condensed consolidating balance sheets, statements of operations and statements of cash flows as required by Rule 3-10 of Regulation S-X of the Securities Exchange Act of 1934.
F-41
VENOCO, INC. AND SUBSIDIARIES
NOTES TO CONSOLIDATED FINANCIAL STATEMENTS (Continued)
YEARS ENDED DECEMBER 31, 2007, 2008 AND 2009
14. GUARANTOR FINANCIAL INFORMATION (Continued)
CONDENSED CONSOLIDATING BALANCE SHEETS
AT DECEMBER 31, 2008
(in thousands)
| |
Venoco, Inc. | Guarantor Subsidiaries |
Non- Guarantor Subsidiary |
Eliminations | Consolidated | ||||||||||||
|---|---|---|---|---|---|---|---|---|---|---|---|---|---|---|---|---|---|
ASSETS |
|||||||||||||||||
CURRENT ASSETS: |
|||||||||||||||||
Cash and cash equivalents |
$ | 190 | $ | 1 | $ | — | $ | — | $ | 191 | |||||||
Accounts receivable |
33,654 | 7,652 | — | — | 41,306 | ||||||||||||
Inventories |
5,544 | 6,817 | — | — | 12,361 | ||||||||||||
Prepaid expenses and other current assets |
4,314 | — | — | — | 4,314 | ||||||||||||
Income taxes receivable |
546 | — | — | — | 546 | ||||||||||||
Commodity derivatives |
57,247 | — | — | — | 57,247 | ||||||||||||
TOTAL CURRENT ASSETS |
101,495 | 14,470 | — | — | 115,965 | ||||||||||||
PROPERTY, PLANT & EQUIPMENT, NET |
580,317 | 121,353 | 1,064 | — | 702,734 | ||||||||||||
COMMODITY DERIVATIVES |
35,314 | — | — | — | 35,314 | ||||||||||||
INVESTMENTS IN AFFILIATES |
498,670 | — | — | (498,670 | ) | — | |||||||||||
OTHER |
9,546 | 695 | — | — | 10,241 | ||||||||||||
TOTAL ASSETS |
$ | 1,225,342 | $ | 136,518 | $ | 1,064 | $ | (498,670 | ) | $ | 864,254 | ||||||
LIABILITIES AND STOCKHOLDERS' EQUITY |
|||||||||||||||||
CURRENT LIABILITIES: |
|||||||||||||||||
Accounts payable and accrued liabilities |
$ | 67,832 | $ | 7,568 | $ | — | $ | — | $ | 75,400 | |||||||
Undistributed revenue payable |
8,277 | — | — | — | 8,277 | ||||||||||||
Interest payable |
5,325 | — | — | — | 5,325 | ||||||||||||
Current maturities of long-term debt |
2,598 | — | — | — | 2,598 | ||||||||||||
Commodity and interest derivatives |
21,284 | — | — | — | 21,284 | ||||||||||||
TOTAL CURRENT LIABILITIES: |
105,316 | 7,568 | — | — | 112,884 | ||||||||||||
LONG-TERM DEBT |
797,670 | — | — | — | 797,670 | ||||||||||||
COMMODITY AND INTEREST DERIVATIVES |
9,363 | — | — | — | 9,363 | ||||||||||||
ASSET RETIREMENT OBLIGATIONS |
68,678 | 10,107 | 719 | — | 79,504 | ||||||||||||
INTERCOMPANY PAYABLES (RECEIVABLES) |
379,482 | (336,243 | ) | (43,239 | ) | — | — | ||||||||||
TOTAL LIABILITIES |
1,360,509 | (318,568 | ) | (42,520 | ) | — | 999,421 | ||||||||||
TOTAL STOCKHOLDERS' EQUITY |
(135,167 | ) | 455,086 | 43,584 | (498,670 | ) | (135,167 | ) | |||||||||
TOTAL LIABILITIES AND STOCKHOLDERS' EQUITY |
$ | 1,225,342 | $ | 136,518 | $ | 1,064 | $ | (498,670 | ) | $ | 864,254 | ||||||
F-42
VENOCO, INC. AND SUBSIDIARIES
NOTES TO CONSOLIDATED FINANCIAL STATEMENTS (Continued)
YEARS ENDED DECEMBER 31, 2007, 2008 AND 2009
14. GUARANTOR FINANCIAL INFORMATION (Continued)
CONDENSED CONSOLIDATING BALANCE SHEETS
AT DECEMBER 31, 2009
(in thousands)
| |
Venoco, Inc. | Guarantor Subsidiaries |
Non- Guarantor Subsidiary |
Eliminations | Consolidated | ||||||||||||
|---|---|---|---|---|---|---|---|---|---|---|---|---|---|---|---|---|---|
ASSETS |
|||||||||||||||||
CURRENT ASSETS: |
|||||||||||||||||
Cash and cash equivalents |
$ | 418 | $ | 1 | $ | — | $ | — | $ | 419 | |||||||
Accounts receivable |
29,282 | 4,110 | 461 | — | 33,853 | ||||||||||||
Inventories |
5,813 | 326 | — | — | 6,139 | ||||||||||||
Prepaid expenses and other current assets |
4,276 | — | — | — | 4,276 | ||||||||||||
Income taxes receivable |
3,116 | — | — | — | 3,116 | ||||||||||||
Deferred income taxes |
8,400 | — | — | — | 8,400 | ||||||||||||
Commodity derivatives |
34,611 | — | — | — | 34,611 | ||||||||||||
TOTAL CURRENT ASSETS |
85,916 | 4,437 | 461 | — | 90,814 | ||||||||||||
PROPERTY, PLANT & EQUIPMENT, NET |
692,695 | (76,380 | ) | 3,115 | — | 619,430 | |||||||||||
COMMODITY DERIVATIVES |
18,720 | — | — | — | 18,720 | ||||||||||||
INVESTMENTS IN AFFILIATES |
512,704 | — | — | (512,704 | ) | — | |||||||||||
OTHER |
10,235 | 344 | — | — | 10,579 | ||||||||||||
TOTAL ASSETS |
$ | 1,320,270 | $ | (71,599 | ) | $ | 3,576 | $ | (512,704 | ) | $ | 739,543 | |||||
LIABILITIES AND STOCKHOLDERS' EQUITY |
|||||||||||||||||
CURRENT LIABILITIES: |
|||||||||||||||||
Accounts payable and accrued liabilities |
$ | 43,915 | $ | 4,794 | $ | — | $ | — | $ | 48,709 | |||||||
Undistributed revenue payable |
8,146 | — | — | — | 8,146 | ||||||||||||
Interest payable |
4,885 | — | — | — | 4,885 | ||||||||||||
Commodity and interest derivatives |
49,709 | — | — | — | 49,709 | ||||||||||||
TOTAL CURRENT LIABILITIES: |
106,655 | 4,794 | — | — | 111,449 | ||||||||||||
LONG-TERM DEBT |
695,029 | — | — | — | 695,029 | ||||||||||||
COMMODITY AND INTEREST DERIVATIVES |
15,076 | — | — | — | 15,076 | ||||||||||||
ASSET RETIREMENT OBLIGATIONS |
83,838 | 7,725 | 922 | — | 92,485 | ||||||||||||
INTERCOMPANY PAYABLES (RECEIVABLES) |
594,168 | (546,512 | ) | (47,656 | ) | — | — | ||||||||||
TOTAL LIABILITIES |
1,494,766 | (533,993 | ) | (46,734 | ) | — | 914,039 | ||||||||||
TOTAL STOCKHOLDERS' EQUITY |
(174,496 | ) | 462,394 | 50,310 | (512,704 | ) | (174,496 | ) | |||||||||
TOTAL LIABILITIES AND STOCKHOLDERS' EQUITY |
$ | 1,320,270 | $ | (71,599 | ) | $ | 3,576 | $ | (512,704 | ) | $ | 739,543 | |||||
F-43
VENOCO, INC. AND SUBSIDIARIES
NOTES TO CONSOLIDATED FINANCIAL STATEMENTS (Continued)
YEARS ENDED DECEMBER 31, 2007, 2008 AND 2009
14. GUARANTOR FINANCIAL INFORMATION (Continued)
CONDENSED CONSOLIDATING STATEMENTS OF OPERATIONS
YEAR ENDED DECEMBER 31, 2007
(in thousands)
| |
Venoco, Inc. | Guarantor Subsidiaries |
Non-Guarantor Subsidiary |
Eliminations | Consolidated | |||||||||||||
|---|---|---|---|---|---|---|---|---|---|---|---|---|---|---|---|---|---|---|
REVENUES: |
||||||||||||||||||
Oil and natural gas sales |
$ | 277,680 | $ | 95,475 | $ | — | $ | — | $ | 373,155 | ||||||||
Other |
2,823 | 54 | 5,193 | (4,715 | ) | 3,355 | ||||||||||||
Total revenues |
280,503 | 95,529 | 5,193 | (4,715 | ) | 376,510 | ||||||||||||
EXPENSES: |
||||||||||||||||||
Oil and natural gas production |
73,737 | 43,840 | 1,744 | — | 119,321 | |||||||||||||
Transportation expense |
10,491 | 5 | — | (4,435 | ) | 6,061 | ||||||||||||
Depletion, depreciation and amortization |
78,112 | 20,622 | 80 | — | 98,814 | |||||||||||||
Accretion of asset retirement obligations |
3,334 | 547 | 33 | — | 3,914 | |||||||||||||
General and administrative, net of amounts capitalized |
29,425 | 2,344 | 281 | (280 | ) | 31,770 | ||||||||||||
Total expenses |
195,099 | 67,358 | 2,138 | (4,715 | ) | 259,880 | ||||||||||||
Income from operations |
85,404 | 28,171 | 3,055 | — | 116,630 | |||||||||||||
FINANCING COSTS AND OTHER: |
||||||||||||||||||
Interest expense, net |
62,876 | (56 | ) | (2,705 | ) | — | 60,115 | |||||||||||
Amortization of deferred loan costs |
4,197 | — | — | — | 4,197 | |||||||||||||
Interest rate derivative losses, net |
17,177 | — | — | — | 17,177 | |||||||||||||
Loss on extinguishment of debt |
12,063 | — | — | — | 12,063 | |||||||||||||
Commodity derivative losses (gains), net |
142,650 | — | — | — | 142,650 | |||||||||||||
Total financing costs and other |
238,963 | (56 | ) | (2,705 | ) | — | 236,202 | |||||||||||
Equity in subsidiary income |
20,854 | — | — | (20,854 | ) | — | ||||||||||||
Income (loss) before income taxes |
(132,705 | ) | 28,227 | 5,760 | (20,854 | ) | (119,572 | ) | ||||||||||
Income tax provision (benefit) |
(59,333 | ) | 10,907 | 2,226 | — | (46,200 | ) | |||||||||||
Net income (loss) |
$ | (73,372 | ) | $ | 17,320 | $ | 3,534 | $ | (20,854 | ) | $ | (73,372 | ) | |||||
F-44
VENOCO, INC. AND SUBSIDIARIES
NOTES TO CONSOLIDATED FINANCIAL STATEMENTS (Continued)
YEARS ENDED DECEMBER 31, 2007, 2008 AND 2009
14. GUARANTOR FINANCIAL INFORMATION (Continued)
CONDENSED CONSOLIDATING STATEMENTS OF OPERATIONS
YEAR ENDED DECEMBER 31, 2008
(in thousands)
| |
Venoco, Inc. | Guarantor Subsidiaries |
Non-Guarantor Subsidiary |
Eliminations | Consolidated | |||||||||||||
|---|---|---|---|---|---|---|---|---|---|---|---|---|---|---|---|---|---|---|
REVENUES: |
||||||||||||||||||
Oil and natural gas sales |
$ | 412,493 | $ | 143,424 | $ | — | $ | — | $ | 555,917 | ||||||||
Other |
3,121 | 30 | 5,451 | (4,999 | ) | 3,603 | ||||||||||||
Total revenues |
415,614 | 143,454 | 5,451 | (4,999 | ) | 559,520 | ||||||||||||
EXPENSES: |
||||||||||||||||||
Oil and natural gas production |
94,110 | 53,228 | 2,166 | — | 149,504 | |||||||||||||
Transportation expense |
10,637 | 24 | — | (4,703 | ) | 5,958 | ||||||||||||
Depletion, depreciation and amortization |
109,846 | 24,545 | 92 | — | 134,483 | |||||||||||||
Impairment of oil and natural gas properties |
641,000 | — | — | — | 641,000 | |||||||||||||
Accretion of asset retirement obligations |
3,334 | 806 | 63 | — | 4,203 | |||||||||||||
General and administrative, net of amounts capitalized |
39,793 | 3,308 | 296 | (296 | ) | 43,101 | ||||||||||||
Total expenses |
898,720 | 81,911 | 2,617 | (4,999 | ) | 978,249 | ||||||||||||
Income from operations |
(483,106 | ) | 61,543 | 2,834 | — | (418,729 | ) | |||||||||||
FINANCING COSTS AND OTHER: |
||||||||||||||||||
Interest expense, net |
57,260 | (18 | ) | (3,193 | ) | — | 54,049 | |||||||||||
Amortization of deferred loan costs |
3,344 | — | — | — | 3,344 | |||||||||||||
Interest rate derivative losses, net |
20,567 | — | — | — | 20,567 | |||||||||||||
Commodity derivative losses (gains), net |
(116,757 | ) | — | — | — | (116,757 | ) | |||||||||||
Total financing costs and other |
(35,586 | ) | (18 | ) | (3,193 | ) | — | (38,797 | ) | |||||||||
Equity in subsidiary income |
41,904 | — | — | (41,904 | ) | — | ||||||||||||
Income (loss) before income taxes |
(405,616 | ) | 61,561 | 6,027 | (41,904 | ) | (379,932 | ) | ||||||||||
Income tax provision (benefit) |
(14,484 | ) | 23,393 | 2,291 | — | 11,200 | ||||||||||||
Net income (loss) |
$ | (391,132 | ) | $ | 38,168 | $ | 3,736 | $ | (41,904 | ) | $ | (391,132 | ) | |||||
F-45
VENOCO, INC. AND SUBSIDIARIES
NOTES TO CONSOLIDATED FINANCIAL STATEMENTS (Continued)
YEARS ENDED DECEMBER 31, 2007, 2008 AND 2009
14. GUARANTOR FINANCIAL INFORMATION (Continued)
CONDENSED CONSOLIDATING STATEMENTS OF OPERATIONS
YEAR ENDED DECEMBER 31, 2009
(in thousands)
| |
Venoco, Inc. | Guarantor Subsidiaries |
Non-Guarantor Subsidiary |
Eliminations | Consolidated | |||||||||||||
|---|---|---|---|---|---|---|---|---|---|---|---|---|---|---|---|---|---|---|
REVENUES: |
||||||||||||||||||
Oil and natural gas sales |
$ | 235,876 | $ | 32,989 | $ | — | $ | — | $ | 268,865 | ||||||||
Other |
2,810 | 114 | 5,667 | (5,260 | ) | 3,331 | ||||||||||||
Total revenues |
238,686 | 33,103 | 5,667 | (5,260 | ) | 272,196 | ||||||||||||
EXPENSES: |
||||||||||||||||||
Oil and natural gas production |
88,856 | 14,394 | 2,091 | — | 105,341 | |||||||||||||
Transportation expense |
9,727 | 77 | — | (4,939 | ) | 4,865 | ||||||||||||
Depletion, depreciation and amortization |
78,209 | 7,862 | 155 | — | 86,226 | |||||||||||||
Accretion of asset retirement obligations |
5,125 | 587 | 53 | — | 5,765 | |||||||||||||
General and administrative, net of amounts capitalized |
34,058 | 2,881 | 321 | (321 | ) | 36,939 | ||||||||||||
Total expenses |
215,975 | 25,801 | 2,620 | (5,260 | ) | 239,136 | ||||||||||||
Income from operations |
22,711 | 7,302 | 3,047 | — | 33,060 | |||||||||||||
FINANCING COSTS AND OTHER: |
||||||||||||||||||
Interest expense, net |
44,669 | (6 | ) | (3,679 | ) | — | 40,984 | |||||||||||
Amortization of deferred loan costs |
2,862 | — | — | — | 2,862 | |||||||||||||
Interest rate derivative losses, net |
16,676 | — | — | — | 16,676 | |||||||||||||
Loss on extinguishment of debt |
8,493 | — | — | — | 8,493 | |||||||||||||
Commodity derivative losses (gains), net |
25,743 | — | — | — | 25,743 | |||||||||||||
Total financing costs and other |
98,443 | (6 | ) | 3,679 | — | 94,758 | ||||||||||||
Equity in subsidiary income |
8,701 | — | — | (8,701 | ) | — | ||||||||||||
Income (loss) before income taxes |
(67,031 | ) | 7,308 | 6,726 | (8,701 | ) | (61,698 | ) | ||||||||||
Income tax provision (benefit) |
(19,733 | ) | 2,777 | 2,556 | — | (14,400 | ) | |||||||||||
Net income (loss) |
$ | (47,298 | ) | $ | 4,531 | $ | 4,170 | $ | (8,701 | ) | $ | (47,298 | ) | |||||
F-46
VENOCO, INC. AND SUBSIDIARIES
NOTES TO CONSOLIDATED FINANCIAL STATEMENTS (Continued)
YEARS ENDED DECEMBER 31, 2007, 2008 AND 2009
14. GUARANTOR FINANCIAL INFORMATION (Continued)
CONDENSED CONSOLIDATING STATEMENT OF CASH FLOWS
FOR THE YEAR ENDED DECEMBER 31, 2007
(in thousands)
| |
Venoco, Inc. | Guarantor Subsidiaries |
Non- Guarantor Subsidiary |
Eliminations | Consolidated | |||||||||||||
|---|---|---|---|---|---|---|---|---|---|---|---|---|---|---|---|---|---|---|
CASH FLOWS FROM OPERATING ACTIVITIES: |
||||||||||||||||||
Net cash provided by (used in) operating activities |
$ | 121,086 | $ | 36,126 | $ | 3,651 | $ | — | $ | 160,863 | ||||||||
CASH FLOWS FROM INVESTING ACTIVITIES: |
||||||||||||||||||
Expenditures for oil and natural gas properties |
(212,717 | ) | (104,073 | ) | (104 | ) | — | (316,894 | ) | |||||||||
Acquisitions of oil and natural gas properties |
(72,512 | ) | (49,310 | ) | — | — | (121,822 | ) | ||||||||||
Expenditures for property and equipment and other |
(5,182 | ) | (207 | ) | — | — | (5,389 | ) | ||||||||||
Proceeds from sale of oil and natural gas properties |
829 | 9,913 | — | — | 10,742 | |||||||||||||
Acquisition of Texcal Energy, net of cash acquired |
— | — | — | — | — | |||||||||||||
Net cash provided by (used in) investing activities |
(289,582 | ) | (143,677 | ) | (104 | ) | — | (433,363 | ) | |||||||||
CASH FLOWS FROM FINANCING ACTIVITIES: |
||||||||||||||||||
Net proceeds from (repayments of) intercompany borrowings |
(96,601 | ) | 100,166 | (3,565 | ) | — | — | |||||||||||
Proceeds from long-term debt |
777,421 | — | — | — | 777,421 | |||||||||||||
Principal payments on long-term debt |
(619,729 | ) | — | — | — | (619,729 | ) | |||||||||||
Payments for deferred loan costs |
(4,923 | ) | — | — | — | (4,923 | ) | |||||||||||
Premium to retire debt |
(3,489 | ) | — | — | — | (3,489 | ) | |||||||||||
Proceeds from derivative premium financing |
3,780 | — | — | — | 3,780 | |||||||||||||
Proceeds from issuance of common stock and other stock activity |
116,034 | — | — | — | 116,034 | |||||||||||||
Proceeds from exercise of stock options |
4,777 | — | — | — | 4,777 | |||||||||||||
Net cash provided by (used in) financing activities |
177,270 | 100,166 | (3,565 | ) | — | 273,871 | ||||||||||||
Net increase (decrease) in cash and cash equivalents |
8,774 | (7,385 | ) | (18 | ) | — | 1,371 | |||||||||||
Cash and cash equivalents, beginning of period |
(12 | ) | 8,358 | 18 | — | 8,364 | ||||||||||||
Cash and cash equivalents, end of period |
$ | 8,762 | $ | 973 | $ | — | $ | — | $ | 9,735 | ||||||||
F-47
VENOCO, INC. AND SUBSIDIARIES
NOTES TO CONSOLIDATED FINANCIAL STATEMENTS (Continued)
YEARS ENDED DECEMBER 31, 2007, 2008 AND 2009
14. GUARANTOR FINANCIAL INFORMATION (Continued)
CONDENSED CONSOLIDATING STATEMENT OF CASH FLOWS
FOR THE YEAR ENDED DECEMBER 31, 2008
(in thousands)
| |
Venoco, Inc. | Guarantor Subsidiaries |
Non- Guarantor Subsidiary |
Eliminations | Consolidated | |||||||||||||
|---|---|---|---|---|---|---|---|---|---|---|---|---|---|---|---|---|---|---|
CASH FLOWS FROM OPERATING ACTIVITIES: |
||||||||||||||||||
Net cash provided by (used in) operating activities |
$ | 109,898 | $ | 96,235 | $ | 6,246 | $ | — | $ | 212,379 | ||||||||
CASH FLOWS FROM INVESTING ACTIVITIES: |
||||||||||||||||||
Expenditures for oil and natural gas properties |
(271,254 | ) | (39,901 | ) | (18 | ) | — | (311,173 | ) | |||||||||
Acquisitions of oil and natural gas properties |
(11,857 | ) | (2,422 | ) | — | — | (14,279 | ) | ||||||||||
Expenditures for property and equipment and other |
(7,228 | ) | (181 | ) | — | — | (7,409 | ) | ||||||||||
Net cash provided by (used in) investing activities |
(290,339 | ) | (42,504 | ) | (18 | ) | — | (332,861 | ) | |||||||||
CASH FLOWS FROM FINANCING ACTIVITIES: |
||||||||||||||||||
Net proceeds from (repayments of) intercompany borrowings |
60,931 | (54,703 | ) | (6,228 | ) | — | — | |||||||||||
Proceeds from long-term debt |
260,052 | — | — | — | 260,052 | |||||||||||||
Principal payments on long-term debt |
(169,892 | ) | — | — | — | (169,892 | ) | |||||||||||
Payments for deferred loan costs |
(963 | ) | — | — | — | (963 | ) | |||||||||||
Proceeds from derivative premium financing |
17,993 | — | — | — | 17,993 | |||||||||||||
Proceeds from issuance of common stock and other stock activity |
(162 | ) | — | — | — | (162 | ) | |||||||||||
Proceeds from exercise of stock options |
2,961 | — | — | — | 2,961 | |||||||||||||
Proceeds from disgorgement of stock sale profits |
949 | — | — | — | 949 | |||||||||||||
Net cash provided by (used in) financing activities |
171,869 | (54,703 | ) | (6,228 | ) | — | 110,938 | |||||||||||
Net increase (decrease) in cash and cash equivalents |
(8,572 | ) | (972 | ) | — | — | (9,544 | ) | ||||||||||
Cash and cash equivalents, beginning of period |
8,762 | 973 | — | — | 9,735 | |||||||||||||
Cash and cash equivalents, end of period |
$ | 190 | $ | 1 | $ | — | $ | — | $ | 191 | ||||||||
F-48
VENOCO, INC. AND SUBSIDIARIES
NOTES TO CONSOLIDATED FINANCIAL STATEMENTS (Continued)
YEARS ENDED DECEMBER 31, 2007, 2008 AND 2009
14. GUARANTOR FINANCIAL INFORMATION (Continued)
CONDENSED CONSOLIDATING STATEMENT OF CASH FLOWS
FOR THE YEAR ENDED DECEMBER 31, 2009
(in thousands)
| |
Venoco, Inc. | Guarantor Subsidiaries |
Non- Guarantor Subsidiary |
Eliminations | Consolidated | |||||||||||||
|---|---|---|---|---|---|---|---|---|---|---|---|---|---|---|---|---|---|---|
CASH FLOWS FROM OPERATING ACTIVITIES: |
||||||||||||||||||
Net cash provided by (used in) operating activities |
$ | 88,851 | $ | 23,367 | $ | 6,473 | $ | — | $ | 118,691 | ||||||||
CASH FLOWS FROM INVESTING ACTIVITIES: |
||||||||||||||||||
Expenditures for oil and natural gas properties |
(159,175 | ) | (13,593 | ) | (2,056 | ) | — | (174,824 | ) | |||||||||
Acquisitions of oil and natural gas properties |
(22,794 | ) | — | — | — | (22,794 | ) | |||||||||||
Expenditures for property and equipment and other |
(1,802 | ) | (186 | ) | — | — | (1,988 | ) | ||||||||||
Proceeds from sale of oil and natural gas properties |
— | 197,653 | — | — | 197,653 | |||||||||||||
Net cash provided by (used in) investing activities |
(183,771 | ) | 183,874 | (2,056 | ) | — | (1,953 | ) | ||||||||||
CASH FLOWS FROM FINANCING ACTIVITIES: |
||||||||||||||||||
Net proceeds from (repayments of) intercompany borrowings |
211,658 | (207,241 | ) | (4,417 | ) | — | — | |||||||||||
Proceeds from long-term debt |
276,562 | — | — | — | 276,562 | |||||||||||||
Principal payments on long-term debt |
(382,280 | ) | — | — | — | (382,280 | ) | |||||||||||
Payments for deferred loan costs |
(5,221 | ) | — | — | — | (5,221 | ) | |||||||||||
Payments to retire debt |
(6,627 | ) | — | — | — | (6,627 | ) | |||||||||||
Proceeds from issuance of common stock and other stock activity |
360 | — | — | — | 360 | |||||||||||||
Proceeds from exercise of stock options |
681 | — | — | — | 681 | |||||||||||||
Proceeds from disgorgement of stock sale profits |
15 | — | — | — | 15 | |||||||||||||
Net cash provided by (used in) financing activities |
95,148 | (207,241 | ) | (4,417 | ) | — | (116,510 | ) | ||||||||||
Net increase (decrease) in cash and cash equivalents |
228 | — | — | — | 228 | |||||||||||||
Cash and cash equivalents, beginning of period |
190 | 1 | — | — | 191 | |||||||||||||
Cash and cash equivalents, end of period |
$ | 418 | $ | 1 | $ | — | $ | — | $ | 419 | ||||||||
F-49