Attached files
| file | filename |
|---|---|
| 8-K - 8-K - Nexeo Solutions Holdings, LLC | a16-6317_38k.htm |
| EX-2.1 - EX-2.1 - Nexeo Solutions Holdings, LLC | a16-6317_3ex2d1.htm |
| EX-10.3 - EX-10.3 - Nexeo Solutions Holdings, LLC | a16-6317_3ex10d3.htm |
| EX-10.2 - EX-10.2 - Nexeo Solutions Holdings, LLC | a16-6317_3ex10d2.htm |
| EX-10.1 - EX-10.1 - Nexeo Solutions Holdings, LLC | a16-6317_3ex10d1.htm |
| EX-10.4 - EX-10.4 - Nexeo Solutions Holdings, LLC | a16-6317_3ex10d4.htm |
Exhibit 99.1
WL Ross Holding Corp. Investor Presentation March 23, 2016

Disclaimer This Investor Presentation (the "Investor Presentation"), which is to be used by the WL Ross Holding Corp. ("WLRH") in making presentations to certain of its stockholders and other persons with respect to the transactions contemplated by the merger agreement previously announced on March 21, supersedes the investor presentation provided on March 21. This Investor Presentation is for informational purposes only and does not constitute an offer to sell, a solicitation of an offer to buy, or a recommendation to purchase any equity, debt or other financial instruments of Nexeo Solutions Holdings, LLC (“Nexeo” or the “Company”) or WLRH or any of Nexeo’s or WLRH’s affiliates’ securities (as such term is defined under the U.S. Federal Securities Laws). This Investor Presentation has been prepared to assist interested parties in making their own evaluation with respect to the proposed business combination of Nexeo and WLRH and for no other purpose. The information contained herein does not purport to be all-inclusive. The data contained herein is derived from various internal and external sources. No representation is made as to the reasonableness of the assumptions made within or the accuracy or completeness of any projections, modelling or back-testing or any other information contained herein. All levels, prices and spreads are historical and do not represent current market levels. prices or spreads, some or all of which may have changed since the issuance of this document. Any data on past performance, modeling or back-testing contained herein is no indication as to future performance. Nexeo and WLRH assume no obligation to update the information in this Investor Presentation. Forward-Looking Statements This Investor Presentation includes financial forecasts, projections, and other forward-looking statements regarding Nexeo, its business and prospects that, unless other indicated, were provided by Nexeo to WLRH and are within the meaning of the “safe harbor” provisions of the United States Private Securities Litigation Reform Act of 1995. Forward-looking statements may be identified by the use of words such as “anticipate”, “believe”, “expect”, “estimate”, “intends”, “plan”, “outlook”, “target”, and “project” and other similar expressions that predict or indicate future events or trends or that are not statements of historical matters, including statements about our beliefs and expectations and the financial and other projections contained herein and the estimated Adjusted EBITDA trading multiples. Such forward-looking statements with respect to revenues, earnings, performance, strategies, prospects and other aspects of the businesses of WLRH, Nexeo and the combined company after completion of the proposed business combination are based on current expectations that are subject to risks and uncertainties. Accordingly, actual results and performance may materially differ from results or performance expressed or implied by the forward-looking statements. These factors include, but are not limited to: (1) the occurrence of any event, change or other circumstances that could give rise to the termination of the Agreement and Plan of Merger for the business combination (the “Merger Agreement”); (2) the outcome of any legal proceedings that may be instituted against WLRH, the combined company or others following announcement of the Merger Agreement and transactions contemplated therein; (3) the inability to complete the transactions contemplated by the Merger Agreement due to the failure to obtain approval of the stockholders of WLRH or other conditions to closing in the Merger Agreement; (4) the risk that the proposed transaction disrupts current plans and operations as a result of the announcement and consummation of the transactions described herein; (5) the ability of the combined company to meet its financial and strategic goals, due to, among other things, competition, the ability of the combined company to grow and manage growth profitability, maintain relationships with suppliers and obtain adequate supply of products and retain its key employees; (6) costs related to the proposed business combination; (7) changes in applicable laws or regulations; (8) the possibility that the combined company may be adversely affected by other economic, business, competitive factors, weather and/or commodity prices; and (9) other risks and uncertainties in the proxy statement intended to be filed concerning the proposed business combination, including those under “Risk Factors” therein, and other filings with the Securities and Exchange Commission (the “SEC”) by WLRH or the Company. You are cautioned not to place undue reliance upon any forward-looking statements, which speak only as of the data made, and WLRH and Nexeo undertake no obligation to update or revise the forward-looking statements, whether as a result of new information, future events or otherwise. Financial Presentation This presentation includes non-GAAP financial measures, including Adjusted EBITDA, Cash Conversion, Adjusted EBITDA excluding Plaschem and Gross Margin excluding Plaschem. Non-GAAP financial measures should not be considered as alternatives to generally accepted accounting principles in the United States of America (“GAAP”), measures such as net income, operating income, net cash flows provided by operating activities or any other GAAP measure of liquidity or financial performance. Adjusted EBITDA is calculated as net income (loss) before interest expense, provision for income taxes, depreciation, amortization and items that we do not consider representative of our ongoing operating performance. A reconciliation of net income (loss) to Adjusted EBITDA for Fiscal 2013 through 2015 is set forth in the Appendix on pages 20 – 22. Nexeo believes that these non-GAAP measures of financial results provide useful information to management and investors regarding certain financial and business trends relating to Nexeo’s financial condition and results of operations. Nexeo’s management uses these non-GAAP measures to compare Nexeo’s performance to that of prior periods for trend analyses, for purposes of determining management incentive compensation, and for budgeting and planning purposes. These measures are used in monthly financial reports prepared for management and Nexeo’s board of directors. Nexeo believes that the use of these non-GAAP financial measures provides an additional tool for investors to use in evaluating ongoing operating results and trends and in comparing Nexeo’s financial measure with other similar companies, many of which present similar non-GAAP financial measures to investors. Management of Nexeo does not consider these non-GAAP measures in isolation or as an alternative to financial measures determined in accordance with GAAP. The principal limitation of these non-GAAP financial measures is that they exclude significant expenses and income that are required by GAAP to be recorded in Nexeo’s financial statements. In addition, they are subject to inherent limitations as they reflect the exercise of judgments by management about which expenses and income are excluded or included in determining these non-GAAP financial measures. In order to compensate for these limitations, management presents non-GAAP financial measures in connection with GAAP results. You should review Nexeo’s audited financial statements, which will be presented in WLRH’s preliminary proxy statement to be filed with the SEC, and not rely on any single financial measure to evaluate Nexeo’s business. The delivery of this Investor Presentation does not at any time imply that there has been no change in the operations, financial condition, prospects, creditworthiness and status or affairs of WLRH or Nexeo since the date shown on this document. WLRH and Nexeo do not accept any liability whatsoever for any losses arising from the use of this document or reliance on the information contained herein. Nothing herein shall be deemed to constitute investment, legal, tax, financial, accounting or other advice. Additional Information In connection with the proposed business combination between Nexeo and WLRH, WLRH intends to file with the SEC a preliminary proxy statement and will mail a definitive proxy statement and other relevant documents to WLRH stockholders. This presentation does not contain all the information that should be considered concerning the proposed business combination. It is not intended to form the basis of any investment decision or any other decision in respect of the proposed business combination. WLRH stockholders and other interested persons are advised to read, when available, the preliminary proxy statement and any amendments thereto, and the definitive proxy statement in connection with WLRH’s solicitation of proxies for the special meeting to be held to approve the transactions contemplated by the proposed business combination because these materials will contain important information about Nexeo, WLRH and the proposed transactions. The definitive proxy statement will be mailed to WLRH stockholders as of a record date to be established for voting on the proposed business combination when it becomes available. Stockholders will also be able to obtain a copy of the preliminary proxy statement and definitive proxy statement once they are available, without charge, at the SEC’s website at http://sec.gov or by directing a request to: WL Ross Holding Corp., c/o WL Ross & Co. LLC, 1166 Avenue of the Americas, 25th Floor, New York, New York 10036, e-mail: WLRHolding@wlross.com, Attn: Tony Reina (Legal Department). This presentation shall not constitute a solicitation of a proxy, consent or authorization with respect to any securities or in respect of the proposed business combination. Participants in the Solicitation WLRH, Nexeo, and their respective directors and officers may be deemed participants in the solicitation of proxies to WLRH's stockholders with respect to the transactions contemplated by the proposed business combination. Information regarding the persons who may, under the rules of the SEC, be deemed participants in the solicitation of proxies to WLRH's stockholders with respect to the transactions contemplated by the proposed business combination will be set forth in the proxy statement for transactions contemplated by the proposed business combination when available. A list of the names of directors and officers of WLRH and a description of their interests in WLRH is contained in WLRH’s proxy statement that was filed with the SEC on January 14, 2016.
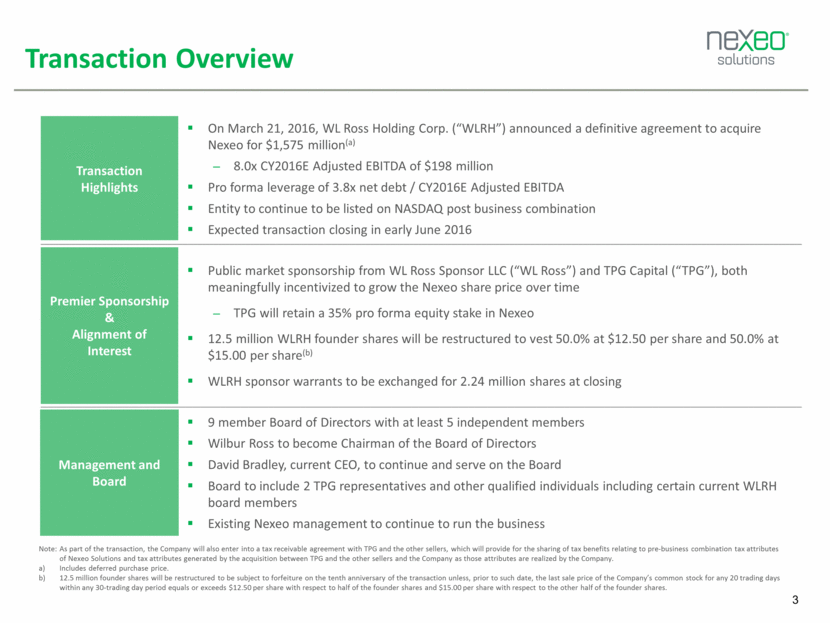
Transaction Overview Transaction Highlights On March 21, 2016, WL Ross Holding Corp. (“WLRH”) announced a definitive agreement to acquire Nexeo for $1,575 million(a) 8.0x CY2016E Adjusted EBITDA of $198 million Pro forma leverage of 3.8x net debt / CY2016E Adjusted EBITDA Entity to continue to be listed on NASDAQ post business combination Expected transaction closing in early June 2016 Premier Sponsorship & Alignment of Interest Public market sponsorship from WL Ross Sponsor LLC (“WL Ross”) and TPG Capital (“TPG”), both meaningfully incentivized to grow the Nexeo share price over time TPG will retain a 35% pro forma equity stake in Nexeo 12.5 million WLRH founder shares will be restructured to vest 50.0% at $12.50 per share and 50.0% at $15.00 per share(b) WLRH sponsor warrants to be exchanged for 2.24 million shares at closing Management and Board 9 member Board of Directors with at least 5 independent members Wilbur Ross to become Chairman of the Board of Directors David Bradley, current CEO, to continue and serve on the Board Board to include 2 TPG representatives and other qualified individuals including certain current WLRH board members Existing Nexeo management to continue to run the business Note: As part of the transaction, the Company will also enter into a tax receivable agreement with TPG and the other sellers, which will provide for the sharing of tax benefits relating to pre-business combination tax attributes of Nexeo Solutions and tax attributes generated by the acquisition between TPG and the other sellers and the Company as those attributes are realized by the Company. Includes deferred purchase price. 12.5 million founder shares will be restructured to be subject to forfeiture on the tenth anniversary of the transaction unless, prior to such date, the last sale price of the Company’s common stock for any 20 trading days within any 30-trading day period equals or exceeds $12.50 per share with respect to half of the founder shares and $15.00 per share with respect to the other half of the founder shares.
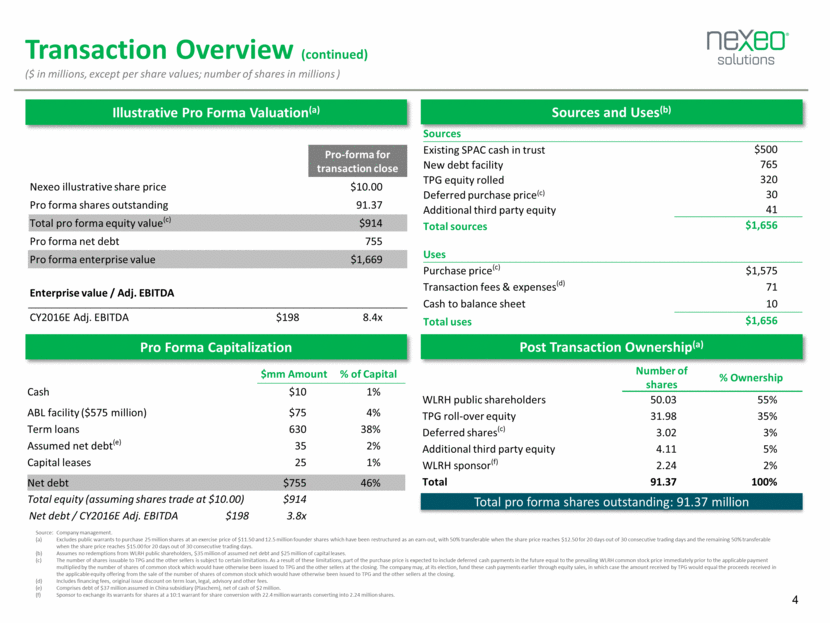
Transaction Overview (continued) ($ in millions, except per share values; number of shares in millions ) Illustrative Pro Forma Valuation(a) Sources and Uses(b) Source: Company management. Excludes public warrants to purchase 25 million shares at an exercise price of $11.50 and 12.5 million founder shares which have been restructured as an earn-out, with 50% transferable when the share price reaches $12.50 for 20 days out of 30 consecutive trading days and the remaining 50% transferable when the share price reaches $15.00 for 20 days out of 30 consecutive trading days. Assumes no redemptions from WLRH public shareholders, $35 million of assumed net debt and $25 million of capital leases. The number of shares issuable to TPG and the other sellers is subject to certain limitations. As a result of these limitations, part of the purchase price is expected to include deferred cash payments in the future equal to the prevailing WLRH common stock price immediately prior to the applicable payment multiplied by the number of shares of common stock which would have otherwise been issued to TPG and the other sellers at the closing. The company may, at its election, fund these cash payments earlier through equity sales, in which case the amount received by TPG would equal the proceeds received in the applicable equity offering from the sale of the number of shares of common stock which would have otherwise been issued to TPG and the other sellers at the closing. Includes financing fees, original issue discount on term loan, legal, advisory and other fees. Comprises debt of $37 million assumed in China subsidiary (Plaschem), net of cash of $2 million. Sponsor to exchange its warrants for shares at a 10:1 warrant for share conversion with 22.4 million warrants converting into 2.24 million shares. Post Transaction Ownership(a) Pro Forma Capitalization Total pro forma shares outstanding: 91.37 million Pro-forma for transaction close Nexeo illustrative share price $10.00 Pro forma shares outstanding 91.37 Total pro forma equity value(c) $914 Pro forma net debt 755 Pro forma enterprise value $1,669 Enterprise value / Adj. EBITDA CY2016E Adj. EBITDA $198 8.4x Number of shares % Ownership WLRH public shareholders 50.03 55% TPG roll-over equity 31.98 35% Deferred shares(c) 3.02 3% Additional third party equity 4.11 5% WLRH sponsor(f) 2.24 2% Total 91.37 100% $mm Amount % of Capital Cash $10 1% ABL facility ($575 million) $75 4% Term loans 630 38% Assumed net debt(e) 35 2% Capital leases 25 1% Net debt $755 46% Total equity (assuming shares trade at $10.00) $914 Net debt / CY2016E Adj. EBITDA $198 3.8x Sources Existing SPAC cash in trust $500 New debt facility 765 TPG equity rolled 320 Deferred purchase price(c) 30 Additional third party equity 41 Total sources $1,656 Uses Purchase price(c) $1,575 Transaction fees & expenses(d) 71 Cash to balance sheet 10 Total uses $1,656
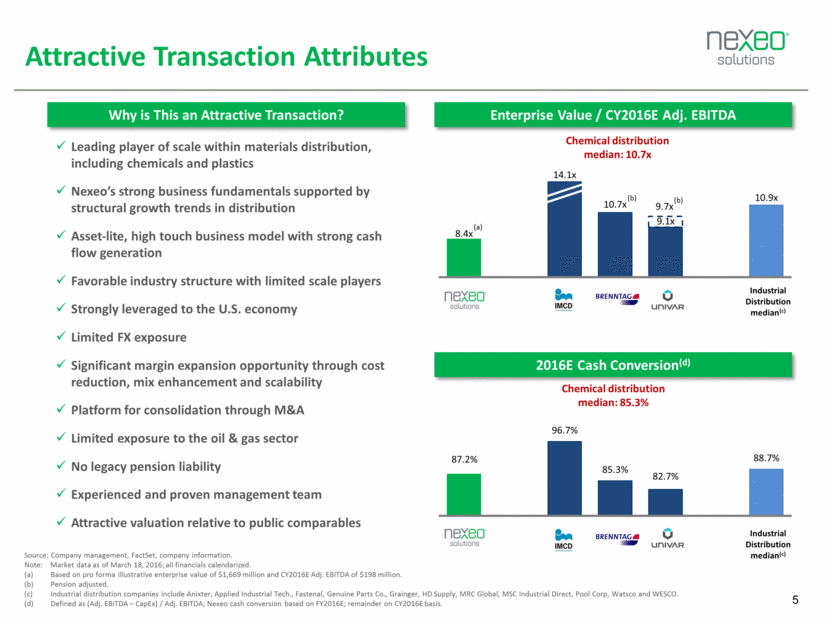
Attractive Transaction Attributes Why is This an Attractive Transaction? Leading player of scale within materials distribution, including chemicals and plastics Nexeo’s strong business fundamentals supported by structural growth trends in distribution Asset-lite, high touch business model with strong cash flow generation Favorable industry structure with limited scale players Strongly leveraged to the U.S. economy Limited FX exposure Significant margin expansion opportunity through cost reduction, mix enhancement and scalability Platform for consolidation through M&A Limited exposure to the oil & gas sector No legacy pension liability Experienced and proven management team Attractive valuation relative to public comparables Source: Company management, FactSet, company information. Note: Market data as of March 18, 2016; all financials calendarized. Based on pro forma illustrative enterprise value of $1,669 million and CY2016E Adj. EBITDA of $198 million. Pension adjusted. Industrial distribution companies include Anixter, Applied Industrial Tech., Fastenal, Genuine Parts Co., Grainger, HD Supply, MRC Global, MSC Industrial Direct, Pool Corp, Watsco and WESCO. Defined as (Adj. EBITDA – CapEx) / Adj. EBITDA; Nexeo cash conversion based on FY2016E; remainder on CY2016E basis. Enterprise Value / CY2016E Adj. EBITDA Chemical distribution median: 10.7x (b) (b) (a) Industrial Distribution median(c) 2016E Cash Conversion(d) Chemical distribution median: 85.3% Industrial Distribution median(c)
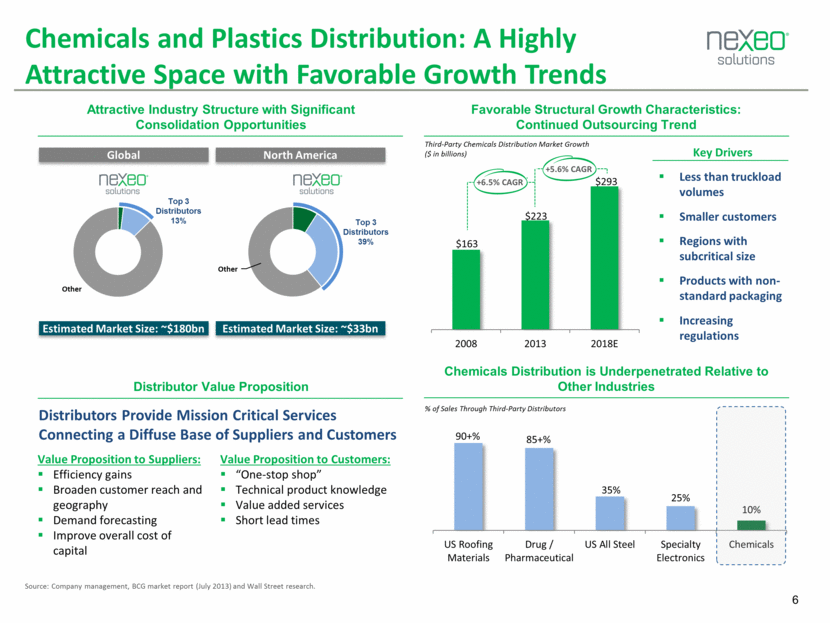
Favorable Structural Growth Characteristics: Continued Outsourcing Trend Attractive Industry Structure with Significant Consolidation Opportunities Top 3 Distributors 13% Global Top 3 Distributors 39% North America Estimated Market Size: ~$180bn Estimated Market Size: ~$33bn Third-Party Chemicals Distribution Market Growth ($ in billions) +5.6% CAGR Chemicals and Plastics Distribution: A Highly Attractive Space with Favorable Growth Trends Distributors Provide Mission Critical Services Connecting a Diffuse Base of Suppliers and Customers Distributor Value Proposition Value Proposition to Customers: “One-stop shop” Technical product knowledge Value added services Short lead times Value Proposition to Suppliers: Efficiency gains Broaden customer reach and geography Demand forecasting Improve overall cost of capital Source: Company management, BCG market report (July 2013) and Wall Street research. +6.5% CAGR Chemicals Distribution is Underpenetrated Relative to Other Industries % of Sales Through Third-Party Distributors Key Drivers Less than truckload volumes Smaller customers Regions with subcritical size Products with non-standard packaging Increasing regulations 90+% 85+% 35% 25% 10% US Roofing Materials Drug / Pharmaceutical US All Steel Specialty Electronics Chemicals Other Other $163 $223 $293 2008 2013 2018E
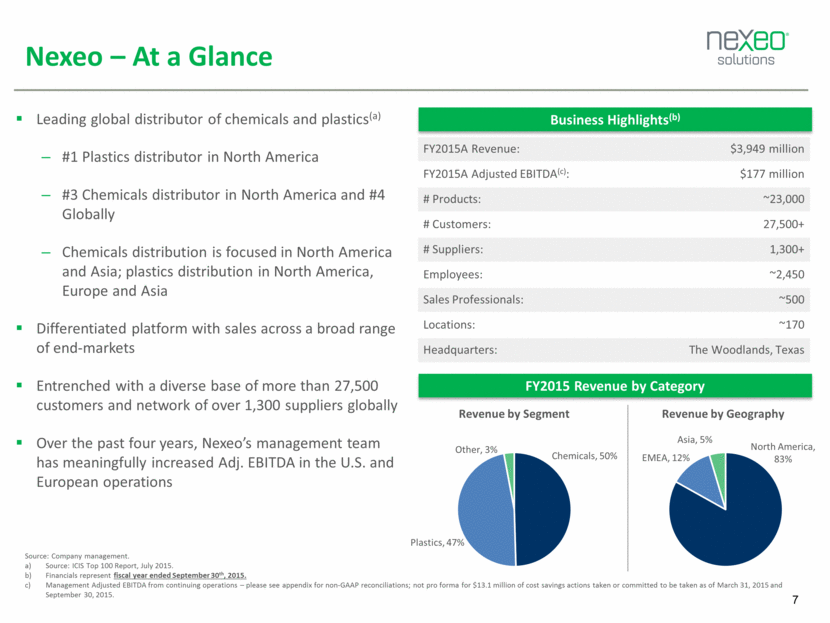
Nexeo – At a Glance Leading global distributor of chemicals and plastics(a) #1 Plastics distributor in North America #3 Chemicals distributor in North America and #4 Globally Chemicals distribution is focused in North America and Asia; plastics distribution in North America, Europe and Asia Differentiated platform with sales across a broad range of end-markets Entrenched with a diverse base of more than 27,500 customers and network of over 1,300 suppliers globally Over the past four years, Nexeo’s management team has meaningfully increased Adj. EBITDA in the U.S. and European operations Business Highlights(b) FY2015 Revenue by Category FY2015A Revenue: $3,949 million FY2015A Adjusted EBITDA(c): $177 million # Products: ~23,000 # Customers: 27,500+ # Suppliers: 1,300+ Employees: ~2,450 Sales Professionals: ~500 Locations: ~170 Headquarters: The Woodlands, Texas Source: Company management. Source: ICIS Top 100 Report, July 2015. Financials represent fiscal year ended September 30th, 2015. Management Adjusted EBITDA from continuing operations – please see appendix for non-GAAP reconciliations; not pro forma for $13.1 million of cost savings actions taken or committed to be taken as of March 31, 2015 and September 30, 2015. North America , 83% EMEA , 12% Asia , 5% Revenue by Geography Chemicals , 50% Plastics , 47% Other , 3% Revenue by Segment
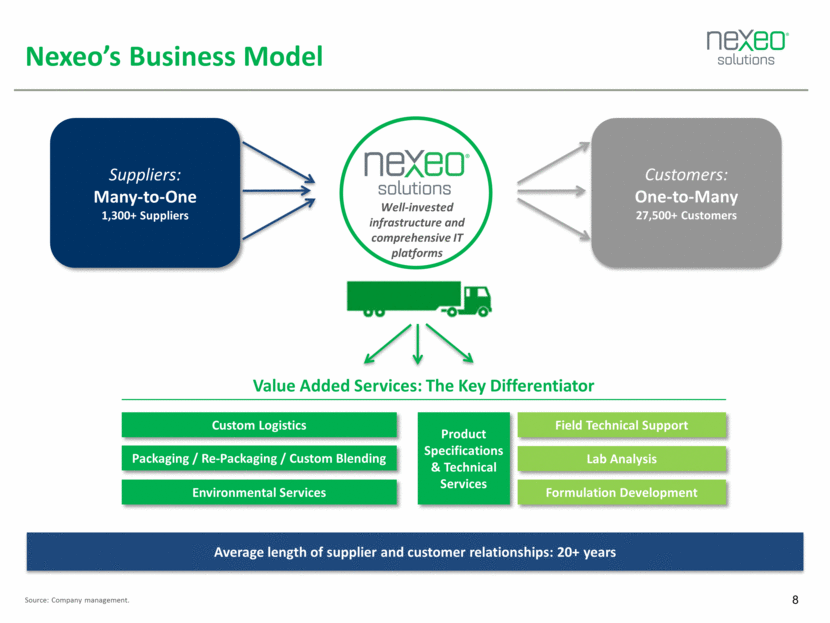
Customers: One-to-Many 27,500+ Customers Suppliers: Many-to-One 1,300+ Suppliers Nexeo’s Business Model Source: Company management. Value Added Services: The Key Differentiator Field Technical Support Product Specifications & Technical Services Lab Analysis Formulation Development Environmental Services Packaging / Re-Packaging / Custom Blending Custom Logistics Average length of supplier and customer relationships: 20+ years Well-invested infrastructure and comprehensive IT platforms
Nexeo – Segment Snapshot Source: Company management. Note: Financials represent fiscal year ended September 30th, 2015; Other segment accounts for approximately 3% of revenues. Market Position #3 in North America #4 Globally #1 in North America Leading EMEA position Key Suppliers Deep supplier base of over 1,300 suppliers from which the Company offers approximately 23,000 products Average length of relationship of 20+ years Chemicals Distribution (50%) FY2015 Segment Sales: $1,956 million Plastics Distribution (47%) FY2015 Segment Sales: $1,876 million Key Customers Segment Largest distributor of plastics in the U.S., supplying nearly every grade of prime thermoplastic resin Leading, broad-line, North American distributor of chemicals, solvents and additives to a diverse range of end markets Key Products Alcohols Blends Ethers Silicones Resins Surfactants Engineered Thermoplastics Polyolefins Polypropylene Glycols Hydrocarbons Ketones Specialty Thermoplastics Styrenics Key End Markets Coating, Adhesives, Sealants, Elastomers (CASE) Household, Industrial and Institutional (HI&I) Lubricants & Chemical Manufacturing Personal Care Healthcare Automotive Industrial Packaging Building and Construction Electrical Highly diversified customer base serving 27,500+ customers from over ~170 locations across over 80 countries Nexeo’s customer-centric model results in strong, long-term relationships
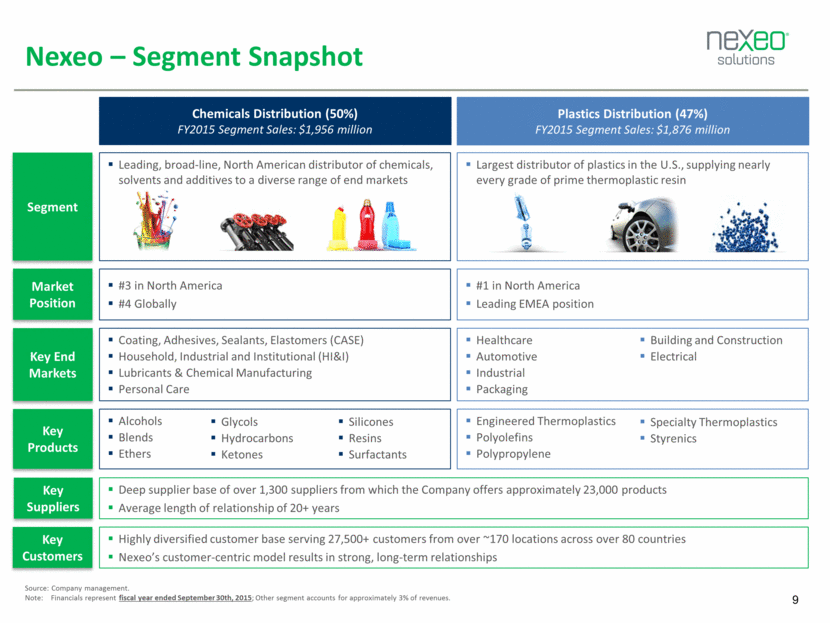
Stability Across the Cycle Supported by End-Market and Product Diversity Stable Margin Performance Across the Cycle Less earnings volatility than producers Pass-through pricing Customer demand for one-stop shop for products and solutions Outsourcing trend strengthens during a downturn Producers focus on cost Number of shipments increase, resulting in increased utilization of distributors Source: Company management, Bloomberg. Note: Gross margin graph excludes Plaschem. Leading North American distributor of Chemicals and Plastics to a diverse range of end-markets, including industrial, automotive, coatings, adhesives, sealants, elastomers, medical & pharma, personal care and packaging, reflecting a large cross-section of industrial output Stable Margins Over Time Oct-12 May-13 Jan-14 Aug-14 Apr-15 Dec-15 Nexeo Gross Margin ($ per lb) Oil Price ($ per bbl) U.S. GDP Growth (%)
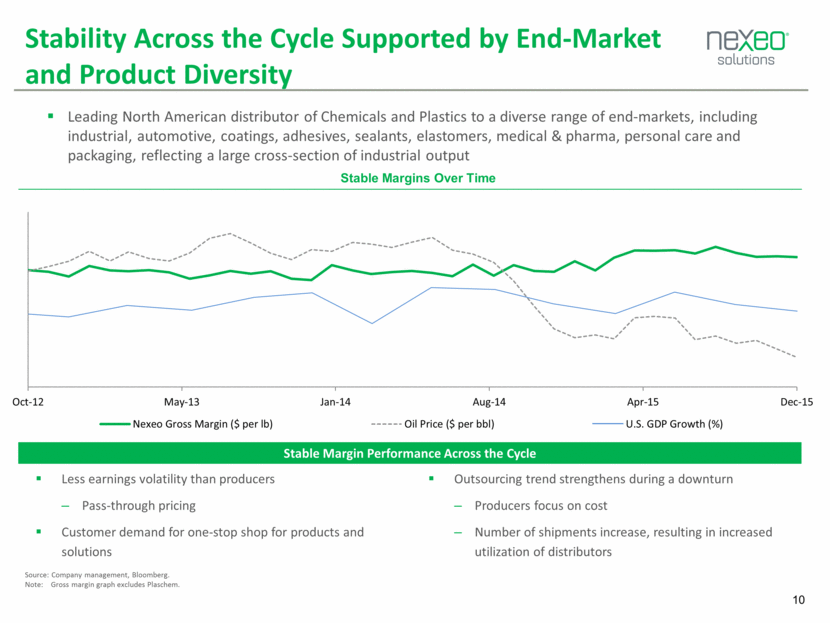
Exceptional Distribution Network in Key Markets Well-invested infrastructure in place Distribution is a local business – strategically placed facilities optimize route density Source: Company management. Note: 3PL = Third party logistics. Nexeo locations Headquarters Next day service available to 99% of customers 99% on-time delivery on Nexeo’s private fleet “Green” private fleet - $30 million recent investment in new trucks 209 new Nexeo trucks in 2015 Americas EMEA Asia # Facilities: Bulk Storage Tanks: Fleet Tractors: Blending Hubs: 53 + 91 (3PL) 1,142 346 35 # Facilities: Within EMEA, Nexeo operates through third-party warehouses supported by 8 sales offices focused on international plastics operations 16 (3PL) # Facilities: Within Asia, Nexeo operates through third-party operated warehouses supported by 8 sales offices focused on international chemicals and plastics operations 21 (3PL)
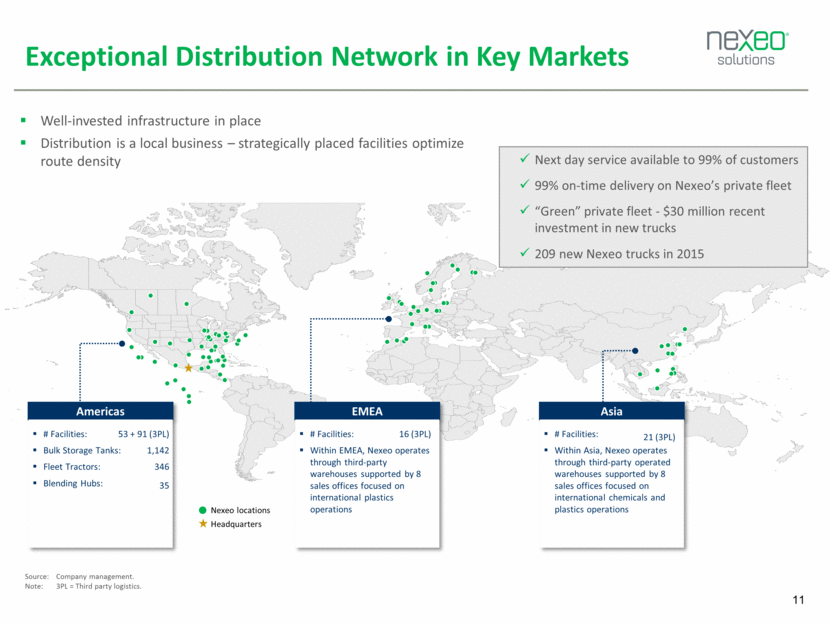
2014 Sells North American composites operations to Composites One LLC Nexeo Evolution – Further Opportunity to Optimize Cost and Poised for Growth 2013 Acquires 100% outstanding shares of Chemical Specialists and Development, Inc. Acquires Archway Sales, Inc., a specialty chemical distributor Phase I: Carve-Out of Ashland Distribution Phase II: Infrastructure & Capability Enhancements Phase III: Optimization & Growth Source: Company management. Completion of operationally intensive carve-out paves the way for focus on optimization Significant strides made towards driving operational improvements with opportunities for further enhancement Focus on driving organic and acquisition growth 2015 Invest in sales capacity Measure / focus on customer ROI Portfolio & cost optimization Pursue value accretive M&A 2011 2012 2013 2014 2015 “Orphan Business” Nexeo management and its shareholders have transformed Ashland’s orphan distribution business into a global leader Invested in state-of-the-art IT and pricing systems and logistic infrastructure Streamlined operations & optimized cost structure Enhanced the portfolio through strategic investments and divestitures 2012 Finalizes a joint venture with Beijing Plaschem Trading Co., Ltd. (60% ownership in JV) 2014 Acquires remaining stake in Plaschem JV 2011 Nexeo Solutions is formed through TPG’s acquisition of Ashland Distribution
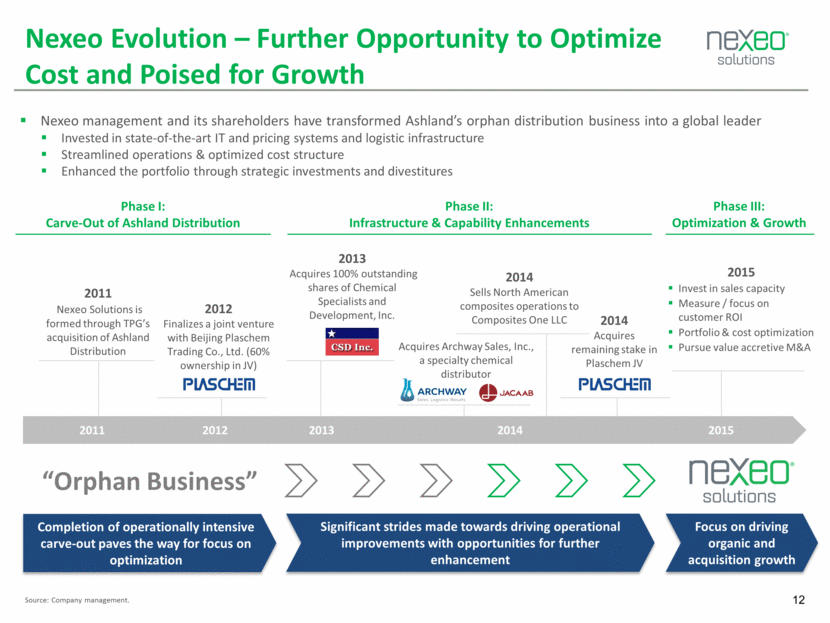
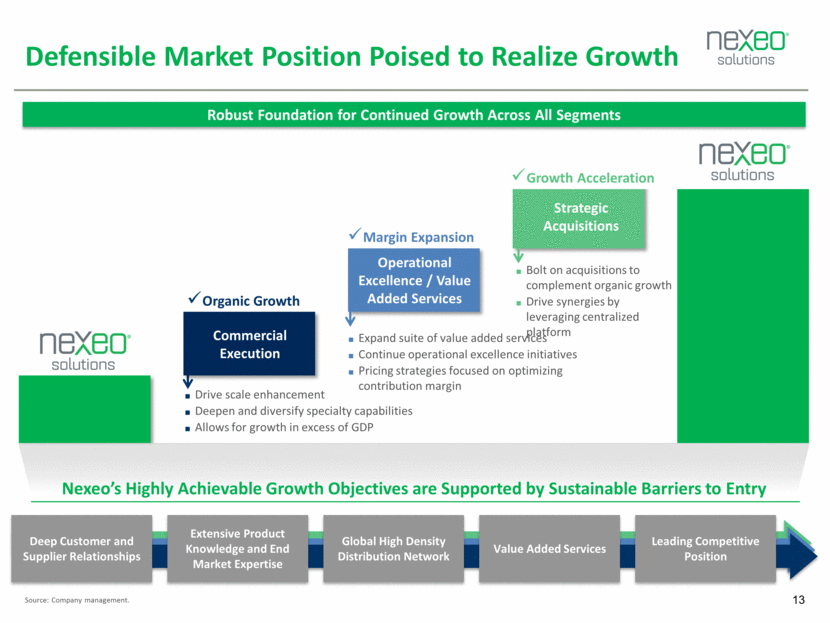
Defensible Market Position Poised to Realize Growth Robust Foundation for Continued Growth Across All Segments Nexeo’s Highly Achievable Growth Objectives are Supported by Sustainable Barriers to Entry Drive scale enhancement Deepen and diversify specialty capabilities Allows for growth in excess of GDP Expand suite of value added services Continue operational excellence initiatives Pricing strategies focused on optimizing contribution margin Bolt on acquisitions to complement organic growth Drive synergies by leveraging centralized platform Deep Customer and Supplier Relationships Extensive Product Knowledge and End Market Expertise Global High Density Distribution Network Value Added Services Leading Competitive Position Commercial Execution Operational Excellence / Value Added Services Strategic Acquisitions Source: Company management. Organic Growth Margin Expansion Growth Acceleration
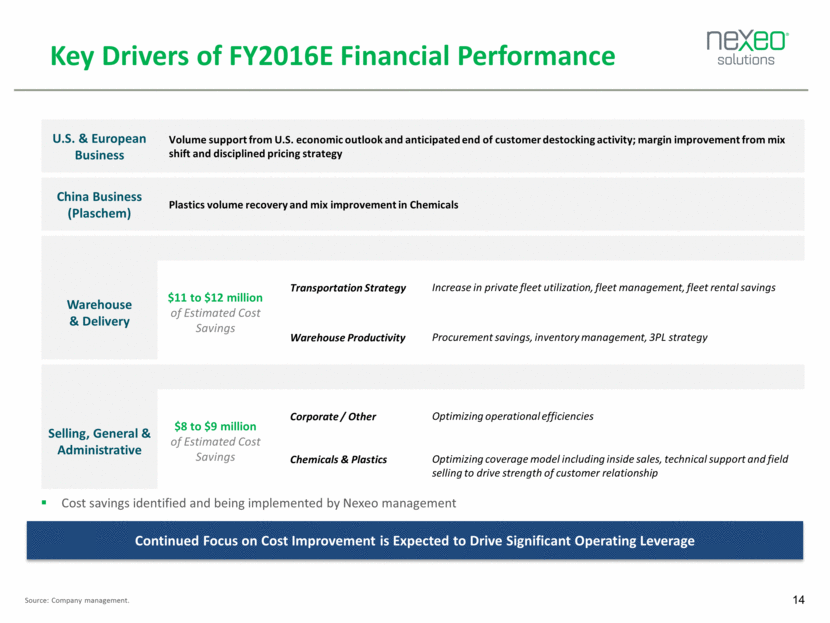
Key Drivers of FY2016E Financial Performance Source: Company management. Continued Focus on Cost Improvement is Expected to Drive Significant Operating Leverage U.S. & European Business Volume support from U.S. economic outlook and anticipated end of customer destocking activity; margin improvement from mix shift and disciplined pricing strategy China Business (Plaschem) Plastics volume recovery and mix improvement in Chemicals Warehouse & Delivery $11 to $12 million of Estimated Cost Savings Transportation Strategy Increase in private fleet utilization, fleet management, fleet rental savings Warehouse Productivity Procurement savings, inventory management, 3PL strategy Selling, General & Administrative $8 to $9 million of Estimated Cost Savings Corporate / Other Optimizing operational efficiencies Chemicals & Plastics Optimizing coverage model including inside sales, technical support and field selling to drive strength of customer relationship Cost savings identified and being implemented by Nexeo management
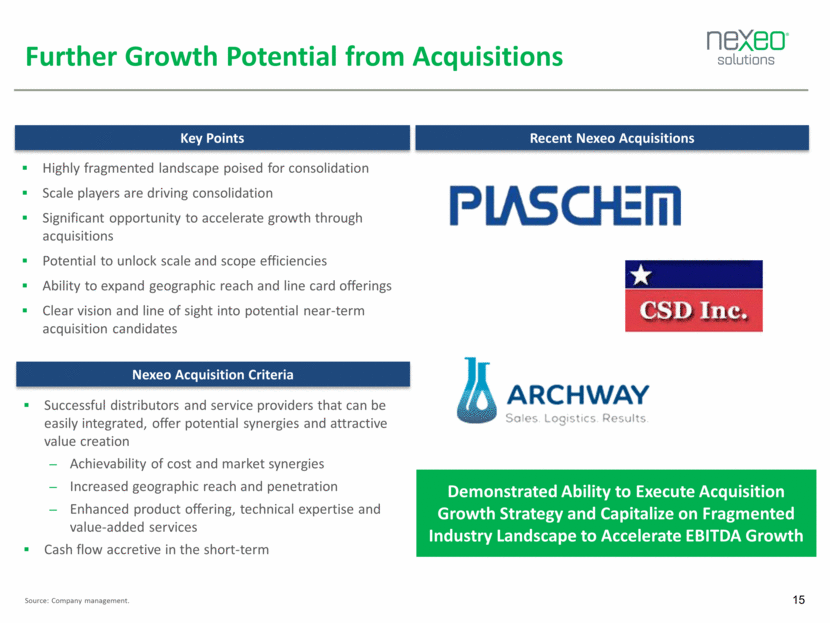
Further Growth Potential from Acquisitions Key Points Nexeo Acquisition Criteria Highly fragmented landscape poised for consolidation Scale players are driving consolidation Significant opportunity to accelerate growth through acquisitions Potential to unlock scale and scope efficiencies Ability to expand geographic reach and line card offerings Clear vision and line of sight into potential near-term acquisition candidates Successful distributors and service providers that can be easily integrated, offer potential synergies and attractive value creation Achievability of cost and market synergies Increased geographic reach and penetration Enhanced product offering, technical expertise and value-added services Cash flow accretive in the short-term Source: Company management. Demonstrated Ability to Execute Acquisition Growth Strategy and Capitalize on Fragmented Industry Landscape to Accelerate EBITDA Growth Recent Nexeo Acquisitions
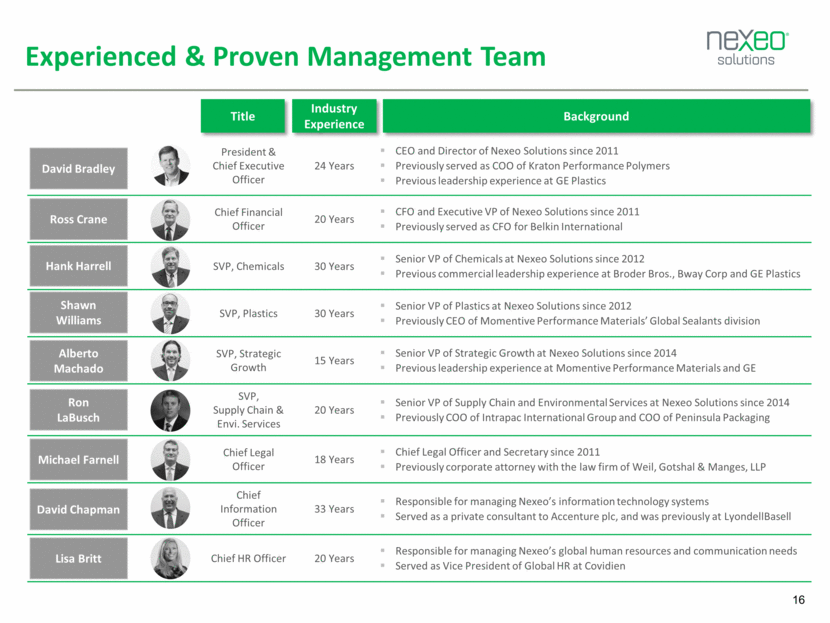
President & Chief Executive Officer 24 Years CEO and Director of Nexeo Solutions since 2011 Previously served as COO of Kraton Performance Polymers Previous leadership experience at GE Plastics Chief Financial Officer 20 Years CFO and Executive VP of Nexeo Solutions since 2011 Previously served as CFO for Belkin International SVP, Chemicals 30 Years Senior VP of Chemicals at Nexeo Solutions since 2012 Previous commercial leadership experience at Broder Bros., Bway Corp and GE Plastics SVP, Plastics 30 Years Senior VP of Plastics at Nexeo Solutions since 2012 Previously CEO of Momentive Performance Materials’ Global Sealants division SVP, Strategic Growth 15 Years Senior VP of Strategic Growth at Nexeo Solutions since 2014 Previous leadership experience at Momentive Performance Materials and GE SVP, Supply Chain & Envi. Services 20 Years Senior VP of Supply Chain and Environmental Services at Nexeo Solutions since 2014 Previously COO of Intrapac International Group and COO of Peninsula Packaging Chief Legal Officer 18 Years Chief Legal Officer and Secretary since 2011 Previously corporate attorney with the law firm of Weil, Gotshal & Manges, LLP Chief Information Officer 33 Years Responsible for managing Nexeo’s information technology systems Served as a private consultant to Accenture plc, and was previously at LyondellBasell Chief HR Officer 20 Years Responsible for managing Nexeo’s global human resources and communication needs Served as Vice President of Global HR at Covidien Experienced & Proven Management Team David Bradley Ross Crane Hank Harrell Shawn Williams Industry Experience Background Title Alberto Machado Ron LaBusch David Chapman Lisa Britt Michael Farnell
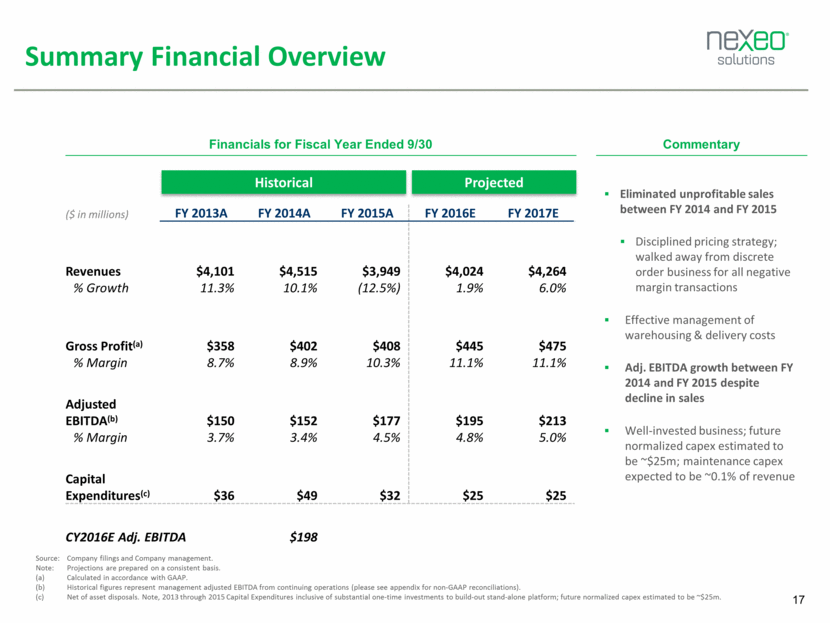
Summary Financial Overview Historical Projected Financials for Fiscal Year Ended 9/30 Commentary Eliminated unprofitable sales between FY 2014 and FY 2015 Disciplined pricing strategy; walked away from discrete order business for all negative margin transactions Effective management of warehousing & delivery costs Adj. EBITDA growth between FY 2014 and FY 2015 despite decline in sales Well-invested business; future normalized capex estimated to be ~$25m; maintenance capex expected to be ~0.1% of revenue ($ in millions) FY 2013A FY 2014A FY 2015A FY 2016E FY 2017E Revenues $4,101 $4,515 $3,949 $4,024 $4,264 % Growth 11.3% 10.1% (12.5%) 1.9% 6.0% Gross Profit(a) $358 $402 $408 $445 $475 % Margin 8.7% 8.9% 10.3% 11.1% 11.1% Adjusted EBITDA(b) $150 $152 $177 $195 $213 % Margin 3.7% 3.4% 4.5% 4.8% 5.0% Capital Expenditures(c) $36 $49 $32 $25 $25 CY2016E Adj. EBITDA $198 Source: Company filings and Company management. Note: Projections are prepared on a consistent basis. (a) Calculated in accordance with GAAP. (b) Historical figures represent management adjusted EBITDA from continuing operations (please see appendix for non-GAAP reconciliations). (c) Net of asset disposals. Note, 2013 through 2015 Capital Expenditures inclusive of substantial one-time investments to build-out stand-alone platform; future normalized capex estimated to be ~$25m.
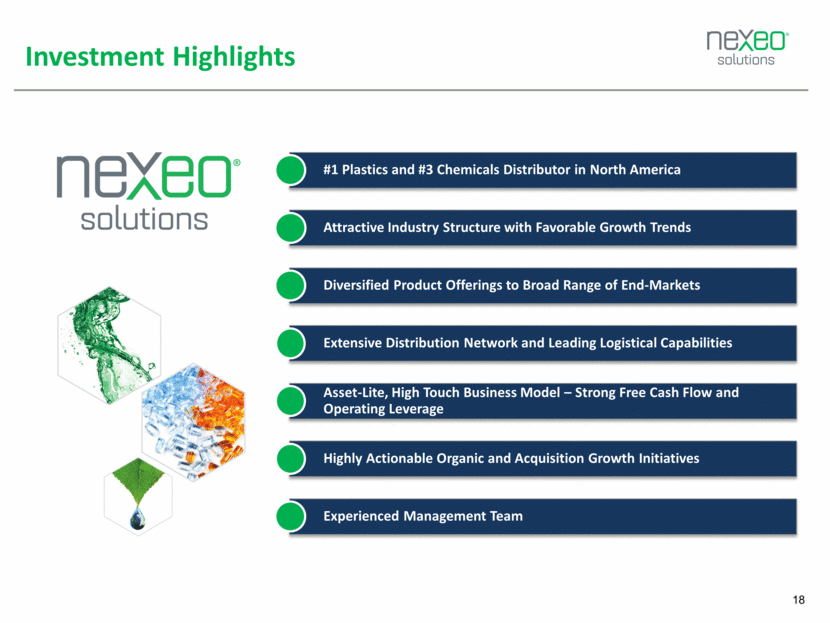
Investment Highlights #1 Plastics and #3 Chemicals Distributor in North America Attractive Industry Structure with Favorable Growth Trends Diversified Product Offerings to Broad Range of End-Markets Extensive Distribution Network and Leading Logistical Capabilities Asset-Lite, High Touch Business Model – Strong Free Cash Flow and Operating Leverage Highly Actionable Organic and Acquisition Growth Initiatives Experienced Management Team
Appendix
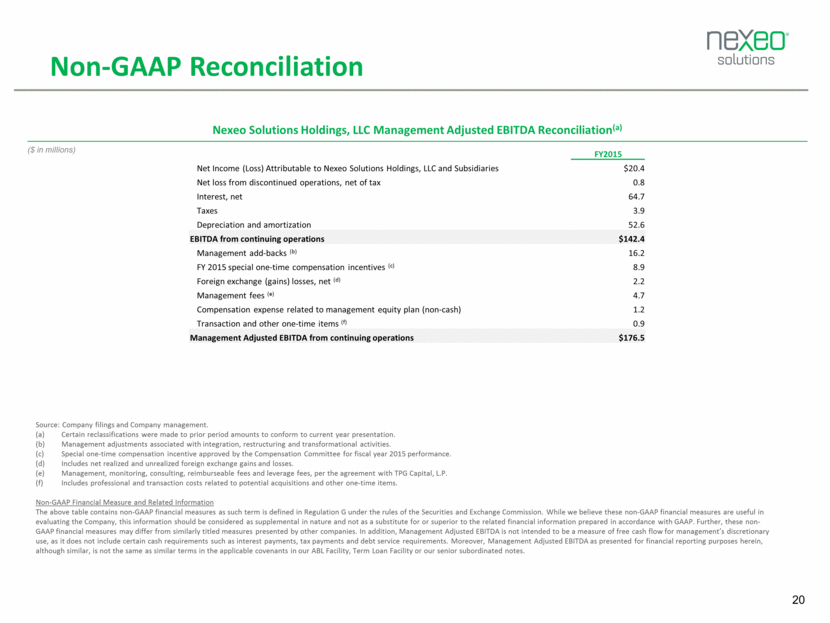
Non-GAAP Reconciliation Source: Company filings and Company management. Certain reclassifications were made to prior period amounts to conform to current year presentation. Management adjustments associated with integration, restructuring and transformational activities. Special one-time compensation incentive approved by the Compensation Committee for fiscal year 2015 performance. Includes net realized and unrealized foreign exchange gains and losses. Management, monitoring, consulting, reimburseable fees and leverage fees, per the agreement with TPG Capital, L.P. Includes professional and transaction costs related to potential acquisitions and other one-time items. Non-GAAP Financial Measure and Related Information The above table contains non-GAAP financial measures as such term is defined in Regulation G under the rules of the Securities and Exchange Commission. While we believe these non-GAAP financial measures are useful in evaluating the Company, this information should be considered as supplemental in nature and not as a substitute for or superior to the related financial information prepared in accordance with GAAP. Further, these non-GAAP financial measures may differ from similarly titled measures presented by other companies. In addition, Management Adjusted EBITDA is not intended to be a measure of free cash flow for management’s discretionary use, as it does not include certain cash requirements such as interest payments, tax payments and debt service requirements. Moreover, Management Adjusted EBITDA as presented for financial reporting purposes herein, although similar, is not the same as similar terms in the applicable covenants in our ABL Facility, Term Loan Facility or our senior subordinated notes. Nexeo Solutions Holdings, LLC Management Adjusted EBITDA Reconciliation(a) ($ in millions) FY2015 Net Income (Loss) Attributable to Nexeo Solutions Holdings, LLC and Subsidiaries $20.4 Net loss from discontinued operations, net of tax 0.8 Interest, net 64.7 Taxes 3.9 Depreciation and amortization 52.6 EBITDA from continuing operations $142.4 Management add-backs (b) 16.2 FY 2015 special one-time compensation incentives (c) 8.9 Foreign exchange (gains) losses, net (d) 2.2 Management fees (e) 4.7 Compensation expense related to management equity plan (non-cash) 1.2 Transaction and other one-time items (f) 0.9 Management Adjusted EBITDA from continuing operations $176.5
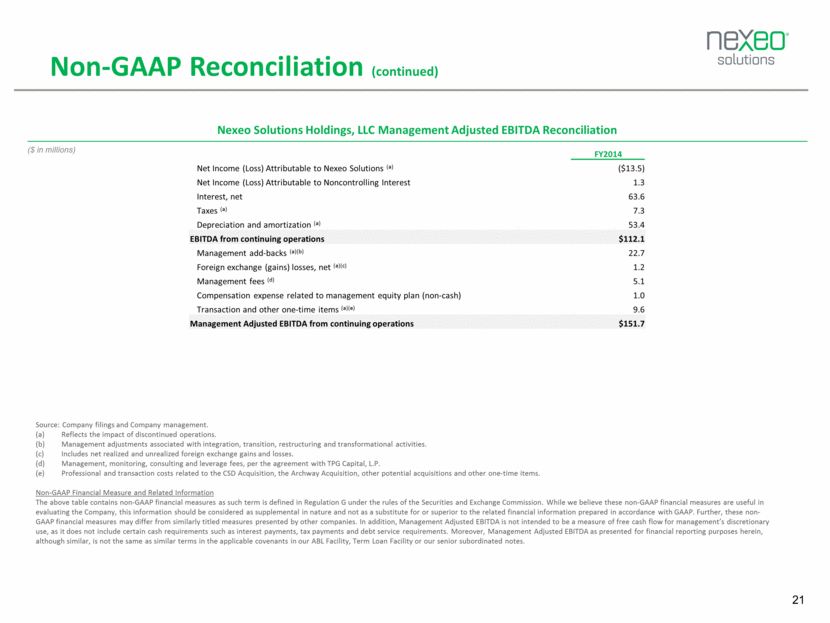
Non-GAAP Reconciliation (continued) Source: Company filings and Company management. Reflects the impact of discontinued operations. Management adjustments associated with integration, transition, restructuring and transformational activities. Includes net realized and unrealized foreign exchange gains and losses. Management, monitoring, consulting and leverage fees, per the agreement with TPG Capital, L.P. Professional and transaction costs related to the CSD Acquisition, the Archway Acquisition, other potential acquisitions and other one-time items. Non-GAAP Financial Measure and Related Information The above table contains non-GAAP financial measures as such term is defined in Regulation G under the rules of the Securities and Exchange Commission. While we believe these non-GAAP financial measures are useful in evaluating the Company, this information should be considered as supplemental in nature and not as a substitute for or superior to the related financial information prepared in accordance with GAAP. Further, these non-GAAP financial measures may differ from similarly titled measures presented by other companies. In addition, Management Adjusted EBITDA is not intended to be a measure of free cash flow for management’s discretionary use, as it does not include certain cash requirements such as interest payments, tax payments and debt service requirements. Moreover, Management Adjusted EBITDA as presented for financial reporting purposes herein, although similar, is not the same as similar terms in the applicable covenants in our ABL Facility, Term Loan Facility or our senior subordinated notes. Nexeo Solutions Holdings, LLC Management Adjusted EBITDA Reconciliation ($ in millions) FY2014 Net Income (Loss) Attributable to Nexeo Solutions (a) ($13.5) Net Income (Loss) Attributable to Noncontrolling Interest 1.3 Interest, net 63.6 Taxes (a) 7.3 Depreciation and amortization (a) 53.4 EBITDA from continuing operations $112.1 Management add-backs (a)(b) 22.7 Foreign exchange (gains) losses, net (a)(c) 1.2 Management fees (d) 5.1 Compensation expense related to management equity plan (non-cash) 1.0 Transaction and other one-time items (a)(e) 9.6 Management Adjusted EBITDA from continuing operations $151.7
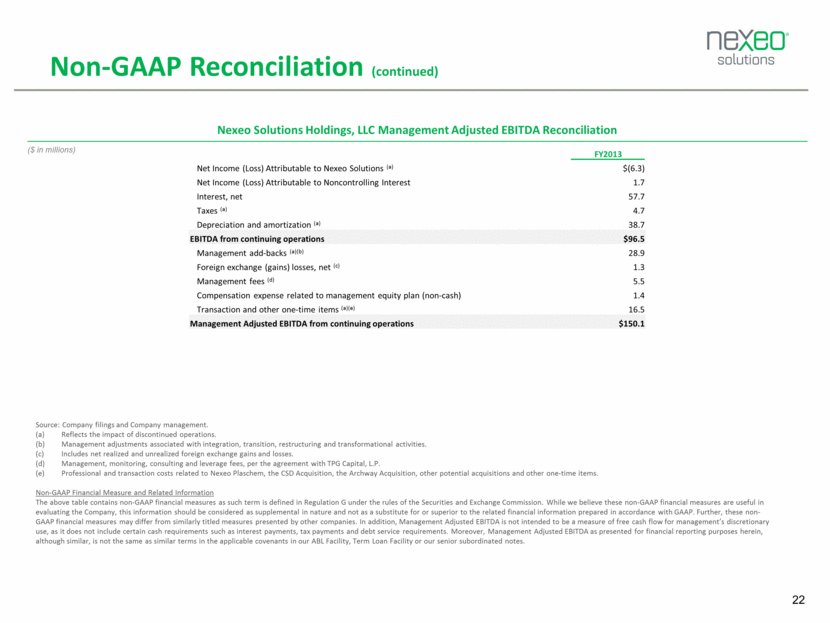
Non-GAAP Reconciliation (continued) Source: Company filings and Company management. Reflects the impact of discontinued operations. Management adjustments associated with integration, transition, restructuring and transformational activities. Includes net realized and unrealized foreign exchange gains and losses. Management, monitoring, consulting and leverage fees, per the agreement with TPG Capital, L.P. Professional and transaction costs related to Nexeo Plaschem, the CSD Acquisition, the Archway Acquisition, other potential acquisitions and other one-time items. Non-GAAP Financial Measure and Related Information The above table contains non-GAAP financial measures as such term is defined in Regulation G under the rules of the Securities and Exchange Commission. While we believe these non-GAAP financial measures are useful in evaluating the Company, this information should be considered as supplemental in nature and not as a substitute for or superior to the related financial information prepared in accordance with GAAP. Further, these non-GAAP financial measures may differ from similarly titled measures presented by other companies. In addition, Management Adjusted EBITDA is not intended to be a measure of free cash flow for management’s discretionary use, as it does not include certain cash requirements such as interest payments, tax payments and debt service requirements. Moreover, Management Adjusted EBITDA as presented for financial reporting purposes herein, although similar, is not the same as similar terms in the applicable covenants in our ABL Facility, Term Loan Facility or our senior subordinated notes. Nexeo Solutions Holdings, LLC Management Adjusted EBITDA Reconciliation ($ in millions) FY2013 Net Income (Loss) Attributable to Nexeo Solutions (a) $(6.3) Net Income (Loss) Attributable to Noncontrolling Interest 1.7 Interest, net 57.7 Taxes (a) 4.7 Depreciation and amortization (a) 38.7 EBITDA from continuing operations $96.5 Management add-backs (a)(b) 28.9 Foreign exchange (gains) losses, net (c) 1.3 Management fees (d) 5.5 Compensation expense related to management equity plan (non-cash) 1.4 Transaction and other one-time items (a)(e) 16.5 Management Adjusted EBITDA from continuing operations $150.1
