Attached files
| file | filename |
|---|---|
| 8-K - FORM 8-K - Metaldyne Performance Group Inc. | v435021_8k.htm |
Exhibit 99.1

Bank of America Merrill Lynch Auto Summit March 23, 2016

Disclaimer This presentation and any related statements contain certain “forward - looking statements” about MPG’s financial results and esti mates and business prospects within the meaning of the Private Securities Litigation Reform Act of 1995. Forward - looking statements may be identified by words such as “expects,” “intends,” “anticipates,” “plans,” “projects,” “believe s,” “seeks,” “targets,” “forecasts,” “estimates,” “will” or other words of similar meaning and include, but are not limited t o, statements regarding the outlook for the Company’s future business, prospects and financial performance; the industry outlook, our backl og and our 2016 financial guidance. Forward - looking statements are based on management’s current expectations and assumptions, whi ch are subject to inherent uncertainties, risks and changes in circumstances that are difficult to predict. Actual outcomes and re sults may differ materially due to global political, economic, business, competitive, market, regulatory, and other factors a nd risks, among them being: volatility in the global economy impacting demand for new vehicles and our products; a decline in vehicle product ion levels, particularly with respect to platforms for which we are a significant supplier, or the financial distress of any of o ur major customers; cyclicality and seasonality in the light vehicle, industrial and commercial vehicle markets; our significant compe tit ion; our dependence on large - volume customers for current and future sales; a reduction in outsourcing by our customers, the los s or discontinuation of material production or programs, or a failure to secure sufficient alternative programs; our failure to of fse t continuing pressure from our customers to reduce our prices; our inability to realize all of the sales expected from awarde d b usiness or fully recover pre - production costs; our failure to increase production capacity or over - expanding our production in times of overcapac ity; our reliance on key machinery and tooling to manufacture components for powertrain and safety - critical systems that cannot be easily replicated; program launch difficulties; a disruption in our supply or delivery chain which causes one or more of our custome rs to halt production; the damage to or termination of our relationships with key third - party suppliers; work stoppages or producti on limitations at one or more of our customer’s facilities; a catastrophic loss of one of our key manufacturing facilities; fail ure to protect our know - how and intellectual property; the disruption or harm to our business as a result of any acquisitions or jo int ventures we make; a significant increase in the prices of raw materials and commodities we use; our failure to maintain our cost structur e; the incurrence of significant costs if we close any of our manufacturing facilities; potential significant costs at our facil ity in Sandusky, Ohio; the incurrence of significant costs, liabilities, and obligations as a result of environmental requirements and other regulat ory risks; extensive and growing governmental regulations; the incurrence of material costs related to legal proceedings; our ina bi lity to recruit and retain key personnel; any failure to maintain satisfactory labor relations; pension and other postretirement benefit obli gat ions; risks related to our global operations; competitive threats posed by global operations and entering new markets; foreig n e xchange rate fluctuations; our substantial indebtedness; our inability, or the inability of our customers or our suppliers, to obtain and mai ntain sufficient debt financing, including working capital lines; our exposure to a number of different tax uncertainties; th e m ix of profits and losses in various jurisdictions adversely affecting our tax rate. For the reasons described above, we caution you against relying on any forward - looking statements, which should also be read in conjunction with the other cautionary statements that are included elsewhere in this press release and in our public filings, including under the heading “Risk Factors” in our filings that we make from time to time with the Securities and Exchange Commission. You should not consider any list of such factors to be an exhaustive statement of all the risks, uncert ai nties, or potentially inaccurate assumptions that could cause our current expectations or beliefs to change. Further, any forward - looking statement speaks only as of the date on which it is made, and we undertake no obligation to update or revise any forward - lookin g statement to reflect events or circumstances after the date on which the statement is made or to reflect the occurrence of un ant icipated events, except as otherwise may be required by law. Non - GAAP Financial Measures Combined Net Sales We define Combined Net Sales as the Net Sales of MPG plus the Net Sales of Grede prior to our acquisition of Grede. We present Combined Net Sales because our management considers it to be a useful, su pplemental indicator of our performance when comparing periods before and after our acquisition of Grede. For a reconciliation of Combined Net Sales to Net Sales, the most directly comparable U.S. generally accepted accounting principles “GAAP” measure, see Appendix to this presentation. Adjusted EBITDA and Combined Adjusted EBITDA We define Adjusted EBITDA as net income (loss) before interest expense, provision for (benefit from) income taxes and depreciati on and amortization, with further adjustments to reflect the additions and eliminations of certain income statement items, including (i) gains and losses on foreign currency and fixed assets and debt transaction expenses, (ii) stoc k - b ased compensation and other non - cash charges, (iii) sponsor management fees and other income and expense items that we consider to be not indicative of our ongoing operations, (iv) specified non - recurring items and (v) other adjustments. We define Combined Adjus ted EBITDA as Adjusted EBITDA plus the Adjusted EBITDA of Grede prior to our acquisition of Grede. We believe Adjusted EBITDA is used by investors as a supplemental measure to evaluate the overall operating performance of companies in our industry. Management us es Adjusted EBITDA (i) as a measurement used in comparing our operating performance on a consistent basis, (ii) to calculate incentive compensation for our employees, (iii) for planning purposes, including the preparation of our internal annual opera tin g budget, (iv) to evaluate the performance and effectiveness of our operational strategies and (v) to assess compliance with var ious metrics associated with our agreements governing our indebtedness. Accordingly, we believe that Adjusted EBITDA provides useful infor mat ion to investors and others in understanding and evaluating our operating performance in the same manner as our management. We present Combined Adjusted EBITDA because our management considers it to be a useful, supplemental indicator of our performanc e w hen comparing periods before and after our acquisition of Grede. For a reconciliation of Adjusted EBITDA and Combined Adjusted EBITDA to income before tax, the most directly comparable measure determined under GAAP, see Appendix to this presentation. Adjusted Free Cash Flow and Combined Adjusted Free Cash Flow We define Adjusted Free Cash Flow as Adjusted EBITDA less capital expenditures. Capital expenditures are on an accrual basis of acc ounting and can be calculated by taking the capital expenditures found in the investing section of our consolidated statements of cash flows and adjusting for the change in the period of the capital expenditure in accounts payab les found in the supplemental cash flow information on our consolidated statements of cash flows. We present Adjusted Free Cash Flow because our management considers it to be a useful, supplemental indicator of our performance. When measured over time, Adjus ted Free Cash Flow provides supplemental information to investors concerning our results of operations and our ability to generat e cash flows to satisfy mandatory debt service requirements and make other non - discretionary expenditures. For a reconciliation of Adjusted Free Cash Flow to income before tax, the most directly comparable GAAP measure, see Appendix to this presentation. Net new business backlog Net new business backlog, which we measure as anticipated net product sales from incremental business for the next four years, net of Programs being ph ase d out and any contractual pricing changes. We are typically awarded Programs one to three years prior to the start of production on new and replacement business. Due to the timing of the OEM sourcing cy cle , our anticipated net product sales were measured based on contracts to be fulfilled during 2016 through 2019. Our estimate o f anticipated net product sales includes formally awarded new Programs, Programs which we believe are highly probable of being awa rded to us, and expected volume and pricing contractual changes on existing Programs. Our estimate may be impacted by various assumptions including vehicle production levels on new and replacement Programs, non - contractual customer price reductions, scrap prices, material price indices, currency exchange rates and the timing of Program launches. Therefore , t his anticipated net product sales information could differ significantly from actual firm orders or firm commitments, and awards of business do not repre sen t guarantees of production volumes or revenues. 2

□ Business Overview and 2016 Priorities □ 2015 Results and 2016 Outlook □ Q & A Session Agenda and Presenters 3 » George Thanopoulos Chief Executive Officer » Mark Blaufuss Chief Financial Officer » Paul Suber Vice President of Investor Relations

BUSINESS OVERVIEW AND 2016 PRIORITIES

The MPG Story 5 MPG is a Powerful C ash F low Engine… …Positioned for Long - Term Growth 1. Cash flow from operations – Cash Capex/ market cap as of 12/31/15 2. Based on 2015 Net Sales excluding wheel bearings …with Strong Margins and Market Positions… 2015 Results • 8.3% Free Cash Flow yield 1 • Adjusted EBITDA – Capex of $318 million • Net debt reduction and dividends of $107 million in 2015 • Adjusted EBITDA margin of 18% • Processes • Forging • Ductile Iron Casting • Products • Powertrain Concentration in higher growth powertrain applications 73% of Net Sales 2

The MPG Value Proposition 6 Leader in Advanced Metal Processes Unique Capabilities Powerful Customer Value Proposition • Broad range of metal forming processes • Expertise in complex, highly engineered components • Global footprint – 61 locations – 13 countries – ~12,000 employees • Leading NA capacity in supply constrained industry • Light weighting and performance solutions • Unique components for critical powertrain applications • Seamless vertical integration capabilities

Broad Global Footprint • 61 locations in 13 countries • Supports OEM global powertrain applications • Leading NA capacity in supply constrained industry • Expansion in both Mexico and China to support customer growth 7 U.S. Brazil South Korea Germany Mexico England Spain Luxembourg France Czech Republic China India Japan 39 5 1 1 2 3 2 2 1 1 2 1 1

Key Factors Driving Faster Content Growth in Powertrains x Smaller, more powerful engines creating more opportunities for additional content x Conversion to higher speed transmissions (8/9/10 speed and CVT ) which require more gears and MPG supplied products x Long life product cycles generally >10 years x Programs serve multiple platforms and nameplates Faster content growth in Powertrain 8 Drivers 34 55 2016 2025 >60% increase in CAFE standards by 2025 U.S. CAFE Standards
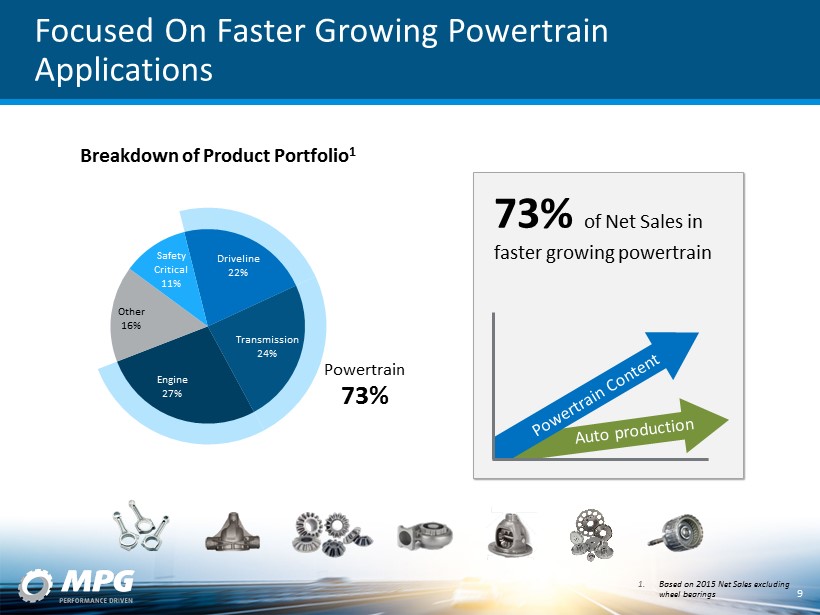
Driveline 22% Transmission 24% Engine 27% Other 16% Safety Critical 11% 1. Based on 2015 Net Sales excluding wheel bearings Focused On Faster Growing Powertrain Applications Breakdown of Product Portfolio 1 Powertrain 73% 73% of Net Sales in faster growing powertrain 9

Leadership Products Powder Metal Connecting Rods Aluminum Valve Bodies Transmission Gears and Shafts Differential Cases 10 Axle Carriers Crankshaft Dampers Balance Shaft Systems

Multiple Factors Driving MPG Value Creation 11 Near - Term Focus Targeted Growth $4B N et S ales $3B • Total shareholder return • New business wins • Vertical integration, cross - selling • Phase out of wheel bearing business • Launch and ramp - up of new programs • Capture value - added, powertrain content • Continue global expansion Key Drivers Anticipated Key Drivers 1. Adjusted EBITDA less capex 2. Based on peak Net Sales 2015 Results • Adjusted Free Cash Flow 1 : $318 million • Adjusted EBITDA margin: 18 % • New business w ins 2 : $727 million

Light Vehicle 85% Commercial 10% Industrial 5% North America 84% Europe 9% Asia 7% Powertrain 90% Safety Critical 5% Other 5% FY 2014 FY 2015 $672 $727 Accelerating Profitable Growth 1. New business is peak annual Net Sales. Programs are expected to launch and ramp up over the next several years. 2. Combined 2014 new b usiness awards Application Region Market $ Millions New Business Awards 1 2 New Business Awards Detail 12

New Business Award Examples – Fuel Efficient Engines 13 Connecting Rods: $85M Scissor Gears: $25M Sprockets: $25M Balance Shaft modules and assemblies: $30M Dampers: $5M New business is peak annual Net Sales. Programs generally launch and ramp up over the next 5 years. $170M of new b usiness a wards

New Business Award Examples – Advanced Transmissions 14 Differential Gears and Assemblies: $85M Clutch Components: $110M Solenoid and Valve Bodies: $30M Fixed/Moveable Pulleys (CVT Transmission): $35M $355M of new b usiness a wards New business is peak annual Net Sales. Programs generally launch and ramp up over the next 5 years.

2016 Priorities - Generate C ash and Build Our Future Investment For Future Growth , Continuous Improvement and Cost Reduction Active Pursuit of Strategic Acquisitions Value Creation Through Cash Generation ▪ 10%+ Adjusted Free Cash Flow 1 ▪ ~18% Adjusted EBITDA margin 2 ▪ Share r epurchase program of up to $25 million MPG 2016 Priorities ▪ Consolidation opportunities ▪ Global expansion ▪ Product and customer growth 1. Calculated as adjusted EBITDA less Capex/ Net Sales 2. Based on Net S ales 12 transactions in 10 years Focus on Growth 2015 2018 Continue to book new business awards 15

2015 RESULTS AND 2016 OUTLOOK

Full Year Financial Results ($ in Millions except EPS) Full Year 2015 2014 Difference % Change Net Sales $3,047 $2,717 $330 12% Adjusted EBITDA 1 538 479 59 12% Capex 220 177 43 Adjusted Free Cash Flow 2 318 302 16 Fully Diluted EPS 1.80 1.06 0.74 1. See Appendix for reconciliation to GAAP 2. Defined as Adjusted EBITDA less Capex Record Full Year Results 17

2015 EPS 18 Other Elements Impacting EPS ▪ Share - based Compensation ▪ Foreign Exchange ▪ Income Taxes ▪ Timing of Expenses ▪ Intangible Amortization ▪ Other Non - Recurring Items 1. Non - Recurring EBITDA items include Debt Transaction Expense of $1.7 M, Loss on debt extinguishment of $0.4 M, Non - Recurring Items of $14.7 M, Severance Costs of $11.7 M 2 . A 1% change in EUR/USD rate would result in an after - tax FX gain/loss of ~$1.4M or ~$0.02 EPS 3. Tax rates depend on the nature of the item and geographic location Fully Diluted EPS $ 1.80 Elements of EPS Pre - Tax Net Of Tax USD Millions USD Millions Per Share Non - Recurring EBITDA Addback Items ¹ $ (29) $ (18) $ (0.26) FX Gain on Euro Loan 2 $ 10 $ 6 $ 0.09 Non - Recurring Income Tax Items 3 $ 7 $ 7 $ 0.10 Intangible Amortization $ (70) $ (42) $ (0.60)

211 207 198 202 206 2014 2015 2016 2017 2018 295 320 260 262 261 232 237 236 244 245 527 557 496 506 506 2014 2015 2016 2017 2018 FTR Class 8 ACT Class 5-7 17.5 18.2 18.5 18.6 19.0 2015 2016 2017 2018 2019 20.9 21.2 21.7 22.4 22.8 2015 2016 2017 2018 2019 Strong Outlook for Primary Light Vehicle Markets 1. Vehicle Production in millions: IHS February 2016 2. Based on 2015 Net Sales country of origin 3. Production in thousands, FTR/ACT February 2016 4. Production in thousands, Yengst September 2015 5. Based on 2015 Net Sales MPG Geographic Footprint 2 North American Light Vehicle Production 1 European Light Vehicle Production 1 Market Outlook North America , 84% EU 12% Rest of World 4% North American Construction Equipment 4 North American Class 5 - 8 Vehicle Production 3 Light Vehicle 82% Commercial* 10% Industrial 8% MPG End Market Contribution 5 * C lass 5 – 7 and Class 8 equally weighted 19

2016 Guidance – Unchanged 2016 Guidance Net Sales $2.75 – $2.95 billion Adjusted EBITDA 1 $500 – $540 million Capital Expenditures $190 – $210 million Adjusted Free Cash Flow 2 $310 – $330 million 20 1. See Appendix for reconciliation to GAAP 2. Defined as Adjusted EBITDA less CapEx , utilizing high and low ends of Adjusted EBITDA and CapEx

Reinvesting in the Business Capital investment to drive future growth and returns Continue Deleveraging Cash flow to reduce net d ebt Rewarding our Shareholders Ma intain dividends given strong cash flow performance Share Repurchase Board authorized up to $25 million share repurchase given market valuation Net debt r eduction through cash flow $190 - $210 million in capital i nvestment Shareholder returns through dividends Balanced Use of Cash Flow 2016 Planned Capital Allocation Value Creation Share repurchase 21

Why Invest in MPG – Continued Shareholder Value Creation and Long - Term Growth ~$3B 2016 Guidance • Adj. Free Cash Flow: $310 – $330 million • Adj. EBITDA margin: ~18% • Base business growth 2015 Results • Adj. Free Cash Flow 1 : $318 million • Adj. EBITDA margin: 17.7% • New business wins 2 : $727 million Near - Term Focus 1. Adjusted EBITDA less Capex 2. Based on peak Net Sales Targeted Growth $4B Net Sales • Launch and ramp - up of new programs • Capture value - added, powertrain content • Continue global expansion Anticipated Key Drivers 22

Q&A

APPENDIX

2015 EPS 25 Q1 '15 Q2 '15 Q3 '15 Q4 '15 FY 2015 Q1 '15 Q2 '15 Q3 '15 Q4 '15 FY 2015 Fully Diluted EPS 0.47$ 0.64$ 0.41$ 0.29$ 1.80$ Elements of EPS (Net of Tax) Non-Recurring EBITDA addback items (1) (6) (4) (8) (18) (0.01) (0.08) (0.05) (0.12) (0.26)$ FX Gain on Euro Loan - 2 - 4 6 - 0.04 - 0.06 0.09$ Non-Recurring Income Tax Items - 3 - 4 7 - 0.05 - 0.06 0.10$ Intangible Amortization (11) (11) (10) (10) (42) (0.15) (0.16) (0.15) (0.15) (0.60)$ EPSUSD Millions

Guidance Assumptions Industry Production/ Assumptions 2016E Vehicle Production Light Vehicle SAAR North America 17.9 million Light Vehicle SAAR Europe 20.8 million Light Vehicle SAAR Asia 38.7 million North American Heavy Truck Class 8 306 thousand North American Heavy Truck Class 5 - 7 224 thousand North American Industrial Market flat FX Rates USD to Euro 1.06 Mexican Peso to USD 16.63 Chinese Yuan to USD 6.39 Korean Won to USD 1,155.7 Metals Market Chicago #1 Bundles $150 Pittsburgh Punchings & Plate GT Low $404 26

GAAP Reconciliation MPG SCHEDULE OF NON - GAAP FINANCIAL INFORMATION 27 $ in Millions Quarter End December 31, Year End December 31, 2015 2014 2015 2014 Income before tax $ 28.6 (39.8) 173.9 54.2 Addbacks to Arrive at Unadjusted EBITDA Interest expense, net $ 27.0 29.6 107.5 99.9 Loss on debt extinguishment - 60.4 0.4 60.7 Depreciation and amortization 57.7 58.4 229.8 210.8 Unadjusted EBITDA $ 113.3 108.6 511.6 425.6 Adjustments to Arrive at Adjusted EBITDA $ (8.5) (4.2) (20.2) (15.7) Gain on foreign currency Loss on fixed assets 0.9 0.7 2.8 2.1 Debt transaction expenses - 0.1 1.7 3.0 Stock - based compensation expense 12.3 2.8 27.7 17.3 Sponsor management fee - 1.4 - 5.1 Non - recurring acquisition and purchase accounting related items 1.6 0.2 3.0 23.0 Non - recurring operational items 3.6 16.1 11.6 18.2 Adjusted EBITDA $ 123.2 125.7 538.2 478.6 Capital expenditures 70.6 78.1 219.6 177.2 Adjusted Free Cash Flow $ 52.6 47.6 318.6 301.4

MPG Adjustments to Reconcile Income Before Tax to Adjusted EBITDA 2016 Guidance 2016 Guidance Low End of Range High End of Range Income before tax 131.2 171.2 Addbacks to Arrive at Unadjusted EBITDA Interest expense, net 104.4 104.4 Depreciation and amortization 238.4 238.4 Unadjusted EBITDA 474.0 514.0 Adjustments to Arrive at Adjusted EBITDA Stock - based compensation expense 22.9 22.9 Non - recurring operational items and other (1) 3.1 3.1 Adjusted EBITDA 500.0 540.0 (1) Non - recurring operational items include charges for disposed operations and other . 2016 GAAP Reconciliation $ in Millions 28