Attached files
| file | filename |
|---|---|
| EX-32.1 - EX-32.1 - Microbot Medical Inc. | d135914dex321.htm |
| EX-23.1 - EX-23.1 - Microbot Medical Inc. | d135914dex231.htm |
| EX-31.1 - EX-31.1 - Microbot Medical Inc. | d135914dex311.htm |
| EX-32.2 - EX-32.2 - Microbot Medical Inc. | d135914dex322.htm |
| EX-31.2 - EX-31.2 - Microbot Medical Inc. | d135914dex312.htm |
| EX-10.21 - EX-10.21 - Microbot Medical Inc. | d135914dex1021.htm |
| EX-10.22 - EX-10.22 - Microbot Medical Inc. | d135914dex1022.htm |
Table of Contents
UNITED STATES
SECURITIES AND EXCHANGE COMMISSION
Washington, D.C. 20549
Form 10-K
| x | ANNUAL REPORT PURSUANT TO SECTION 13 OR 15(d) OF THE SECURITIES EXCHANGE ACT OF 1934 |
For the fiscal year ended December 31, 2015
or
| ¨ | TRANSITION REPORT PURSUANT TO SECTION 13 OR 15(d) OF THE SECURITIES EXCHANGE ACT OF 1934 |
COMMISSION FILE NUMBER 0-19871
STEMCELLS, INC.
(Exact name of Registrant as specified in its charter)
| A Delaware Corporation | 94-3078125 | |
| (State or other jurisdiction of incorporation or organization) |
(I.R.S. Employer Identification No.) | |
| 7707 GATEWAY BLVD NEWARK, CA (Address of principal offices) |
94560 (zip code) | |
Registrant’s telephone number, including area code:
(510) 456-4000
Securities registered pursuant to Section 12(b) of the Act:
| Title of Each Class |
Name of Each Exchange on Which Registered | |
| Common Stock, $0.01 par value | NASDAQ Capital Market |
Securities registered pursuant to Section 12(g) of the Act:
None
Indicate by check mark if the registrant is a well-known seasoned issuer, as defined in Rule 405 of the Securities Act. Yes ¨ No x
Indicate by check mark if the registrant is not required to file reports pursuant to Section 13 or Section 15(d) of the Act. Yes ¨ No x
Indicate by check mark whether the Registrant (1) has filed all reports required to be filed by Section 13 or 15(d) of the Securities Exchange Act of 1934 during the preceding 12 months (or for such shorter period that the registrant was required to file such reports), and (2) has been subject to such filing requirements for the past 90 days. Yes x No ¨
Indicate by check mark whether the registrant has submitted electronically and posted on its corporate Web site, if any, every Interactive Data File required to be submitted and posted pursuant to Rule 405 of Regulation S-T (§ 232.405 of this chapter) during the preceding 12 months (or for such shorter period that the registrant was required to submit and post such files). Yes x No ¨
Indicate by check mark if disclosure of delinquent filers pursuant to Item 405 of Regulation S-K is not contained herein, and will not be contained, to the best of registrant’s knowledge, in definitive proxy or information statements incorporated by reference in Part III of this Form 10-K or any amendment to this Form 10-K. x
Indicate by check mark whether the registrant is a large accelerated filer, an accelerated filer, a non-accelerated filer, or a smaller reporting company. See the definitions of “large accelerated filer,” “accelerated filer” and “smaller reporting company” in Rule 12b-2 of the Exchange Act. (Check one):
| Large accelerated filer | ¨ | Accelerated filer | x | |||
| Non-accelerated filer | ¨ (Do not check if a smaller reporting company) | Smaller reporting company | ¨ | |||
Indicate by check mark whether the Registrant is a shell company (as defined in Rule 12b-2 of the Exchange Act). Yes ¨ No x
Aggregate market value of common stock held by non-affiliates at June 30, 2015: $57,426,079. Inclusion of shares held beneficially by any person should not be construed to indicate that such person possesses the power, direct or indirect, to direct or cause the direction of management policies of the registrant, or that such person is controlled by or under common control with the Registrant.
Common stock outstanding at March 11, 2016: 112,507,589 shares.
DOCUMENTS INCORPORATED BY REFERENCE
Portions of the registrant’s definitive Proxy Statement relating to the registrant’s 2016 Annual Meeting of Stockholders to be filed with the Commission pursuant to Regulation 14A are incorporated by reference in Part III of this report.
Table of Contents
FORWARD LOOKING STATEMENTS
THIS REPORT CONTAINS FORWARD-LOOKING STATEMENTS AS DEFINED UNDER THE FEDERAL SECURITIES LAWS. ACTUAL RESULTS COULD VARY MATERIALLY. FACTORS THAT COULD CAUSE ACTUAL RESULTS TO VARY MATERIALLY ARE DESCRIBED HEREIN AND IN OTHER DOCUMENTS FILED WITH THE SECURITIES AND EXCHANGE COMMISSION. READERS SHOULD PAY PARTICULAR ATTENTION TO THE CONSIDERATIONS DESCRIBED IN THE SECTION OF THIS REPORT ENTITLED “MANAGEMENT’S DISCUSSION AND ANALYSIS OF FINANCIAL CONDITION AND RESULTS OF OPERATIONS” AS WELL AS ITEM 1A UNDER THE HEADING “RISK FACTORS.” FORWARD-LOOKING STATEMENTS SPEAK ONLY AS OF THE DATE OF THIS REPORT. WE DO NOT UNDERTAKE ANY OBLIGATION TO PUBLICLY UPDATE ANY FORWARD-LOOKING STATEMENTS.
Table of Contents
| Page | ||||||
| PART I | ||||||
| Item 1. | 1 | |||||
| Item 1A. | 22 | |||||
| Item 1B. | 32 | |||||
| Item 2. | 32 | |||||
| Item 3. | 32 | |||||
| Item 4. | 32 | |||||
| PART II | ||||||
| Item 5. | 33 | |||||
| Item 6. | 35 | |||||
| Item 7. | Management’s Discussion and Analysis of Financial Condition and Results of Operations |
36 | ||||
| Item 7A. | 54 | |||||
| Item 8. | 55 | |||||
| Item 9. | Changes in and Disagreements with Accountants on Accounting and Financial Disclosure |
88 | ||||
| Item 9A. | 88 | |||||
| Item 9B. | 91 | |||||
| PART III | ||||||
| Item 10. | 91 | |||||
| Item 11. | 93 | |||||
| Item 12. | Security Ownership of Certain Beneficial Owners and Management and Related Stockholder Matters |
93 | ||||
| Item 13. | Certain Relationships and Related Transactions, and Director Independence |
93 | ||||
| Item 14. | 93 | |||||
| PART IV | ||||||
| Item 15. | 94 | |||||
NOTE REGARDING REFERENCES TO OUR COMMON STOCK
Throughout this Form 10-K, the words “we,” “us,” “our,” and “StemCells” refer to StemCells, Inc., including our directly and indirectly wholly-owned subsidiaries. “Common stock” refers to the common stock of StemCells, Inc., $0.01 par value.
Table of Contents
PART I
| Item 1. | BUSINESS |
Overview
StemCells, Inc. is engaged in the research, development, and commercialization of stem cell therapeutics. We believe that understanding cells and cell biology, and in particular stem cells, will play an increasingly important role in the understanding of human diseases and in the discovery of new medical therapies. Consequently, we are focused on developing and commercializing stem and progenitor cells as the basis for novel therapeutics and therapies.
Our primary research and development efforts are focused on identifying and developing stem and progenitor cells as potential therapeutic agents. Our lead product development program is our CNS Program, in which we are developing applications for our HuCNS-SC® platform technology, highly purified human neural stem cells, as a potential therapeutic to treat diseases and disorders of the central nervous system (CNS). We estimate that degenerative conditions of the CNS currently affect more than 30 million people in the United States. 1
We are currently in clinical development with our HuCNS-SC cells for a range of diseases and disorders of the CNS. The CNS consists of the brain, spinal cord and eye, and we are currently the only stem cell company in clinical development for indications in all three compartments comprising the CNS, specifically:
| (i) | with respect to the brain, |
| • | in October 2012, we published in Science Translational Medicine, a peer-reviewed journal, the data from our Phase I clinical trial in Pelizeaus-Merzbacher Disease (PMD), a fatal myelination disorder in the brain. The data showed preliminary evidence of progressive and durable donor cell-derived myelination in all four patients transplanted with HuCNS-SC cells. Three of the four patients showed modest gains in neurological function; the fourth patient remained stable; and |
| • | we have completed a Phase I clinical trial in infantile and late infantile neuronal ceroid lipofuscinosis (NCL, also known as Batten disease), which is a neurodegenerative disorder of the brain. The data from that trial showed that our HuCNS-SC cells were well tolerated, non-tumorigenic, there was evidence of engraftment and long-term survival of the transplanted HuCNS-SC cells for up to six years; five years after stopping immunosuppression these data suggest that patients receiving human neural stem cell transplants should not need to be maintained on life-long immunosuppression; and |
| (ii) | with respect to the spinal cord, |
| • | in May 2014, we completed the enrollment and dosing of twelve subjects in a Phase I/II clinical trial of our HuCNS-SC cells for the treatment of thoracic spinal cord injury. Under this trial, a total of twelve patients, seven patients with complete injury (AIS A) and five patients with an incomplete injury (AIS B), were enrolled and transplanted with our HuCNS-SC cells. We reported the results from twelve-month data that revealed sustained improvements in sensory function that emerged consistently around three months after transplantation and persisted until the end of the study. The patterns of sensory gains were confirmed to involve multiple sensory pathways and were observed more frequently in the patients with less severe injury; three of the seven AIS A patients and four of the five AIS B patients showed signs of positive sensory gains confirming the previously reported interim results. In addition, two patients progressed during the study from the most severe classification, AIS A, to the lesser degree of injury grade, AIS B; and |
| 1 | This estimate is based on information from the Alzheimer’s Association, the Alzheimer’s Disease Education & Referral Center (National Institute on Aging), the National Parkinson Foundation, the National Institutes of Health’s National Institute on Neurological Disorders and Stroke, the Foundation for Spinal Cord Injury Prevention, Care & Cure, the Travis Roy Foundation, the Centers for Disease Control and Prevention, the Wisconsin Chapter of the Huntington’s Disease Society of America, and the Cincinnati Children’s Hospital Medical Center. |
1
Table of Contents
| • | in October 2014, we initiated our Pathway™ Study, a Phase II proof of concept clinical trial using our HuCNS-SC cells for the treatment of cervical spinal cord injury (SCI). The Pathway Study is designed to evaluate both the safety and efficacy of transplanting stem cells into patients with traumatic injury to the cervical spinal cord. The trial will be conducted as a randomized, controlled, single-blind study and efficacy will be primarily measured by assessing motor function according to the International Standards for Neurological Classification of Spinal Cord Injury (ISNCSCI). The primary efficacy outcome will focus on change in upper extremity strength as measured in the hands, arms and shoulders. The trial will enroll approximately fifty-two subjects and follow the patients for twelve months post-transplant. The trial has three cohorts; the first cohort is an open-label dose escalation arm involving six patients to determine the cell dose to be used for the second and third cohort of the study; the second cohort will enroll forty patients and forms the single-blinded controlled arm of the Phase II study with the primary efficacy outcome being tested as change in motor strength of the various muscle groups in the upper extremities innervated by the cervical spinal cord; the third cohort is an optional open label cohort targeted to enroll six patients to assess safety and preliminary efficacy in patients with less severe injuries (AIS C). We transplanted our first subject in this Phase II trial in December 2014 and completed transplanting the six patients comprising the first cohort of this trial in April 2015. The six-month interim results for the first cohort showed an overall pattern of motor improvement in four of the six patients as measured by gains in both strength and fine motor skills. In addition, four of the six patients showed improvement in the spinal level of injury as defined by the ISNCSCI assessment of at least one level. Consistent with the changes in sensation seen in our prior study in spinal cord injury, these changes in muscle strength and function seen in our Pathway Study were observed around three months post-transplant. We commenced enrollment of the second cohort in the Pathway Study in June 2015; and |
| (iii) | with respect to the eye, |
| • | in June 2012, we initiated a Phase I/II clinical trial designed to evaluate the safety and preliminary efficacy of our HuCNS-SC cells as a treatment for dry age-related macular degeneration (AMD). The trial, an open-label, dose-escalation study, was planned to enroll a total of sixteen patients. In June 2014, based on positive interim results, we closed enrollment after dosing fifteen patients. Multiple safety and efficacy assessments were incorporated into the study, including various assessments of visual function and measurements of disease status by direct retinal examination. The tests in the study included best-corrected visual acuity (BCVA), contrast sensitivity (CS), microperimetry for analysis of visual function, optical coherence tomography (OCT), and fundus autofluorescence (FAF) to measure the extent of the underlying geographic atrophy. Initial assessment of data from the Phase I/II trial indicate that the BCVA and CS measurements for the majority of the patients in the study either improved or remained stable in the treated eye. OCT analysis showed increases in central subfield thickness and in macular volume in the treated eye relative to the untreated eye. For those patients enrolled in the study with lesions sizes consistent with the eligibility criteria for enrollment in our Phase II efficacy study, the study showed GA growth rates in the study eye that were lower than those seen in the control eye. Patients will be followed for an additional four years in a separate observational study; and |
| • | in July 2015, we transplanted our first subject in our Radiant™ Study. This Phase II randomized, controlled proof-of-concept study was designed to evaluate both the safety and efficacy of our proprietary HuCNS-SC cells for the treatment of dry AMD. The study was designed to enroll sixty-three patients between 50-90 years of age with bi-lateral GA-AMD (geographic atrophy associated with age related macular degeneration in both eyes). Designed as a “fellow eye” controlled study, all subjects were to receive subretinal transplantation of HuCNS-SC cells via a single injection into the eye with the inferior best-corrected visual acuity; the untreated eye would serve as a control. The objective of the trial was to demonstrate a reduction in the rate of GA disease progression in the treated eye versus the control eye. However, in December 2015, we |
2
Table of Contents
| initiated a strategic realignment plan to fully focus our resources on our proprietary HuCNS-SC cells for the treatment of chronic spinal cord injury. A key element of the plan included the suspension of further enrollment into our Phase II Radiant Study in dry AMD, while we seek a partner to fund continued development of HuCNS-SC cells as a potential treatment of retinal disorders, and discontinuation of certain third party services related to our AMD program. |
The Potential of Our Tissue-Derived Cell-Based Therapeutics
Stem cells are “building block” cells as they are capable of producing many cell types needed for proper organ function. Stem cells are rare and have two defining characteristics: (i) they produce all of the mature cell types of a particular organ, and (ii) they self renew — that is, some of the cells developed from stem cells are themselves new stem cells. Progenitor cells are cells that have already developed from stem cells, but can still produce one or more mature cell types within an organ. Tissue stem cells are rare cells within an organ and require sophisticated instrumentation and scientific rigor to identify, purify and characterize these cells. To date the human neural stem cell is one of only two adult tissue-derived cells to have been isolated to the single cell level, characterized extensively and confirmed to have all the characteristics of a true stem cell, namely self-renewal (i.e., the ability to make more neural stem cells) and differentiation (i.e., the ability to make neurons, astrocytes and oligodendrocytes, the building blocks of the CNS). Because of their self-renewal property and ability to make the mature cells of the organ we believe that tissue stem cell-based therapies may have the potential to return an impaired organ to proper function for the life of the patient. Many degenerative diseases are caused by the loss of normal cellular function in a particular organ. When cells are damaged or destroyed, they no longer produce, metabolize or accurately regulate the many substances essential to life. There is no technology existing today that can deliver these essential substances precisely to the sites of action, under the appropriate physiological regulation, in the appropriate quantity, or for the duration required to cure the degenerative condition. Cells, however, can do all of this naturally. Transplantation of stem or progenitor cells may therefore prevent the loss of, or even generate new, functional cells and thereby potentially maintain or restore organ function and the patient’s health.
We have been focused on identifying and purifying tissue-derived stem and progenitor cells for use in homologous therapy. Homologous therapy means the use of cells derived from a particular organ to treat a disease of that same organ (for example, use of brain-derived neural stem cells for treatment of CNS disorders). Tissue-derived stem cells are developmentally pre-programmed to become the mature functional cells of the organ from which they were derived. We believe that homologous use of these purified, unmodified brain tissue-derived cells is the most direct way to provide for engraftment and differentiation into functional cells of the CNS. The purification of the “right cell”, the true human neural stem cell, not only facilitates a reproducible manufacturing process and product but also should minimize the risk of transplantation or growth of unwanted cell types.
We use cells derived from donated tissues, which are supplied to us in compliance with all applicable state and federal regulations. We are not involved in any activity directed toward human cloning, nor do we have any plans to start such activities.
Business Strategy
Our aim is to create a sustainable business based on our belief that understanding cells and cell biology will play an increasingly important role in life science research and in the discovery, development and implementation of new medical therapies. Our strategy has been to identify multiple types of human stem and progenitor cells with therapeutic and commercial importance, to develop techniques and processes to purify these cells for direct transplant and to expand and bank these cells. We are currently focused on advancing these cells through clinical development and into commercialized cell-based therapeutic products, with particular focus on the use of human neural stem cells as a potential treatment for acute spinal cord injury.
3
Table of Contents
The fundamental competencies required to execute this strategy are knowledge and expertise in cell biology, particularly stem cell biology, and a commitment to rigorous and robust research and development. We believe that these competencies are critical to identifying, characterizing and understanding cells with therapeutic potential and importance.
Consequently, we have made significant investments in our research and development, clinical and regulatory, and cell processing and process development capabilities. Our management and staff have many years of experience in the stem cell field and in developing potential cell therapies. Two of the four human stem cells identified and characterized to date (the hematopoietic and neural stem cells) were discovered by scientists who are currently on our staff, and we believe we were the first company to receive authorization from the FDA to conduct a clinical trial of a purified neural stem cell product candidate, as well as the first to complete such a clinical trial. We are committed to proving that “groundbreaking science,” especially in the field of stem cell biology, has the potential to create truly “breakthrough medicine.”
Therapeutic Product Development Programs
Overview
The following table summarizes the current status of, and the anticipated initial indications for, our therapeutic product development program. A more detailed discussion of each of these follows the table.
| CNS Program |
Cell-based therapeutics to restore or preserve function to central nervous system tissue by protecting, repairing or replacing dysfunctional or damaged cells. | |
| Diseases and Disorders of the Brain |
Pelizeaus-Merzbacher Disease: | |
| • Four-patient Phase I clinical trial completed February 2012.
• Data from the Phase I trial was published in Science Translational Medicine, a peer-reviewed scientific journal, in October 2012 and showed preliminary evidence of new myelin in all four patients, and three of the four patients showed modest gains in neurological function; the fourth patient remained stable. The data also showed that the HuCNS-SC cells, the transplantation procedure, and the immunosuppression were all well tolerated.
• In August 2013, we presented data which show that, two years after transplantation of our HuCNS-SC cells into patients with PMD, the evidence of myelination, by magnetic resonance imaging (MRI), is more pronounced compared to one year post-transplantation, the gains in neurological function reported after one year were maintained, and there were no safety concerns. The neurological and MRI changes suggest a departure from the natural history of the disease and may represent signals of a clinical effect. | ||
|
• Demonstrated in vivo proof of principle by showing in the myelin deficient shiverer mouse that transplanted HuCNS-SC cells can:
• generate and integrate myelin producing oligodendrocytes into the mouse brain; and
• tightly wrap the mouse nerve axons to form myelin sheath.
Neuronal Ceroid Lipofuscinosis (also known as Batten disease): | ||
| • Six-patient Phase I clinical trial completed in January 2009. Trial results showed that the HuCNS-SC cells, the transplantation procedure, and the immunosuppression were well tolerated and the | ||
4
Table of Contents
| cells were not tumorigenic, and that there was evidence of engraftment and survival of the transplanted cells.
• Demonstrated in vivo proof of principle by showing in a mouse model for infantile NCL that transplanted HuCNS-SC cells can:
• continuously produce the enzyme that is deficient in infantile NCL;
• protect host neurons from death;
• delay the loss of motor function in HuCNS-SC transplanted mice; and
• survive up to six years; five years after stopping immunosuppression. | ||
| Alzheimer’s Disease: | ||
| • In July 2012, reported data that showed our HuCNS-SC cells can restore memory in two mouse models relevant to Alzheimer’s disease.
• Demonstrated that our HuCNS-SC cells are capable of engrafting and surviving in the hostile environment reflective of an Alzheimer’s brain, which characteristically features abnormal accumulations of brain lesions called plaques and tangles. | ||
| Diseases and Disorders of the Spinal Cord |
Spinal Cord Injury: | |
| • Completed enrollment in a Phase I/II clinical trial in multiple sites for chronic spinal cord injury. The trial enrolled 12 patients with thoracic (chest-level) spinal cord injury, and included both complete and incomplete injuries as classified by the American Spinal Injury Association Impairment Scale (AIS). We reported the results from twelve-month data that revealed sustained improvements in sensory function that emerged consistently around three months after transplantation and persisted until the end of the study. The patterns of sensory gains were confirmed to involve multiple sensory pathways and were observed more frequently in the patients with less severe injury; three of the seven AIS A patients and four of the five AIS B patients showed signs of positive sensory gains confirming the previously reported interim results. In addition, two patients progressed during the study from the most severe classification, AIS A, to the lesser degree of injury grade, AIS B. | ||
|
• In October 2014, we initiated our Pathway Study, a Phase II proof of concept clinical trial using our HuCNS-SC cells for the treatment of cervical spinal cord injury (SCI). We transplanted our first subject in this Phase II trial in December 2014 and completed transplanting the six patients comprising the first cohort of this trial in April 2015. The six-month interim results for the first cohort showed an overall pattern of motor improvement in four of the six | ||
5
Table of Contents
| patients as measured by gains in both strength and fine motor skills. In addition, four of the six patients showed improvement in the spinal level of injury as defined by the ISNCSCI assessment of at least one level. Consistent with the prior study, changes in muscle strength and function were observed around three months post-transplant. We commenced enrollment of the second cohort in the Pathway Study in June 2015; and
• Demonstrated in vivo proof of principle by showing in a mouse model for spinal cord injury that transplanted HuCNS-SC cells can:
• restore motor function in injured animals;
• directly contribute to functional recovery (and that when human cells are ablated restored function is lost); and | ||
|
• become specialized oligodendrocytes and neurons. | ||
| Diseases and Disorders of the Eye |
Age-Related Macular Degeneration: | |
| • in June 2012, we initiated a Phase I/II clinical trial designed to evaluate the safety and preliminary efficacy of our HuCNS-SC cells as a treatment for geographic atrophy (GA), the most advanced form of dry AMD.
• In July 2015, we transplanted our first subject in our Radiant™ Study. This Phase II randomized, controlled proof-of-concept study was designed to evaluate both the safety and efficacy of our proprietary HuCNS-SC cells for the treatment of GA. However, in December 2015, we initiated a strategic realignment plan to fully focus our resources on our proprietary HuCNS-SC cells for the treatment of chronic spinal cord injury. A key elements of the plan included the immediate suspension of enrollment into our Phase II Radiant Study in GA-AMD.
• Demonstrated in vivo proof of principle by showing in the Royal College of Surgeons rat, a widely accepted model for retinal degeneration, that HuCNS-SC cells can:
• protect photoreceptor cells from death; and
• prevent or slow loss of vision. | ||
Many neurodegenerative diseases involve the failure of central nervous system tissue (i.e., the brain, spinal cord and eye) due to the loss of functional cells. Our CNS Program is initially focusing on developing clinical applications in which transplanting HuCNS-SC cells would protect or restore organ function of the patient before such function is irreversibly damaged or lost due to disease progression. Our initial target indications are (i) Pelizeaus-Merzbacher Disease, and more generally, diseases in which deficient myelination plays a central role, such as cerebral palsy or multiple sclerosis; (ii) spinal cord injury;, and (iii) disorders in which retinal degeneration plays a central role, such as age-related macular degeneration or retinitis pigmentosa. These disorders affect a significant number of people in the United States and there currently are no effective long-term therapies for them.
Our preclinical research has shown in vivo that HuCNS-SC cells engraft, migrate, differentiate into neurons and glial cells, and survive for as long as one year with no sign of tumor formation or adverse effects. Moreover, the HuCNS-SC cells were still producing progeny cells at the end of the test period. These findings show that our neural stem cells, when transplanted, act like normal neural stem cells, suggesting the possibility of a continual replenishment of normal human neural cells in transplant recipients. In the longer term, then, we believe stem cells have the potential to restore or replace lost cells and cellular function.
6
Table of Contents
Diseases and Disorders of the Brain
Pelizaeus-Merzbacher Disease (PMD).
Pelizaeus-Merzbacher disease, a rare, degenerative, central nervous system disorder, is one of a group of genetic disorders known as leukodystrophies. Leukodystrophies involve abnormal growth of the myelin sheath, which is the fatty substance that surrounds nerve fibers in the brain and spinal cord. PMD is most commonly caused by a genetic mutation that affects an important protein found in myelin, proteolipid protein. PMD is most frequently diagnosed in early childhood and is associated with abnormal eye movements, abnormal muscle function, and in some cases, seizures. The course of the disease is marked by progressive neurological deterioration resulting in premature death.
In February 2012, we completed a Phase I clinical trial in PMD. A total of four patients were transplanted with HuCNS-SC cells and were evaluated periodically over a 12-month period. The study was designed to help detect evidence of new myelin, including by magnetic resonance imaging (MRI) of the brain, changes in neuropsychological tests of development and cognitive function, and clinical changes in neurological function. The trial was conducted at the University of California, San Francisco. In October 2012, we published the results of the trial in Science Translational Medicine, a peer-reviewed journal. The clinical data from this study showed evidence of new myelin in all four patients who were transplanted with HuCNS-SC cells. In addition, three of the four patients showed modest gains in neurological function; the fourth patient remained stable. The data also showed that the cells, the transplantation procedure and the immunosuppression regimen were all well tolerated.
In our preclinical research, we have shown that HuCNS-SC cells differentiate into oligodendrocytes, the myelin producing cells, and produce myelin. We have transplanted HuCNS-SC cells into the brain of the mutant shiverer mouse, which is deficient in myelin, and shown widespread engraftment of human cells that matured into oligodendrocytes, and that the human oligodendrocytes myelinated the mouse axons.
Other Myelin Disorders.
Loss of myelin characterizes conditions such as multiple sclerosis, cerebral palsy and certain genetic disorders (for example, Krabbe’s disease and metachromatic leukodystrophy). Loss of myelin can also play a role in certain spinal cord indications. Based on our preclinical data, we believe our HuCNS-SC product candidate may have applicability to a range of myelin disorders.
Neuronal Ceroid Lipofuscinosis (NCL; also known as Batten disease).
Neuronal ceroid lipofuscinosis, which is often referred to as Batten disease, is a neurodegenerative disease that affects infants and young children. Infantile and late infantile NCL are brought on by inherited genetic mutations which result in either a defective or missing enzyme, leading to the accumulation of cellular waste product in various neuronal cell types. This accumulation eventually interferes with normal cellular and tissue function, and leads to seizures and progressive loss of motor skills, sight and mental capacity. Today, NCL is always fatal.
In January 2009, we completed a six-patient Phase I clinical trial of our HuCNS-SC cells in infantile and late infantile NCL. We believe that this clinical trial was the first FDA-authorized trial to evaluate purified human neural stem cells as a potential therapeutic agent. The trial data demonstrated that the HuCNS-SC cells, the transplantation procedure and the immunosuppression regimen were well tolerated by all six patients, and the patients’ medical, neurological and neuropsychological conditions, following transplantation, appeared consistent with the normal course of the disease. In addition to this favorable safety profile, there was evidence of engraftment and long-term survival of the HuCNS-SC cells. This Phase I trial was conducted at OHSU Doernbecher Children’s Hospital in Oregon.
Our preclinical data demonstrate that HuCNS-SC cells, when transplanted in a mouse model of infantile NCL, engraft, migrate throughout the brain, produce the relevant missing enzyme, measurably reduce the toxic
7
Table of Contents
storage material in the brain, protect host neurons so that more of them survive, and delay the loss of motor function compared to a control group of non-transplanted mice. A summary of this data was published in September 2009 in the peer-reviewed journal Cell Stem Cell. We have also demonstrated in vitro that HuCNS-SC cells produce the enzyme that is deficient in late infantile NCL.
Alzheimer’s Disease.
Alzheimer’s disease is a progressive, fatal neurodegenerative disorder that results in loss of memory and cognitive function. Today, there is no cure or effective treatment option. According to the Alzheimer’s Association, an estimated 5.2 million Americans have Alzheimer’s disease, including nearly 5 million people aged 65 and older. The prevalence of Alzheimer’s disease is expected to increase rapidly as a result of our aging population.
In July 2012, we reported data that showed that our HuCNS-SC cells restored memory and enhanced synaptic function in two animal models relevant to Alzheimer’s disease. This research was a result of a collaboration we entered into with a world renowned leader in Alzheimer’s disease research at the University of California, Irvine (UCI) to study the therapeutic potential of our HuCNS-SC cells in Alzheimer’s disease. Our collaborator’s published research had shown that mouse neural stem cells enhance memory in a mouse model of Alzheimer’s disease, and the goal of the collaboration was to replicate these results using our human neural stem cells.
Previously, we conducted studies of our HuCNS-SC cells in another model of Alzheimer’s disease as part of a collaboration with researchers at the McLaughlin Research Institute. This research, which was funded by a National Institutes of Health (NIH) grant, demonstrated that our HuCNS-SC cells are capable of engrafting and surviving in the hostile environment reflective of an Alzheimer’s brain, which characteristically features abnormal accumulations of brain lesions called plaques and tangles.
In September 2012, the governing board of the California Institute of Regenerative Medicine (CIRM) approved our application for a Disease Team Therapy Development Research Award for the study of HuCNS-SC cells as a potential treatment for Alzheimer’s disease. CIRM would have provided up to approximately $19.3 million as a forgivable loan, in accordance with mutually agreed upon terms and conditions and CIRM regulations. The goal of the research was to have been the filing of an Investigational New Drug application with the U.S. Food and Drug Administration within four years. We have demonstrated that transplantation of our HuCNS-SC cells into the hippocampus, the area of the brain responsible for learning and memory, increases connectivity between the points of contact (synapses) between neurons an important finding given that clinical disability in humans correlates with synapse loss. The observation that our cells increase synapse density in the hippocampus opens the possibility that HuCNS-SC cells may improve neuronal function in human neurodegenerative disorders in general. However, this finding did not translate into a statistically significant improvement in memory as measured by specific behavioral tasks in the animal models, which was a pre-determined criteria for ongoing funding of this pre-clinical program by CIRM. We will continue to assess the data from this study but have wound-down this pre-clinical study funded by CIRM.
Diseases and Disorders of the Spinal Cord
According to a study initiated by the Christopher and Dana Reeve Foundation, an estimated 1.3 million people in the United States are living with chronic spinal cord injury. There are no therapies today that can address the paralysis or loss of function caused by a spinal cord injury, but neural stem cells may have the potential to provide a novel therapeutic approach.
In May 2014, we completed the enrollment and dosing of twelve subjects in a Phase I/II clinical trial of our HuCNS-SC cells for the treatment of thoracic spinal cord injury. The trial was initiated at University Hospital Balgrist in Zurich and was authorized by Swissmedic, the regulatory agency for therapeutic products in Switzerland. A total of twelve patients enrolled in the study, all of whom were three to twelve months post-
8
Table of Contents
injury. The study followed a progressive study design, beginning with patients with complete injuries and then enrolling patients with incomplete injuries, all as classified by the American Spinal Injury Association Impairment Scale (AIS). Of the twelve patients transplanted with our HuCNS-SC cells, seven patients were categorized as having complete injury (AIS A) and five patients were categorized as having an incomplete injury (AIS B). In contrast to AIS A patients who have no mobility or sensory perception below the point of injury, AIS B subjects are less severely injured and, while still paralyzed they retain sensory perception below the point of injury. In addition to assessing safety, the trial evaluated preliminary efficacy using defined clinical endpoints, such as changes in sensation, motor function, and bowel/bladder function. Under this trial, a total of twelve patients, seven patients with complete injury (AIS A) and five patients with an incomplete injury (AIS B), were enrolled and transplanted with our HuCNS-SC cells. .In February 2013, we reported that the first patient cohort, all of whom had complete injuries classified as AIS A, had completed the trial, and that data from this first cohort showed that two of the three patients showed multi-segment gains in sensory function compared to pre-transplant baseline. The gains in sensory function were first observed at the six month assessment and persisted to the 12 month assessment. The third patient remained stable. To accelerate patient enrollment, we expanded the trial from a single-site, single-country study to a multi-site, multi-country program that includes, Switzerland, Canada and the United States. In May 2014, our principal investigator presented an interim update on the Phase I/II trial in spinal cord injury at the Annual Meeting of the American Spinal Injury Association. Interim analysis of clinical data to date has shown that the significant post-transplant gains in sensory function first reported in two patients have now been observed in two additional patients. The presentation included the first data on AIS B subjects to be transplanted in the Phase I/II chronic spinal cord injury trial with our HuCNS-SC cells. Two of the three AIS B patients had significant gains in sensory perception and the third remained stable. We reported the results from twelve-month data that revealed sustained improvements in sensory function that emerged consistently around three months after transplantation and persisted until the end of the study. The patterns of sensory gains were confirmed to involve multiple sensory pathways and were observed more frequently in the patients with less severe injury; three of the seven AIS A patients and four of the five AIS B patients showed signs of positive sensory gains confirming the previously reported interim results. In addition, two patients progressed during the study from the most severe classification, AIS A, to the lesser degree of injury grade, AIS B. The results to-date also continue to confirm the favorable safety profile of the cells and the surgical implant procedure.
In October 2014, we initiated our Pathway™ Study, a Phase II proof of concept clinical trial using our HuCNS-SC cells for the treatment of cervical spinal cord injury (SCI). The Pathway Study is designed to evaluate both the safety and efficacy of transplanting stem cells into patients with traumatic injury to the cervical spinal cord. The trial will be conducted as a randomized, controlled, single-blind study and efficacy will be primarily measured by assessing motor function according to the International Standards for Neurological Classification of Spinal Cord Injury. Patients eligible for the study have complete loss of motor control below the level of injury, the most severe degree of SCI as defined by the American Spinal Injury Association Impairment Scale (AIS). Clinicians used both ISNCSCI (International Standards for Neurological Classification of Spinal Cord Injury) and GRASSP (Graded Assessment of Strength Sensibility and Prehension) measures to establish a pre-transplant baseline for each patient and to assess post-transplant progress. The primary efficacy outcome will focus on change in upper extremity strength as measured in the hands, arms and shoulders. The trial will enroll approximately fifty-two subjects and follow the patients for twelve months post-transplant. The trial has three cohorts; the first cohort is an open-label dose escalation arm involving six patients to determine the cell dose to be used for the second and third cohort of the study; the second cohort will enroll forty patients and forms the single-blinded controlled arm of the Phase II study with the primary efficacy outcome being tested is the change in motor strength of the various muscle groups in the upper extremities innervated by the cervical spinal cord; the third cohort is an optional open label cohort targeted to enroll six patients to assess safety and preliminary efficacy in patients with less severe injuries (AIS C). We transplanted our first subject in this Phase II trial in December 2014 and completed transplanting the six patients comprising the first cohort of this trial in April 2015. The six-month interim results for the first cohort showed motor improvements in both strength and function. Additional highlights of the six-month interim results include – (i) muscle strength was improved in five of the six patients; (ii) four of the five patients with gains in muscle strength also demonstrated improved
9
Table of Contents
performance on functional tasks assessing dexterity and fine motor skills; (iii) four of the six patients had improvement in the spinal level of injury as defined by the ISNCSCI assessment; (iv) three upgraded one level and one upgraded two levels; (v) based on a Patient Global Impression of Change (PGIC) assessment, four of the six patients reported that their condition had improved post-transplant; (vi) changes in muscle strength and function were observed around three months post-transplant, consistent with the onset of sensory improvements seen in the Company’s Phase I/II thoracic study;(vii) no adverse events were attributed to the cells; and (viii) the timing of the transplants ranged from ten to twenty-three months post-injury. We commenced enrollment of the second cohort in the Pathway Study in June 2015.
The results of numerous preclinical studies demonstrate the therapeutic potential of our human neural stem cells for the treatment of spinal cord injury. Using a mouse model of spinal cord injury, our collaborators at the Reeve-Irvine Research Center at the University of California, Irvine have shown that our HuCNS-SC cells have the potential to protect and regenerate damaged nerves and nerve fibers, and that injured mice transplanted with our HuCNS-SC cells showed improved motor function compared to control animals. Inspection of the spinal cords from the treated mice showed significant levels of human neural cells derived from the transplanted stem cells. Some of these cells were oligodendrocytes, the specialized neural cell that forms the myelin sheath around axons, while others had become neurons and showed evidence of synapse formation, a requirement for proper neuronal function. The researchers then selectively ablated the human cells, and found that the functional improvement was lost, thus demonstrating that the human cells had played a direct role in the functional recovery of the transplanted mice. Moreover, our preclinical studies show that our human neural stem cells enable a significant and persistent recovery of motor function when transplanted in spinal cord-injured mice at both sub-acute and chronic injury time points.
Diseases and Disorders of the Eye
The retina is a thin layer of neural cells that lines the back of the eye and is responsible for converting external light into neural signals. A loss of function in retinal cells leads to impairment or loss of vision. The most common forms of retinal degeneration are age-related macular degeneration (AMD) and retinitis pigmentosa. AMD is the leading cause of vision loss and blindness in people over the age of 55 and afflicts some 30 million people worldwide.
In June 2012, we initiated a Phase I/II clinical trial designed to evaluate the safety and preliminary efficacy of sub-retinal transplantation of our HuCNS-SC cells as a treatment for geographic atrophy (GA), the most advanced form of dry AMD. The trial, an open-label, dose-escalation study, was planned to enroll a total of 16 patients. In June 2014, after enrolling fifteen patients and based on positive interim results, we closed enrollment for this study. Multiple safety and efficacy assessments were incorporated into the study, including various assessments of visual function and measurements of disease status by direct retinal examination. The tests in the study included best-corrected visual acuity (BCVA), contrast sensitivity (CS), microperimetry for analysis of visual function, optical coherence tomography (OCT), and fundus autofluorescence (FAF) to measure the extent of the underlying geographic atrophy. The BCVA and CS measurements for the majority of the patients in the study either improved or remained stable in the treated eye. OCT analysis showed increases in central subfield thickness and in macular volume in the treated eye relative to the untreated eye. The prospective analysis of both cohorts in the study showed GA growth rates in the study eye that were lower than those seen in the control eye, consistent with the previously reported interim findings for Cohort I alone which showed for all four subjects of cohort one, a 70% reduction in the rate of GA as compared to the control eye and a 65 percent reduction in the rate of GGA as compared to the expected natural history of the disease following a single dose of our HuCNS-SC cells. However, to further investigate the possible effect of the cells on GA and to inform future clinical development, we subsequently engaged a reading center to perform a separate post-hoc assessment. The separate assessments have revealed greater than anticipated variability in grading of the images. While the prospective analysis for both Cohorts continues to show a decrease in the rate of GA progression in the treated eye for the majority of the patients, the post-hoc analysis did not reveal a similar trend. Further analysis of the collective data is ongoing to determine possible explanations for these findings. Patients will be followed for an additional four years in a separate observational study.
10
Table of Contents
Our preclinical data have shown that our HuCNS-SC cells, when transplanted in a well-established animal model of retinal degeneration, engraft long-term, can protect photoreceptors (the key cells involved in vision) from progressive degeneration, and can slow or prevent loss of visual function. In this model, called the Royal College of Surgeons (RCS) rat, a genetic mutation causes dysfunction of the retinal pigmented cells, which leads to progressive loss of the photoreceptors and ultimately, loss of visual function in the rat. Our preclinical data shows that our human neural stem cells protect both rod and cone photoreceptors in the eye from progressive degeneration and preserve visual function long term. The cone photoreceptors are light sensing cells that are highly concentrated within the macula of the human eye, and the ability to protect these cells suggests a promising approach to treating AMD. A summary of our preclinical data was featured as the cover article in February 2012 edition of the international peer-reviewed European Journal of Neuroscience.
Other CNS Collaborations
We have collaborated on a number of research programs to assess both the in vitro potential of the HuCNS-SC cells and the effects of transplanting HuCNS-SC cells into various preclinical animal models. One such collaboration was with researchers at the Stanford University School of Medicine that evaluated our human neural stem cells in animal models of stroke. The results of these studies demonstrated the targeted migration of the cells toward the stroke lesion and differentiation toward the neuronal lineage. Another study with researchers at Stanford’s School of Medicine demonstrated that HuCNS-SC cells labeled with magnetic nanoparticles could non-invasively track the survival and migration of human cells within the brain. We continue to search for and evaluate promising collaborations to supplement our efforts to develop and commercialize our proprietary human neural platform technology.
Operations
Manufacturing
We have made considerable investments in our manufacturing operations. Our team includes world-recognized experts with proven track records in the development, manufacture and delivery of a range of different cell-based products. For clinical trials, our highly-qualified personnel manufacture cell products in clean room environments within our California licensed facility that are in compliance with current Good Manufacturing Practice (cGMP) and to quality standards that meet U.S. as well as international regulatory requirements. We are currently investing in process development activities to scale the production of our HuCNS-SC cells to meet the requirements of Phase III clinical trials and eventually commercial volumes should we be successful in getting a cell-based product to market. By combining expertise and experience, we believe our expandable and bankable cell products can ultimately be manufactured and distributed at commercial scale as “stem cells in a bottle,” much like an off-the-shelf pharmaceutical product.
Marketing
Because of the early stage of our stem and progenitor cell-based therapeutic product development programs, we have not yet addressed questions of channels of distribution or marketing of potential future products.
Employees
As of December 31, 2015, we had 74 full-time employees, 16 of whom have Ph.D., M.D. or D.V.M. degrees. 62 full-time employees work in research and development and laboratory support services. No employees are covered by collective bargaining agreements. We consider our employee relations in general to be good.
Discontinued operations
As part of our strategy to focus on our clinical operations, in the fourth quarter of 2014 we sold our SC Proven reagent and cell culture business and wound-down our business operations at our Subsidiary Stem Cell Sciences (U.K.) Ltd.’s (SCS UK) in Cambridge, UK. The results of operations from these operations have been
11
Table of Contents
classified as discontinued operations for all periods presented (see Note 19 “Discontinued Operations” in the Notes to Consolidated Financial Statements of Part II, Item 8 of this Form 10-K for further information).
Patents, Proprietary Rights and Licenses
We believe that proprietary protection of our inventions will be important to our future business. We therefore continuously evaluate intellectual property that we believe might be useful in connection with our products, and have an active program of protecting our intellectual property, including patents, copyrights, trademarks, and trade secrets. We may also from time to time seek to acquire licenses to important externally developed technologies.
We have exclusive or non-exclusive rights to a portfolio of patents and patent applications related to various stem and progenitor cells and methods of deriving and using them. These patents and patent applications relate to compositions of matter, methods of obtaining such cells, and methods for preparing, transplanting and utilizing these cells. We also own or have exclusive rights to exploit a number of patents that claim tools and techniques important to cell-based research. A number of these patents were acquired from Stem Cell Sciences Plc (SCS) in April 2009. Additional patents were acquired from NsGene A/S, a Danish company, in February 2013. These patents claim GFAP+ Nestin+ precursor cells capable of differentiating into neurons. Among our significant U.S. patents covering stem and progenitor cells are: (i) U.S. Patent No. 5,968,829, entitled “Human CNS Neural Stem Cells,” which covers our composition of matter for human CNS stem cells; (ii) U.S. Patent No. 7,153,686, entitled “Enriched Central Nervous System Stem Cell and Progenitor Cell Populations, and Methods for Identifying, Isolating and Enriching such Populations,” which claims the composition of matter of various antibody-selected neural stem cell populations; (iii) U.S. Patent No. 6,777,233, entitled “Cultures of Human CNS Neural Stem Cells,” which discloses a neural stem cell culture with a doubling rate faster than days; and (iv) U.S. Patent No. 6,468,794, entitled “Enriched central nervous system stem cell and progenitor cell populations, and methods for identifying, isolating and enriching for such populations,” which covers the identification and purification of the human CNS stem cell.
Because most of our issued patents will expire by 2019, absent the grant of any patent term extension, whether under the Hatch Waxman Act (Pub. L. 98-417) or otherwise, we continue to invest resources into the evaluation and prosecution of other potentially patentable technologies, including a patent family licensed from the University of Edinburgh claiming a highly purified population of human neural stem cells. We intend to file a provisional patent application claiming a novel methodology for producing genetically modified human neural stem cells.
In addition, we also rely upon trade secret protection for our proprietary information and know-how, and we take active measures to control access to this information. We believe that our know-how will also provide a significant competitive advantage.
Our policy is to require our employees, consultants and significant scientific collaborators and sponsored researchers to execute confidentiality agreements upon the commencement of any employment or consulting relationship with us. These agreements generally provide that all confidential information disclosed by us or developed during the course of the individual’s relationship with us is to be kept confidential and not disclosed to third parties except in specific circumstances. In the case of employees and consultants, the agreements generally provide that all inventions conceived by the individual in the course of rendering services to us will be our exclusive property.
Licenses Agreements
Since inception, we have entered into a number of license agreements with academic organizations and commercial entities, including NeuroSpheres, Ltd. (Neurospheres), ReNeuron Ltd. (ReNeuron), Stem Cell Therapeutics Corp. (SCT), genOway SA (genOway), and the University of Edinburgh, to either acquire or
12
Table of Contents
license out intellectual property rights. Under these license agreements, there are typically obligations of due diligence and the requirement to pay royalties on products that use patented technology licensed under these agreements. The license agreements with some of these institutions relate largely to stem or progenitor cells or to processes and methods for the isolation, identification, expansion, or culturing of stem or progenitor cells. Generally speaking, these license agreements will terminate upon expiration, revocation or invalidation of the licensed patents, unless governmental regulations require a shorter term. Typically, the licensee under each of these license agreements can terminate the agreement at any time upon notice. At this time, we do not believe the future success of our research and development efforts depend significantly on any particular license agreement or research collaboration. Nevertheless, we describe the more important license agreements below.
University of Edinburgh
In January 2006, we entered into an exclusive, world-wide license agreement with the University of Edinburgh covering approximately twelve separate patent families in the stem cell field. Since then, the parties added some additional patent families and dropped some patent families which were not considered core to our business activities. Today, the license agreement patent families, including several that cover culture media and research technologies, one that covers purified populations of neural stem cells, some that cover cell reprogramming technologies, and one that covers the manipulation and use of embryonic stem cells for the derivation of research animal models, such as knock-out rats, with one or more missing genes. Under the license agreement, we have the exclusive right to commercialize the technologies in all fields. We have been paying royalties to the University of Edinburgh on the commercial sale of certain SC Proven products, and will pay royalties on all net sales of products covered by any of the intellectual property licensed under this agreement. All of the product-based royalty rates in the license agreement between the Company and the University of Edinburgh are in the single digits and there are no provisions under the University of Edinburgh license agreement for the payment of potential milestones by the Company.
ReNeuron
In July 2005, we entered into an agreement with ReNeuron under which we granted ReNeuron a license that allows ReNeuron to exploit its “c-mycER” conditionally immortalized adult human neural stem cell technology for therapy and other purposes. We received shares of ReNeuron common stock, as well as a cross-license to the exclusive use of ReNeuron’s technology for certain diseases and conditions, including lysosomal storage diseases, spinal cord injury, cerebral palsy, and multiple sclerosis. The agreement also provides for full settlement of any potential claims that either we or ReNeuron might have had against the other in connection with any putative infringement of certain of each party’s patent rights prior to the effective date of the agreement. As part of the agreement, we received in aggregate, approximately 10,097,000 ordinary shares of ReNeuron common stock, net of approximately 122,000 shares that were transferred to NeuroSpheres. Between 2007 and 2011, we sold our entire holdings of shares of ReNeuron common stock for aggregate net proceeds of approximately $3,743,000. As of June 30, 2011, we no longer hold any shares of ReNeuron.
genOway
In October 2008, we entered into a license agreement with genOway, a leading transgenics company located in France, in which we granted a non-exclusive sublicense to genOway for the use of Internal Ribosome Entry Site (IRES) technology. The IRES technology enables the dual expression of a protein of interest and a selectable marker, thereby enabling researchers to genetically modify any mammalian cell and monitor the activity of a particular gene of interest in living cells or tissues without blocking the normal function of the gene. The IRES technology is particularly important for evaluating the success of gene knock-outs or knock-ins in stem cells and for the successful creation of transgenic rodent disease models. The IRES technology has been used to develop hundreds of genetically modified models in the past decade, and the technology is now considered to be the reference technology for transgene expression in some key rodent animal models, such as humanized models, reporter model, and cell trafficking models. The IRES technology is covered by one of the patent families
13
Table of Contents
exclusively licensed to us by the University of Edinburgh, specifically U.S. Patents No. 7,005,299 and 6,150,169 and their foreign counterparts.
In March 2012, we agreed to amend the genOway license agreement to give genOway exclusive worldwide rights, including a right to grant sublicenses, under the IRES patent family in order to commercialize transgenic mice, and provide related services such as the genetic engineering of such mice. Under this exclusive license agreement, as amended, we received a six figure lump sum payment in lieu of annual maintenance fees, and will receive single digit royalties on licensed products and services.
Takara Bio Inc.
In November 2014, we granted fully-paid up, worldwide, field-based licenses to Takara Bio Inc., a Japanese company, under some of our patents in connection with our divestiture of the SC Proven business. From the sale of the SC Proven business, we received $400,000 for certain business intellectual property rights, trademark and records and $400,000 as consideration for the licenses granted. The licenses give Takara the exclusive right to use and sub-license certain technology in order to sell and distribute products to distributors and end-user customers for use in research, including research involving induced pluripotent (iPS), embryonic, and adult stem cells. The licensed patents claim purified populations of human neural stem cells and the use of certain inhibitors to maintain pluripotent cells, among other things.
Other Commercial Licenses
We have approximately thirteen other license agreements with commercial entities, which we entered into in the ordinary course of business to monetize certain of our patents. A number of these include sublicenses to certain patents exclusively licensed to us from either NeuroSpheres or the University of Edinburgh. Some of these are license agreements to commercialize cells. A number of these are license agreements to our research tools patents, such as the IRES and selectable marker technologies described above. We have an on-going licensing program at the Company with the goal of identifying likely infringers of our intellectual property rights in order to generate license revenues.
Scientific Advisory Board
Members of our Scientific Advisory Board provide us with strategic guidance primarily in regard to our therapeutic products research and development programs, as well as assistance in recruiting employees and collaborators. Each Scientific Advisory Board member has entered into a consulting agreement with us. These consulting agreements specify the compensation to be paid and require that all information about our products and technology be kept confidential. All of the Scientific Advisory Board members are employed by employers other than us and may have commitments to, or consulting or advising agreements with, other entities that limit their availability to us. The Scientific Advisory Board members have generally agreed, however, for so long as they serve as consultants to us, not to provide any services to any other entities that would conflict with the services the member provides to us. We are entitled to terminate the arrangements if we determine that there is such a conflict.
The following persons are members of our Scientific Advisory Board:
| • | Irving L. Weissman, M.D., Chairman of our Scientific Advisory Board, is the Virginia and Daniel K. Ludwig Professor of Cancer Research, Professor of Pathology and Professor of Developmental Biology at Stanford University, Director of the Stanford University Institute for Stem Cell Biology and Regenerative Medicine, and Director of the Stanford Ludwig Center for Cancer Stem Cell Research and Medicine, all in Stanford, California. Dr. Weissman’s lab was responsible for the discovery and isolation of the first ever mammalian tissue stem cell, the hematopoietic (blood-forming) stem cell. Dr. Weissman was responsible for the formation of three stem cell companies, SyStemix, Inc., StemCells, Inc. and Cellerant, Inc. Dr. Weissman co-discovered the mammalian and human hematopoietic stem cells and the human neural stem cell. He has extended these stem cell discoveries |
14
Table of Contents
| to cancer and leukemia, discovering the leukemic stem cells in human and mouse acute or blast crisis myeloid leukemias, and has enriched the cancer stem cells in several human brain cancers as well as human head and neck squamous cell carcinoma. Past achievements of Dr. Weissman’s laboratory include identification of the states of development between stem cells and mature blood cells, the discovery and molecular isolation and characterization of lymphocyte and stem cell homing receptors, and identification of the states of thymic lymphocyte development. His laboratory at Stanford has developed accurate mouse models of human leukemias, and has shown the central role of inhibition of programmed cell death in that process. He has also established the evolutionary origins of pre-vertebrate stem cells, and identified and cloned the transplantation genes that prevent their passage from one organism to another. Dr. Weissman has been elected to the National Academy of Science, the Institute of Medicine of the National Academies, the American Academy of Arts and Sciences, the American Society of Microbiology, and several other societies. He has received the Kaiser Award for Excellence in Preclinical Teaching, the Pasarow Foundation Award for Cancer Research, the California Scientist of the Year (2002), the Kovalenko Medal of the National Academy of Sciences, the Elliott Joslin Medal for Diabetes Research, the de Villiers Award for Leukemia Research, the Irvington Award for Immunologist of the Year, the Bass Award of the Society of Neurosurgeons, the New York Academy of Medicine Award for Medical Research, the Alan Cranston Award for Aging Research, the Linus Pauling Award for Biomedical Research, the E. Donnall Thomas Award for Hematology Research, the van Bekkum Award for Stem Cell Research, the Outstanding Investigator Award from the National Institutes of Health, Robert Koch Award for research in the hemopoieteic system, and many other awards. In 2010, Dr. Weissman was appointed as an Honorary Director of the Center for Biotech and BioMedicine and the Shenzhen Key Lab of Gene and Antibody Therapy at the Graduate School of Shenzhen at Tsinghua University. He was also appointed as an Honorary Professor at Peking Union Medical College and an Honorary Investigator at the State Key Laboratory of Experimental Hematology, Institute of Hematology and Blood Disease Hospital at the Chinese Academy of Medical Sciences and Peking Union Medical College. In 2011, Dr. Weissman was elected to the National Academy of Sciences Council. |
| • | David J. Anderson, Ph.D., is Seymour Benzer Professor of Biology, California Institute of Technology, Pasadena, California and Investigator, Howard Hughes Medical Institute. His laboratory was the first to isolate a multipotent, self-renewing, stem cell for the peripheral nervous system, the first to identify instructive signals that promote the differentiation of these stem cells along various lineages, and the first to accomplish a direct purification of peripheral neural stem cells from uncultured tissue. Dr. Anderson’s laboratory also was the first to isolate transcription factors that act as master regulators of neuronal fate. More recently, he has identified signals that tell a neural stem cell to differentiate to oligodendrocytes, the myelinating glia of the central nervous system, as well as factors for astrocyte differentiation. Dr. Anderson is a co-founder of the Company and was a founding member of the scientific advisory board of the International Society for Stem Cell Research. Dr. Anderson also serves on the scientific advisory board of Allen Institute for Brain Science. He has held a presidential Young Investigator Award from the National Science Foundation, a Sloan foundation Fellowship in Neuroscience, and has been Donald D. Matson lecturer at Harvard Medical School. He has received the Charles Judson Herrick Award from the American Association of Anatomy, the 1999 W. Alden Spencer Award in Neurobiology from Columbia University, and the Alexander von Humboldt Foundation Award. Dr. Anderson has been elected to the National Academy of Science and is a member of the American Academy of Arts and Sciences. |
| • | Fred H. Gage, Ph.D., is Professor, Laboratory of Genetics, The Salk Institute for Biological Studies, La Jolla, California and Adjunct Professor, Department of Neurosciences, University of California, San Diego, California. Dr. Gage’s lab was the first to discover Neurogenesis in the adult human brain. His research focus is on the development of strategies to induce recovery of function following central nervous system damage. Dr. Gage is a co-founder of StemCells and of BrainCells, Inc., and a member of the scientific advisory board of each. Dr. Gage also serves on the Scientific Advisory Board of Ceregene, Inc, and he is a founding member of the scientific advisory board of the International |
15
Table of Contents
| Society for Stem Cell Research. Dr. Gage has been the recipient of numerous awards, including the 1993 Charles A. Dana Award for Pioneering Achievements in Health and Education, the Christopher Reeves Medal, the Decade of the Brain Medal, the Max-Planck research Prize, and the Pasarow Foundation Award. Professor Gage is a member of the Institute of Medicine, a member of the National Academy of Science, and a Fellow of the American Academy of Arts and Science. |
Government Regulation
Our research and development activities and the future manufacturing and marketing of our potential therapeutic products are, and will continue to be, subject to regulation for safety and efficacy by numerous governmental authorities in the United States and other countries.
U.S. Regulations
In the United States, pharmaceuticals, biologicals and medical devices are subject to rigorous regulation by the U.S. Food and Drug Administration (FDA). The Federal Food, Drug and Cosmetic Act, the Public Health Service Act, applicable FDA regulations, and other federal and state statutes and regulations govern, among other things, the testing, manufacture, labeling, storage, export, record keeping, approval, marketing, advertising, and promotion of our potential products. Product development and approval within this regulatory framework takes a number of years and involves significant uncertainty combined with the expenditure of substantial resources. In addition, many jurisdictions, both federal and state, have restrictions on the use of fetal tissue.
16
Table of Contents
FDA Marketing Approval
The steps required before our potential therapeutic products may be marketed in the United States include:
| Steps |
Considerations | |
| 1. Preclinical laboratory and animal tests |
Preclinical tests include laboratory evaluation of the cells and the formulation intended for use in humans for quality and consistency. In vivo studies are performed in normal animals and specific disease models to assess the potential safety and efficacy of the cell therapy product. | |
| 2. Submission of an Investigational New Drug (IND) application |
The IND is a regulatory document submitted to the FDA with preclinical and manufacturing data, a proposed development plan and a proposed protocol for a study in humans. The IND becomes effective 30 days following receipt by the FDA, provided there are no questions, requests for delay or objections from the FDA. If the FDA has questions or concerns, it notifies the sponsor, and the IND will then be on clinical hold until the sponsor responds satisfactorily. In general an IND must become effective before U.S. human clinical trials may commence. | |
| 3. Human clinical trials |
Clinical trials involve the evaluation of a potential product under the supervision of a qualified physician, in accordance with a protocol that details the objectives of the study, the parameters to be used to monitor safety and the efficacy criteria to be evaluated. Each protocol is submitted to the FDA as part of the IND. The protocol for each clinical study must be approved by an independent Institutional Review Board (IRB) of the institution at which the study is conducted and the informed consent of all participants must be obtained. The IRB reviews the existing information on the product, considers ethical factors, the safety of human subjects, the potential benefits of the therapy, and the possible liability of the institution. The IRB is responsible for ongoing safety assessment of the subjects during the clinical investigation. | |
| Clinical development is traditionally conducted in three sequential phases, Phase I, II and III. | ||
| Phase I studies for a product are designed to evaluate safety in a small number of subjects in a selected patient population by assessing adverse effects, and may include multiple dose levels. This study may also gather preliminary evidence of a beneficial effect on the disease. | ||
| Phase II studies typically involve a larger, but still limited, patient population to determine biological and clinical effects of the investigational product and to identify possible adverse effects and safety risks of the product in the selected patient population. | ||
17
Table of Contents
| Steps |
Considerations | |
| Phase III studies are undertaken to demonstrate clinical benefit or effect in a statistically significant manner and to test further for safety within a broader patient population, generally at multiple study sites. | ||
| The FDA continually reviews the clinical trial plans and results and may suggest changes or may require discontinuance of any trial at any time if significant safety issues arise. | ||
| 4. Submission of a Biologics Licensing Application (BLA) |
The results of the preclinical studies and clinical studies are submitted to the FDA in an application for marketing approval authorization. | |
| 5. Regulatory Approval |
The testing and approval process will require substantial time, effort and expense. The time for approval is affected by a number of factors, including relative risks and benefits demonstrated in clinical trials, the availability of alternative treatments and the severity of the disease. Additional animal studies or clinical trials may be requested during the FDA review period, which might add to that time. FDA approval of the application(s) is required prior to any commercial sale or shipment of the therapeutic product. Biologic product manufacturing facilities located in certain states also may be subject to separate regulatory and licensing requirements. | |
| 6. Post-marketing studies |
After receiving FDA marketing approval for a product for an initial indication, further clinical trials may be required to gain approval for the use of the product for additional indications. The FDA may also require post-marketing testing and surveillance to monitor for adverse effects, which could involve significant expense, or the FDA may elect to grant only conditional approvals subject to collection of post-marketing data. | |
FDA Manufacturing Requirements
Among the conditions for product licensure is the requirement that the prospective manufacturer’s quality control and manufacturing procedures conform to the FDA’s current good manufacturing practice (GMP) requirements. Even after a product’s licensure approval, its manufacturer must comply with GMP on a continuing basis, and what constitutes GMP may change as the state of the art of manufacturing changes. Domestic manufacturing facilities are subject to regular FDA inspections for GMP compliance, which are normally held at least every two years. Foreign manufacturing facilities are subject to periodic FDA inspections or inspections by the foreign regulatory authorities. Domestic manufacturing facilities may also be subject to inspection by foreign authorities.
Orphan Drug Act
The Orphan Drug Act provides incentives to drug manufacturers to develop and manufacture drugs for the treatment of diseases or conditions that affect fewer than 200,000 individuals in the United States. Orphan drug status can also be sought for treatments for diseases or conditions that affect more than 200,000 individuals in the United States if the sponsor does not realistically anticipate its product becoming profitable from sales in the United States. We may apply for orphan drug status for certain of our therapies. Under the Orphan Drug Act, a
18
Table of Contents
manufacturer of a designated orphan product can seek tax benefits, and the holder of the first FDA approval of a designated orphan product will be granted a seven-year period of marketing exclusivity in the United States for that product for the orphan indication. While the marketing exclusivity of an orphan drug would prevent other sponsors from obtaining approval of the same compound for the same indication, it would not prevent other compounds or products from being approved for the same use including, in some cases, slight variations on the originally designated orphan product.
FDA programs to expedite drug development for serious conditions
We may avail of various FDA programs that are intended to facilitate and expedite development and review of new drugs to address unmet medical need in the treatment of serious or life-threatening conditions.
Breakthrough therapy designation
This program is intended to expedite the development and review of drugs for serious or life-threatening conditions. The criteria for breakthrough therapy designation require preliminary clinical evidence that demonstrates the drug may have substantial improvement on at least one clinically significant endpoint over available therapy. A breakthrough therapy designation conveys all of the fast track program features as well as more intensive FDA guidance on an efficient drug development program.
Fast Track Designation
This program is intended to facilitate the development and expedite the review of drugs to treat serious conditions and fill an unmet medical need. Designation may be granted on the basis of preclinical data. A sponsor of a drug that receives fast track designation will typically have more frequent interactions with FDA during drug development. In addition, products that have been designated as fast track can submit portions of a marketing application before submitting the complete application, known as rolling review.
Accelerated Approval
This program can be used for speeding the development and approval of promising therapies that treat a serious or life-threatening condition and provide meaningful therapeutic benefit over available therapies. Accelerated approval allows approval of a drug that demonstrates an effect on a “surrogate endpoint” that is reasonably likely to predict clinical benefit, or on a clinical endpoint that can be measured earlier than an effect on irreversible morbidity or mortality (IMM) that is reasonably likely to predict an effect on IMM or other clinical benefit. The accelerated approval pathway is most often useful in settings in which the disease course is long and an extended period of time is required to measure the intended clinical benefit of a drug, even if the effect on the surrogate or intermediate clinical endpoint occurs rapidly. Nevertheless, even after the drug enters the market, the sponsor may be required to conduct post-marketing trials to verify and describe the drug’s clinical benefit. If further trials fail to verify the predicted clinical benefit, the FDA may withdraw approval. A drug that has received a breakthrough therapy designation or a fast track designation can be eligible for the accelerated approval pathway, if the relevant criteria are met.
FDA Human Cell and Tissue Regulations
Our research and development is based on the use of human stem and progenitor cells. The FDA has initiated a risk-based approach to regulating Human Cells, Tissues, and Human Cellular and Tissue-based products (HCT/P) and has published current Good Tissue Practice (GTP) regulations. As part of this approach, the FDA has published final rules for registration of establishments that recover, process, store, label, package, or distribute HCT/P or that screen or test the donor of HCT/P, and for the listing of such products. In addition, the FDA has published rules for determining the suitability of donors of cells and tissue, the eligibility of the cells and tissues for clinical use and for current good tissue practice for manufacturers using them. We have adopted policies and procedures to comply with these regulations.
19
Table of Contents
Other Regulations
In addition to safety regulations enforced by the FDA, we are also subject to regulations under the Occupational Safety and Health Act, the Environmental Protection Act, the Toxic Substances Control Act, and other present and potential future foreign, federal, state, and local regulations.
International Law
Outside the United States, we will be subject to regulations that govern the import of drug products from the United States or other manufacturing sites and foreign regulatory requirements governing human clinical trials and marketing approval for our products. The requirements governing the conduct of clinical trials, product licensing, pricing, and reimbursements vary widely from country to country. In particular, the European Union (EU) is revising its regulatory approach to biotechnology products, and representatives from the United States, Japan and the EU are in the process of harmonizing and making more uniform the regulations for the registration of pharmaceutical products in these three markets. This process increases uncertainty over regulatory requirements in our industry. Furthermore, human stem and progenitor cells may be regulated in the EU and other countries as transplant material or as a somatic cell therapy medicinal product, depending on the processing, indication and country.
Environment
We have made, and will continue to make, expenditures for environmental compliance and protection. Expenditures for compliance with environmental laws have not had, and are not expected to have, a material effect on our capital expenditures, results of operations or competitive position.
Reimbursement and Health Care Cost Control
Reimbursement for the costs of treatments and products such as ours from government health administration authorities, private health insurers and others, both in the United States and abroad, is a key element in the success of new health care products. Significant uncertainty often exists as to the reimbursement status of newly approved health care products.
The revenue and profitability of some health care-related companies have been affected by the continuing efforts of governmental and third party payors to contain or reduce the cost of health care through various means. Payors are increasingly attempting to limit both coverage and the levels of reimbursement for new therapeutic products approved for marketing by the FDA, and are refusing, in some cases, to provide any coverage for uses of approved products for disease indications for which the FDA has not granted marketing approval. In certain foreign markets, pricing or profitability of prescription pharmaceuticals is subject to government control. In the United States, there have been a number of federal and state proposals to implement government control over health care costs.
The U.S. Patient Protection and Affordance Care Act and the Health Care and Education Reconciliation Act were signed into law in March 2010. A number of provisions of those laws require further rulemaking action by governmental agencies to implement. The laws change access to health care products and services and create new fees for the pharmaceutical and medical device industries. Future rulemaking could increase rebates, reduce prices or the rate of price increases for health care products and services, or require additional reporting and disclosure. The laws also include new authorization to the FDA to approve companies to market biosimilar products within the United States, although to date FDA rulemaking under this legislation has been limited. We cannot predict the timing or impact of any such future rulemaking on our business.
Competition
In most instances, the targeted indications for our initial products in development have no effective long-term therapies at this time. However, we do expect that our initial products will have to compete with a variety of therapeutic products and procedures. Other pharmaceutical and biotechnology companies currently offer a
20
Table of Contents
number of pharmaceutical products to treat lysosomal storage diseases, neurodegenerative and other diseases for which our technologies may be applicable. Many pharmaceutical and biotechnology companies are investigating new drugs and therapeutic approaches for the same purposes, which may achieve new efficacy profiles, extend the therapeutic window for such products, alter the prognosis of these diseases, or prevent their onset. We believe that our products, when and if successfully developed, will compete with these products principally on the basis of improved and extended efficacy and safety and their overall economic benefit to the health care system. The market for therapeutic products that address degenerative diseases is large and competition is intense. Many companies have significant products approved or in development that could be competitive with our potential products. We expect competition to increase. However, at this time, there are no approved treatments for acute spinal cord injury.
Competition for any stem and progenitor cell products that we may develop may be in the form of existing and new drugs, other forms of cell transplantation, ablative and simulative procedures, medical devices, and gene therapy. We believe that some of our competitors are also trying to develop stem and progenitor cell-based technologies. We may also face competition from companies that have filed patent applications relating to the use of genetically modified cells to treat disease, disorder or injury. In the event our therapies should require the use of such genetically modified cells, we may be required to seek licenses from these competitors in order to commercialize certain of our proposed products, and such licenses may not be granted.
If we develop products that receive regulatory approval, they would then have to compete for market acceptance and market share. For certain of our potential products, an important success factor will be the timing of market introduction of competitive products. This is a function of the relative speed with which we and our competitors can develop products, complete the clinical testing and approval processes, and supply commercial quantities of a product to market. These competitive products may also impact the timing of clinical testing and approval processes by limiting the number of clinical investigators and patients available to test our potential products.
We expect that all of these products will compete with our potential stem and progenitor cell-based products based on efficacy, safety, cost, and intellectual property positions. While we believe that these will be the primary competitive factors, other factors include, in certain instances, obtaining marketing exclusivity under the Orphan Drug Act, availability of supply, manufacturing, marketing and sales expertise and capability, and reimbursement coverage.
Available Information
The following information can be obtained free of charge through our website at http://www.stemcellsinc.com or by sending an e-mail message to irpr@stemcellsinc.com:
| • | our annual report on Form 10-K, quarterly reports on Form 10-Q, current reports on Form 8-K, and all amendments to these reports as soon as reasonably practicable after such material is electronically filed with the Securities and Exchange Commission; |
| • | our policies related to corporate governance, including StemCells’ Code of Conduct and Ethics and Procedure for Submission of Complaints; and |
| • | the charters of the Audit Committee, the Compensation & Stock Option Committee and the Corporate Governance & Nominating Committee of our Board of Directors. |
The public may read and copy any material we file with the SEC at the SEC’s Public Reference Room at 100 F Street, N.E., Washington, DC, 20549. The public may obtain information on the operations of the Public Reference Room by calling the SEC at 1-800-SEC-0330. The SEC maintains an Internet site, http://www.sec.gov, which contains reports, proxy and information statements, and other information regarding issuers that file electronically with the SEC.
21
Table of Contents
| Item 1A. | RISK FACTORS |
This annual report on Form 10-K contains forward-looking statements that involve risks and uncertainties. Our business, operating results, financial performance, and share price may be materially adversely affected by a number of factors, including but not limited to the following risk factors, any one of which could cause actual results to vary materially from anticipated results or from those expressed in any forward-looking statements made by us in this annual report on Form 10-K or in other reports, press releases or other statements issued from time to time. Additional factors that may cause such a difference are set forth elsewhere in this annual report on Form 10-K. Forward-looking statements speak only as of the date of this report. We do not undertake any obligation to publicly update any forward-looking statements.
Risks Related to our Business
Any adverse development relating to our HuCNS-SC product candidate, such as a significant clinical trial failure, could substantially depress our stock price and prevent us from raising additional capital.
At present, our ability to progress as a company is significantly dependent on a single platform technology, our HuCNS-SC cells (purified human neural stem cells), and on early stage clinical trials. Any clinical, regulatory or other development that significantly delays or prevents us from completing any of our trials, any material safety issue or adverse side effect to any study participant in any of these trials, or the failure of these trials to show the results expected would likely depress our stock price significantly and could prevent us from raising the substantial additional capital we will need to further develop our cell technologies. Moreover, any material adverse occurrence in our first clinical trials could substantially impair our ability to initiate additional clinical trials to test our HuCNS-SC cells, whether in other potential indications or otherwise. This, in turn, could adversely impact our ability to raise additional capital and pursue our planned research and development efforts.
We have limited capital resources and we may not obtain the significant additional capital needed to sustain our research and development efforts.
We have limited liquidity and capital resources and must obtain significant additional capital resources in order to sustain our product development efforts, acquire businesses, technologies and intellectual property rights which may be important to our business, continue preclinical and clinical testing of our therapeutic products, pursue regulatory approvals, acquire capital equipment, laboratory and office facilities, establish production capabilities, maintain and enforce our intellectual property portfolio, and support our general and administrative expenses and other working capital requirements. We rely on cash reserves and proceeds from equity and debt offerings, proceeds from the transfer, license, lease, or sale of our intellectual property rights, equipment, facilities, or investments, and government grants and funding from collaborative arrangements, if obtainable, to fund our operations.
We intend to pursue opportunities for additional fundraising in the future through equity or debt financings, corporate alliances or combinations, grants or collaborative research arrangements, sales or dispositions of assets, or any combination of these. However, the source, timing and availability of any future fundraising will depend principally upon market conditions, and, more specifically, on progress in our research, preclinical and clinical development programs. Funding may not be available when needed — at all or on terms acceptable to us. While we actively manage our programs and resources in order to conserve cash between fundraising opportunities, our existing capital resources may not be sufficient to fund our operations beyond the next twelve months. Lack of necessary funds may require us, among other things, to delay, scale back or eliminate some or all of our research and product development programs, planned clinical trials, and/or our capital expenditures or to license our potential products or technologies to third parties. If we exhaust our cash reserves and are unable to realize adequate additional fundraising, we may be unable to meet operating obligations and be required to initiate bankruptcy proceedings or delay, scale back or eliminate some or all of our research and product development programs.
22
Table of Contents
Our product development programs are based on novel technologies and are inherently risky.
We are subject to the risks of failure inherent in the development of products based on new technologies. The novel nature of these therapies creates significant challenges in regard to product development and optimization, manufacturing, government regulation, third party reimbursement, and market acceptance. For example, the pathway to regulatory approval for cell-based therapies, including our therapeutic product candidates, may be more complex and lengthy than the pathway for conventional drugs. These challenges may prevent us from developing and commercializing products on a timely or profitable basis or at all.
Our technologies are at early stages of discovery and development, and we may fail to develop any commercially acceptable or profitable products.
We have incurred significant operating losses and negative cash flows since inception. We have not achieved profitability and may not be able to realize sufficient revenue to achieve or sustain profitability in the future. We have yet to develop any therapeutic products that have been approved for marketing, and we do not expect to become profitable within the next several years, but rather expect to incur additional and increasing operating losses. Before commercializing any therapeutic product, we will need to obtain regulatory approval from the FDA or from equivalent foreign agencies after conducting extensive preclinical studies and clinical trials that demonstrate that the product candidate is safe and effective. Our experience in human clinical trials is limited to the Phase I NCL and Phase I PMD trials we completed, and our currently ongoing clinical programs in spinal cord injury (the completed Phase I/II and the in-progress Phase II) and in dry age-related macular degeneration the completed (Phase I/II and the uncompleted Phase II). We expect that none of our cell-based therapeutic product candidates will be commercially available for several years, if at all.
While regulatory agencies in the United States, Switzerland and Canada have approved the clinical study of our cells in a total of four indications, there can be no assurance that any of our clinical trials will be completed or result in a successful outcome.
We may elect to delay or discontinue studies or clinical trials based on unfavorable results. Any product developed from, or based on, cell technologies may fail to:
| • | survive and persist in the desired location; |
| • | provide the intended therapeutic benefit; |
| • | engraft into existing tissue in the desired manner; or |
| • | achieve therapeutic benefits equal to, or better than, the standard of treatment at the time of testing. |
In addition, our therapeutic products may cause undesirable side effects. Results of preclinical research in animals may not be indicative of future clinical results in humans.
Ultimately, if regulatory authorities do not approve our products or if we fail to maintain regulatory compliance, we would be unable to commercialize our products, and our business and results of operations would be harmed. Even if we do succeed in developing products, we will face many potential obstacles such as the need to develop or obtain manufacturing, marketing and distribution capabilities. Furthermore, because transplantation of cells is a new form of therapy, the marketplace may not accept any products we may develop.
Moreover, because our cell-based therapeutic products will be derived from tissue of individuals other than the patient (that is, they will be “non-self” or “allogeneic” transplant products), patients may require the use of immunosuppressive drugs. While immunosuppression is now standard in connection with allogeneic transplants of various kinds, such as heart or liver transplants, long-term maintenance on immunosuppressive drugs can result in complications such as infection, cancer, cardiovascular disease, and renal dysfunction. An immunosuppression regimen was used with our therapeutic product candidate in all our clinical trials to date.
23
Table of Contents
Delays in the commencement or completion of clinical testing of our current and potential product candidates could result in increased costs to us and delay our ability to generate revenues.
The commencement of clinical trials can be delayed for a variety of reasons, including delays in:
| • | the preclinical studies necessary to demonstrate safety and efficacy in relevant animal models sufficient to obtain regulatory clearance to commence the planned clinical trials; |
| • | the manufacturing activities needed to produce sufficient quantities of the product candidate that meets our quality standards for clinical testing; |
| • | regulatory approval needed to commence the planned clinical trials, including agreement with the FDA or other regulatory body on the clinical protocol and study design; |
| • | reaching agreement with our collaborators, including any contract research organizations (CROs) and the trial sites, on all aspects of the clinical trial; and |
| • | securing the institutional review board approval needed to conduct the clinical trials at the prospective sites. |
Even after commencement, the completion of clinical trials can be delayed or prevented for a number of reasons, such as:
| • | the FDA or similar foreign regulatory authorities may find that our product candidates are not sufficiently safe or effective or may find our cell culturing processes or facilities unsatisfactory; |
| • | our clinical trials may produce negative or inconclusive results or may not meet the level of statistical significance required by the FDA or other regulatory authorities, and we may decide, or regulators may require us, to conduct additional preclinical studies and/or clinical trials or to abandon one or more of our development programs; |
| • | the FDA or similar foreign regulatory authorities may change their approval policies or adopt new regulations; |
| • | we, or regulators, may suspend or terminate our clinical trials because the participating patients are being exposed to unacceptable health risks or undesirable side effects; |
| • | changes in local law, including laws restricting scientific experimentation on products derived from fetal tissue, could prevent continued clinical testing of our HuCNS-SC cells; |
| • | we may experience difficulties in managing multiple clinical sites; |
| • | we may be unable to manufacture or obtain from third party manufacturers sufficient quantities of our product candidates for use in clinical trials; and |
| • | our product candidates may be deemed unsafe or ineffective, or may be perceived as being unsafe or ineffective, by healthcare providers for a particular indication. |
In addition, clinical trials may be delayed due to insufficient patient enrollment, which is a function of many factors, including the size and nature of the relevant patient populations, the nature of the protocols, the proximity of patients to clinical sites, the availability of effective treatments for the relevant diseases, clinical testing alternatives available to patients interested in enrolling in our studies, and the eligibility criteria for our clinical trials. Delays in clinical testing of our product candidate could prevent or delay us from obtaining the additional evidence of clinical efficacy we will need for the approval for our product candidate in any indication.
Acquisitions of companies, businesses or technologies may substantially dilute our stockholders and increase our operating losses.
We may make acquisitions of businesses, technologies or intellectual property rights or otherwise modify our business model in ways we believe to be necessary, useful or complementary to our current business. For example, in April 2009, we acquired substantially all of the operating assets and liabilities of Stem Cell Sciences
24
Table of Contents
Plc (SCS). Any such acquisition or change in business activities may require assimilation of the operations, products or product candidates and personnel of the acquired business and the training and integration of its employees, and could substantially increase our operating costs, without any offsetting increase in revenue. Acquisitions may not provide the intended technological, scientific or business benefits and could disrupt our operations and divert our limited resources and management’s attention from our current operations, which could harm our existing product development efforts. For example, in the fourth quarter of 2014, as part of our strategy to focus on our clinical operations, we sold our SC Proven reagent and cell culture business and wound-down our business operations at our Subsidiary SCS UK in Cambridge, UK. We would likely issue equity securities to pay for any other future acquisitions. The issuance of equity securities for an acquisition could be substantially dilutive to our stockholders. Any investment made in, or funds advanced to, a potential acquisition target could also significantly adversely affect our results of operation and could further reduce our limited capital resources. Any acquisition or action taken in anticipation of a potential acquisition or other change in business activities could substantially depress the price of our stock. In addition, our results of operations may suffer because of acquisition-related costs or the post-acquisition costs of funding the development of an acquired technology or product candidates or operation of the acquired business, or due to amortization or impairment costs for acquired goodwill and other intangible assets. In December 2011, for example, we determined that the intangible in-process research and development (IPR&D) asset related to the assays technology was impaired. In part because of management’s decision to focus on our therapeutic product development programs and not to allocate time and resources to the assays program, we determined that we could not predict the future cash flows from this asset and that the approximately $655,000 carrying value of the asset should be written-off in full. In December 2014, based on our decision to focus all of our efforts on moving our clinical programs forward, we determined we could not predict the future cash flows from the intangible IPR&D asset related to our Transgenic Rat Program and determined that the intangible asset was impaired and wrote off the approximately $530,000 carrying value of the asset. In the fourth quarter of 2015, based on our annual impairment tests, we determined that certain capitalized patent and license costs were impaired and wrote off approximately $239,000.
We may be unable to obtain partners to support our product development efforts when needed to commercialize our technologies.
Equity and debt financings alone may not be sufficient to fund the cost of developing our cell technologies, and we may need to rely on partnering or other arrangements to provide financial support for our product development efforts. In addition, in order to successfully develop and commercialize our technologies, we may need to enter into various arrangements with corporate sponsors, pharmaceutical companies, universities, research groups, and others. As of December 31, 2015, we have no such agreements. While we have engaged, and expect to continue to engage, in discussions regarding such arrangements, we may fail to obtain any such agreement on terms acceptable to us. Even if we enter into such arrangements, we may not be able to satisfy our obligations under them or renew or replace them after their original terms expire. Furthermore, these arrangements may require us to grant rights to third parties, such as exclusive marketing rights to one or more products, may require us to issue securities to our collaborators and may contain other terms that are burdensome to us or result in a decrease in our stock price.
If we are unable to protect our patents and proprietary rights, our business, financial condition and results of operations may be materially harmed.
We either own or exclusively license a number of patents and pending patent applications related to various stem and progenitor cells, including human neural stem cell cultures, as well as methods of deriving and using them. We also own or exclusively license a number of patents and patent applications related to certain mammalian pluripotent and multipotent stem cells, cellular reprogramming, genetic manipulation of stem cells, the creation of genetically engineered animals used for research, technologies that facilitate the identification and isolation of specific stem cell types, and media formulations for the culture of stem cells. The process of obtaining patent protection for products such as those we propose to develop is highly uncertain and involves complex and continually evolving factual, legal and occasionally ethical questions. The governmental authorities that consider patent applications can deny or significantly reduce the patent coverage requested in an application
25
Table of Contents
either before or after issuing the patent and procedures exist in all relevant geographies for third parties to challenge even issued patents. In addition, changes to the laws protecting intellectual property rights could adversely impact the perceived or actual value of our Company. Consequently, we do not know whether any of our pending applications will result in the issuance of patents, whether any of our issued patents will be invalidated or restricted, whether any existing or future patents will provide sufficient protection or significant commercial advantage, or whether others will circumvent or invalidate these patents, whether or not lawfully. In addition, our patents may not afford us adequate protection from competing products. For example, in early 2015, certain of our patents were adjudged invalid by the U.S. district court of Maryland for failure to name all the relevant inventors and this resulted in the dismissal of our patent infringement case against Neuralstem, Inc. Moreover, because patents issue for a limited term, our patents may expire before we can commercialize a product covered by the issued patent claims or before we can utilize the patents profitably.
If we learn of third parties who infringe our patent rights, we may decide to initiate legal proceedings to enforce these rights. However, patent litigation, is inherently unpredictable and highly risky and may result in unanticipated challenges to the validity or enforceability of our intellectual property, antitrust claims or other claims against us, which could result in the loss of these intellectual property rights. Litigation proceedings can be very time-consuming for management and are also very costly and the parties we bring actions against may have significantly greater financial resources than our own. We may not prevail in these proceedings and if we do not prevail we could be liable for damages as well as the costs and attorney fees of our opponents.
Proprietary trade secrets and unpatented know-how are also important to our research and development activities. We cannot be certain that others will not independently develop the same or similar technologies on their own or gain access to our trade secrets or disclose such technology or that we will be able to meaningfully protect our trade secrets and unpatented know-how. We require our employees, consultants and significant scientific collaborators and sponsored researchers to execute confidentiality agreements upon the commencement of an employment or consulting relationship with us. These agreements may, however, fail to provide meaningful protection or adequate remedies for us in the event of unauthorized use, transfer or disclosure of such information or technology.
If we are unable to obtain necessary licenses to third-party patents and other rights, we may not be able to commercially develop our expected products.
A number of pharmaceutical, biotechnology and other companies, universities and research institutions have filed patent applications or have received patents relating to cell therapy, stem and progenitor cells and other technologies potentially relevant to, or necessary for, our expected products. We cannot predict which, if any, of these applications will issue as patents or how many of these issued patents will be found valid and enforceable. There may also be existing issued patents which we are currently unaware of which would be infringed by the commercialization of one or more of our product candidates. If so, we may be prevented from commercializing these products unless the third party is willing to grant a license to us. We may be unable to obtain licenses to the relevant patents at a reasonable cost, if at all, and may also be unable to develop or obtain alternative non-infringing technology. If we are unable to obtain such licenses or develop non-infringing technology at a reasonable cost, our business could be significantly harmed. Also, any infringement lawsuits commenced against us may result in significant costs, divert our management’s attention and result in an award against us for substantial damages, or potentially prevent us from continuing certain operations.
We are aware of intellectual property rights held by third parties that relate to products or technologies we are developing. For example, some aspects of our cell-based therapeutic product candidates involve the use of growth factors, antibodies and other reagents that may, in certain cases, be the subject of third party rights. Before we commercialize any product using these growth factors, antibodies or reagents, we may need to obtain license rights from third parties or use alternative growth factors, antibodies and reagents that are not then the subject of third party patent rights. We currently believe that the commercialization of our products as currently planned will not infringe these third party rights, or, alternatively, that we will be able to obtain necessary licenses or otherwise use alternative non-infringing technology. However, third parties may nonetheless bring
26
Table of Contents
suit against us claiming infringement. If we are unable to prove that our technology does not infringe their patents, or if we are unable to obtain necessary licenses or otherwise use alternative non-infringing technology, we may not be able to commercialize any products.
We have obtained rights from companies, universities and research institutions to technologies, processes and compounds that we believe may be important to the development of our products. These licensors, however, may cancel our licenses or convert them to non-exclusive licenses if we fail to use the relevant technology or otherwise breach these agreements. Loss of these licenses could expose us to the risk that our technology infringes the rights of third parties. We can give no assurance that any of these licenses will provide effective protection against our competitors.
We compete with companies that have significant advantages over us.
The market for therapeutic products to treat diseases of, or injuries to, the central nervous system (CNS) is large and competition is intense. The majority of the products currently on the market or in development are small molecule pharmaceutical compounds, and many pharmaceutical companies have made significant commitments to the CNS field. We believe cellular therapies, if proven safe and effective, will have unique properties that will make them desirable over small molecule drugs, none of which currently replace damaged tissue. However, any cell-based therapeutic to treat diseases of, or injuries to, the CNS is likely to face intense competition from small molecules, biologics, as well as medical devices. We expect to compete with a host of companies, some of which are privately owned and some of which have resources far greater than ours, making them better equipped to license technologies and intellectual property from third parties or to fund research and development, manufacturing and marketing efforts.
Development of our technologies is subject to, and restricted by, extensive government regulation, which could impede our business.
Our research and development efforts, as well as any ongoing or future clinical trials, and the manufacturing and marketing of any products we may develop, will be subject to, and restricted by, extensive regulation by governmental authorities in the United States and other countries. The process of obtaining FDA and other necessary regulatory approvals for human therapeutics is lengthy, expensive and uncertain. FDA and other legal and regulatory requirements applicable to the development and manufacture of the cells required for our preclinical and clinical products could substantially delay or prevent us from producing the cells needed to initiate additional clinical trials. We or our collaborators may fail to obtain the necessary approvals to commence or continue clinical testing or to manufacture or market our potential products in reasonable time frames, if at all. In addition, federal, state and international legislative bodies may enact regulatory reforms or restrictions on the development of new therapies, such as those regulating experimentation on products developed from fetal tissue, which could adversely affect the regulatory environment in which we operate or the development of any products we may develop.
We base our research and development on the use of human stem and progenitor cells obtained from human tissue, including fetal tissue. The U.S. federal and state governments and other jurisdictions impose restrictions on the acquisition and use of fetal tissue, including those incorporated in federal Good Tissue Practice, or GTP, regulations. These regulatory and other constraints could prevent us from obtaining cells and other components of our products in the quantity or quality needed for their development or commercialization of both therapeutic products and certain of our enabling cell technologies. These restrictions change from time to time and may become more onerous. Additionally, we may not be able to identify or develop reliable sources for the cells necessary for our potential products — that is, sources that follow all state and federal laws and guidelines for cell procurement. Certain components used to manufacture our stem and progenitor cell product candidates will need to be manufactured in compliance with the FDA’s Good Manufacturing Practices, or GMP. Accordingly, we will need to enter into supply agreements with companies that manufacture these components to GMP standards.
27
Table of Contents
Noncompliance with applicable requirements both before and after product marketing approval, if any, can subject us, our third party suppliers and manufacturers, and our other collaborators to administrative and judicial sanctions, such as, among other things, warning letters, fines and other monetary payments, recall or seizure of products, criminal proceedings, suspension or withdrawal of regulatory approvals, interruption or cessation of clinical trials, total or partial suspension of production or distribution, injunctions, limitations on or the elimination of claims we can make for our products, and refusal of the government to enter into supply contracts or fund research, or delay in approving or refusal to approve new drug applications.
We are dependent on the services of key personnel.
We are highly dependent on the principal members of our management, operations, and scientific staff, and on some of our outside consultants. Although we have entered into employment agreements with some of these individuals, they may terminate their agreements at any time. In addition, our operations are dependent upon our ability to attract and retain additional qualified scientific and management personnel. We may not be able to attract and retain the personnel we need on acceptable terms given the competition for experienced personnel among pharmaceutical, biotechnology and health care companies, universities and research institutions.
Our activities involve hazardous materials and experimental animal testing; improper handling of these animals and materials by our employees or agents could expose us to significant legal and financial penalties.
Our research and development activities involve the controlled use of test animals as well as hazardous chemicals and potentially hazardous biological materials such as human tissue. Their use subjects us to environmental and safety laws and regulations such as those governing laboratory procedures, exposure to blood-borne pathogens, use of laboratory animals, and the handling of biohazardous materials. Compliance with current or future laws and regulations may be expensive and the cost of compliance could adversely affect us.
Although we believe that our safety procedures for using, handling, storing, and disposing of hazardous and potentially hazardous materials comply with the standards prescribed by applicable state, federal and international law, the risk of accidental contamination or injury from these materials cannot be eliminated. In the event of such an accident or of any violation of these or future laws and regulations, state or federal authorities could curtail our use of these materials; we could be liable for any civil damages that result, the cost of which could be substantial; and we could be subjected to substantial fines or penalties. In addition, any failure by us to control the use, disposal, removal, or storage, or to adequately restrict the discharge, or to assist in the cleanup, of hazardous chemicals or hazardous, infectious or toxic substances could subject us to significant liability. Any such liability could exceed our resources and could have a material adverse effect on our business, financial condition and results of operations. Moreover, an accident could damage our research and manufacturing facilities and operations and result in serious adverse effects on our business.
Natural disasters and violent acts of public protest may cause damage or disruption to us and our employees, facilities, information systems, vendors, suppliers, and customers.
Our operations are concentrated in Northern California. The western United States has experienced a number of earthquakes, wildfires, flooding, landslides, and other natural disasters in recent years. These occurrences could damage or destroy our facilities which may result in interruptions to our business and losses that exceed our insurance coverage. In addition, we conduct certain type of medical research including animal testing and stem cell research that certain individuals are strenuously opposed to. Acts of both legal and illegal public protest, including picketing and bioterrorism, could affect the markets in which we operate and our business operations. Any of these events could cause a decrease in our actual and anticipated revenue, earnings, and cash flows.
28
Table of Contents
The development, manufacturing and commercialization of cell-based therapeutic products expose us to product liability claims, which could lead to substantial liability.
By developing and, ultimately, commercializing therapeutic products, we are exposed to the risk of product liability claims. Product liability claims against us could result in substantial litigation costs and damage awards against us. We have obtained liability insurance that covers our clinical trials, and we will need to increase our insurance coverage if and when we begin commercializing products. We may not be able to obtain insurance on acceptable terms, if at all, and the policy limits on our insurance policies may be insufficient to cover our liability.
The manufacture of cell-based therapeutic products is novel, highly regulated, critical to our business, and dependent upon specialized key materials.
The manufacture of cell-based and related products is complicated and difficult, dependent upon substantial know-how and subject to the need for continual process improvements to be competitive. Our manufacturing experience is limited and the technologies are comparatively new. In addition, our ability to scale-up manufacturing to satisfy the various requirements of our planned clinical trials, such as GTP, GMP and release testing requirements, is uncertain. Manufacturing disruptions may occur and despite efforts to regulate and control all aspects of manufacturing, the potential for human or system failure remains. Manufacturing irregularities or lapses in quality control could have a serious adverse effect on our reputation and business, which could cause a significant loss of stockholder value. Many of the materials that we use to prepare our cell-based and related products are highly specialized, complex and available from only a limited number of suppliers or derived from a biological origin. At present, some of our material requirements are single sourced, and the loss of one or more of these sources may adversely affect our business if we are unable to obtain alternatives or alternative sources at all or upon terms that are acceptable to us.
Because health care insurers and other organizations may not pay for our products or may impose limits on reimbursements, our ability to become profitable could be adversely affected.
In both domestic and foreign markets, sales of potential therapeutic products are likely to depend in part upon the availability and amounts of reimbursement from third-party health care payor organizations, including government agencies, private health care insurers and other health care payors, such as health maintenance organizations and self-insured employee plans. There is considerable pressure to reduce the cost of therapeutic products. Government and other third party payors are increasingly attempting to contain health care costs by limiting both coverage and the level of reimbursement for new therapeutic products and by refusing, in some cases, to provide any coverage for uses of approved products for disease indications for which the FDA or other relevant authority has not granted marketing approval. Moreover, in some cases, government and other third party payors have refused to provide reimbursement for uses of approved products for disease indications for which the FDA or other relevant authority has granted marketing approval. Significant uncertainty exists as to the reimbursement status of newly approved health care products or novel therapies such as ours. Even if we obtain regulatory approval to market our products, we can give no assurance that reimbursement will be provided by such payors at all or without substantial delay or, if such reimbursement is provided, that the approved reimbursement amounts will be sufficient to enable us to sell products we develop on a profitable basis. Changes in reimbursement policies could also adversely affect the willingness of pharmaceutical companies to collaborate with us on the development of our cellular technologies. In certain foreign markets, pricing or profitability of prescription pharmaceuticals is subject to government control. We also expect that there will continue to be a number of federal and state proposals to implement government control over health care costs. Efforts to change regulatory and reimbursement standards are likely to continue in future legislative sessions. We do not know what legislative proposals federal or state governments will adopt or what actions federal, state or private payors for health care goods and services may take in response to such proposals or legislation. We cannot predict the effect of government control and health care reimbursement practices on our business.
29
Table of Contents
Ethical and other concerns surrounding the use of stem or progenitor-based cell therapy may negatively affect regulatory approval or public perception of our product candidates, which could reduce demand for our products or depress our stock price.
The use of stem cells for research and therapy has been the subject of considerable public debate, with many people voicing ethical, legal and social concerns. Negative public attitudes toward stem cell therapy could result in greater governmental regulation of stem cell therapies, which could harm our business. The use of these cells could give rise to ethical and social commentary adverse to us, which could harm the market price of our common stock. Additional government-imposed restrictions on the use of embryos or human stem cells in research and development could also cause an adverse effect on us by harming our ability to establish important partnerships or collaborations, delaying or preventing the development of certain products, including delays in clinical enrollment and testing, and causing a decrease in the price of our stock or by otherwise making it more difficult for us to raise additional capital. For example, concerns regarding such possible regulation could impact our ability to attract collaborators, investors and clinical investigators. Also, existing regulatory constraints on the use of embryonic stem cells may in the future be extended to use of fetal stem cells, and these constraints might prohibit or restrict us from conducting research or from commercializing products. Similarly, concerns and moral objections to embryonic and fetal-tissue derived technologies could delay or prevent us from patenting or enforcing our patents in certain geographies. Also, existing and potential government regulation of embryonic tissue may lead researchers to leave the field of stem cell research or the country altogether, in order to assure that their careers will not be impeded by restrictions on their work. Similarly, these factors may induce graduate students to choose other fields less vulnerable to changes in regulatory oversight, thus exacerbating the risk that we may not be able to attract and retain the scientific personnel we need in face of the competition among pharmaceutical, biotechnology and health care companies, universities and research institutions for what may become a shrinking class of qualified individuals.
Our corporate documents and Delaware law contain provisions that could make it difficult for us to be acquired in a transaction that might be beneficial to our stockholders.
Our board of directors has the authority to issue shares of preferred stock and to fix the rights, preferences, privileges, and restrictions of these shares without stockholder approval. These provisions in our corporate documents, along with certain provisions under Delaware law, may make it more difficult for a third party to acquire us or discourage a third party from attempting to acquire us, even if the acquisition might be beneficial to our stockholders.
Risks Related to Our Stock
Our stock price has been, and will likely continue to be, highly volatile, which may negatively affect our ability to obtain additional financing in the future.
The market price per share of our common stock has been and is likely to continue to be highly volatile due to the risks and uncertainties described in this section of this Annual Report on Form 10-K, as well as other factors, including:
| • | our ability to develop and test our technologies; |
| • | our ability to patent or obtain licenses to necessary technologies; |
| • | conditions and publicity regarding the industry in which we operate, as well as the specific areas our product candidates seek to address; |
| • | competition in our industry; |
| • | economic and other external factors or other disasters or crises; |
| • | price and volume fluctuations in the stock market at large that are unrelated to our operating performance; and |
| • | comments by securities analysts, or our failure to meet market expectations. |
30
Table of Contents
Over the two-year period ended December 31, 2015, the trading price of our common stock as reported on NASDAQ Stock Market (NASDAQ) ranged from a high of $2.43 to a low of $0.31 per share. As a result of this volatility, an investment in our stock is subject to substantial risk. Furthermore, the volatility of our stock price could negatively impact our ability to raise capital or acquire businesses or technologies.
Our stock could be delisted from the NASDAQ Capital Market, which could affect our stock’s market price and liquidity.
Our listing on the NASDAQ Capital Market is contingent upon meeting all the continued listing requirements of the NASDAQ Capital Market which include maintaining a minimum bid price of not less than $1.00 per share and a minimum of $2.5 million in stockholders’ equity. NASDAQ Listing Rule 5810(c)(3)(A) provides that a failure to meet the minimum bid price requirement exists if the deficiency continues for a period of 30 consecutive business days.
On May 14, 2015, we received written notice from NASDAQ that the closing bid price for our common stock had been below $1.00 per share for the previous 30 consecutive business days, and that we were therefore not in compliance with the requirements for continued inclusion on the NASDAQ Capital Market under NASDAQ Listing Rule 5550(a)(2). In accordance with NASDAQ Listing Rule 5810(c)(3)(A), we had 180 calendar days, or until November 10, 2015, to regain compliance with the minimum bid price requirement. To regain compliance with the $1 minimum bid listing requirement of the NASDAQ Capital Market, the closing bid price per share of our common stock would have to be $1.00 or higher for a minimum of ten consecutive business days during this initial 180-day compliance period.
On November 11, 2015, we were notified by NASDAQ that we had not regained compliance with the minimum $1 bid price per share requirement. However, NASDAQ determined that we were nevertheless eligible under NASDAQ Listing Rule 5810(c)(3)(A) for an additional 180 calendar day period, or until May 9, 2016, to regain compliance. This second 180 day period relates exclusively to the bid price deficiency. Our common stock may be delisted during the 180 days for failure to maintain compliance with any other listing requirements which occurs during this period, such as NASDAQ’s stockholders’ equity requirements. For example, our price per share and stockholders’ equity at December 31, 2015 was $0.42 and $(334,000), respectively. If compliance cannot be demonstrated by May 9, 2016, NASDAQ will provide written notification that our common stock will be delisted. At that time, we may appeal NASDAQ’s determination to a Hearings Panel. We will be asked to provide a plan to regain compliance to the Hearings Panel. Historically, the Hearings Panel has generally viewed a near-term reverse stock split as the only definitive plan acceptable to resolve a bid price deficiency. There can be no assurance that we will be able to regain compliance with the minimum bid price requirement or will otherwise be in compliance with other NASDAQ listing criteria.
If our common stock is delisted from the NASDAQ Capital Market, our ability to raise capital in the future may be limited. Delisting could also result in less liquidity for our stockholders and a lower stock price.
We are contractually obligated to issue shares in the future, diluting the interest of current stockholders.
As of December 31, 2015, there were outstanding warrants to purchase 44,277,849 shares of our common stock, at a weighted average exercise price of $0.94 per share, outstanding options to purchase 2,079,129 shares of our common stock, at a weighted average exercise price of $2.89 per share, and outstanding restricted stock units for 8,442,519 shares of our common stock. We expect to issue additional options and restricted stock units to purchase shares of our common stock to compensate employees, consultants and directors, and may issue additional shares to raise capital, to acquire other companies or technologies, to pay for services, or for other corporate purposes. Any such issuances will have the effect of diluting the interest of current stockholders.
31
Table of Contents
| Item 1B. | UNRESOLVED STAFF COMMENTS |
None
| Item 2. | PROPERTIES |
In December 2010, we entered into a commercial lease agreement with BMR-Gateway Boulevard LLC (BMR), as landlord, for approximately 43,000 square feet of office and research space at BMR’s Pacific Research Center in Newark, California. The initial term of the lease is approximately eleven and one-half years. We will pay approximately $17,869,000 in aggregate as rent over the term of the lease to BMR. As part of the lease, BMR agreed to provide various financial allowances so that we can build initial and future laboratories, offices and other improvements, subject to customary terms and conditions relating to landlord-funded tenant improvements.
In March 2013, we entered into a commercial lease agreement with Prologis, L.P. (Prologis), as landlord, for office and research space in Sunnyvale, California. The facility is for operations that support our clinical development activities. The initial term of the lease is ten years and includes escalating rent payments which we recognize as lease operating expense on a straight-line basis. We will pay approximately $3,497,000 in aggregate rent over the term of the lease. As part of the lease, Prologis has agreed to provide us financial allowances to build initial tenant improvements, subject to customary terms and conditions relating to landlord-funded tenant improvements.
We believe our leased physical properties are suitable and adequate for our current and planned operations at this time.
| Item 3. | LEGAL PROCEEDINGS |
We know of no material, existing or pending legal proceedings against our company, nor are we involved as a plaintiff in any material proceeding or pending litigation.
| Item 4. | MINE SAFETY DISCLOSURES |
Not applicable.
32
Table of Contents
PART II
| Item 5. | MARKET FOR REGISTRANT’S COMMON EQUITY, RELATED SHAREHOLDER MATTERS AND ISSUER PURCHASES OF EQUITY SECURITIES |
Market price and dividend information
Our stock is traded on the NASDAQ Capital Market under the symbol STEM. The quarterly ranges of high and low bid prices per share for the last two fiscal years as reported by NASDAQ are shown below:
| High | Low | |||||||
| 2015 |
||||||||
| First Quarter |
$ | 1.39 | $ | 0.93 | ||||
| Second Quarter |
$ | 1.05 | $ | 0.49 | ||||
| Third Quarter |
$ | 0.62 | $ | 0.31 | ||||
| Fourth Quarter |
$ | 0.63 | $ | 0.39 | ||||
| 2014 |
||||||||
| First Quarter |
$ | 1.67 | $ | 1.21 | ||||
| Second Quarter |
$ | 2.33 | $ | 1.15 | ||||
| Third Quarter |
$ | 2.42 | $ | 1.23 | ||||
| Fourth Quarter |
$ | 1.28 | $ | 0.83 | ||||
No cash dividends have been declared on our common stock since our inception.
PERFORMANCE GRAPH
We show below the cumulative total return to our stockholders during the period from December 31, 2010 through December 31, 2015(1) in comparison to the cumulative return on the Standard & Poor’s 500 Index and the Amex Biotechnology Index during that same period.
The stock price performance shown on the graph below is not necessarily indicative of future stock price performance.
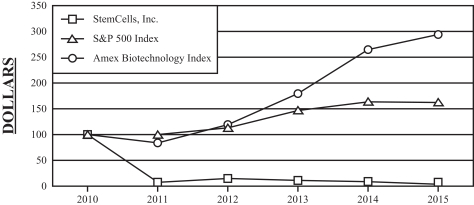
| December 31, 2010 |
December 31, 2011 |
December 31, 2012 |
December 31, 2013 |
December 31, 2014 |
December 31, 2015 |
|||||||||||||||||||
| StemCells, Inc. |
$ | 100.00 | $ | 7.59 | $ | 15.09 | $ | 11.39 | $ | 8.70 | $ | 3.89 | ||||||||||||
| S&P 500 Index |
$ | 100.00 | $ | 100.00 | $ | 113.40 | $ | 146.97 | $ | 163.71 | $ | 162.52 | ||||||||||||
| Amex Biotechnology Index |
$ | 100.00 | $ | 84.11 | $ | 119.22 | $ | 179.59 | $ | 265.03 | $ | 293.92 | ||||||||||||
| (1) | Cumulative total returns assume a hypothetical investment of $100 on December 31, 2010. |
33
Table of Contents
The information under “Performance Graph” is not deemed filed with the Securities and Exchange Commission and is not to be incorporated by reference in any Company filing under the Securities Act of 1933, as amended, or the Securities Exchange Act of 1934, as amended, whether made before or after the date of this 10-K and irrespective of any general incorporation language in those filings.
Approximate Number of Holders of Common Stock
As of March 1, 2016, there were approximately 256 holders of record of our common stock and the closing price of our common stock on the NASDAQ Capital Market was $0.40 per share.
The number of record holders is based upon the actual number of holders registered on the books of our transfer agent at such date and does not include holders of shares in “street names” or persons, partnerships, associations, corporations, or other entities identified in security position listings maintained by depository trust companies.
Recent Sales of Unregistered Securities (last three years ending December 31, 2015)
We did not issue unregistered securities in 2014 and 2015.
In October, 2013, we acquired from NeuroSpheres a patent portfolio we had licensed on an exclusive worldwide basis, including the six patents that were the subject of our patent infringement litigation against Neuralstem, Inc. As consideration for the patents, we issued 139,548 shares of unregistered common stock to NeuroSpheres. In connection with the patent acquisition, all preexisting agreements were terminated. The acquisition relieved us from further milestone and royalty payments to NeuroSpheres.
Equity Compensation Plan Information
The following table provides certain information with respect to all of our equity compensation plans in effect as of December 31, 2015.
| Equity Compensation Plan Information | ||||||||||||
| Plan Category |
Number of Securities to be Issued upon Exercise of Outstanding Stock Options, Warrants and Rights (a) |
Weighted-Average Exercise Price of Outstanding Stock Options, Warrants and Rights (b) |
Number of Securities Remaining Available for Future Issuance Under Equity Compensation Plans (Excluding Securities Reflected in Column(a)) (c) |
|||||||||
| Equity compensation plans approved by security holders(1) |
8,871,647 | $ | 0.67 | 5,182,236 | ||||||||
| Equity compensation plans not approved by security holders(2) |
1,650,000 | 0.02 | 1,025,635 | |||||||||
|
|
|
|
|
|
|
|||||||
| 10,521,647 | $ | 0.57 | 6,207,871 | |||||||||
|
|
|
|
|
|
|
|||||||
| (1) | Consists of stock options and restricted stock units issued to employees and directors and stock options issued as compensation to consultants for consultation services. These stock options and restricted stock units were issued under our 2004, 2006 and 2013 Equity Incentive Plans. |
| (2) | In 2012, we adopted by board action the 2012 Commencement Incentive Plan in accordance with NASDAQ Listing Rule 5635(c)(4) concerning inducement grants to new employees. Outstanding awards are restricted stock units. |
34
Table of Contents
| Item 6. | SELECTED FINANCIAL DATA |
The following selected financial and operating data are derived from our audited consolidated financial statements which has been adjusted to reflect discontinued operations for all periods presented. The selected financial and operating data should be read in conjunction with “Item 7. Management’s Discussion and Analysis of Financial Condition and Results of Operation” and the consolidated financial statements and notes thereto contained elsewhere in this Form 10-K.
| Year Ended December 31, | ||||||||||||||||||||
| 2015 | 2014 | 2013 | 2012 | 2011 | ||||||||||||||||
| (In thousands, except per share amounts) | ||||||||||||||||||||
| Consolidated Statements of Operations: |
||||||||||||||||||||
| Revenue from licensing agreements and grants |
$ | 117 | $ | 1,012 | $ | 172 | $ | 490 | $ | 558 | ||||||||||
| Research and development expenses |
27,111 | 21,503 | 19,369 | 14,682 | 18,402 | |||||||||||||||
| General and administrative expenses |
9,334 | 10,420 | 8,834 | 7,360 | 8,143 | |||||||||||||||
| Wind-down expenses(1) |
392 | — | 62 | 356 | 287 | |||||||||||||||
| Impairment of intangible asset |
239 | 2,440 | — | — | 655 | |||||||||||||||
| Gain (loss) on change in fair value of warrant liabilities(2) |
914 | 2,422 | 3,253 | (5,945 | ) | 6,612 | ||||||||||||||
| Net loss from continuing operations |
(36,415 | ) | (32,261 | ) | (25,987 | ) | (27,971 | ) | (20,183 | ) | ||||||||||
| Discontinued Operations:(3) |
||||||||||||||||||||
| Net loss from discontinued operations |
— | (369 | ) | (452 | ) | (520 | ) | (1,146 | ) | |||||||||||
| Net loss from disposal of assets |
— | (111 | ) | — | — | — | ||||||||||||||
| Basic and diluted loss per share: |
||||||||||||||||||||
| From continuing operations |
$ | (0.38 | ) | $ | (0.52 | ) | $ | (0.60 | ) | $ | (0.97 | ) | $ | (1.42 | ) | |||||
| From discontinued operations |
— | $ | (0.01 | ) | $ | (0.01 | ) | $ | (0.02 | ) | $ | (0.08 | ) | |||||||
| Shares used in computing basic and diluted loss per share amounts |
95,807 | 61,613 | 43,422 | 28,824 | 14,188 | |||||||||||||||
| December 31, | ||||||||||||||||||||
| 2015 | 2014 | 2013 | 2012 | 2011 | ||||||||||||||||
| (In thousands) | ||||||||||||||||||||
| Consolidated Balance Sheets |
||||||||||||||||||||
| Cash and cash equivalents |
$ | 12,111 | $ | 24,988 | $ | 30,585 | $ | 8,471 | $ | 13,311 | ||||||||||
| Restricted cash(4) |
2,422 | — | — | — | — | |||||||||||||||
| Marketable securities |
— | — | — | 13,901 | 3,281 | |||||||||||||||
| Total assets |
21,219 | 32,427 | 41,557 | 30,170 | 25,205 | |||||||||||||||
| Accrued wind-down expenses(1) |
392 | — | — | 1,103 | 2,135 | |||||||||||||||
| Fair value of warrant liabilities(2) |
771 | 1,685 | 5,542 | 9,265 | 6,042 | |||||||||||||||
| Long-term debt, including capital leases(5) |
10,370 | 10,343 | 9,274 | 138 | 331 | |||||||||||||||
| Stockholders’ equity |
(334 | ) | 5,871 | 14,954 | 13,985 | 10,725 | ||||||||||||||
| (1) | For 2015 relates to restructuring costs under our strategic realignment plan. See Note 10 “Restructuring Costs” in the Notes to Consolidated Financial Statements of Part II, Item 8 of this Form 10-K for further information. For 2013, 2012 and 2011, relates to wind-down and exit expenses in respect of our Rhode Island facility. (2) See Note 5 “Intangible assets” in the Notes to Consolidated Financial Statements of Part II, Item 8 of this Form 10-K for further information. |
| (2) | Relates to the fair value of warrants issued as part of our financing in December 2011. See Note 13 “Warrant Liability” in the Notes to Consolidated Financial Statements of Part II, Item 8 of this Form 10-K for further information. |
| (3) | In December 2014, we sold and completed the wind down of our subsidiary SCS UK’s operations in Cambridge, UK and therefore, have classified the historical results of this component as a discontinued operation. See Note 19 “Discontinued Operations” in the Notes to Consolidated Financial Statements of Part II, Item 8 of this Form 10-K for further information. |
| (4) | Relates to our loan payable with Silicon Valley Bank. See Note 14 “Loan Payable” in the Notes to Consolidated Financial Statements of Part II, Item 8 of this Form 10-K for further information. |
| (5) | Data for 2015, 2014 and 2013 relates to the loan agreements with Silicon Valley Bank and the California Institute for Regenerative Medicine. See Note 14 “Loan Payable” in the Notes to Consolidated Financial Statements of Part II, Item 8 of this Form 10-K for further information. |
35
Table of Contents
| Item 7. | MANAGEMENT’S DISCUSSION AND ANALYSIS OF FINANCIAL CONDITION AND RESULTS OF OPERATIONS |
This report contains forward looking statements that involve substantial risks and uncertainties. Such statements include, without limitation, all statements as to expectation or belief and statements as to our future results of operations; the progress of our research, product development and clinical programs; the need for, and timing of, additional capital and capital expenditures; partnering prospects; costs of manufacture of products; the protection of, and the need for, additional intellectual property rights; effects of regulations; the need for additional facilities; and potential market opportunities. Our actual results may vary materially from those contained in such forward-looking statements because of risks to which we are subject, including the fact that additional trials will be required to confirm the safety and demonstrate the efficacy of our HuCNS-SC cells for the treatment of any disease or disorder; uncertainty as to whether the U.S. Food and Drug Administration (FDA) or other regulatory authorities will permit us to proceed with clinical testing of proposed products despite the novel and unproven nature of our technologies; the risk that our clinical trials or studies could be substantially delayed beyond their expected dates or cause us to incur substantial unanticipated costs; uncertainties in our ability to obtain the capital resources needed to continue our current research and development operations and to conduct the research, preclinical development and clinical trials necessary for regulatory approvals; the uncertainty regarding our ability to obtain a corporate partner or partners, if needed, to support the development and commercialization of our potential cell-based therapeutics products; the uncertainty regarding the outcome of our clinical trials or studies we may conduct in the future; the uncertainty regarding the validity and enforceability of our issued patents; the risk that we may not be able to manufacture additional master and working cell banks when needed; the uncertainty whether any products that may be generated in our cell-based therapeutics programs will prove clinically safe and effective; the uncertainty whether we will achieve significant revenue from product sales or become profitable; obsolescence of our technologies; competition from third parties; intellectual property rights of third parties; litigation risks; and other risks to which we are subject. Forward-looking statements speak only as of the date of this report. We do not undertake any obligation to publicly update any forward-looking statements. All forward-looking statements attributable to us or to persons acting on our behalf are expressly qualified in their entirety by the cautionary statements and risk factors set forth in “Risk Factors” in Part I, Item 1A of this Form 10-K.
Overview
The Company
We are engaged in researching, developing, and commercializing cell-based therapeutics. Our research and development (R&D) programs are primarily focused on identifying and developing potential cell-based therapeutics which can either restore or support organ function. In particular, since we relocated our operations to California in 1999, our R&D efforts have been directed at refining our methods for identifying, isolating, culturing, and purifying the human neural stem cell and developing this cell as potential cell-based therapeutics for the central nervous system (CNS). Our HuCNS-SC® cells (purified human neural stem cells) are currently in clinical development for several indications, with a primary focus on chronic spinal cord injury.
We completed our Phase I/II clinical trial for the treatment of chronic spinal cord injury, which represents the first time that neural stem cells have been transplanted as a potential therapeutic agent for spinal cord injury. The Phase I/II trial evaluated both safety and preliminary efficacy of our proprietary HuCNS-SC human neural stem cells as a treatment for chronic thoracic spinal cord injury. To accelerate patient enrollment, we expanded this trial from a single-site, single-country study to a multi-site, multi-country program. Under this trial, a total of twelve patients that included both complete and incomplete injuries as classified by the American Spinal Injury Association Impairment Scale (AIS) were enrolled and transplanted with our HuCNS-SC cells; seven patients with complete injury (AIS A) and five patients with an incomplete injury (AIS B).We reported the results from twelve-month data that revealed sustained improvements in sensory function that emerged consistently around three months after transplantation and persisted until the end of the study. The patterns of sensory gains were confirmed to involve multiple sensory pathways and were observed more frequently in the patients with less severe injury; three of the seven AIS A patients and four of the five AIS B patients showed signs of positive
36
Table of Contents
sensory gains confirming the previously reported interim results. In addition, two patients progressed during the study from the most severe classification, AIS A, to the lesser degree of injury grade, AIS B.
In October 2014, we initiated a Phase II proof of concept clinical trial to further investigate our HuCNS-SC cells as a treatment for spinal cord injury. The Phase II Pathway™ Study, is the first clinical trial designed to evaluate both the safety and efficacy of transplanting human neural stem cells into patients with cervical spinal cord injury. Traumatic injuries to the cervical (neck) region of the spinal cord, also known as tetraplegia or quadriplegia, impair sensation and motor function of the hands, arms, legs, and trunk. The trial will be conducted as a randomized, controlled, single-blind study and efficacy will be primarily measured by assessing motor function according to the International Standards for Neurological Classification of Spinal Cord Injury (ISNCSCI). The primary efficacy outcome will focus on change in upper extremity strength as measured in the hands, arms, and shoulders. The trial will follow the participants for one year and will enroll up to fifty-two subjects. The trial has three cohorts; the first cohort is an open-label dose escalation arm involving six patients to determine the cell dose to be used for the second and third cohort of the study; the second cohort will enroll forty patients and forms the single-blinded controlled arm of the Phase II study with the primary efficacy outcome being tested is the change in motor strength of the various muscle groups in the upper extremities innervated by the cervical spinal cord; the third cohort is an optional open label cohort targeted to enroll six patients to assess safety and preliminary efficacy in patients with less severe injuries (AIS C). We transplanted our first subject in this Phase II trial in December 2014 and completed transplanting the six patients comprising the first cohort of this trial in April 2015. The six-month interim results for the first cohort showed an overall pattern of motor improvement in four of the six patients as measured by gains in both strength and fine motor skills. In addition, four of the six patients showed improvement in the spinal level of injury as defined by the ISNCSCI assessment of at least one level. Consistent with the prior study, changes in muscle strength and function were observed around three months post-transplant. We commenced enrollment of the second cohort in the Pathway Study in June 2015.
We conducted a Phase I/II clinical trial in dry AMD at five trial sites in the United States, and in June 2014, based on positive interim results, we closed enrollment for this trial in order to focus our efforts on initiating a follow-on Phase II randomized, controlled proof-of-concept study in 2015. The phase I/II trial was designed to evaluate the safety and preliminary efficacy of sub-retinal HuCNS-SC cell transplantation in geographic atrophy (GA), the most advanced form of dry AMD. Multiple safety and efficacy assessments were incorporated into the study, including various assessments of visual function and measurements of disease status by direct retinal examination. The tests in the study included best-corrected visual acuity (BCVA), contrast sensitivity (CS), microperimetry for analysis of visual function, optical coherence tomography (OCT), and fundus autofluorescence (FAF) to measure the extent of the underlying geographic atrophy. Initial assessment of data from the Phase I/II trial indicate that the BCVA and CS measurements for the majority of the patients in the study either improved or remained stable in the treated eye. OCT analysis showed increases in central subfield thickness and in macular volume in the treated eye relative to the untreated eye. For those patients enrolled in the study with lesions sizes consistent with the eligibility criteria for enrollment in our Phase II efficacy study, the study showed GA growth rates in the study eye that were lower than those seen in the control eye.
In July 2015, we transplanted our first subject in our Radiant™ Study. This Phase II randomized, controlled proof-of-concept study was designed to evaluate both the safety and efficacy of our proprietary HuCNS-SC cells for the treatment of GA. The study was designed to enroll sixty-three patients between 50-90 years of age with bi-lateral GA-AMD (geographic atrophy associated with age related macular degeneration in both eyes). Designed as a “fellow eye” controlled study, all subjects were to receive subretinal transplantation of HuCNS-SC cells via a single injection into the eye with the inferior best-corrected visual acuity; the untreated eye would serve as a control. The objective of the trial was to demonstrate a reduction in the rate of GA disease progression in the treated eye versus the control eye. In December 2015, however, we initiated a strategic realignment plan to fully focus our resources on our proprietary HuCNS-SC cells for the treatment of chronic spinal cord injury. A key elements of the plan included the immediate suspension of further patient enrollment into our Phase II Radiant Study in GA-AMD as well as the modification of certain service agreements related to the AMD
37
Table of Contents
program, while we seek a partner to fund continued development of the CNS-SC cells as a potential treatment of retinal disorders.
We previously completed a Phase I clinical trial in infantile and late infantile neuronal ceroid lipofuscinosis (NCL), which showed that our HuCNS-SC cells were well tolerated and non-tumorigenic, and that there was evidence of engraftment and long-term survival of the transplanted HuCNS-SC cells. In October 2013, the results of a four-year, long-term follow up study of the patients from the initial Phase I study showed there were no long-term safety or tolerability issues associated with the cells up to five years post-transplantation.
In October 2012, we published in Science Translational Medicine, a peer-reviewed journal, the data from our four-patient Phase I clinical trial in PMD, which showed preliminary evidence of durable and progressive donor-derived myelination in all four patients. In addition, there were measurable gains in neurological function in three of the four patients, with the fourth patient clinically stable.
For a brief description of our significant therapeutic research and development programs see Overview “Therapeutic Product Development Programs” in the Business Section of Part I, Item 1 of this Form 10-K.
In April 2013, we entered into an agreement with the California Institute for Regenerative Medicine (CIRM) under which CIRM would have provided up to approximately $19.3 million as a forgivable loan, in accordance with mutually agreed upon terms and conditions and CIRM regulations. The CIRM loan was to have helped fund preclinical development of our HuCNS-SC cells for Alzheimer’s disease. Between July 2013 and August 2014, we received in aggregate, approximately $9.6 million as disbursements of the loan provided under the CIRM Loan Agreement. However in December 2014, as findings under this pre-clinical study in Alzheimer’s disease did not meet pre-determined criteria for ongoing funding for this program by CIRM, we decided to wind down this pre-clinical study which had been funded in part by the CIRM loan agreement. Under the terms of the CIRM loan agreement, principal amount of approximately $8,917,000 and accrued interest of approximately $243,000 were forgiven. However, authoritative accounting guidance requires certain conditions (which includes a legal release from the creditor) to be met before a liability can be extinguished and derecognized. In February 2015, we repaid CIRM approximately $679,000 of the aggregate loan proceeds received.
As part of our strategy to focus on our clinical operations, we sold our SC Proven reagent and cell culture business and wound-down our business operations at our Subsidiary SCS UK in Cambridge, UK. The results of operations from these operations have been classified as discontinued operations for all periods presented (see Note 19 “Discontinued Operations” in the Notes to Consolidated Financial Statements of Part II, Item 8 of this Form 10-K for further information).
We have not derived any revenue or cash flows from the sale or commercialization of any products except for license revenue for certain of our patented technologies and sales of products for use in stem cell research. As a result, we have incurred annual operating losses since inception and expect to incur substantial operating losses in the future. Therefore, we are dependent upon external financing, such as from equity and debt offerings, to finance our operations. Before we can derive revenue or cash inflows from the commercialization of any of our therapeutic product candidates, we will need to: (i) conduct substantial in vitro testing and characterization of our proprietary cell types, (ii) undertake preclinical and clinical testing for specific disease indications; (iii) develop, validate and scale-up manufacturing processes to produce these cell-based therapeutics, and (iv) obtain required regulatory approvals. These steps are risky, expensive and time consuming.
Overall, we expect our R&D expenses to be substantial and to increase for the foreseeable future as we continue the development and clinical investigation of our current and future product candidates. However, expenditures on R&D programs are subject to many uncertainties, including whether we develop our product candidates with a partner or independently. We cannot forecast with any degree of certainty which of our current product candidates will be subject to future collaboration, when such collaboration agreements will be secured, if at all, and to what degree such arrangements would affect our development plans and capital requirements. In addition, there are numerous factors associated with the successful commercialization of any of our cell-based
38
Table of Contents
therapeutics, including future trial design and regulatory requirements, many of which cannot be determined with accuracy at this time given the stage of our development and the novel nature of stem cell technologies. The regulatory pathways, both in the United States and internationally, are complex and fluid given the novel and, in general, clinically unproven nature of stem cell technologies. At this time, due to such uncertainties and inherent risks, we cannot estimate in a meaningful way the duration of, or the costs to complete, our R&D programs or whether, when or to what extent we will generate revenues or cash inflows from the commercialization and sale of any of our therapeutic product candidates. While we are currently focused on advancing each of our product development programs, our future R&D expenses will depend on the determinations we make as to the scientific and clinical prospects of each product candidate, as well as our ongoing assessment of the regulatory requirements and each product candidate’s commercial potential.
Given the early stage of development of our therapeutic product candidates, any estimates of when we may be able to commercialize one or more of these products would not be meaningful. Moreover, any estimate of the time and investment required to develop potential products based upon our proprietary HuCNS-SC technologies will change depending on the ultimate approach or approaches we take to pursue them, the results of preclinical and clinical studies, and the content and timing of decisions made by the FDA and other regulatory authorities. There can be no assurance that we will be able to develop any product successfully, or that we will be able to recover our development costs, whether upon commercialization of a developed product or otherwise. We cannot provide assurance that any of these programs will result in products that can be marketed or marketed profitably. If certain of our development-stage programs do not result in commercially viable products, our results of operations could be materially adversely affected.
Significant Events
Therapeutic Product Development
Spinal cord injury
In April 2015, we completed transplanting the six patients comprising the first cohort of our Phase II Pathway Study. The first cohort is an open-label dose escalation arm to determine the cell dose to be used for the second cohort of the study. The second cohort of the study is a single-blind arm in 40 patients that will assess efficacy of our proprietary HuCNS-SC platform technology for the treatment of cervical spinal cord injury (SCI).
In May 2015, we presented a summary of the safety and preliminary efficacy data from our Phase I/II study investigating our proprietary HuCNS-SC human neural stem cells as a treatment for chronic thoracic spinal cord injury. The analysis of the study demonstrated that the surgical transplantation technique and cell dose were safe and well tolerated by all patients. HuCNS-SC cells were injected directly into the cord both above and below the level of injury and sequential examinations of the patients over the course of twelve months showed no abnormal changes in spinal cord function associated with the transplantation technique. There were no adverse events attributed to the HuCNS-SC cells. In addition to safety, analysis of the twelve-month data revealed sustained improvements in sensory function that emerged consistently around three months after transplantation and persisted until the end of the study. The patterns of sensory gains were confirmed to involve multiple sensory pathways and were observed more frequently in the patients with less severe injury; three of the seven AIS A patients and four of the five AIS B patients showed signs of positive sensory gains confirming the previously released interim results. In addition, two patients progressed during the study from the most severe classification, AIS A, to the lesser degree of injury grade, AIS B.
In June 2015, we commenced enrollment of the second cohort in our Phase II Pathway Study in SCI. The second cohort will enroll forty patients and forms the single-blinded controlled arm of the Phase II study. The primary efficacy outcome being tested in the second cohort is the change in motor strength of the various muscle groups in the upper extremities innervated by the cervical spinal cord.
In November 2015, we announced that the six-month interim results for the first cohort in our ongoing Phase II Pathway Study in SCI showed motor improvements in both strength and function. The assessment of
39
Table of Contents
motor function involved using tests of dexterity. Patients eligible for the study have complete loss of motor control below the level of injury, the most severe degree of SCI as defined by AIS. Clinicians used both ISNCSCI and GRASSP (Graded Assessment of Strength Sensibility and Prehension) measures to establish a pre-transplant baseline for each patient and to assess post-transplant progress. This first cohort of the Pathway Study was designed to assess the safety, and preliminary signs of efficacy, of cell administration into the cervical cord and select the dose level for the forty-patient second cohort, a randomized, controlled and single-blinded arm of the trial, which is already underway. Based on six-month follow-up, for the first cohort, an overall pattern of motor improvement in four of the six patients as measured by gains in both strength and fine motor skills. In addition, four of the six patients showed improvement in the spinal level of injury as defined by the ISNCSCI assessment of at least one level. Consistent with the prior study, changes in muscle strength and function were observed around three months post-transplant.
Age-related macular degeneration (AMD)
In June 2015 we presented a summary of the safety and preliminary efficacy data from our Phase I/II clinical trial in dry AMD. The fifteen patient, open-label, Phase I/II trial was designed to evaluate the safety and preliminary efficacy of sub-retinal HuCNS-SC cell transplantation in geographic atrophy (GA), the most advanced form of dry AMD.
In July 2015, we transplanted our first subject in our Radiant Study. This Phase II randomized, controlled proof-of-concept study was designed to evaluate both the safety and efficacy of our proprietary HuCNS-SC cells for the treatment of GA. The study was to enroll sixty-three patients between 50-90 years of age with bi-lateral GA-AMD (geographic atrophy associated with age related macular degeneration in both eyes). Designed as a “fellow eye” controlled study, all subjects were to receive subretinal transplantation of HuCNS-SC cells via a single injection into the eye with the inferior best-corrected visual acuity; the untreated eye will serve as a control. All patients were be followed for 12 months, with evaluations performed at predetermined intervals to assess safety, anatomic and functional changes. The objective of the trial was to demonstrate a reduction in the rate of GA disease progression in the treated eye versus the control eye. In December 2015, however, we initiated a strategic realignment plan to fully focus our resources on our proprietary HuCNS-SC cells for the treatment of chronic spinal cord injury. A key elements of the plan included the immediate suspension of further patient enrollment into our Phase II Radiant Study in GA-AMD as well as the modification of certain service agreements related to the AMD program.
Financing and Other Business-related Activities
In March 2015, Ian Massey, D. Phil., joined our executive team as President and Chief Operating Officer with direct responsibility for all aspects of our research and development, manufacturing, regulatory affairs, and quality assurance activities. In January 2016, Dr. Ian Massey was appointed by the Board of Directors to succeed Martin McGlynn, as the Company’s Chief Executive Officer, and elected to the Board.
In April 2015, we raised gross proceeds of approximately $25 million through a public offering of 35,715,000 Units. Each Unit consisted of one share of our common stock and a warrant to purchase three-quarters of a share of our common stock. The warrants have an exercise price of $0.85 per share and will expire five years from the date of issuance. We also granted the underwriters a thirty day option to purchase up to an additional 5,357,250 shares of common stock and/or warrants to purchase up to an additional 4,017,938 shares of common stock to cover over-allotments, if any. The underwriters exercised the over-allotment option for the warrants and so, in April 2015, we issued warrants to purchase up to an additional 4,017,938 shares of common stock. The shares were offered under our effective shelf registration statement previously filed with the SEC.
In December 2015, we initiated a strategic realignment plan to fully focus our resources on our proprietary HuCNS-SC cells for the treatment of chronic spinal cord injury. The plan is expected to (i) yield a cost reduction of approximately $20 million over the next two years, (ii) allow us to expedite completion of our ongoing Phase II Pathway Study, and (iii) commence a pivotal Phase III clinical trial in chronic spinal cord injury. Key elements
40
Table of Contents
of the plan included suspension of patient enrollment into our Phase II Radiant Study in GA-AMD, the termination or modification of certain third party service agreements related to the AMD program; a workforce reduction of approximately 25%, which was completed in January 2016; and ongoing efforts to monetize certain of our technology assets.
Critical Accounting Policies and the Use of Estimates
The accompanying discussion and analysis of our financial condition and results of operations is based on our Consolidated Financial Statements and the related disclosures, which have been prepared in accordance with accounting principles generally accepted in the United States of America (U.S. GAAP). The preparation of these Consolidated Financial Statements requires management to make estimates, assumptions, and judgments that affect the reported amounts in our Consolidated Financial Statements and accompanying notes. These estimates form the basis for making judgments about the carrying values of assets and liabilities. We base our estimates and judgments on historical experience and on various other assumptions that we believe to be reasonable under the circumstances, and we have established internal controls related to the preparation of these estimates. Actual results and the timing of the results could differ materially from these estimates.
Warrant Liability
We account for our warrants in accordance with U.S. GAAP which defines how freestanding contracts that are indexed to and potentially settled in a company’s own stock should be measured and classified. Authoritative accounting guidance prescribes that only warrants issued by us under contracts that cannot be net-cash settled, and are both indexed to and settled in our common stock, can be classified as equity. As part of our December 2011 financing, we issued Series A Warrants with a five year term to purchase 8,000,000 shares at $1.40 per share and Series B Warrants with a ninety trading day term to purchase 8,000,000 units at $1.25 per unit. Each unit underlying the Series B Warrants consisted of one share of our common stock and one Series A Warrant. In the first and second quarter of 2012, an aggregate of 2,700,000 Series B Warrants were exercised. For the exercise of these warrants, we issued 2,700,000 shares of our common stock and 2,700,000 Series A Warrants. The remaining 5,300,000 Series B Warrants expired unexercised by their terms on May 2, 2012. The Series A Warrants contain full ratchet anti-dilution price protection so that, in most situations, upon the issuance of any common stock or securities convertible into common stock at a price below the then-existing exercise price of the Series A Warrants, the Series A exercise price will be reset to the lower common stock sales price. As a result of our April 2015 financing, the exercise price of the outstanding Series A warrants were reduced from $1.40 per share to $0.70 per share. Subsequently, as a result of our sale of shares of our common stock under a sales agreement entered into in 2009 and amended in 2012, the exercise price of the outstanding Series A warrants were reduced from $0.70 per share to $0.52 per share. As terms of the Series A Warrants do not meet the specific conditions for equity classification, we are required to classify the fair value of these warrants as a liability, with subsequent changes in fair value to be recorded as income (loss) due to change in fair value of warrant liability. The fair value of the Series A Warrants is determined using a Monte Carlo simulation model (see Note 13, “Warrant Liability”). The fair value is affected by changes in inputs to these models including our stock price, expected stock price volatility, the contractual term, and the risk-free interest rate. The use of a Monte Carlo simulation model requires input of additional assumptions including the progress of our R&D programs and its effect on potential future financings. We will continue to classify the fair value of the warrants as a liability until the warrants are exercised, expire or are amended in a way that would no longer require these warrants to be classified as a liability. The estimated fair value of our warrant liability at December 31, 2015, was approximately $771,000.
Stock-Based Compensation
U.S. GAAP requires us to recognize expense related to the fair value of our stock-based compensation awards, including employee stock options and restricted stock units. Employee stock-based compensation is estimated at the date of grant based on the award’s fair value using the Black-Scholes option pricing model and is recognized as expense ratably over the requisite service period. The Black-Scholes option pricing model requires
41
Table of Contents
the use of certain assumptions, the most significant of which are our estimates of the expected volatility of the market price of our stock, the expected term of the award, and the risk-free interest rate. Our estimate of the expected volatility is based on historical volatility. The expected term represents the period during which our stock-based awards are expected to be outstanding. In 2015, we estimated this amount based on historical experience of similar awards, giving consideration to the contractual terms of the awards, vesting requirements, and expectation of future employee behavior, including post-vesting terminations. Our estimate of the risk-free interest rate is based on U.S. Treasury debt securities with maturities close to the expected term of the option as of the date of grant. We review our valuation assumptions at each grant date and, as a result, our assumptions in future periods may change. At the end of each reporting period we estimate forfeiture rates based on our historical experience within separate groups of employees and adjust stock-based compensation expense accordingly. For the year ended December 31, 2015, employee and external services stock-based compensation expense (stock options, restricted stock units and 401(k) Plan employer match in form of shares) was approximately $4,244,000. As of December 31, 2015, total compensation cost related to unvested stock options and restricted stock units not yet recognized was approximately $5,924,000, which is expected to be recognized as expense over a weighted-average period of 1.7 years.
Discontinued Operations
Effective January 1, 2015, in accordance with amended accounting guidance, the Company reports a disposal of a component of an entity or a group of components of an entity in discontinued operations only if the disposal represents a strategic shift and will have a major effect on an entity’s operations and financial results. The guidance in effect prior to fiscal year 2015 required the results of operations and cash flows of a business that either has been disposed of or is classified as held-for-sale are reported in discontinued operations if the operations and cash flows of the component have been or will be eliminated from our ongoing operations as a result of the disposal transaction and we will not have any significant continuing involvement in the operations of the component after the disposal transaction. We present the operations of a business that meet this criteria as a discontinued operation, and retrospectively reclassify operating results for all prior periods presented. In the fourth quarter of 2014, as part of our strategy to focus on our clinical operations, we sold our SC Proven reagent and cell culture business and wound-down our business operations at our Subsidiary SCS UK in Cambridge, UK. The results of operations for this component have been classified as discontinued operations for all periods in our Consolidated Statement of Operations.
Intangible Assets (Patent and License Costs)
Other intangible assets, net were approximately $46,000 at December 31, 2015. Intangible assets with finite useful lives are amortized generally on a straight-line basis over the periods benefited. Intangible assets deemed to have indefinite lives are not amortized but are subject to annual impairment tests. Intangible assets are also reviewed for impairment whenever events or changes in circumstances indicate the carrying amount of an asset may not be recoverable. In December 2014, based on our decision to focus all of our efforts on moving our clinical programs forward, we determined we could not predict the future cash flows from the intangible IPR&D asset related to our Transgenic Rat Program and determined that the intangible asset was impaired and wrote off the approximately $530,000 carrying value of the asset. In the fourth quarter of 2015, based on our annual impairment tests, we determined that certain capitalized patent and license costs were impaired and wrote off approximately $239,000.
Prior to fiscal year 2001, we capitalized certain patent costs, which are being amortized over the estimated life of the patent and would be expensed at the time such patents are deemed to have no continuing value. Since 2001, all patent costs are expensed as incurred. License costs are capitalized and amortized over the estimated life of the license agreement.
42
Table of Contents
Impairment of Long-Lived Tangible Assets
Long-lived assets are reviewed for impairment whenever events or changes in circumstances indicate the carrying amount of an asset may not be recoverable. If property, plant, and equipment are considered to be impaired, the impairment to be recognized equals the amount by which the carrying value of the assets exceeds its estimated fair market value. No such impairment was recognized during the year 2015.
Loan Payable
In April 2013, we entered into a Loan Agreement with Silicon Valley Bank (SVB) and received loan proceeds of $9,900,000, net of a $100,000 cash discount. The loan has a three-year term and bears interest at an annual rate of 6%. The loan obligations are secured by a first priority security interest on substantially all of our assets excluding intellectual property. There is also a final $1,000,000 fee payable at the end of the term which is being expensed over the term of the loan using the effective interest method. In conjunction with the Loan Agreement, we issued to SVB a ten year warrant to acquire 293,531 shares of common stock at an exercise price of $1.7034 per share. The warrant is immediately exercisable and expires in April 2023. We estimated the fair value of the warrant to be approximately $388,000 using the Black-Scholes option pricing model. We applied the relative fair value method to allocate the $9,900,000 net proceeds between the loan and warrant. The approximately $388,000 fair value allocated to the warrant was recorded as an increase to additional paid-in capital and as a discount to loan payable. Approximately $9,512,000 was assigned to the loan and was recorded as the initial carrying amount of the loan payable, net of discount. The approximately $388,000 fair value of the warrant and the $100,000 cash discount are both being amortized as additional interest expense over the term of the loan using the effective interest rate method. We also incurred loan issuance costs of approximately $117,000, which are recorded as deferred financing costs on the accompanying consolidated balance sheet and are being amortized to interest expense over the term of the Loan Agreement using the effective interest rate method. The effective interest rate used to amortize the deferred financing costs and the discount (including the fair value of the warrant and the cash discount), and for the accretion of the final payment, is 9.0%. We are required to maintain certain financial and other covenants set forth in the Loan Agreement. In December 2015, to remain in compliance with the terms of the agreement, we entered into an amendment to the Loan Agreement that required us to maintain with SVB a restricted money market account with a minimum aggregate balance of $2,422,500. As part of the amendment, we pledged to SVB a security interest in the restricted money market account. The pledged restricted money market account will be released on the earlier of date we repay the outstanding principal, interest and fees or (i) we receive at least $18,000,000 of net new cash proceeds from investors on terms and conditions reasonably acceptable to SVB and (ii) we have cash and cash equivalents at SVB sufficient to support six months operations.
In April 2013, we entered into an agreement with the CIRM under which CIRM would have provided up to approximately $19.3 million as a forgivable loan, in accordance with mutually agreed upon terms and conditions and CIRM regulations. The CIRM loan was to have helped fund preclinical development of our HuCNS-SC cells for Alzheimer’s disease. Between July 2013 and August 2014, we received in aggregate, approximately $9.6 million as disbursements of the loan provided under the CIRM Loan Agreement. However in December 2014, as findings under this pre-clinical study in Alzheimer’s disease did not meet pre-determined criteria for ongoing funding for this program by CIRM, we decided to wind down this pre-clinical study which had been funded in part by the CIRM loan agreement. Under the terms of the CIRM loan agreement, principal amount of approximately $8,917,000 and accrued interest of approximately $243,000 were forgiven. However, authoritative accounting guidance requires certain conditions (which includes a legal release from the creditor) to be met before a liability can be extinguished and derecognized. In February 2015, we repaid CIRM approximately $679,000 of the aggregate loan proceeds received.
We classified our loan obligations with SVB and CIRM as loan payable, net of discount, current and non-current on our Consolidated Balance Sheet. See Note 14 “Loan payable” in the Notes to the Consolidated Financial Statements of Part II, Item 8 of this Form 10-K for further information.
43
Table of Contents
Restructuring Costs
On December 18, 2015, we committed to a strategic realignment to fully focus our resources on our proprietary HuCNS-SC platform technology for the treatment of chronic spinal cord injury. As part of our strategic realignment, we have suspended further enrollment of patients in our Phase II Radiant Study in geographic atrophy of age-related macular degeneration, while we seek a partner to fund continued development of HuCNS-SC cells as a potential treatment of retinal disorders. We intend to continue following patients already treated in the study through their 12-month follow up visits. As part of the realignment, we initiated a reduction in our workforce by 17 full-time employees, or approximately 25% of our workforce. In connection with the reduction in workforce, we recorded a one-time charge for severance and related expenses of approximately $392,000 in the fourth quarter of 2015.
Income Taxes
When accounting for income taxes, we recognize deferred tax assets and liabilities for the expected future tax consequences of temporary differences between the carrying amounts and the tax bases of assets and liabilities. Income tax receivables and liabilities and deferred tax assets and liabilities are recognized based on the amounts that more likely than not will be sustained upon ultimate settlement with taxing authorities.
Developing our provision for income taxes and analyzing our tax positions requires significant judgment and knowledge of federal and state income tax laws, regulations and strategies, including the determination of deferred tax assets and liabilities and, any valuation allowances that may be required for deferred tax assets.
We assess the likelihood of realizing our deferred tax assets to determine whether an income tax valuation allowance is required. Based on such evidence that can be objectively verified, we determine whether it is more likely than not that all or a portion of the deferred tax assets will be realized. The main factors that we consider include:
| • | cumulative losses in recent years; |
| • | income/losses expected in future years; and |
| • | the applicable statute of limitations. |
Tax benefits associated with uncertain tax positions are recognized in the period in which one of the following conditions is satisfied: (1) the more likely than not recognition threshold is satisfied; (2) the position is ultimately settled through negotiation or litigation; or (3) the statute of limitations for the taxing authority to examine and challenge the position has expired. Tax benefits associated with an uncertain tax position are reversed in the period in which the more likely than not recognition threshold is no longer satisfied.
We concluded that the realization of deferred tax assets is dependent upon future earnings, if any, the timing and amount of which are uncertain. Accordingly, the net deferred tax assets have been fully offset by a valuation allowance.
Results of Operations
Our results of operations have varied significantly from year to year and quarter to quarter and may vary significantly in the future due to the occurrence of material recurring and nonrecurring events, including without limitation the receipt and payment of recurring and nonrecurring licensing payments, the initiation or termination of clinical studies, research collaborations and development programs for both cell-based therapeutic products and research tools, unpredictable or unanticipated manufacturing and supply costs, unanticipated capital expenditures necessary to support our business, developments in on-going patent prosecution and litigation, the on-going expenses to maintain our facilities.
44
Table of Contents
Revenue
Revenue from continuing operations totaled approximately $117,000 in 2015, $1,012,000 in 2014, and $172,000 in 2013.
| Change in 2015 Versus 2014 |
Change in 2014 Versus 2013 |
|||||||||||||||||||||||||||
| 2015 | 2014 | 2013 | $ | % | $ | % | ||||||||||||||||||||||
| Revenue: |
||||||||||||||||||||||||||||
| Revenue from licensing agreements, grants and other |
$ | 116,887 | $ | 1,012,391 | $ | 172,297 | $ | (895,504 | ) | (88 | )% | $ | 840,094 | 488 | % | |||||||||||||
Revenue from continuing operations is primarily from royalties and milestone payments received under various licensing agreements. Total revenue from continuing operations in 2015 was approximately $117,000, compared to total revenue from continuing operations of approximately $1,012,000 in 2014. The decrease in revenue from 2014 to 2015 was primarily attributable to the receipt in 2014 of (i) a milestone payment of approximately $500,000 received under a licensing agreement with Reneuron Ltd, and (ii) in connection with our divestiture of the SC Proven business, a licensing fee of approximately $400,000 from licensing agreements entered into with Takara Bio Inc. a publicly traded Japanese company.
Total revenue in 2014 from continuing operations was approximately $840,000, or 488% higher than total revenue in 2013. The increase in 2014 was primarily attributable to a milestone payment of approximately $500,000 received under a licensing agreement with Reneuron Ltd and in connection with our divestiture of the SC Proven business, a licensing fee of approximately $400,000 from licensing agreements entered into with Takara Bio Inc. a publicly traded Japanese company.
Operating Expenses
Operating expense from continuing operations totaled approximately $36,837,000 in 2015, $31,923,000 in 2014, and $28,265,000 in 2013.
| 2015 | 2014 | 2013 | |
Change in 2015 Versus 2014 |
|
|
Change in 2014 Versus 2013 |
| ||||||||||||||||||||
| Operating expenses: |
||||||||||||||||||||||||||||
| Research and development |
$ | 27,110,909 | $ | 21,503,085 | $ | 19,368,888 | $ | 5,607,824 | 26 | % | $ | 2,134,197 | 11 | % | ||||||||||||||
| General and administrative |
9,334,174 | 10,419,620 | 8,834,271 | (1,085,446 | ) | (10 | )% | 1,585,349 | 18 | % | ||||||||||||||||||
| Wind-down expenses |
392,230 | — | 61,837 | 392,230 | * | (61,837 | ) | (100 | )% | |||||||||||||||||||
|
|
|
|
|
|
|
|
|
|
|
|||||||||||||||||||
| Total operating expenses |
$ | 36,837,313 | $ | 31,922,705 | $ | 28,264,996 | $ | 4,914,608 | 15 | % | $ | 3,657,709 | 13 | % | ||||||||||||||
|
|
|
|
|
|
|
|
|
|
|
|||||||||||||||||||
| * | Calculation not meaningful |
Research and Development Expenses
Our R&D expenses consist primarily of salaries and related personnel expenses, costs associated with clinical trials and regulatory submissions, costs associated with preclinical activities such as toxicology studies, costs associated with cell processing and process development, certain patent-related costs such as licensing, facilities related costs such as depreciation, lab equipment, and supplies. Clinical trial expenses include payments to vendors such as clinical research organizations, contract manufacturers, clinical trial sites, laboratories for
45
Table of Contents
testing clinical samples and consultants. Cumulative R&D costs incurred since we refocused our activities on developing cell-based therapeutics (fiscal years 2000 through 2015) were approximately $237 million. Over this period, the majority of these cumulative costs were related to: (i) characterization of our proprietary HuCNS-SC cells, (ii) expenditures for toxicology and other preclinical studies, preparation and submission of applications to regulatory agencies to conduct clinical trials and obtaining regulatory clearance to initiate such trials, all with respect to our HuCNS-SC cells, (iii) preclinical studies and development of our human liver engrafting cells, (iv) costs associated with cell processing and process development, and (v) costs associated with our clinical studies.
We use and manage our R&D resources, including our employees and facilities, across various projects rather than on a project-by-project basis for the following reasons. The allocations of time and resources change as the needs and priorities of individual projects and programs change, and many of our researchers are assigned to more than one project at any given time. Furthermore, we are exploring multiple possible uses for our proprietary HuCNS-SC cells, so much of our R&D effort is complementary to and supportive of each of these projects. Lastly, much of our R&D effort is focused on manufacturing processes, which can result in process improvements useful across cell types. We also use external service providers to assist in the conduct of our clinical trials, to manufacture certain of our product candidates and to provide various other R&D related products and services. Many of these costs and expenses are complementary to and supportive of each of our programs. Because we do not have a development collaborator for any of our product programs, we are currently responsible for all costs incurred with respect to our product candidates.
R&D expense from continuing operations totaled approximately $27,111,000 in 2015, as compared to $21,503,000 in 2014 and $19,369,000 in 2013. At December 31, 2015, we had 62 full-time employees working in research and development and laboratory support services as compared to 56 at December 31, 2014 and 47 at December 31, 2013.
2015 versus 2014. R&D expenses increased by approximately $5,608,000, or 26%, in 2015 compared to 2014. The increase was primarily attributable to (i) an increase in personnel costs of approximately $2,959,000 due to the addition of key personnel to strengthen our product development and clinical operations capabilities and an increase in stock based compensation, (ii) an increase of approximately $1,533,000 in expenses related to our clinical studies; primarily attributable to expenses incurred towards initiating a follow-on Phase II randomized, controlled proof-of-concept study in dry AMD in the second-half of 2015 and increased activities in our Phase II proof of concept clinical trial to investigate our HuCNS-SC cells as a treatment for chronic cervical spinal cord injury, (iii) an increase of approximately $490,000 in supplies due to increased clinical and process development activities, and (iv) an increase in allocated facilities expenses of $673,000 primarily related to manufacturing activities. The increase was partially offset by a net decrease in other operating expenses of approximately $47,000.
2014 versus 2013 R&D expenses increased by approximately $2,134,000, or 11%, in 2014 compared to 2013. The increase was primarily attributable to (i) an increase of approximately $2,136,000 in expenses related to our clinical studies; (a) our Phase I/II clinical trial for the treatment of chronic spinal cord injury, (b) our Phase I/II clinical trial in dry AMD, and (c) expenses incurred to initiate a controlled Phase II efficacy study to further investigate our HuCNS-SC cells as a treatment for spinal cord injury, (ii) an increase in personnel costs of approximately $566,000 due to the addition of key personnel to strengthen our product development and clinical operations capabilities, (iii) an increase of approximately $337,000 in supplies and validation expenses primarily related to manufacturing, quality control and process development activities to support our preclinical and clinical studies, and (iv) an increase in other expenses of approximately $169,000. The increase was partially offset by a decrease of approximately $1,074,000 in external services primarily related to our cell manufacturing.
General and Administrative Expenses. General and administrative (G&A) expenses are primarily comprised of salaries, benefits and other staff-related costs associated with finance, legal, human resources, information technology, and other administrative personnel, facilities and overhead costs, and external legal, audit and other general and administrative services.
46
Table of Contents
G&A expenses totaled approximately $9,334,000 in 2015, compared with $10,420,000 in 2014 and $8,834,000 in 2013.
2015 versus 2014. G&A expenses decreased by approximately $1,085,000, or 10%, in 2015 compared to 2014. This decrease was primarily attributable to (i) a decrease of approximately $2,032,000 in external services, primarily legal litigation fees, and (ii) a decrease in other operating expenses of approximately $121,000. This decrease was offset by an increase of approximately $1,068,000 in payroll expenses due to an increase in stock-based compensation awards.
2014 versus 2013 G&A expenses increased by approximately $1,585,000, or 18%, in 2014 compared to 2013. This increase was primarily attributable to (i) an increase of approximately $889,000 in external services, primarily legal fees, (ii) an increase in personnel costs of approximately $400,000 and (iii) an increase in net other expenses of approximately $296,000.
Other Income (Expense)
Other income from continuing operations totaled approximately $305,000 in 2015, compared with other expense of approximately $1,350,000 in 2014 and other income of $2,106,000 in 2013.
| 2015 | 2014 | 2013 | |
Change in 2015 Versus 2014 |
|
|
Change in 2014 Versus 2013 |
| ||||||||||||||||||||
| Other income (expense): |
||||||||||||||||||||||||||||
| Change in fair value of warrant liability |
$ | 913,587 | $ | 2,422,451 | $ | 3,253,253 | $ | (1,508,864 | ) | (62 | )% | $ | (830,802 | ) | (26 | )% | ||||||||||||
| Impairment of goodwill |
— | (1,910,062 | ) | — | 1,910,062 | (100 | )% | (1,910,062 | ) | * | ||||||||||||||||||
| Impairment of other intangible assets |
(239,241 | ) | (530,100 | ) | — | 290,859 | (55 | )% | (530,100 | ) | * | |||||||||||||||||
| Interest income |
7,544 | 8,532 | 11,318 | (988 | ) | (12 | )% | (2,786 | ) | (25 | )% | |||||||||||||||||
| Interest expense |
(506,319 | ) | (1,295,404 | ) | (1,166,782 | ) | 789,085 | (61 | )% | (128,622 | ) | 11 | % | |||||||||||||||
| Other income (expense), net |
129,829 | (45,766 | ) | 8,218 | 175,595 | (384 | )% | (53,984 | ) | (657 | )% | |||||||||||||||||
|
|
|
|
|
|
|
|
|
|
|
|||||||||||||||||||
| Total other income (expense), net |
$ | 305,400 | $ | (1,350,349 | ) | $ | 2,106,007 | $ | 1,655,750 | (123 | )% | $ | (3,456,356 | ) | (164 | )% | ||||||||||||
|
|
|
|
|
|
|
|
|
|
|
|||||||||||||||||||
| * | Calculation not meaningful |
Change in Fair Value of Warrant Liability
As terms of the warrants issued in 2009, as well as the Series A Warrants, do not meet the specific conditions for equity classification, we are required to classify the fair value of these warrants as a liability, with subsequent changes in fair value to be recorded as income or loss in our Consolidated Statements of Operations. The fair value of the outstanding warrants is determined using various option pricing models, such as the Black-Scholes-Merton (Black-Scholes) option pricing model and a Monte Carlo simulation model, and is affected by changes in inputs to the various models, including our stock price, expected stock price volatility, the contractual term and the risk-free interest rate. The use of a Monte Carlo simulation model requires input of additional subjective assumptions including the progress of our R&D programs and its affect on potential future financings. The fair value of the warrant liability is revalued at the end of each reporting period. See Note 13 “Warrant Liability,” in the Notes to Consolidated Financial Statements of Part II, Item 8 of this Form 10-K for further information on this transaction.
47
Table of Contents
Interest Income
Interest income totaled approximately $8,000 in 2015, $9,000 in 2014, and $11,000 in 2013. Interest income is not significant and is from the investment of our cash balances in money market accounts and short-term money market instruments that are highly liquid and that preserves capital.
Interest Expense
Interest expense was approximately $506,000 in 2015, $1,295,000 in 2014, and $1,167,000 in 2013. Interest expense for 2015 was primarily from the accretion of discount, amortization of deferred financing costs and accrual of interest related to our loan agreement with SVB. Interest expense for 2014 and 2013 was primarily from the accretion of discount, amortization of deferred financing costs and accrual of interest related to our loan agreement with SVB, and accrued interest related to our loan agreement with CIRM. See Note 14 “Loan Payable,” in the Notes to Consolidated Financial Statements of Part II, Item 8 of this Form 10-K for further information.
Impairment of Intangible Assets
In the fourth quarter of 2015, based on our annual impairment tests, we determined that certain capitalized patent and license costs were impaired and wrote off approximately $239,000.
Other Income (Expense), net
Other income, net of approximately $130,000 for 2015 was primarily attributable to the gain on sale of our Rhode Island property (see Note 12, “Commitments and Contingencies” in the Notes to Consolidated Financial Statements of Part II, Item 8 of this Form 10-K for further information) and gain on sale of equipment offset by state franchise taxes paid. Other expense, net of approximately $46,000 for 2014 was primarily state franchise taxes. Other income of approximately $8,000 in 2013 includes approximately $38,000 from a net gain on sale and disposal of equipment. The above income was offset by state franchise taxes of approximately $30,000.
Discontinued Operations
In the fourth quarter of 2014, as part of our strategy to focus on our clinical operations, we sold our SC Proven reagent and cell culture business and wound-down our business operations at our Subsidiary SCS UK in Cambridge, UK. The results of operations for this component have been classified as discontinued operations for all periods in our Consolidated Statement of Operations.
Net loss from discontinued operations totaled approximately $0 in 2015, $369,000 in 2014, and $452,000 in 2013.
| 2015 | 2014 | 2013 | ||||||||||
| Revenue from product sales |
$ | — | $ | 1,150,354 | $ | 997,968 | ||||||
| Revenue from other, net |
— | 20,530 | 33,005 | |||||||||
|
|
|
|
|
|
|
|||||||
| Total revenue |
— | 1,170,884 | 1,030,973 | |||||||||
| Cost of product sales |
— | 733,425 | 316,629 | |||||||||
|
|
|
|
|
|
|
|||||||
| Gross profit |
— | 437,459 | 714,344 | |||||||||
| Operating expenses |
— | 806,816 | 1,166,811 | |||||||||
|
|
|
|
|
|
|
|||||||
| Net loss from discontinued operations |
$ | — | $ | (369,357 | ) | $ | (452,467 | ) | ||||
|
|
|
|
|
|
|
|||||||
From the sale and wind-down of our SC Proven reagent and cell culture business, we received approximately $400,000 for certain business intellectual property rights, trade mark and records and approximately $75,000 for tangible assets. For the disposal of these assets, we recorded a net loss on disposal of
48
Table of Contents
assets of approximately $111,000 in our Consolidated Statement of Operations. As a result of the disposition, we are no longer in the businesses of marketing and selling specialized cell culture products and antibody reagents through the SC Proven product line.
Liquidity and Capital Resources
Since our inception, we have financed our operations through the sale of common and preferred stock, the issuance of long-term debt and capitalized lease obligations, revenue from research grants, license fees, product sales and interest income.
| Change in 2015 Versus 2014 |
Change in 2014 Versus 2013 |
|||||||||||||||||||||||||||
| 2015 | 2014 | 2013 | $ | % | $ | % | ||||||||||||||||||||||
| At December 31: |
||||||||||||||||||||||||||||
| Cash and highly liquid investments(1) |
$ | 12,110,565 | $ | 24,987,603 | $ | 30,585,424 | $ | (12,877,038 | ) | (52 | )% | $ | (5,597,821 | ) | (18 | )% | ||||||||||||
| Year ended December 31: |
||||||||||||||||||||||||||||
| Net cash used in operating activities |
$ | (30,679,424 | ) | $ | (27,352,431 | ) | $ | (23,322,001 | ) | $ | (3,326,993 | ) | 12 | % | $ | (4,030,430 | ) | 17 | % | |||||||||
| Net cash provided by (used in) investing activities |
$ | (885,280 | ) | $ | (425,622 | ) | $ | 9,035,906 | $ | (459,658 | ) | 108 | % | $ | (9,461,528 | ) | * | |||||||||||
| Net cash provided by financing activities |
$ | 18,706,825 | $ | 22,196,501 | $ | 36,402,277 | $ | (3,489,676 | ) | (16 | )% | $ | (14,205,776 | ) | (39 | )% | ||||||||||||
| (1) | For 2015 and 2014, cash and highly liquid investments include unrestricted cash, cash equivalents. For 2013, marketable debt securities are also included. |
| * | Calculation not meaningful. |
Net Cash Used in Operating Activities
Cash used in operating activities was approximately $30,679,000 in 2015, $27,352,000 in 2014, and $23,322,000 in 2013. Cash used in operating activities is primarily driven by our net loss as adjusted for non-cash charges and differences in the timing of operating cash flows.
Net Cash (Used in) Provided by Investing Activities
Net cash used in investing activities of approximately $885,000 in 2015 was primarily related to the purchase of lab equipment for approximately $1,054,000, offset by receipts of approximately $149,000 from the sale of our property in Rhode Island (See Note 12, “Commitments and Contingencies” in the notes to Consolidated Financial Statements of Part II, Item 8 of this Form 10-K for further information) and approximately $20,000 from the sale of lab equipment. Net cash used in investing activities in 2014 was primarily for the purchase of lab and office equipment. Net cash provided by investing activities for the similar period in 2013 was primarily attributable to net maturities of short-term marketable debt securities of approximately $13,742,000, offset by a net investment in leasehold improvements, equipment and other assets of approximately $4,706,000.
Our investment portfolio is comprised primarily of U.S. Treasury debt securities, which are classified as cash equivalents.
49
Table of Contents
Net Cash Provided by Financing Activities
Listed below are key financing transactions entered into by us in 2015, 2014 and 2013:
| • | In April 2015, we raised gross proceeds of approximately $25 million through a public offering of 35,715,000 Units. Each Unit consists of one share of our common stock and a warrant to purchase three-quarters of a share of our common stock. The warrants have an exercise price of $0.85 per share, are exercisable immediately, and will expire five years from the date of issuance. We also granted the underwriters a thirty day option (the Over-Allotment Option) to purchase up to an additional 5,357,250 shares of common stock and/or warrants to purchase up to an additional 4,017,938 shares of common stock to cover over-allotments, if any. The underwriters exercised the over-allotment option for the warrants and so, in April 2015, we issued warrants to purchase up to an additional 4,017,938 shares of common stock at $0.85 per share. In May 2015, the underwriters exercised in part, the over-allotment option for additional shares and purchased 2,757,250 shares of our common stock at a price of $0.699 per share, before the underwriting discount. We received net proceeds of approximately $1.8 million from the exercise of the Over-Allotment Option, increasing our aggregate net proceeds from the offering to approximately $25 million, after deducting offering expenses, underwriting discounts and commissions. The shares were offered under our effective shelf registration statement previously filed with the SEC. |
| • | Under a sales agreement entered into in 2009 and amended in 2012 (Amended Sales Agreement), we have the option to sell up to $30 million of our common stock from time to time, in at-the-market offerings. The sales agent is paid compensation of 2% of gross proceeds pursuant to the terms of the amended agreement. The sales agreement as amended, has been filed with the SEC. Under the Amended Sales Agreement, in 2015, we sold a total of 2,546,681 shares of our common stock at an average price per share of $0.55 for gross proceeds of approximately $1,410,000. The shares were offered under our shelf registration statement previously filed with, and declared effective by, the SEC. |
| • | In July 2014, we raised gross proceeds of $20,000,000 through the sale of 11,299,435 units to two institutional biotechnology investors, at an offering price of $1.77 per unit. Each unit consists of one share of our common stock and a warrant to purchase 0.85 of a share of our common stock. The warrants are exercisable six months from the date of issuance at an exercise price of $2.17. The warrants are non-transferable and will expire thirteen months from the date of issuance. The shares were offered under our shelf registration statement previously filed with, and declared effective by, the SEC. |
| • | In 2014, an aggregate of 1,180,015 Series A Warrants were exercised. For the exercise of these warrants, we issued 1,180,015 shares of our common stock and received gross proceeds of approximately $1,652,000. |
| • | Under the Amended Sales Agreement, in 2014, we sold a total of 193,271 shares of our common stock at an average price per share of $1.47 for gross proceeds of approximately $285,000. The shares were offered under our shelf registration statement previously filed with, and declared effective by, the SEC. |
| • | In October 2013, we sold a total of 12,845,500 units in an underwritten public offering at a price of $1.45 per unit and received total proceeds, net of offering expenses, underwriting discounts and commissions, of approximately $17.3 million. Each unit sold consisted of one share of common stock, par value $.01 per share, and a warrant to purchase one-half share of common stock. The warrants have an exercise price of $1.80 per share, are exercisable immediately, and will expire five years from the date of issuance. |
| • | In June 2013, we entered into an agreement with an institutional investor, under which we have the right to sell up to $30.0 million of our common stock to the institutional investor. Proceeds from the sale of our common stock will be used for general corporate purposes. Under the terms of the agreement, we immediately sold 1,645,639 in shares of our common stock to the institutional investor at a purchase price of $1.823 per share, which was the volume-weighted average price of the prior ten trading days, and received gross proceeds of $3.0 million. In consideration for entering into the |
50
Table of Contents
| agreement, we issued 329,131 shares of our common stock to the institutional investor. We did not receive any cash proceeds from the issuance of these 329,131 shares. Under this agreement, we had the right for a period of three years and at our sole discretion, to sell additional amounts up to $27.0 million of our common stock to the institutional investor subject to certain limitations. No warrants were issued in connection with this transaction. All shares were sold under our shelf registration statement previously filed with, and declared effective by, the SEC. In October 2013, we terminated the agreement without any cost or penalty. |
| • | Under the Amended Sales Agreement, in 2013, we sold an aggregate of 1,733,771 shares of our common stock at an average price per share of $1.91 for gross proceeds of approximately $3,317,000. The shares were offered under our shelf registration statement previously filed with, and declared effective by, the SEC. |
| • | In 2013, an aggregate of 384,534 Series A Warrants were exercised. For the exercise of these warrants, we issued 384,534 shares of our common stock and received gross proceeds of approximately $538,000. |
We have incurred significant operating losses and negative cash flows since inception. We have not achieved profitability and may not be able to realize sufficient revenue to achieve or sustain profitability in the future. We do not expect to be profitable in the next several years, but rather expect to incur additional operating losses. We have limited liquidity and capital resources and must obtain significant additional capital resources in order to sustain our product development efforts, for acquisition of technologies and intellectual property rights, for preclinical and clinical testing of our anticipated products, pursuit of regulatory approvals, acquisition of capital equipment, laboratory and office facilities, establishment of production capabilities, for selling, general and administrative expenses and other working capital requirements. We rely on cash balances and proceeds from equity and debt offerings, proceeds from the transfer or sale of our intellectual property rights, equipment, facilities or investments, and government grants and funding from collaborative arrangements, if obtainable, to fund our operations.
We intend to pursue opportunities to obtain additional financing in the future through equity and debt financings, grants and collaborative research arrangements. In December 2013, we filed with the SEC, and the SEC declared effective, a universal shelf registration statement which permits us to issue up to $100 million worth of registered debt and equity securities. Under this effective shelf registration, we have the flexibility to issue registered securities, from time to time, in one or more separate offerings or other transactions with the size, price and terms to be determined at the time of issuance. Registered securities issued using this shelf may be used to raise additional capital to fund our working capital and other corporate needs, for future acquisitions of assets, programs or businesses, and for other corporate purposes. As of March 1, 2016, we had approximately $25 million under this universal shelf registration statement available for issuing debt or equity securities.
The source, timing and availability of any future financing will depend principally upon market conditions, interest rates and, more specifically, on our progress in our exploratory, preclinical and future clinical development programs. Funding may not be available when needed — at all, or on terms acceptable to us. Lack of necessary funds may require us, among other things, to delay, scale back or eliminate some or all of our research and product development programs, planned clinical trials, and/or our capital expenditures or to license our potential products or technologies to third parties. In addition, the decline in economic activity, together with the deterioration of the credit and capital markets, could have an adverse impact on potential sources of future financing.
Commitments
See Note 12, “Commitments and Contingencies” in the Notes to Consolidated Financial Statements of Part II, Item 8 of this Form 10-K for further information.
51
Table of Contents
Off-Balance Sheet Arrangements
We have certain contractual arrangements that create potential risk for us and are not recognized in our Consolidated Balance Sheets. Discussed below are those off-balance sheet arrangements that have, or are reasonably likely to have, a material current or future effect on our financial condition, changes in financial condition, revenue or expenses, results of operations, liquidity, capital expenditures, or capital resources.
Operating Leases
We lease various real properties under operating leases that generally require us to pay taxes, insurance, maintenance, and minimum lease payments. Some of our leases have options to renew.
Operating Leases — California
In December 2010, we entered into a commercial lease agreement with BMR-Gateway Boulevard LLC (BMR), as landlord, for office and research space at BMR’s Pacific Research Center in Newark, California. The initial term of the lease is approximately eleven and one-half years and includes escalating rent payments which we recognize as lease operating expense on a straight-line basis. We will pay approximately $17,869,000 in aggregate as rent over the term of the lease to BMR. Deferred rent for this facility was approximately $1,372,000 as of December 31, 2015, and approximately $1,429,000 as of December 31, 2014.
In March 2013, we entered into a commercial lease agreement with Prologis, L.P. (Prologis), as landlord, for office and research space in Sunnyvale, California. The facility is for operations that support our clinical development activities. The initial term of the lease is ten years and includes escalating rent payments which we recognize as lease operating expense on a straight-line basis. We will pay approximately $3,497,000 in aggregate rent over the term of the lease. As part of the lease, Prologis has agreed to provide us financial allowances to build initial tenant improvements, subject to customary terms and conditions relating to landlord-funded tenant improvements. The tenant improvements are recorded as leasehold improvement assets and amortized over the term of the lease. The financial allowances are treated as a lease incentive and recorded as deferred rent which is amortized as reductions to lease expense over the lease term. Deferred rent for this facility was approximately $382,000 as of December 31, 2015 and $391,000 as of December 31, 2014.
Operating Leases — United Kingdom
In January 2011, we amended the existing lease agreements of our wholly-owned subsidiary, Stem Cell Sciences (U.K.) Ltd, effectively reducing our leased office and lab space. The lease by its terms was extended to September 30, 2013. In October 2013, we signed a new three-year lease agreement for the leased space and expect to pay rent of approximately GBP 53,000 per annum. StemCells, Inc. is the guarantor of SCS UK’s obligations under the existing lease. The lease gave SCS UK an option for early termination of the lease agreement. In December 2014, we sold our SC Proven reagent and cell culture business and as part of the wind-down of our business operations in UK, sublet our leased space for the remaining term of our lease agreement; from January 2015 to our opted early termination date of October 2015.
With the exception of the operating leases discussed above, we have not entered into any significant off balance sheet financial arrangements and have not established any special purpose entities. We have not guaranteed any debts or commitments of other entities or entered into any options on non-financial assets. See Note 12, “Commitments and Contingencies,” in the Notes to Consolidated Financial Statements of Part II, Item 8 of this Form 10-K for further information.
52
Table of Contents
Contractual Obligations
In the table below, we set forth our legally binding and enforceable contractual cash obligations at December 31, 2015:
| Total Obligations at 12/31/15 |
Payable in 2016 |
Payable in 2017 |
Payable in 2018 |
Payable in 2019 |
Payable in 2020 |
Payable in 2021 and Beyond |
||||||||||||||||||||||
| Operating lease payments |
$ | 14,241,335 | $ | 1,968,459 | $ | 2,014,706 | $ | 2,061,260 | $ | 2,108,130 | $ | 2,155,325 | $ | 3,933,455 | ||||||||||||||
| Capital lease equipment (principal & interest) |
36,785 | 20,670 | 11,202 | 4,913 | — | — | — | |||||||||||||||||||||
| Loan payable (principal & interest)(1) |
1,440,679 | 1,440,679 | — | — | — | — | — | |||||||||||||||||||||
|
|
|
|
|
|
|
|
|
|
|
|
|
|
|
|||||||||||||||
| Total contractual cash obligations |
$ | 15,718,799 | $ | 3,429,808 | $ | 2,025,908 | $ | 2,066,173 | $ | 2,108,130 | $ | 2,155,325 | $ | 3,933,455 | ||||||||||||||
|
|
|
|
|
|
|
|
|
|
|
|
|
|
|
|||||||||||||||
| (1) | Excludes principal of approximately $8,917,000 and accrued interest of approximately $243,000 related to the CIRM loan agreement. See Note 14, “Loan Payable” in the Notes to Consolidated Financial Statements of Part II, Item 8 of this Form 10-K for further information. |
We periodically enter into licensing agreements with third parties to obtain exclusive or non-exclusive licenses for certain technologies. The terms of certain of these agreements require us to pay future milestone payments based upon achievement of certain developmental, regulatory or commercial milestones. We do not anticipate making any milestone payments under any of our licensing agreements for 2015. Milestone payments beyond fiscal year 2015 cannot be predicted or estimated, due to the uncertainty of achieving the required developmental, regulatory or commercial milestones.
We do not have any material unconditional purchase obligations or commercial commitments related to capital expenditures, clinical development, clinical manufacturing, or other external services contracts at December 31, 2015.
Recent Accounting Pronouncements
In June 2014, the Financial Accounting Standards Board (“FASB”) issued Accounting Standards Update (“ASU”) 2014-12, “Accounting for Share-Based Payments When the Terms of an Award Provide That a Performance Target Could Be Achieved after the Requisite Service Period.” The ASU requires that a performance target that affects vesting, and that could be achieved after the requisite service period, be treated as a performance condition. A reporting entity should apply existing guidance in Topic 718 as it relates to awards with performance conditions that affect vesting to account for such awards. In July 2015, the FASB voted to defer the effective date of this ASU for one year, revising the effective date for interim and annual periods beginning after December 15, 2016. Early adoption is permitted. We do not anticipate the adoption of this ASU will have a material impact on our consolidated financial statements.
In August 2014, the Financial Accounting Standards Board (“FASB”) issued Accounting Standards Update (“ASU”) No. 2014-15, “Disclosure of Uncertainties about an Entity’s Ability to Continue as a Going Concern,” to provide guidance on management’s responsibility in evaluating whether there is substantial doubt about a company’s ability to continue as a going concern and to provide related footnote disclosures. This update is effective for annual periods ending after December 15, 2016, and interim periods within annual periods beginning after December 15, 2016. Early application is permitted for annual or interim reporting periods for
53
Table of Contents
which the financial statements have not previously been issued. We do not expect the adoption of ASU 2014-15 to have a significant impact on our Consolidated Financial Statements or related disclosures.
In April 2015, the FASB issued ASU 2015-03, “Interest — Imputation of Interest,” which amends the presentation of debt issuance costs in the balance sheet as a direct deduction from the carrying amount of the related debt liability rather than as a deferred charge as presented under current guidance. ASU 2015-03 is effective for annual and interim periods beginning after December 15, 2015, and must be retrospectively applied. Early adoption is permitted. We do not expect the adoption of this amendment to have a material effect on our financial condition and results of operations.
In January 2016, the FASB issued ASU 2015-01, “Financial Instruments—Overall.” The amendments in this update require all equity investments to be measured at fair value with changes in the fair value recognized through net income (other than those accounted for under equity method of accounting or those that result in consolidation of the investee).The amendments in this update also require an entity to present separately in other comprehensive income the portion of the total change in the fair value of a liability resulting from a change in the instrument-specific credit risk when the entity has elected to measure the liability at fair value in accordance with the fair value option for financial instruments. For public business entities, the amendments in this update are effective for fiscal years beginning after December 15, 2017, including interim periods within those fiscal years. We do not expect the adoption of ASU 2016-01 to have a significant impact on our Consolidated Financial Statements or related disclosures.
| Item 7A. | QUANTITATIVE AND QUALITATIVE DISCLOSURES ABOUT MARKET RISK |
Interest Rate and Credit Risks
Our interest-bearing assets, or interest-bearing portfolio, consist of cash and cash equivalents. The balance of our interest-bearing portfolio was approximately $14,533,000, or 68%, of total assets at December 31, 2015 and $24,988,000, or 77%, of total assets at December 31, 2014. Interest income earned on these assets was approximately $8,000 in 2015 and $9,000 in 2014. Our interest income is sensitive to changes in the general level of interest rates, primarily U.S. interest rates. At December 31, 2015, our cash equivalents were primarily composed of money market accounts comprised of U.S. Treasury debt securities. See Note 1, “Summary of Significant Accounting Policies — Financial Instruments” and Note 2 “Financial Instruments” section in the Notes to Consolidated Financial Statements in Part II, Item 8 of this Form 10-K for further information.
Equity Security and Foreign Exchange Risks
Our foreign exchange risk is an exposure to foreign currency exchange rates on the earnings, cash flows and financial position of our foreign subsidiary in the United Kingdom. Financial statements of our foreign subsidiary are translated into U.S. dollars from U.K. pounds (GBP), using period-end exchange rates for assets and liabilities and average exchange rates for revenues and expenses. Adjustments resulting from translating net assets are reported as a separate component of “Accumulated other comprehensive income (loss)” within shareholders’ equity under the caption “Unrealized gain (loss) on foreign currency translation”. In the fourth quarter of 2014, as part of our strategy to focus on our clinical operations, we sold our SC Proven reagent and cell culture business and wound-down our business operations at our Subsidiary SCS UK in Cambridge, UK. At December 31, 2015, the remaining assets and liabilities of our UK subsidiaries included in our Consolidated Balance Sheets are not significant Because we are currently not subject to material foreign currency exchange risk with respect to revenue transactions and cash balances, we have not to date entered into any hedging contracts.
54
Table of Contents
| Item 8. | FINANCIAL STATEMENTS AND SUPPLEMENTARY DATA |
STEMCELLS, INC.
INDEX TO CONSOLIDATED FINANCIAL STATEMENTS
| Page | ||||
| 56 | ||||
| 57 | ||||
| 58 | ||||
| 59 | ||||
| 60 | ||||
| 61 | ||||
| 63 | ||||
55
Table of Contents
REPORT OF INDEPENDENT REGISTERED PUBLIC ACCOUNTING FIRM
Board of Directors and Stockholders
StemCells, Inc.
We have audited the accompanying consolidated balance sheets of StemCells, Inc. (a Delaware corporation) and subsidiaries (the “Company”) as of December 31, 2015 and 2014, and the related consolidated statements of operations, comprehensive loss, stockholders’ equity (deficit) and cash flows for each of the three years in the period ended December 31, 2015. These financial statements are the responsibility of the Company’s management. Our responsibility is to express an opinion on these financial statements based on our audits.
We conducted our audits in accordance with the standards of the Public Company Accounting Oversight Board (United States). Those standards require that we plan and perform the audit to obtain reasonable assurance about whether the financial statements are free of material misstatement. An audit includes examining, on a test basis, evidence supporting the amounts and disclosures in the financial statements an audit also includes assessing the accounting principles used and significant estimates made by management. As well as evaluating the overall financial statement presentation. We believe that our audits provide a reasonable basis for our opinion.
In our opinion, the consolidated financial statements referred to above present fairly, in all material respects, the financial position of StemCells, Inc. and subsidiaries as of December 31, 2015 and 2014, and the results of their operations and their cash flows for each of the three years in the period ended December 31, 2015 in conformity with accounting principles generally accepted in the United States of America.
We also have audited, in accordance with the standards of the Public Company Accounting Oversight Board (United States), the Company’s internal control over financial reporting as of December 31, 2015, based on criteria established in the 2013 Internal Control—Integrated Framework issued by the Committee of Sponsoring Organizations of the Treadway Commission (COSO), and our report dated March 15, 2016 expressed an unqualified opinion thereon.
/s/ GRANT THORNTON LLP
San Francisco, California
March 15, 2016
56
Table of Contents
StemCells, Inc.
| December 31, | ||||||||
| 2015 | 2014 | |||||||
| ASSETS | ||||||||
| Current assets: |
||||||||
| Cash and cash equivalents |
$ | 12,110,565 | $ | 24,987,603 | ||||
| Restricted cash |
2,422,500 | — | ||||||
| Trade receivables |
— | 159,466 | ||||||
| Other receivables |
53,405 | 256,166 | ||||||
| Prepaid assets |
625,296 | 1,017,726 | ||||||
| Deferred financing costs, current |
1,224 | 22,082 | ||||||
| Other assets, current |
— | 64,928 | ||||||
|
|
|
|
|
|||||
| Total current assets |
15,212,990 | 26,507,971 | ||||||
| Property, plant and equipment, net |
5,217,929 | 5,186,958 | ||||||
| Other intangible assets, net |
45,816 | 356,889 | ||||||
| Deferred financing costs, non-current |
— | 1,224 | ||||||
| Other assets, non-current |
742,729 | 373,717 | ||||||
|
|
|
|
|
|||||
| Total assets |
$ | 21,219,464 | $ | 32,426,759 | ||||
|
|
|
|
|
|||||
| LIABILITIES AND STOCKHOLDERS’ EQUITY (DEFICIT) | ||||||||
| Current liabilities: |
||||||||
| Accounts payable |
$ | 2,512,045 | $ | 1,818,831 | ||||
| Accrued expenses and other current liabilities |
5,731,596 | 4,869,710 | ||||||
| Loan payable net of discount, current |
1,417,388 | 4,686,388 | ||||||
| Deferred revenue, current |
16,826 | 16,826 | ||||||
| Capital lease obligation, current |
20,032 | 20,191 | ||||||
| Deferred rent, current |
132,338 | 85,925 | ||||||
|
|
|
|
|
|||||
| Total current liabilities |
9,830,225 | 11,497,871 | ||||||
| Capital lease obligations, non-current |
15,878 | 9,230 | ||||||
| Loan payable net of discount, non-current |
8,916,641 | 10,334,029 | ||||||
| Fair value of warrant liability |
770,964 | 1,684,551 | ||||||
| Deferred rent, non-current |
1,621,338 | 1,734,214 | ||||||
| Deferred revenue, non-current |
29,258 | 46,084 | ||||||
| Other long-term liabilities |
369,370 | 1,250,007 | ||||||
|
|
|
|
|
|||||
| Total liabilities |
21,553,674 | 26,555,986 | ||||||
| Commitments and contingencies (Note 12) |
||||||||
| Stockholders’ equity (deficit): |
||||||||
| Common stock, $0.01 par value; 225,000,000 shares authorized; issued and outstanding 111,348,241 at December 31, 2015 and 68,729,774 at December 31, 2014 |
1,113,483 | 687,298 | ||||||
| Additional paid-in capital |
455,191,582 | 425,389,693 | ||||||
| Accumulated deficit |
(456,686,634 | ) | (420,271,608 | ) | ||||
| Accumulated other comprehensive income |
47,359 | 65,390 | ||||||
|
|
|
|
|
|||||
| Total stockholders’ equity (deficit) |
(334,210 | ) | 5,870,773 | |||||
|
|
|
|
|
|||||
| Total liabilities and stockholders’ equity (deficit) |
$ | 21,219,464 | $ | 32,426,759 | ||||
|
|
|
|
|
|||||
See Notes to Consolidated Financial Statements.
57
Table of Contents
StemCells, Inc.
Consolidated Statements of Operations
| Year Ended December 31, | ||||||||||||
| 2015 | 2014 | 2013 | ||||||||||
| Revenue: |
||||||||||||
| Revenue from licensing agreements, grants and other |
$ | 116,887 | $ | 1,012,391 | $ | 172,297 | ||||||
| Operating expenses: |
||||||||||||
| Research and development |
27,110,909 | 21,503,085 | 19,368,888 | |||||||||
| General and administrative |
9,334,174 | 10,419,620 | 8,834,271 | |||||||||
| Wind-down expenses |
392,230 | — | 61,837 | |||||||||
|
|
|
|
|
|
|
|||||||
| Total operating expenses |
36,837,313 | 31,922,705 | 28,264,996 | |||||||||
|
|
|
|
|
|
|
|||||||
| Operating loss |
(36,720,426 | ) | (30,910,314 | ) | (28,092,699 | ) | ||||||
| Other income (expense): |
||||||||||||
| Change in fair value of warrant liability |
913,587 | 2,422,451 | 3,253,253 | |||||||||
| Impairment of goodwill |
— | (1,910,062 | ) | — | ||||||||
| Impairment of other intangible assets |
(239,241 | ) | (530,100 | ) | — | |||||||
| Interest income |
7,544 | 8,532 | 11,318 | |||||||||
| Interest expense |
(506,319 | ) | (1,295,404 | ) | (1,166,782 | ) | ||||||
| Other income (expense), net |
129,829 | (45,766 | ) | 8,218 | ||||||||
|
|
|
|
|
|
|
|||||||
| Total other income (expense), net |
305,400 | (1,350,349 | ) | 2,106,007 | ||||||||
|
|
|
|
|
|
|
|||||||
| Net loss from continuing operations |
(36,415,026 | ) | (32,260,663 | ) | (25,986,692 | ) | ||||||
| Discontinued operations: |
||||||||||||
| Loss from discontinued operations |
— | (369,357 | ) | (452,467 | ) | |||||||
| Net loss on disposal of assets |
— | (111,254 | ) | — | ||||||||
|
|
|
|
|
|
|
|||||||
| Net loss from discontinued operations |
— | (480,611 | ) | (452,467 | ) | |||||||
|
|
|
|
|
|
|
|||||||
| Net loss |
$ | (36,415,026 | ) | $ | (32,741,274 | ) | $ | (26,439,159 | ) | |||
|
|
|
|
|
|
|
|||||||
| Basic and diluted net loss per share: |
||||||||||||
| Basic and diluted net loss per share from continuing operations |
$ | (0.38 | ) | $ | (0.52 | ) | $ | (0.60 | ) | |||
| Basic and diluted net loss per share from discontinued operations |
— | (0.01 | ) | (0.01 | ) | |||||||
|
|
|
|
|
|
|
|||||||
| Basic and diluted net loss per share |
$ | (0.38 | ) | $ | (0.53 | ) | $ | (0.61 | ) | |||
| Shares used to compute basic and diluted loss per share |
95,807,377 | 61,612,957 | 43,422,001 | |||||||||
See Notes to Consolidated Financial Statements.
58
Table of Contents
StemCells, Inc.
Consolidated Statements of Comprehensive Loss
| Year Ended December 31, | ||||||||||||
| 2015 | 2014 | 2013 | ||||||||||
| Net loss from continuing operations |
$ | (36,415,026 | ) | $ | (32,260,663 | ) | $ | (25,986,692 | ) | |||
| Other comprehensive income (loss) |
||||||||||||
| Unrealized gains (losses) on marketable securities |
— | — | 1,356 | |||||||||
|
|
|
|
|
|
|
|||||||
| Comprehensive loss from continuing operations |
(36,415,026 | ) | (32,260,663 | ) | (25,985,336 | ) | ||||||
| Discontinued operations: |
||||||||||||
| Net loss from discontinued operations |
— | (480,611 | ) | (452,467 | ) | |||||||
| Other comprehensive income (loss) |
(18,031 | ) | (186,711 | ) | 57,568 | |||||||
|
|
|
|
|
|
|
|||||||
| Comprehensive loss from discontinued operations |
(18,031 | ) | (667,322 | ) | (394,899 | ) | ||||||
|
|
|
|
|
|
|
|||||||
| Comprehensive loss |
$ | (36,433,057 | ) | $ | (32,927,985 | ) | $ | (26,380,235 | ) | |||
|
|
|
|
|
|
|
|||||||
See Notes to Consolidated Financial Statements.
59
Table of Contents
StemCells, Inc.
Consolidated Statement of Stockholders’ Equity (Deficit)
| Common Stock | Additional Paid-in Capital |
Accumulated Deficit |
Accumulated Other Comprehensive Income (Loss) |
Total Stockholders’ Equity (Deficit) |
||||||||||||||||||||
| Shares | Amount | |||||||||||||||||||||||
| Balances, December 31, 2012 |
37,506,305 | 375,063 | 374,507,552 | (361,091,175 | ) | 193,177 | 13,984,617 | |||||||||||||||||
| Net loss |
— | — | — | (26,439,159 | ) | — | (26,439,159 | ) | ||||||||||||||||
| Unrealized gain on foreign currency translation |
— | — | — | — | 57,568 | 57,568 | ||||||||||||||||||
| Change in unrealized gain on securities available-for-sale |
— | — | — | — | 1,356 | 1,356 | ||||||||||||||||||
| Issuance of common stock and warrants, net of issuance cost of $2,051,699 |
16,938,575 | 169,385 | 24,710,188 | — | — | 24,879,573 | ||||||||||||||||||
| Common stock issued for external services |
104,911 | 1,049 | 153,062 | — | — | 154,111 | ||||||||||||||||||
| Common stock issued pursuant to employee benefit plan |
82,863 | 829 | 131,242 | — | — | 132,071 | ||||||||||||||||||
| Compensation expense from grant of options and restricted stock units (fair value) |
— | — | 2,322,489 | — | — | 2,322,489 | ||||||||||||||||||
| Exercise of director stock options |
3,452 | 35 | 3,417 | — | — | 3,452 | ||||||||||||||||||
| Exercise and net settlement of restricted stock units |
362,657 | 3,627 | (345,993 | ) | — | — | (342,366 | ) | ||||||||||||||||
| Common stock issued as consideration in the acquisition of a patent portfolio |
139,548 | 1,395 | 198,605 | — | — | 200,000 | ||||||||||||||||||
|
|
|
|
|
|
|
|
|
|
|
|
|
|||||||||||||
| Balances, December 31, 2013 |
55,138,311 | 551,383 | 401,680,562 | (387,530,334 | ) | 252,101 | 14,953,712 | |||||||||||||||||
| Net loss |
— | — | — | (32,741,274 | ) | — | (32,741,274 | ) | ||||||||||||||||
| Unrealized loss on foreign currency translation |
— | — | — | — | (186,711 | ) | (186,711 | ) | ||||||||||||||||
| Issuance of common stock and warrants, net of issuance cost of $1,335,327 |
12,852,221 | 128,522 | 22,230,864 | — | — | 22,359,386 | ||||||||||||||||||
| Common stock issued for external services |
120,149 | 1,202 | 153,506 | — | — | 154,708 | ||||||||||||||||||
| Common stock issued pursuant to employee benefit plan |
115,722 | 1,157 | 182,520 | — | — | 183,677 | ||||||||||||||||||
| Compensation expense from grant of options and restricted stock units (fair value) |
— | — | 1,646,608 | — | — | 1,646,608 | ||||||||||||||||||
| Exercise and net settlement of restricted stock units |
503,371 | 5,034 | (504,367 | ) | — | — | (499,333 | ) | ||||||||||||||||
|
|
|
|
|
|
|
|
|
|
|
|
|
|||||||||||||
| Balances, December 31, 2014 |
68,729,774 | $ | 687,298 | $ | 425,389,693 | $ | (420,271,608 | ) | $ | 65,390 | $ | 5,870,773 | ||||||||||||
| Net loss |
— | — | — | (36,415,026 | ) | — | (36,415,026 | ) | ||||||||||||||||
| Unrealized loss on foreign currency translation |
— | — | — | — | (18,031 | ) | (18,031 | ) | ||||||||||||||||
| Issuance of common stock and warrants, net of issuance cost of $2,015,808 |
41,018,931 | 410,190 | 25,914,375 | — | — | 26,324,565 | ||||||||||||||||||
| Common stock issued for external services |
422,207 | 4,222 | 227,779 | — | — | 232,001 | ||||||||||||||||||
| Common stock issued pursuant to employee benefit plan |
355,004 | 3,550 | 226,715 | — | — | 230,265 | ||||||||||||||||||
| Compensation expense from grant of options and restricted stock units (fair value) |
— | — | 3,833,830 | — | — | 3,833,830 | ||||||||||||||||||
| Exercise and net settlement of restricted stock units |
822,325 | 8,223 | (400,810 | ) | — | — | (392,587 | ) | ||||||||||||||||
|
|
|
|
|
|
|
|
|
|
|
|
|
|||||||||||||
| Balances, December 31, 2015 |
111,348,241 | $ | 1,113,483 | $ | 455,191,582 | $ | (456,686,634 | ) | $ | 47,359 | $ | (334,210 | ) | |||||||||||
|
|
|
|
|
|
|
|
|
|
|
|
|
|||||||||||||
See Notes to Consolidated Financial Statements.
60
Table of Contents
StemCells, Inc.
Consolidated Statements of Cash Flows
| Year Ended December 31, | ||||||||||||
| 2015 | 2014 | 2013 | ||||||||||
| Cash flows from operating activities: |
||||||||||||
| Net loss |
$ | (36,415,026 | ) | $ | (32,741,274 | ) | $ | (26,439,159 | ) | |||
| Adjustments to reconcile net loss to net cash used in operating activities: |
— | |||||||||||
| Depreciation and amortization |
1,125,696 | 1,307,203 | 1,058,725 | |||||||||
| Stock-based compensation |
4,244,408 | 2,034,898 | 2,608,670 | |||||||||
| Amortization of debt discount and issuance costs |
114,180 | 240,021 | 288,951 | |||||||||
| Gain on disposal of fixed assets |
(168,898 | ) | (75,917 | ) | (38,854 | ) | ||||||
| Impairment of intangible asset |
239,241 | 530,100 | — | |||||||||
| Impairment of goodwill |
— | 1,910,062 | — | |||||||||
| Loss on disposal of intangible assets relating to discontinued operations |
— | 186,846 | — | |||||||||
| Fair value of property gifted |
— | 5,671 | — | |||||||||
| Change in fair value of warrant liability |
(913,587 | ) | (2,422,451 | ) | (3,253,253 | ) | ||||||
| Changes in operating assets and liabilities: |
||||||||||||
| Trade receivables |
155,419 | (55,457 | ) | 3,606 | ||||||||
| Other receivables |
199,365 | 192,795 | (298,734 | ) | ||||||||
| Prepaid and other current assets |
507,659 | (465,478 | ) | 801,611 | ||||||||
| Accounts payable and accrued expenses |
292,190 | 2,055,437 | 2,143,917 | |||||||||
| Accrued wind-down expenses |
392,230 | — | (1,102,762 | ) | ||||||||
| Deferred revenue |
(16,826 | ) | (66,925 | ) | (24,270 | ) | ||||||
| Deferred rent |
(66,463 | ) | (5,169 | ) | 435,967 | |||||||
| Other assets non-current |
(369,012 | ) | 17,207 | 493,584 | ||||||||
|
|
|
|
|
|
|
|||||||
| Net cash used in operating activities |
(30,679,424 | ) | (27,352,431 | ) | (23,322,001 | ) | ||||||
| Cash flows from investing activities: |
||||||||||||
| Purchases of marketable debt securities |
— | — | (687,798 | ) | ||||||||
| Sales or maturities of marketable debt securities |
— | — | 14,430,000 | |||||||||
| Purchases of property, plant and equipment |
(1,053,993 | ) | (903,943 | ) | (4,680,796 | ) | ||||||
| Proceeds from sale of property, plant and equipment |
168,713 | 3,500 | 38,500 | |||||||||
| Acquisition of other assets |
— | — | (64,000 | ) | ||||||||
| Proceeds from the disposal of assets related to discontinued operations |
— | 474,821 | — | |||||||||
|
|
|
|
|
|
|
|||||||
| Net (cash used in) provided by investing activities |
(885,280 | ) | (425,622 | ) | 9,035,906 | |||||||
| Cash flows from financing activities: |
||||||||||||
| Proceeds from issuance of common stock, net of issuance costs |
26,324,565 | 18,949,647 | 23,491,597 | |||||||||
| Proceeds from the exercise of warrants, net of issuance costs |
— | 1,974,931 | 530,097 | |||||||||
| Proceeds from the exercise of stock options |
— | — | 3,452 | |||||||||
| Proceeds from loan payable, net of issuance costs |
— | 5,775,543 | 13,558,358 | |||||||||
| Repayment of debt obligations |
(4,778,485 | ) | (3,982,971 | ) | (826,465 | ) | ||||||
| Restricted cash related to debt obligations |
(2,422,500 | ) | — | — | ||||||||
| Repayment of capital lease obligations |
(24,168 | ) | (21,316 | ) | (12,396 | ) | ||||||
| Payments related to net share issuance of stock based awards |
(392,587 | ) | (499,333 | ) | (342,366 | ) | ||||||
|
|
|
|
|
|
|
|||||||
| Net cash provided by financing activities |
18,706,825 | 22,196,501 | 36,402,277 | |||||||||
|
|
|
|
|
|
|
|||||||
| Increase (decrease) in cash and cash equivalents |
(12,857,879 | ) | (5,581,552 | ) | 22,116,182 | |||||||
| Effects of foreign exchange rate changes on cash and cash equivalents |
(19,159 | ) | (16,269 | ) | (2,033 | ) | ||||||
| Cash and cash equivalents, beginning of period |
24,987,603 | 30,585,424 | 8,471,275 | |||||||||
|
|
|
|
|
|
|
|||||||
| Cash and cash equivalents, end of period |
$ | 12,110,565 | $ | 24,987,603 | $ | 30,585,424 | ||||||
|
|
|
|
|
|
|
|||||||
| Supplemental disclosure of cash flow information: |
||||||||||||
| Interest paid |
$ | 506,319 | $ | 479,011 | $ | 427,040 | ||||||
| Supplemental schedule of non-cash investing and financing activities: |
||||||||||||
| Fair value of 329,131 shares issued as consideration under an equity financing agreement (1) |
$ | — | $ | — | $ | 600,006 | ||||||
| Fair value of 139,548 shares issued as consideration in the acquisition of a patent portfolio (2) |
$ | — | $ | — | $ | 200,000 | ||||||
| Equipment acquired under a capital lease (3) |
$ | 28,882 | $ | — | $ | 43,600 | ||||||
|
|
|
|
|
|
|
|||||||
61
Table of Contents
| (1) | In June 2013, we entered into an agreement with an institutional investor, under which we had the right to sell up to $30.0 million of common stock to the institutional investor. In consideration for entering into the agreement, we issued 329,131 shares of our common stock to the institutional investor. We will not receive any cash proceeds from the issuance of these 329,131 shares. All shares sold under this agreement were offered under our shelf registration statement previously filed with, and declared effective by, the SEC. In October 2013, we terminated the agreement without any cost or penalty. |
| (2) | In October, 2013, we acquired from NeuroSpheres a patent portfolio we licensed on an exclusive worldwide basis, including the six patents that were the subject of our patent infringement litigation against Neuralstem. As consideration for the patents, we issued 139,548 shares of unregistered common stock with a fair value of $200,000 to NeuroSpheres. In connection with the patent acquisition, all preexisting agreements were terminated. The acquisition relieves us from further milestone and royalty payments to NeuroSpheres. |
| (3) | Represents the present value of future minimum capital lease payments for equipment leased. |
See notes to the Consolidated Financial Statements
62
Table of Contents
StemCells, Inc.
Notes to Consolidated Financial Statements
December 31, 2015
Note 1. Summary of Significant Accounting Policies
Nature of Business
StemCells, Inc., a Delaware corporation, is a biopharmaceutical company that operates in one segment, the research, development, and commercialization of cell-based therapeutics and related technologies.
The accompanying consolidated financial statements have been prepared on the basis that we will continue as a going concern. Since inception, we have incurred annual losses and negative cash flows from operations and have an accumulated deficit of approximately $457 million at December 31, 2015. We have not derived significant revenue from the sale of products, and do not expect to receive significant revenue from product sales for at least several years. We may never be able to realize sufficient revenue to achieve or sustain profitability in the future.
We expect to incur additional operating losses over the foreseeable future. We have limited liquidity and capital resources and must obtain significant additional capital and other resources in order to sustain our product development efforts, to provide funding for the acquisition of technologies and intellectual property rights, preclinical and clinical testing of our anticipated products, pursuit of regulatory approvals, acquisition of capital equipment, laboratory and office facilities, establishment of production capabilities, general and administrative expenses and other working capital requirements. We rely on our cash reserves, proceeds from equity and debt offerings, proceeds from the transfer or sale of intellectual property rights, equipment, facilities or investments, government grants and funding from collaborative arrangements, to fund our operations. Funding may not be available when needed — at all or on terms acceptable to us. If we exhaust our cash reserves and are unable to obtain adequate financing, we may be unable to meet our operating obligations and we may be required to initiate bankruptcy proceedings. The financial statements do not include any adjustments to reflect the possible future effects on the recoverability and classification of assets or the amounts and classification of liabilities that may result from the outcome of this uncertainty.
Principles of Consolidation
The consolidated financial statements include the accounts of StemCells, Inc., and our wholly-owned subsidiaries, including StemCells California, Inc., Stem Cell Sciences Holdings Ltd (SCS), and Stem Cell Sciences (UK) Ltd (SCS UK). All significant intercompany accounts and transactions have been eliminated.
Reclassifications
Certain reclassifications have been made to the prior year financial statements in order to conform to the current year’s presentation. These reclassifications relate to the wind-down of our business operations at our Subsidiary SCS UK (See Note 19, “Discontinued Operations”).
Use of Estimates
The preparation of financial statements in conformity with generally accepted accounting principles requires management to make judgments, assumptions and estimates that affect the amounts reported in our consolidated financial statements and accompanying notes. Actual results could differ materially from those estimates.
Significant estimates include the following:
| • | the fair value of share-based awards recognized as compensation (see Note 11, “Stock-Based Compensation”); |
63
Table of Contents
| • | valuation allowance against net deferred tax assets (see Note 18, “Income Taxes”); |
| • | the fair value of warrants recorded as a liability (see Note 13, “Warrant Liability”); and |
Financial Instruments
Cash Equivalents, Restricted Cash, and Marketable Securities
All money market and highly liquid investments with a maturity of 90 days or less at the date of purchase are classified as cash equivalents. Highly liquid investments with maturities of 365 days or less not previously classified as cash equivalents are classified as marketable securities, current. Investments with maturities greater than 365 days are classified as marketable securities, non-current. Our restricted cash is held in a money market account.
Trade and Other Receivables
Our receivables generally consist of interest income on our financial instruments, revenue from licensing agreements and grants. Because dollar amounts for our receivables are not material we regard the associated credit risk to be minimal.
Estimated Fair Value of Financial Instruments
The estimated fair values of cash and cash equivalents, receivables and accounts payable approximates their carrying values due to the short maturities of these instruments.
Property, Plant and Equipment
Property, plant and equipment, including those held under capital lease, are stated at cost. Depreciation is computed by use of the straight-line method over the estimated useful lives of the assets, or the lease term if shorter, as follows:
| Building and improvements |
3 - 20 years | |||
| Machinery and equipment |
3 - 10 years | |||
| Furniture and fixtures |
3 - 10 years |
Repairs and maintenance costs are expensed as incurred.
Discontinued Operations
Effective January 1, 2015, in accordance with amended accounting guidance, the Company reports a disposal of a component of an entity or a group of components of an entity in discontinued operations only if the disposal represents a strategic shift and will have a major effect on an entity’s operations and financial results. The guidance in effect prior to fiscal year 2015 required the results of operations and cash flows of a business that either has been disposed of or is classified as held-for-sale are reported in discontinued operations if the operations and cash flows of the component have been or will be eliminated from our ongoing operations as a result of the disposal transaction and we will not have any significant continuing involvement in the operations of the component after the disposal transaction. We present the operations of a business that meet this criteria as a discontinued operation, and retrospectively reclassify operating results for all prior periods presented. In the fourth quarter of 2014, as part of our strategy to focus on our clinical operations, we sold our SC Proven reagent and cell culture business and wound-down our business operations at our Subsidiary SCS UK in Cambridge, UK. The results of operations for this component have been classified as discontinued operations for all periods in our Consolidated Statement of Operations.
Goodwill
Goodwill is not amortized but subject to annual impairment tests. On April 1, 2009, we acquired the operations of SCS for an aggregate purchase price of approximately $5,135,000. Approximately 42% of the purchase price was allocated to Goodwill. The acquired operations included proprietary cell technologies relating
64
Table of Contents
to embryonic stem cells, induced pluripotent stem (iPS) cells, and tissue-derived (adult) stem cells; expertise and infrastructure for providing cell-based assays for drug discovery; a cell culture products business; and an intellectual property portfolio with claims relevant to cell processing, reprogramming and manipulation, as well as to gene targeting and insertion. In the fourth quarter of 2014, as part of our strategy to focus on our clinical operations, we sold our SC Proven reagent and cell culture business and wound-down our business operations at our Subsidiary SCS UK in Cambridge, UK. We also determined that we could not predict the future cash flows if any from the intellectual property portfolio acquired. Based on these factors, we determined that the Goodwill related to the acquisition was impaired and in the fourth quarter of 2014, wrote off its carrying value of approximately $1,910,000.
Intangible Assets (Patent and License Costs)
Other intangible assets, net were approximately $46,000 at December 31, 2015. Intangible assets with finite useful lives are amortized generally on a straight-line basis over the periods benefited. Intangible assets deemed to have indefinite lives are not amortized but are subject to annual impairment tests. Intangible assets are also reviewed for impairment whenever events or changes in circumstances indicate the carrying amount of an asset may not be recoverable. In December 2014, based on our decision to focus all of our efforts on moving our clinical programs forward, we determined we could not predict the future cash flows from the intangible in process research and development (IPR&D) asset related to our Transgenic Rat Program and determined that the intangible asset was impaired and wrote off the approximately $530,000 carrying value of the asset. In the fourth quarter of 2015, based on our annual impairment tests, we determined that certain capitalized patent and license costs were impaired and wrote off approximately $239,000.
Prior to fiscal year 2001, we capitalized certain patent costs, which are being amortized over the estimated life of the patent and would be expensed at the time such patents are deemed to have no continuing value. Since 2001, all patent costs are expensed as incurred. License costs are capitalized and amortized over the estimated life of the license agreement.
Impairment of Long-Lived Tangible Assets
Long-lived assets are reviewed for impairment whenever events or changes in circumstances indicate the carrying amount of an asset may not be recoverable. If property, plant, and equipment are considered to be impaired, the impairment to be recognized equals the amount by which the carrying value of the assets exceeds its estimated fair market value. No such impairment was recognized during the year 2014 and 2015.
Loan Payable
In April 2013, we entered into a Loan Agreement with Silicon Valley Bank (SVB) and received loan proceeds of $9,900,000, net of a $100,000 cash discount. The loan has a three-year term and bears interest at an annual rate of 6%. The loan obligations are secured by a first priority security interest on substantially all of our assets excluding intellectual property. There is also a final $1,000,000 fee payable at the end of the term which is being expensed over the term of the loan using the effective interest method. In conjunction with the Loan Agreement, we issued to SVB a ten year warrant to acquire 293,531 shares of common stock at an exercise price of $1.7034 per share. The warrant is immediately exercisable and expires in April 2023. We estimated the fair value of the warrant to be approximately $388,000 using the Black-Scholes option pricing model. We applied the relative fair value method to allocate the $9,900,000 net proceeds between the loan and warrant. The approximately $388,000 fair value allocated to the warrant was recorded as an increase to additional paid-in capital and as a discount to loan payable. Approximately $9,512,000 was assigned to the loan and was recorded as the initial carrying amount of the loan payable, net of discount. The approximately $388,000 fair value of the warrant and the $100,000 cash discount are both being amortized as additional interest expense over the term of the loan using the effective interest rate method. We also incurred loan issuance costs of approximately $117,000, which are recorded as deferred financing costs on the accompanying consolidated balance sheet and are being amortized to interest expense over the term of the Loan Agreement using the effective interest rate
65
Table of Contents
method. The effective interest rate used to amortize the deferred financing costs and the discount (including the fair value of the warrant and the cash discount), and for the accretion of the final payment, is 9.0%. We are required to maintain certain financial and other covenants set forth in the Loan Agreement. In December 2015, to remain in compliance with the terms of the agreement, we entered into an amendment to the Loan Agreement that required us to maintain with SVB a restricted money market account with a minimum aggregate balance of $2,422,500. As part of the amendment, we pledged to SVB a security interest in the restricted money market account. The pledged restricted money market account will be released on the earlier of date we repay the outstanding principal, interest and fees or (i) we receive at least $18,000,000 of net new cash proceeds from investors on terms and conditions reasonably acceptable to SVB and (ii) we have cash and cash equivalents at SVB sufficient to support six months operations.
In April 2013, we entered into an agreement with the California Institute for Regenerative Medicine (CIRM) under which CIRM will provide up to approximately $19.3 million as a forgivable loan, in accordance with mutually agreed upon terms and conditions and CIRM regulations. The CIRM loan was to help fund preclinical development of our HuCNS-SC cells for Alzheimer’s disease. Between July 2013 and August 2014, we received in aggregate, approximately $9.6 million as disbursements of the loan provided under the CIRM Loan Agreement. However in December 2014, as findings under this pre-clinical study in Alzheimer’s disease did not meet pre-determined criteria for ongoing funding for this program by CIRM, we decided to wind down this pre-clinical study which had been funded in part by the CIRM loan agreement. Under the terms of the CIRM loan agreement, principal amount of approximately $8,917,000 and accrued interest of approximately $243,000 were forgiven. However, authoritative accounting guidance requires certain conditions (which includes a legal release from the creditor) to be met before a liability can be extinguished and derecognized. In February 2015, we repaid CIRM approximately $679,000 of the aggregate loan proceeds received.
Warrant Liability
We account for our warrants in accordance with U.S. GAAP which defines how freestanding contracts that are indexed to and potentially settled in a company’s own stock should be measured and classified. Authoritative accounting guidance prescribes that only warrants issued by us under contracts that cannot be net-cash settled, and are both indexed to and settled in our common stock, can be classified as equity. As part of our December 2011 financing, we issued Series A Warrants with a five year term to purchase 8,000,000 shares at $1.40 per share and Series B Warrants with a ninety trading day term to purchase 8,000,000 units at $1.25 per unit. Each unit underlying the Series B Warrants consisted of one share of our common stock and one Series A Warrant. In the first and second quarter of 2012, an aggregate of 2,700,000 Series B Warrants were exercised. For the exercise of these warrants, we issued 2,700,000 shares of our common stock and 2,700,000 Series A Warrants. The remaining 5,300,000 Series B Warrants expired unexercised by their terms on May 2, 2012. The Series A Warrants contain full ratchet anti-dilution price protection so that, in most situations, upon the issuance of any common stock or securities convertible into common stock at a price below the then-existing exercise price of the Series A Warrants, the Series A exercise price will be reset to the lower common stock sales price. As a result of our April 2015 financing, the exercise price of the outstanding Series A warrants were reduced from $1.40 per share to $0.70 per share. Subsequently, as a result of our sale of shares of our common stock under a sales agreement entered into in 2009 and amended in 2012, the exercise price of the outstanding Series A warrants were reduced from $0.70 per share to $0.52 per share. As terms of the Series A Warrants do not meet the specific conditions for equity classification, we are required to classify the fair value of these warrants as a liability, with subsequent changes in fair value to be recorded as income (loss) due to change in fair value of warrant liability. The fair value of the Series A Warrants is determined using a Monte Carlo simulation model (see Note 13, “Warrant Liability”). The fair value is affected by changes in inputs to these models including our stock price, expected stock price volatility, the contractual term, and the risk-free interest rate. The use of a Monte Carlo simulation model requires input of additional assumptions including the progress of our research and development (R&D) programs and its affect on potential future financings. We will continue to classify the fair value of the warrants as a liability until the warrants are exercised, expire or are amended in a way that would no longer require these warrants to be classified as a liability. The estimated fair value of our warrant liability at December 31, 2015, was approximately $771,000.
66
Table of Contents
Revenue Recognition
We recognize revenue resulting from licensing agreements and government grants.
Licensing agreements — We currently recognize revenue resulting from the licensing and use of our technology and intellectual property. Such licensing agreements may contain multiple elements, such as up-front fees, payments related to the achievement of particular milestones and royalties. Revenue from up-front fees for licensing agreements that contain multiple elements are generally deferred and recognized on a straight-line basis over the term of the agreement. Fees associated with substantive at risk performance-based milestones are recognized as revenue upon completion of the scientific or regulatory event specified in the agreement, and royalties received are recognized as earned. Revenue from licensing agreements is recognized net of a fixed percentage due to licensors as royalties.
Government grants — Grant revenue from government agencies are funds received to cover specific expenses and are recognized as earned upon either the incurring of reimbursable expenses directly related to the particular research plan or the completion of certain development milestones as defined within the terms of the relevant collaborative agreement or grant.
Research and Development Costs
Our research and development expenses consist primarily of salaries and related personnel expenses; costs associated with clinical trials and regulatory submissions; costs associated with process development and quality assurance activities to scale the production of our HuCNS-SC cells to meet the requirements of Phase III clinical trials; costs associated with preclinical activities such as toxicology studies; certain patent-related costs such as licensing; facilities-related costs such as depreciation; lab equipment and supplies. Clinical trial expenses include payments to vendors such as clinical research organizations, contract manufacturers, clinical trial sites, laboratories for testing clinical samples and consultants. All research and development costs are expensed as incurred.
Stock-Based Compensation
We expense the estimated fair value of our stock-based compensation awards. The estimated fair value is calculated using the Black-Scholes option pricing model. The compensation cost we record for these awards are based on their grant-date fair value as estimated and amortized over their vesting period. At the end of each reporting period we estimate forfeiture rates based on our historical experience within separate groups of employees and adjust stock-based compensation expense accordingly. See Note 11, “Stock-Based Compensation” for further information.
Restructuring Costs
On December 18, 2015, we committed to a strategic realignment to fully focus our resources on our proprietary HuCNS-SC platform technology for the treatment of chronic spinal cord injury. As part of our strategic realignment, we suspended further enrollment of patients in our Phase II Radiant Study in geographic atrophy of age-related macular degeneration, while we seek a partner to fund continued development of HuCNS-SC cells as a potential treatment of retinal disorders. We intend to continue following patients already treated in the study through their 12-month follow up visits. As part of the realignment, we initiated a reduction in our workforce by 17 full-time employees, or approximately 25% of our workforce. In connection with the reduction in workforce, we recorded a one-time charge for severance and related expenses of approximately $392,000 in the fourth quarter of 2015. The $392,000 is part of our accrued expenses on our accompanying consolidated balance sheets and is classified as wind-down expenses in our consolidated statement of operations.
67
Table of Contents
Income Taxes
When accounting for income taxes, we recognize deferred tax assets and liabilities for the expected future tax consequences of temporary differences between the carrying amounts and the tax bases of assets and liabilities. Income tax receivables and liabilities and deferred tax assets and liabilities are recognized based on the amounts that more likely than not will be sustained upon ultimate settlement with taxing authorities.
Developing our provision for income taxes and analyzing our uncertain tax positions requires significant judgment and knowledge of federal and state income tax laws, regulations and strategies, including the determination of deferred tax assets and liabilities and, any valuation allowances that may be required for deferred tax assets.
We assess the realization of our deferred tax assets to determine whether an income tax valuation allowance is required. Based on such evidence that can be objectively verified, we determine whether it is more likely than not that all or a portion of the deferred tax assets will be realized. The main factors that we consider include:
| • | cumulative losses in recent years; |
| • | income/losses expected in future years; and |
| • | the applicable statute of limitations. |
Tax benefits associated with uncertain tax positions are recognized in the period in which one of the following conditions is satisfied: (1) the more likely than not recognition threshold is satisfied; (2) the position is ultimately settled through negotiation or litigation; or (3) the statute of limitations for the taxing authority to examine and challenge the position has expired. Tax benefits associated with an uncertain tax position are derecognized in the period in which the more likely than not recognition threshold is no longer satisfied.
We concluded that the realization of deferred tax assets is dependent upon future earnings, if any, the timing and amount of which are uncertain. Accordingly, the net deferred tax assets have been fully offset by a valuation allowance. Deferred tax liabilities related to indefinite-lived assets that cannot be used as a source of taxable income to support the realization of deferred tax assets are reported as a net deferred tax liability.
Net Loss per Share
Basic net loss per share is computed based on the weighted-average number of shares of our common stock outstanding during the period. Diluted net loss per share is computed based on the weighted-average number of shares of our common stock and other dilutive securities.
The following are the basic and dilutive net loss per share computations for the last three fiscal years:
| 2015 | 2014 | 2013 | ||||||||||
| Net loss from continuing operations |
$ | (36,415,026 | ) | $ | (32,260,663 | ) | $ | (25,986,692 | ) | |||
| Net loss from discontinued operations |
— | (480,611 | ) | (452,467 | ) | |||||||
|
|
|
|
|
|
|
|||||||
| Net loss |
$ | (36,415,026 | ) | $ | (32,741,274 | ) | $ | (26,439,159 | ) | |||
|
|
|
|
|
|
|
|||||||
| Weighted average shares outstanding used to compute basic and diluted net loss per share |
95,807,377 | 61,612,957 | 43,422,001 | |||||||||
| Basic and diluted net loss per share from continuing operations |
$ | (0.38 | ) | $ | (0.52 | ) | $ | (0.60 | ) | |||
| Basic and diluted net loss per share from discontinued operations |
$ | — | $ | (0.01 | ) | $ | (0.01 | ) | ||||
|
|
|
|
|
|
|
|||||||
| Basic and diluted net loss per share |
$ | (0.38 | ) | $ | (0.53 | ) | $ | (0.61 | ) | |||
|
|
|
|
|
|
|
|||||||
68
Table of Contents
Outstanding options, warrants and restricted stock units were excluded from the computation of diluted net loss per share because the effect would have been anti-dilutive for all periods presented below:
| 2015 | 2014 | 2013 | ||||||||||
| Outstanding options |
2,079,129 | 302,729 | 428,258 | |||||||||
| Restricted stock units |
8,442,519 | 3,374,940 | 3,326,282 | |||||||||
| Outstanding warrants |
44,277,849 | 23,478,181 | 16,267,659 | |||||||||
|
|
|
|
|
|
|
|||||||
| Total |
54,799,497 | 27,155,850 | 20,022,199 | |||||||||
|
|
|
|
|
|
|
|||||||
In August 2015, 9,604,520 warrants expired unexercised by their terms. These warrants were issued as part of a financing transaction in July 2014.
Comprehensive Income (Loss)
Comprehensive income (loss) is comprised of net losses and other comprehensive income (or “OCI”). OCI includes certain changes in stockholders’ equity that are excluded from net losses. Specifically, we include in OCI changes in unrealized gains and losses on our marketable securities and unrealized gains and losses on foreign currency translations.
The components of our accumulated OCI, as of December 31 of each year shown, are as follows:
| 2015 | 2014 | |||||||
| Unrealized gain on foreign currency translation |
$ | 47,359 | $ | 65,390 | ||||
|
|
|
|
|
|||||
Recent Accounting Pronouncements
In June 2014, the Financial Accounting Standards Board (“FASB”) issued Accounting Standards Update (“ASU”) 2014-12, “Accounting for Share-Based Payments When the Terms of an Award Provide That a Performance Target Could Be Achieved after the Requisite Service Period”. The ASU requires that a performance target that affects vesting, and that could be achieved after the requisite service period, be treated as a performance condition. A reporting entity should apply existing guidance in Topic 718 as it relates to awards with performance conditions that affect vesting to account for such awards. In July 2015, the FASB voted to defer the effective date of this ASU for one year, revising the effective date for interim and annual periods beginning after December 15, 2016. Early adoption is permitted. We do not expect the adoption of this ASU will have a material impact on our Consolidated Financial Statements or related disclosures.
In August 2014, the Financial Accounting Standards Board (“FASB”) issued Accounting Standards Update (“ASU”) No. 2014-15, “Disclosure of Uncertainties about an Entity’s Ability to Continue as a Going Concern,” to provide guidance on management’s responsibility in evaluating whether there is substantial doubt about a company’s ability to continue as a going concern and to provide related footnote disclosures. This update is effective for annual periods ending after December 15, 2016, and interim periods within annual periods beginning after December 15, 2016. Early application is permitted for annual or interim reporting periods for which the financial statements have not previously been issued. We do not expect the adoption of ASU 2014-15 to have a material impact on our Consolidated Financial Statements or related disclosures.
In April 2015, the FASB issued ASU 2015-03, “Interest—Imputation of Interest” , which amends the presentation of debt issuance costs in the balance sheet as a direct deduction from the carrying amount of the related debt liability rather than as a deferred charge as presented under current guidance. ASU 2015-03 is effective for annual and interim periods beginning after December 15, 2015, and must be retrospectively applied. Early adoption is permitted. We do not expect the adoption of this amendment to have a material impact on our Consolidated Financial Statements or related disclosures.
69
Table of Contents
In January 2016, the FASB issued ASU 2015-01, “Financial Instruments—Overall”, the amendments in this update require all equity investments to be measured at fair value with changes in the fair value recognized through net income (other than those accounted for under equity method of accounting or those that result in consolidation of the investee). The amendments in this update also require an entity to present separately in other comprehensive income the portion of the total change in the fair value of a liability resulting from a change in the instrument-specific credit risk when the entity has elected to measure the liability at fair value in accordance with the fair value option for financial instruments. For public business entities, the amendments in this update are effective for fiscal years beginning after December 15, 2017, including interim periods within those fiscal years. We do not expect the adoption of ASU 2016-01 to have a significant impact on our Consolidated Financial Statements or related disclosures.
Note 2. Financial Instruments
Cash, cash equivalents, and restricted cash
The following table summarizes the fair value of our cash, cash equivalents and restricted cash:
| Amortized Cost |
Gross Unrealized Gains |
Gross Unrealized Losses |
Fair Value | |||||||||||||
| December 31, 2015 |
||||||||||||||||
| Cash |
$ | 830,190 | $ | — | $ | — | $ | 830,190 | ||||||||
| Cash equivalents (money market accounts) |
11,280,375 | — | — | 11,280,375 | ||||||||||||
| Restricted cash (money market accounts) |
2,422,500 | — | — | 2,422,500 | ||||||||||||
|
|
|
|
|
|
|
|
|
|||||||||
| Total cash, cash equivalents, and restricted cash |
$ | 14,533,065 | $ | — | $ | — | $ | 14,533,065 | ||||||||
|
|
|
|
|
|
|
|
|
|||||||||
| December 31, 2014 |
||||||||||||||||
| Cash |
$ | 1,398,928 | $ | — | $ | — | $ | 1,398,928 | ||||||||
| Cash equivalents (money market accounts) |
23,588,675 | — | — | 23,588,675 | ||||||||||||
|
|
|
|
|
|
|
|
|
|||||||||
| Total cash and cash equivalents |
$ | 24,987,603 | $ | — | $ | — | $ | 24,987,603 | ||||||||
|
|
|
|
|
|
|
|
|
|||||||||
At December 31, 2015, our investments in money market accounts are through a money market fund that invests in high quality, short-term money market instruments which are classified as cash equivalents in the accompanying Consolidated Balance Sheet due to their short maturities. The investment seeks to provide the highest possible level of current income while still maintaining liquidity and preserving capital. From time to time, we carry cash balances in excess of federally insured limits.
We do not hold any investments that were in a material unrealized loss position as of December 31, 2015.
Note 3. Fair Value Measurement
Fair value is defined as an exit price, representing the amount that would be received to sell an asset or paid to transfer a liability in an orderly transaction between market participants. As such, fair value is a market-based measurement that should be determined based on assumptions that market participants would use in pricing an asset or a liability. As a basis for considering such assumptions, we are required to apply a three-tier value hierarchy, which prioritizes the inputs used in the valuation methodologies in measuring fair value. The three levels of the fair value hierarchy are:
Level 1 — Observable inputs that reflect quoted prices (unadjusted) for identical assets or liabilities in active markets.
Level 2 — Directly or indirectly observable inputs other than in Level 1, that include quoted prices for similar assets or liabilities in active markets or quoted prices for identical or similar assets or liabilities in markets that are not active.
70
Table of Contents
Level 3 — Unobservable inputs which are supported by little or no market activity that reflects the reporting entity’s own assumptions about the assumptions that market participants would use in pricing the asset or liability.
The fair value hierarchy also requires an entity to maximize the use of observable inputs and minimize the use of unobservable inputs when measuring fair value. Assets measured at fair value as of December 31, 2015 and 2014 are classified below based on the three fair value hierarchy tiers described above.
Our cash equivalents are classified as Level 1 because they are valued primarily using quoted market prices.
We estimated the fair value of our loan payable using the net present value of the payments discounted at an effective interest rate. We believe the estimates used to measure the fair value of our loan payable constitute Level 3 inputs.
Our liability for warrants issued in our 2011 financing is classified as Level 3 as the liability is valued using a Monte Carlo simulation model. Some of the significant inputs used to calculate the fair value of warrant liability include our stock price on the valuation date, expected volatility of our common stock as traded on NASDAQ, and risk-free interest rates that are derived from the yield on U.S. Treasury debt securities, all of which are observable from active markets. However, the use of a Monte Carlo simulation model requires the input of additional subjective assumptions including management’s assumptions regarding the likelihood of a re-pricing of these warrants pursuant to anti-dilution provisions and the progress of our R&D programs and its affect on potential future financings.
The following table presents our financial assets and liabilities measured at fair value as of December 31, 2015:
| Fair Value Measurement at Reporting Date Using |
||||||||||||
| Quoted Prices in Active Markets for Identical Assets (Level 1) |
Unobservable Inputs (Level 3) |
As of December 31, 2015 |
||||||||||
| Financial assets |
||||||||||||
| Cash equivalents: |
||||||||||||
| Money market funds |
$ | 2,544,475 | $ | — | $ | 2,544,475 | ||||||
| U.S. Treasury debt obligations |
11,158,400 | — | 11,158,400 | |||||||||
|
|
|
|
|
|
|
|||||||
| Total financial assets |
$ | 13,702,875 | $ | — | $ | 13,702,875 | ||||||
|
|
|
|
|
|
|
|||||||
| Financial liabilities |
||||||||||||
| Loan payable net of discounts |
$ | — | $ | 10,334,029 | $ | 10,334,029 | ||||||
| Warrant liabilities |
— | 770,964 | 770,964 | |||||||||
|
|
|
|
|
|
|
|||||||
| Total financial liabilities |
$ | — | $ | 11,104,993 | $ | 11,104,993 | ||||||
|
|
|
|
|
|
|
|||||||
Level 3 Reconciliation
The following table presents a roll forward for liabilities measured at fair value using significant unobservable inputs (Level 3) for 2015.
| Warrant Liabilities |
||||
| Balance at December 31, 2014 |
$ | 1,684,551 | ||
| Add change in fair value of warrants |
(913,587 | ) | ||
|
|
|
|||
| Balance at December 31, 2015 |
$ | 770,964 | ||
|
|
|
|||
71
Table of Contents
| Loan Payable |
||||
| Balance at December 31, 2014 |
$ | 15,020,417 | ||
| Less repayments of principal |
(4,778,485 | ) | ||
| Add accretion of discount |
92,097 | |||
|
|
|
|||
| Balance at December 31, 2015 |
$ | 10,334,029 | ||
|
|
|
|||
| Current portion |
$ | 1,417,388 | ||
| Non-current portion |
8,916,641 | |||
|
|
|
|||
| Balance at December 31, 2015 |
$ | 10,334,029 | ||
|
|
|
|||
Note 4. Property, Plant and Equipment
Property, plant and equipment balances at December 31 are summarized below:
| 2015 | 2014 | |||||||
| Building and improvements |
$ | 3,608,588 | $ | 6,794,556 | ||||
| Machinery and equipment |
8,530,203 | 8,161,291 | ||||||
| Furniture and fixtures |
338,259 | 639,909 | ||||||
|
|
|
|
|
|||||
| 12,477,050 | 15,595,756 | |||||||
| Less accumulated depreciation and amortization |
(7,259,121 | ) | (10,408,798 | ) | ||||
|
|
|
|
|
|||||
| Property, plant and equipment, net |
$ | 5,217,929 | $ | 5,186,958 | ||||
|
|
|
|
|
|||||
Depreciation and amortization expense was approximately $1,054,000 in 2015, $1,008,000 in 2014, and $789,000 in 2013.
Note 5. Other Intangible Assets
Other intangible assets, net were approximately $46,000 at December 31, 2015. Intangible assets with finite useful lives are amortized generally on a straight-line basis over the periods benefited. Intangible assets deemed to have indefinite lives are not amortized but are subject to annual impairment tests. Intangible assets are also reviewed for impairment whenever events or changes in circumstances indicate the carrying amount of an asset may not be recoverable. In December 2014, based on our decision to focus all of our efforts on moving our clinical programs forward, we determined we could not predict the future cash flows from the intangible IPR&D asset related to our Transgenic Rat Program and determined that the intangible asset was impaired and wrote off the approximately $530,000 carrying value of the asset. In the fourth quarter of 2015, based on our annual impairment tests, we determined that certain capitalized patent and license costs were impaired and wrote off approximately $239,000.
The components of our other intangible assets at December 31, 2015 are summarized below:
| Other Intangible Asset Class |
Cost | Accumulated Amortization |
Write Off/ Impairment |
Net Carrying Amount |
Weighted- Average Amortization Period |
|||||||||||||||
| Patents |
1,243,612 | (958,555 | ) | (239,241 | ) | 45,816 | 17.0 years | |||||||||||||
|
|
|
|
|
|
|
|
|
|
|
|||||||||||
Amortization expense was approximately $72,000 in 2015, $299,000 in 2014, and $269,000 in 2013.
72
Table of Contents
The expected future annual amortization expense for each of the next five years based on current balances of our intangible assets is as follows:
| For the year ending December 31: |
||||
| 2016 |
$ | 29,529 | ||
| 2017 |
$ | 16,287 | ||
| 2018 |
$ | — | ||
| 2019 |
$ | — | ||
| 2020 |
$ | — |
Note 6. Other Assets
Other assets, non-current at December 31 are summarized below:
| 2015 | 2014 | |||||||
| Security deposit (buildings and equipment lease) |
$ | 373,717 | $ | 373,717 | ||||
| Deposit for contractual services |
369,012 | — | ||||||
|
|
|
|
|
|||||
| Total Other Assets |
$ | 742,729 | $ | 373,717 | ||||
|
|
|
|
|
|||||
Note 7. Accounts Payable
Accounts payable at December 31 are summarized below:
| 2015 | 2014 | |||||||
| External services |
$ | 1,995,302 | $ | 1,352,710 | ||||
| Supplies |
476,544 | 339,762 | ||||||
| Other |
40,199 | 126,359 | ||||||
|
|
|
|
|
|||||
| Total accounts payable |
$ | 2,512,045 | $ | 1,818,831 | ||||
|
|
|
|
|
|||||
Note 8. Accrued Expenses and Other Current Liabilities
Accrued expenses at December 31 are summarized below:
| 2015 | 2014 | |||||||
| External services |
$ | 1,949,398 | $ | 2,152,770 | ||||
| Employee compensation |
2,758,798 | 2,415,826 | ||||||
| Other |
1,023,400 | 301,114 | ||||||
|
|
|
|
|
|||||
| Total accrued expenses and other current liabilities |
$ | 5,731,596 | $ | 4,869,710 | ||||
|
|
|
|
|
|||||
Note 9. Other Long-Term Liabilities
Other long-term liabilities at December 31 are summarized below:
| 2015 | 2014 | |||||||
| Accrued interest on loan payable |
$ | 242,930 | $ | 1,093,568 | ||||
| Employee compensation |
126,440 | 156,439 | ||||||
|
|
|
|
|
|||||
| Total other long-term liabilities |
$ | 369,370 | $ | 1,250,007 | ||||
|
|
|
|
|
|||||
73
Table of Contents
Note 10. Restructuring Costs
On December 18, 2015, we committed to a strategic realignment to fully focus our resources on our proprietary HuCNS-SC platform technology for the treatment of chronic spinal cord injury. As part of our strategic realignment, we have suspended further enrollment of patients in our Phase II Radiant Study in geographic atrophy of age-related macular degeneration, while we seek a partner to fund continued development of HuCNS-SC cells as a potential treatment of retinal disorders. We intend to continue following patients already treated in the study through their 12-month follow up visits. As part of the realignment, we initiated a reduction in our workforce by 17 full-time employees, or approximately 25% of our workforce. In connection with the reduction in workforce, we recorded a one-time charge for severance and related expenses of approximately $392,000 in the fourth quarter of 2015. The $392,000 is part of our accrued expenses and accrued liabilities on our accompanying consolidated balance sheets and is classified as wind-down expenses in our consolidated statement of operations. We disbursed the severance payments in the first quarter of 2016.
Note 11. Stock-Based Compensation
We currently grant stock-based compensation under two equity incentive plans (2006 and 2013 Equity Incentive Plans) approved by the Company’s stockholders and one plan adopted in 2012 pursuant to NASDAQ Listing Rule 5635(c)(4) concerning inducement grants for new employees (our “2012 Commencement Incentive Plan”). As of December 31, 2015, we had 6,207,871 shares available to grant under the above mentioned plans. At our annual stockholders meeting held on June 12, 2007, our stockholders approved an amendment to our 2006 Equity Incentive Plan to provide for an annual increase in the number of shares of common stock available for issuance under the plan each January 1 (beginning January 1, 2008) equal to 4% of the outstanding common shares as of that date. The amendment further provided an aggregate limit of 3,000,000 shares issuable pursuant to incentive stock option awards under the plan. At our annual stockholders meeting held on December 20, 2013, our stockholders approved our 2013 Equity Incentive Plan to grant stock-based compensation of up to an initial 6,000,000 shares, plus an increase of 4% per year of the outstanding number of shares of our common stock beginning in January 1, 2015. Under the two stockholder-approved plans we may grant incentive stock options, nonqualified stock options, stock appreciation rights, restricted stock, restricted stock units, 401(k) Plan employer match in form of shares and performance-based shares to our employees, directors and consultants, at prices determined by our Board of Directors. Incentive stock options may only be granted to employees under these plans with a grant price not less than the fair market value on the date of grant. Under our 2012 Commencement Inducement Plan, we may only award options, restricted stock units and other equity awards to newly hired employees and newly engaged directors, in each case as allowed by NASDAQ listing requirements.
Generally, stock options and restricted stock units granted to employees have a maximum term of ten years. Stock based awards may vest over a period of time from the date of grant or upon the attainment of certain performance goals established by the Compensation Committee or the Single Member Committee established under our 2006 Equity Incentive Plan and our 2013 Equity Incentive Plan. Upon employee termination of service, any unexercised vested option will be forfeited three months following termination or the expiration of the option, whichever is earlier.
Our stock-based compensation expense for the last three fiscal years was as follows:
| 2015 | 2014 | 2013 | ||||||||||
| Research and development expense |
$ | 1,873,848 | $ | 608,840 | $ | 1,219,308 | ||||||
| General and administrative expense |
2,370,560 | 1,426,058 | 1,389,362 | |||||||||
|
|
|
|
|
|
|
|||||||
| Total stock-based compensation expense and effect on net loss |
$ | 4,244,408 | $ | 2,034,898 | $ | 2,608,670 | ||||||
|
|
|
|
|
|
|
|||||||
As of December 31, 2015, we have approximately $5,924,000 of total unrecognized compensation expense related to unvested awards granted under our various share-based plans that we expect to recognize over a weighted-average period of 1.7 years. The fair value of stock options and restricted stock units granted is estimated as of the date of grant using the Black-Scholes option pricing model and expensed on a pro-rata
74
Table of Contents
straight-line basis over the period in which the stock options vest. The Black-Scholes option pricing model requires certain assumptions as of the date of grant. The weighted-average assumptions used for the last three fiscal years are as follows:
| 2015 | 2014 | 2013 | ||||||||||
| Expected term (years)(1) |
5.7 | 4.2 | 5.1 | |||||||||
| Risk-free interest rate(2) |
1.8 | % | 1.3 | % | 1.2 | % | ||||||
| Expected volatility(3) |
75.2 | % | 78.7 | % | 89.3 | % | ||||||
| Expected dividend yield(4) |
0 | % | 0 | % | 0 | % | ||||||
| (1) | The expected term represents the period during which our stock-based awards are expected to be outstanding. We estimated this amount based on historical experience of similar awards, giving consideration to the contractual terms of the awards, vesting requirements, and expectation of future employee behavior, including post-vesting terminations. |
| (2) | The risk-free interest rate is based on U.S. Treasury debt securities with maturities close to the expected term of the option as of the date of grant. |
| (3) | Expected volatility is based on historical volatility over the most recent historical period equal to the length of the expected term of the option as of the date of grant. |
| (4) | We have neither declared nor paid dividends on any share of common stock and we do not expect to do so in the foreseeable future. |
At the end of each reporting period, we estimate forfeiture rates based on our historical experience within separate groups of employees and adjust the stock-based compensation expense accordingly.
A summary of our stock option activity and related information for the last three fiscal years is as follows:
| Outstanding Options | ||||||||||||||||
| Number of Shares |
Weighted- Average Exercise Price |
Weighted-Average Remaining Contractual Term |
Aggregate Intrinsic Value(1) |
|||||||||||||
| Balance at December 31, 2012 |
447,359 | $ | 19.59 | 5.1 | $ | 2,175 | ||||||||||
| Granted |
— | |||||||||||||||
| Exercised |
(3,452 | ) | $ | 1.00 | $ | 2,214 | ||||||||||
| Cancelled (forfeited and expired) |
(15,649 | ) | $ | 13.06 | ||||||||||||
|
|
|
|||||||||||||||
| Balance at December 31, 2013 |
428,258 | $ | 19.97 | 4.3 | $ | — | ||||||||||
| Granted |
— | |||||||||||||||
| Exercised |
— | — | — | |||||||||||||
| Cancelled (forfeited and expired) |
(125,529 | ) | $ | 24.30 | ||||||||||||
|
|
|
|||||||||||||||
| Balance at December 31, 2014 |
302,729 | $ | 18.18 | 3.3 | $ | — | ||||||||||
| Granted |
2,595,000 | $ | 0.69 | |||||||||||||
| Exercised |
— | — | — | |||||||||||||
| Cancelled (forfeited and expired) |
(818,600 | ) | $ | 1.57 | ||||||||||||
|
|
|
|||||||||||||||
| Balance at December 31, 2015 |
2,079,129 | $ | 2.89 | 8.6 | $ | 1,800 | ||||||||||
|
|
|
|||||||||||||||
| Exercisable at December 31, 2015 |
399,129 | $ | 12.14 | 4.9 | $ | 360 | ||||||||||
|
|
|
|||||||||||||||
| Vested and expected to vest(2) |
1,873,521 | $ | 3.134 | 8.5 | $ | 1,620 | ||||||||||
|
|
|
|||||||||||||||
| (1) | Aggregate intrinsic value represents the value of the closing price per share of our common stock on the last trading day of the fiscal period in excess of the exercise price multiplied by the number of options outstanding or exercisable, except for the “Exercised” line, which uses the closing price on the date exercised. |
| (2) | Number of shares includes options vested and those expected to vest net of estimated forfeitures. |
75
Table of Contents
No options were granted in 2014 and 2013. Total intrinsic value of options exercised at time of exercise was approximately $2,000 in 2013. No options were exercised in 2014 and 2015.
The following is a summary of changes in unvested options:
| Unvested Options |
Number of Options |
Weighted Average Grant Date Fair Value |
||||||
| Unvested options at December 31, 2014 |
— | — | ||||||
| Granted(1) |
2,595,000 | $ | 0.45 | |||||
| Vested |
(135,000 | ) | $ | 0.44 | ||||
| Cancelled |
(38,600 | ) | $ | 14.62 | ||||
|
|
|
|||||||
| Unvested options at December 31, 2015 |
1,680,000 | $ | 9.97 | |||||
|
|
|
|||||||
The estimated fair value of options vested were approximately $59,000 in 2015, $138,000 in 2014 and $406,000 in 2013.
The following table presents weighted average exercise price and remaining term information about significant option groups outstanding at December 31, 2015:
| Options Outstanding at December 31, 2015 |
||||||||||||||||
| Range of Exercise Prices |
Number Outstanding |
Weighted Average Remaining Term (Yrs.) |
Weighted Average Exercise Price |
Aggregate Intrinsic Value at December 31, 2015 |
||||||||||||
| Less than $10.00 |
1,815,300 | 9.5 | $ | 0.69 | $ | 1,800 | ||||||||||
| $10.00 - $19.99 |
140,870 | 4.0 | $ | 11.79 | — | |||||||||||
| $20.00 - $29.99 |
106,159 | 1.1 | $ | 23.27 | — | |||||||||||
| $30.00 - $39.99 |
16,800 | 0.1 | $ | 36.95 | — | |||||||||||
|
|
|
|
|
|||||||||||||
| 2,079,129 | 8.6 | $ | 2.9 | $ | 1,800 | |||||||||||
|
|
|
|
|
|||||||||||||
| Vested Options Outstanding at December 31, 2015 |
||||||||
| Range of Exercise Prices |
Number Outstanding |
Weighted Average Exercise Price |
||||||
| Less than $10.00 |
135,300 | $ | 0.70 | |||||
| $10.00 - $19.99 |
140,870 | $ | 11.79 | |||||
| $20.00 - $29.99 |
106,159 | $ | 23.27 | |||||
| $30.00 - $39.99 |
16,800 | $ | 36.95 | |||||
|
|
|
|||||||
| 399,129 | $ | 12.14 | ||||||
|
|
|
|||||||
76
Table of Contents
Restricted Stock Units
We have granted restricted stock units (RSUs) to our directors and to certain employees which entitle the holders to receive shares of our common stock upon vesting of the RSUs. The fair value of restricted stock units granted are based upon the market price of the underlying common stock as if it were vested and issued on the date of grant. A summary of our restricted stock unit activity for the year ended December 31, 2015 is as follows:
| Number of RSUs |
Weighted Average Grant Date Fair Value |
|||||||
| Unvested at January 1, 2015 |
3,374,940 | $ | 1.55 | |||||
| Granted(1) |
7,540,768 | $ | 1.10 | |||||
| Vested |
(1,510,257 | ) | $ | 1.41 | ||||
| Cancelled |
(1,154,100 | ) | $ | 1.22 | ||||
|
|
|
|||||||
| Unvested at December 31, 2015 |
8,251,351 | $ | 1.21 | |||||
|
|
|
|||||||
| (1) | All 2,595,000 options granted in 2015 vest upon the attainment of certain performance goals established by the Compensation Committee or the Single Member Committee established under our 2006 Equity Incentive Plan and our 2013 Equity Incentive Plan. A total of 7,540,768 restricted units were granted in 2015. 349,518 of these restricted stock units vest and convert into shares of our common stock after one year from the date of grant. 2,331,250 of these restricted stock units vest and convert into shares of our common stock over a three year period from the date of grant: one-third of the award will vest on each grant date anniversary following the grant. The remaining restricted units granted vest upon the attainment of certain performance goals established by the Compensation Committee or the Single Member Committee established under our 2006 Equity Incentive Plan and our 2013 Equity Incentive Plan. |
Stock Appreciation Rights
In July 2006, we granted cash-settled Stock Appreciation Rights (SARs) to certain employees that give the holder the right, upon exercise, to the difference between the price per share of our common stock at the time of exercise and the exercise price of the SARs.
The SARs have a maximum term of ten years with an exercise price of $20.00, which is equal to the market price of our common stock at the date of grant. The SARs vest 25% on the first anniversary of the grant date and 75% vest monthly over the remaining three-year service period. All of the outstanding SARs as of December 31, 2015 are fully vested and there were no changes (grants, exercises or forfeitures) in the fourth quarter of 2015. Compensation expense is based on the fair value of SARs which is calculated using the Black-Scholes option pricing model. The stock-based compensation expense and liability are re-measured at each reporting date through the earlier of date of settlement or forfeiture of the SARs.
For the year ended December 31, 2015, 2014 and 2013, the re-measured liability and compensation expense related to the SARs were not significant. The compensation expense recognized for the year ended December 31, 2015 and resulting effect on net loss and net loss per share attributable to common stockholders is not likely to be representative of the effects in future periods, due to changes in the fair value calculation which is dependent on the stock price, volatility, interest and forfeiture rates, additional grants and subsequent periods of vesting. We will continue to recognize compensation cost each period, which will be the change in fair value from the previous period through the earlier date of settlement or forfeiture of the SARs.
Note 12. Commitments and Contingencies
Bonds Payable
We entered into direct financing transactions with the State of Rhode Island and received proceeds from the issuance of industrial revenue bonds totaling $5,000,000 to finance the construction of a 21,000 square-foot pilot
77
Table of Contents
manufacturing facility and a 3,000 square-foot cell processing facility in Lincoln, Rhode Island. The related lease agreements are structured such that lease payments fully fund all semiannual interest payments and annual principal payments through maturity in August 2014. In August 2014, we made the final principal and interest payment thereby extinguishing the debt. In March 2015, we sold the vacant 21,000 square-foot pilot manufacturing facility and the vacant 3,000 square-foot cell processing facility in Lincoln, Rhode Island to an unrelated third party net of expenses for approximately $149,000.
Operating leases
We lease various real properties under operating leases that generally require us to pay taxes, insurance, maintenance, and minimum lease payments. Some of our leases have options to renew.
Operating Leases — California
In December 2010, we entered into a commercial lease agreement with BMR-Gateway Boulevard LLC (BMR), as landlord, for office and research space at BMR’s Pacific Research Center in Newark, California. The initial term of the lease is approximately eleven and one-half years and includes escalating rent payments which we recognize as lease operating expense on a straight-line basis. We will pay approximately $17,869,000 in aggregate as rent over the term of the lease to BMR. Deferred rent for this facility was approximately $1,372,000 as of December 31, 2015, and approximately $1,434,000 as of December 31, 2014.
In March 2013, we entered into a commercial lease agreement with Prologis, L.P. (Prologis), as landlord, for office and research space in Sunnyvale, California. The facility is for operations that support our clinical development activities. The initial term of the lease is ten years and includes escalating rent payments which we recognize as lease operating expense on a straight-line basis. We will pay approximately $3,497,000 in aggregate rent over the term of the lease. As part of the lease, Prologis has agreed to provide us financial allowances to build initial tenant improvements, subject to customary terms and conditions relating to landlord-funded tenant improvements. The tenant improvements are recorded as leasehold improvement assets and amortized over the term of the lease. The financial allowances are treated as a lease incentive and recorded as deferred rent which is amortized as reductions to lease expense over the lease term. Deferred rent for this facility was approximately $382,000 as of December 31, 2015, and $391,000 as of December 31, 2014.
Operating Leases — United Kingdom
In January 2011, we amended the existing lease agreements of our wholly-owned subsidiary, Stem Cell Sciences (U.K.) Ltd, effectively reducing our leased office and lab space. The lease by its terms was extended to September 30, 2013. In October 2013, we signed a new three-year lease agreement for the leased space and expect to pay rent of approximately GBP 53,000 per annum. StemCells, Inc. was the guarantor of SCS UK’s obligations under this lease. The lease gave SCS UK an option for early termination of the lease agreement. In December 2014, we sold our SC Proven reagent and cell culture business and as part of the wind-down of our business operations in UK, sublet our leased space for the remaining term of our lease agreement; from January 2015 to our opted early termination date of October 2015. This lease terminated by its terms in October 2015 and we have no continuing operations in the United Kingdom.
With the exception of the operating leases discussed above, we have not entered into any significant off balance sheet financial arrangements and have not established any special purpose entities. We have not guaranteed any debts or commitments of other entities or entered into any options on non-financial assets.
78
Table of Contents
The table below summarizes the components of rent expense for the fiscal year ended December 31, as follows:
| 2015 | 2014 | 2013 | ||||||||||
| Rent expense |
$ | 1,844,610 | $ | 1,955,747 | $ | 2,612,899 | ||||||
| Sublease income |
— | — | (53,726 | ) | ||||||||
|
|
|
|
|
|
|
|||||||
| Rent expense, net |
$ | 1,844,610 | $ | 1,955,747 | $ | 2,559,173 | ||||||
|
|
|
|
|
|
|
|||||||
Future minimum payments under all leases and loan payable at December 31, 2015 are as follows:
| Loan Payable SVB |
Capital Leases |
Operating Leases |
||||||||||
| 2016 |
$ | 1,440,679 | $ | 20,670 | $ | 1,968,459 | ||||||
| 2017 |
— | 11,202 | 2,014,706 | |||||||||
| 2018 |
— | 4,913 | 2,061,260 | |||||||||
| 2019 |
— | — | 2,108,130 | |||||||||
| 2020 |
— | — | 2,155,325 | |||||||||
| Thereafter |
— | — | 3,933,455 | |||||||||
|
|
|
|
|
|
|
|||||||
| Total minimum lease and loan payments (1) |
1,440,679 | 36,785 | $ | 14,241,335 | ||||||||
|
|
|
|||||||||||
| Less amounts representing interest |
18,184 | 875 | ||||||||||
|
|
|
|
|
|||||||||
| Principal amounts of loan payable and capital lease obligations |
1,422,495 | 35,910 | ||||||||||
| Less current maturities |
1,422,495 | 20,032 | ||||||||||
|
|
|
|
|
|||||||||
| Loan payable and capital lease obligations, less current maturities |
$ | — | $ | 15,878 | ||||||||
|
|
|
|
|
|||||||||
| (1) | An aggregate of approximately $9.2 million of principal and accrued interest under the CIRM Loan Agreement is not included. In April 2013, we entered into an agreement with the CIRM under which CIRM would have provided up to approximately $19.3 million as a forgivable loan, in accordance with mutually agreed upon terms and conditions and CIRM regulations. The CIRM loan was to have helped fund preclinical development of our HuCNS-SC cells for Alzheimer’s disease. Between July 2013 and August 2014, we received in aggregate, approximately $9.6 million as disbursements of the loan provided under the CIRM Loan Agreement. However in December 2014, as findings under this pre-clinical study in Alzheimer’s disease did not meet pre-determined criteria for ongoing funding for this program by CIRM, we decided to wind down this pre-clinical study which had been funded in part by the CIRM loan agreement. Under the terms of the CIRM loan agreement, principal amount of approximately $8,917,000 and accrued interest of approximately $243,000 were forgiven. However, authoritative accounting guidance requires certain conditions (which includes a legal release from the creditor) to be met before a liability can be extinguished and derecognized. In February 2015, we repaid CIRM approximately $679,000 of the aggregate loan proceeds received. |
Note 13. Warrant Liability
We use various option pricing models, such as the Black-Scholes option pricing model and a Monte Carlo simulation model, to estimate fair value of warrants issued. In using these models, we make certain assumptions about risk-free interest rates, dividend yields, volatility, expected term of the warrants and other assumptions. Risk-free interest rates are derived from the yield on U.S. Treasury debt securities. Dividend yields are based on our historical dividend payments, which have been zero to date. Volatility is estimated from the historical volatility of our common stock as traded on NASDAQ. The expected term of the warrants is based on the time to expiration of the warrants from the date of measurement.
79
Table of Contents
In November 2009, we sold 1,000,000 units to institutional investors at a price of $12.50 per unit, for gross proceeds of $12,500,000. The units, each of which consisted of one share of common stock and a warrant to purchase 0.40 shares of common stock at an exercise price of $15.00 per share, were offered as a registered direct offering under a shelf registration statement previously filed with, and declared effective by, the SEC. We received total proceeds, net of offering expenses and placement agency fees, of approximately $11,985,000. We recorded the fair value of the warrants to purchase 400,000 shares of our common stock as a liability. The fair value of the warrant liability is revalued at the end of each reporting period, with the change in fair value of the warrant liability recorded as a gain or loss in our consolidated statements of operations. The November 2009 warrants expired unexercised by their own terms in April 2015.
In December 2011, we raised gross proceeds of $10,000,000 through a public offering of 8,000,000 units and 8,000,000 Series B Warrants. The combination of units and Series B Warrants were sold at a public offering price of $1.25 per unit. Each Series B Warrant gave the holder the right to purchase one unit at an exercise price of $1.25 per unit and was exercisable until May 2, 2012, the 90th trading day after the date of issuance. Each unit consists of one share of our common stock and one Series A Warrant. Each Series A Warrant gives the holder the right to purchase one share of our common stock at an initial exercise price of $1.40 per share. The Series A Warrants are immediately exercisable upon issuance and will expire in December 2016. In 2012, an aggregate of 2,700,000 Series B Warrants were exercised. For the exercise of these warrants, we issued 2,700,000 shares of our common stock and 2,700,000 Series A Warrants. The remaining 5,300,000 Series B Warrants expired unexercised by their terms on May 2, 2012. In 2012, 2013 and 2014, an aggregate of 2,198,571, 384,534 and 1,180,015 Series A Warrants were exercised, respectively. For the exercise of these warrants, in 2012, 2013 and 2014, we issued 2,198,571, 384,534 and 1,180,015 shares of our common stock and received gross proceeds of approximately $3,078,000, $538,000 and $1,652,000, respectively. The shares were offered under our shelf registration statement previously filed with previously filed with, and declared effective by, the SEC. The Series A Warrants contain full ratchet anti-dilution price protection so that, in most situations upon the issuance of any common stock or securities convertible into common stock at a price below the then-existing exercise price of the outstanding Series A Warrants, the Series A exercise price will be reset to the lower common stock sales price. As a result of our April 2015 financing, the exercise price of the outstanding Series A warrants were reduced from $1.40 per share to $0.70 per share. Subsequently, as a result of our sale of shares of our common stock under a sales agreement entered into in 2009 and amended in 2012, the exercise price of the outstanding Series A warrants were reduced from $0.70 per share to $0.52 per share. The fair value of the warrant liability will be revalued at the end of each reporting period, with the change in fair value of the warrant liability recorded as a gain or loss in our consolidated statements of operations. The fair value of the warrants will continue to be classified as a liability until such time as the warrants are exercised, expire or an amendment of the warrant agreement renders these warrants to be no longer classified as a liability.
The assumptions used for the Monte Carlo simulation model to value the outstanding Series A Warrants at December 31, 2015 are as follows:
| Risk-free interest rate per year |
0.6 | % | ||
| Expected volatility per year |
76.5 | % | ||
| Expected dividend yield |
0 | % | ||
| Expected life (years) |
1.0 |
The use of the Monte Carlo simulation model requires the input of additional subjective assumptions including the progress of our R&D programs and its effect on potential future financings.
80
Table of Contents
The following table is a summary of the changes in fair value of warrant liability for the Series A Warrants in 2015:
| Series A | ||||||||
| Number of Warrants |
Fair value $ | |||||||
| Balance at December 31, 2014 |
6,936,880 | $ | 1,684,551 | |||||
| Changes in fair value |
— | (913,587 | ) | |||||
|
|
|
|
|
|||||
| Balance at December 31, 2015 |
6,936,880 | $ | 770,964 | |||||
|
|
|
|
|
|||||
Note 14. Loan Payable
Loan Agreement with Silicon Valley Bank
In April 2013, we entered into a Loan Agreement with Silicon Valley Bank (SVB) and received loan proceeds of $9,900,000, net of a $100,000 cash discount. The loan proceeds will be used for research and development and general corporate purposes. The loan has a three-year term and bears interest at an annual rate of 6%. The loan obligations are secured by a first priority security interest on substantially all of our assets excluding intellectual property. For the first six months, payments will be interest only followed by repayment of principal and interest over a period of 30 months. There is also a final $1,000,000 fee payable at the end of the term which is being expensed over the term of the loan using the effective interest method. In conjunction with the Loan Agreement, we issued to SVB a ten year warrant to acquire 293,531 shares of common stock at an exercise price of $1.7034 per share. The warrant is immediately exercisable and expires in April 2023. We estimated the fair value of the warrant to be approximately $388,000 using the Black-Scholes option pricing model with the following assumptions:
| Expected life (years) |
10 | |||
| Risk-free interest rate |
1.9 | % | ||
| Expected volatility |
88.1 | % | ||
| Expected dividend yield |
0 | % |
We applied the relative fair value method to allocate the $9,900,000 net proceeds between the loan and warrant. The approximately $388,000 fair value allocated to the warrant was recorded as an increase to additional paid-in capital and as a discount to loan payable. Approximately $9,512,000 was assigned to the loan and was recorded as the initial carrying amount of the loan payable, net of discount. The approximately $388,000 fair value of the warrant and the $100,000 cash discount are both being amortized as additional interest expense over the term of the loan using the effective interest rate method.
We also incurred loan issuance costs of approximately $117,000, which are recorded as deferred financing costs on the accompanying consolidated balance sheet and are being amortized to interest expense over the term of the Loan Agreement using the effective interest rate method. The effective interest rate used to amortize the deferred financing costs and the discount (including the fair value of the warrant and the cash discount), and for the accretion of the final payment, is 9.0%.
We are required to maintain certain financial and other covenants set forth in the Loan Agreement. In December 2015, to remain in compliance with the terms of the agreement, we entered into an amendment to the Loan Agreement that required us to maintain with SVB a restricted money market account with a minimum aggregate balance of $2,422,500. As part of the amendment, we pledged to SVB a security interest in the restricted money market account. The pledged restricted money market account will be released on the earlier of date we repay the outstanding principal, interest and fees or (i) we receive at least $18,000,000 of net new cash proceeds from investors on terms and conditions reasonably acceptable to SVB and (ii) we have cash and cash equivalents at SVB sufficient to support six months operations.
81
Table of Contents
Loan Agreement with California Institute for Regenerative Medicine
In April 2013, we entered into an agreement with the CIRM under which CIRM would have provided up to approximately $19.3 million as a forgivable loan, in accordance with mutually agreed upon terms and conditions and CIRM regulations. The CIRM loan was to have helped fund preclinical development of our HuCNS-SC cells for Alzheimer’s disease. Between July 2013 and August 2014, we received in aggregate, approximately $9.6 million as disbursements of the loan provided under the CIRM Loan Agreement. However in December 2014, as findings under this pre-clinical study in Alzheimer’s disease did not meet pre-determined criteria for ongoing funding for this program by CIRM, we decided to wind down this pre-clinical study which had been funded in part by the CIRM loan agreement. Under the terms of the CIRM loan agreement, principal amount of approximately $8,917,000 and accrued interest of approximately $243,000 were forgiven. However, authoritative accounting guidance requires certain conditions (which includes a legal release from the creditor) to be met before a liability can be extinguished and derecognized. In February 2015, we repaid CIRM approximately $679,000 of the aggregate loan proceeds received.
The following table is a summary of the changes in the carrying value of our loan payable in 2015:
| Silicon Valley Bank Loan |
CIRM Loan | Total | ||||||||||
| Loan payable at December 31, 2014 |
$ | 5,424,610 | $ | 9,595,807 | $ | 15,020,417 | ||||||
| Repayment of principal |
(4,099,319 | ) | (679,166 | ) | (4,778,485 | ) | ||||||
| Accretion of discount |
92,097 | — | 92,097 | |||||||||
|
|
|
|
|
|
|
|||||||
| Carrying value of loan payable at 12/31/2015 (current and non-current) |
$ | 1,417,388 | $ | 8,916,641 | $ | 10,334,029 | ||||||
|
|
|
|
|
|
|
|||||||
| Carrying value of loan payable, current portion |
$ | 1,417,388 | $ | — | $ | 1,417,388 | ||||||
| Carrying value of loan payable, non-current portion |
— | 8,916,641 | 8,916,641 | |||||||||
|
|
|
|
|
|
|
|||||||
| Total loan payable at December 31, 2015 |
$ | 1,417,388 | $ | 8,916,641 | $ | 10,334,029 | ||||||
|
|
|
|
|
|
|
|||||||
Note 15. Common Stock
Sale of common stock
Major transactions involving our common stock for the last three years include the following:
| • | In April 2015, we raised gross proceeds of approximately $25 million through a public offering of 35,715,000 Units. Each Unit consists of one share of our common stock and a warrant to purchase three-quarters of a share of our common stock. The warrants have an exercise price of $0.85 per share and will expire five years from the date of issuance. We also granted the underwriters a thirty day option (the Over-Allotment Option) to purchase up to an additional 5,357,250 shares of common stock and/or warrants to purchase up to an additional 4,017,938 shares of common stock to cover over-allotments, if any. The underwriters exercised the over-allotment option for the warrants and so, in April 2015, we issued warrants to purchase up to an additional 4,017,938 shares of common stock at $0.85 per share. In May 2015, the underwriters exercised in part, the over-allotment option for additional shares and purchased 2,757,250 shares of our common stock at a price of $0.699 per share, before the underwriting discount. We received net proceeds of approximately $1.8 million from the exercise of the Over-Allotment Option, increasing our aggregate net proceeds from the offering to approximately $25 million, after deducting offering expenses, underwriting discounts and commissions. The shares were offered under our effective shelf registration statement previously filed with the SEC. |
82
Table of Contents
| • | Under a sales agreement entered into in 2009 and amended in 2012 (the Amended Sales Agreement), we have the option to sell up to $30 million of our common stock from time to time, in at-the-market offerings. The sales agent is paid compensation of 2% of gross proceeds pursuant to the terms of the amended agreement. The sales agreement as amended, has been filed with the SEC. Under the Amended Sales Agreement, in 2015, we sold a total of 2,546,681 shares of our common stock at an average price per share of $0.55 for gross proceeds of approximately $1,410,000. The shares were offered under our shelf registration statement previously filed with, and declared effective by, the SEC. |
| • | In July 2014, we raised gross proceeds of $20,000,000 through the sale of 11,299,435 units to two institutional biotechnology investors, at an offering price of $1.77 per unit. Each unit consists of one share of our common stock and a warrant to purchase 0.85 of a share of our common stock. The warrants are exercisable six months from the date of issuance at an exercise price of $2.17. The Warrants are non-transferable and will expire thirteen months from the date of issuance. The shares were offered under our shelf registration statement previously filed with, and declared effective by, the SEC. |
| • | In 2014, an aggregate of 1,180,015 Series A Warrants were exercised. For the exercise of these warrants, we issued 1,180,015 shares of our common stock and received gross proceeds of approximately $1,652,000. |
| • | Under the Amended Sales Agreement, in 2014, we sold a total of 193,271 shares of our common stock at an average price per share of $1.47 for gross proceeds of approximately $285,000. The shares were offered under our shelf registration statement previously filed with, and declared effective by, the SEC. |
| • | In October 2013, we sold a total of 12,845,500 units in an underwritten public offering at a price of $1.45 per unit and received total proceeds, net of offering expenses, underwriting discounts and commissions, of approximately $17.3 million. Each unit sold consisted of one share of common stock, par value $.01 per share, and a warrant to purchase one-half share of common stock. The warrants have an exercise price of $1.80 per share, are exercisable immediately, and will expire five years from the date of issuance. |
| • | In June 2013, we entered into an agreement with an institutional investor, under which we have the right to sell up to $30.0 million of our common stock to the institutional investor. Proceeds from the sale of our common stock will be used for general corporate purposes. Under the terms of the agreement, we immediately sold 1,645,639 in shares of our common stock to the institutional investor at a purchase price of $1.823 per share, which was the volume-weighted average price of the prior ten trading days, and received gross proceeds of $3.0 million. In consideration for entering into the agreement, we issued 329,131 shares of our common stock to the institutional investor. We did not receive any cash proceeds from the issuance of these 329,131 shares. Under this agreement, we had the right for a period of three years and at our sole discretion, to sell additional amounts up to $27.0 million of our common stock to the institutional investor subject to certain limitations. No warrants were issued in connection with this transaction. All shares were sold under our shelf registration statement previously filed with, and declared effective by, the SEC. In October 2013, we terminated the agreement without any cost or penalty. |
| • | Under the Amended Sales Agreement, in 2013, we sold an aggregate of 1,733,771 shares of our common stock at an average price per share of $1.91 for gross proceeds of approximately $3,317,000. The shares were offered under our shelf registration statement previously filed with, and declared effective by, the SEC. |
| • | In 2013, an aggregate of 384,534 Series A Warrants were exercised. For the exercise of these warrants, we issued 384,534 shares of our common stock and received gross proceeds of approximately $538,000. |
83
Table of Contents
Common Stock Reserved
We reserved the following shares of common stock for the exercise of options, warrants and other contingent issuances of common stock, as of December 31, 2015:
| Shares reserved for share based compensation |
16,729,518 | |||
| Shares reserved for warrants related to financing transactions |
44,277,849 | |||
|
|
|
|||
| Total |
61,007,367 | |||
|
|
|
Note 16. Deferred Revenue
Deferred revenue includes unamortized upfront licensing fees received of approximately $46,000. The up-front license fee is being amortized and recognized as revenue over a period of twelve years.
Note 17. 401(k) Plan
Our 401(k) Plan covers substantially all of our employees. Participants in the plan are permitted to contribute a fixed percentage of their total annual cash compensation to the plan (subject to the maximum employee contribution defined by law). We match 50% of employee contributions, up to a maximum of 6% of each employee’s eligible compensation in the form of shares of our common stock. We recorded an expense of $230,000 in 2015, $184,000 in 2014, and $132,000 in 2013 for our contributions under our 401(k) Plan.
Note 18. Income Taxes
Loss before income taxes is attributed to the following geographic locations for the years ended December 31,
| 2015 | 2014 | |||||||
| United States |
$ | 36,065,000 | $ | 30,215,000 | ||||
| Foreign |
350,000 | 2,526,000 | ||||||
|
|
|
|
|
|||||
| Total loss before income taxes |
$ | 36,415,000 | $ | 32,741,000 | ||||
|
|
|
|
|
|||||
84
Table of Contents
We follow authoritative guidance regarding accounting for uncertainty in income taxes, which prescribes a recognition threshold a tax position is required to meet before being recognized in the financial statements. As of December 31, 2015 and 2014, we have not recorded any unrecognized tax benefits. Deferred income taxes reflect the tax effects of temporary differences between the carrying amounts of assets and liabilities for financial reporting purposes and the amounts used for income tax purposes. Significant components of our deferred tax assets and liabilities at December 31 are as follows:
| 2015 | 2014 | |||||||
| Deferred tax assets: |
||||||||
| Capitalized research and development costs |
$ | 75,409,000 | $ | 66,212,000 | ||||
| Net operating losses |
59,319,000 | 57,261,000 | ||||||
| Research and development credits |
10,581,000 | 9,798,000 | ||||||
| Stock-based compensation |
1,925,000 | 1,124,000 | ||||||
| Capital loss carryover |
264,000 | 254,000 | ||||||
| Fixed assets |
(107,000 | ) | 393,000 | |||||
| Other |
4,707,000 | 3,930,000 | ||||||
|
|
|
|
|
|||||
| 152,098,000 | 138,972,000 | |||||||
| Valuation allowance |
(152,098,000 | ) | (138,972,000 | ) | ||||
|
|
|
|
|
|||||
| Total deferred tax assets |
$ | — | $ | — | ||||
|
|
|
|
|
|||||
Realization of deferred tax assets is dependent upon future earnings, if any, the timing and amount of which are uncertain. Accordingly, the net deferred tax assets have been fully offset by a valuation allowance. The valuation allowance increased by approximately $13,126,000 in 2015 and by approximately $10,657,000 in 2014.
As of December 31, 2015, we had the following:
| • | Net operating loss carry forwards for federal income tax purposes of approximately $169,972,000 which expire in the years 2018 through 2035. This includes $1,792,000 of excess deductions from the exercise of stock options, the benefit of which will be recorded in additional paid-in-capital when realized |
| • | Federal research and development tax credits of approximately $6,725,000 which expire in the years 2018 through 2035. |
| • | Net operating loss carry forwards for state income tax purposes of approximately $34,136,000 which expire in the years 2016 through 2035. This includes $1,362,000 of excess deductions from the exercise of stock options, the benefit of which will be recorded in additional paid-in-capital when realized. |
| • | State research and development tax credits of approximately $5,842,000 ($3,856,000 net of federal tax effect) which do not expire. |
| • | Net operating loss carry forwards in foreign jurisdictions of approximately $1,128,000 which do not expire. |
| • | Capital loss carry forwards for federal and state income tax purposes of $746,000 which expire in 2016. |
Utilization of the federal and state net operating loss and federal and state research and development tax credit carry forwards may be subject to annual limitations due to the ownership percentage change provisions of the Internal Revenue Code of 1986 and similar state provisions. The annual limitations may result in the inability
85
Table of Contents
to fully offset future annual taxable income and could result in the expiration of the net operating loss carry forwards before utilization. Utilization of foreign net operating loss carry forwards may be limited or disallowed under similar foreign income tax provisions.
The effective tax rate as a percentage of income before income taxes differs from the statutory federal income tax rate (when applied to income before income taxes) for the years ended December 31 as follows:
| 2015 | 2014 | 2013 | ||||||||||
| Statutory federal income tax (benefit) rate |
(34 | )% | (34 | )% | (34 | )% | ||||||
| State income tax (benefit) rate |
(0.6 | ) | — | — | ||||||||
| Increase resulting from: |
||||||||||||
| Expenses not deductible for taxes |
0.1 | 0.8 | 0.5 | |||||||||
| Increase in valuation allowance |
36.0 | 32.6 | 38.8 | |||||||||
| Change in state deferred tax rate |
(2.2 | ) | 0.0 | 1.1 | ||||||||
| Change in foreign deferred tax rate |
0.3 | 2.8 | 0.9 | |||||||||
| Expiration of tax attributes |
1.2 | 1.7 | 0.5 | |||||||||
| Prior year true up |
2.5 | 1.1 | (0.7 | ) | ||||||||
| Tax credits |
(2.5 | ) | (2.4 | ) | (3.0 | ) | ||||||
| Warrant valuation |
(0.9 | ) | (2.5 | ) | (4.1 | ) | ||||||
|
|
|
|
|
|
|
|||||||
| Effective tax (benefit) rate |
0 | % | 0 | % | 0 | % | ||||||
|
|
|
|
|
|
|
|||||||
As of December 31, 2015, we have not recognized U.S deferred income taxes as we have cumulative total undistributed losses for non-U.S. subsidiaries. Determining the unrecognized deferred tax liability related to investments in these non-U. S. subsidiaries that are indefinitely reinvested is no practicable.
We did not have any unrecognized tax benefits at December 31, 2015. Our policy is to recognize interest and penalties related to income tax matters in income tax expense. Because we have no tax liabilities, no tax-related interest and penalties have been expensed in our consolidated statements of operations during 2015 or accrued as a liability in our consolidated balance sheets at December 31, 2015. We do not anticipate any significant changes to total unrecognized tax benefits as a result of settlement of audits or the expiration of statute of limitations within the next twelve months.
We file U.S. federal income tax returns, as well as tax returns with the State of California, the State of Colorado and the State of Rhode Island. Due to the carry forward of unutilized net operating losses and research and development credits, our federal tax returns from 1998 forward remain subject to examination by the Internal Revenue Service, and our State of California tax returns from 2001 forward and our State of Rhode Island tax returns from 2010 forward remain subject to examination by the respective state tax authorities. We file income tax returns in various foreign jurisdictions. Tax years from 2007 forward remain subject to examination by the appropriate foreign governmental agencies.
Note 19. Discontinued Operations
In the fourth quarter of 2014, we sold and completed the wind down of our subsidiary SCS UK’s operations in Cambridge, UK, which includes the SC Proven reagent and cell culture business. We classified the historical results of this component as discontinued operations in our Consolidated Statement of Operations. At December 31, 2015, the remaining assets and liabilities of the discontinued operations included in our Consolidated Balance Sheets are not significant.
86
Table of Contents
Note 20. Subsequent Events
In March 2016, we raised gross proceeds of approximately $8.0 million through an underwritten public offering of 26,667,000 units, at a price of $0.30 per unit, before deducting underwriting discounts and other offering expenses. Each unit consists of a fixed combination of one share of our common stock, a Series A Warrant to purchase 0.50 of a share of our common stock, and a Series B Warrant to purchase 0.75 of a share of our common stock. Each Series A Warrant has an exercise price of $0.30 per share, is immediately exercisable, and will expire two years from the date of issuance. Each Series B Warrant has an exercise price of $0.42 per share, will become exercisable upon stockholder approval of an increase in our authorized capital and the one year anniversary of the issuance date, whichever is later, and will expire on the fifth anniversary of the date they become exercisable. In connection with the offering, we have granted the underwriters a 45 day option to purchase up to an additional 4,000,050 shares of our common stock and/or warrants to purchase up to an additional 5,000,063 shares of our common stock to cover over-allotments, if any. The initial shares and warrants were offered under our effective shelf registration statement previously filed with the SEC. We intend to file a subsequent registration statement to register the common shares issuable upon the exercise of the Series B Warrants at the time they become exercisable. Proceeds from the sale will be used for general corporate purposes.
*****
87
Table of Contents
QUARTERLY FINANCIAL DATA (unaudited)
| 2015 Quarter Ended | ||||||||||||||||
| December 31 | September 30 | June 30 | March 31 | |||||||||||||
| (In $ thousands, except per share amounts) | ||||||||||||||||
| Continuing operations: |
||||||||||||||||
| Total revenue |
29 | 37 | 30 | 21 | ||||||||||||
| Operating expenses |
8,528 | 10,025 | 9,303 | 8,981 | ||||||||||||
| Change in fair value of warrant liability |
(155 | ) | 427 | 988 | (347 | ) | ||||||||||
| Impairment of goodwill and other intangible assets |
(239 | ) | — | — | — | |||||||||||
| Interest and other expense, net |
(67 | ) | (82 | ) | (178 | ) | (42 | ) | ||||||||
| Net loss from continuing operations |
(8,960 | ) | (9,643 | ) | (8,462 | ) | (9,351 | ) | ||||||||
| Basic and diluted net loss per share: |
||||||||||||||||
| Basic and diluted net loss per share |
$ | (0.08 | ) | $ | (0.09 | ) | $ | (0.09 | ) | $ | (0.14 | ) | ||||
| 2014 Quarter Ended | ||||||||||||||||
| December 31 | September 30 | June 30 | March 31 | |||||||||||||
| (In $ thousands, except per share amounts) | ||||||||||||||||
| Continuing operations: |
||||||||||||||||
| Total revenue |
883 | 82 | 23 | 24 | ||||||||||||
| Operating expenses |
10,612 | 6,462 | 7,983 | 6,866 | ||||||||||||
| Change in fair value of warrant liability |
2,327 | 4,076 | (3,654 | ) | (327 | ) | ||||||||||
| Impairment of goodwill and other intangible assets |
(2,440 | ) | — | — | — | |||||||||||
| Interest and other expense, net |
(266 | ) | (316 | ) | (357 | ) | (394 | ) | ||||||||
| Net loss from continuing operations |
(10,108 | ) | (2,620 | ) | (11,971 | ) | (7,562 | ) | ||||||||
| Discontinued operations: |
||||||||||||||||
| Net loss from discontinued operations |
(30 | ) | (137 | ) | (144 | ) | (58 | ) | ||||||||
| Net loss from disposal of assets |
(111 | ) | — | — | — | |||||||||||
| Basic and diluted net loss per share: |
||||||||||||||||
| Continuing operations |
$ | (0.15 | ) | $ | (0.04 | ) | $ | (0.21 | ) | $ | (0.14 | ) | ||||
| Discontinued operations |
$ | (0.00 | ) | $ | (0.00 | ) | $ | (0.00 | ) | $ | (0.00 | ) | ||||
| Basic and diluted net loss per share |
$ | (0.15 | ) | $ | (0.04 | ) | $ | (0.21 | ) | $ | (0.14 | ) | ||||
| Item 9. | CHANGES IN AND DISAGREEMENTS WITH ACCOUNTANTS ON ACCOUNTING AND FINANCIAL DISCLOSURE |
None.
| Item 9A. | CONTROLS AND PROCEDURES |
Evaluation of Disclosure Controls and Procedures
The Company’s management, with the participation of its chief executive officer and chief financial officer, evaluated the effectiveness of the design and operation of its disclosure controls and procedures (as defined in Rules 13a-15(e) and 15d-15(e) under the Securities Exchange Act of 1934, as amended) as of the end of the period covered by this annual report. Based on this evaluation, the Company’s principal executive officer and principal financial officer concluded that these disclosure controls and procedures are effective.
Changes in Internal Controls
There have been no changes in the Company’s internal control over financial reporting during the quarter ended December 31, 2015, that have materially affected, or are reasonably likely to materially affect, the Company’s internal control over financial reporting.
88
Table of Contents
Management’s Report on Internal Control over Financial Reporting
Management of the Company is responsible for establishing and maintaining adequate internal control over financial reporting. The Company’s management, including its principal executive officer and principal financial officer, assessed the effectiveness of its internal control over financial reporting based on the framework issued by the Committee of Sponsoring Organizations of the Treadway Commission (COSO). The evaluation of the design and operating effectiveness of internal control over financial reporting include among others those policies and procedures that:
| • | pertain to the maintenance of records that in reasonable detail accurately and fairly reflect the transactions and dispositions of the assets of the Company; |
| • | provide reasonable assurance that transactions are recorded as necessary to permit preparation of financial statements in accordance with generally accepted accounting principles, and that receipts and expenditures of the Company are being made only in accordance with authorizations of management and directors of the Company; and |
| • | provide reasonable assurance regarding prevention or timely detection of unauthorized acquisition, use or disposition of the Company’s assets that could have a material effect on the financial statements. |
During the fiscal year 2015, the Company periodically tested the design and operating effectiveness of its internal control over financial reporting. Among other matters, the Company sought in its evaluation to determine whether there were any “significant deficiencies” or “material weakness” in its internal control over financial reporting, or whether it had identified any acts of fraud involving management or other employees.
Based on the above evaluation, the Company’s chief executive officer and chief financial officer have concluded that as of December 31, 2015, the Company’s internal control over financial reporting were effective. Nonetheless, it is important to acknowledge that due to its inherent limitations, internal control over financial reporting may not prevent or detect misstatements. Therefore, even systems determined to be effective can provide only reasonable assurance with respect to financial statement preparation and presentation. Projections of any evaluation of effectiveness to future periods are subject to the risk that controls may become inadequate because of changes in conditions, or that the degree of compliance with the policies or procedures may deteriorate.
The Company’s internal control over financial reporting as of December 31, 2015 has been audited by Grant Thornton LLP, an independent registered public accounting firm, as stated in their report below.
89
Table of Contents
REPORT OF INDEPENDENT REGISTERED PUBLIC ACCOUNTING FIRM
Board of Directors and Shareholders
StemCells, Inc.
We have audited the internal control over financial reporting of StemCells, Inc. (a Delaware corporation) and subsidiaries (the “Company”) as of December 31, 2015, based on criteria established in the 2013 Internal Control — Integrated Framework issued by the Committee of Sponsoring Organizations of the Treadway Commission (COSO). The Company’s management is responsible for maintaining effective internal control over financial reporting and for its assessment of the effectiveness of internal control over financial reporting, included in the accompanying Management’s Report on Internal Control over Financial Reporting. Our responsibility is to express an opinion on the Company’s internal control over financial reporting based on our audit.
We conducted our audit in accordance with the standards of the Public Company Accounting Oversight Board (United States). Those standards require that we plan and perform the audit to obtain reasonable assurance about whether effective internal control over financial reporting was maintained in all material respects. Our audit included obtaining an understanding of internal control over financial reporting, assessing the risk that a material weakness exists, testing and evaluating the design and operating effectiveness of internal control based on the assessed risk, and performing such other procedures as we considered necessary in the circumstances. We believe that our audit provides a reasonable basis for our opinion.
A company’s internal control over financial reporting is a process designed to provide reasonable assurance regarding the reliability of financial reporting and the preparation of financial statements for external purposes in accordance with generally accepted accounting principles. A company’s internal control over financial reporting includes those policies and procedures that (1) pertain to the maintenance of records that, in reasonable detail, accurately and fairly reflect the transactions and dispositions of the assets of the company; (2) provide reasonable assurance that transactions are recorded as necessary to permit preparation of financial statements in accordance with generally accepted accounting principles, and that receipts and expenditures of the company are being made only in accordance with authorizations of management and directors of the company; and (3) provide reasonable assurance regarding prevention or timely detection of unauthorized acquisition, use, or disposition of the company’s assets that could have a material effect on the financial statements.
Because of its inherent limitations, internal control over financial reporting may not prevent or detect misstatements. Also, projections of any evaluation of effectiveness to future periods are subject to the risk that controls may become inadequate because of changes in conditions, or that the degree of compliance with the policies or procedures may deteriorate.
In our opinion, the Company maintained, in all material respects, effective internal control over financial reporting as of December 31, 2015, based on criteria established in the 2013 Internal Control—Integrated Framework issued by COSO.
We also have audited, in accordance with the standards of the Public Company Accounting Oversight Board (United States), the consolidated financial statements of the Company as of and for the year ended December 31, 2015 and our report dated March 15, 2016 expressed an unqualified opinion on those financial statements.
/s/ GRANT THORNTON LLP
San Francisco, California
March 15, 2016
90
Table of Contents
| Item 9B. | OTHER INFORMATION |
None.
PART III
| Item 10. | DIRECTORS, EXECUTIVE OFFICERS AND CORPORATE GOVERNANCE |
Executive Officers
Below are the name, age and principal occupations for the last five years of each executive officer of StemCells, Inc., as of February 28, 2016. All such persons have been elected to serve until their successors are elected and qualified or until their earlier resignation or removal.
| Ian Massey, President and Chief Executive Officer |
65 | Ian Massey, D.Phil., joined the company in March 2015 as President and Chief Operating Officer. He was appointed President and Chief Executive Officer of the company and elected to the Board of Directors in January 2016. Prior to joining the company, Dr. Massey served as Chief Operating Officer and President of U.S. Operations of Biotie Therapies Corporation. In 2006, Dr. Massey was the co-founder, President and Chief Executive Officer of Synosia Therapeutics. Dr. Massey’s prior experience in the pharmaceutical industry included over 25 years first with Syntex and then with Roche where he held positions of increasing responsibility culminating in Sr. Vice President and Head of Research and Preclinical Development of Roche Palo Alto. | ||
| Gregory Schiffman, Chief Financial Officer and Executive Vice President, Finance |
58 | Gregory Schiffman joined the company in January 2014 as Chief Financial Officer and Executive Vice President, Finance. He is responsible for functions that include Finance, Information Technology and Investor Relations. Mr. Schiffman was Executive Vice President and CFO of Dendreon Corporation since 2007, prior to which he served as Controller of Hewlett Packard’s European P.C. manufacturing and distribution operations in Grenoble, France, and as manufacturing manager and controller of its Netmetrix Division. In November 2014, Dendreon Corporation filed for a Chapter 11 bankruptcy restructuring. | ||
| Kenneth Stratton General Counsel |
47 | Kenneth Stratton joined the company in February 2007 as General Counsel, with responsibility for corporate compliance and legal affairs. In March 2008, he assumed responsibilities for the Human Resources function. Prior to StemCells, Mr. Stratton served as Deputy General Counsel for Threshold Pharmaceuticals and as Senior Legal Counsel for Medtronic’s Vascular business unit. | ||
91
Table of Contents
Directors
Below are the name, age and principal occupations for the last five years of each Director of StemCells, Inc., as of February 28, 2016. Directors are elected to staggered three year terms.
| Eric H. Bjerkholt |
56 | Eric Bjerkholt was elected to the Board of Directors in March 2004. He is Executive Vice President and Chief Financial Officer of Sunesis Pharmaceuticals, Inc., a biopharmaceutical company. Mr. Bjerkholt is a member of the board of directors of Ambrx, Inc. and Corium International, Inc. | ||||
| R. Scott Greer |
57 | R. Scott Greer was elected to the Board of Directors in June 2010. He is currently a Principal and Managing Director of Numenor Ventures LLC which he founded in 2002 to provide funding and strategic advisory services to early stage enterprises. Mr. Greer currently serves on the boards of Nektar Therapeutics, Auspex Pharmaceuticals, Inc., Sientra, Inc., and Versartis, Inc. | ||||
| Ricardo Levy, Ph.D. |
71 | Ricardo Levy, Ph.D. was elected to the Board of Directors in September 2001. He currently serves on several boards of directors. | ||||
| Ian Massey, Ph.D. |
65 | Ian Massey, D.Phil., was elected to the Board of Directors in January 2016. He is President and Chief Executive Officer of the Company, a position he has held since January 2016. | ||||
| John Schwartz, Ph.D. |
80 | John Schwartz, Ph.D., was elected to the Board of Directors in December 1998 and was elected Chairman of the Board at the same time. He is currently President of Quantum Strategies Management Company. | ||||
| Alan Trounson, Ph.D. |
70 | Alan Trounson, Ph.D., was elected to the Board of Directors in July 2014. He most recently served as President of the California Institute for Regenerative Medicine (CIRM) from 2008 until 2014. | ||||
| Irving Weissman, M.D. |
76 | Irving L. Weissman, M.D., was elected to the Board of Directors in September 1997. He is the Virginia and Daniel K. Ludwig Professor of Cancer Research, Professor of Pathology and Professor of Developmental Biology at Stanford University and the Director of the Institute of Stem Cell Biology and Regenerative Medicine at Stanford. | ||||
92
Table of Contents
Certain other information required by this Item regarding our officers, directors, and corporate governance is incorporated herein by reference to the information appearing under the headings “Information About Our Directors” and “Information About Ownership of Our Common Stock” in our definitive proxy statement to be filed with the Securities and Exchange Commission within 120 days of December 31, 2016.
| Item 11. | EXECUTIVE COMPENSATION |
The information required by this Item is incorporated by reference from Item 5 of this Annual Report on Form 10-K and our Proxy Statement for the 2016 Annual Meeting of Stockholders.
| Item 12. | SECURITY OWNERSHIP OF CERTAIN BENEFICIAL OWNERS AND MANAGEMENT AND RELATED STOCKHOLDER MATTERS |
The information required by this Item is incorporated by reference from Item 5 of this Annual Report on Form 10-K and from our Proxy Statement for the 2016 Annual Meeting of Stockholders.
| Item 13. | CERTAIN RELATIONSHIPS AND RELATED TRANSACTIONS, AND DIRECTOR INDEPENDENCE |
The information required by this Item is incorporated by reference from our Proxy Statement for the 2016 Annual Meeting of Stockholders.
| Item 14. | PRINCIPAL ACCOUNTING FEES AND SERVICES |
The information required by this Item is incorporated by reference from our Proxy Statement for the 2016 Annual Meeting of Stockholders.
93
Table of Contents
PART IV
| Item 15. | EXHIBITS AND FINANCIAL STATEMENT SCHEDULES |
(a) The following documents are included as part of this Annual Report on Form 10-K.
(1) Financial Statements.
The financial statements filed as part of this Report are listed and indexed under Item 8 above.
(2) Financial Statement Schedules.
Schedules are not included herein because they are not applicable or the required information appears in the Financial Statements or Notes thereto.
(3) Exhibits.
The documents set forth below are filed herewith or incorporated by reference to the location indicated.
| Exhibit No. |
Title or Description | |
| 3.1 | Restated Certificate of Incorporation of the Registrant(1) | |
| 3.2 | Amended and Restated By-Laws of the Registrant(2) | |
| 4.1 | Specimen Common Stock Certificate(3) | |
| 4.2 | Form of Series A Warrant Certificate issued to certain purchasers of the Registrant’s common stock in December 2011(4) | |
| 4.3 | Form of Warrant Certificate issued to certain purchasers of the Registrant’s common stock in July 2014(5) | |
| 4.4 | Form of Warrant Certificate issued to certain purchasers of the Registrant’s common stock in April 2015(6) | |
| 10.1 | Form of at-will Employment Agreement between the Registrant and most of its employees(7) | |
| 10.2 | Form of Agreement for Consulting Services between the Registrant and the members of its Scientific Advisory Board(8) | |
| 10.3 | Consulting Agreement, dated as of September 25, 1997, between Dr. Irving Weissman and the Registrant(9) | |
| 10.4 # | StemCells, Inc. Amended and Restated 2004 Equity Incentive Plan(10) | |
| 10.5 & | License Agreement, dated as of July 1, 2005, between the Registrant and ReNeuron Limited(11) | |
| 10.6 # | Letter Agreement, effective as of February 2, 2007, between the Registrant and Kenneth B. Stratton(12) | |
| 10.7 # | Letter Agreement, effective as of August 6, 2009, between the Registrant and Kenneth B. Stratton(12) | |
| 10.8 & | License Agreement, dated as of January 31, 2006, between Stem Cell Sciences (Australia) Pty Limited and The University of Edinburgh(12) | |
| 10.9 | Lease agreement, dated December 2, 2010, between the Registrant and BMR-Gateway Boulevard LLC(13) | |
| 10.10 # | StemCells, Inc. Director’s Fee Plan(14) | |
94
Table of Contents
| Exhibit No. |
Title or Description | |
| 10.11 # | Form of equity award under Registrant’s 2012 Commencement Incentive Plan(15) | |
| 10.12 # | Amended and Restated 2006 Equity Incentive Plan of StemCells, Inc.(16) | |
| 10.13 & | Loan and Security Agreement, dated April 8, 2013, between the Registrant and Silicon Valley Bank(17) | |
| 10.14 & | Loan Agreement, dated April 9, 2013, between the Registrant and the California Institute for Regenerative Medicine(17) | |
| 10.15 & | Notice of Loan Award, effective as of April 10, 2013, between the Registrant and the California Institute for Regenerative Medicine(17) | |
| 10.16 # | Amendment to the Notice of Loan Award, effective as of December 12, 2014, between the Registrant and the California Institute for Regenerative Medicine(18) | |
| 10.17 # | 2013 Equity Incentive Plan(19) | |
| 10.18 | Lease agreement, dated March 20, 2013, between the Registrant and Prologis L.P.(20) | |
| 10.20 # | Letter Agreement, dated November 13, 2013, between the Registrant and Gregory Schiffman(20) | |
| 10.21 #* | Letter Agreement, dated March 6, 2015, between the Registrant and Ian J. Massey | |
| 10.22 #* | Letter Agreement, dated January 14, 2016, between the Registrant and Ian J. Massey | |
| 21 | Subsidiaries of the Registrant(20) | |
| 23.1* | Consent of Grant Thornton, LLP, Independent Registered Public Accounting Firm | |
| 31.1* | Certification Pursuant to Securities Exchange Act Rule 13(a)-14(a), as Adopted Pursuant to Section 302 of the Sarbanes-Oxley Act of 2002 (Ian J. Massey, Chief Executive Officer) | |
| 31.2* | Certification Pursuant to Securities Exchange Act Rule 13(a)-14(a), as Adopted Pursuant to Section 302 of the Sarbanes-Oxley Act of 2002 (Gregory Schiffman, Chief Financial Officer) | |
| 32.1** | Certification Pursuant to 18 U.S.C. Section 1350, As Adopted Pursuant to Section 906 of the Sarbanes-Oxley Act of 2002 (Ian J. Massey, Chief Executive Officer) | |
| 32.2** | Certification Pursuant to 18 U.S.C. Section 1350, As Adopted Pursuant to Section 906 of the Sarbanes-Oxley Act of 2002 (Gregory Schiffman, Chief Financial Officer) | |
| 101.1 | The following materials from the Registrant’s Annual Report on Form 10-K for the year ended December 31, 2013 are formatted in XBRL (eXtensible Business Reporting Language): (i) the Consolidated Balance Sheets, (ii) the Consolidated Statements of Operations, (iii) the Consolidated Statements of Cash Flows, and (iv) Notes to Condensed Consolidated Financial Statements. | |
| # | Indicates management compensatory plan, contract or arrangement. |
| & | Confidential treatment requested as to certain portions. Material has been omitted and separately filed with the Commission. |
| * | Filed herewith. |
| ** | Furnished herewith. |
| (1) | Incorporated by reference to the Registrant’s Annual Report on Form 10-K for the fiscal year ended December 31, 2006 and filed on March 15, 2007. |
| (2) | Incorporated by reference to the Registrant’s current report on Form 8-K filed on October 23, 2015. |
| (3) | Incorporated by reference to the Registrant’s Registration Statement on Form S-3, File No. 333-151891. |
| (4) | Incorporated by reference to the Registrant’s current report on Form 8-K filed on December 16, 2011. |
| (5) | Incorporated by reference to the Registrant’s current report on Form 8-K filed on July 14, 2014. |
| (6) | Incorporated by reference to the Registrant’s current report on Form 8-K filed on April 27, 2015. |
| (7) | Incorporated by reference to the Registrant’s annual report on Form 10-K for the fiscal year ended December 31, 2008 and filed on March 16, 2009. |
95
Table of Contents
| (8) | Incorporated by reference to the Registrant’s Registration Statement on Form S-1, File No. 33-45739. |
| (9) | Incorporated by reference to the Registrant’s Quarterly Report on Form 10-Q for the quarter ended September 30, 1997 and filed on November 14, 1997. |
| (10) | Incorporated by reference to the Registrants Registration Statement on Form S-8, File No. 333-118263. |
| (11) | Incorporated by reference to the Registrant’s Quarterly Report on Form 10-Q for the quarter ended June 30, 2005. |
| (12) | Incorporated by reference to the Registrant’s annual report on Form 10-K for the fiscal year ended December 31, 2009 and filed on March 11, 2010. |
| (13) | Incorporated by reference to the Registrant’s Annual Report on Form 10-K for the fiscal year ended December 31, 2010 and filed on March 11, 2011. |
| (14) | Incorporated by reference to the Registrant’s Annual Report on Form 10-K for the fiscal year ended December 31, 2011 and filed on March 15, 2012. |
| (15) | Incorporated by reference to the Registrant’s Registration Statement on Form S-8, File No. 333-183712. |
| (16) | Incorporated by reference to the Registrant’s Registration Statement on Form S-8, File No. 333-144747. |
| (17) | Incorporated by reference to the Registrant’s Annual Report on Form 10-K/A for the fiscal year ended December 31, 2012 and filed on October 11, 2013. |
| (18) | Incorporated by reference to the Registrant’s Annual Report on Form 10-K for the fiscal year ended December 31, 2014 and filed on March 13, 2015. |
| (19) | Incorporated by reference to the Registrant’s definitive proxy statement filed October 31, 2013. |
| (20) | Incorporated by reference to the Registrant’s Annual Report on Form 10-K for the fiscal year ended December 31, 2013 and filed on March 13, 2014. |
96
Table of Contents
SIGNATURES
Pursuant to the requirements of Section 13 or 15(d) of the Securities Exchange Act of 1934, the Registrant has duly caused this Report to be signed on its behalf by the undersigned, thereunto duly authorized.
| STEMCELLS, INC. | ||
| By: | /s/ IAN J. MASSEY | |
| Ian J. Massey | ||
| PRESIDENT AND CHIEF EXECUTIVE OFFICER | ||
Dated: March 15, 2016
Pursuant to the requirements of the Securities Exchange Act of 1934, this report has been signed below by the following persons on behalf of the Registrant and in the capacities and on the dates indicated.
| Signature |
Capacity |
Date | ||
| /s/ IAN J. MASSEY, PH.D. Ian J. Massey, Ph.D. |
President and Chief Executive Officer and Director (principal executive officer) |
March 15, 2016 | ||
| /s/ GREGORY SCHIFFMAN Gregory Schiffman |
Chief Financial Officer (principal financial officer) |
March 15, 2016 | ||
| /s/ GEORGE KOSHY George Koshy |
Chief Accounting Officer (principal accounting officer) |
March 15, 2016 | ||
| /s/ ERIC BJERKHOLT Eric Bjerkholt |
Director | March 15, 2016 | ||
| /s/ R. SCOTT GREER R. Scott Greer |
Director | March 15, 2016 | ||
| /s/ RICARDO B. LEVY, PH.D. Ricardo B. Levy, Ph.D. |
Director | March 15, 2016 | ||
| /s/ JOHN J. SCHWARTZ, PH.D. John J. Schwartz, Ph.D. |
Director, Chairman of the Board | March 15, 2016 | ||
| /s/ ALAN TROUNSON, PH.D. Alan Trounson, Ph.D. |
Director | March 15, 2016 | ||
| /s/ IRVING L. WEISSMAN, M.D. Irving L. Weissman, M.D. |
Director | March 15, 2016 | ||
97
Table of Contents
Exhibit Index
| Exhibit No. |
Title or Description | |
| 3.1 | Restated Certificate of Incorporation of the Registrant(1) | |
| 3.2 | Amended and Restated By-Laws of the Registrant(2) | |
| 4.1 | Specimen Common Stock Certificate(3) | |
| 4.2 | Form of Series A Warrant Certificate issued to certain purchasers of the Registrant’s common stock in December 2011(4) | |
| 4.3 | Form of Warrant Certificate issued to certain purchasers of the Registrant’s common stock in July 2014(5) | |
| 4.4 | Form of Warrant Certificate issued to certain purchasers of the Registrant’s common stock in April 2015(6) | |
| 10.1 | Form of at-will Employment Agreement between the Registrant and most of its employees(7) | |
| 10.2 | Form of Agreement for Consulting Services between the Registrant and the members of its Scientific Advisory Board(8) | |
| 10.3 | Consulting Agreement, dated as of September 25, 1997, between Dr. Irving Weissman and the Registrant(9) | |
| 10.4 # | StemCells, Inc. Amended and Restated 2004 Equity Incentive Plan(10) | |
| 10.5 & | License Agreement, dated as of July 1, 2005, between the Registrant and ReNeuron Limited(11) | |
| 10.6 # | Letter Agreement, effective as of February 2, 2007, between the Registrant and Kenneth B. Stratton(12) | |
| 10.7 # | Letter Agreement, effective as of August 6, 2009, between the Registrant and Kenneth B. Stratton(12) | |
| 10.8 & | License Agreement, dated as of January 31, 2006, between Stem Cell Sciences (Australia) Pty Limited and The University of Edinburgh(12) | |
| 10.9 | Lease agreement, dated December 2, 2010, between the Registrant and BMR-Gateway Boulevard LLC(13) | |
| 10.10 # | StemCells, Inc. Director’s Fee Plan(14) | |
| 10.11 # | Form of equity award under Registrant’s 2012 Commencement Incentive Plan(15) | |
| 10.12 # | Amended and Restated 2006 Equity Incentive Plan of StemCells, Inc.(16) | |
| 10.13 & | Loan and Security Agreement, dated April 8, 2013, between the Registrant and Silicon Valley Bank(17) | |
| 10.14 & | Loan Agreement, dated April 9, 2013, between the Registrant and the California Institute for Regenerative Medicine(17) | |
| 10.15 & | Notice of Loan Award, effective as of April 10, 2013, between the Registrant and the California Institute for Regenerative Medicine(17) | |
| 10.16 # | Amendment to the Notice of Loan Award, effective as of December 12, 2014, between the Registrant and the California Institute for Regenerative Medicine(18) | |
| 10.17 # | 2013 Equity Incentive Plan(19) | |
| 10.18 | Lease agreement, dated March 20, 2013, between the Registrant and Prologis L.P.(20) | |
98
Table of Contents
| Exhibit No. |
Title or Description | |
| 10.20 # | Letter Agreement, dated November 13, 2013, between the Registrant and Gregory Schiffman(20) | |
| 10.21 #* | Letter Agreement, dated March 6, 2015, between the Registrant and Ian J. Massey | |
| 10.22 #* | Letter Agreement, dated January 14, 2016, between the Registrant and Ian J. Massey | |
| 21 | Subsidiaries of the Registrant(20) | |
| 23.1* | Consent of Grant Thornton, LLP, Independent Registered Public Accounting Firm | |
| 31.1* | Certification Pursuant to Securities Exchange Act Rule 13(a)-14(a), as Adopted Pursuant to Section 302 of the Sarbanes-Oxley Act of 2002 (Ian J. Massey, Chief Executive Officer) | |
| 31.2* | Certification Pursuant to Securities Exchange Act Rule 13(a)-14(a), as Adopted Pursuant to Section 302 of the Sarbanes-Oxley Act of 2002 (Gregory Schiffman, Chief Financial Officer) | |
| 32.1** | Certification Pursuant to 18 U.S.C. Section 1350, As Adopted Pursuant to Section 906 of the Sarbanes-Oxley Act of 2002 (Ian J. Massey, Chief Executive Officer) | |
| 32.2** | Certification Pursuant to 18 U.S.C. Section 1350, As Adopted Pursuant to Section 906 of the Sarbanes-Oxley Act of 2002 (Gregory Schiffman, Chief Financial Officer) | |
| 101.1 | The following materials from the Registrant’s Annual Report on Form 10-K for the year ended December 31, 2013 are formatted in XBRL (eXtensible Business Reporting Language): (i) the Consolidated Balance Sheets, (ii) the Consolidated Statements of Operations, (iii) the Consolidated Statements of Cash Flows, and (iv) Notes to Condensed Consolidated Financial Statements. | |
| # | Indicates management compensatory plan, contract or arrangement. |
| & | Confidential treatment requested as to certain portions. Material has been omitted and separately filed with the Commission. |
| * | Filed herewith. |
| ** | Furnished herewith. |
| (1) | Incorporated by reference to the Registrant’s Annual Report on Form 10-K for the fiscal year ended December 31, 2006 and filed on March 15, 2007. |
| (2) | Incorporated by reference to the Registrant’s current report on Form 8-K filed on October 23, 2015. |
| (3) | Incorporated by reference to the Registrant’s Registration Statement on Form S-3, File No. 333-151891. |
| (4) | Incorporated by reference to the Registrant’s current report on Form 8-K filed on December 16, 2011. |
| (5) | Incorporated by reference to the Registrant’s current report on Form 8-K filed on July 14, 2014. |
| (6) | Incorporated by reference to the Registrant’s current report on Form 8-K filed on April 27, 2015. |
| (7) | Incorporated by reference to the Registrant’s annual report on Form 10-K for the fiscal year ended December 31, 2008 and filed on March 16, 2009. |
| (8) | Incorporated by reference to the Registrant’s Registration Statement on Form S-1, File No. 33-45739. |
| (9) | Incorporated by reference to the Registrant’s Quarterly Report on Form 10-Q for the quarter ended September 30, 1997 and filed on November 14, 1997. |
| (10) | Incorporated by reference to the Registrants Registration Statement on Form S-8, File No. 333-118263. |
| (11) | Incorporated by reference to the Registrant’s Quarterly Report on Form 10-Q for the quarter ended June 30, 2005. |
| (12) | Incorporated by reference to the Registrant’s annual report on Form 10-K for the fiscal year ended December 31, 2009 and filed on March 11, 2010. |
| (13) | Incorporated by reference to the Registrant’s Annual Report on Form 10-K for the fiscal year ended December 31, 2010 and filed on March 11, 2011. |
| (14) | Incorporated by reference to the Registrant’s Annual Report on Form 10-K for the fiscal year ended December 31, 2011 and filed on March 15, 2012. |
| (15) | Incorporated by reference to the Registrant’s Registration Statement on Form S-8, File No. 333-183712. |
| (16) | Incorporated by reference to the Registrant’s Registration Statement on Form S-8, File No. 333-144747. |
99
Table of Contents
| (17) | Incorporated by reference to the Registrant’s Annual Report on Form 10-K/A for the fiscal year ended December 31, 2012 and filed on October 11, 2013. |
| (18) | Incorporated by reference to the Registrant’s Annual Report on Form 10-K for the fiscal year ended December 31, 2014 and filed on March 13, 2015. |
| (19) | Incorporated by reference to the Registrant’s definitive proxy statement filed October 31, 2013. |
| (20) | Incorporated by reference to the Registrant’s Annual Report on Form 10-K for the fiscal year ended December 31, 2013 and filed on March 13, 2014. |
100