Attached files
| file | filename |
|---|---|
| EX-99.1 - EX-99.1 - Farmland Partners Inc. | a16-6372_1ex99d1.htm |
| 8-K - 8-K - Farmland Partners Inc. | a16-6372_18k.htm |
Exhibit 99.2
Fourth Quarter and Fiscal Year 2015 Earnings Call Supplement March 15, 2016
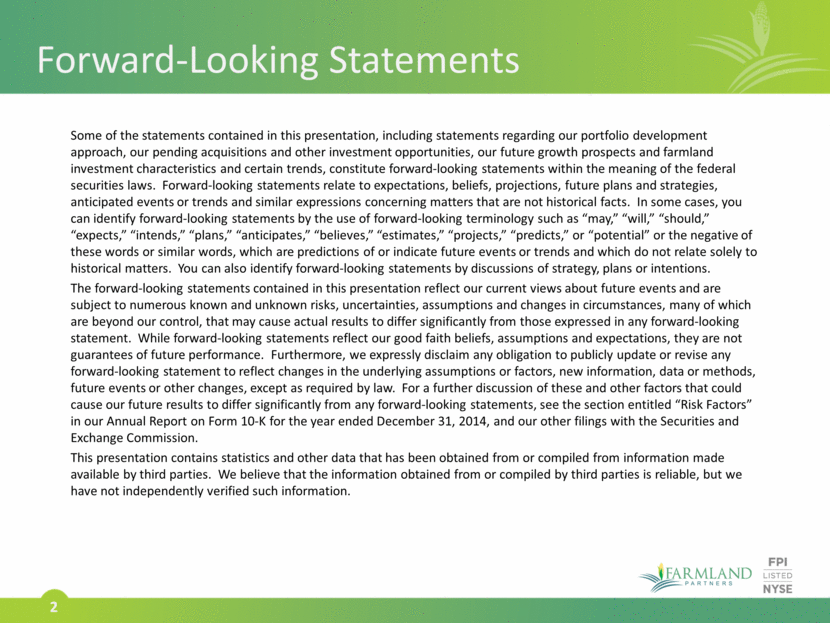
Forward-Looking Statements 2 Some of the statements contained in this presentation, including statements regarding our portfolio development approach, our pending acquisitions and other investment opportunities, our future growth prospects and farmland investment characteristics and certain trends, constitute forward-looking statements within the meaning of the federal securities laws. Forward-looking statements relate to expectations, beliefs, projections, future plans and strategies, anticipated events or trends and similar expressions concerning matters that are not historical facts. In some cases, you can identify forward-looking statements by the use of forward-looking terminology such as “may,” “will,” “should,” “expects,” “intends,” “plans,” “anticipates,” “believes,” “estimates,” “projects,” “predicts,” or “potential” or the negative of these words or similar words, which are predictions of or indicate future events or trends and which do not relate solely to historical matters. You can also identify forward-looking statements by discussions of strategy, plans or intentions. The forward-looking statements contained in this presentation reflect our current views about future events and are subject to numerous known and unknown risks, uncertainties, assumptions and changes in circumstances, many of which are beyond our control, that may cause actual results to differ significantly from those expressed in any forward-looking statement. While forward-looking statements reflect our good faith beliefs, assumptions and expectations, they are not guarantees of future performance. Furthermore, we expressly disclaim any obligation to publicly update or revise any forward-looking statement to reflect changes in the underlying assumptions or factors, new information, data or methods, future events or other changes, except as required by law. For a further discussion of these and other factors that could cause our future results to differ significantly from any forward-looking statements, see the section entitled “Risk Factors” in our Annual Report on Form 10-K for the year ended December 31, 2014, and our other filings with the Securities and Exchange Commission. This presentation contains statistics and other data that has been obtained from or compiled from information made available by third parties. We believe that the information obtained from or compiled by third parties is reliable, but we have not independently verified such information.
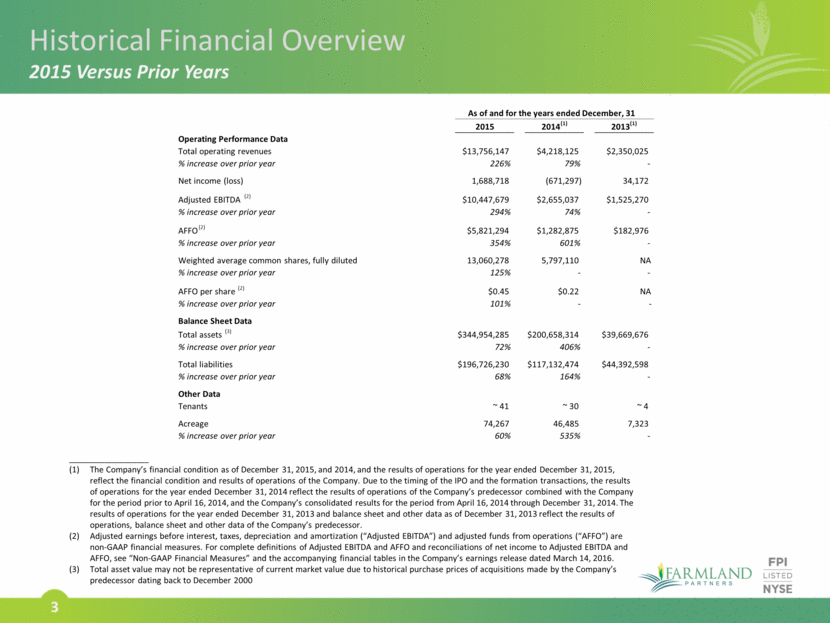
3 ____________________ The Company’s financial condition as of December 31, 2015, and 2014, and the results of operations for the year ended December 31, 2015, reflect the financial condition and results of operations of the Company. Due to the timing of the IPO and the formation transactions, the results of operations for the year ended December 31, 2014 reflect the results of operations of the Company’s predecessor combined with the Company for the period prior to April 16, 2014, and the Company’s consolidated results for the period from April 16, 2014 through December 31, 2014. The results of operations for the year ended December 31, 2013 and balance sheet and other data as of December 31, 2013 reflect the results of operations, balance sheet and other data of the Company’s predecessor. Adjusted earnings before interest, taxes, depreciation and amortization (“Adjusted EBITDA”) and adjusted funds from operations (“AFFO”) are non-GAAP financial measures. For complete definitions of Adjusted EBITDA and AFFO and reconciliations of net income to Adjusted EBITDA and AFFO, see “Non-GAAP Financial Measures” and the accompanying financial tables in the Company’s earnings release dated March 14, 2016. Total asset value may not be representative of current market value due to historical purchase prices of acquisitions made by the Company’s predecessor dating back to December 2000 Historical Financial Overview 2015 Versus Prior Years 2015 2014 (1) 2013 (1) Operating Performance Data Total operating revenues $13,756,147 $4,218,125 $2,350,025 % increase over prior year 226% 79% - Net income (loss) 1,688,718 (671,297) 34,172 Adjusted EBITDA (2) $10,447,679 $2,655,037 $1,525,270 % increase over prior year 294% 74% - AFFO (2) $5,821,294 $1,282,875 $182,976 % increase over prior year 354% 601% - Weighted average common shares, fully diluted 13,060,278 5,797,110 NA % increase over prior year 125% - - AFFO per share (2) $0.45 $0.22 NA % increase over prior year 101% - - Balance Sheet Data Total assets (3) $344,954,285 $200,658,314 $39,669,676 % increase over prior year 72% 406% - Total liabilities $196,726,230 $117,132,474 $44,392,598 % increase over prior year 68% 164% - Other Data Tenants ~ 41 ~ 30 ~ 4 Acreage 74,267 46,485 7,323 % increase over prior year 60% 535% - As of and for the years ended December, 31
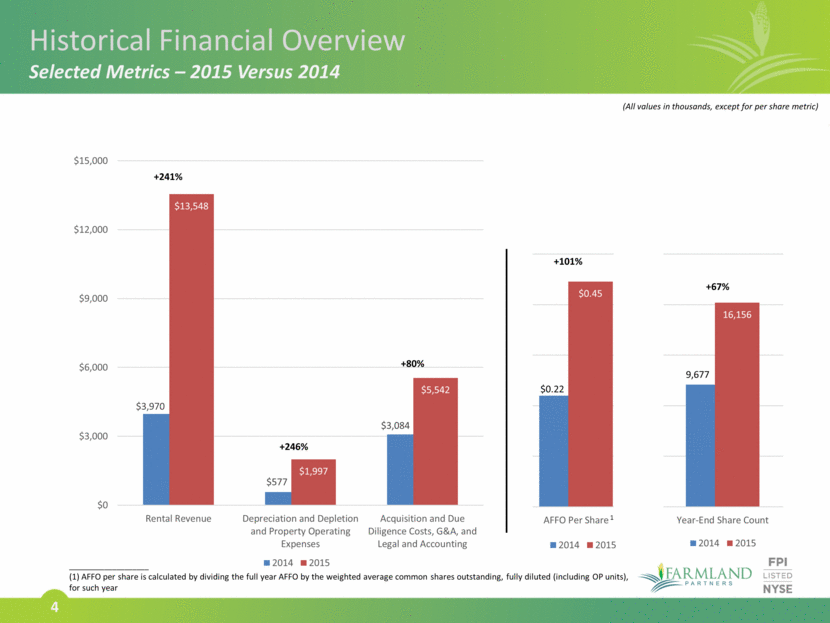
4 Historical Financial Overview Selected Metrics – 2015 Versus 2014 (All values in thousands, except for per share metric) +241% +246% +80% 1.98x 2014 total 1.67x 2014 total +101% 1.67x 2014 total +67% ____________________ (1) AFFO per share is calculated by dividing the full year AFFO by the weighted average common shares outstanding, fully diluted (including OP units), for such year 1 $3,970 $577 $3,084 $13,548 $1,997 $5,542 $0 $3,000 $6,000 $9,000 $12,000 $15,000 Rental Revenue Depreciation and Depletion and Property Operating Expenses Acquisition and Due Diligence Costs, G&A, and Legal and Accounting 2014 2015 $0.22 0.01 $0.45 AFFO Per Share Filler 2014 2015 9,677 $0 16,156 $0 0 4,000 8,000 12,000 16,000 20,000 Year-End Share Count Filler 2014 2015
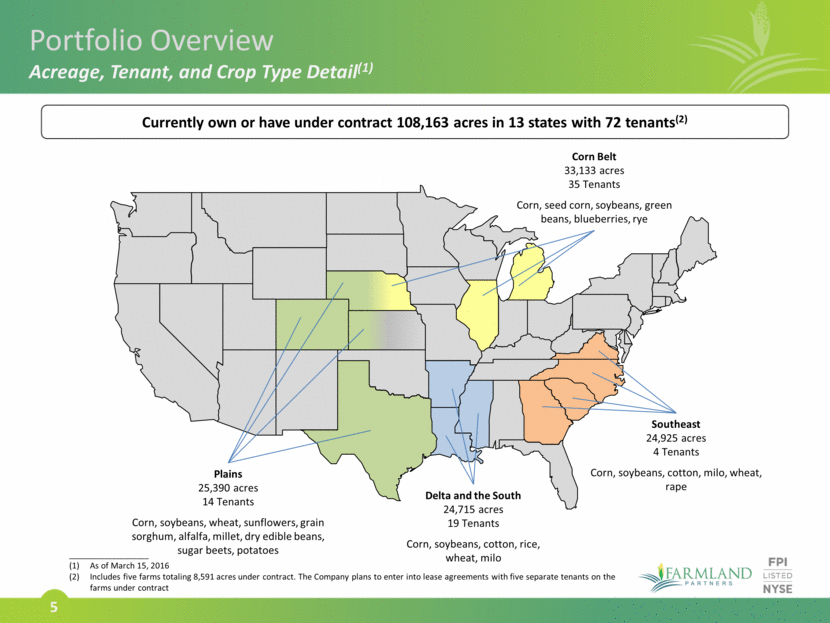
5 Portfolio Overview Acreage, Tenant, and Crop Type Detail(1) Corn Belt 33,133 acres 35 Tenants Corn, seed corn, soybeans, green beans, blueberries, rye Southeast 24,925 acres 4 Tenants Corn, soybeans, cotton, milo, wheat, rape Delta and the South 24,715 acres 19 Tenants Corn, soybeans, cotton, rice, wheat, milo Plains 25,390 acres 14 Tenants Corn, soybeans, wheat, sunflowers, grain sorghum, alfalfa, millet, dry edible beans, sugar beets, potatoes Currently own or have under contract 108,163 acres in 13 states with 72 tenants(2) ____________________ As of March 15, 2016 Includes five farms totaling 8,591 acres under contract. The Company plans to enter into lease agreements with five separate tenants on the farms under contract
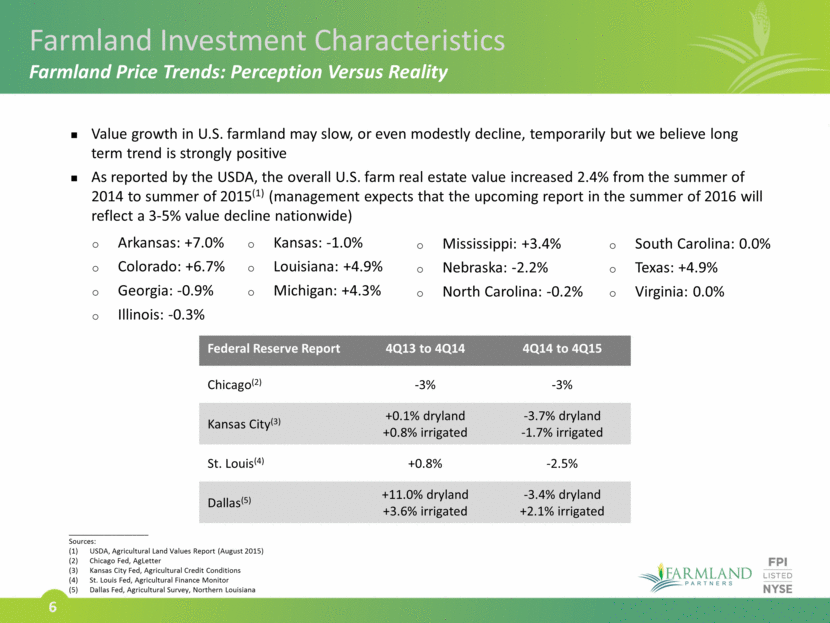
Value growth in U.S. farmland may slow, or even modestly decline, temporarily but we believe long term trend is strongly positive As reported by the USDA, the overall U.S. farm real estate value increased 2.4% from the summer of 2014 to summer of 2015(1) (management expects that the upcoming report in the summer of 2016 will reflect a 3-5% value decline nationwide) 6 Mississippi: +3.4% Nebraska: -2.2% North Carolina: -0.2% South Carolina: 0.0% Texas: +4.9% Virginia: 0.0% Farmland Investment Characteristics Farmland Price Trends: Perception Versus Reality Kansas: -1.0% Louisiana: +4.9% Michigan: +4.3% Arkansas: +7.0% Colorado: +6.7% Georgia: -0.9% Illinois: -0.3% Federal Reserve Report 4Q13 to 4Q14 4Q14 to 4Q15 Chicago(2) -3% -3% Kansas City(3) +0.1% dryland +0.8% irrigated -3.7% dryland -1.7% irrigated St. Louis(4) +0.8% -2.5% Dallas(5) +11.0% dryland +3.6% irrigated -3.4% dryland +2.1% irrigated ____________________ Sources: USDA, Agricultural Land Values Report (August 2015) Chicago Fed, AgLetter Kansas City Fed, Agricultural Credit Conditions St. Louis Fed, Agricultural Finance Monitor Dallas Fed, Agricultural Survey, Northern Louisiana
