Attached files
| file | filename |
|---|---|
| 8-K - 8-K - NorthStar Realty Europe Corp. | nre8-k2016citiconference.htm |

©2016 NorthStar Realty Europe Corp. ©2016 NorthStar Realty Europe Corp. Corporate Presentation March 14, 2016 Exhibit 99.1
©2016 NorthStar Realty Europe Corp. Forward Looking Statements 2 This presentation may contain certain “forward-looking statements” within the meaning of the Private Securities Litigation Reform Act of 1995, Section 27A of the Securities Act of 1933, as amended, and Section 21E of the Securities Exchange Act of 1934, as amended, including statements about future results, growth potential, projected leverage, projected supply growth, projected yields, projected demand, projected economic growth, rates of return and performance, projected rental rate growth, ability to reposition or enhance the performance of existing properties, market and industry trends, investment opportunities, business conditions and other matters, including, among other things: the commercial real estate industry has been and may continue to be adversely affected by economic conditions and geopolitical events in Europe, the United States, China and elsewhere, NorthStar Realty Europe Corp.’s (NRE) rapid growth and relatively limited experience investing in Europe; the ability of NorthStar Asset Management Group Inc. (NSAM) to scale its operations in Europe to effectively manage NRE; NRE’s ability to qualify and remain qualified as a real estate investment trust (REIT); access to debt and equity capital and liquidity; use of leverage and ability to comply with the terms of any borrowing arrangements; the ability to obtain mortgage financing on real estate portfolio on favorable terms or at all; the effect of economic conditions, particularly in Europe, on the valuation of European investments and on the tenants of owned real property; the occurrence of terrorism or hostilities involving Europe; the unknown impact of the potential default and/or exit of one or more countries within the European Union; NRE’s ability to acquire attractive investment opportunities and the impact of competition for attractive investment opportunities; NRE’s performance pursuant to long-term management contracts with NSAM as its manager, including reliance on NSAM and its affiliates and sub-advisors/joint venture partners in providing management services to NRE, the payment of substantial base and potential incentive fees to NSAM, the allocation of investments by NSAM among NRE and NSAM’s and its affiliates’ other managed companies and strategic vehicles and various conflicts of interest in the relationship with NSAM; the effectiveness of portfolio management techniques and strategies, including reliance on third parties and the potential loss and/or liability arising as a result of our relationships with such third parties; the impact of adverse conditions affecting a specific property type in which NRE has investments, such as office properties; tenant defaults or bankruptcy; illiquidity of properties in their portfolios; the ability to realize current and expected return over the life of investments; any failure in NRE’s due diligence to identify all relevant facts in the underwriting process or otherwise; the impact of credit rating downgrades; the ability to manage costs in line with expectations and the impact on cash available for distribution (CAD) and net operating income (NOI); environmental and regulatory requirements, compliance costs and liabilities related to owning and operating properties and to a business in general; effect of regulatory actions, litigation and contractual claims against NRE and its affiliates, including the potential settlement and litigation of such claims; changes in international and domestic laws or regulations governing various aspects of NRE’s business; future changes in local tax law that may have an adverse impact on the cash flow and value of investments; the ability to effectively structure investments in a tax efficient manner, including for local tax purposes; the impact that a rise in future interest rates may have on NRE’s floating rate financing; potential devaluation of the Euro relative to the U.S. dollar due to quantitative easing and/or other factors which could cause the U.S. dollar value of NRE’s investments to decline; general foreign exchange risk associated with properties located in European countries located outside of the Eurozone, including the United Kingdom and Sweden; the loss of our exemption from the definition of an “investment company” under the Investment Company Act of 1940, as amended; competition for qualified personnel and NSAM’s ability to retain key personnel to manage NRE effectively; the impact of damage to the NorthStar brand and reputation resulting from internal or external causes; the lack of historical financial statements for properties we may acquire in compliance with U.S. Securities and Exchange Commission (SEC) requirements and U.S. generally accepted accounting principles, as well as the lack of familiarity of tenants and third party service providers with such requirements and principles; failure to maintain effective internal controls and disclosure controls and procedures; and NRE’s status as an emerging growth company. Forward-looking statements are generally identifiable by use of forward-looking terminology such as “may,” “will,” “should,” “potential,” “intend,” “expect,” “seek,” “anticipate,” “estimate,” “believe,” “could,” “project,” “predict,” “hypothetical,” “continue,” “future” or other similar words or expressions. All forward-looking statements included in this presentation are based upon information available to us on the date hereof and we undertake no duty to update any of the forward-looking statements after the date of this presentation to conform these statements to actual results. The forward-looking statements involve a number of significant risks and uncertainties. Factors that could have a material adverse effect on our operations and future prospects are set forth in NorthStar Realty Europe Corp.’s Registration Statement on Form S-11 (Reg. No. 333-205440), including the section entitled “Risk Factors”. The factors set forth in the Risk Factors section and otherwise described in NRE filings with the SEC could cause actual results to differ significantly from those contained in any forward-looking statement contained in this presentation. We do not guarantee that the assumptions underlying such forward-looking statements are free from errors. This presentation is for informational purposes only and does not constitute an offer to sell or a solicitation of an offer to buy any securities of NorthStar Realty Europe Corp. The endnotes herein contain important information that is material to an understanding of this presentation and you should read this presentation only with and in context of the endnotes.
©2016 NorthStar Realty Europe Corp. Overview(1) 3 • NorthStar Realty Europe Corp. (NYSE:NRE) is a European focused REIT • Focused strategy targeting prime office properties in key cities within Germany, the United Kingdom and France • Compelling market opportunity in Europe • $2.6 billion portfolio acquired in four transactions since 2014 • Recent valuation by Cushman & Wakefield implies NAV of $18 per share • Experienced and dedicated management team with established local networks • Proven track record of successfully sourcing, managing and exiting European investments • Creating shareholder value through stable and recurring income stream supplemented by capital growth over time
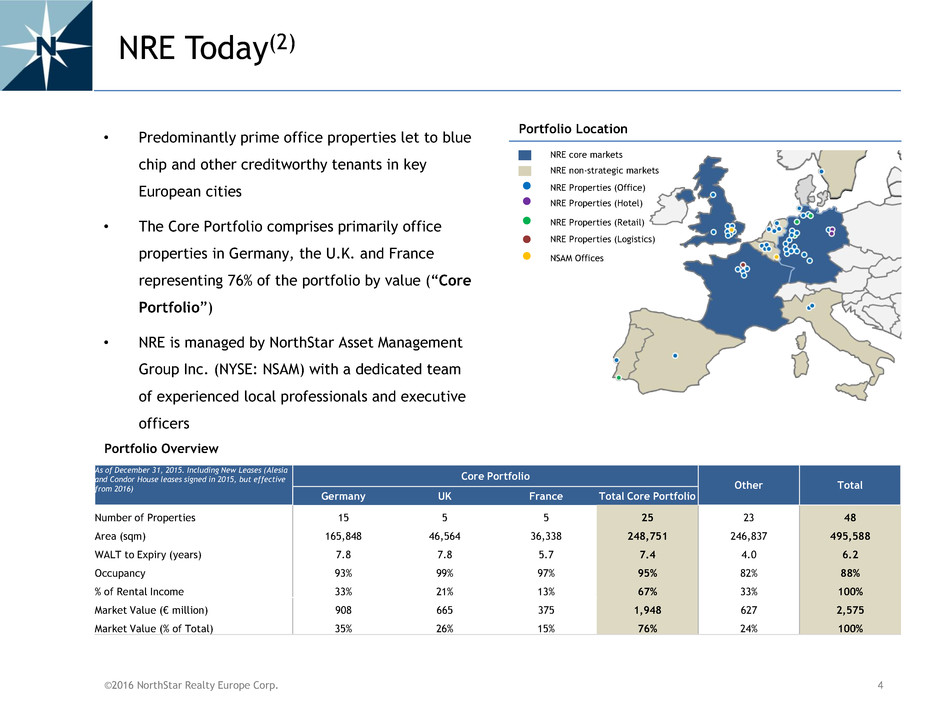
©2016 NorthStar Realty Europe Corp. • Predominantly prime office properties let to blue chip and other creditworthy tenants in key European cities • The Core Portfolio comprises primarily office properties in Germany, the U.K. and France representing 76% of the portfolio by value (“Core Portfolio”) • NRE is managed by NorthStar Asset Management Group Inc. (NYSE: NSAM) with a dedicated team of experienced local professionals and executive officers NRE Today(2) 4 NRE Properties (Hotel) NRE non-strategic markets NRE Properties (Office) NRE core markets NRE Properties (Retail) NRE Properties (Logistics) NSAM Offices Portfolio Location As of December 31, 2015. Including New Leases (Alesia and Condor House leases signed in 2015, but effective from 2016) Core Portfolio Other Total Germany UK France Total Core Portfolio Number of Properties 15 5 5 25 23 48 Area (sqm) 165,848 46,564 36,338 248,751 246,837 495,588 WALT to Expiry (years) 7.8 7.8 5.7 7.4 4.0 6.2 Occupancy 93% 99% 97% 95% 82% 88% % of Rental Income 33% 21% 13% 67% 33% 100% Market Value (€ million) 908 665 375 1,948 627 2,575 Market Value (% of Total) 35% 26% 15% 76% 24% 100% Portfolio Overview
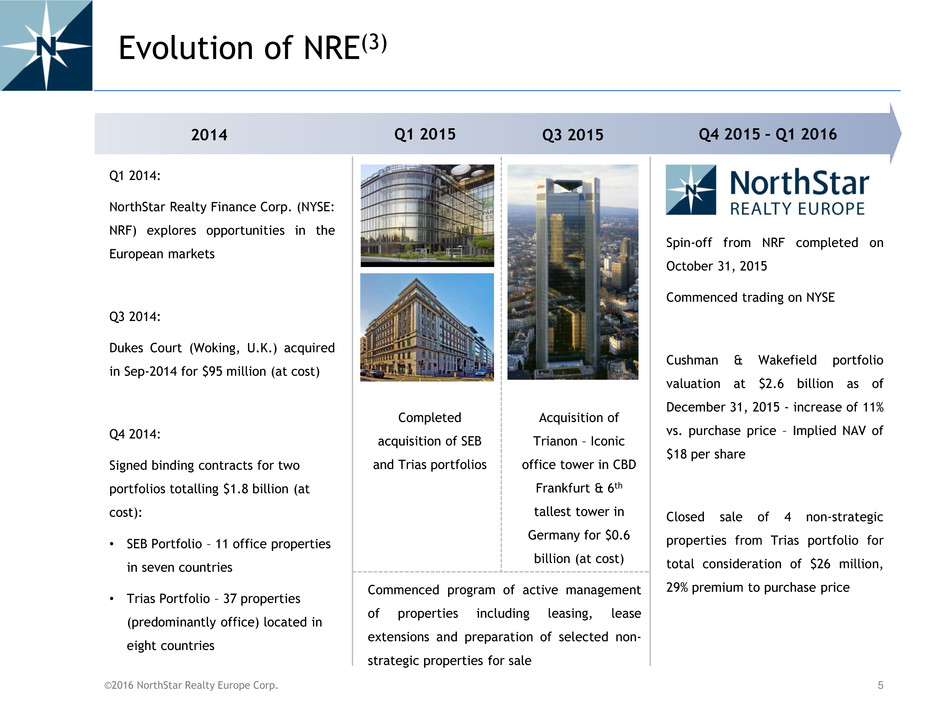
©2016 NorthStar Realty Europe Corp. Evolution of NRE(3) 5 2014 Q1 2015 Q4 2015 – Q1 2016 Q1 2014: NorthStar Realty Finance Corp. (NYSE: NRF) explores opportunities in the European markets Q3 2014: Dukes Court (Woking, U.K.) acquired in Sep-2014 for $95 million (at cost) Q4 2014: Signed binding contracts for two portfolios totalling $1.8 billion (at cost): • SEB Portfolio – 11 office properties in seven countries • Trias Portfolio – 37 properties (predominantly office) located in eight countries Acquisition of Trianon – Iconic office tower in CBD Frankfurt & 6th tallest tower in Germany for $0.6 billion (at cost) Spin-off from NRF completed on October 31, 2015 Commenced trading on NYSE Cushman & Wakefield portfolio valuation at $2.6 billion as of December 31, 2015 - increase of 11% vs. purchase price – Implied NAV of $18 per share Closed sale of 4 non-strategic properties from Trias portfolio for total consideration of $26 million, 29% premium to purchase price Q3 2015 Completed acquisition of SEB and Trias portfolios Commenced program of active management of properties including leasing, lease extensions and preparation of selected non- strategic properties for sale
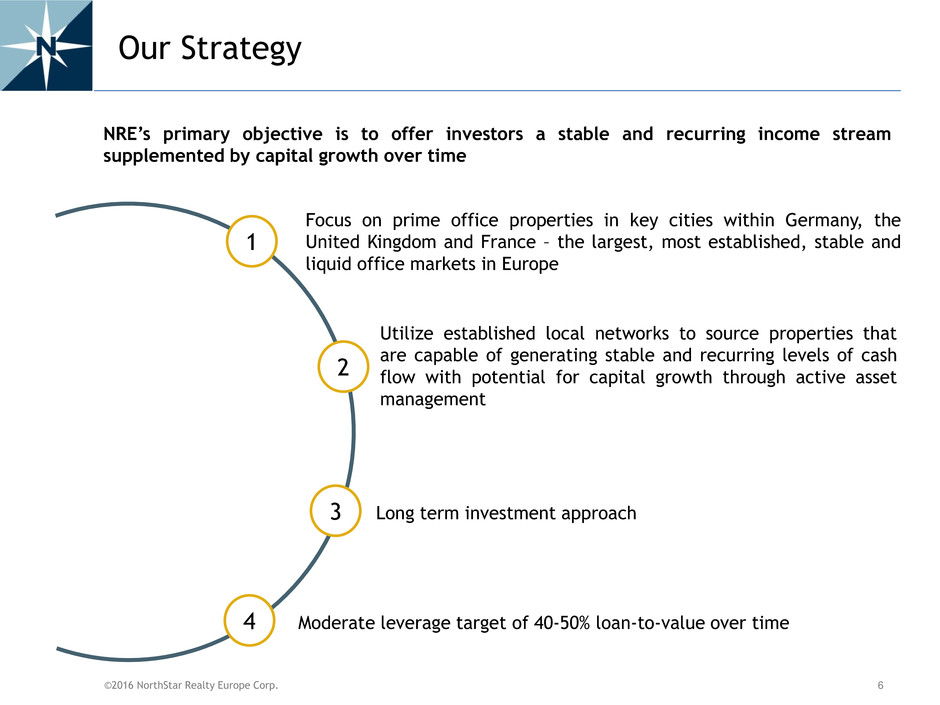
©2016 NorthStar Realty Europe Corp. Our Strategy 6 1 2 3 4 NRE’s primary objective is to offer investors a stable and recurring income stream supplemented by capital growth over time Utilize established local networks to source properties that are capable of generating stable and recurring levels of cash flow with potential for capital growth through active asset management Focus on prime office properties in key cities within Germany, the United Kingdom and France – the largest, most established, stable and liquid office markets in Europe Long term investment approach Moderate leverage target of 40-50% loan-to-value over time
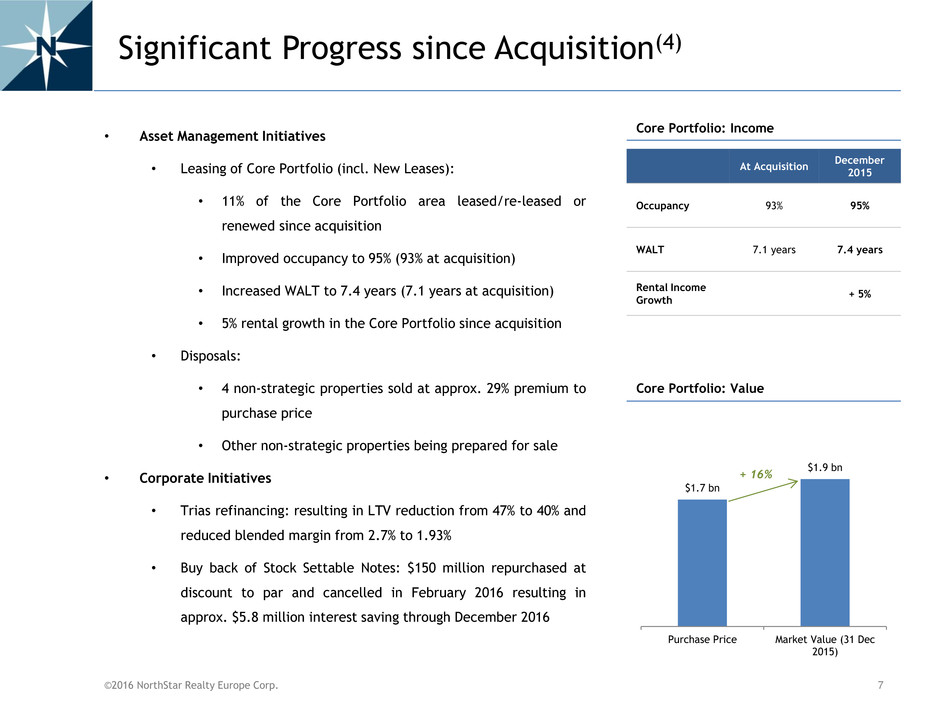
©2016 NorthStar Realty Europe Corp. $1.7 bn $1.9 bn Purchase Price Market Value (31 Dec 2015) Significant Progress since Acquisition(4) 7 Core Portfolio: Income At Acquisition December 2015 Occupancy 93% 95% WALT 7.1 years 7.4 years Rental Income Growth + 5% Core Portfolio: Value + 16% • Asset Management Initiatives • Leasing of Core Portfolio (incl. New Leases): • 11% of the Core Portfolio area leased/re-leased or renewed since acquisition • Improved occupancy to 95% (93% at acquisition) • Increased WALT to 7.4 years (7.1 years at acquisition) • 5% rental growth in the Core Portfolio since acquisition • Disposals: • 4 non-strategic properties sold at approx. 29% premium to purchase price • Other non-strategic properties being prepared for sale • Corporate Initiatives • Trias refinancing: resulting in LTV reduction from 47% to 40% and reduced blended margin from 2.7% to 1.93% • Buy back of Stock Settable Notes: $150 million repurchased at discount to par and cancelled in February 2016 resulting in approx. $5.8 million interest saving through December 2016

©2016 NorthStar Realty Europe Corp. Case Study(5) Condor House, London 8 Location City of London, UK Area (sqm) 11,356 Occupancy 100% Tenancy Multi-Tenant • Pro-active management: 3,350 sqm vacated in December 2015 and leased to existing tenants from January 2016 (approx. 20% above in place rent) 2015 Achievements: Lease-up and Tenant Consolidation Property Overview Investment Rationale • Prime location in the City of London, directly opposite St. Paul’s cathedral • Acquired as part of a pan-European portfolio from a German open ended fund in forced liquidation (SEB Portfolio) • 100% occupied by credit worthy tenants • Further 2,800 sqm due for rent review in 2016 which is currently under rented Rental Income Occupancy WALT Acquisition Dec-15 + 10% 100% 100% Acquisition Dec-15 Apr-2015 Apr-2015 Apr-2015 3.8 8.5 Acquisition Dec-15 + 124%
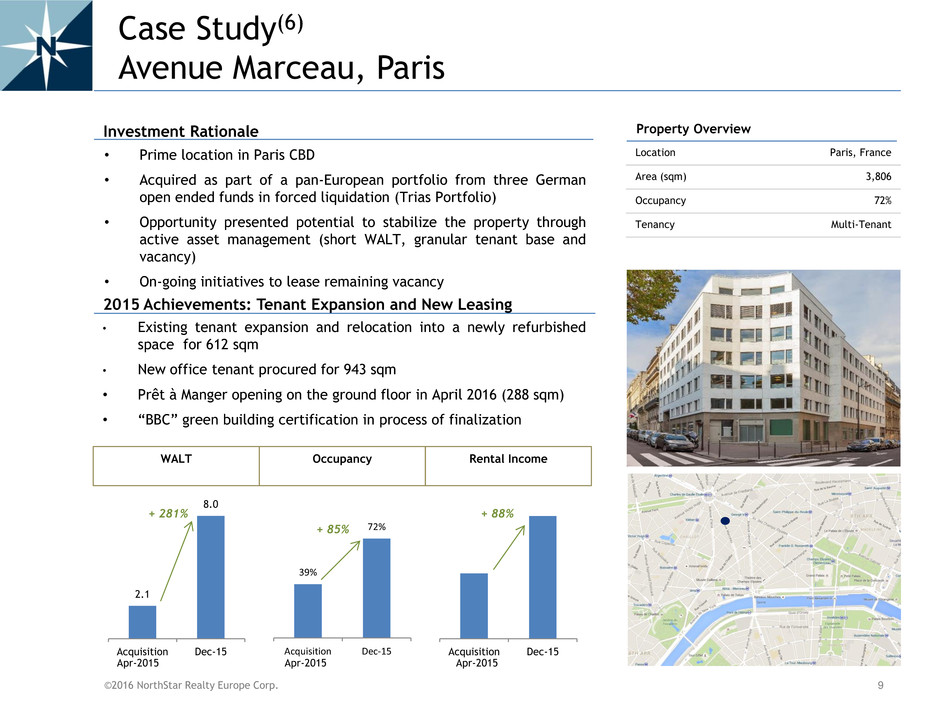
©2016 NorthStar Realty Europe Corp. Acquisition Dec-15 Case Study(6) Avenue Marceau, Paris 9 Location Paris, France Area (sqm) 3,806 Occupancy 72% Tenancy Multi-Tenant • Existing tenant expansion and relocation into a newly refurbished space for 612 sqm • New office tenant procured for 943 sqm • Prêt à Manger opening on the ground floor in April 2016 (288 sqm) • “BBC” green building certification in process of finalization 2015 Achievements: Tenant Expansion and New Leasing Property Overview Investment Rationale • Prime location in Paris CBD • Acquired as part of a pan-European portfolio from three German open ended funds in forced liquidation (Trias Portfolio) • Opportunity presented potential to stabilize the property through active asset management (short WALT, granular tenant base and vacancy) • On-going initiatives to lease remaining vacancy 39% 72% Acquisition Dec-15 + 88% Rental Income Occupancy WALT 2.1 8.0 Acquisition Dec-15 Apr-2015 Apr-2015 Apr-2015 + 85% + 281%
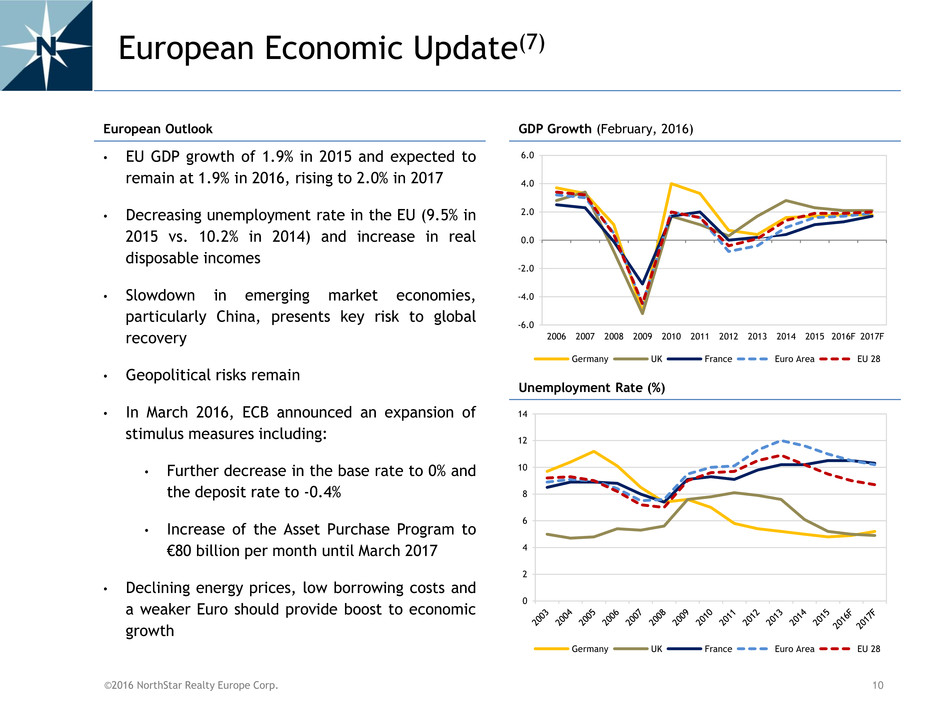
©2016 NorthStar Realty Europe Corp. European Economic Update(7) • EU GDP growth of 1.9% in 2015 and expected to remain at 1.9% in 2016, rising to 2.0% in 2017 • Decreasing unemployment rate in the EU (9.5% in 2015 vs. 10.2% in 2014) and increase in real disposable incomes • Slowdown in emerging market economies, particularly China, presents key risk to global recovery • Geopolitical risks remain • In March 2016, ECB announced an expansion of stimulus measures including: • Further decrease in the base rate to 0% and the deposit rate to -0.4% • Increase of the Asset Purchase Program to €80 billion per month until March 2017 • Declining energy prices, low borrowing costs and a weaker Euro should provide boost to economic growth 10 European Outlook GDP Growth (February, 2016) Unemployment Rate (%) -6.0 -4.0 -2.0 0.0 2.0 4.0 6.0 2006 2007 2008 2009 2010 2011 2012 2013 2014 2015 2016F 2017F Germany UK France Euro Area EU 28 0 2 4 6 8 10 12 14 Germany UK France Euro Area EU 28
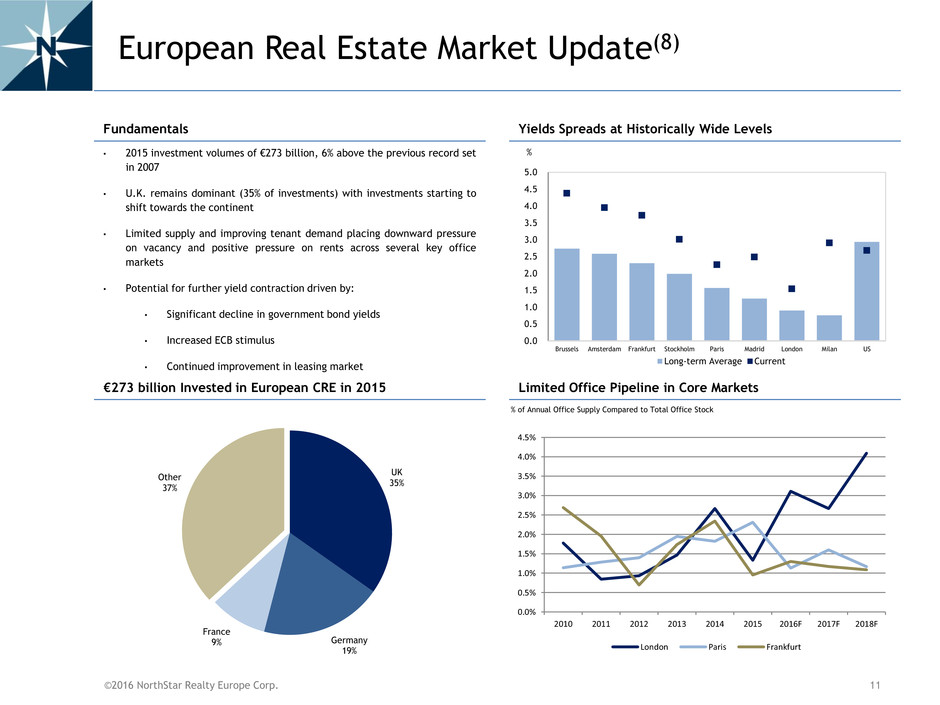
©2016 NorthStar Realty Europe Corp. European Real Estate Market Update(8) • 2015 investment volumes of €273 billion, 6% above the previous record set in 2007 • U.K. remains dominant (35% of investments) with investments starting to shift towards the continent • Limited supply and improving tenant demand placing downward pressure on vacancy and positive pressure on rents across several key office markets • Potential for further yield contraction driven by: • Significant decline in government bond yields • Increased ECB stimulus • Continued improvement in leasing market 11 Fundamentals Yields Spreads at Historically Wide Levels Limited Office Pipeline in Core Markets €273 billion Invested in European CRE in 2015 0.0 0.5 1.0 1.5 2.0 2.5 3.0 3.5 4.0 4.5 5.0 Brussels Amsterdam Frankfurt Stockholm Paris Madrid London Milan US Long-term Average Current % of Annual Office Supply Compared to Total Office Stock % UK 35% Germany 19% France 9% Other 37% 0.0% 0.5% 1.0% 1.5% 2.0% 2.5% 3.0% 3.5% 4.0% 4.5% 2010 2011 2012 2013 2014 2015 2016F 2017F 2018F London Paris Frankfurt

©2016 NorthStar Realty Europe Corp. 0 2 4 6 8 10 12 2005 2006 2007 2008 2009 2010 2011 2012 2013 2014 2015 London Paris Frankfurt Boston CBD Chicago District of Columbia LA (Westside) New York (Midtown) European Market vs. US(9) 12 Prime Office Yields in Europe are Lower and more Stable than in The United States %
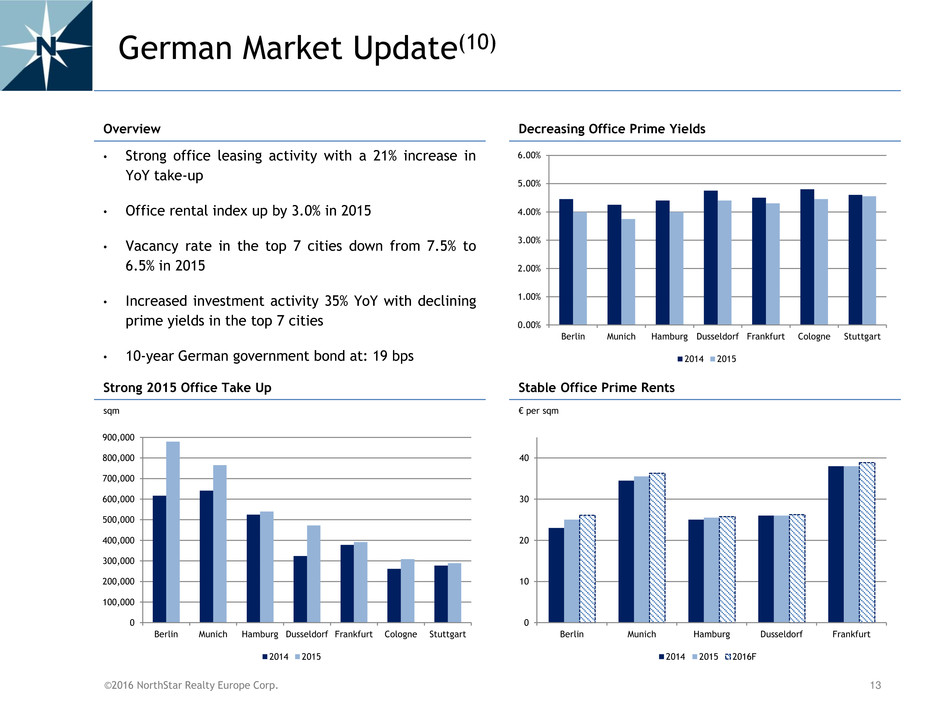
©2016 NorthStar Realty Europe Corp. German Market Update(10) • Strong office leasing activity with a 21% increase in YoY take-up • Office rental index up by 3.0% in 2015 • Vacancy rate in the top 7 cities down from 7.5% to 6.5% in 2015 • Increased investment activity 35% YoY with declining prime yields in the top 7 cities • 10-year German government bond at: 19 bps Overview Decreasing Office Prime Yields Stable Office Prime Rents Strong 2015 Office Take Up € per sqm sqm 0 10 20 30 40 Berlin Munich Hamburg Dusseldorf Frankfurt 2014 2015 2016F 0 100,000 200,000 300,000 400,000 500,000 600,000 700,000 800,000 900,000 Berlin Munich Hamburg Dusseldorf Frankfurt Cologne Stuttgart 2014 2015 0.00% 1.00% 2.00% 3.00% 4.00% 5.00% 6.00% Berlin Munich Hamburg Dusseldorf Frankfurt Cologne Stuttgart 2014 2015 13

©2016 NorthStar Realty Europe Corp. U.K. Market Update(11) • Central London continues to benefit from the out- performance of the services sector driving rental growth of 6.5% YoY • Prime office yields in London are currently at historical low levels – Prime yields in the South-East region/M25 are 11% above 2007 levels • Increased investor appetite for regional assets due to positive occupational outlook and limited supply Overview Decreasing Prime Office Yields Increasing Prime Office Rents Strong Office Take Up in Central London in 2015 0 500 1,000 1,500 2,000 2,500 2005 2006 2007 2008 2009 2010 2011 2012 2013 2014 2015 2016 2017 London West End London City € per sqm Million Sqft 3.00% 3.50% 4.00% 4.50% 5.00% 5.50% 6.00% 6.50% 7.00% 7.50% 8.00% 2005 2006 2007 2008 2009 2010 2011 2012 2013 2014 2015 2016 London West End London City M25 / SE 0 2 4 6 8 10 12 14 2006 2007 2008 2009 2010 2011 2012 2013 2014 2015 London West End London City London Docklands 14
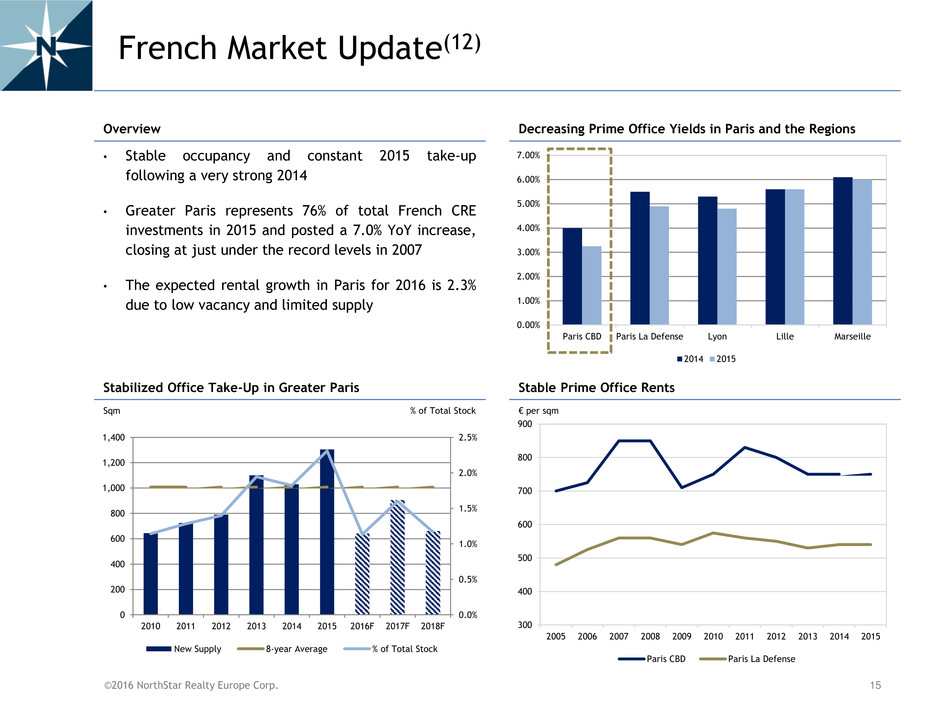
©2016 NorthStar Realty Europe Corp. French Market Update(12) • Stable occupancy and constant 2015 take-up following a very strong 2014 • Greater Paris represents 76% of total French CRE investments in 2015 and posted a 7.0% YoY increase, closing at just under the record levels in 2007 • The expected rental growth in Paris for 2016 is 2.3% due to low vacancy and limited supply Overview Decreasing Prime Office Yields in Paris and the Regions Stable Prime Office Rents Stabilized Office Take-Up in Greater Paris 0.00% 1.00% 2.00% 3.00% 4.00% 5.00% 6.00% 7.00% Paris CBD Paris La Defense Lyon Lille Marseille 2014 2015 Sqm % of Total Stock 300 400 500 600 700 800 900 2005 2006 2007 2008 2009 2010 2011 2012 2013 2014 2015 Paris CBD Paris La Defense € per sqm 0.0% 0.5% 1.0% 1.5% 2.0% 2.5% 0 200 400 600 800 1,000 1,200 1,400 2010 2011 2012 2013 2014 2015 2016F 2017F 2018F New Supply 8-year Average % of Total Stock 15
©2016 NorthStar Realty Europe Corp. • NRE is externally managed and advised by an affiliate of NorthStar Asset Management Group Inc. (NYSE: NSAM) • NSAM has $38 billion of assets under management • Dedicated executive team – 34 professionals located in NorthStar European offices in London and Luxembourg • Executive officers have substantial experience in the European real estate market • Management Fee • Lower than industry average fixed fee at $14 million p.a. and independent of portfolio value (0.5% of current GAV) • Long term management / shareholder alignment • NSAM performance incentives aligned with shareholders’ income - Success fee linked to CAD growth • 15% of incremental CAD > $0.30 per share per quarter • 25% of incremental CAD > $0.36 per share per quarter Appendix: Management Team & Fee Structure(13) 16

©2016 NorthStar Realty Europe Corp. 1. Overview a. Market Value = independent third-party appraisal as of December 31, 2015 performed by Cushman & Wakefield LLP in accordance with the current U.K. and Global edition of the Royal Institution of Chartered Surveyors' (RICS) Valuation – Professional Standards (the "Red Book") on the basis of "Fair Value," which is widely recognized within Europe as the leading professional standards for independent valuation professionals. Each property is classified as an investment and has been valued on the basis of Fair Value adopted by the International Accounting Standards Board. This is the equivalent to the Red Book definition of Market Value. The Red Book defines Market Value as the estimated amount for which an asset or liability should exchange on the valuation date between a willing buyer and a willing seller in an arm's-length transaction after proper marketing where the parties had each acted knowledgably, prudently and without compulsion. The Cushman & Wakefield LLP appraisal assumes that certain of the properties would be purchased through market accepted structures resulting in lower purchaser transaction expenses (taxes, duties, and similar costs). Excluding four properties sold or committed to be sold in Q4 2015 2. Company Summary – NRE Today a. Unless stated otherwise, all data is as of December 31, 2015 b. Core Portfolio includes 2 hotel properties and 1 German retail property c. Disposed assets include 1 property completed in Q1 2016 d. FX rates used as of December 31, 2015: EUR/USD = 1.0906, EUR/GBP = 0.7369 and EUR/SEK = 9.1912 e. Excluding new leases, NRE portfolio occupancy is 87%, WALT to Expiry is 6.0 years f. Rental Income = rental income as per rent roll, as of December 31, 2015 adjusted for New Leases 3. Company History a. At cost values based on FX rates as of December 31, 2015 b. Trias portfolios include the Internos Portfolio, the IVG Portfolio and the Deka Portfolio (“Trias”) 4. Significant Progress since Acquisition a. Acquisition: September 2014 for Dukes Court, April 2016 for the SEB and Trias portfolio and July 2015 for Trianon b. Rental growth based on contractual income as per rent roll c. Disposed assets include one asset sale completion in Q1 2016 d. WALT = WALT to Expiry. Rental Income Growth = Rent roll based Rental Income as of December 31, 2015 vs. at the respective acquisition dates 5. Case Study – Condor House, London a. WALT = WALT to Break b. Rental Income Growth = Rent roll based Rental Income as of December 31, 2015 vs. at acquisition 6. Case Study – Avenue Marceau, Paris a. WALT = WALT to Expiry b. Rental Income Growth = Rent roll based Rental Income as of December 31, 2015 vs. at acquisition 7. Strategy – European Economic Update: a. GDP forecast: Euro Area forecast based on ECB announcement from March 10, 2016. EU and the country specific data is based on the European Commission forecast from February, 2016 as updated information wasn’t available (European Commission – European Economic Forecast – Winter 2016, Eurostat). b. Eurozone: 19 countries, members of a monetary union and using the Euro as their common and sole currency c. In December 2015, ECB extended the program until March 2017 (€60 billion a month, total target of €1.4 trillion) - vs. a total of $2.5 trillion in the US since the financial crisis Notes 17
©2016 NorthStar Realty Europe Corp. 8. Strategy – European Real Estate Market Update: a. German Government Bond Yield: 0.194 (08/03/2016) – 0.629 (31/12/2015) - Bloomberg b. U.K. Government Bond Yield: 1.409 (08/03/2016) – 1.960 (31/12/2015) - Bloomberg c. French Government Bond Yield: 0.596 (08/03/2015) – 0.988 (31/12/2015) - Bloomberg d. Cushman & Wakefield – Investment Market Update – Q4 2015 e. Yield spreads reflect spread between office property yields and 10-year government bonds in each respective country. f. CRE = Commercial Real Estate g. Investment volumes from CBRE provided in March 2015 9. Strategy – European Real Estate Market vs. US: a. European cities data from JLL b. American cities data from GreenStreet Advisors – Market Analysis – DataHub 10. Strategy – German Market Update: a. BNP Paribas Real Estate – Office Market Germany – Property Report 2016 b. JLL – Office Market View – Big 7 – Q4 2015 c. Data from Cushman & Wakefield – January 2015 d. Top 7 German cities: Berlin, Munich, Hamburg, Dusseldorf, Frankfurt, Cologne and Stuttgart e. Cushman & Wakefield – European Office Forecast – 2015-2017 11. Strategy – UK Market Update: a. CBRE – MarketView – UK Prime Rent and Yield – Q4 2015 b. CBRE – Monthly Prime Yields – February 2016 c. Prime Rents: Data from Cushman & Wakefield d. Bilfinger – Central London Analysis – Q4 2015 12. Strategy – French Market Update: a. JLL – 2015: An Unexpected Year – Q4 2015 b. BNP Paribas Real Estate – Investment in France – Q4 2015 c. Knight Frank – Paris Office Market Outlook – Q4 2015 d. Knight Frank – Paris Vision – 2016 e. Cushman & Wakefield – European Office Forecast – 2015-2017 13. Management Structure and Fee a. AUM as of year end 2015, proforma for NRF asset monetization initiatives as of February, 23, 2016 b. CAD = Cash Available for Distribution – Definition as per 10Q c. Industry Average: Based on a sample of 18 internally managed European REITs (where opex is assumed as a proxy for management fees), 4 externally managed European REITs and 1 externally managed Canadian REIT investing solely in Europe Notes 18
