Attached files
| file | filename |
|---|---|
| EX-31.1 - EX-31.1 - ADVISORY BOARD CO | abco12312015exhibit311.htm |
| EX-23.3 - EX-23.3 - ADVISORY BOARD CO | abco12312015exhibit233.htm |
| EX-32.1 - EX-32.1 - ADVISORY BOARD CO | abco12312015exhibit321.htm |
| EX-21.1 - EX-21.1 - ADVISORY BOARD CO | abco12312015exhibit211.htm |
| EX-31.2 - EX-31.2 - ADVISORY BOARD CO | abco12312015exhibit312.htm |
| EX-99.1 - EX-99.1 - ADVISORY BOARD CO | abco12312015exhibit991.htm |
| EX-23.1 - EX-23.1 - ADVISORY BOARD CO | abco12312015exhibit231.htm |
| EX-23.4 - EX-23.4 - ADVISORY BOARD CO | abco12312015exhibit234.htm |
| EX-12.1 - EX-12.1 - ADVISORY BOARD CO | abco12312015exhibit121.htm |
| EX-23.2 - EX-23.2 - ADVISORY BOARD CO | abco12312015exhibit232.htm |
| EX-10.32 - EX-10.32 - ADVISORY BOARD CO | abco12312015exhibit1032.htm |
SECURITIES AND EXCHANGE COMMISSION
Washington, D.C. 20549
Form 10-K
(Mark One)
þ | ANNUAL REPORT PURSUANT TO SECTION 13 OR 15(d) OF THE SECURITIES EXCHANGE ACT OF 1934 |
¨ | TRANSITION REPORT PURSUANT TO SECTION 13 OR 15(d) OF THE SECURITIES EXCHANGE ACT OF 1934 |
For the fiscal year ended December 31, 2015
Commission file number: 000-33283

THE ADVISORY BOARD COMPANY
(Exact name of registrant as specified in its charter)
Delaware | 52-1468699 | |
(State or other jurisdiction of incorporation or organization) | (I.R.S. Employer Identification No.) | |
2445 M Street, N.W., Washington, D.C. 20037
(Address of principal executive offices) (Zip Code)
Registrant’s telephone number, including area code: 202-266-5600
Securities registered pursuant to Section 12(b) of the Act:
Title of each class | Name of each exchange on which registered | |
Common Stock, par value $0.01 | The NASDAQ Stock Market LLC | |
(NASDAQ Global Select Market) | ||
Securities registered pursuant to Section 12(g) of the Act: None
Indicate by check mark if the registrant is a well-known seasoned issuer, as defined in Rule 405 of the Securities Act. Yes þ No ¨
Indicate by check mark if the registrant is not required to file reports pursuant to Section 13 or Section 15(d) of the Act. Yes ¨ No þ
Indicate by check mark whether the registrant (1) has filed all reports required to be filed by Section 13 or 15(d) of the Securities Exchange Act of 1934 during the preceding 12 months (or for such shorter period that the registrant was required to file such reports), and (2) has been subject to such filing requirements for the past 90 days. Yes þ No ¨
Indicate by check mark whether the registrant has submitted electronically and posted on its corporate Website, if any, every Interactive Data File required to be submitted and posted pursuant to Rule 405 of Regulation S-T during the preceding 12 months (or for such shorter period that the registrant was required to submit and post such files). Yes þ No ¨
Indicate by check mark if disclosure of delinquent filers pursuant to Item 405 of Regulation S-K is not contained herein, and will not be contained, to the best of the registrant’s knowledge, in definitive proxy or information statements incorporated by reference in Part III of this Form 10-K or any amendment to this Form 10-K. ¨
Indicate by check mark whether the registrant is a large accelerated filer, an accelerated filer, a non-accelerated filer, or a smaller reporting company. See the definitions of “large accelerated filer,” “accelerated filer” and “smaller reporting company” in Rule 12b-2 of the Exchange Act.
Large accelerated filer | þ | Accelerated filer | ¨ | ||||
Non-accelerated filer | ¨ (Do not check if smaller reporting company) | Smaller reporting company | ¨ | ||||
Indicate by check mark whether the registrant is a shell company (as defined in Rule 12b-2 of the Act). Yes ¨ No þ
Based upon the closing price of the registrant’s common stock as reported on the NASDAQ Global Select Market on June 30, 2015, the aggregate market value of the common stock held by non-affiliates of the registrant was $2,325,939,961.
The number of shares of the registrant’s common stock, par value $0.01 per share, outstanding on February 19, 2016 was 41,581,722.
DOCUMENTS INCORPORATED BY REFERENCE
Part III of this Form 10-K incorporates by reference certain portions of the registrant’s definitive proxy statement for the 2016 annual meeting of stockholders to be filed with the Commission no later than 120 days after the end of the fiscal period covered by this report.
THE ADVISORY BOARD COMPANY
TABLE OF CONTENTS
Page | ||
Item 1. | ||
Item 1A. | ||
Item 1B. | ||
Item 2. | ||
Item 3. | ||
Item 4. | ||
Item 5. | ||
Item 6. | ||
Item 7. | ||
Item 7A. | ||
Item 8. | ||
Item 9. | ||
Item 9A. | ||
Item 9B. | ||
Item 10. | ||
Item 11. | ||
Item 12. | ||
Item 13. | ||
Item 14. | ||
Item 15. | ||
-i-
EXPLANATORY NOTE REGARDING THIS ANNUAL REPORT
In November 2014, we elected to change our fiscal year from the period beginning on April 1 and ending on March 31 to the period beginning on January 1 and ending on December 31. As a result of this change, our prior fiscal year was a nine-month transition period ended on December 31, 2014. We refer in this report to our 2015 fiscal year that began on January 1, 2015 and ended on December 31, 2015 as “calendar year 2015,” to the period that began on April 1, 2014 and ended on December 31, 2014 as the “transition period,” and to the period that began on April 1, 2013 and ended on March 31, 2014 as “fiscal 2014.”
CAUTIONARY NOTE REGARDING FORWARD-LOOKING STATEMENTS
This report includes “forward-looking statements.” The words “may,” “will,” “anticipate,” “estimate,” “expect,” “intend,” “plan,” “aim,” “seek,” and similar expressions as they relate to us or our management are intended to identify these forward-looking statements. All statements by us regarding our expected financial position, revenues, cash flows and other operating results, business strategy, legal proceedings, and similar matters are forward-looking statements. Our expectations expressed or implied in these forward-looking statements may not turn out to be correct. Our results could be materially different from our expectations because of various risks, including the risks discussed in this report under “Part I – Item 1A – Risk Factors.” Any forward-looking statement speaks only as of the date of this report, and, except as required by law, we undertake no obligation to update any forward-looking statement to reflect events or circumstances, including unanticipated events, after the date of this report.
-ii-
PART I
We have derived some of the information contained in this report concerning the markets and industry in which we operate and the customers we serve from publicly available information and from industry sources. Although we believe that this publicly available information and the information provided by these industry sources are reliable, we have not independently verified the accuracy of any of this information.
Unless the context indicates otherwise, references in this report to the “Company,” “The Advisory Board,” “we,” “our,” and “us” mean The Advisory Board Company and its consolidated subsidiaries.
Item 1. Business.
Overview
We are a leading provider of insight-driven performance improvement software and solutions to the rapidly changing health care and education industries. Through our subscription-based membership programs, we leverage our intellectual capital to help our clients, which we refer to as our members, solve their most critical business problems. As of the date of this report, we served approximately 5,200 members.
We launched our first health care program in 1986 and our first education program in 2007. Our health care programs address a range of clinical and business issues, including physician alignment and engagement, network management and growth strategy, value-based care and population health, revenue cycle performance, clinical operations, and supply chain management. Our education programs support colleges and universities in enrollment management, academic programming and student learning, faculty recruitment and retention, student advising and success, alumni affairs and advancement, and college and university operations. All of our programs are rooted in best practices and extend across four key areas:
• | Best practices research and insight. Our best practices research and insight programs provide the foundation for all of our other programs. These programs are focused on understanding industry dynamics, identifying best-demonstrated management practices, critically evaluating widely-followed but ineffective practices, and analyzing emerging trends within the health care and education industries. |
• | Performance technology software. Our cloud-based software applications allow members to combine insights derived from our best practices research with their own operational and financial data and third- party and proprietary data to identify and assess revenue, cost, quality, and performance improvement opportunities. |
• | Data- and tech-enabled services. Our data- and tech-enabled services draw on our extensive data resources, distinctive technology platforms, and deep expertise gained over years of experience to apply best practices on behalf of our members and deliver superior results. |
• | Consulting and management services. Our consulting and management services programs assist our members’ own efforts to set strategic direction, address key operational challenges, and adopt and implement best practices to improve their performance. |
Corporate Information
We were incorporated in Maryland in 1979 and reincorporated in Delaware in 2001. The mailing address of our principal executive offices is 2445 M Street, N.W., Washington, D.C., 20037, and our telephone number is (202) 266-5600.
We maintain a corporate Internet website at www.advisory.com. We make available free of charge through our website our annual reports on Form 10-K, quarterly reports on Form 10-Q, and current reports on Form 8-K, and all amendments to those reports, as soon as reasonably practicable after we electronically file or furnish the reports with the Securities and Exchange Commission, or SEC. The contents of our website are not a part of this annual report on Form 10-K.
1
Our Markets
Over our 35-year history, we have focused on providing insight-driven, differentiated, scalable, and renewable solutions to the rapidly transforming health care and education industries. Within the health care market, we primarily serve U.S. hospitals and health systems, and also sell programs to independent medical groups, pharmaceutical, biotechnology, and medical device companies, as well as to health care insurers and other service providers. The Centers for Medicare and Medicaid Services estimated that spending in the United States for health care services will be $3.4 trillion in 2016 and expects that such spending will grow to over $5.4 trillion by 2024. Within the education market, we serve a range of public and private colleges and universities. The U.S. Department of Education estimates education institutions to be a $1.2 trillion market involving the participation of more than 22 million students and 7,200 institutions, including both degree-granting and other education organizations.
Both health care and education organizations rely on external service providers to help them develop strategies, consolidate and analyze data, improve operations and processes, and train staff in order to remain competitive in a dynamic industry environment. We believe that certain characteristics of the health care and education industries make them especially suited for our business model of standardized delivery of services and software rooted in shared best practices:
• | Undergoing transformation: Both the health care and education industries are undergoing tremendous change. Health care providers are facing an aging population, increasing cost and margin pressures, new regulations related to the Affordable Care Act, and movement from fee-for-service to value-based reimbursement. Colleges and universities are confronting a slower growing student population, shrinking state budgets, rising cost concerns, heightened attention to value and outcomes, and a movement towards performance-based funding. During these times of significant change, health care and education institutions are in greater need of, and are actively seeking, best practices to address their mounting challenges. |
• | Common and complex industry-wide issues: Health care and education organizations of all types and sizes face many of the same complex strategic, operational, and management issues. Institutions are working to increase revenue, reduce costs, improve productivity and performance, manage innovation, reengineer business processes, and comply with new government regulations. Because the delivery of health care and education services is based on complex, interrelated processes, there is widespread interest in and broad applicability of standardized programs that address the major challenges facing the industries. |
• | Fragmented target industries: We believe that our target market consists of over 15,000 health care organizations and over 5,000 education institutions. Many of these organizations deliver services primarily on a local or regional basis. As a result of this fragmentation, best practices that are pioneered in local or regional markets are rarely widely known throughout the industry. |
• | Willingness to share best practices: We believe that health care and education organizations display a relatively high propensity to share best practices. Many health systems and universities are non-profit organizations or compete in a limited geographic market and do not consider organizations outside their market to be their competitors. In addition, the health care and education industries have a charter above commerce in serving their communities and their end customers and have a long tradition of disseminating information as part of ongoing research and education activities. |
• | Need for data and analytics: Health care data reside in numerous source systems both within and dispersed across a variety of organizations, including hospitals, physician practices, and government and commercial payers. Education data similarly are derived from a broad range of sources, which encompass students, parents, employers, high schools, colleges and universities, and other non-traditional education institutions. To achieve higher-quality outcomes and control costs, organizations within these markets exhibit a strong and continuing need for data and the systematic analysis of data to help them understand their current performance and identify opportunities for improvement. |
• | Value orientation: A membership model that provides access to best practice insight and performance technology software on a shared-cost basis appeals to many value-focused health care and education organizations that may be reluctant to make discretionary investments in an exclusive, higher-priced, customized engagement or tailored software solution to address their critical issues. |
2
Our Strengths
We are a mission-driven organization with core values, a service ethic, and a results-oriented approach dedicated to helping health care and education institutions solve their most pressing problems. Our competitive strengths include the following:
• | Market leader in rapidly changing markets. We are a market leader in both the health care and education markets, serving executives at a majority of U.S. hospitals and health systems since 1986 and a large number of U.S. colleges and universities since 2007. The ongoing transformation of these industries is presenting new challenges and creating demand for new programs and services. Our expertise in health care and education allows us to attract into our membership base progressive and highly-regarded institutions where many industry issues are first recognized and where many best practices originate. We believe our reputation and success to date have positioned us as a premier source and partner for identifying, evaluating, communicating, and providing solutions that respond to evolving market needs. |
• | A superior value proposition to members. We believe our programs offer access to best practices and software at a fraction of the cost that other business services firms charge to provide a comparable customized analysis or solution. Members use our programs to improve the effectiveness of their organizations by increasing productivity, reducing operating costs, and enhancing revenue. We believe that our program prices generally represent a small percentage of the potential benefit members can achieve through successful application of even a portion of the best practices and software that they receive. In addition, our fixed-fee pricing promotes frequent use of our programs by our members, which we believe increases both the value members receive and their loyalty to our programs. |
• | Extensive membership base and longstanding member relationships. Our membership includes some of the largest and most prestigious health care and education institutions in the United States, including all 15 of the 2015-2016 U.S. News and World Report honor roll hospitals and 89% of the U.S. News and World Report’s top 100 universities for 2016. As of December 31, 2015, our programs reached more than 11,000 chief executive and chief operating officers and 130,000 other senior executives, clinical leaders, department heads, and product-line managers. Our membership-based model, in which members participate in our research on an annual basis, gives us privileged access to our members’ business practices, proprietary data, and strategic plans, enabling us not only to identify and share emerging best practices but also to develop first-in-class and best-in-class new programs and services to meet our members’ changing needs. |
• | Broad, insight-driven offerings. We provide a distinctively broad and deep set of best practices research programs, performance technology software programs, tech-enabled services, and consulting and management services, allowing us to assist our members in a variety of ways depending on their specific needs and problem areas. Our health care programs address a wide range of issues, including physician performance, network management, value-based care, revenue cycle management, clinical quality improvement, population health management, and clinical operations. Our education programs focus on such topics as enrollment management, student success, academic programming, faculty productivity, and advancement. Our performance technology software programs and tech-enabled services differ from those of our competitors in that they are rooted in best practices, aggregate and standardize data from disparate source systems, and are part of a complementary platform of offerings. |
• | Highly renewable, visible, and scalable business model. We derive most of our revenue from multi-year, renewable memberships across our discrete annual programs. Our member institution renewal rate has equaled or exceeded 90% for each of the years in the five-year period ended March 31, 2015, which we believe reflects our members’ recognition of the value they derive from participating in our programs. In addition, we can identify over 80% of our annual revenues at the beginning of the calendar year by considering our deferred revenues and renewals based on recent experience. Our economic model, which features a standardized set of services and a highly-fixed program cost structure, enables us to add new members to our programs for a low incremental delivery cost, thereby increasing revenue, disproportionately increasing operating profit, and funding investment in new programs for our members. |
• | Consistent financial performance and strong cash flows. Since becoming a public company in 2001, we have increased our number of members, contract value per member, total contract value, and revenue nearly every year, including during economic downturns. Over the five-year period ended March 31, 2015, our number of members has grown by an average of 13% annually from 3,179 to 5,221, while our contract value per member has expanded by an average of 10% annually, from approximately $95,000 to approximately $140,000. The combination of revenue growth, profitable operations, and payment for memberships in |
3
advance of accrual revenue typically results in our cash flows from operations exceeding our net income and often approximating our adjusted EBITDA.
Growth Strategy
We believe we are well positioned to capitalize on the favorable characteristics in our target markets and deploy our competitive strengths to continue growing our business. As part of our growth strategy, we plan to:
• | Add new health care and education members. We believe there are over 15,000 potential members in the health care market and over 5,000 potential members in the education market. Although we currently have an established membership base in these markets, we actively seek to continue adding new members. In addition, we believe that our business model and existing membership base represent significant assets that we can use to attract additional non-provider health care members and international health care and education members. We currently serve approximately 500 non-U.S. health care organizations through programs that rely on research and analysis primarily derived from our work with U.S. health care organizations. In addition, we are seeking to expand our work with independent medical groups, pharmaceutical, biotechnology, medical device, and health insurance companies, as well as with other organizations with an interest in U.S. hospital and health system operations, performance, and data. |
• | Expand relationships with and create additional value for existing members. We have developed broad and deep relationships with approximately 5,200 members and over 230,000 executives across our health care and education programs. As members recognize benefits from one program, they may seek out or become strong candidates for other programs and services. In addition, our steady interaction with members through sales force visits, program development and delivery, and account management provides us with insight into which of our programs would be most suitable for them. Since 2010, we have increased contract value per member by 60%, from approximately $90,000 to approximately $140,000 as of March 31, 2015, by selling additional programs to existing members, but an average contract value of $140,000 remains a small portion of many institutions’ expenditures on professional services. |
• | Continue innovating through member-driven product development. As our markets rapidly evolve, we seek to expand our portfolio of programs and services through development of new programs and successful execution and integration of acquisitions and strategic partnerships. Each year, we pursue a rigorous research process involving extensive member feedback, in which we build a large pipeline of potential new program concepts. We then concentrate our efforts on specific program launches of greatest interest to our members. Our research and development process benefits from the involvement of industry thought-leaders from progressive and well-known organizations that act as advisors, as well as from information we gather from hundreds of member interviews. We currently plan to continue introducing new programs on an annual basis through a mixture of internal development activities and acquisitions. |
• | Use differentiated data and expertise to provide comprehensive solutions to members. As the health care and education industries continue their transformation, our members increasingly are looking to consolidate and replace their individual vendors and products with strategic partners, integrated technology platforms, and comprehensive solutions. We believe many of our members will consider us particularly well suited to respond to this demand based on our differentiated data acquisition and standardization capabilities, compiled data sets across thousands of physicians, patients, and students, and reputation for deep industry expertise and a strategic approach to solving issues. |
4
Our Offerings
As of December 31, 2015, we offered distinct membership programs rooted in best practices and extending across the four key areas of best practices research and insight, performance technology software, data- and tech-enabled services, and consulting and management services.
Program Attributes
Our programs are targeted at serving member executives and using our insights and deep expertise to produce tangible and significant results for our members. Our insight-driven programs include best practices research studies; executive education; proprietary content databases and online tools; daily online executive briefings; original executive inquiry services; dedicated expert advisory services; software applications which provide ad hoc querying, performance alerts, drill-down analysis, and comparative benchmarking; tech-enabled services; and consulting and management services. We typically charge a separate annual membership fee for each program that is fixed for the duration of the membership agreement and entitles participating members to access all of a program’s membership services. Most programs are sold as renewable, multi-year contracts. The specific membership services vary by program and change over time as services are periodically added or removed. Institutions may access our services within a program only if they are members of that program. The types of services we provide include those described below.
Best Practices Research and Insights Programs
We focus the senior management teams of our member organizations on important problems by providing an analysis of changing industry dynamics and best practices used by some of the most successful organizations to solve those problems, and by providing tools and services to accelerate the adoption of best practices within our member institutions. Each of our best practices research programs is targeted at a specific member executive and addresses the executive’s specific strategic challenges, operational issues, and management concerns. Each program includes published studies, executive education, proprietary databases and online services, access to experts, and executive briefings, among other services, as we continue to enhance the programs with innovative features. For each best practices research program, we typically publish two to four best practices research studies or modules annually. We design each study and module to present the conclusions and supporting best practices in a graphical format, enabling the intended audience to assimilate quickly the 100 to 250 pages of research content. Consistent application of our research methodology and extensive staff member training across all programs enable us to maintain a high level of research quality in the programs.
In addition to our research studies, we deliver an executive education curriculum based on our proprietary research to member institutions nationwide through four channels: general membership meetings; presentations conducted on-site at member organizations; on-call access to experts; and frequent teleconferences. In all four settings, we use interactive discussions to provide a deeper understanding and facilitate practical application of the best practices we have identified. In the year ended December 31, 2015, we delivered executive education services to more than 125,000 executive and managerial participants through more than 250 member meetings, over 2,200 on-site seminars, and over 300 webconferences. These interactions serve as an important building block for our relationships with members, allowing us the opportunity to gather input about our research agendas and services, generate leads for cross-selling additional programs to existing members, and identify ideas for potential new programs.
Across our research programs, we also offer a variety of online databases, content, tools, and calculators to increase the utility of our research, facilitate analysis of an organization’s current performance, and assist the adoption of best practices at member institutions. Each research program has a dedicated section on our password-protected member website, accessible only to members of the program, that includes such items as best practices, executive modules, online data, audit toolkits, and market forecasting instruments. Through the website, members of each program may search and access program-specific content, which includes the ability to access an electronic library of past and current research studies, review executive education modules, view meeting schedules, and communicate with our staff and other members.
Performance Technology Software Programs
Each of our performance technology software programs is anchored by cloud-based software applications that are regularly updated with member-specific data as well as third-party and proprietary data and provide all member institutions with access to specific performance improvement metrics. The software applications pull data from disparate legacy information systems through standardized data extracts and, with analytics and proprietary metrics informed by our best practices research and insights, transform hard-to-access legacy data into performance reports and benchmarks offering actionable insight for managers and executives. Members in these programs receive best practices from our research and benchmarking against peer organizations, access to teleconferences, webconferences, and user conferences, and engage in regular interaction with our employees who are tasked with helping our members analyze their institution-specific data and suggesting tactics for improving performance.
5
The software programs are renewable and address perennial problems in areas in which we have developed significant knowledge through our research programs. In health care, these include revenue cycle efficiency, assistance with physician management, cost optimization, throughput in the emergency department and surgical suites, utilization management, workforce management and optimization, and improvement in quality of outcomes. Our primary software program for education helps institutions improve student advising and increase student success by identifying and positively influencing choices by at-risk and off-path students.
Our software programs are cloud-based, allowing members to derive value with minimal upfront investment costs. Cloud-based software allows continual access via the Internet and can quickly be updated, delivering new program content and functionality to all members with minimal disruption. Our software is built to be flexible and easy to use, offering members ad hoc querying, performance alerts, drill-down analysis, and comparative benchmarking.
Through the combination of our research and access to the software, members gain insight into areas of opportunity for operational or financial improvement, receive best practices toolkits to capture the improvement, and directly use our resources to inform front-line decisions on an hourly, daily, and weekly basis. Our programs allow members to transform their data into information they can use to enhance performance, enabling them to quantify areas of opportunity and identify value captured through use of our programs. Our performance technology membership model allows our members to benchmark themselves against each other and learn how other members captured value from our software applications and consulting services.
Data- and Tech-Enabled Services
For some critical and complex business functions, we offer members data- and tech-enabled services as a means to deliver results when our best practices cannot be as effectively implemented directly by our members and their staff. The outsourced services are end-to-end and iterative by nature: we work closely with the member to understand the challenge and clarify the member’s objectives in addressing the challenge; we apply strategic data analytics to segment the problem and identify specific opportunities and strategies; we use various technology platforms and solutions to implement those strategies; and we measure the effectiveness of the adopted strategies. A key focus is continuously improving and optimizing the outcomes.
Our data- and tech-enabled services draw on our considerable data resources, distinctive technology platforms, and deep expertise gained over years of experience, all of which are difficult or costly to transfer to members. Our data sets are constantly updated and enhanced. Our technology platforms are proprietary and multi-faceted, allowing us to work with a range of members on a particular type of issue. Our know-how expands each year with new learnings from our best practices research as well as new experiences solving similar problems on behalf of hundreds of organizations.
The focus of our data- and tech-enabled services for our health care members is hospital and health system supply chain optimization and for our education members is student engagement and enrollment management. These services are often delivered under one-year, renewable contracts, and, given the importance of the functions provided and the strength of the results delivered, tend to evolve into extended relationships.
Consulting and Management Services
Through our consulting and management services, we provide on-the-ground support for major turnaround and performance improvement initiatives, as well as best practice, day-in-day-out professional management of key areas of the hospital or medical group. We assist in three primary ways: expert counsel, including business planning and strategy development; dedicated support, including interim senior management to oversee a specific change management process for a defined period; and long-term management, involving a seasoned group of senior executives on-site for an extended period to provide hands-on, practical advice and execution against financial and operational goals.
Our consulting engagements deliver meaningful insights and results on issues such as value-based care and population health, physician practice management, clinical quality and care redesign, operational capacity and workforce efficiency, and revenue cycle optimization. Our clients benefit from outcomes-focused consultants experienced in change management, access to best practice performance criteria, industry standard and proprietary benchmarks, implementation-oriented recommendations, and an objective third-party perspective.
Our Membership
As of the date of this report, our membership consisted of approximately 5,200 members, composed primarily of hospitals and health systems and colleges and universities, as well as selected other health care and education institutions. Each of our programs targets the issues of a specific executive constituency or business function. Our programs serve a range of constituencies, including both the most senior executives and the broader management team. As of the date of this report, our programs reached over 11,000 chief executive and chief operating officers and more than 130,000 other senior executives, clinical leaders, department heads, and product-line managers. No one member accounted for more than 1.5% of our revenue in
6
the calendar year 2015, the transition period, or fiscal 2014. We generated approximately 2%, 4%, and 3% of our revenue from members outside the United States in calendar year 2015, the transition period, and fiscal 2014, respectively.
We seek to involve the country’s most progressive health care and education organizations in our membership. The participation of these members provides us with a window into the latest challenges confronting the industries we serve and the most innovative best practices that we can share broadly throughout our membership. As of December 31, 2015, we served all 15 of the honor roll hospitals listed in the 2015-2016 U.S. News and World Report ranking, all of the largest 100 health care delivery systems, 30 of the world’s largest pharmaceutical and medical device companies, and 89 of the U.S. News and World Report top 100 universities for 2016.
Pricing and Contracts
We typically charge a separate fixed annual membership fee for each of our programs that covers all of the services in the program. Annual fees vary by program based on the target executive constituency and the specific combination of services we provide to participating members. The annual fees paid by members within the same program also vary based on the size of the member institution and the total number of program memberships the member purchases. Membership fees also may be lower for the initial members of new programs. Annual fees for software programs are higher than annual fees for research and insights programs. On average, we increase membership fees 2% to 3% per year, and, in some of our programs, we charge our members for certain direct billable expenses, such as travel expenses. Most of our memberships are multi-year agreements. Fees for our programs are generally payable in advance.
Sales and Marketing
We maintain new business development teams that are responsible for selling new memberships and member services teams that are responsible for servicing and renewing existing memberships. New business development representatives typically focus on selling specific programs through face-to-face meetings with senior executives at current and prospective member institutions. Member services representatives assume a relationship management role and perform most of their responsibilities over the telephone. New business development teams and member services teams are compensated with base salaries and variable, goal-based incentives. For many of our members we assign an executive advisor to ensure that the member is receiving value from the programs in which it currently participates, to identify new programs that could assist the member with key challenges that it faces, and to coordinate the activities of the new business development and member services teams with the goal of serving the member and expanding the overall member relationship.
Intellectual Property
We offer our members a range of products to which we claim intellectual property rights, including research content, online services, databases, electronic tools, cloud-based applications, performance metrics, and software products. We own and control a variety of trade secrets, confidential information, trademarks, trade names, copyrights, and other intellectual property rights that, in the aggregate, are of material importance to our business. We are licensed to use certain technology and other intellectual property rights owned and controlled by others, and license other companies to use certain technology and other intellectual property that we control. We consider our trademarks, service marks, databases, software, and other intellectual property to be proprietary, and rely on a combination of copyright, trademark, trade secret, non-disclosure, and contractual safeguards to protect our intellectual property rights. We have been granted federal registration for some of our trademarks and service marks.
Competition
We are not aware of any other organization that offers services to health care or education organizations across as broad a range of best practices, performance technology software, data- and tech-enabled services, and consulting and management services as those offered by our company. We compete in some discrete programs and for discretionary expenditures against health care-focused, education-focused, and multi-industry firms. These include consulting and strategy firms; market research, data, benchmarking, and forecasting providers; technology vendors and services firms; health care information technology firms; technology advisory firms; outsourcing firms; and specialized providers of educational and training services. Other organizations, such as state and national trade associations, group purchasing organizations, non-profit think-tanks, and database companies, also may offer research, consulting, tools, and education services to health care and education organizations.
We believe that the principal competitive factors in our market include quality and timeliness of research and analysis, applicability and efficacy of recommendations, strength and depth of relationships with member senior executives, reliability and effectiveness of software applications, distinctiveness of dashboards and user interfaces, depth and quality of the customer network, ability to meet the changing needs of current and prospective members, measurable returns on customer investment, and service and affordability. We believe we compete favorably with respect to each of these factors.
7
In February 2014, we extended the collaboration agreement with CEB, a global business membership and research organization, to enhance our services to members and explore new product development opportunities. To advance these efforts, which require our two companies to share proprietary information related to best practices products and services, the agreement includes a limited non-competition provision.
Legal Proceedings
From time to time, we are subject to ordinary routine litigation incidental to our normal business operations. We are not currently a party to, and our property is not subject to, any material legal proceedings.
Employees
As of December 31, 2015, we employed approximately 3,500 professionals, approximately 1,900 of whom are based in our headquarters in Washington, D.C. None of our employees are represented by a collective bargaining arrangement.
Government Regulation
The health care and education industries are highly regulated and subject to changing political, legislative, regulatory, and other influences. Existing and new federal and state laws and regulations affecting the health care and education industries could create unexpected liabilities for us, could cause us or our members to incur additional costs and could restrict our or our members’ operations. Many of the laws are complex and their application to us, our members, or the specific services and relationships we have with our members are not always clear. Our failure to anticipate accurately the application of these laws and regulations, or our other failure to comply, could create liability for us, result in adverse publicity, and otherwise negatively affect our business. See the “Risk Factors” section of this report for more information about the impact of government regulation on our company.
Executive Officers
The following table sets forth as of the date of this report the names, ages, and positions of the persons who serve as our executive officers.
Executive Officers | Age | Position | ||
Robert W. Musslewhite | 46 | Chief Executive Officer and Chairman | ||
David L. Felsenthal | 45 | President and Director | ||
Michael T. Kirshbaum | 39 | Chief Financial Officer and Treasurer | ||
Evan R. Farber | 43 | Chief Legal Officer and Corporate Secretary | ||
Cormac F. Miller | 42 | Chief Product Officer | ||
Richard A. Schwartz | 50 | Chief Operating Officer, Health Care | ||
Mary D. Van Hoose | 51 | Chief Talent Officer | ||
Our executive officers are appointed by, and serve at the pleasure of, our board of directors.
Robert W. Musslewhite has served as our Chief Executive Officer since September 2008. Mr. Musslewhite joined us in 2003, initially serving in executive roles in strategic planning and new product development. In 2007, Mr. Musslewhite was named Executive Vice President and general manager in charge of software-based programs, and he became CEO the following year. Mr. Musslewhite currently serves on the board of Evolent Health, Inc., a value-based care company. Before joining us, Mr. Musslewhite was an Associate Principal in the Washington, D.C., Amsterdam, and Dallas offices of McKinsey & Company, an international consulting firm, where he served a range of clients across the consumer products industry and other industries and was a co-leader of McKinsey’s Pricing Center. Mr. Musslewhite received an A.B. degree in Economics from Princeton University and a J.D. from Harvard Law School.
David L. Felsenthal became our President in September 2008. Mr. Felsenthal first joined us in 1992. He served as Chief Financial Officer, Secretary, and Treasurer from April 2001 through February 2006 before his service as an Executive Vice President beginning in February 2006 and as Chief Operating Officer from January 2007 to September 2008. From 1997 to 1999, Mr. Felsenthal worked as Director of Business Development and Special Assistant to the CEO/CFO of Vivra Specialty Partners, a private health care services and technology firm. From 1992 through 1995, Mr. Felsenthal held various positions with us in research and new product development. Mr. Felsenthal received an A.B. degree from Princeton University and an M.B.A. from Stanford University.
Michael T. Kirshbaum became our Chief Financial Officer in February 2006 and Treasurer in March 2007. Mr. Kirshbaum joined us in 1998, and before his current role held a variety of positions in the finance group, most recently
8
serving as Senior Director of Finance. In that role, Mr. Kirshbaum was responsible for most of our finance operations, including our overall financial strategy and budgeting process, as well as a number of other accounting functions. Mr. Kirshbaum currently serves on the board of Evolent Health, Inc., a value-based care company. Mr. Kirshbaum received a B.S. degree in Economics from Duke University.
Evan R. Farber became our Chief Legal Officer in September 2015. Mr. Farber joined us in October 2007 as General Counsel and also has served as Corporate Secretary since November 2007. Before joining us, Mr. Farber was a partner at Hogan & Hartson L.L.P. (now Hogan Lovells US LLP), an international law firm, where he practiced corporate, securities, transactional, and commercial law. Mr. Farber received a B.A. degree from Binghamton University, State University of New York, and a J.D. from The George Washington University Law School.
Cormac F. Miller was named Chief Product Officer in January 2016. Mr. Miller served as our Executive Vice President from August 2011 through January 2016, with responsibility for corporate strategy and new product development, and as our Executive Director, Strategic Planning and New Product Development from January 2007 through August 2011. Mr. Miller joined us in 1996 and held various management positions within our research programs, including Executive Director, Research from October 2005 to December 2006, and Managing Director from October 2002 through October 2005. Mr. Miller received a B.S. degree from the University of Wisconsin-Madison.
Richard A. Schwartz became our Chief Operating Officer, Health Care in January 2016. He previously served as President, Performance Technologies and Consulting since March 2014 and also as Executive Vice President from February 2006 to February 2014, responsible for strategic planning and general management of our physician-oriented programs. Mr. Schwartz joined us in 1992 and held various management positions within our research programs, including Executive Director, Research from June 1996 to March 2000. In addition, Mr. Schwartz served as our General Manager, Research from 2001 to 2006. Mr. Schwartz received a B.A. degree from Stanford University and an M.B.A. from Duke University.
Mary D. Van Hoose has served as Chief Talent Officer since 2009. In this role Ms. Van Hoose oversees recruiting, retention, engagement, and development of our staff worldwide, and works closely with the executive team on a broad range of issues that include organizational planning, goal setting, leadership development, and firm communication. Ms. Van Hoose joined us in 1991 and initially served as a research analyst focusing on certain clinical best practices for hospitals and health care providers. From 2000 to 2009, Ms. Van Hoose served as our Executive Director of Career Management. Ms. Van Hoose received a B.A. degree from the University of Virginia.
9
Item 1A. Risk Factors.
We describe below what we believe are currently the material risks and uncertainties we face, but they are not the only risks and uncertainties we face. Additional risks and uncertainties that we are unaware of, or that we currently believe are not material, also may become important factors that could adversely affect our business, financial condition, results of operations, and prospects.
Risks Related to Our Business
Because most of our members are in the health care industry, factors that adversely affect the financial condition of the health care industry could have a negative impact on us.
We historically have derived most of our revenue from members in the health care industry. As a result, our business, financial condition, and results of operations could be adversely affected by conditions affecting the health care industry generally and hospitals and health systems in particular. Our ability to grow will depend on the economic environment of the health care industry as well as our ability to increase the number and the breadth of the services that we sell to our members. There are many factors that could affect the purchasing practices, operations, and, ultimately, the operating funds of health care organizations, such as reimbursement policies for health care expenses, consolidation in the health care industry, and regulation, litigation, and general economic conditions. Because of current macro-economic conditions, many health care delivery organizations continue to experience deteriorating cash flow, access to credit, and budgets. It is unclear what long-term effects general economic conditions will have on the health care industry and in turn on us.
The health care industry is highly regulated and is subject to changing political, legislative, regulatory, and other influences. Existing and new federal and state laws and regulations affecting the health care industry could create unexpected liabilities for us, could cause us or our members to incur additional costs, and could restrict our or our members’ operations. Many health care laws are complex and their application to us, our members, or the specific services and relationships we have with our members is not always clear. In addition, federal and state legislatures periodically have considered programs to reform or amend the U.S. health care system at both the federal and state level, such as the Patient Protection and Affordable Care Act and the Health Care and Education Reconciliation Act of 2010, and we expect that additional federal and state health care reform measures will be adopted in the future.
Because of the significant implementation issues arising under these laws and because regulations for implementing these laws are being released on an ongoing basis, it is unclear what long-term effects such issues they will have on the health care industry and in turn on our business, financial condition, and results of operations. Among other effects, we could be required to make unplanned modifications of our products and services or could suffer delays or cancellations of orders or reductions in demand for our products and services as a result of changes in regulations affecting the health care industry, such as any increased regulation by governmental agencies of the purchase and sale of medical products, changes to the Health Insurance Portability and Accountability Act of 1995, and the regulations that have been issued under it, which we refer to collectively as HIPAA, and other federal or state privacy laws, laws relating to the tax-exempt status of many of our members, or restrictions on permissible discounts and other financial arrangements. Our failure to anticipate accurately the application of these laws and regulations, or our failure to comply with them, could create liability for us, result in adverse publicity, and negatively affect our business.
Federal and state regulations governing our members in the education industry may negatively affect our members’ businesses, marketing practices, and budgets, any or all of which could have a material adverse effect on our ability to generate revenue.
We expect to derive an increasing amount of revenue from post-secondary educational institutions. Such educational institutions are subject to extensive federal and state regulation, including the Higher Education Act, Department of Education regulations, and individual state higher education regulations. The regulations govern many aspects of the operations of our higher education members, including marketing and recruiting activities, as well as their eligibility to participate in Title IV federal student financial aid programs, which is the principal source of funding for many of our members. There recently have been significant changes to these regulations, and a high level of regulatory activity and heightened legislative scrutiny is expected to continue. Changes in, new interpretations of, or noncompliance with applicable laws, regulations, standards, or policies applicable to our members could have a material adverse effect on their accreditation, authorization to operate in various states, or receipt of funds under Title IV programs, any of which, in turn, may harm our ability to generate revenue from these members and thereby negatively affect our financial results.
10
Privacy and security laws may increase the costs of operation and expose us to civil and criminal sanctions.
The privacy and security of personally identifiable information, also known as personal data, is a major issue in our industries. We must comply with extensive requirements regarding the use, disclosure, retention, and security of personal data, including patient health care information. Failure by us to comply with any of the applicable laws, regulations, and standards regarding privacy, identity theft prevention and detection, breach notification, and data security may subject us to actual or threatened proceedings, actions, and public statements against us by government entities, private parties, consumer advocacy groups, or others, including civil monetary penalties and, in some circumstances, criminal penalties or contractual liability under our agreements with our members. In addition, any such failure may harm our reputation and adversely affect our ability to retain existing members and attract new members.
Recently, there has been an increase in public awareness of privacy issues in the wake of revelations about data security breaches suffered by well-known companies and institutions and the activities of various government agencies and lawsuits filed in response to these breaches. Concerns about our practices with regard to the collection, use, disclosure, or security of personally identifiable information or other privacy-related matters, even if unfounded and even if we are in compliance with applicable laws, could damage our reputation and harm our business. In addition, we may incur significant costs in monitoring and complying with the multitude of evolving laws and regulations relating to privacy and security, the scope of which is changing and subject to differing interpretations.
The Health Insurance Portability and Accountability Act of 1996, the Health Information Technology for Economic and Clinical Health Act (or the HITECH Act, which was enacted as part of the American Recovery and Reinvestment Act of 2009), and the implementing regulations issued under these statutes contain substantial restrictions and requirements with respect to the use and disclosure of individuals’ protected health information. These restrictions and requirements are set forth in the Privacy Rule and Security Rule portions of HIPAA. The HIPAA Privacy Rule prohibits a covered entity from using or disclosing an individual’s protected health information unless the use or disclosure is authorized by the individual or is specifically required or permitted under the Privacy Rule, and requires covered entities to provide individuals with certain rights with respect to their protected health information. The Privacy Rule imposes a complex system of requirements on covered entities for complying with these basic standards. Under the HIPAA Security Rule, covered entities must establish administrative, physical, and technical safeguards to protect the confidentiality, integrity, and availability of electronic protected health information maintained or transmitted by them or by others on their behalf.
The HIPAA Privacy and Security Rules historically have applied directly to covered entities, such as our members who are health care providers that engage in HIPAA-defined standard electronic transactions or health plans. Because some of our members disclose protected health information to us so that we may use that information to provide certain services to them, we are a “business associate” of those members. To provide members with services that involve the use or disclosure of protected health information, the HIPAA Privacy and Security Rules require us to enter into business associate agreements with our members. Such agreements must, among other matters, provide adequate written assurances:
• | as to how we will use and disclose the protected health information; |
• | that we will implement reasonable administrative, physical, and technical safeguards to protect such information from misuse; |
• | that we will enter into similar agreements with our agents and subcontractors that have access to the information; |
• | that we will report security incidents and other inappropriate uses or disclosures of the information; and |
• | that we will assist the covered entity with certain of its duties under the Privacy Rule. |
On January 25, 2013, the United States Department of Health and Human Services, Office for Civil Rights, published a final rule modifying the HIPAA Privacy, Security, Enforcement, and Breach Notification Rules, referred to as the Final HIPAA Omnibus Rule, that implemented many of the provisions of the HITECH Act. Under the Final HIPAA Omnibus Rule, the privacy and security requirements of HIPAA were modified and expanded. The Final HIPAA Omnibus Rule applies certain of the HIPAA privacy and security requirements directly to business associates of covered entities. We must directly comply with certain aspects of the Privacy and Security Rules, and are also subject to enforcement for a violation of HIPAA. The Final HIPAA Omnibus Rule also imposes mandatory federal requirements for both covered entities and business associates regarding notification of breaches of unsecured protected health information.
Any failure or perception of failure of our products or services to meet HIPAA and related regulatory requirements could expose us to risks of investigation, notification, litigation, penalty, or enforcement, could adversely affect demand for our products and services, and force us to expend significant capital and other resources to modify our products or services to address the privacy and security requirements of our members and HIPAA.
11
In addition to our obligations under HIPAA, most states have enacted patient confidentiality laws that protect against the disclosure of confidential medical information, and many states have adopted or are considering adopting further legislation in this area, including privacy safeguards, security standards, and data security breach notification requirements. We may be required to comply with these state laws, if they are more stringent than HIPAA requirements and therefore not preempted by the federal requirements.
We are unable to predict what changes to HIPAA or other federal or state laws or regulations might be made in the future or how those changes could affect our business, products, services, or the associated costs of compliance.
Federal or state governmental authorities may impose additional data security standards or additional privacy or other restrictions on the collection, use, transmission, and other disclosures of health information that would limit, forbid, or regulate the use or transmission of health information pertaining to U.S. patients outside of the United States. Such legislation, if adopted, could render operations outside of the United States impracticable or substantially more expensive. In addition, although most of our business is conducted in the United States, some of our businesses and operations are international in nature and consequently are subject to regulation in the jurisdictions in which we conduct those operations. We may be obligated to comply with these regulatory regimes, which include, among other matters, privacy and data protection regulations (including requirements for cross-border data transfers) that vary from jurisdiction to jurisdiction.
Our higher education industry members are required to comply with The Family Educational Rights and Privacy Act, or FERPA, and if we violate obligations relating to such members’ FERPA compliance, our reputation and business could suffer.
FERPA generally prohibits an institution of higher education from disclosing personally identifiable information from a student’s education records without the student’s consent. Our members disclose to us certain information that originates from or constitutes a student education record under FERPA and must make such disclosures to us in compliance with FERPA. As an entity that provides services to institutions, we are indirectly subject to FERPA and may not transfer or otherwise disclose any personally identifiable information from a student record to another party other than in a manner permitted under the statute. Any violation of us by FERPA could result in a material breach of contract with one or more of our members and could harm our reputation. Further, if we disclose student information in violation of FERPA, the Department of Education could require one or more members to suspend our access to student information for an extended period.
If we or our subcontractors or agents cause a violation of the Higher Education Act and corresponding regulations established by the Department of Education as they relate to the ban on incentive compensation, we could be liable to our members for substantial fines, sanctions, or other liabilities.
Many of our higher education members are subject to the ban on incentive compensation established under the Higher Education Act and corresponding regulations established by the Department of Education. Such institutions are prohibited from providing any incentive payments based directly or indirectly on success in securing enrollments or financial aid to any persons or “entities” engaged in any student recruiting or admission activities or in making decisions regarding the award of student financial assistance. Such entities would include us to the extent that we are engaged in any student recruiting or admission activities, or in making decisions regarding financial aid, for a member. Moreover, the ban on incentive compensation extends to incentive payments, based directly or indirectly on success in securing enrollments or financial aid, to the employees of such entities if the employees are involved with or responsible for admissions, recruiting, or financial aid activities. If we or our subcontractors or agents act in a manner that causes a violation of the incentive compensation rule, we could be liable to our members for substantial fines, sanctions, or other liabilities, including liabilities related to “whistleblower” claims under the federal False Claims Act. Any such claims, even if without merit, could require us to incur significant costs to defend the claim, distract management’s attention from our operations, and damage our reputation.
If we or our subcontractors or agents act in a manner that causes a violation of the Department of Education’s misrepresentation rule, or similar federal and state regulatory requirements, we could face fines, sanctions, and other liabilities.
Many of our higher education members are subject to other regulations promulgated by the Department of Education that affect our student recruitment activities, including the misrepresentation rule. The misrepresentation rule is broad in scope and may apply to certain statements our employees, subcontractors, or agents may make on behalf of or at the direction of a higher education member about the nature of a member’s program, a member’s financial charges, or the employability of graduates of a member’s program. A violation of this rule, or other federal or state regulations applicable to our activities, based on statements or conduct by us or by an employee, subcontractor, or agent performing services for members could negatively affect our reputation, result in the termination of member contracts, require us to pay the fees associated with indemnifying a member from private claims or government investigations, or require us to pay substantial fines, sanctions, or other liabilities.
12
If our products or services fail to provide accurate information, or if our content or any other element of our products or services is associated with incorrect, inaccurate, or faulty coding, billing, or claims submissions to Medicare or any other third-party payor, we could be liable for damages to customers or the government.
Our products and content were developed based on the laws, regulations, and third-party payor rules in existence at the time such software and content was developed. Members could assert claims against us or the government, or qui tam relators on behalf of the government could assert claims against us under the federal False Claims Act or similar state laws, if we interpret those laws, regulations, or rules incorrectly; the laws, regulations, or rules materially change at any point after the software and content was developed; we fail to provide up-to-date, accurate information; or our products or services are otherwise associated with incorrect, inaccurate, or faulty coding, billing, or claims submissions by our members. The assertion of such claims and ensuing litigation, regardless of the resolution, could result in substantial costs to us, divert management’s attention from operations, damage our reputation, and decrease market acceptance of our services. Although we attempt to limit by contract our liability to customers for damages, the allocations of responsibility and limitations of liability set forth in our contracts may not be enforceable or otherwise protect us from liability for damages. We cannot limit liability the government could seek to impose on us under the False Claims Act.
If we fail to comply with federal and state laws governing health care fraud and abuse or reimbursement, we may be subject to civil and criminal penalties or loss of eligibility to participate in government health care programs.
A number of federal and state laws, including physician self-referral laws, anti-kickback restrictions, and laws prohibiting the submission of false or fraudulent claims, apply to health care providers, physicians, and others that make, offer, seek, or receive referrals or payments for products or services that may be paid for through any federal or state health care program and, in some instances, private programs. These laws are complex and change rapidly and may be applied to our business in ways that we do not anticipate. Federal and state regulatory and law enforcement authorities recently have increased enforcement activities with respect to Medicare and Medicaid fraud and abuse regulations and other health care reimbursement laws and rules. From time to time, participants in the health care industry receive inquiries or subpoenas to produce documents in connection with government investigations. We could be required to expend significant time and resources to comply with these requests, and the attention of our management team could be diverted from operations by these efforts.
These laws and regulations may change rapidly, and it is frequently unclear how they apply to our business. Errors created by our proprietary applications or that relate to claims or cost report information or services that relate to relationships between our members and other health care providers, including physicians, may be determined or alleged to be in violation of these laws and regulations. Any failure of our proprietary applications or services, including consulting and management services, to comply with these laws and regulations could result in substantial civil or criminal liability and could, among other impacts, adversely affect demand for our services, invalidate all or portions of some of our contracts with our members, require us to change or terminate some portions of our business, cause us to be disqualified from serving customers doing business with government payors, and give our members the right to terminate our contracts with them.
We could become subject to regulation by the Food and Drug Administration if functionality in one or more of the software applications we offer causes the software to be considered a medical device.
The overall framework of the laws and regulations administered by the Food and Drug Administration, or FDA, applies to all products that meet the definition of a “medical device.” To the extent that functionality in one or more of the software products we currently or may in the future offer causes the software to be considered a medical device under existing FDA regulations or policies or under regulations and policies now under active consideration by the FDA, we, as a provider of application functionality, could be required, depending on the functionality, to:
• | register our company and list products with the FDA; |
• | notify the FDA and demonstrate substantial equivalence to other products on the market before marketing our functionality; |
• | obtain FDA approval by demonstrating the safety and effectiveness of the regulated products prior to marketing; and |
• | comply with various FDA regulations, including the agency’s quality system regulation, medical device reporting regulations, corrections and removal reporting regulations, and post-market surveillance regulations. |
The FDA can impose extensive requirements governing pre- and post-market conditions, such as service investigation and conditions relating to approval, labeling, and manufacturing. In addition, the FDA can impose extensive requirements governing development controls and quality assurance processes. Any application of FDA regulations to our business could adversely affect our financial results by increasing our operating costs, slowing our time to market for regulated software products, and making it uneconomical to offer some software products.
13
Risks Related to Our Operations
Our revenue and results of operations may suffer if we are unable to attract new members, obtain renewals from existing members, or sell additional products and services.
We derive most of our revenue from annual memberships for our programs, products, and services. Our growth therefore depends on our ability to attract prospects to their first membership, achieve and sustain high renewal rates on existing memberships, and sell additional products and services to existing members. This depends on our ability to understand and anticipate market and pricing trends and members’ needs, the continuity of our principal contacts at a member organization, our members’ budgetary environment, and our ability to deliver consistent, reliable, high-quality, and timely products and services that are more desirable than those of our competition. Failure to achieve new member additions, to deliver acceptable member renewal rate levels, or to cross-sell additional memberships and services to existing members at the level we forecast could materially and adversely affect our operating results.
If we are unable to maintain our reputation and expand our name recognition, we may have difficulty attracting new business and retaining current members.
Our professional reputation is an important factor in attracting and retaining our members and in building relationships with the progressive health care and education organizations that supply many of the best practices we feature in our research. We believe that establishing and maintaining a good reputation and name recognition are critical for attracting and retaining members. Promotion and enhancement of our reputation will depend largely on our success in continuing to provide effective solutions. Our brand name and reputation will suffer, and our ability to attract new members or retain existing members could be adversely affected, if members do not perceive our solutions to be effective or of high quality or if there are inaccuracies or defects in our solutions.
If we are not able to offer new and valuable products and services, our business may suffer.
Our success depends on our ability to identify and develop new products and services that serve specific constituencies, to anticipate changing market trends, and to adapt our research, software applications, and analysis to meet the changing needs of our members. We may not be able to provide helpful and timely research and analysis of developments and trends in a manner that meets market needs. Any such failure could cause some of our existing products and services to become obsolete, particularly in the health care industry, where needs continue to evolve rapidly with the introduction of new technology and the obsolescence of old technology, changing payment systems and regulatory requirements, shifting strategies and market positions of major industry participants, and changing objectives and expectations of health care consumers. This environment of rapid and continuous change presents significant challenges to our ability to provide our members with timely research, software applications, and consulting and management services for issues and topics of importance. As a result, we must continue to invest resources in development of new programs and services in order to enhance our existing products and services and introduce new high-quality products and services that will appeal to members and potential members.
Many of our member relationships are non-exclusive or terminable after a specified term. If our new or modified product and service innovations are not responsive to user preferences or emerging industry standards or regulatory changes, are not appropriately timed with market opportunity, or are not effectively brought to market, we may lose existing members, be unable to obtain new members, or incur impairment of capitalized software development assets.
Because many of our programs offer a standardized set of services that allows us to spread our largely fixed program cost structure across our membership base of participating organizations, we may lose money on or terminate a program if we are unable to attract or retain a sufficient number of members in that program to cover our costs. Terminating a program could adversely affect our business by causing dissatisfaction among members of the terminated program and by impairing our reputation with current and potential members.
Competition may adversely affect our business.
Any failure by us adequately to identify, understand, or address competitive pressures could have a material adverse effect on our business. We compete in discrete programs and for discretionary dollars against health care-focused, education-focused, and multi-industry firms. These include traditional consulting firms; market research, data, benchmarking and forecasting providers; technology vendors and services firms; health care and education information technology firms; technology advisory firms; and specialized providers of educational and training services. Other entities, such as state and national trade associations, group purchasing organizations, non-profit think-tanks, and database companies, also may offer research, consulting, data- and tech-enabled services, and education services to health care and education organizations that are competitive with our programs.
We compete on the basis of several factors, including breadth, depth, and quality of product and service offerings, ability to deliver clinical, financial, and operational performance improvement through the use of products and services, quality and
14
reliability of services, ease of use and convenience, brand recognition, and the ability to integrate services with existing technology. Some of our competitors are more established, benefit from greater name recognition, have larger member bases, and have substantially greater financial, technical, and marketing resources. Other of our competitors have proprietary technology that differentiates their product and service offerings from ours. As a result of these competitive advantages, our competitors and potential competitors may be able to respond more quickly to market forces, undertake more extensive marketing campaigns for their brands, products, and services, and make more attractive offers to our members.
We also compete on the basis of price. We may be subject to pricing pressures as a result of, among other factors, competition within the industry, consolidation of health care industry participants, practices of managed care organizations, government action affecting reimbursement, government action affecting access to student loans, and financial stress experienced by our members. If our pricing experiences significant downward pressure, our business will be less profitable and our results of operations will be adversely affected.
We cannot be certain that we will be able to retain our current members or expand our member base in this competitive environment. If we do not retain current members or expand our member base, our business, financial condition, and results of operations will be harmed. Moreover, we expect that competition will continue to increase as a result of consolidation in both the health care information technology and health care industries. If one or more of our competitors or potential competitors were to merge or partner with another of our competitors, the change in the competitive landscape also could adversely affect our ability to compete effectively and could harm our business, financial condition, and results of operations.
Our prospects will suffer if we are not able to hire, train, motivate, manage, and retain a significant number of highly skilled employees.
Our future success depends upon our ability to hire, train, motivate, manage, and retain a significant number of highly skilled employees, particularly research analysts, technical experts, and sales and marketing staff. We have experienced, and expect to continue to experience, competition for professional personnel from management consulting firms and other producers of research, technology, and analysis services. Hiring, training, motivating, managing, and retaining employees with the skills we need is time consuming and expensive. Any failure by us to address our staffing needs in an effective manner could hinder our ability to continue to provide high-quality products and services, implement software applications, complete existing member engagements, or attract new members.
Unsuccessful design or implementation of our software may harm our future financial results.
Software development and implementation can take long periods of time and require significant capital investments. If our software applications are less effective, cost-efficient, or attractive to our members than they anticipate or do not function as expected or designed, we may not recover the development costs, and our competitive position, operations, or financial results could be adversely affected. In addition, any defects in our software applications or other intellectual property could result in additional development costs, the diversion of technical and other resources from our other development efforts, significant cost to resolve the defect, loss of members, harm to our reputation, risk of nonpayment, loss of revenue, and exposure to liability claims. We also rely on technology and implementation support provided by others in certain of our programs that offer software applications. Our business could be harmed by defects in this technology or by the failure of third parties to provide timely and accurate services.
Some of our products and services are complex and require significant work to implement. If the member implementation process is not executed successfully or if execution is delayed, our relationships with some of our members may be adversely impacted, and our results of operations may be negatively affected. In addition, cancellation of any of our products and services after implementation has begun may involve loss to us of time, effort, and resources invested in the canceled implementation as well as lost opportunity for acquiring other members over the same period.
We may experience significant delays in generating, or an inability to generate, revenue if potential members take a long time to evaluate our products and services.
A key element of our strategy is to market our products and services directly to health care providers, such as health systems and acute care hospitals, and education institutions, such as colleges and research universities, to increase the number of our products and services utilized by existing members. If we are unable to sell additional products and services to existing hospital, health system, and education members, or enter into and maintain favorable relationships with other health care providers or education organizations, our ability to increase our revenue could be materially adversely affected. We do not control many of the factors that will influence the decisions of these organizations regarding the purchase of our products and services. The evaluation process sometimes can be lengthy and involve significant technical evaluation and commitment of personnel by these organizations. The use of our products and services also may be delayed due to reluctance to change or modify existing procedures.
15
Unsuccessful delivery of our consulting and management services may harm our future financial success.
We provide strategic and operational support to our member institutions to help them achieve key clinical quality and financial performance goals, as well as to accelerate the implementation of best practices profiled in our research studies and to perform some services that they otherwise may perform themselves. If we do not deliver our services appropriately or timely, our relationships with some of our members and our results of operations may be negatively affected. To maintain our annual revenue and contract value from our consulting and management services, we will have to sell new consulting and management engagements each year as we complete other consulting and management engagements. We may not be successful in selling consulting and management engagements in the future as a result of a lack of continued market acceptance of our offerings or other factors. We also are subject to litigation for any failure to provide our services appropriately or in a timely manner.
We could sustain a material loss of business, substantial legal liability, and significant harm to our reputation as a result of an actual or attempted breach of security, unauthorized disclosure of information, denial of service attack, or the perception that personal or other sensitive or confidential information in our possession is not secure.
We receive, collect, process, and use a large amount of data and information from our employees and from or on behalf of our members and prospective members and other third parties in the course of our operations, including personally identifiable, protected health, and other sensitive and confidential information. This data is often accessed by us and our members through transmissions over public and private networks, including the Internet. The secure transmission of such information over the Internet and other mechanisms is essential to maintain confidence in our information technology systems. We have implemented security measures, technical controls, and contractual precautions designed to identify, detect, and prevent unauthorized access, alteration, use, or disclosure of our and our clients' and employees' data. However, there is no guarantee that these measures can provide absolute security. Beyond external criminal activity, systems that access or control access to our services and databases may be compromised as a result of human error, fraud, or malice on the part of employees or third parties, or may result from accidental technological failure. Because the techniques used to obtain unauthorized access, disable service, or sabotage systems change frequently, may originate from less regulated and remote areas around the world, and generally are not recognized until launched against us, we may be unable to proactively address these techniques or to implement adequate preventative measures.
If someone is able to circumvent or breach our security systems, they could misappropriate information or cause interruptions to our operations. Successful or attempted security breaches also could damage our reputation and expose us to a risk of monetary loss, litigation, fines, and sanctions. We also face risks associated with security breaches affecting third parties that conduct business with us or our members and others who interact with our data. While we maintain insurance against loss for certain security and privacy breaches, we may not carry appropriate insurance or maintain sufficient coverage to compensate for all potential liability.
The costs to us to eliminate or address the foregoing security problems and security vulnerabilities before or after an incident could be significant. Our remediation efforts may not be successful and could result in interruptions, delays, or cessation of service, and loss of existing or potential members that may impede our critical functions. In addition, breaches of our security measures and the unapproved dissemination of proprietary information or sensitive or confidential data about us or our members or other third parties could expose us, our members, or other third parties affected to a risk of loss or misuse of this information, result in litigation and potential liability for us, damage our brand and reputation, or otherwise harm our business. In addition, we rely in certain limited capacities on third-party data management providers whose possible security problems and security vulnerabilities may have similar effects on us.
Our business could be harmed by disruptions in service or operational failures at our data centers or at other service provider locations related to the storage, transmission, and presentation of member data.
Our data centers and service provider locations store and transmit critical member data that is essential to our business. While these locations are chosen for their stability, failover capabilities, and system controls, we do not directly control the continued or uninterrupted availability of every location. Interruptions in service or damage to locations may be caused by natural disasters, power loss, Internet or network failures, operator error, security breaches, computer viruses, denial-of-service attacks, or similar events, and could result in service interruptions, delays in access, or the destruction of data. Disaster recovery, data backups, and business continuity planning address many of these possible service interruptions, but the varied types and severity of the interruptions that could occur may render our safeguards inadequate. These service interruption events could impair our ability to deliver services or products or cause us to miss specified service levels in our agreements with our members, which could negatively affect our ability to retain existing members and attract new members.
16
We may be liable to our members and may lose members if we are unable to collect and maintain member data or if we lose member data.
Because of the large amount of data that we collect and manage from our members and other third parties and the increasing use of technology in our programs, hardware failures or errors in our processes or systems could result in data loss or corruption or cause the information that we collect to be incomplete or contain inaccuracies that our members regard as significant. Further, our ability to collect and report data may be interrupted or limited by a number of factors, including the failure of our network, software systems, or software applications, or the terms of our members’ contracts with their third-party suppliers. Computer viruses may harm our systems, causing us to lose data, and the transmission of computer viruses could expose us to litigation. In addition to potential liability, if we supply inaccurate information or experience interruptions in our ability to capture, store, supply, utilize, and report information, our reputation could be harmed and we could lose existing members and experience difficulties in attracting new members.
Failure by our members to obtain proper permissions and waivers for use and disclosure of the information we receive from them or on their behalf may result in claims against us or may limit or prevent our use of data, which could harm our business.
We require our members to provide necessary notices and to obtain necessary permissions and waivers for use and disclosure of the information that we receive, and we require contractual assurances from our members that they have done so and will do so. If our members do not obtain necessary permissions and waivers, our use and disclosure of information that we receive from them or on their behalf may be limited or prohibited by state or federal privacy laws or other laws. Any such failure to obtain proper permissions and waivers could impair our functions, processes, and databases that reflect, contain, or are based on such data and may prevent our use of such data. In addition, such a failure could interfere with or prevent creation or use of rules and analyses or limit other data-driven activities that benefit us. Moreover, we may be subject to claims or liability for use or disclosure of information by reason of our lack of a valid notice, permission, or waiver. These claims or liabilities could subject us to unexpected costs and adversely affect our operating results.
Our sources of data might restrict our use of or refuse to license us such data, which could adversely affect our ability to provide certain products or services.
A portion of the data that we use is purchased, licensed, or otherwise obtained from third parties, including from our members, government entities, and public records. We believe that we currently have the rights necessary to use the data that are incorporated into our products and services, although our licenses for information may not allow us to use that information for all potential or contemplated applications and products. These third parties could seek to withdraw their data from us for any reason, including if there is a competitive reason to do so, if legislation is passed restricting the use of the data, or if judicial or regulatory interpretations are issued restricting use of the data, and they also could fail to adhere to our data quality standards, causing us to incur additional expense to utilize the data appropriately. If a substantial number or data providers were to withdraw or restrict their data, or if they fail to adhere to our quality control standards, and if we are unable to identify and contract with suitable alternative data suppliers and integrate these data sources into our service offerings, our ability to provide products and services to our members could be materially adversely impacted, and it would have a material adverse effect on our business, financial condition, and results of operations.
If we are unable to maintain our third-party providers or strategic alliances, or enter into new alliances, we may be unable to expand our current business.
Our business strategy includes entering into strategic alliances and affiliations with leading service providers. If existing alliances are terminated or we are unable to enter into alliances with such providers, we may be unable to maintain or increase our market presence. We work closely with our strategic partners either to expand our penetration in certain areas or to expand our market capabilities. We may not achieve our objectives through these alliances. Many of these companies have multiple relationships and they may not regard us as significant to their business. Moreover, these companies, in certain circumstances, may pursue relationships with our competitors or develop or acquire products and services that compete with our products and services.
Our business could be harmed if we are no longer able to license, integrate, or access third-party technologies and data.
We depend upon licenses from third-party vendors for some of the technology and data used in our software applications, for some of the technology platforms upon which these applications operate. We also use third-party software to maintain and enhance content generation and delivery, and to support our technology infrastructure. These technologies might not continue to be available to us on commercially reasonable terms, or at all. Most of these licenses can be renewed only by mutual agreement and may be terminated if we breach the terms of the license and fail to cure the breach within a specified period. Our inability to obtain any of these licenses could delay our ability to provide services until alternative technology can be identified, licensed, and integrated, which may harm our financial condition and results of operations. Some of our third-
17
party licenses are non-exclusive, and our competitors may obtain the right to use any of the technology covered by these licenses to compete directly with us.
Our use of third-party technologies exposes us to increased risks, including risks associated with the integration of new technology into our solutions, the diversion of our resources from development of our own proprietary technology, and the generation of revenue from licensed technology sufficient to offset associated procurement and maintenance costs. In addition, if our vendors choose to discontinue support of the licensed technology in the future, we might not be able to modify or adapt our own solutions to operate as effectively without this technology.
In addition, we need to access a member’s information technology systems, some of which are provided to our members by third parties, in order to extract some of the member’s data for certain of our software applications or otherwise to provide some of our consulting and management services to the member. Some of those third parties may limit, condition, or otherwise deny us access to those systems for any reason, including if there is a competitive reason to do so. Our inability to obtain timely access to a member’s system on reasonable terms may increase the cost to deliver such services to our members and may adversely affect our ability to serve or retain existing members, gain new members, or continue to provide certain services.
Potential liability claims may adversely affect our business.
Our services, which may include recommendations and advice to organizations regarding complex business and operational processes, regulatory and compliance issues, and labor practices, may give rise to liability claims by our members or by third parties who bring claims against our members. Health care and education organizations often are the subject of regulatory scrutiny and litigation, and we also may become the subject of such litigation based on our advice and services. Any such litigation, whether or not resulting in a judgment against us, may adversely affect our reputation and could have a material adverse effect on our financial condition and results of operations. We may not have adequate insurance coverage for claims against us.
If the protection of our intellectual property is inadequate, our competitors may gain access to our intellectual property and we may lose our competitive advantage.
Our success depends in part upon our ability to protect our intellectual property. To accomplish this, we rely on a combination of internal controls, contractual arrangements, and legal protections to protect our proprietary rights in our products and services. The steps we have taken to protect our intellectual property rights may not be adequate to deter misappropriation of our rights and may not enable us to detect unauthorized uses and take timely and effective steps to enforce our rights. Our financial condition and results of operations could be negatively affected if we lose our competitive advantage because others are able to use our intellectual property. If unauthorized uses of our proprietary products and services were to occur, we may be required to engage in costly and time-consuming litigation to enforce our rights, and we might not prevail in any such litigation. If others were able to use our intellectual property, our ability to charge our fees for our products and services could be adversely affected. In addition, we may be subject to infringement claims as we become more well-known to non-operating entities, sometimes referred to as patent trolls, or to competitors, that assert patents against other entities.
If we are alleged to infringe, misappropriate, or violate the proprietary rights of third parties, we could incur unanticipated expense and be prevented from providing our products and services.
We could be subject to intellectual property infringement, misappropriation, or other intellectual property violation claims to the extent that our research content and applications’ functionality may overlap with competitive products, and third parties may claim that we do not own or have rights to use all intellectual property rights used in the conduct of our business. We cannot assure you that infringement, misappropriation, or claims alleging intellectual property violations will not be asserted against us. Also, we cannot assure you that any such claims will be unsuccessful. We could incur substantial costs and diversion of management resources defending any such claims. Further, a party making a claim against us could secure a judgment awarding substantial damages, as well as injunctive or other equitable relief that could effectively block our ability to provide products or services. Licenses for any intellectual property of third parties that might be required for our products or services may not be available on commercially reasonable terms, or at all. Such claims also might require us to indemnify of our members at significant expense.
A number of our contracts with our members contain indemnity provisions in which we indemnify such members against certain losses that may arise from third-party claims that are brought in connection with the use of our products.
Our exposure to risks associated with the use of intellectual property may be increased as a result of our acquisitions of technology, as we have limited information about the development process with respect to such technology or the care taken to safeguard against infringement risks. In addition, third parties may make infringement and similar or related claims after we have acquired technology that had not been asserted prior to our acquisition.
18
Our use of open source technology could adversely affect our ability to commercialize our software applications and subject us to possible litigation.
The products or technologies acquired, licensed, or developed by us may incorporate so-called “open source” software, and we may incorporate open source software into other products in the future. Such open source software is generally licensed by its authors or other third parties under various public domain or other open source licenses. Some open source software licenses require users who distribute open source software as part of their software to disclose publicly all or part of the source code to such software or make available any derivative works of the open source code on unfavorable terms or at no cost. There is little or no legal precedent governing the interpretation of many of the terms of these licenses and therefore the potential impact of such terms on our business is unknown and may result in unanticipated conditions or restrictions on our ability to market our software applications.
If an author or other party that distributes such open source software were to allege that we had not complied with the conditions of one or more of these licenses, we could be required to incur significant legal costs defending ourselves against such allegations. If our defenses were not successful, we could be subject to significant damages, be enjoined from the distribution of our products that contained the open source software, and be required to comply with the foregoing conditions, which could disrupt the distribution and sale of some of our products. In addition, if we combine our proprietary software with open source software in a certain manner, we could be required under some open source licenses to release the source code of our proprietary software, which could substantially help our competitors develop products that are similar to or better than ours.
We make estimates and assumptions in connection with the preparation of our consolidated financial statements, and any changes to those estimates and assumptions could have a material adverse effect on our operating results.
In connection with the preparation of our consolidated financial statements, we use certain estimates and assumptions based on historical experience and other factors. Our most critical accounting estimates are described in “Management’s Discussion and Analysis of Financial Condition and Results of Operations” in this report. In addition, as discussed in Note 2 to our consolidated financial statements for the twelve months ended December 31, 2015 included elsewhere in this report, we make certain estimates, including decisions related to provisions for uncollectible revenue, income taxes, and other contingencies. While we believe that these estimates and assumptions are reasonable under the circumstances, they are subject to significant uncertainties, some of which are beyond our control. If any of these estimates and assumptions should change or prove to have been incorrect, our reported operating results could be materially adversely affected.
Any significant increase in bad debt in excess of recorded estimates would have a negative impact on our business, financial condition, and results of operations.
Our operations may incur unexpected losses from unforeseen exposures to member credit risk. We initially evaluate the collectability of our accounts receivable based on a number of factors, including a specific member’s ability to meet its financial obligations to us, the length of time the receivables are past due, and historical collections experience. Based on these assessments, we record a reserve for specific account balances as well as a general reserve based on our historical experience for bad debt to reduce the related receivables to the amount we expect to collect from members. If circumstances related to specific members change as a result of economic conditions or otherwise, such as a limited ability to meet financial obligations due to bankruptcy, or if conditions deteriorate to the extent that our past collection experience is no longer relevant, the amount of accounts receivable that we are able to collect may be less than our previous estimates as we experience bad debt in excess of reserves previously recorded.
We may fail to realize the anticipated benefits of our acquisition of Royall.
Our future success will depend in part on our ability to realize the new revenue opportunities and other benefits that we expect to achieve from the integration of the businesses of Royall Acquisition Co., referred to as “Royall,” into our company. Our operating results and financial condition will be adversely affected if we are unable to integrate successfully Royall’s operations into our own, fail to achieve new revenue opportunities, incur unforeseen costs and expenses, or experience unexpected operating difficulties that offset anticipated benefits. In particular, the integration of our and the Royall businesses will involve, among other matters, integration of sales, marketing, billing, accounting, management, personnel, payroll, and other systems.
We are continuing to integrate the operations of Royall and other acquisitions into our business, and we may be unable to do so in the manner expected.
Our ability to achieve the anticipated benefits of our acquisition of Royall and other acquisitions continue to be subject to a number of uncertainties. The integration process, which is continuing in 2016, could result in brand confusion, reduced employee morale and engagement, the disruption of our businesses, processes, and systems, inconsistencies in standards, controls, procedures, practices, and policies, and a significant burden on our management and internal resources, any of which could adversely affect our ability to achieve the anticipated the benefits of the acquisition as and when expected, or at all.
19
Failure to achieve these anticipated benefits could result in increased costs or decreases in the amount of expected revenue and efficiencies from the Royall and other smaller acquisitions and could adversely affect our operating results and future growth
We may pursue other acquisition opportunities, which could subject us to considerable business and financial risk.
We evaluate potential acquisitions of complementary businesses on an ongoing basis and may from time to time pursue acquisition opportunities. We may not be successful in identifying acquisition opportunities, assessing the value, strengths, and weaknesses of these opportunities, or completing acquisitions on acceptable terms. Future acquisitions may result in dilution to our earnings, including as a result of dilutive issuances of equity securities we may pay as acquisition consideration. Acquisitions may expose us to particular business and financial risks, including risks that we may:
• | suffer the diversion of financial and management resources from existing operations; |
• | incur indebtedness and assume additional liabilities, known and unknown, including liabilities relating to the use of intellectual property we acquire; |
• | incur significant additional capital expenditures, transaction expenses, operating expenses, and non-recurring acquisition-related and integration charges; |
• | experience an adverse impact on our earnings from the amortization or impairment of acquired goodwill and other intangible assets; |
• | fail to integrate successfully the operations and personnel of the acquired businesses; |
• | enter new markets or market new products with which we are not entirely familiar; and |
• | fail to retain key personnel of, vendors to, and clients of the acquired businesses. |
If we are unable to manage the risks associated with acquisitions, or if we experience unforeseen expenses, difficulties, complications, or delays frequently encountered in connection with the integration of acquired entities and the expansion of operations, we may fail to achieve expected cost savings, revenue opportunities, and other expected benefits of our acquisition strategy and may be required to focus resources on integrating the acquired operations rather than on our primary product and service offerings.
Goodwill impairment charges may adversely affect our operating results.
Goodwill represents the excess purchase price over the net amount of identifiable assets acquired and liabilities assumed in a business combination measured at fair value. We have a substantial amount of goodwill on our balance sheet generated in connection with our acquisitions and business growth strategy. As of December 31, 2015, our goodwill of approximately $738.2 million represented approximately 37.3% of our total assets as of that date. We test the goodwill balances allocated to our reporting units for impairment on an annual basis and if events occur or circumstances change that indicate that the fair value of one or more of our reporting units may be below its carrying amount. A decline in the quoted market price of our stock could denote a triggering event indicating that goodwill may be impaired. When testing goodwill for impairment, we determine fair value using both an income and market approach. The income approach is based on the present value of expected future cash flows utilizing a market-based weighted average cost of capital, or “WACC.” The market approach is based on revenue and earnings multiple data of peer companies. Given that market prices of our reporting units are not readily available, we make various estimates and assumptions in determining the fair value of the reporting units, including estimating revenue growth rates, operating margins, capital expenditures, working capital requirements, tax rates, terminal growth rates, discount rate, benefits associated with a taxable transaction, and synergistic benefits available to market participants. We also perform a reconciliation between our market capitalization and our estimate of the aggregate fair value of the reporting units, including consideration of a control premium. Fair value determinations require considerable judgment and are sensitive to inherent uncertainties and changes in the estimates and assumptions described above.
In connection with our annual goodwill assessment on October 1, 2015, management reduced its cash flow projections for Royall due in part to first year performance being below the expectations we had set as of the acquisition date. Based on the results of the impairment test, we recorded an impairment charge of 15.3% of Royall’s goodwill. For information about this $99.1 million impairment charge, see Note 8, “Goodwill and intangibles,” to our consolidated financial statements included in this report.
Continued lower than expected revenue growth, a trend of weaker than anticipated financial performance, including the pace and extent of operating margin, a decline in our share price from current levels for a sustained period of time, or an increase in the market-based WACC, among other factors, could significantly impact our impairment analysis and may result in further goodwill impairment charges that, if incurred, could have a material adverse effect on our financial condition and results of operations. For additional information, see “Management’s Discussion and Analysis of Financial Condition and Results of Operations - Summary of Critical Accounting Policies - Goodwill and Other Intangible Assets.”
20
We may invest in companies for strategic reasons and may not realize a return on our investments.
From time to time, we may make investments in companies to further their strategic objectives and support our key business initiatives. Such investments could include equity or debt instruments in private companies, many of which may be not be marketable at the time of our initial investment. These companies may range from early-stage companies that are often still defining their strategic direction to more mature companies with established revenue streams and business models. The success of these companies may depend on product development, market acceptance, operational efficiency, and other key business factors. The companies in which we invest may fail because they may not be able to secure additional funding, obtain favorable investment terms for future financings, or take advantage of liquidity events such as public offerings, mergers, and private sales. If any of these private companies fails, we could lose all or part of our investment in that company. If we determine that impairment indicators exist and that there are other-than-temporary declines in the fair value of the investments, we may be required to write down the investments to their fair value and recognize the related write-down as an investment loss.
If our members who operate as not-for profit entities lose their tax-exempt status, those members would suffer significant adverse tax consequences which, in turn, could adversely affect their ability to purchase products or services from us.
State tax authorities have challenged the tax-exempt status of hospitals and other health care facilities claiming such status on the basis that they are operating as charitable or religious organizations. The outcome of these cases has been mixed, with some facilities retaining their tax-exempt status and others being denied the ability to continue operating as not-for profit, tax-exempt entities under state law. In addition, many states have removed sales tax exemptions previously available to not-for-profit entities, and both the Internal Revenue Service and the U.S. Congress are investigating the practices of non-for profit hospitals. Those facilities denied tax exemptions could be subject to the imposition of tax penalties and assessments that could have a material adverse impact on their cash flow, financial strength, and, in some cases, continuing viability. If the tax-exempt status of any of our members is revoked or compromised by new legislation or interpretation of existing legislation, that member’s financial health could be adversely affected, which could negatively affect our sales to the member.
Our growing operations in India expose us to risks that could have an adverse effect on our costs of operations.
As of December 31, 2015, we employed approximately 250 employees in India through our Indian subsidiary, ABCO Advisory Services India Private Ltd., which expects to continue adding personnel. While there are cost advantages to operating in India, significant growth in the technology sector in India has increased competition to attract and retain skilled employees and has led to a commensurate increase in compensation expense. In the future, we may not be able to hire and retain such personnel at compensation levels consistent with our existing compensation and salary structure in India. In addition, our reliance on a workforce in India exposes us to disruptions in the business, political, and economic environment in that region. Maintenance of a stable political environment is important to our operations, and terrorist attacks and acts of violence or war may directly affect our physical facilities and workforce or contribute to general instability. Our operations in India require us to comply with complex local laws and regulatory requirements and expose us to foreign currency exchange rate risk. Our Indian operations also may subject us to trade restrictions, reduced or inadequate protection for intellectual property rights, and security breaches. Negative developments in any of these areas could increase our costs of operations or otherwise harm our business.
If we are required to collect sales and use taxes on the programs we sell in various jurisdictions, we may be subject to liability for past sales and incur additional related costs and expenses and may experience a decrease in our future sales.
We may lose sales or incur significant expenses if states are successful in imposing state sales and use taxes on our services. A successful assertion by one or more states that we should collect sales or other taxes on the sale of our services could result in substantial tax liabilities for past sales, decrease our ability to compete with software vendors not subject to sales and use taxes, and otherwise harm our business. Each state has different rules and regulations governing sales and use taxes, and these rules and regulations are subject to varying interpretations that may change over time. We review these rules and regulations periodically and, when we believe that our services are subject to sales and use taxes in a particular state, may approach state tax authorities to determine how to comply with their rules and regulations. We may become subject to sales and use taxes and related interest and penalties for past sales in states where we believe no compliance is necessary. If we are required to collect and pay back taxes and the associated interest and penalties, and if our members fail or refuse to reimburse us for all or a portion of these amounts, we will incur unplanned expenses that may be substantial. Moreover, imposition of such taxes on our future services will effectively increase the cost of such services to our members and may adversely affect our ability to retain existing clients or to gain new members in the states in which such taxes are imposed.
We may not be able to fully realize our deferred tax assets.
For tax purposes, we have deferred income tax assets consisting primarily of state income tax credit and net operating loss carryforwards. As of December 31, 2015, our deferred income tax assets totaled approximately $49.6 million, which
21
constituted approximately 2.5% of our total assets as of that date. If our future taxable income is less than we believe it will be, we may not be able to fully realize our deferred tax assets. In estimating future tax consequences, we do not consider the effect of future changes in existing tax laws or rates in the determination and evaluation of deferred tax assets and liabilities until the new tax laws or rates are enacted. We have established our deferred income tax assets and liabilities using currently enacted tax laws and rates, including the estimated effects of our status as a Qualified High Technology Company on our Washington, D.C. deferred tax assets. We will recognize an adjustment to income for the impact of new tax laws or rates on the existing deferred tax assets and liabilities when and if new tax laws or rates are enacted that have an impact on our deferred income taxes.
Changes in, or interpretations of, tax rules and regulations may adversely affect our effective tax rates.
We are subject to income and other taxes in the United States and several foreign jurisdictions. Significant judgment is required in evaluating our provision for income taxes. We also are subject to tax audits in various jurisdictions, and such jurisdictions may assess additional tax against us. Although we believe our tax estimates are reasonable, the final determination of tax audits and any related litigation could be materially different from our historical income tax provisions and accruals. The results of an audit or litigation, or the effects of a change in tax policy in the United States or in any of the international jurisdictions where we do business, could have a material effect on our operating results in the period or periods for which that determination is made.
As a result of the inherent limitations in our internal control over financial reporting, misstatements due to error or fraud may occur and not be detected.
Our disclosure controls and procedures are designed to provide reasonable assurance that information required to be disclosed by us in reports we file with or submit to the SEC under the Securities Exchange Act of 1934, or the “Exchange Act,” is accumulated and communicated to management and recorded, processed, summarized, and reported within the time periods specified in SEC rules and forms. We believe that any disclosure controls and procedures or internal controls and procedures, no matter how well conceived and operated, can provide only reasonable, not absolute, assurance that the objectives of the control system are met. These inherent limitations include the realities that judgments in decision-making can be faulty and that breakdowns can occur because of simple error or mistake. In addition, controls can be circumvented by the individual acts of some persons, by collusion of two or more people, or by an unauthorized override of the controls.
Any failure by us to maintain effective internal control over financial reporting may adversely affect investor confidence in our company and, as a result, the value of our common stock.
We are required under Section 404 of the Sarbanes-Oxley Act to furnish a report by management on the effectiveness of our internal control over financial reporting and to include a report by our independent auditors attesting to such effectiveness. Any failure by us to maintain effective internal control over financial reporting could adversely affect our ability to report accurately our financial condition or results of operations. If we are unable to conclude that our internal control over financial reporting is effective, or if our independent auditors determine that we have a material weakness in our internal control over financial reporting, we could lose investor confidence in the accuracy and completeness of our financial reports, the market price of our common stock could decline, and we could be subject to sanctions or investigations by the SEC or other regulatory authorities. Failure to remedy any material weakness in our internal control over financial reporting, or to implement or maintain other effective control systems required of public companies, also could restrict our future access to the capital markets. As discussed in this report under “Controls and Procedures,” our management concluded that, as of December 31, 2015, we had material weaknesses in our internal control over financial reporting related to our revenue recognition and business combination processes.
Our issuance of additional capital stock in connection with financings, acquisitions, investments, our stock incentive plans, or otherwise could adversely affect the market price of our common stock.
Our charter authorizes us to issue up to 135,000,000 shares of common stock and up to 5,000,000 shares of preferred stock with such rights and preferences as may be determined by our board of directors. Subject to compliance with applicable rules and regulations and our debt covenants, we may issue our shares of common stock or securities convertible into our common stock from time to time in connection with a financing, acquisition, investment, our stock incentive plans, or otherwise. We may issue additional shares of common stock at a discount from the market price of our common stock on the issue date. Any issuance of stock could result in substantial dilution to our existing stockholders and cause the market price of our common stock to decline.
22
Provisions in our charter and bylaws could discourage takeover attempts we oppose even if our stockholders might benefit from a change in control of our company.
Provisions in our charter and bylaws may make it difficult and expensive for a third party to pursue a takeover attempt we oppose even if a change in control of our company would be beneficial to the interests of our stockholders. These provisions also could make it more difficult for you and other stockholders to elect directors of your choosing and cause us to take other corporate actions you support. The charter and bylaw provisions:
• | provide that the number of directors that will constitute the entire board of directors will be determined by a resolution of a majority of the board; |
• | provide that any vacancy on the board of directors may be filled only by the affirmative vote of a majority of the remaining directors then in office; |
• | provide that a special meeting of stockholders may be called only by a majority of the directors then in office, by the chairman of the board of directors, or by any holder or holders of at least 40% of the outstanding shares of capital stock then entitled to vote on any matter for which the special meeting is being called; |
• | prohibit stockholders from taking action by written consent in lieu of a meeting with respect to any actions that are required or permitted to be taken by stockholders at any annual or special meeting of stockholders; |
• | provide authority for our board of directors without stockholder approval to provide for the issuance of up to 5,000,000 shares of preferred stock, in one or more classes or series, with terms and conditions, and having rights, privileges and preferences, to be determined by the board of directors; and |
• | establish advance notice procedures for stockholders to make nominations of candidates for election as directors or to present any other business for consideration at any annual or special stockholder meeting. |
Risks Related to Our Indebtedness
Our level of debt and interest payment obligations may limit our growth and operational flexibility.
As of December 31, 2015, we had approximately $553.4 million in aggregate outstanding indebtedness, consisting of $453.4 million in borrowings under our senior secured term loan facility and $100 million in borrowings under our senior secured revolving credit facility. These facilities were obtained on February 6, 2015 and amended on October 31, 2015, as described elsewhere in this report. We may incur an additional $100 million of indebtedness under our senior secured revolving credit facility. This substantial level of indebtedness may have important consequences. For example, it may:
• | require us to dedicate a substantial portion of our cash flow from operations to payments on our indebtedness, thereby reducing the availability of our cash flow to fund working capital, capital expenditures, and other general corporate purposes; |
• | limit our ability to obtain additional financing to expand our business or alleviate liquidity constraints, as a result of financial and other restrictive covenants in our indebtedness; |
• | limit our ability to pursue our acquisition strategy; |
• | increase our vulnerability to general adverse economic and industry conditions; |
• | limit our flexibility in planning for, or reacting to, changes in our business and the industry in which we operate; and |
• | place us at a competitive disadvantage relative to companies that have less indebtedness. |
Covenants under our senior secured credit agreement may restrict our future operations.
Our senior secured credit agreement imposes operating and financial restrictions that limit our discretion on certain business matters, which could make it more difficult for us to expand, finance our operations, and engage in other business activities that may be in our interest. These restrictions include a requirement that we comply on a quarterly basis with financial covenants. Our debt covenants limit our ability and the ability of our subsidiaries to:
• | incur indebtedness; |
• | create liens on assets; |
• | pay cash dividends; |
• | repurchase shares of our common stock or make other restricted payments; |
23
• | make investments in or loans to other parties; |
• | sell assets; |
• | engage in mergers and acquisitions; |
• | enter into transactions with affiliates; |
• | enter into sale and leaseback transactions; and |
• | engage in businesses other than businesses of the type we conduct currently. |
We may incur indebtedness in addition to the foregoing indebtedness. Any additional indebtedness we may incur in the future may subject us to similar or even more restrictive conditions.
We are subject to interest rate risk that could cause us to incur unanticipated costs.
Borrowings under our senior secured credit agreement are at variable rates of interest and expose us to interest rate risk. If interest rates were to increase, our debt service obligations on the variable rate indebtedness would increase even though the amount borrowed would remain the same, and our net income and cash flows, including cash available for servicing our indebtedness, would correspondingly decrease. We have entered into interest rate swaps that involve the exchange of floating for fixed rate interest payments in order to reduce interest rate volatility for a notional amount of $276.8 million at December 31, 2015. However, we may not maintain interest rate swaps with respect to all of our variable rate indebtedness and any swaps we enter into may not fully mitigate our interest rate risk. Additionally, hedging transactions involve additional risks such as counterparty risk, the legal enforceability of hedging contracts, the early repayment of hedged transactions, and the risk that unanticipated and significant changes in interest rates may cause a significant loss of basis in the contract and a change in current period expense.
In the event that we need to refinance all or a portion of our outstanding debt before maturity or as it matures, we may not be able to obtain terms as favorable as the terms of our existing debt or refinance our existing debt at all. If interest rates or other factors existing at the time of refinancing result in higher interest rates upon refinancing, the interest expense relating to the refinanced debt would increase.
Hedging instruments often are not guaranteed by an exchange or its clearing house and involve risks and costs.
Hedging instruments involve risk since they are often not guaranteed by an exchange or a clearing house. The enforceability of agreements underlying derivative transactions may depend on compliance with applicable regulatory requirements and, depending on the identity of the counterparty, applicable international requirements. The business failure of a hedging counterparty with which we enter into a hedging transaction would most likely result in a default, which would result in the loss of unrealized gains and force us to cover our resale commitments, if any, at the then current market price. Although we generally seek to reserve the right to terminate our hedging positions, it may not always be possible to dispose of or close out a hedging position without the consent of the hedging counterparty, and we may not be able to enter into an offsetting contract to cover our risk. We cannot assure that a liquid secondary market will exist for hedging instruments purchased or sold, and we may be required to maintain a position until its expiration, which could result in losses.
24
Item 1B. Unresolved Staff Comments.
None.
Item 2. Properties.
Our headquarters is located in approximately 290,000 square feet of office space in Washington, D.C. The facilities accommodate research, delivery, marketing and sales, software development, information technology, administration, and operations personnel. Our headquarters facilities is under an operating lease that expires in May 2019. The lease contains provisions for rental escalation and requires us to pay our portion of our executory costs such as taxes, insurance, and operating expenses.
In December 2015, we entered into a new lease to move our headquarters to a building, yet to be constructed, in Washington, D.C. We expect to occupy the building for 16 years, starting no later than May 1, 2019. Payments to the landlord under our new lease agreement will not begin until May 2019.
As of December 31, 2015, we also leased office space under operating leases in Birmingham, Alabama; Tucson, Arizona; San Francisco, California; Chicago, Illinois; Bloomington, Minnesota; Plymouth Meeting, Pennsylvania; Nashville, Tennessee; Austin, Texas; Houston, Texas; Richmond, Virginia; and London, England. We also lease office space in Chennai, India through our Indian subsidiary, ABCO Advisory Services India Private Ltd. For information about our leases, see Note 16, “Commitments and contingencies,” to our consolidated financial statements included elsewhere in this report. We believe that our facilities are adequate for our current needs and that additional facilities will be available for lease on a commercially reasonable basis to accommodate our anticipated growth.
Item 3. Legal Proceedings.
From time to time, we are subject to ordinary routine litigation incidental to our normal business operations. We are not currently a party to, and our property is not subject to, any material legal proceedings.
Item 4. Mine Safety Disclosures.
None.
25
PART II
Item 5. | Market For Registrant’s Common Equity, Related Stockholder Matters and Issuer Purchases of Equity Securities. |
Our common stock is listed on the Global Select Market of The NASDAQ Stock Market LLC and is traded under the NASDAQ symbol “ABCO.” The following table sets forth, for the fiscal periods indicated, the high and low sales prices per share of our common stock as reported on the NASDAQ Global Select Market.
High | Low | ||||||
Calendar Year Ended December 31, 2015: | |||||||
First quarter | $ | 56.49 | $ | 43.00 | |||
Second quarter | $ | 54.94 | $ | 46.67 | |||
Third quarter | $ | 60.38 | $ | 43.59 | |||
Fourth quarter | $ | 54.84 | $ | 40.70 | |||
Transition Period Ended December 31, 2014: | |||||||
First quarter | $ | 66.04 | $ | 46.58 | |||
Second quarter | $ | 55.22 | $ | 43.00 | |||
Third quarter | $ | 54.62 | $ | 37.47 | |||
As of February 19, 2016, there were eight holders of record of our common stock and 41,581,722 shares of common stock outstanding. The number of record holders does not include individuals or entities who beneficially own shares but whose shares are held of record by a broker, bank, or other nominee, but does include each such broker, bank, or other nominee as one record holder.
We have not declared or paid any cash dividends on our common stock since we became a public company in 2001. We do not currently anticipate declaring or paying any cash dividends. The timing and amount of future cash dividends, if any, is periodically evaluated by our board of directors and would depend on, among other factors, our earnings, financial condition, cash requirements, and restrictions on dividend payments under our senior secured credit facilities.
26
The Advisory Board Company Stock Comparable Performance Graph
The graph below compares the cumulative total stockholder return on our common stock during the period from March 31, 2011 through December 31, 2015, with the cumulative total return on the S&P 500 Index, the Russell 2000 Index, and the NASDAQ Composite Index for the same period. The comparison assumes that $100 was invested on March 31, 2011 in our common stock and in each of the foregoing indices and assumes reinvestment of dividends, if any. The comparisons in the graph below are based on historical data and are not intended to forecast the possible future performance of our common stock.
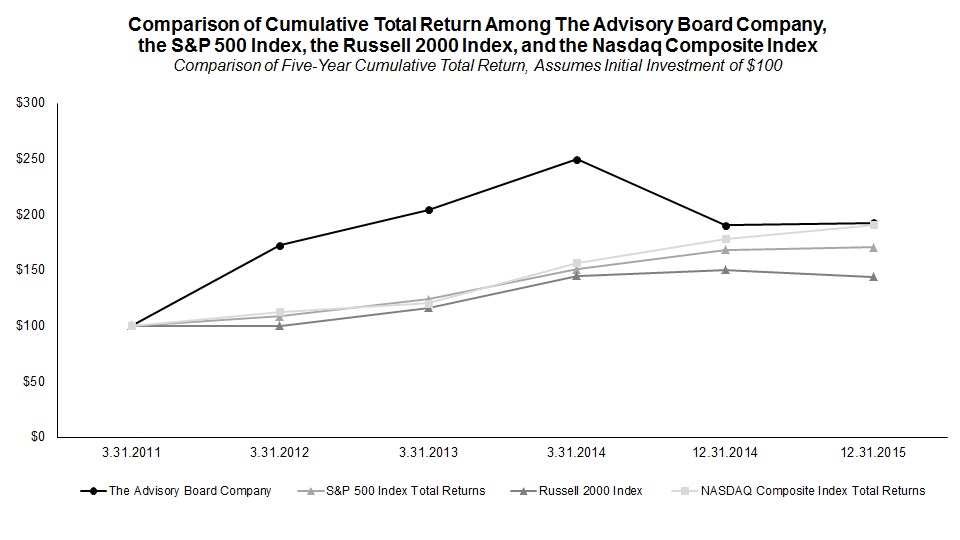
The Advisory Board Company | S&P 500 Index | Russell 2000 Index | NASDAQ Composite Index | |||||||||||||
March 31, 2011 | $ | 100 | $ | 100 | $ | 100 | $ | 100 | ||||||||
March 31, 2012 | $ | 172 | $ | 109 | $ | 100 | $ | 112 | ||||||||
March 31, 2013 | $ | 204 | $ | 124 | $ | 116 | $ | 120 | ||||||||
March 31, 2014 | $ | 250 | $ | 151 | $ | 145 | $ | 157 | ||||||||
December 31, 2014 | $ | 190 | $ | 168 | $ | 150 | $ | 178 | ||||||||
December 31, 2015 | $ | 193 | $ | 171 | $ | 144 | $ | 191 | ||||||||
27
Issuer Purchases of Equity Securities
In January 2004, our board of directors authorized the repurchase by us from time to time of up to $50 million of our common stock. That authorization subsequently was increased in cumulative amount to $100 million in October 2004, to $150 million in February 2006, to $200 million in January 2007, to $250 million in July 2007, to $350 million in April 2008, to $450 million in May 2013, and to the current level of $550 million in November 2015. All repurchases have been made in the open market pursuant to this publicly announced repurchase program. No minimum number of shares has been fixed, and the share repurchase authorization has no expiration date. A summary of the share repurchase activity for our fourth quarter of calendar year 2015 is set forth in the following table:
Total Number of Shares Purchased | Average Price Paid Per Share | Total Number of Shares Purchased as Part of Publicly Announced Plans or Programs | Approximate Dollar Value of Shares That May Yet Be Purchased Under The Plan | ||||||||||
October 1 to October 31, 2015 | — | $ | — | — | $ | 18,161,660 | |||||||
November 1 to November 30, 2015 | 18,600 | $ | 53.64 | 18,600 | $ | 17,163,979 | |||||||
December 1 to December 31, 2015 | 373,254 | $ | 50.91 | 373,254 | $ | 98,161,642 | |||||||
Total | 391,854 | $ | 51.04 | 391,854 | |||||||||
As of December 31, 2015, we had repurchased a total of 17,827,542 shares under our repurchase program since its inception.
28
Item 6. Selected Financial Data.
The following table presents our selected financial data. The table should be read in conjunction with our consolidated financial statements, the notes to the consolidated financial statements, and “Management’s Discussion and Analysis of Financial Condition and Results of Operations” included elsewhere in this report.
Calendar Year | Transition Period | Fiscal Year | ||||||||||||||||||
2015 | 2014 (1) | 2014 (1) | 2013 (1) | 2012 (1) | ||||||||||||||||
(In thousands except per share amounts) | ||||||||||||||||||||
Statements of Operations Data: | ||||||||||||||||||||
Revenue | $ | 768,348 | $ | 434,002 | $ | 519,429 | $ | 450,286 | $ | 370,345 | ||||||||||
Costs and expenses: | ||||||||||||||||||||
Cost of services, excluding depreciation and amortization | 392,676 | 230,769 | 271,923 | 237,605 | 197,937 | |||||||||||||||
Member relations and marketing | 120,958 | 81,244 | 96,298 | 85,264 | 73,875 | |||||||||||||||
General and administrative | 128,669 | 75,483 | 74,169 | 62,185 | 47,892 | |||||||||||||||
Depreciation and amortization | 73,134 | 30,317 | 31,084 | 20,108 | 14,269 | |||||||||||||||
Impairment of capitalized software | 8,166 | 2,086 | — | — | — | |||||||||||||||
Goodwill impairment | 99,145 | — | — | — | — | |||||||||||||||
Total costs and expenses | 822,748 | 419,899 | 473,474 | 405,162 | 333,973 | |||||||||||||||
Operating (loss) income | (54,400 | ) | 14,103 | 45,955 | 45,124 | 36,372 | ||||||||||||||
Other (expense) income: | ||||||||||||||||||||
Interest Expense | (21,121 | ) | — | — | — | — | ||||||||||||||
Other (expense) income, net | (6,499 | ) | (1,327 | ) | 2,706 | 2,604 | 3,034 | |||||||||||||
Loss on financing activities | (17,398 | ) | — | — | — | — | ||||||||||||||
Total other (expense) income, net | (45,018 | ) | (1,327 | ) | 2,706 | 2,604 | 3,034 | |||||||||||||
(Loss) Income from continuing operations before provision for income taxes and equity in loss of unconsolidated entities | (99,418 | ) | 12,776 | 48,661 | 47,728 | 39,406 | ||||||||||||||
Provision for income taxes | (15,200 | ) | (3,530 | ) | (18,737 | ) | (17,899 | ) | (15,207 | ) | ||||||||||
Equity in loss of unconsolidated entities | (4,396 | ) | (6,540 | ) | (6,051 | ) | (6,756 | ) | (1,337 | ) | ||||||||||
Net (loss) income from continuing operations | (119,014 | ) | 2,706 | 23,873 | 23,073 | 22,862 | ||||||||||||||
Discontinued operations: | ||||||||||||||||||||
Income from discontinued operations, net of tax (2) | — | — | — | — | 286 | |||||||||||||||
Gain on sale of discontinued operations, net of tax | — | — | — | — | 2,155 | |||||||||||||||
Net income from discontinued operations | — | — | — | — | 2,441 | |||||||||||||||
Net (loss) income before allocation to noncontrolling interest | (119,014 | ) | 2,706 | 23,873 | 23,073 | 25,303 | ||||||||||||||
Net (loss) income and accretion to redemption value attributable to noncontrolling interest | — | (6,253 | ) | 119 | 108 | — | ||||||||||||||
Net (loss) income attributable to common stockholders | $ | (119,014 | ) | $ | (3,547 | ) | $ | 23,992 | $ | 23,181 | $ | 25,303 | ||||||||
Earnings per share – basic: | ||||||||||||||||||||
Net (loss) income from continuing operations attributable to common stockholders | $ | (2.84 | ) | $ | (0.10 | ) | $ | 0.67 | $ | 0.67 | $ | 0.70 | ||||||||
Net income from discontinued operations attributable to common stockholders | $ | — | $ | — | $ | — | $ | — | $ | 0.07 | ||||||||||
Net (loss) income attributable to common stockholders per share – basic | $ | (2.84 | ) | $ | (0.10 | ) | $ | 0.67 | $ | 0.67 | $ | 0.77 | ||||||||
Earnings per share – diluted: | ||||||||||||||||||||
Net (loss) income from continuing operations attributable to common stockholders | $ | (2.84 | ) | $ | (0.10 | ) | $ | 0.65 | $ | 0.64 | $ | 0.66 | ||||||||
Net income from discontinued operations attributable to common stockholders | $ | — | $ | — | $ | — | $ | — | $ | 0.07 | ||||||||||
Net (loss) income attributable to common stockholders per share – diluted | $ | (2.84 | ) | $ | (0.10 | ) | $ | 0.65 | $ | 0.64 | $ | 0.73 | ||||||||
Weighted average number of shares outstanding: | ||||||||||||||||||||
Basic | 41,888 | 36,213 | 35,909 | 34,723 | 32,808 | |||||||||||||||
Diluted | 41,888 | 36,213 | 36,959 | 36,306 | 34,660 | |||||||||||||||
—————————————
29
(1) | During the calendar year ended December 31, 2015, we identified errors related to prior periods. The results provided in this table have been revised to reflect the adjustments required as a result of our correction of such errors. For additional information regarding these corrections, see Note 2, “Summary of significant accounting policies,” to our consolidated financial statements included in this report. |
(2) | Income from discontinued operations for all periods presented includes the operating results for OptiLink, a business that was sold in January 2012. |
Calendar Year | Transition Period | Year Ended March 31, | ||||||||||||||||||
2015 | 2014 (1) | 2014 (1) | 2013 (1) | 2012 (1) | ||||||||||||||||
(In thousands) | ||||||||||||||||||||
Stock-based compensation expense included in Statement of Operations: | ||||||||||||||||||||
Costs and expenses: | ||||||||||||||||||||
Cost of services | $ | 9,211 | $ | 5,977 | $ | 5,527 | $ | 3,975 | $ | 3,440 | ||||||||||
Member relations and marketing | 14,706 | 3,348 | 3,688 | 2,643 | 2,133 | |||||||||||||||
General and administrative | 5,176 | 8,640 | 9,002 | 7,295 | 6,413 | |||||||||||||||
Total costs and expenses | 29,093 | 17,965 | 18,217 | 13,913 | 11,986 | |||||||||||||||
Operating income | (29,093 | ) | (17,965 | ) | (18,217 | ) | (13,913 | ) | (11,986 | ) | ||||||||||
December 31, | March 31, | |||||||||||||||||||
2015 | 2014 (1) | 2014 (1) | 2013 (1) | 2012 (1) | ||||||||||||||||
(In thousands) | ||||||||||||||||||||
Balance Sheet Data: | ||||||||||||||||||||
Cash and cash equivalents | $ | 71,825 | $ | 72,936 | $ | 23,129 | $ | 57,829 | $ | 60,642 | ||||||||||
Marketable securities | — | 14,714 | 164,396 | 156,839 | 127,444 | |||||||||||||||
Working (deficit) capital | (25,454 | ) | 46,635 | (61,038 | ) | (26,720 | ) | (28,191 | ) | |||||||||||
Total assets | 1,979,866 | 1,125,643 | 1,042,064 | 898,849 | 706,838 | |||||||||||||||
Deferred revenue | 755,424 | 672,743 | 589,077 | 503,576 | 391,920 | |||||||||||||||
Total stockholders’ equity | 449,091 | 317,810 | 336,665 | 283,185 | 217,894 | |||||||||||||||
—————————————
(1) | During the calendar year ended December 31, 2015, we identified errors related to prior periods. The results provided in this table have been revised to reflect the adjustments required as a result of our correction of such errors. For additional information regarding these corrections, see Note 2, “Summary of significant accounting policies,” to our consolidated financial statements included in this report. |
30
December 31, | March 31, | |||||||||||||||||||
(unaudited) | 2015 | 2014 | 2014 | 2013 | 2012 | |||||||||||||||
Other Operating Data: | ||||||||||||||||||||
Contract value (in thousands) (1) | $ | 762,595 | $ | 601,842 | $ | 541,903 | $ | 466,329 | $ | 398,313 | ||||||||||
—————————————
(1) | Represents the aggregate annualized revenue attributable to all agreements in effect at a particular date, without regard to the initial term or remaining duration of any such agreement. |
During the calendar year ended December 31, 2015, we identified errors related to prior periods. The impact of the errors in the prior periods was not material to us in any of those periods. However, an adjustment to correct the aggregate amount of the prior period errors would have been material to our current year financial statements. We have applied the guidance for accounting changes and error correction and have corrected these errors for all prior periods presented by revising the consolidated financial statements and other financial information included herein. The following table shows, for the fiscal year ended March 31, 2013, financial information as originally reported, adjustments made as a result of our correction of the foregoing errors, and the as adjusted financial information.
31
As of March 31, 2014 | ||||||||
As reported | Adjustments | As adjusted | ||||||
Balance Sheet Data: | ||||||||
Working deficit | (59,912 | ) | (1,126 | ) | (61,038 | ) | ||
Total assets | 1,041,335 | 729 | 1,042,064 | |||||
Deferred revenue | 587,359 | 1,718 | 589,077 | |||||
Total Stockholders' equity | 337,059 | (394 | ) | 336,665 | ||||
Fiscal Year Ended March 31, 2013 | ||||||||
As reported | Adjustments | As adjusted | ||||||
Income statement: | ||||||||
Revenue | 450,837 | (551 | ) | 450,286 | ||||
Depreciation and amortization | 20,308 | (200 | ) | 20,108 | ||||
Operating income | 45,475 | (351 | ) | 45,124 | ||||
Income before provision for income taxes and equity in loss of unconsolidated entities | 48,079 | (351 | ) | 47,728 | ||||
Provision for income taxes | (18,023 | ) | 124 | (17,899 | ) | |||
Net income before allocation to noncontrolling interest | 23,300 | (227 | ) | 23,073 | ||||
Net loss attributable to common stockholders | 23,408 | (227 | ) | 23,181 | ||||
Earnings per share: | ||||||||
Net loss attributable to common stockholders per share — basic | 0.67 | — | 0.67 | |||||
Net loss attributable to common stockholders per share — diluted | 0.64 | — | 0.64 | |||||
Balance Sheet Data: | ||||||||
Working deficit | (26,761 | ) | 41 | (26,720 | ) | |||
Total assets | 897,933 | 916 | 898,849 | |||||
Deferred revenue | 503,025 | 551 | 503,576 | |||||
Total stockholders’ equity | 282,820 | 365 | 283,185 | |||||
As of March 31, 2012 | ||||||||
As reported | Adjustments | As adjusted | ||||||
Balance Sheet Data: | ||||||||
Working deficit | (28,783 | ) | 592 | (28,191 | ) | |||
Total assets | 706,307 | 531 | 706,838 | |||||
Total Stockholders' equity | 217,302 | 592 | 217,894 | |||||
32
Item 7. Management’s Discussion and Analysis of Financial Condition and Results of Operations.
Overview
The following management’s discussion and analysis should be read in conjunction with our audited consolidated financial statements included elsewhere in this report.
In November 2014, we elected to change our fiscal year-end from March 31 to December 31. As a result, our prior fiscal period is a nine-month transition period that began on April 1, 2014 and ended on December 31, 2014, which we refer to as the “transition period.” We believe that a reader’s understanding of our results of operations will be enhanced by review of a comparison between the audited results for the calendar year ended December 31, 2015, referred to as “calendar year 2015,” and the unaudited results for the calendar year ended December 31, 2014, referred to as "calendar year 2014," and by a comparison between the audited results for the transition period to the unaudited results for the nine-month period ended December 31, 2013, referred to as the "comparable nine-month period." Accordingly we present our discussion and analysis under “Results of Operations” below based on comparisons of the results for such periods. The financial and operational trends highlighted in the comparisons presented below are consistent with those that would result from a comparison of calendar year 2015 to the transition period and from a comparison of the transition period to the fiscal year ended March 31, 2014, referred to as "fiscal 2014."
Acquisition of Royall
On January 9, 2015, after the end of our transition period, we completed our acquisition of Royall, a leading provider of strategic, data-driven student engagement and enrollment management, financial aid optimization, and alumni fundraising solutions to the education industry. For additional information about Royall and the terms of the acquisition, see Note 3, “Acquisitions,” to our consolidated financial statements included in this report.
Overview of Our Operations
We are a leading provider of insight-driven performance improvement software and solutions to the rapidly changing health care and education industries. Through our subscription-based membership programs, we leverage our intellectual capital to help members solve their most critical business problems. As of the date of this report, we served approximately 5,200 members, including hospitals, health systems and other health care organizations, and colleges and universities.
Our membership business model allows us to create value for our members by providing proven solutions to common and complex problems as well as high-quality content and innovative software on a broad set of relevant issues. Our growth has been driven by strong renewal rates, expansion of our relationships with existing members, new program launches, acquisition activity, the addition of new members, and annual price increases. Our member institution renewal rate has equaled or exceeded 90% in each of the years in the three-year period ended March 31, 2015. We believe high renewal rates reflect of our members’ recognition of the value they derive from participating in our programs.
Our revenue grew 34.4% in calendar year 2015 over calendar year 2014 and 13.7% in the transition period over the comparable nine-month period. Our contract value increased 26.7% to $762.6 million as of December 31, 2015 from December 31, 2014 and 15.2% to $601.8 million as of December 31, 2014 from December 31, 2013. We define contract value as the aggregate annualized revenue attributable to all agreements in effect at a particular date, without regard to the initial term or remaining duration of any such agreement. In each of our programs, we generally invoice and collect fees in advance of accrual revenue recognition.
We expect year-over-year revenue growth in calendar year 2016 due to continued cross-selling initiatives, new program adoption, and price increases within our existing member base, as well as the continued addition of new members. We expect that our year-over-year rate of revenue growth in calendar year 2016 will be lower than in recent years due to the absence of acquisition activity in calendar year 2015 after our acquisition of Royall, slower sales in the quarter ended December 31, 2015, and anticipated lower sales growth for calendar year 2016 compared to calendar year 2015. We expect adjusted EBITDA growth in excess of revenue growth and adjusted EBITDA margin expansion in calendar year 2016 due to scale and efficiency from revenue growth relative to a fixed cost base for existing programs, lower revenue growth from consulting, and such absence of additional acquisition activity in calendar year 2015.
Our operating costs and expenses consist of cost of services, member relations and marketing expense, general and administrative expenses, depreciation and amortization expense, impairment of capitalized software, and goodwill impairment.
• | Cost of services includes the costs associated with the production and delivery of our products and services, consisting of compensation for research, creative, data and analysis personnel, consultants, software developers, and in-house faculty; costs of the organization and delivery of membership meetings, teleconferences, and other events; production of published materials; technology license fees; costs of developing and supporting our cloud- |
33
based content and performance technology software; and fair value adjustments to acquisition-related earn-out liabilities.
Member relations and marketing expense includes the costs of acquiring new members and the costs of account management, and includes compensation (including sales incentives), travel and entertainment expenses, and costs for training of personnel, sales and marketing materials, and associated support services.
• | General and administrative expense includes the costs of human resources and recruiting; finance and accounting; legal support; management information systems; real estate and facilities management; corporate development; new program development; and other administrative functions. |
• | Depreciation and amortization expense includes the cost of depreciation of our property and equipment; amortization of costs associated with the development of software and tools that are offered as part of certain of our membership programs; and amortization of acquired intangibles. |
• | Impairment of capitalized software includes the impairment charge taken to write down acquired technology and internally developed capitalized software balances to their fair value. |
• | Goodwill impairment includes the impairment charge taken to write down goodwill to its fair value. |
Our operating costs for each period include stock-based compensation expenses and expenses representing additional payroll taxes for compensation expense as a result of the taxable income employees recognize upon their exercise of common stock options and the vesting of restricted stock units issued under our stock incentive plans.
Acquisitions that we have completed since December 31, 2012 affect the comparability of our results of operations for calendar year 2015 and the transition period to our results of operations for the prior year comparable periods.
Non-GAAP Financial Presentation
This management’s discussion and analysis presents supplemental measures of our performance which are derived from our consolidated financial information but which are not presented in our consolidated financial statements prepared in accordance with accounting principles generally accepted in the United States of America, or “GAAP.” These financial measures, which are considered “non-GAAP financial measures” under SEC rules, are referred to as adjusted revenue, adjusted EBITDA, adjusted net income, non-GAAP earnings per diluted share, adjusted tax rate, and adjusted weighted average common shares outstanding - diluted. See “Non-GAAP Financial Measures” below for information about our use of these non-GAAP financial measures, including our reasons for including the measures, material limitations with respect to the usefulness of such measures, and reconciliations of each non-GAAP financial measure to the most directly comparable GAAP financial measure.
34
Results of Operations
The following table shows statements of operations data expressed as a percentage of revenue for the periods indicated:
Calendar Year Ended December 31, | Nine Months Ended December 31, | Fiscal Year Ended March 31, | |||||||
2015 | 2014 | 2014 | 2013 | 2014 | |||||
(Unaudited) | (Unaudited) | ||||||||
Revenue | 100.0% | 100.0% | 100.0% | 100.0% | 100.0% | ||||
Costs and expenses: | |||||||||
Cost of services, excluding depreciation and amortization | 51.1% | 52.0% | 53.2% | 53.8% | 52.4% | ||||
Member relations and marketing | 15.7% | 18.8% | 18.7% | 18.3% | 18.5% | ||||
General and administrative | 16.7% | 16.5% | 17.4% | 14.5% | 14.3% | ||||
Depreciation and amortization | 9.5% | 6.8% | 7.0% | 5.8% | 6.0% | ||||
Impairment of capitalized software | 1.1% | 0.4% | 0.5% | —% | —% | ||||
Goodwill impairment | 12.9% | —% | —% | —% | —% | ||||
Total costs and expenses | 107.0% | 94.5% | 96.8% | 92.4% | 91.2% | ||||
Operating income | (7.1)% | 5.5% | 3.2% | 7.5% | 8.8% | ||||
Interest expense | (2.7)% | —% | —% | —% | —% | ||||
Other expense income, net | (0.8)% | (0.1)% | (0.3)% | 0.5% | 0.5% | ||||
Loss on financing activities | (2.3)% | —% | —% | —% | —% | ||||
Total other income, net | (5.9)% | (0.1)% | (0.3)% | 0.5% | 0.5% | ||||
Income before provision for income taxes and equity in loss of unconsolidated entities | (12.9)% | 5.4% | 2.9% | 8.0% | 9.4% | ||||
Provision for income taxes | (2.0)% | (1.8)% | (0.8)% | (3.1)% | (3.6)% | ||||
Equity in loss of unconsolidated entities | (0.6)% | (1.6)% | (1.5)% | (0.9)% | (1.2)% | ||||
Net income before allocation to noncontrolling interest | (15.5)% | 1.9% | 0.6% | 4.1% | 4.6% | ||||
Net loss and accretion to redemption value attributable to noncontrolling interest | —% | (1.1)% | (1.4)% | —% | —% | ||||
Net (loss) income attributable to common stockholders | (15.5)% | 0.8% | (0.8)% | 4.1% | 4.6% | ||||
35
Calendar Year 2015 Compared to Calendar Year 2014 and Transition Period Compared to the Comparable Nine-Month Period
Net (loss) income attributable to common stockholders. Net loss attributable to common stockholders was $119.0 million in calendar year 2015 compared to net income attributable to common stockholders of $4.8 million in calendar year 2014. The principal factors affecting calendar 2015 results that contributed to the change included a $99.1 million goodwill impairment, $21.1 million in interest expense related to new indebtedness, a $17.4 million loss on financing activities, a discrete tax item of $10.8 million related to a write-off of accumulated Washington, D.C. tax credits as a result of changes in District of Columbia tax laws effective January 1, 2015, an $8.2 million impairment of capitalized software, $6.6 million in acquisition-related costs, a $3.2 million impairment of a cost method investment, and increases in operating expenses, principally related to our acquisition of Royall. The effects of these items were partially offset by a $196.5 million increase in revenue over the revenue generated in calendar year 2014 and a non-cash accretion of $6.3 million associated with the change in the redemption value of our redeemable noncontrolling interest in a private entity in calendar year 2014.
Net loss attributable to common stockholders for the transition period was $3.5 million compared to net income attributable to common stockholders of $15.7 million for the comparable nine-month period. The change was primarily attributable to an accretion charge to the estimated redemption amount noncontrolling interest of $6.3 million, an increase of $4.0 million in acquisition-related costs, a $3.2 million increase in our equity in loss of unconsolidated entities, and a $2.1 million impairment of capitalized internally developed software assets. The effect of these factors was partially offset by a 13.7% increase in revenue from $381.6 million to $434.0 million.
Revenue. Total revenue increased 34.4% to $768.3 million in calendar year 2015 from $571.8 million in calendar year 2014, while contract value increased 26.7% to $762.6 million as of December 31, 2015 from $601.8 million as of December 31, 2014. The increases in revenue and contract value were attributable to our acquisition of Royall in combination with strong performance in our consulting and management offerings, including the addition of offerings through recently acquired Clinovations, LLC, or Clinovations, and continued growth in our software and research programs.
Revenue increased 13.7% to $434.0 million for the transition period from $381.6 million for the comparable nine-month period. Our contract value increased 15.2% to $601.8 million as of December 31, 2014 from $522.5 million as of December 31, 2013. The increase in revenue for the transition period over the comparable nine-month period was primarily attributable to the introduction and expansion of new programs, our cross-selling of existing programs to existing members, a full nine months of revenue from the prior period acquisitions of Care Team Connect, Inc., or Care Team Connect, and Medical Referral Source, Inc., or MRS, an increase in large and bundled services contracts, and, to a lesser degree, price increases.
Cost of services. Cost of services increased to $392.7 million for calendar year 2015 from $297.4 million for calendar year 2014. The increase in cost of services was primarily due to an increase of $46.6 million relating to our acquisition of Royall and increases of $13.8 million relating to the continued growth and expansion of our Crimson programs, as well as our recent acquisitions of Clinovations and ThoughtWright, LLA d/b/a Grades First, or GradesFirst. Cost of services in the current period also reflected increased costs associated with the delivery of program content and tools to our expanded membership base, including increased staffing, licensing fees, and other costs. As a percentage of revenue, cost of services was 51.1% and 52.0% for calendar years 2015 and 2014, respectively. Cost of services included fair value adjustments to our acquisition-related earn-out liabilities, which resulted in decreases in such liabilities of $1.7 million and $4.7 million in calendar years 2015 and 2014, respectively.
In the transition period, cost of services increased 12.4% to $230.8 million from $205.3 million for the comparable nine-month period. As a percentage of revenue, cost of services was 53.2% for the transition period and 53.8% for the comparable nine-month period. The increase of $25.4 million in cost of services was primarily attributable to increases of $8.3 million in expenses related to our new and growing physician-related software programs, as well as to costs of $14.7 million incurred in connection with programs launched from companies acquired during fiscal 2014 and fiscal 2013. Cost of services included fair value adjustments to our acquisition-related earn-out liabilities, which resulted in decreases in such liabilities of $0.6 million and $0.3 million for the transition period and the comparable nine-month period, respectively.
Member relations and marketing expense. Member relations and marketing expense increased 12.4% to $121.0 million in calendar year 2015 from $107.7 million in calendar year 2014. As a percentage of revenue, member relations and marketing expense in calendar years 2015 and 2014 was 15.7% and 18.8%, respectively. The increase in member relations and marketing expense was primarily attributable to an increase in sales staff and other associated costs, as well as to an increase in member relations personnel and related costs required to serve our expanding membership base. The decrease in member relations and marketing expense as a percentage of revenue resulted from our acquisition of Royall as the Royall business historically spends less on marketing relative to revenue, as well as increased efficiency of our sales teams.
For the transition period, member relations and marketing expense increased 16.3% to $81.2 million from $69.9 million in the comparable nine-month period. As a percentage of revenue, member relations and marketing expense for the transition period increased to 18.7% from 18.3% for the comparable nine-month period. The total dollar increases in member relations
36
and marketing expense were primarily attributable to an increase in sales staff and related travel and other associated costs, as well as to an increase in member relations personnel and related costs required to serve our expanding membership base.
General and administrative expense. General and administrative expense increased to $128.7 million in calendar year 2015 from $94.2 million in calendar year 2014. As a percentage of revenue, general and administrative expense increased to 16.7% in calendar year 2015 from 16.5% in calendar year 2014. The increase of $34.4 million in general and administrative expense was primarily attributable to increases of $4.6 million in costs related to investments in our human resources, finance, and information technology infrastructure to support our growing employee base and number of office locations, as well as an increase of $5.0 million in our new product and corporate development groups. For calendar year 2015, we also recognized a total of $6.6 million in acquisition costs related to our acquisition of Royall, $4.0 million relating to an all-employee event held during 2015, and $3.2 million in costs relating to signing our new headquarters lease.
For the transition period, general and administrative expenses increased 36.2% to $75.5 million from $55.4 million in the comparable nine-month period. As a percentage of revenue, general and administrative expense for the transition period increased to 17.4% from 14.5% for the comparable nine-month period. The increase of $20.1 million in general and administrative expense was primarily attributable to an increase of $7.4 million in costs related to investment in our human resources, finance, and information technology infrastructure to support our growing employee base and number of office locations, an increase of $4.0 million in acquisition-related costs, and an increase of $1.8 million in share-based compensation expense. As of December 31, 2015, we had approximately 3,500 employees compared to approximately 3,100 employees as of December 31, 2014.
Depreciation and amortization. Depreciation expense increased to $73.1 million, or 9.5% of revenue in calendar year 2015, from $39.1 million, or 6.8% of revenue in calendar year 2014. The increase in depreciation and amortization expense in the current period was primarily attributable to increased amortization expense of $23.4 million from acquired intangibles relating to our acquisitions of Royall, GradesFirst, and Clinovations, developed capitalized internal use software, and depreciation of improvements made to new expansion floors in our Washington, D.C. headquarters.
For the transition period, depreciation and amortization expense increased to $30.3 million, or 7.0% of revenue, from $22.3 million, or 5.8% of revenue, for the comparable nine-month period. The increase in such expense was primarily due to increased amortization expense from developed capitalized internal-use software, amortization of intangible assets related to our acquisition of MRS, Care Team Connect, Healthpost Inc., or HealthPost, Clinovations, and GradesFirst, and depreciation of our newly renovated Austin, San Francisco, and Nashville offices and an expansion floor of our Washington, D.C. headquarters.
Impairment of capitalized software. During calendar year 2015, we concluded that certain internally developed and acquired technology assets would no longer be utilized in our services, and as a result, we recognized a $8.2 million impairment charge on the remaining unamortized costs.
During the transition period, we concluded that certain internally developed capitalized software for sale assets were not fully recoverable, and as a result recognized a $2.1 million impairment on the remaining unamortized costs.
Goodwill impairment. We performed our annual goodwill impairment assessment on October 1, 2015 and, in connection with the preparation of our audited financial statements for calendar year 2015, concluded that the Royall reporting unit was impaired by $99.1 million. See Note 8, “Goodwill and intangibles,” to our consolidated financial statements included in this report for information about this impairment change. There was no comparable activity in the prior-year periods.
Interest expense. Interest expense of $21.1 million was incurred during calendar year 2015 on indebtedness incurred to fund the Royall acquisition on January 9, 2015 and amended on February 6, 2015 and October 23, 2015 initially to retire a portion of the indebtedness and subsequently to refinance such acquisition indebtedness. There was no comparable activity in the prior-year periods.
Other (expense) income, net. Other income, net consists of gains and losses on investments in preferred stock and common stock warrants, interest income, and foreign currency gains and losses. Other expense, net for calendar year 2015 was $6.5 million and consisted of a loss of $3.6 million on an investment in common stock warrants, and a foreign exchange rate loss of $2.9 million. Other expense, net for calendar year 2014 was $0.6 million and consisted of interest income of $1.8 million, offset by a foreign exchange rate loss of $1.7 million, revolving credit facility fees of $0.6 million, a loss of $0.2 million on an investment in common stock warrants, and a realized gain of $0.1 million on the sale of marketable securities. As of December 31, 2015, we no longer owned marketable securities, except for our ownership interest in Evolent Health, Inc., which is accounted for under the equity method.
37
The foreign currency gains and losses reflected the effect of fluctuating currency rates on our receivable balances denominated in foreign currencies.
For the transition period, other expense, net was $1.3 million and consisted of interest income of $1.1 million, offset by a foreign exchange rate loss of $1.7 million, revolving credit facility fees of $0.5 million, a loss of $0.2 million on an investment in common stock warrants, and a realized loss of $0.1 million on the sale of bonds. For the comparable nine-month period, other income, net consisted of interest income of $2.6 million, of which $0.4 million related to interest earned on our loan to Evolent Health, Inc., or Evolent, which was converted to a preferred stock interest in Evolent Health LLC, or Evolent LLC, in September 2013, offset by revolving credit facility fees of $0.4 million and a foreign exchange rate loss of $0.2 million.
Loss on financing activities. A loss on financing activities of $17.4 million was recognized in connection with the refinancing of acquisition indebtedness during calendar year 2015. There was no comparable activity in the prior year.
Provision for income taxes. Our provision for income taxes was $15.2 million and $10.5 million for calendar years 2015 and 2014, respectively. Our effective tax rate for calendar year 2015 was (15.3%) compared to 34.0% for calendar year 2014. The tax expense for calendar year 2015 included a $10.8 million impact related to a write-off of accumulated Washington, D.C. income tax credits as a result of changes in District of Columbia tax laws effective January 1, 2015.
Our provision for income taxes for the transition period was $3.5 million compared to $11.8 million for the comparable nine-month period. Our effective tax rate of 27.6% for the transition period decreased from our effective tax rate of 38.5% for the comparable nine-month period. The decrease in the effective tax rate was primarily attributable to a discrete tax benefit relating to federal research and development tax credits claimed during the transition period relating to tax years 2012, 2013, and 2014.
Equity in loss of unconsolidated entities. Our proportionate share of losses in our investments in the Evolent entities, net of tax during calendar years 2015 and 2014 was $4.4 million and $9.3 million, respectively. Offsetting the loss for calendar year 2015 was a $6.7 million tax benefit from the release of a valuation allowance, as we determined that it is now more-likely-than not that we will be able to realize deferred tax assets associated with our investment in Evolent LLC. Evolent was established in August 2011 and continues to operate as an early-stage business. As a result, we expect the Evolent entities to continue to incur losses in the future.
Our share of the losses of Evolent and Evolent LLC for the transition period increased to $6.5 million from $3.3 million for the comparable nine-month period.
Net loss and accretion to redemption value of noncontrolling interest. In July 2012, we entered into an agreement with an entity created for the sole purpose of providing consulting services for us on an exclusive basis. We determined that this entity met the definition of a variable interest entity over which we have significant influence and, as a result, have consolidated the results of this entity into our consolidated financial statements. During calendar year 2014, we determined that the conditions to satisfy the put option discussed further in Note 11, "Noncontrolling interest," of our consolidated financial statements included elsewhere in this report were probable of achievement and at such time recorded an accretion charge to the estimated redemption amount of our redeemable noncontrolling interest of $6.3 million. In December 2014, the put option was exercised by the previous owners of the entity.
Stock-based compensation expense. We recognized the following stock-based compensation expense in the consolidated statements of operations line items for stock options and restricted stock units issued under our stock incentive plans for calendar years 2015 and 2014, the transition period, and the comparable nine-month period (in thousands except per share amounts):
Calendar Year Ended | Nine Months Ended | ||||||||||||
December 31, | December 31, | ||||||||||||
2015 | 2014 | 2014 | 2013 | ||||||||||
Stock-based compensation expense included in: | |||||||||||||
Costs and expenses: | |||||||||||||
Cost of services | $ | 9,211 | $ | 7,358 | 5,977 | 4,145 | |||||||
Member relations and marketing | 14,706 | 4,190 | 3,348 | 2,845 | |||||||||
General and administrative | 5,176 | 10,839 | 8,640 | 6,804 | |||||||||
Depreciation and amortization | — | — | — | — | |||||||||
Total costs and expenses | 29,093 | 22,387 | 17,965 | 13,794 | |||||||||
Operating income | (29,093 | ) | (22,387 | ) | (17,965 | ) | (13,794 | ) | |||||
There are no stock-based compensation costs capitalized as part of the cost of an asset.
38
Stock-based compensation expense by award type for calendar years 2015 and 2014, transition period and the comparable nine-month period was as follows (in thousands):
Calendar Year Ended | Nine Months Ended | ||||||||||||||
December 31, | December 31, | ||||||||||||||
2015 | 2014 | 2014 | 2013 | ||||||||||||
Stock-based compensation expense by award type: | |||||||||||||||
Stock options | $ | 10,908 | $ | 6,585 | 5,431 | $ | 3,692 | ||||||||
Restricted stock units | 18,185 | 15,802 | 12,534 | 10,102 | |||||||||||
Total stock-based compensation | $ | 29,093 | $ | 22,387 | $ | 17,965 | $ | 13,794 | |||||||
As of December 31, 2015, $59.2 million of total unrecognized compensation cost related to stock-based awards is expected to be recognized over a weighted average period of 2.7 years.
Liquidity and Capital Resources
Cash flows generated from operating activities represent our primary source of liquidity. We believe that existing cash and cash equivalents, and operating cash flows will be sufficient to support our expected operating and capital expenditures, as well as our debt service obligations, during at least the next 12 months. We had cash and cash equivalents of $71.8 million as of December 31, 2015 and cash, cash equivalents, and marketable securities balances of $87.7 million as of December 31, 2014. We expended $53.0 million and $36.0 million in cash to purchase shares of our common stock through our share repurchase program during calendar year 2015 and the transition period, respectively. We expended $746.7 million and $70.2 million in cash for acquisitions during calendar year 2015 and the transition period, respectively.
Cash Flows
Cash flows from operating activities. The combination of revenue growth, profitable operations, and payment for memberships in advance of accrual revenue typically results in operating activities that generate cash flows in excess of net income attributable to common stockholders on an annual basis. Net cash flows provided by operating activities were $161.9 million for calendar year 2015, consisting primarily of net loss offset by non-cash depreciation and amortization expense, stock-based compensation expense, loss on financing activities, and non-cash impairment charges of $110.9 million. Furthermore, the changes in membership fees receivable and deferred revenue which increased operating cash flows reflect the fact that we invoice and collect in advance of services performed.
Net cash flows provided by operating activities were $64.6 million for the transition period, consisting primarily of net income plus non-cash depreciation and amortization expense, stock-based compensation expense, and deferred revenue, offset by changes in membership fees receivable.
Net cash flows provided by operating activities were $77.3 million in fiscal 2014, consisting primarily of net income plus non-cash depreciation and amortization expense, stock-based compensation expense, and deferred revenue, offset by changes in membership fees receivable.
Cash flows from investing activities. Our cash management, investment and acquisition strategy, and capital expenditure programs affect investing cash flows. Cash used in investing activities for calendar year 2015 was $791.7 million, consisting primarily of expenditures of $746.7 million for our acquisitions, capital expenditures of $56.7 million, and a contribution of $3.0 million to Evolent LLC, offset by redemptions of $14.7 million of marketable securities.
During the transition period, investing activities provided $29.9 million in cash, primarily consisting of net redemptions of $151.4 million of marketable securities, partially offset by capital expenditures of $51.4 million and expenditures of $70.2 million for our acquisitions of Healthpost, GradesFirst, and Clinovations.
During fiscal 2014, investing activities used $126.2 million in cash, primarily consisting of capital expenditures of $49.7 million, expenditures of $46.0 million for our acquisitions of Care Team Connect and MRS, a contribution of $15.6 million to Evolent LLC, and net purchases of $14.8 million of marketable securities.
Cash flows from financing activities. In calendar year 2015, we had net cash flows used in financing activities of $628.6 million consisting of proceeds from the issuance of debt of $1,840.7 million, proceeds from the issuance of common stock of $154.0 million, and excess tax benefits resulting from the exercise of employee options of $4.9 million. The effect of those items was partially offset by the pay-down of debt of $1,307.2 million, the repurchase of 1,069,357 shares of our common
39
stock for approximately $53.0 million, and our use of $6.1 million to satisfy minimum employee tax withholding for vested restricted stock units, $3.3 million for debt issuance costs, and $1.5 million in acquisition-related earn-out payments.
In the transition period, we had net cash flows used in financing activities of $44.6 million, consisting of our repurchase of 731,559 shares of our common stock for approximately $36.0 million, a $6.1 million payment for the acquisition of a noncontrolling interest, and our use of $7.6 million to satisfy minimum employee tax withholding for vested restricted stock units. The effect of those items was partially offset by our receipt of $4.3 million from the exercise of stock options, $0.4 million in excess tax benefits resulting from the exercise of employee options, and $0.4 million from the issuance of common stock under our employee stock purchase plan.
In fiscal 2014, we had net cash flows provided by financing activities of $14.2 million, consisting of $22.0 million from the exercise of stock options, $19.5 million in excess tax benefits resulting from the exercise of employee options, and $0.5 million from the issuance of common stock under our employee stock purchase plan. The effect of those items was partially offset by our repurchase of 376,532 shares of our common stock for approximately $21.9 million and our use of $5.9 million to satisfy minimum employee tax withholding for vested restricted stock units.
Senior secured credit facilities
On February 6, 2015, we obtained $675 million of senior secured credit facilities, referred to as the “Credit Facilities,” under a credit agreement with a syndicate of lenders. The Credit Facilities were amended on October 30, 2015.
The amended Credit Facilities consist of (a) a five-year senior secured term loan facility in the principal amount of $475 million, or “Term Facility,” and (b) a five-year senior secured revolving credit facility, or “Revolving Facility,” under which up to $200 million principal amount of borrowings and other credit extensions may be outstanding at any time.
The Advisory Board Company is the borrower under the Credit Facilities. The obligations of The Advisory Board Company under the Credit Facilities are guaranteed by its domestic subsidiaries, subject to certain exceptions, and the obligations of The Advisory Board Company and the subsidiary guarantors under the Credit Facilities are secured by a first-priority security interest in substantially all of the assets of The Advisory Board Company and such domestic subsidiaries.
Term Facility
As of December 31, 2015, $453.4 million was outstanding under the Term Facility. We are able to elect, subject to pro forma compliance with the financial covenants and other customary conditions, to solicit the lenders under the Credit Facilities or other prospective lenders to add one or more incremental term loan facilities to the Credit Facilities or to increase commitments under the Revolving Facility in an aggregate amount of no more than (a) $150 million plus (b) the amount of voluntary prepayments of borrowings under the Credit Facilities not funded with the incurrence of other long-term indebtedness. Any such voluntary prepayments of loans under the Revolving Facility must be accompanied by permanent reductions of commitments under the Revolving Facility.
To the extent not previously paid, the Term Facility will mature, and all term loans outstanding under the facility will become due and payable, on February 6, 2020. The term loans are repayable in quarterly installments, which commenced with the quarter ended June 30, 2015, equal to a specified percentage of the aggregate principal amount drawn on the facility closing date, as follows: (a) 1.25% for each of the first eight full fiscal quarters following the facility closing date; (b) 2.5% for each of the ninth through twelfth full fiscal quarters following the facility closing date; and (c) 3.75% for each of the thirteenth through nineteenth full fiscal quarters following the facility closing date. We also are required to make principal prepayments under the Term Facility from the net proceeds of specified types of asset sales, casualty events, and incurrences of debt. We may voluntarily prepay outstanding term loans without premium or penalty.
Amounts drawn under the Term Facility generally bear interest, payable monthly, at an annual rate calculated, at our option, on the basis of either (a) an alternate base rate plus an initial margin of 1.25% or (b) the applicable London interbank offered rate, or “LIBOR,” plus an initial margin of 2.25%, subject in each case to margin reductions based on our total leverage ratio from time to time. The interest rate on the alternate base rate loans will fluctuate as the base rate fluctuates, while the interest rate on the LIBOR loans will be adjusted at the end of each applicable interest period. Interest on alternate base rate loans will be payable monthly in arrears, while interest on LIBOR loans will be payable at the end of each applicable interest period, except that, in the case of any interest period longer than three months, interest will be payable at the end of each three-month period.
Revolving Facility
As of December 31, 2015, $100 million was borrowed under the Revolving Facility of the $200 million available to be borrowed. The Revolving Facility will mature, and all revolving loans outstanding under the facility will become due and payable, on February 6, 2020. The facility loans may be borrowed, repaid and reborrowed from time to time during the term of
40
the facility. The Company may use the proceeds of borrowings under the Revolving Facility, when drawn, to finance working capital needs and for general corporate purposes, including permitted acquisitions.
Amounts drawn under the Revolving Facility generally bear interest, payable quarterly, at an annual rate calculated, at our option, on the basis of either (a) an alternate base rate plus an initial margin of 1.25% or (b) the applicable London interbank offered rate plus an initial margin of 2.25%, subject in each case to margin reductions based on the Company’s total leverage ratio from time to time.
We are obligated to pay a commitment fee at an initial annual rate of 0.30%, subject to reduction based on our total leverage ratio from time to time, accruing on the average daily amount of available commitments under the Revolving Facility.
The Credit Facilities contain customary negative covenants restricting certain actions that may be taken by the Company and its subsidiaries. Subject to specified exceptions, these covenants limit the ability of the Company and its subsidiaries to incur indebtedness, create liens on their assets, pay cash dividends, repurchase our common stock and make other restricted payments, make investments in or loans to other parties, sell assets, engage in mergers and acquisitions, enter into transactions with affiliates, enter into sale and leaseback transactions, and change their businesses. The Credit Facilities also contain customary affirmative covenants, including, among others, covenants requiring compliance with laws, maintenance of corporate existence, licenses, properties, and insurance, payment of taxes and performance of other material obligations, and delivery of financial and other information to the lenders. The Company is required to maintain compliance with financial covenants consisting of (a) a maximum total leverage ratio and (b) a minimum interest coverage ratio, each measured as of the last day of our fiscal quarter, for a period consisting of our most recently completed four fiscal quarters.
We were in compliance with these financial covenants as of December 31, 2015.
Contractual Obligations
The following summarizes our contractual obligations as of December 31, 2015. These obligations relate to our debt, leases for our headquarters and other offices, and a non-cancelable agreement for the purchase of data. These are more fully described in Note 16, “Commitments and contingencies,” to our consolidated financial statements included elsewhere in this report.
Payment due by period (in thousands) | |||||||||||||||||||
Total | Less than 1 year | 1-3 years | 3-5 years | More than 5 years | |||||||||||||||
Long-term debt | $ | 553,438 | $ | 28,750 | $ | 129,375 | $ | 395,313 | $ | — | |||||||||
Build-to-suit lease obligation | $ | 446,134 | $ | — | $ | — | $ | 41,534 | $ | 404,600 | |||||||||
Non-cancelable operating leases | $ | 80,397 | $ | 18,775 | $ | 35,085 | $ | 17,135 | $ | 9,402 | |||||||||
Purchase obligation | $ | 6,000 | $ | 3,000 | $ | 3,000 | $ | — | $ | — | |||||||||
In addition to the contractual obligations above, as of December 31, 2015 we have payments of up to $7.3 million contingently payable through December 31, 2017 related to business acquisitions. For additional detail, see Note 4, “Fair value measurements,” to our consolidated financial statements included elsewhere in this report.
Share Repurchase Program
In January 2004, our board of directors authorized the repurchase by us from time to time of up to $50 million of our common stock. This authorization subsequently was increased in cumulative amount to $100 million in October 2004, to $150 million in February 2006, to $200 million in January 2007, to $250 million in July 2007, to $350 million in April 2008, to $450 million in May 2013, and to the current level of $550 million in November 2015. We intend to fund any future share repurchases with cash on hand and with cash generated from operations. No minimum number of shares for repurchase has been fixed, and the share repurchase authorization has no expiration date. All repurchases have been made in the open market pursuant to this publicly announced repurchase program. As of December 31, 2015, the remaining authorized repurchase amount was $98.2 million. Our ability to repurchase common stock is restricted by the covenants in our senior secured credit facilities.
41
Exercise of Stock Options and Purchases Under Our Employee Stock Purchase Plan
Options granted to participants under our stock-based incentive compensation plans that were exercised to acquire shares generated cash of approximately $4.7 million, $4.3 million, and $22.0 million for calendar year 2015, the transition period, and fiscal 2014, respectively, from payment of option exercise prices.
Cash flows of approximately $0.5 million, $0.4 million, and $0.5 million for calendar year 2015, the transition period, and the fiscal year 2014, respectively, were provided by discounted stock purchases by participants under our employee stock purchase plan.
Off-Balance Sheet Arrangements
As of December 31, 2015, we had no off-balance sheet arrangements that have or are reasonably likely to have a current or future material effect on our financial condition or results of operations.
Summary of Critical Accounting Policies
We have identified the following policies as critical to our business operations and the understanding of our results of operations. This listing is not a comprehensive identification of all of our accounting policies. In many cases, the accounting treatment of a particular transaction is specifically dictated by GAAP, with no need for management’s judgment in its application. There are also areas in which management’s judgment in selecting any available alternative would not produce a materially different result. Certain of our accounting policies are particularly important to the presentation of our financial condition and results of operations and may require the application of significant judgment by our management. In applying those policies, our management uses its judgment to determine the appropriate assumptions to be used in the determination of certain estimates. Those estimates are based on our historical experience, our observation of trends in the industry, information provided by our members, and information available from other outside sources, as appropriate. For a more detailed discussion on the application of these and other accounting policies, see Note 2, “Summary of significant accounting policies,” to our consolidated financial statements included elsewhere in this report. Our critical accounting policies are discussed below.
Revenue Recognition
Revenue is recognized when (1) there is persuasive evidence of an arrangement, (2) the fee is fixed or determinable, (3) services have been rendered and payment has been contractually earned, and (4) collectibility is reasonably assured. Fees are generally billable when a letter of agreement is signed by the member, and fees receivable during the subsequent twelve-month period and related deferred revenue are recorded upon the commencement of the membership or collection of fees, if earlier. In many of our higher priced membership program agreements with terms that are greater than one year, fees may be billed on an installment basis. In certain multi-year arrangements, the member has the ability to cancel the arrangement within a defined notice period without penalty.
Our membership programs generally include more than one deliverable. Deliverables are determined based upon the availability and delivery method of the services and may include: best practices research; executive education curricula; cloud-based content, databases, and calculators; performance or benchmarking reports; diagnostic tools; interactive advisory support; and performance technology software. Access to such deliverables is generally available on an unlimited basis over the membership period. When an agreement contains multiple deliverables, we review the deliverables to determine if they qualify as separate units of accounting. In order for deliverables in a multiple-deliverable arrangement to be treated as separate units of accounting, the deliverables must have standalone value upon delivery, and delivery or performance of undelivered items in an arrangement with a general right of return must be probable. If we determine that there are separate units of accounting, arrangement consideration at the inception of the membership period is allocated to all deliverables based on the relative selling price method in accordance with the selling price hierarchy. Because of the unique nature of our products, neither vendor specific objective evidence nor third-party evidence is available. Therefore, we utilize best estimate of selling price to allocate arrangement consideration in multiple element arrangements. Best estimate of selling price is an estimate and, as such, could change over time.
In general, the deliverables in membership programs do not qualify as separate units of accounting. These deliverables are consistently available throughout the membership period, and, as a result, the consideration is recognized ratably over the membership period. When a service offering includes a combination of unlimited and limited service offerings, revenue is recognized over the appropriate service period, either ratably, if the service is consistently available, or, if the service is not consistently available, upon the earlier of the delivery of the service or the completion of the membership period, provided that all other criteria for recognition have been met.
Certain membership programs incorporate hosted performance technology software. In many of these agreements, members are charged set-up fees in addition to subscription fees for access to the hosted cloud-based software and related
42
membership services. Both set-up fees and subscription fees are recognized ratably over the term of the membership agreement, which is generally three years, and is consistent with the pattern of the delivery of services under these arrangements. Upon launch of a new program that incorporates software, all program revenue is deferred until the program is generally available for release to our membership, and then recognized ratably over the remainder of the contract term of each agreement.
Certain arrangements include performance-based fees that are contingent upon the member realizing a benefit over a defined period. These performance-based fees are recognized at the end of the measurement period when the benefit is realized by the member. We have not recognized any revenue that is at risk due to future performance contingencies.
We also perform professional services sold under separate agreements that include consulting and management services. These agreements are either fixed fee or time-and-materials arrangements. For fixed fee arrangements, we recognize professional services revenues using the proportional performance method based on effort expended. We recognize professional services revenues for time-and-materials arrangements as services are rendered based on contractual rates.
For arrangements in which a customer purchases multiple membership programs or purchases a membership program together with consulting and management services, each program and professional services arrangement is generally considered a separate unit of accounting, and arrangement consideration is allocated based on our best estimate of selling price. We develop our best estimate of selling price by considering pricing practices, margin, competition, and geographies in which we offer our products and services.
Although we believe that our approach to estimates and judgments with respect to revenue recognition is reasonable, actual results could differ and we may be exposed to increases or decreases in revenue that could be material.
Allowance for Uncollectible Revenue
Our ability to collect outstanding receivables from our members has an effect on our operating performance and cash flows. We maintain an allowance for uncollectible revenue as a reduction of revenue based on our ongoing monitoring of members’ credit and the aging of receivables. To determine the allowance for uncollectible revenue, we examine our collections history, the age of accounts receivable in question, any specific member collection issues that have been identified, general market conditions, and current economic trends.
Basis of Presentation and Consolidation
We may enter into various agreements with unrelated third parties to provide, directly or indirectly, services to our members or prospective members. We must determine for each of these business arrangements, which could include an investment by us in the third party, whether to consolidate the third party or account for our investment under the equity or cost basis of accounting. We determine whether to consolidate certain entities based on our rights and obligations under the agreements, applying the applicable accounting guidance. For investment interests that we do not consolidate, we evaluate the guidance to determine the accounting framework to apply. The application of the rules in evaluating the accounting treatment for each agreement is complex and requires substantial management judgment. Therefore, we believe the decision to choose an appropriate accounting framework is a critical accounting estimate. We evaluate our accounting for investments on a regular basis, including when a significant change in the design of an entity occurs.
Property and Equipment
Property and equipment consists of leasehold improvements, furniture, fixtures, equipment, capitalized internal use software development costs, and acquired developed technology. Property and equipment is stated at cost, less accumulated depreciation and amortization. In certain membership programs, we provide performance technology software under a hosting arrangement where the software application resides on our or our service providers’ hardware. The members do not take delivery of the software and only receive access to the software during the term of their membership agreement.
Software development costs that are incurred in the preliminary project stage for internal use software are expensed as incurred. During the development stage, direct consulting costs and payroll and payroll-related costs for employees that are directly associated with each project are capitalized and amortized over the estimated useful life of the software once it is placed into operation. Capitalized software is amortized using the straight-line method over its estimated useful life, which is generally five years. Replacements and upgrades and enhancements to existing systems that result in added functionality are capitalized, while maintenance and repairs are charged to expense as incurred.
Acquired developed software represents the fair value of software acquired through a business combination that resides on our or our service providers’ hardware and is made available to members through the memberships. Amortization for acquired developed software is included in the depreciation and amortization line item of our consolidated statements of
43
operations. Acquired developed software is amortized over its weighted average estimated useful life of eight years based on the cash flow estimate used to determine the value of the intangible asset at its acquisition.
Furniture, fixtures, and equipment are depreciated using the straight-line method over the estimated useful lives of the assets, which range from three to seven years. Leasehold improvements are depreciated using the straight-line method over the shorter of the estimated useful lives of the assets or the lease term.
Construction Costs for a Build-to-Suit Lease
In December 2015, we entered into a build-to-suit lease agreement for a new corporate headquarters, which is currently being constructed in Washington, D.C. For accounting purposes only, we are the deemed owner of the building during the construction period. Accordingly, we estimate the construction-in-progress asset and the corresponding construction financing obligation on at least a quarterly basis. Estimates for the total cost of the construction and percentage of completion are based on project plans and progress reports. We anticipate that construction will be completed in mid-2019.
Business Combinations
Accounting for acquisitions requires our management to estimate the fair value of the assets and liabilities acquired, which involves a number of judgments, assumptions, and estimates that could materially affect the timing or amounts recognized in our financial statements. The items involving the most significant assumptions, estimates, and judgments include those requiring determination of the fair value of the following:
• | acquired technologies and other intangible assets, including valuation methodology, estimations of future cash flows, and discount rates, as well as the estimated useful life of assets; |
• | the acquired company’s trademark, as well as assumptions about the period of time the acquired trademark will continue to be used; |
• | deferred tax assets and liabilities, uncertain tax positions, and tax-related valuation allowances, which are initially estimated as of the acquisition date; |
• | property and equipment, pre-existing liabilities, deferred revenue, and contingent consideration, as each may be applicable; and |
• | goodwill as measured as the excess of consideration transferred over the net of the acquisition date fair values of the assets acquired and the liabilities assumed. |
We allocate goodwill and intangible assets to the reporting unit based on the reporting unit that is expected to benefit from the business combination. Our assumptions and estimates are based upon comparable market data and information obtained from our management and the management of the acquired companies. While we use our best estimates and assumptions to accurately value assets acquired and liabilities assumed at the acquisition date, our estimates are inherently uncertain and subject to refinement. As a result, during the measurement period, which may be up to one year following the acquisition date, we record adjustments to the assets acquired and liabilities assumed with the corresponding offset to goodwill.
Increases or decreases in the fair value of contingent consideration obligations resulting from changes in the estimates of earn-out results can materially impact the financial statements. As of December 31, 2015, we had a liability of $7.3 million for contingent consideration related to acquisitions.
Goodwill and Other Intangible Assets
The excess cost of an acquisition over the fair value of the net assets acquired is recorded as goodwill. The primary factors that generate goodwill are the value of synergies between us and our acquired entities and the acquired assembled workforce, neither of which qualifies as an identifiable intangible asset. Our goodwill and other intangible assets with indefinite lives are not amortized, but rather tested for impairment on an annual basis on October 1, or more frequently if events or changes in circumstances indicate potential impairment.
When testing goodwill for impairment, we have the option to first assess qualitative factors to determine whether the existence of events or circumstances leads to a determination that it is more likely than not that the estimated fair value of a reporting unit is less than its carrying amount. If we elect to perform a qualitative assessment and determine that an impairment is more likely than not, we are then required to perform the two-step quantitative impairment test, otherwise no further analysis is required. We also may elect not to perform the qualitative assessment and, instead, proceed directly to the two-step quantitative impairment test.
In the first step of the two-step quantitative impairment test, the fair value of a reporting unit is compared to its carrying value. If the carrying value of a reporting unit exceeds its fair value, the second step of the impairment test is performed for
44
purposes of measuring the impairment. In the second step, the fair value of the reporting unit is allocated to all of the assets and liabilities of the reporting unit to determine an implied goodwill value. If the carrying amount of the reporting unit’s goodwill exceeds the implied fair value of goodwill, an impairment loss is recognized in an amount equal to that excess.
We estimate the fair value of our reporting units using both an income and a market approach. The income approach is based on the present value of expected future cash flows, including terminal value, utilizing a market-based weighted average cost of capital determined separately for each reporting unit. The determination of fair value using the income approach involves the use of significant estimates and assumptions, including revenue growth rates, operating margins, capital expenditures, working capital requirements, tax rates, terminal growth rates, discount rates and benefits associated with a taxable transaction. The market approach is based on revenue and earnings multiple data of peer companies. See Note 8, “Goodwill and intangibles,” to our consolidated financial statements included in this report for further detail, including our recognition of a goodwill impairment charge of $99.1 million during calendar year 2015.
Other intangible assets consist of capitalized software for sale and acquired intangibles. We capitalize consulting costs and payroll and payroll-related costs for employees directly related to building a software product for sale once technological feasibility is established. We determine that technological feasibility is established by the completion of a detailed program design or, in its absence, completion of a working model. Once the software product is ready for general availability, we cease capitalizing costs and begins amortizing the intangible asset on a straight-line basis over its estimated useful life. The weighted average estimated useful life of capitalized software is five years. Other intangible assets include those assets that arise from business combinations and that consist of developed technology both for internal use and external sale, non-competition covenants, trademarks, contracts, and customer relationships that are amortized, on a straight-line basis, over two years to seventeen years. Finite-lived intangible assets are required to be amortized over their useful lives and are evaluated for possible impairment whenever events or changes in circumstances indicate that the carrying amount of the assets may not be recoverable.
Recovery of Long-lived Assets (Excluding Goodwill)
We record our long-lived assets, such as property and equipment, at cost. We review the carrying value of our long-lived assets for possible impairment whenever events or changes in circumstances indicate that the carrying amount of assets may not be fully recoverable. The test for recoverability is made using an estimate of the undiscounted expected future cash flows and, if required, the impairment loss, if any, is measured as the amount that the carrying value of the asset exceeds the asset’s fair value if the asset is not recoverable. We consider expected cash flows and estimated future operating results, trends, and other available information in assessing whether the carrying value of assets is impaired. If we determine that an asset’s carrying value is impaired, we will record a reduction in the carrying value of the identified asset and charge the impairment as an operating expense in the period in which the determination is made. Although we believe that the carrying values of our long-lived assets are appropriately stated, changes in our business strategy or market conditions or significant technological developments could significantly affect these judgments and require adjustments to recorded asset balances.
Deferred Incentive Compensation and Other Charges
Incentive compensation to our employees related to the negotiation of new and renewal memberships, license fees to third-party vendors for tools, data, and software incorporated in specific memberships that include performance technology software, and other direct and incremental costs associated with specific memberships are deferred and amortized over the term of the related memberships.
Income Taxes
Deferred income taxes are determined using the asset and liability method. Under this method, temporary differences arise as a result of the difference between the reported amounts of assets and liabilities and their tax bases. Deferred tax assets are reduced by a valuation allowance when, in our management's opinion, it is more likely than not that some portion or the entire deferred tax asset will not be realized. Deferred tax assets and liabilities are adjusted for the effects of changes in tax law and tax rates on the date of the enactment of the change.
Stock-based Compensation
We measure and recognize stock-based compensation cost based on the estimated fair values of the stock-based awards on the grant date. Stock-based compensation costs are recognized as an expense in the consolidated statements of operations over the vesting periods of the awards. We calculate the grant date estimated fair value of all stock options, with the exception of the stock options issued with market-based conditions, using a Black-Scholes valuation model. The fair value of stock options issued with both performance-based and market-based conditions is calculated on the date of grant using a Monte Carlo model.
45
Determining the estimated fair value of stock-based awards is subjective in nature and involves the use of significant estimates and assumptions, including the term of the stock-based awards, risk-free interest rates over the vesting period, expected dividend rates, the price volatility of our shares, forfeiture rates of the awards, and the impact of market conditions. The probability of achieving performance conditions and the estimated time to achieve such performance conditions are significant estimates in determining when and in what amount to recognize stock-based awards with performance conditions. Such estimates are made based on the historical achievement of similar conditions and the Company's estimated operating plan. As these factors change, the estimates of probability and estimated time to achieve performance conditions are updated. Forfeitures are estimated at the time of grant and adjusted, if necessary, in subsequent periods if actual forfeitures differ from those estimates. The forfeiture rate is based on historical experience. Our fair value estimates are based on assumptions we believe are reasonable but that are inherently uncertain. The fair value of all restricted stock units, with the exception of the restricted stock units issued with market-based conditions, is determined as the fair market value of the underlying shares on the date of grant. The fair value of restricted stock units issued with both performance-based and market-based conditions is calculated on the date of grant using a Monte Carlo model. To the extent we change the terms of our employee stock-based compensation programs, experience market volatility in the pricing of our common stock that increases the implied volatility calculation, or refine different assumptions in future periods such as the probability or timing of achieving performance conditions and forfeiture rates that differ from our current estimates, among other potential factors, the stock-based compensation expense that we record in future periods and the tax benefits that we realize may differ significantly from the expense and the tax benefits we have recorded in previous reporting periods.
Recent Accounting Pronouncements
See Note 2, “Summary of significant accounting policies,” to our consolidated financial statements included elsewhere in this report for a description of recent accounting pronouncements, including the expected dates of adoption.
Non-GAAP Financial Measures
The tables and related discussion below present information for the periods indicated about our adjusted revenue, adjusted EBITDA, adjusted net income, non-GAAP earnings per diluted share, adjusted effective tax rate, and adjusted weighted average common shares outstanding - diluted.
Our management believes that providing information about these non-GAAP financial measures facilitates an assessment by our investors of our fundamental operating trends and addresses concerns of management and investors that the various gains and expenses excluded from these measures may obscure such underlying trends. Our management uses these non-GAAP financial measures, together with financial measures prepared in accordance with GAAP, to enhance its understanding of our core operating performance, which represents our views concerning our performance in the ordinary, ongoing, and customary course of our operations. In the future, we are likely to incur income and expenses similar to the items for which the applicable GAAP measures have been adjusted and to report non-GAAP financial measures excluding such items. Accordingly, the exclusion of those and similar items in our non-GAAP presentation should not be interpreted as implying that the items are non-recurring, infrequent, or unusual.
The information about our core operating performance provided by our non-GAAP financial measures is used by management for a variety of purposes. Management uses the non-GAAP financial measures for internal budgeting and other managerial purposes in part because the measures enable management to evaluate projected operating results and make comparative assessments of our performance over time while isolating the effects of items that vary from period to period without any or with limited correlation to core operating performance, such as interest expense and foreign currency exchange rates, periodic costs of certain capitalized tangible and intangible assets, stock-based compensation expense, tax rates, and certain non-cash and special charges. The effects of the foregoing items also vary widely among similar companies, and affect the ability of management and investors to make company-to-company comparisons. In addition, merger and acquisition activity can have inconsistent effects on earnings that are not related to core operating performance due, for instance, to charges relating to acquisition costs, the amortization of acquisition-related intangibles, and fluctuations in the fair value of contingent earn-out liabilities. Companies also exhibit significant variations with respect to capital structure and cost of capital (which affect relative interest expense) and differences in taxation and book depreciation of facilities and equipment (which affect relative depreciation expense), including significant differences in the depreciable lives of similar assets among various companies. By eliminating some of the foregoing variations, management believes that our non-GAAP financial measures allow management and investors to evaluate more effectively our performance relative to that of our competitors and peer companies. Similarly, our management believes that because of the variety of equity awards used by companies, the varying methodologies for determining both stock-based compensation and stock-based compensation expense among companies and from period to period, and the subjective assumptions involved in those determinations, excluding stock-based compensation from our non-GAAP financial measures enhances company-to-company comparisons over multiple fiscal periods.
46
Our non-GAAP measures may be calculated differently from similarly titled measures reported by other companies due to differences in accounting policies and items excluded or included in the adjustments, which limits their usefulness as comparative measures. In addition, there are other limitations associated with the non-GAAP financial measures we use, including the following:
• | the non-GAAP financial measures generally do not reflect all depreciation and amortization, and although the assets being depreciated and amortized will in some cases have to be replaced in the future, the measures do not reflect any cash requirements for such replacements; |
• | the non-GAAP financial measures do not reflect the expense of equity awards to employees; |
• | the non-GAAP financial measures do not reflect the effect of earnings or charges resulting from matters that management considers not indicative of our ongoing operations, but which may recur from year to year; and |
• | to the extent that we change our accounting for certain transactions or other items from period to period, our non-GAAP financial measures may not be directly comparable from period to period. |
Our management compensates for these limitations by relying primarily on our GAAP results and using the non-GAAP financial measures only as a supplemental measure of our operating performance, and by considering independently the economic effects of the foregoing items that are or are not reflected in the non-GAAP measures. Because of their limitations, our non-GAAP financial measures should be considered by our investors only in addition to financial measures prepared in accordance with GAAP, and should not be considered to be a substitute for, or superior to, the GAAP measures as indicators of operating performance.
A reconciliation of adjusted revenue, adjusted EBITDA, adjusted net income, non-GAAP earnings per diluted share, adjusted effective tax rate, and adjusted weighted average common shares outstanding - diluted to the most directly comparable GAAP financial measures is provided below (in thousands, except per share data).
Calendar Year Ended December 31, | Nine Months Ended December 31, | Fiscal Year Ended March 31, | |||||||||||||||||
2015 | 2014 | 2014 | 2013 | 2014 | |||||||||||||||
Revenue | $ | 768,348 | $ | 571,805 | $ | 434,002 | $ | 381,626 | $ | 519,429 | |||||||||
Effect on revenue of fair value adjustments to acquisition-related deferred revenue | 12,499 | — | — | — | — | ||||||||||||||
Adjusted revenue | $ | 780,847 | $ | 571,805 | $ | 434,002 | $ | 381,626 | $ | 519,429 | |||||||||
47
Calendar Year Ended December 31, | Nine Months Ended December 31, | Fiscal Year Ended March 31, | |||||||||||||||||
2015 | 2014 | 2014 | 2013 | 2014 | |||||||||||||||
Net (loss) income attributable to common stockholders | $ | (119,014 | ) | $ | 4,790 | $ | (3,547 | ) | $ | 15,655 | $ | 23,992 | |||||||
Effect on revenue of fair value adjustments to acquisition-related deferred revenue | 12,499 | — | — | — | — | ||||||||||||||
Equity in loss of unconsolidated entities | 4,396 | 9,271 | 6,540 | 3,320 | 6,051 | ||||||||||||||
Accretion of noncontrolling interest to redemption value | — | 6,253 | 6,253 | — | — | ||||||||||||||
Provision for income taxes | 15,200 | 10,463 | 3,530 | 11,804 | 18,737 | ||||||||||||||
Interest expense | 21,121 | — | — | — | — | ||||||||||||||
Other expense (income), net | 6,499 | 595 | 1,327 | (1,974 | ) | (2,706 | ) | ||||||||||||
Loss on financing activities | 17,398 | — | — | — | — | ||||||||||||||
Depreciation and amortization | 73,134 | 39,101 | 30,317 | 22,300 | 31,084 | ||||||||||||||
Impairment of capitalized software | 8,166 | 2,086 | 2,086 | — | — | ||||||||||||||
Goodwill impairment | 99,145 | — | — | — | — | ||||||||||||||
Acquisition and similar transaction charges | 6,610 | 4,592 | 4,592 | 573 | 573 | ||||||||||||||
Fair value adjustments to acquisition-related earn-out liabilities | (1,665 | ) | (4,700 | ) | (600 | ) | (250 | ) | (4,350 | ) | |||||||||
Vacation accrual adjustment | (850 | ) | 850 | 850 | — | — | |||||||||||||
Stock-based compensation expense | 29,093 | 22,388 | 17,965 | 13,794 | 18,217 | ||||||||||||||
Adjusted EBITDA | $ | 171,732 | $ | 95,689 | $ | 69,313 | $ | 65,222 | $ | 91,598 | |||||||||
48
Calendar Year Ended December 31, | Nine Months Ended December 31, | Fiscal Year Ended March 31, | |||||||||||||||||
2015 | 2014 | 2014 | 2013 | 2014 | |||||||||||||||
Net (loss) income attributable to common stockholders | $ | (119,014 | ) | $ | 4,790 | $ | (3,547 | ) | $ | 15,655 | $ | 23,992 | |||||||
Effect of adjusted tax rate on net (loss) income | 39,174 | 738 | 738 | — | — | ||||||||||||||
Effect on revenue of fair value adjustments to acquisition-related deferred revenue, net of adjusted tax rate | 7,046 | — | — | — | — | ||||||||||||||
Equity in loss of unconsolidated entities | 4,396 | 9,271 | 6,540 | 3,320 | 6,051 | ||||||||||||||
Accretion of noncontrolling interest to redemption value | — | 6,253 | 6,253 | — | — | ||||||||||||||
Impairment of capitalized software, net of adjusted tax rate | 6,190 | 1,502 | 1,502 | — | — | ||||||||||||||
Goodwill impairment, net of adjusted tax rate | 75,152 | — | — | — | — | ||||||||||||||
Amortization of acquisition-related intangibles, net of adjusted tax rate | 18,816 | 7,164 | 5,733 | 3,790 | 5,221 | ||||||||||||||
Loss on financing activities, net of adjusted tax rate | 9,725 | — | — | — | — | ||||||||||||||
Acquisition and similar transaction charges, net of adjusted tax rate | 3,704 | 3,276 | 3,276 | 352 | 352 | ||||||||||||||
Fair value adjustments to acquisition-related earn-out liabilities, net of adjusted tax rate | (831 | ) | (3,032 | ) | (511 | ) | (154 | ) | (2,675 | ) | |||||||||
Gain on investment in common stock warrants, net of adjusted tax rate | 294 | 108 | 108 | — | — | ||||||||||||||
Impairment of cost method investment, net of adjusted tax rate | 2,426 | — | — | — | — | ||||||||||||||
Vacation accrual adjustment, net of adjusted tax rate | (475 | ) | 803 | 803 | — | — | |||||||||||||
Stock-based compensation expense, net of adjusted tax rate | 17,598 | 16,424 | 13,702 | 8,484 | 11,204 | ||||||||||||||
Adjusted net income (2) | $ | 64,201 | $ | 47,297 | $ | 34,597 | $ | 31,447 | $ | 44,145 | |||||||||
49
Calendar Year Ended December 31, | Nine Months Ended December 31, | Fiscal Year Ended March 31, | |||||||||||||||||
2015 | 2014 | 2014 | 2013 | 2014 | |||||||||||||||
Net (loss) income attributable to common shareholders per share - diluted | $ | (2.84 | ) | $ | 0.13 | $ | (0.10 | ) | $ | 0.44 | $ | 0.65 | |||||||
Effect of adjusted tax rate on net (loss) income | 0.93 | 0.02 | 0.02 | — | — | ||||||||||||||
Effect of adjusted weighted average common shares outstanding - diluted on earnings (loss) per share | 0.02 | — | 0.01 | — | — | ||||||||||||||
Effect on revenue of fair value adjustments to acquisition-related deferred revenue, net of adjusted tax rate | 0.17 | — | — | — | — | ||||||||||||||
Equity in loss of unconsolidated entities | 0.11 | 0.25 | 0.18 | 0.09 | 0.17 | ||||||||||||||
Accretion of noncontrolling interest to redemption value | — | 0.17 | 0.17 | — | — | ||||||||||||||
Impairment of capitalized software, net of adjusted tax rate | 0.15 | 0.04 | 0.04 | — | — | ||||||||||||||
Goodwill impairment, net of adjusted tax rate | 1.77 | — | — | — | — | ||||||||||||||
Amortization of acquisition-related intangibles, net of adjusted tax rate | 0.45 | 0.20 | 0.16 | 0.10 | 0.14 | ||||||||||||||
Loss on financing activities, net of adjusted tax rate | 0.23 | — | — | — | — | ||||||||||||||
Acquisition and similar transaction charges, net of adjusted tax rate | 0.09 | 0.09 | 0.09 | 0.01 | 0.01 | ||||||||||||||
Fair value adjustments to acquisition-related earn-out liabilities, net of adjusted tax rate | (0.03 | ) | (0.09 | ) | (0.01 | ) | — | (0.07 | ) | ||||||||||
Gain on investment in common stock warrants, net of adjusted tax rate | — | — | — | — | — | ||||||||||||||
Impairment of cost method investment, net of adjusted tax rate | 0.06 | — | — | — | — | ||||||||||||||
Vacation accrual adjustment, net of adjusted tax rate | (0.01 | ) | 0.02 | — | — | — | |||||||||||||
Stock-based compensation expense, net of adjusted tax rate | 0.41 | 0.45 | 0.37 | 0.23 | 0.30 | ||||||||||||||
Non-GAAP earnings per diluted share | $ | 1.51 | $ | 1.28 | $ | 0.93 | $ | 0.87 | $ | 1.20 | |||||||||
Calendar Year Ended December 31, | Nine Months Ended December 31, | Fiscal Year Ended March 31, | ||||||||||||
2015 | 2014 | 2014 | 2013 | 2014 | ||||||||||
Effective tax rate | (15.3 | )% | 34.0 | % | 27.6 | % | 38.5 | % | 38.5 | % | ||||
Effect on tax rate of Washington, D.C. tax law change including write-off of DC income tax credits | 18.0 | % | — | % | — | % | — | % | — | % | ||||
Effect on tax rate of loss on financing activities | (13.0 | )% | — | % | — | % | — | % | — | % | ||||
Effect on tax rate of asset impairment | 52.1 | % | — | % | — | % | — | % | — | % | ||||
Effect on tax rate of unconsolidated equity method investment related FIN 48 liability | — | % | (5.6 | )% | — | % | — | % | — | % | ||||
Effect on tax rate of Royall acquisition costs and other acquisition-related tax items | (2.6 | )% | — | % | — | % | — | % | — | % | ||||
Adjusted effective tax rate | 39.20 | % | 28.40 | % | 27.60 | % | 38.50 | % | 38.50 | % | ||||
50
Calendar Year Ended December 31, | Nine Months Ended December 31, | Fiscal Year Ended March 31, | ||||||||||||
2015 | 2014 | 2014 | 2013 | 2014 | ||||||||||
Weighted average common shares outstanding - Diluted | 41,888 | 36,877 | 36,213 | 36,876 | 36,959 | |||||||||
Dilutive shares outstanding | 516 | — | 555 | — | — | |||||||||
Adjusted weighted average common shares outstanding - Diluted | 42,404 | 36,877 | 36,768 | 36,876 | 36,959 | |||||||||
Adjusted net income, non-GAAP earnings per diluted share, and adjusted EBITDA. Adjusted net income increased to $64.2 million for calendar year 2015 from $47.3 million for calendar year 2014, while adjusted EBITDA increased 80% to $171.7 million for calendar year 2015 from $95.7 million for calendar year 2014. The increases in adjusted EBITDA and adjusted net income for calendar year 2015 were attributable to our increased revenue and our acquisition of Royall, the effects of which were partially offset by increased investment in our general and administrative infrastructure to support our growing employee base, higher marketing and member relations costs attributable to an increase in the number of new sales teams, and the costs of new and growing programs.
For the transition period, adjusted net income increased 10.0% to $34.6 million from $31.4 million for the comparable nine-month period. For the transition period, non-GAAP earnings per diluted share increased to $0.93 from non-GAAP earnings per diluted share of $0.87 for the comparable nine-month period. Adjusted EBITDA increased 6.3% to $69.3 million for the transition period from $65.2 million for the comparable nine-month period. The increases in adjusted net income and adjusted EBITDA for the transition period were due to increased revenue, the effect of which was partially offset by the costs of new and growing programs, increased investment in our general and administrative infrastructure to support our growing employee base, and an increase in the number of new sales teams.
Item 7A. Quantitative and Qualitative Disclosures About Market Risk.
Interest Rate Risk. As of December 31, 2015, we had $450.2 million of outstanding borrowings under our senior secured term loan facility and $100.0 million of outstanding borrowings under our revolving credit facility. Amounts drawn under each facility generally bear interest, payable quarterly, at an annual rate calculated, at our option, on the basis of either (a) an alternate base rate plus an initial margin of 1.25% or (b) the applicable London interbank offered rate, plus an initial margin of 2.25%, subject in each case to margin reductions based on our total leverage ratio from time to time. Accordingly, we are exposed to fluctuations in interest rates on borrowings under this senior secured term loan facility and revolving credit facility. A hypothetical 10% increase in LIBOR would increase our annual cash interest expense on our variable-rate debt by approximately $0.2 million.
During the calendar year ended December 31, 2015, we utilized an interest rate swap to manage exposure to interest rates on a portion of the variable rate of our indebtedness. Our interest rate swap is with major financial institutions and is not used for speculative or trading purposes. We have designated our interest rate swap as a cash flow hedge, and changes in the fair value of the interest rate swap are recognized in other comprehensive (loss) income. Hedge ineffectiveness, if any, associated with the interest rate swap will be reported in interest expense. We recorded the interest rate swap at fair value, which amounted to an asset of $0.4 million as of December 31, 2015.
Foreign Currency Risk. Our international operations, which accounted for approximately 2.4% of our consolidated total revenue for the calendar year ended December 31, 2015, subject us to risks related to currency exchange fluctuations. Prices for our services sold to members located outside the United States are sometimes denominated in local currencies (primarily the British Pound Sterling). As a consequence, increases in the U.S. dollar against local currencies in countries where we have members would result in a foreign exchange loss recognized by us. For the calendar year ended December 31, 2015, we recorded a foreign currency exchange rate loss of $2.9 million, for the transition period ended December 31, 2014, we recorded a foreign currency exchange rate loss of $1.7 million, and for the fiscal year ended March 31, 2014, we recorded a foreign currency exchange rate loss of $0.2 million. These amounts are included in other income, net in our consolidated statements of operations. A hypothetical 10% change in foreign currency exchange rates would not have a material impact on our financial position as of December 31, 2015.
51
Item 8. Financial Statements and Supplementary Data.
Report of Management’s Assessment of Internal Control Over Financial Reporting
Management is responsible for the preparation and integrity of our consolidated financial statements appearing in our Annual Report on Form 10-K. Our consolidated financial statements were prepared in conformity with accounting principles generally accepted in the United States of America and include amounts based on management’s estimates and judgments.
Management is also responsible for establishing and maintaining adequate internal control over financial reporting. We maintain a system of internal control that is designed to provide reasonable assurance as to the reliable preparation and presentation of our consolidated financial statements in accordance with generally accepted accounting principles, as well as to safeguard assets from unauthorized use or disposition.
Our control environment is the foundation for our system of internal control over financial reporting and is reflected in our Code of Ethics for Employees, Code of Business Conduct and Ethics for Members of the Board of Directors and Code of Ethics for Finance Team Members. Our internal control over financial reporting is supported by formal policies and procedures which are reviewed, modified and improved as changes occur in business conditions and operations.
The Audit Committee of the Board of Directors, which is composed solely of outside directors, meets periodically with members of management and the independent registered public accounting firm to review and discuss internal control over financial reporting and accounting and financial reporting matters. The independent registered public accounting firm reports to the Audit Committee.
Management, with the participation of the Chief Executive Officer and Chief Financial Officer, conducted an evaluation of the effectiveness of our internal control over financial reporting as of December 31, 2015 based on the framework in Internal Control—Integrated Framework (2013 Framework) issued by the Committee of Sponsoring Organizations of the Treadway Commission. This evaluation included review of the documentation of controls, evaluation of the design effectiveness of controls, testing of the operating effectiveness of controls and a conclusion on this evaluation. In its evaluation, management identified control deficiencies in its revenue recognition and business combinations processes that constituted material weaknesses as such deficiencies potentially would not prevent or detect a material misstatement of the Company’s consolidated financial statements. As a result, management has concluded that our internal control over financial reporting was not effective as of December 31, 2015.
We excluded Royall Acquisition Co., which is included in our consolidated financial statements, from our assessment of internal control over financial reporting as of December 31, 2015 because it was acquired by the Company in a purchase business combination on January 9, 2015. The assets of Royall Acquisition Co. excluded from our assessment represented approximately 7% of the Company’s total assets as of December 31, 2015 and approximately 13% of the Company’s consolidated total revenues for the calendar year ended December 31, 2015.
Because of its inherent limitations, internal control over financial reporting may not prevent or detect misstatements. Also, projections of any evaluation of effectiveness to future periods are subject to the risk that controls may become inadequate because of changes in conditions, or that the degree of compliance with the policies or procedures may deteriorate.
Ernst & Young LLP, an independent registered public accounting firm which has issued a report on our consolidated financial statements included in this Annual Report on Form 10-K, has issued an attestation report on the effectiveness of our internal control over financial reporting, which is included herein and which expresses an adverse opinion thereon.
/s/ Robert W. Musslewhite | |
Robert W. Musslewhite | |
Chief Executive Officer and Director | |
March 11, 2016 | |
/s/ Michael T. Kirshbaum | |
Michael T. Kirshbaum | |
Chief Financial Officer and Treasurer | |
March 11, 2016 | |
52
Report of Independent Registered Public Accounting Firm on Internal Control Over Financial Reporting
The Board of Directors and Stockholders of
The Advisory Board Company and subsidiaries
We have audited The Advisory Board Company and subsidiaries (the Company) internal control over financial reporting as of December 31, 2015, based on criteria established in Internal Control-Integrated Framework issued by the Committee of Sponsoring Organizations of the Treadway Commission (2013 framework) (the COSO criteria). The Company’s management is responsible for maintaining effective internal control over financial reporting, and for its assessment of the effectiveness of internal control over financial reporting included in the accompanying Report of Management’s Assessment of Internal Control Over Financial Reporting. Our responsibility is to express an opinion on the Company’s internal control over financial reporting based on our audit.
We conducted our audit in accordance with the standards of the Public Company Accounting Oversight Board (United States). Those standards require that we plan and perform the audit to obtain reasonable assurance about whether effective internal control over financial reporting was maintained in all material respects. Our audit included obtaining an understanding of internal control over financial reporting, assessing the risk that a material weakness exists, testing and evaluating the design and operating effectiveness of internal control based on the assessed risk, and performing such other procedures as we considered necessary in the circumstances. We believe that our audit provides a reasonable basis for our opinion.
A company’s internal control over financial reporting is a process designed to provide reasonable assurance regarding the reliability of financial reporting and the preparation of financial statements for external purposes in accordance with generally accepted accounting principles. A company’s internal control over financial reporting includes those policies and procedures that (1) pertain to the maintenance of records that, in reasonable detail, accurately and fairly reflect the transactions and dispositions of the assets of the company; (2) provide reasonable assurance that transactions are recorded as necessary to permit preparation of financial statements in accordance with generally accepted accounting principles, and that receipts and expenditures of the company are being made only in accordance with authorizations of management and directors of the company; and (3) provide reasonable assurance regarding prevention or timely detection of unauthorized acquisition, use, or disposition of the company’s assets that could have a material effect on the financial statements.
Because of its inherent limitations, internal control over financial reporting may not prevent or detect misstatements. Also, projections of any evaluation of effectiveness to future periods are subject to the risk that controls may become inadequate because of changes in conditions, or that the degree of compliance with the policies or procedures may deteriorate.
As indicated in the accompanying Report of Management’s Assessment of Internal Control over Financial Reporting, management’s assessment of and conclusion on the effectiveness of internal control over financial reporting did not include the internal controls of Royall Acquisition Co., which is included in the 2015 consolidated financial statements of The Advisory Board Company and subsidiaries and constituted approximately 7% of the Company’s total assets as of December 31, 2015 and approximately 13% of the Company’s consolidated total revenues for the year then ended. Our audit of internal control over financial reporting of the Company also did not include an evaluation of the internal control over financial reporting of Royall Acquisition Co.
A material weakness is a deficiency, or combination of deficiencies, in internal control over financial reporting, such that there is a reasonable possibility that a material misstatement of the company’s annual or interim financial statements will not be prevented or detected on a timely basis. Material weaknesses in internal controls related to the Company’s revenue recognition and business combination processes have been identified and included in management’s assessment. We also have audited, in accordance with the standards of the Public Company Accounting Oversight Board (United States), the consolidated balance sheets of The Advisory Board Company and subsidiaries as of December 31, 2015 and 2014 and the related consolidated statements of operations, comprehensive income (loss), stockholders’ equity and cash flows for the year ended December 31, 2015, the nine months ended December 31, 2014 and the year ended March 31, 2014. These material weaknesses were considered in determining the nature, timing and extent of audit tests applied in our audit of the 2015 financial statements, and this report does not affect our report dated March 11, 2016 which expressed an unqualified opinion on those financial statements.
In our opinion, because of the effect of the material weaknesses described above on the achievement of the objectives of the control criteria, The Advisory Board Company and subsidiaries have not maintained effective internal control over financial reporting as of December 31, 2015, based on the COSO criteria.
/s/ Ernst & Young LLP
McLean, Virginia
March 11, 2016
53
Report of Independent Registered Public Accounting Firm on the Consolidated Financial Statements
The Board of Directors and Stockholders of
The Advisory Board Company and subsidiaries
We have audited the accompanying consolidated balance sheets of The Advisory Board Company and subsidiaries as of December 31, 2015 and 2014, and the related consolidated statements of operations, comprehensive income (loss), stockholders' equity and cash flows for the year ended December 31, 2015, the nine months ended December 31, 2014 and the year ended March 31, 2014. Our audits also included the financial statement schedule listed in the Index at Item 15(a). These financial statements and schedule are the responsibility of the Company's management. Our responsibility is to express an opinion on these financial statements and schedule based on our audits. We did not audit the financial statements of Evolent Health, Inc. or Evolent Health LLC, entities in which the Company has a 15.4% and 8.8% interest, respectively, as of December 31, 2015. In the consolidated financial statements, the Company’s investment in Evolent Health, Inc. is stated at $0 as of December 31, 2015, the Company’s investment in Evolent Health LLC is stated at $0.7 million and $9.3 million as of December 31, 2015 and 2014, respectively, the Company’s equity in the net loss of Evolent Health, Inc. is stated at $3.0 million for the year ended December 31, 2015, and the Company’s equity in the net loss of Evolent Health LLC is stated at $8.6 million and $6.5 million for the year ended December 31, 2015 and the nine months ended December 31, 2014, respectively. Those statements were audited by other auditors whose reports have been furnished to us, and our opinion, insofar as it relates to the amounts included for Evolent Health, Inc. and Evolent Health LLC, is based solely on the reports of the other auditors.
We conducted our audits in accordance with the standards of the Public Company Accounting Oversight Board (United States). Those standards require that we plan and perform the audit to obtain reasonable assurance about whether the financial statements are free of material misstatement. An audit includes examining, on a test basis, evidence supporting the amounts and disclosures in the financial statements. An audit also includes assessing the accounting principles used and significant estimates made by management, as well as evaluating the overall financial statement presentation. We believe that our audits and the reports of other auditors provide a reasonable basis for our opinion.
In our opinion, based on our audits and the reports of other auditors, the financial statements referred to above present fairly, in all material respects, the consolidated financial position of The Advisory Board Company and subsidiaries at December 31, 2015 and 2014, and the consolidated results of their operations and their cash flows for the year ended December 31, 2015, the nine months ended December 31, 2014 and the year ended March 31, 2014, in conformity with U.S. generally accepted accounting principles. Also, in our opinion, the related financial statement schedule, when considered in relation to the basic financial statements taken as a whole, presents fairly in all material respects the information set forth therein.
We also have audited, in accordance with the standards of the Public Company Accounting Oversight Board (United States), The Advisory Board Company’s internal control over financial reporting as of December 31, 2015, based on criteria established in Internal Control-Integrated Framework issued by the Committee of Sponsoring Organizations of the Treadway Commission (2013 framework) and our report dated March 11, 2016, expressed an adverse opinion thereon.
/s/ Ernst & Young LLP
McLean, Virginia
March 11, 2016
54
Report of Independent Registered Public Accounting Firm
To the Board of Directors and Shareholders of Evolent Health, Inc.:
In our opinion, the accompanying consolidated balance sheets and the related consolidated statements of operations, changes in
shareholders’ equity (deficit) and redeemable preferred stock and of cash flows present fairly, in all material respects, the financial position of Evolent Health, Inc. at December 31, 2015 and 2014, and the results of their operations and their cash flows for each of the three years in the period ended December 31, 2015 in conformity with accounting principles generally accepted in the United States of America. These financial statements are the responsibility of the Company’s management.
Our responsibility is to express an opinion on these financial statements based on our audits. We conducted our audits of these statements in accordance with the standards of the Public Company Accounting Oversight Board (United States). Those standards require that we plan and perform the audit to obtain reasonable assurance about whether the financial statements are free of material misstatement. An audit includes examining, on a test basis, evidence supporting the amounts and disclosures in the financial statements, assessing the accounting principles used and significant estimates made by management, and evaluating the overall financial statement presentation. We believe that our audits provide a reasonable basis for our opinion.
As discussed in Note 1, the Company accounted for its investment in its subsidiary as an equity method investment from September 23, 2013 through June 3, 2015. Subsequent to June 3, 2015, in connection with the reorganization described in Note 1, the Company consolidated the results of its subsidiary.
/s/ PricewaterhouseCoopers LLP
McLean, Virginia
February 29, 2016
55
Report of Independent Registered Public Accounting Firm
To the Board of Directors of Evolent Health LLC:
In our opinion, the accompanying balance sheet as of December 31, 2014 and the related statements of operations, of changes in members’ equity and redeemable preferred units and of cash flows, for the period from January 1, 2015 to June 3, 2015 and for the years ended December 31, 2014 and 2013 present fairly, in all material respects, the financial position of Evolent Health LLC (Predecessor) at December 31, 2014, and the results of its operations and its cash flows for the period from January 1, 2015 to June 3, 2015 and the years ended December 31, 2014 and 2013 in conformity with accounting principles generally accepted in the United States of America. These financial statements are the responsibility of the Company’s management.
Our responsibility is to express an opinion on these financial statements based on our audits. We conducted our audits of these statements in accordance with the auditing standards of the Public Company Accounting Oversight Board (United States) and in accordance with auditing standards generally accepted in the United States of America. Those standards require that we plan and perform the audit to obtain reasonable assurance about whether the financial statements are free of material misstatement. An audit includes examining, on a test basis, evidence supporting the amounts and disclosures in the financial statements, assessing the accounting principles used and significant estimates made by management, and evaluating the overall financial statement presentation. We believe that our audits provide a reasonable basis for our opinion.
/s/ PricewaterhouseCoopers LLP
McLean, Virginia
February 29, 2016
56
Report of Independent Registered Public Accounting Firm
To the Board of Directors of Evolent Health LLC:
In our opinion, the accompanying balance sheet as of December 31, 2015 and the related statements of operations, of changes in members’ equity and redeemable preferred units and of cash flows, for the period from June 4, 2015 to December 31, 2015 present fairly, in all material respects, the financial position of Evolent Health LLC (Successor) at December 31, 2015, and the results of its operations and its cash flows for the period from June 4, 2015 to December 31, 2015 in conformity with accounting principles generally accepted in the United States of America. These financial statements are the responsibility of the Company’s management. Our responsibility is to express an opinion on these financial statements based on our audit. We conducted our audit of these statements in accordance with the auditing standards of the Public Company Accounting Oversight Board (United States) and in accordance with auditing standards generally accepted in the United States of America. Those standards require that we plan and perform the audit to obtain reasonable assurance about whether the financial statements are free of material misstatement. An audit includes examining, on a test basis, evidence supporting the amounts and disclosures in the financial statements, assessing the accounting principles used and significant estimates made by management, and evaluating the overall financial statement presentation. We believe that our audit provides a reasonable basis for our opinion.
/s/ PricewaterhouseCoopers LLP
McLean, Virginia
February 29, 2016
57
THE ADVISORY BOARD COMPANY AND SUBSIDIARIES
CONSOLIDATED BALANCE SHEETS
(In thousands, except share and per share amounts)
December 31, | |||||||
2015 | 2014 | ||||||
ASSETS | |||||||
Current assets: | |||||||
Cash and cash equivalents | $ | 71,825 | $ | 72,936 | |||
Marketable securities, current | — | 14,714 | |||||
Membership fees receivable, net | 605,444 | 539,061 | |||||
Prepaid expenses and other current assets | 22,651 | 23,315 | |||||
Deferred income taxes, current | — | 14,695 | |||||
Total current assets | 699,920 | 664,721 | |||||
Property and equipment, net | 183,057 | 134,323 | |||||
Intangible assets, net | 274,721 | 38,973 | |||||
Deferred incentive compensation and other charges | 81,462 | 86,045 | |||||
Goodwill | 738,200 | 186,895 | |||||
Investments in and advances to unconsolidated entities | 706 | 9,316 | |||||
Other non-current assets | 1,800 | 5,370 | |||||
Total assets | $ | 1,979,866 | $ | 1,125,643 | |||
LIABILITIES AND STOCKHOLDERS’ EQUITY | |||||||
Current liabilities: | |||||||
Deferred revenue, current | $ | 581,471 | $ | 505,729 | |||
Accounts payable and accrued liabilities | 74,879 | 80,284 | |||||
Accrued incentive compensation | 41,173 | 32,073 | |||||
Debt, current | 27,851 | — | |||||
Total current liabilities | 725,374 | 618,086 | |||||
Deferred revenue, net of current portion | 173,953 | 167,014 | |||||
Deferred income taxes, net of current portion | 93,893 | 7,429 | |||||
Debt, net of current portion | 522,367 | — | |||||
Financing obligation | 2,700 | — | |||||
Other long-term liabilities | 12,488 | 15,304 | |||||
Total liabilities | 1,530,775 | 807,833 | |||||
Stockholders’ equity: | |||||||
Preferred stock, par value $0.01; 5,000,000 shares authorized, zero shares issued and outstanding | — | — | |||||
Common stock, par value $0.01; 135,000,000 shares authorized, 41,572,523 and 36,087,754 shares issued and outstanding as of December 31, 2015 and 2014, respectively | 416 | 361 | |||||
Additional paid-in capital | 744,333 | 441,224 | |||||
Accumulated deficit | (295,860 | ) | (123,857 | ) | |||
Accumulated other comprehensive income | 202 | 82 | |||||
Total stockholders’ equity | 449,091 | 317,810 | |||||
Total liabilities and stockholders’ equity | $ | 1,979,866 | $ | 1,125,643 | |||
The accompanying notes are an integral part of these consolidated balance sheets.
58
THE ADVISORY BOARD COMPANY AND SUBSIDIARIES
CONSOLIDATED STATEMENTS OF OPERATIONS
(In thousands, except per share amounts)
Year Ended December 31, | Nine Months Ended December 31, | Year Ended March 31, | |||||||||
2015 | 2014 | 2014 | |||||||||
Revenue | $ | 768,348 | $ | 434,002 | $ | 519,429 | |||||
Costs and expenses: | |||||||||||
Cost of services, excluding depreciation and amortization | 392,676 | 230,769 | 271,923 | ||||||||
Member relations and marketing | 120,958 | 81,244 | 96,298 | ||||||||
General and administrative | 128,669 | 75,483 | 74,169 | ||||||||
Depreciation and amortization | 73,134 | 30,317 | 31,084 | ||||||||
Impairment of capitalized software | 8,166 | 2,086 | — | ||||||||
Goodwill impairment | 99,145 | — | — | ||||||||
Operating (loss) income | (54,400 | ) | 14,103 | 45,955 | |||||||
Other (expense) income | |||||||||||
Interest expense | (21,121 | ) | — | — | |||||||
Other (expense) income, net | (6,499 | ) | (1,327 | ) | 2,706 | ||||||
Loss on financing activities | (17,398 | ) | — | — | |||||||
Total other (expense) income, net | (45,018 | ) | (1,327 | ) | 2,706 | ||||||
(Loss) Income before provision for income taxes and equity in loss of unconsolidated entities | (99,418 | ) | 12,776 | 48,661 | |||||||
Provision for income taxes | (15,200 | ) | (3,530 | ) | (18,737 | ) | |||||
Equity in loss of unconsolidated entities | (4,396 | ) | (6,540 | ) | (6,051 | ) | |||||
Net (loss) income before allocation to noncontrolling interest | (119,014 | ) | 2,706 | 23,873 | |||||||
Net loss and accretion to redemption value attributable to noncontrolling interest | — | (6,253 | ) | 119 | |||||||
Net (loss) income attributable to common stockholders | $ | (119,014 | ) | $ | (3,547 | ) | $ | 23,992 | |||
Net (loss) income attributable to common stockholders per share — basic | (2.84 | ) | (0.10 | ) | 0.67 | ||||||
Net (loss) income attributable to common stockholders per share — diluted | (2.84 | ) | (0.10 | ) | 0.65 | ||||||
Weighted average number of shares outstanding: | |||||||||||
Basic | 41,888 | 36,213 | 35,909 | ||||||||
Diluted | 41,888 | 36,213 | 36,959 | ||||||||
The accompanying notes are an integral part of these consolidated statements.
59
THE ADVISORY BOARD COMPANY
CONSOLIDATED STATEMENTS OF COMPREHENSIVE (LOSS) INCOME
(In thousands)
Year Ended December 31, | Nine Months Ended December 31, | Year Ended March 31, | |||||||||
2015 | 2014 | 2014 | |||||||||
Net (loss) income attributable to common stockholders | $ | (119,014 | ) | $ | (3,547 | ) | $ | 23,992 | |||
Other comprehensive income: | |||||||||||
Net unrealized gains (losses) on marketable securities, net of tax | (81 | ) | 1,623 | (2,802 | ) | ||||||
Net unrealized gain on cash flow hedges, net of taxes | 201 | — | |||||||||
Comprehensive (loss) income | $ | (118,894 | ) | $ | (1,924 | ) | $ | 21,190 | |||
The accompanying notes are an integral part of these consolidated financial statements.
60
THE ADVISORY BOARD COMPANY AND SUBSIDIARIES
CONSOLIDATED STATEMENTS OF STOCKHOLDERS’ EQUITY
(In thousands, except share amounts)
Accumulated Elements of Other Comprehensive Income (Loss) | ||||||||||||||||||||||||||||||
Common Shares | Additional Paid-in Capital | Retained Earnings | Treasury Stock | Noncontrolling Interest | ||||||||||||||||||||||||||
Stock | Amount | Total | ||||||||||||||||||||||||||||
Balance as of March 31, 2013 | 35,138,465 | $ | 351 | $ | 374,318 | $ | (92,635 | ) | $ | 1,261 | $ | — | $ | (108 | ) | $ | 283,187 | |||||||||||||
Proceeds from exercise of stock options | 1,323,728 | 13 | 22,023 | — | — | — | — | 22,036 | ||||||||||||||||||||||
Vesting of restricted stock units, net of shares withheld to satisfy minimum employee tax withholding | 227,202 | 2 | (5,920 | ) | — | — | — | — | (5,918 | ) | ||||||||||||||||||||
Excess tax benefits from stock-based awards | — | — | 19,476 | — | — | — | — | 19,476 | ||||||||||||||||||||||
Proceeds from issuance of common stock under employee stock purchase plan | 8,962 | — | 514 | — | — | — | — | 514 | ||||||||||||||||||||||
Stock-based compensation expense | — | — | 18,217 | — | — | — | — | 18,217 | ||||||||||||||||||||||
Retirement of treasury stock | — | (3 | ) | — | (21,914 | ) | — | 21,917 | — | — | ||||||||||||||||||||
Purchases of treasury stock | (376,532 | ) | — | — | — | — | (21,917 | ) | — | (21,917 | ) | |||||||||||||||||||
Change in net unrealized gains (losses) on available-for-sale marketable securities, net of income taxes of ($1,760) | — | — | — | — | (2,802 | ) | — | — | (2,802 | ) | ||||||||||||||||||||
Net income | — | — | — | 23,992 | — | — | (119 | ) | 23,873 | |||||||||||||||||||||
Balance as of March 31, 2014 | 36,321,825 | $ | 363 | $ | 428,628 | $ | (90,557 | ) | $ | (1,541 | ) | $ | — | $ | (227 | ) | $ | 336,666 | ||||||||||||
Proceeds from exercise of stock options | 233,999 | 3 | 4,294 | — | — | — | — | 4,297 | ||||||||||||||||||||||
Vesting of restricted stock units, net of shares withheld to satisfy minimum employee tax withholding | 254,248 | 3 | (7,611 | ) | — | — | — | — | (7,608 | ) | ||||||||||||||||||||
Excess tax benefits from stock-based awards | — | — | 392 | — | — | — | — | 392 | ||||||||||||||||||||||
Proceeds from issuance of common stock under employee stock purchase plan | 9,241 | — | 432 | — | — | — | — | 432 | ||||||||||||||||||||||
Stock-based compensation expense | — | — | 17,964 | — | — | — | — | 17,964 | ||||||||||||||||||||||
Retirement of treasury stock | — | (8 | ) | — | (36,006 | ) | — | 36,014 | — | — | ||||||||||||||||||||
Purchases of treasury stock | (731,559 | ) | — | — | — | — | (36,014 | ) | — | (36,014 | ) | |||||||||||||||||||
Net activity related to noncontrolling interests | — | — | 3,378 | — | — | — | 227 | 3,605 | ||||||||||||||||||||||
Change in net unrealized gains (losses) on available-for-sale marketable securities, net of income taxes of ($1,147) | — | — | — | — | 1,623 | — | — | 1,623 | ||||||||||||||||||||||
Net income | — | — | (6,253 | ) | 2,706 | — | — | (3,547 | ) | |||||||||||||||||||||
Balance as of December 31, 2014 | 36,087,754 | $ | 361 | $ | 441,224 | $ | (123,857 | ) | $ | 82 | $ | — | $ | — | $ | 317,810 | ||||||||||||||
Proceeds from exercise of stock options | 218,109 | 3 | 4,744 | — | — | — | — | 4,747 | ||||||||||||||||||||||
Vesting of restricted stock units, net of shares withheld to satisfy minimum employee tax withholding | 247,157 | 2 | (6,060 | ) | — | — | — | — | (6,058 | ) | ||||||||||||||||||||
Excess tax benefits from stock-based awards | — | — | 4,855 | — | — | — | — | 4,855 | ||||||||||||||||||||||
Proceeds from issuance of common stock under employee stock purchase plan | 10,496 | — | 505 | — | — | — | — | 505 | ||||||||||||||||||||||
Stock-based compensation expense | — | — | 29,092 | — | — | — | — | 29,092 | ||||||||||||||||||||||
Retirement of treasury stock | — | (11 | ) | — | (52,989 | ) | — | 53,000 | — | — | ||||||||||||||||||||
Purchases of treasury stock | (1,069,357 | ) | — | — | — | — | (53,000 | ) | — | (53,000 | ) | |||||||||||||||||||
Net activity related to noncontrolling interests | — | — | — | — | — | — | — | — | ||||||||||||||||||||||
Issuance of common stock to purchase Royall | 2,428,364 | 24 | 121,224 | — | — | — | — | 121,248 | ||||||||||||||||||||||
Common stock offering | 3,650,000 | 37 | 148,749 | — | — | — | — | 148,786 | ||||||||||||||||||||||
Change in net unrealized gains (losses) on cash flow hedge, net of income taxes of $211 | — | — | — | — | 120 | — | — | 120 | ||||||||||||||||||||||
Net loss | — | — | — | (119,014 | ) | — | — | — | (119,014 | ) | ||||||||||||||||||||
Balance as of December 31, 2015 | 41,572,523 | $ | 416 | $ | 744,333 | $ | (295,860 | ) | $ | 202 | $ | — | $ | — | $ | 449,091 | ||||||||||||||
The accompanying notes are an integral part of these consolidated statements.
61
THE ADVISORY BOARD COMPANY AND SUBSIDIARIES
CONSOLIDATED STATEMENTS OF CASH FLOWS
(In thousands)
Year Ended December 31, | Nine Months Ended December 31, | Year Ended March 31, | |||||||||
2015 | 2014 | 2014 | |||||||||
Cash flows from operating activities: | |||||||||||
Net (loss) income before allocation to noncontrolling interest | $ | (119,014 | ) | $ | 2,706 | $ | 23,873 | ||||
Adjustments to reconcile net income before allocation to noncontrolling interest to net cash provided by operating activities: | |||||||||||
Depreciation and amortization | 73,134 | 30,317 | 31,084 | ||||||||
Impairment of capitalized software | 8,166 | 2,086 | — | ||||||||
Goodwill impairment | 99,145 | — | — | ||||||||
Loss on financing activities | 17,398 | — | — | ||||||||
Amortization of debt issuance costs | 1,270 | — | — | ||||||||
Deferred income taxes | 6,670 | (2,383 | ) | 7,324 | |||||||
Excess tax benefits from stock-based awards | (4,855 | ) | (392 | ) | (19,476 | ) | |||||
Stock-based compensation expense | 29,093 | 17,964 | 18,217 | ||||||||
Amortization of marketable securities premiums | — | 1,274 | 2,667 | ||||||||
Loss on investment in common stock warrants | 370 | 180 | — | ||||||||
Impairment of cost method investment | 3,200 | — | — | ||||||||
Equity in loss of unconsolidated entities | 4,396 | 6,540 | 6,051 | ||||||||
Changes in operating assets and liabilities: | |||||||||||
Membership fees receivable | (37,144 | ) | (82,689 | ) | (63,077 | ) | |||||
Prepaid expenses and other current assets | 13,276 | 4,936 | 7,741 | ||||||||
Deferred incentive compensation and other charges | 5,937 | 102 | (12,645 | ) | |||||||
Other non-current assets | (258 | ) | — | — | |||||||
Deferred revenue | 64,381 | 80,386 | 73,304 | ||||||||
Accounts payable and accrued liabilities | (6,678 | ) | 5,107 | 4,277 | |||||||
Acquisition-related earn-out payments | (2,531 | ) | (3,348 | ) | (2,212 | ) | |||||
Accrued incentive compensation | 9,100 | 3,602 | 7,065 | ||||||||
Other long-term liabilities | (3,122 | ) | (1,815 | ) | (6,891 | ) | |||||
Net cash provided by operating activities | 161,934 | 64,573 | 77,302 | ||||||||
Cash flows from investing activities: | |||||||||||
Purchases of property and equipment | (52,941 | ) | (47,535 | ) | (44,658 | ) | |||||
Capitalized external use software development costs | (3,749 | ) | (3,826 | ) | (5,071 | ) | |||||
Cash paid for acquisition, net of cash acquired | (746,693 | ) | (70,208 | ) | (46,036 | ) | |||||
Investments in and advances to unconsolidated entities | (3,006 | ) | — | (15,641 | ) | ||||||
Redemptions of marketable securities | 14,714 | 151,420 | 56,647 | ||||||||
Purchases of marketable securities | — | — | (71,419 | ) | |||||||
Net cash (used in) provided by investing activities | (791,675 | ) | 29,851 | (126,178 | ) | ||||||
Cash flows from financing activities: | |||||||||||
Payment for acquisition of noncontrolling interest | — | (6,110 | ) | — | |||||||
Proceeds from debt, net | 1,840,734 | — | — | ||||||||
Pay down of debt | (1,307,188 | ) | — | — | |||||||
Debt issuance costs | (3,251 | ) | — | — | |||||||
Equity offering | 148,786 | — | — | ||||||||
Proceeds from issuance of common stock from exercise of stock options | 4,747 | 4,294 | 22,023 | ||||||||
Withholding of shares to satisfy minimum employee tax withholding for vested restricted stock units | (6,058 | ) | (7,611 | ) | (5,920 | ) | |||||
Proceeds from issuance of common stock under employee stock purchase plan | 505 | 432 | 514 | ||||||||
Excess tax benefits from stock-based awards | 4,855 | 392 | 19,476 | ||||||||
Acquisition-related earn-out payments | (1,500 | ) | — | — | |||||||
Purchases of treasury stock | (53,000 | ) | (36,014 | ) | (21,917 | ) | |||||
Net cash provided by (used in) financing activities | 628,630 | (44,617 | ) | 14,176 | |||||||
Net (decrease) increase in cash and cash equivalents | (1,111 | ) | 49,807 | (34,700 | ) | ||||||
Cash and cash equivalents, beginning of period | 72,936 | 23,129 | 57,829 | ||||||||
Cash and cash equivalents, end of period | $ | 71,825 | $ | 72,936 | $ | 23,129 | |||||
Supplemental disclosure of cash flow information: | |||||||||||
Cash (received) paid for income taxes | $ | (4,695 | ) | $ | 32 | $ | (633 | ) | |||
Cash paid for interest | $ | (17,646 | ) | $ | — | $ | — | ||||
Non-cash increase in estimated cost of construction of a building under a build-to-suit lease | $ | 2,700 | $ | — | $ | — | |||||
The accompanying notes are an integral part of these consolidated statements.
62
THE ADVISORY BOARD COMPANY AND SUBSIDIARIES
NOTES TO CONSOLIDATED FINANCIAL STATEMENTS
Note 1. | Business description |
The Advisory Board Company (individually and collectively with its subsidiaries, the “Company”) provides best practices research and insight, performance technology software, data- and tech-enabled services, and consulting and management services, through discrete programs to hospitals, health systems, independent medical groups, pharmaceutical and biotechnology companies, health care insurers, medical device companies, and colleges, universities, and other health care-focused organizations and educational institutions. Members of each subscription-based membership program are typically charged a separate fixed annual fee and have access to an integrated set of services that may include best practices research studies, executive education, proprietary content databases and online tools, daily online executive briefings, original executive inquiry services, cloud-based software applications, data- and tech-enabled services, and consulting and management services.
Note 2. | Summary of significant accounting policies |
Basis of presentation and consolidation
The consolidated financial statements include the accounts of the Company and its wholly-owned subsidiaries. The Company uses the equity method to account for equity investments in instances in which it owns common stock or securities deemed to be in-substance common stock and has the ability to exercise significant influence, but not control, over the investee and for all investments in partnerships or limited liability companies where the investee maintains separate capital accounts for each investor. Investments in which the Company holds securities that are not in-substance common stock, or holds common stock or in-substance common stock but has little or no influence over the investee are accounted for using the cost method. All significant intercompany transactions and balances have been eliminated.
Fiscal year
The Company changed its fiscal year to the calendar twelve months ending December 31, effective beginning with the period ended on December 31, 2014. As a result, the previous fiscal period was shortened from twelve months to a nine-month transition period ended on December 31, 2014. In these consolidated statements, including the notes thereto, the previous period financial results ended December 31, 2014 are for a nine-month period. Audited results for the twelve months ended December 31, 2015 and March 31, 2014 are both for twelve-month periods. All references herein to a fiscal year prior to December 31, 2014 refer to the twelve months ended March 31 of such year.
Correction of prior period financial statements
During the three months ended December 31, 2015, the Company identified errors related to prior periods. The effect of the errors in the prior periods was not material to the Company in any of those periods; however, an adjustment to correct the aggregate amount of the prior period errors would have been material to the Company’s current year statement of income. The Company has applied the guidance for accounting changes and error correction and has corrected these errors for all prior periods presented by revising the consolidated financial statements and other financial information included herein. Beginning retained earnings as of April 1, 2013 has been increased by $1.9 million for the cumulative effect of the errors corrected. Periods not presented herein will be revised, as applicable, as they are included in future financial statements. These errors were attributable to the items described below.
Timing of contingent revenue recognition
The Company did not properly identify and account for customer cancellation provisions and contingent fee arrangements. As a result, revenue was not recognized in the correct periods. The adjustments to revenue and associated tax effects are included in the tables below.
Software cost capitalization and related amortization
The Company did not properly capitalize and amortize costs related to software development. As a result, capitalized software development costs and associated amortization were not recognized in the correct periods. The adjustments to costs of services, excluding depreciation and amortization, as well as depreciation and amortization and associated tax impacts are included in the tables below.
63
Income tax adjustments
The Company did not properly account for excess tax benefits associated with stock option exercises and further identified errors in its deferred tax balances. These adjustments related to periods prior to the year ended March 31, 2012 and are reflected in the tables below as a correction to beginning stockholders’ equity as of April 1, 2011.
Other errors
In connection with the restatement, other, immaterial errors were corrected.
Nine Months Ended December 31, 2014 | ||||||||
As reported | Adjustments | As adjusted | ||||||
Income statement: | ||||||||
Revenue | 436,228 | (2,226 | ) | 434,002 | ||||
Cost of services, excluding depreciation and amortization | 230,169 | 600 | 230,769 | |||||
Depreciation and amortization | 29,994 | 323 | 30,317 | |||||
Operating income | 17,252 | (3,149 | ) | 14,103 | ||||
Income before provision for income taxes and equity in loss of unconsolidated entities | 15,925 | (3,149 | ) | 12,776 | ||||
Provision for income taxes | (4,831 | ) | 1,301 | (3,530 | ) | |||
Net income before allocation to noncontrolling interest | 4,554 | (1,848 | ) | 2,706 | ||||
Net loss attributable to common stockholders | (1,699 | ) | (1,848 | ) | (3,547 | ) | ||
Earnings per share: | ||||||||
Net loss attributable to common stockholders per share — basic | (0.05 | ) | (0.05 | ) | (0.10 | ) | ||
Net loss attributable to common stockholders per share — diluted | (0.05 | ) | (0.05 | ) | (0.10 | ) | ||
Comprehensive loss | (76 | ) | (1,848 | ) | (1,924 | ) | ||
Statement of cash flows: | ||||||||
Net income before allocation to noncontrolling interest | 4,554 | (1,848 | ) | 2,706 | ||||
Depreciation and amortization | 29,994 | 323 | 30,317 | |||||
Deferred income taxes | (1,083 | ) | (1,300 | ) | (2,383 | ) | ||
Deferred revenue | 78,160 | 2,226 | 80,386 | |||||
Net cash provided by operating activities | 65,172 | (599 | ) | 64,573 | ||||
Purchases of property and equipment | (48,134 | ) | 599 | (47,535 | ) | |||
Net cash provided by investing activities | 29,252 | 599 | 29,851 | |||||
64
Fiscal Year Ended March 31, 2014 | ||||||||
As reported | Adjustments | As adjusted | ||||||
Income statement: | ||||||||
Revenue | 520,596 | (1,167 | ) | 519,429 | ||||
Cost of services, excluding depreciation and amortization | 272,523 | (600 | ) | 271,923 | ||||
Depreciation and amortization | 30,420 | 664 | 31,084 | |||||
Operating income | 47,186 | (1,231 | ) | 45,955 | ||||
Income before provision for income taxes and equity in loss of unconsolidated entities | 49,892 | (1,231 | ) | 48,661 | ||||
Provision for income taxes | (19,208 | ) | 471 | (18,737 | ) | |||
Net income before allocation to noncontrolling interest | 24,633 | (760 | ) | 23,873 | ||||
Net income attributable to common stockholders | 24,752 | (760 | ) | 23,992 | ||||
Earnings per share: | ||||||||
Net income attributable to common stockholders per share — basic | 0.69 | (0.02 | ) | 0.67 | ||||
Net income attributable to common stockholders per share — diluted | 0.67 | (0.02 | ) | 0.65 | ||||
Comprehensive income | 21,950 | (760 | ) | 21,190 | ||||
Statement of cash flows: | ||||||||
Net income before allocation to noncontrolling interest | 24,633 | (760 | ) | 23,873 | ||||
Depreciation and amortization | 30,420 | 664 | 31,084 | |||||
Deferred income taxes | 7,795 | (471 | ) | 7,324 | ||||
Deferred revenue | 72,137 | 1,167 | 73,304 | |||||
Net cash provided by operating activities | 76,702 | 600 | 77,302 | |||||
Purchases of property and equipment | (44,058 | ) | (600 | ) | (44,658 | ) | ||
Net cash used in investing activities | (125,578 | ) | (600 | ) | (126,178 | ) | ||
As of December 31, 2014 | ||||||||
As reported | Adjustments | As adjusted | ||||||
Balance sheet: | ||||||||
Prepaid expenses and other current assets | 23,254 | 61 | 23,315 | |||||
Total current assets | 664,660 | 61 | 664,721 | |||||
Property and equipment, net | 135,107 | (784 | ) | 134,323 | ||||
Total assets | 1,126,366 | (723 | ) | 1,125,643 | ||||
Deferred revenue, current | 501,785 | 3,944 | 505,729 | |||||
Total current liabilities | 614,142 | 3,944 | 618,086 | |||||
Total liabilities | 806,315 | 1,518 | 807,833 | |||||
Deferred income taxes, net of current portion | 9,855 | (2,426 | ) | 7,429 | ||||
Additional paid-in capital | 442,528 | (1,304 | ) | 441,224 | ||||
Accumulated deficit | (122,920 | ) | (937 | ) | (123,857 | ) | ||
Total stockholders’ equity | 320,051 | (2,241 | ) | 317,810 | ||||
Total liabilities and stockholders’ equity | 1,126,366 | (723 | ) | 1,125,643 | ||||
Use of estimates in preparation of consolidated financial statements
The Company’s consolidated financial statements are prepared in accordance with accounting principles generally accepted in the United States of America (“GAAP”). These accounting principles require the Company to make certain estimates, judgments, and assumptions. For cases where the Company is required to make certain estimates, judgments, and assumptions, the Company believes that the estimates, judgments, and assumptions upon which it relies are reasonable based
65
upon information available to the Company at the time that these estimates, judgments, and assumptions are made. These estimates, judgments, and assumptions can affect the reported amounts of assets and liabilities as of the date of the financial statements as well as the reported amounts of revenue and expenses during the periods presented. To the extent there are material differences between these estimates, judgments, or assumptions and actual results, the Company’s financial statements will be affected. The Company’s estimates, judgments, and assumptions may include: estimates of bad debt reserves; estimates to establish employee bonus and commission accruals; estimates of the fair value of contingent earn-out liabilities; estimates of the useful lives of acquired or internally developed intangible assets; estimates of the fair value of goodwill and intangibles and evaluation of impairment; determination of when investment impairments are other-than-temporary; estimates of the recoverability of deferred tax assets; and estimates of the potential for future tax consequences of events that have been recognized in the Company’s financial statements or tax returns.
Cash equivalents and marketable securities
Included in cash equivalents are marketable securities with original maturities of three months or less at purchase. Investments with original maturities of more than three months were classified as marketable securities. The Company did not hold any marketable securities as of December 31, 2015. All marketable securities held as of December 31, 2014 were classified as current as they were expected to be liquidated within the next twelve months, regardless of their contractual maturity dates. The Company’s marketable securities, which were classified as available-for-sale, were carried at fair value based on quoted market prices. The net unrealized gains and losses on available-for-sale marketable securities were excluded from net income attributable to common stockholders and were included within accumulated other comprehensive income, net of tax. The specific identification method was used to compute the realized gains and losses on the sale of marketable securities.
Allowance for uncollectible revenue
The Company’s ability to collect outstanding receivables from its members has an effect on the Company’s operating performance and cash flows. The Company records an allowance for uncollectible revenue as a reduction of revenue based on its ongoing monitoring of members’ credit and the aging of receivables. To determine the allowance for uncollectible revenue, the Company examines its collections history, the age of accounts receivable in question, any specific member collection issues that have been identified, general market conditions, and current economic trends. Membership fees receivable balances are not collateralized.
Property and equipment
Property and equipment consists of leasehold improvements, furniture, fixtures, equipment, capitalized internal use software development costs, and acquired developed technology. Property and equipment is stated at cost, less accumulated depreciation and amortization. In certain membership programs, the Company provides software applications under a hosting arrangement where the software application resides on the Company’s or its service providers’ hardware. The members do not take delivery of the software and receive access to the software only during the term of their membership agreement.
Software development costs that are incurred in the preliminary project stage for internal use software are expensed as incurred. During the development stage, direct consulting costs and payroll and payroll-related costs for employees that are directly associated with each project are capitalized and amortized over the estimated useful life of the software once it is placed into operation. Internally developed capitalized software is classified as software within property and equipment and is amortized using the straight-line method over its estimated useful life, which is generally five years. Replacements and upgrades and enhancements to existing systems that result in additional functionality are capitalized, while maintenance and repairs are charged to expense as incurred. Amortization expense for internally developed capitalized software for the year ended December 31, 2015, recorded in depreciation and amortization on the consolidated statements of operations, was approximately $18.9 million. Amortization expense for internally developed capitalized software for the nine months ended December 31, 2014 and the fiscal year ended March 31, 2014, recorded in depreciation and amortization on the consolidated statements of operations, was approximately $10.1 million and $9.4 million, respectively.
Acquired developed software represents the fair value of software acquired through a business combination that resides on the Company’s or its service providers’ hardware and is made available to members though the memberships. Amortization for acquired developed software is included in depreciation and amortization on the consolidated statements of operations. Acquired developed software is amortized over a weighted average estimated useful life of eight years based on the cash flow estimate used to determine the value of the intangible asset at its acquisition. The amount of acquired developed software amortization included in depreciation and amortization for the year ended December 31, 2015 was approximately $9.4 million. The amount of acquired developed software amortization included in depreciation and amortization for the nine months ended December 31, 2014 and the fiscal year ended March 31, 2014 was approximately $2.0 million and $1.7 million, respectively.
66
Furniture, fixtures, and equipment are depreciated using the straight-line method over the estimated useful lives of the assets, which range from three to seven years. Leasehold improvements are depreciated using the straight-line method over the shorter of the estimated useful lives of the assets or the lease term. There are no capital leases included in property and equipment. The amount of depreciation expense recognized on plant, property, and equipment for the year ended December 31, 2015 was approximately $20.4 million. The amount of depreciation expense recognized on plant, property, and equipment for the nine months ended December 31, 2014 and the fiscal year ended March 31, 2014 was approximately $10.9 million and $12.0 million, respectively.
The Company establishes assets and liabilities (financing obligations) for the estimated construction costs incurred under build-to-suit lease arrangements where the Company is considered the owner for accounting purposes only, to the extent the Company is involved in the design or construction of the asset or takes construction risk prior to commencement of a lease. The Company will begin recognizing expense on a portion of future lease payments that were estimated to represent the underlying land lease. The Company records an asset for the amount of the total project costs in construction in progress in property and equipment, net and the related financing obligation, representative of the project costs incurred by the developer, in financing obligations on the consolidated balance sheet. Upon completion of the construction of facilities under build-to-suit leases, the Company evaluates whether these arrangements meet the criteria for sale-leaseback accounting treatment. If the lease does not meet sale-leaseback criteria, the Company will treat the build-to-suit as a financing obligation and lease payments will be attributed to (1) a reduction of the principal financing obligation; (2) imputed interest expense; and (3) land lease expense (which is considered an operating lease) representing an imputed cost to lease the underlying land of the facility. In addition, the underlying building asset will be depreciated over the building’s estimated useful life. At the conclusion of the lease term, the net book values of the asset and financing obligation would be derecognized.
Business combinations
The Company records acquisitions using the purchase method of accounting. All of the assets acquired, liabilities assumed, contractual contingencies, and contingent consideration are recognized at their fair value on the acquisition date. All subsequent changes to the acquired assets or assumed liabilities of the acquired company at the acquisition date that occur both within the measurement period and as a result of facts and circumstances that existed at the acquisition date are recognized as an adjustment to goodwill. Any acquired in-process research and development is capitalized as an intangible asset and amortized over its estimated useful life. Acquisition-related costs are recorded as expenses in the consolidated financial statements. The results of operations of acquired businesses are included in the consolidated financial statements from the acquisition date.
Goodwill and other intangible assets
The excess cost of an acquisition over the fair value of the net assets acquired is recorded as goodwill. The primary factors that generate goodwill are the value of synergies between the acquired entities and the Company and the acquired assembled workforce, neither of which qualifies as an identifiable intangible asset. The Company’s goodwill and other intangible assets with indefinite lives are not amortized, but rather tested for impairment on an annual basis on October 1, or more frequently if events or changes in circumstances indicate potential impairment.
When testing goodwill for impairment, the Company has the option to first assess qualitative factors to determine whether the existence of events or circumstances leads to a determination that it is more likely than not that the estimated fair value of a reporting unit is less than its carrying amount. If the Company elects to perform a qualitative assessment and determines that an impairment is more likely than not, the Company is then required to perform the two-step quantitative impairment test, otherwise no further analysis is required. The Company also may elect not to perform the qualitative assessment and, instead, proceed directly to the two-step quantitative impairment test.
In the first step of the two-step quantitative impairment test, the fair value of a reporting unit is compared to its carrying value. If the carrying value of a reporting unit exceeds its fair value, the second step of the impairment test is performed for purposes of measuring the impairment. In the second step, the fair value of the reporting unit is allocated to all of the assets and liabilities of the reporting unit to determine an implied goodwill value. If the carrying amount of the reporting unit’s goodwill exceeds the implied fair value of goodwill, an impairment loss is recognized in an amount equal to that excess.
The Company estimates the fair value of its reporting units using both an income and market approach. The income approach is based on the present value of expected future cash flows, including terminal value, utilizing a market-based weighted average cost of capital (“WACC”) determined separately for each reporting unit. The determination of fair value using the income approach involves the use of significant estimates and assumptions, including revenue growth rates, operating margins, capital expenditures, working capital requirements, tax rates, terminal growth rates, discount rates and benefits associated with a taxable transaction. The market approach is based on revenue and earnings multiple data of peer companies. See Note 8, “Goodwill and intangibles,” for further detail including the recognition of goodwill impairment charges of $99.1 million during the year ended December 31, 2015.
67
Other intangible assets consist of capitalized software for sale and acquired intangibles. The Company capitalizes consulting costs and payroll and payroll-related costs for employees directly related to building a software product for sale once technological feasibility is established. The Company determines that technological feasibility is established by the completion of a detailed program design or, in its absence, completion of a working model. Once the software product is ready for general availability, the Company ceases capitalizing costs and begins amortizing the intangible asset on a straight-line basis over its estimated useful life. The weighted average estimated useful life of capitalized software for sale is five years. Other intangible assets include those assets that arise from business combinations and that consist of developed technology both for internal use and external sale, non-competition covenants, trademarks, contracts, and customer relationships that are amortized, on a straight-line basis, over two years to seventeen years. Finite-lived intangible assets are required to be amortized over their useful lives and are evaluated for possible impairment whenever events or changes in circumstances indicate that the carrying amount of the assets may not be recoverable.
Recovery of long-lived assets (excluding goodwill)
The Company records long-lived assets, such as property and equipment, at cost. The carrying value of long-lived assets is reviewed for possible impairment whenever events or changes in circumstances suggest the carrying value of a long-lived asset may not be fully recoverable. The test for recoverability is made using an estimate of the undiscounted expected future cash flows and, if required, the impairment loss is measured as the amount that the carrying value of the asset exceeds the asset’s fair value if the asset is not recoverable. The Company considers expected cash flows and estimated future operating results, trends, and other available information in assessing whether the carrying value of assets is impaired. If it is determined that an asset’s carrying value is impaired, a write-down of the carrying value of the identified asset will be recorded as an operating expense on the consolidated statements of operations in the period in which the determination is made.
Fair value of financial instruments
The Company’s short-term financial instruments include cash and cash equivalents, membership fees receivable, accrued expenses, and accounts payable. The carrying value of these financial instruments as of December 31, 2015 and December 31, 2014 approximates their fair value due to their short-term nature. The Company’s marketable securities consisted of U.S. government-sponsored enterprise obligations and various state tax-exempt notes and bonds were classified as available-for-sale and are carried at fair market value based on quoted market prices.
Derivative instruments
The Company holds warrants to purchase common stock in an entity that meet the definition of a derivative. Derivative instruments are carried at fair value on the consolidated balance sheets. Gains or losses from changes in the fair value of the warrants are recognized on the consolidated statements of operations in the period in which they occur.
The Company uses interest rate swaps to manage interest rate risk. The fair values of interest rate swaps are determined using the market standard methodology of discounting the future variable cash payments, or receipts, over the life of the agreements. The Company has designated the interest rate swap as a cash flow hedge of the variability of interest payments under its senior secured term loan facility due to changes in the benchmark interest rate. If, at any time, the swap is determined to be ineffective, in whole or in part, due to changes in the interest rate swap or underlying debt agreements, the fair value of the portion of the swap determined to be ineffective will be recognized as a gain or loss in the consolidated statement of operations for the applicable period.
Revenue recognition
Revenue is recognized when (1) there is persuasive evidence of an arrangement, (2) the fee is fixed or determinable, (3) services have been rendered and payment has been contractually earned, and (4) collectibility is reasonably assured. Fees are generally billable when a letter of agreement is signed by the member, and fees receivable during the subsequent twelve-month period and related deferred revenue are recorded upon the commencement of the membership or collection of fees, if earlier. In many of the Company’s higher priced programs and membership agreements with terms that are greater than one year, fees may be billed on an installment basis. In certain multi-year arrangements, the member has the ability to cancel the arrangement within a defined notice period without penalty.
The Company’s membership programs generally include more than one deliverable. Deliverables are determined based upon the availability and delivery method of the services and may include: best practices research; executive education curricula; cloud-based content, databases, and calculators; performance or benchmarking reports; diagnostic tools; interactive advisory support; and performance technology software. Access to such deliverables is generally available on an unlimited basis over the membership period. When an agreement contains multiple deliverables, the Company reviews the deliverables to determine if they qualify as separate units of accounting. In order for deliverables in a multiple-deliverable arrangement to be treated as separate units of accounting, the deliverables must have standalone value upon delivery, and delivery or performance
68
of undelivered items in an arrangement with a general right of return must be probable. If the Company determines that there are separate units of accounting, arrangement consideration at the inception of the membership period is allocated to all deliverables based on the relative selling price method in accordance with the selling price hierarchy. Because of the unique nature of the Company’s products, neither vendor specific objective evidence nor third-party evidence is available. Therefore, the Company utilizes best estimate of selling price to allocate arrangement consideration in multiple element arrangements.
In general, the deliverables in membership programs do not qualify as separate units of accounting. These deliverables are consistently available throughout the membership period, and, as a result, the consideration is recognized ratably over the membership period. When a service offering includes a combination of unlimited and limited service offerings, revenue is recognized over the appropriate service period, either ratably, if the service is consistently available, or, if the service is not consistently available, upon the earlier of the delivery of the service or the completion of the membership period, provided that all other criteria for recognition have been met.
Certain membership programs incorporate hosted performance technology software. In many of these agreements, members are charged set-up fees in addition to subscription fees for access to the hosted cloud-based software and related membership services. Both set-up fees and subscription fees are recognized ratably over the term of the membership agreement, which is generally three years, and is consistent with the pattern of the delivery of services under these arrangements. Upon launch of a new program that incorporates software, all program revenue is deferred until the program is generally available for release to the Company’s membership, and then recognized ratably over the remainder of the contract term of each agreement.
Certain arrangements include performance-based fees that are contingent upon the member realizing a benefit over a defined period. These performance-based fees are recognized at the end of the measurement period when the benefit is realized by the member. The Company has not recognized any revenue that is at risk due to future performance contingencies.
The Company also performs professional services sold under separate agreements that include consulting and management services. These agreements are either fixed fee or time-and-materials arrangements. For fixed fee arrangements, the Company recognizes professional services revenues using the proportional performance method based on effort expended. The Company recognizes professional services revenues for time-and-materials arrangements as services are rendered based on contractual rates.
For arrangements in which a customer purchases multiple membership programs or purchases a membership program together with consulting and management services, each program and professional services arrangement is generally considered a separate unit of accounting, and arrangement consideration is allocated based on the Company’s best estimate of selling price. The Company develops its best estimate of selling price by considering pricing practices, margin, competition, and geographies in which the Company offers its products and services.
Deferred incentive compensation and other charges
Incentive compensation to employees related to the negotiation of new and renewal memberships, license fees to third-party vendors for tools, data, and software incorporated in specific memberships that include performance technology software, and other direct and incremental costs associated with specific memberships are deferred and amortized over the term of the related memberships.
Deferred compensation plan
The Company has a Deferred Compensation Plan (the “Plan”) for certain employees to provide an opportunity to defer compensation on a pre-tax basis. The Plan provides for deferred amounts to be credited with investment returns based upon investment options selected by participants from alternatives designated from time to time by the plan administrative committee. Investment earnings associated with the Plan’s assets are included in other income, net while changes in individual participant account balances are recorded as compensation expense in the consolidated statements of operations. The Plan also allows the Company to make discretionary contributions at any time based on individual or overall Company performance, which may be subject to a different vesting schedule than elective deferrals, and provides that the Company may make contributions in an amount equal to the amount of any 401(k) plan matching contribution that is not credited to the participant’s 401(k) account due to such employee's participation in the Plan. The Company did not make any discretionary contributions to the Plan in the year ended December 31, 2015, in the nine months ended December 31, 2014, or the fiscal year ended March 31, 2014. The income earned and expense incurred related to the Plan was immaterial for the year ended December 31, 2015, the nine months ended December 31, 2014, and the fiscal year ended March 31, 2014.
Operating leases
The Company recognizes rent expense under operating leases on a straight-line basis over the non-cancelable term of the lease, including free-rent periods. Lease incentives relating to allowances provided by landlords are amortized over the term of the lease as a reduction of rent expense. The Company recognizes sublease income on a straight-line basis over the term of the
69
sublease, including free rent periods and escalations, as a reduction of rent expense. Costs associated with acquiring a subtenant, including broker commissions and tenant allowances, are amortized over the sublease term as a reduction of sublease income.
Stock-based compensation
The Company has several stock-based compensation plans which are described more fully in Note 14, “Stock-based compensation.” These plans provide for the granting of stock options and restricted stock units (“RSUs”) to employees, non-employee members of the Company’s Board of Directors and any other service providers who have been retained to provide consulting, advisory, or other services to the Company. Stock-based compensation cost is measured at the grant date of the stock-based awards based on their fair values, and is recognized as an expense in the consolidated statements of operations over the vesting periods of the awards. The fair value of RSUs, with the exception of RSUs issued with both performance and market-based conditions, is determined as the fair market value of the underlying shares on the date of grant. The fair value of RSUs issued with market-based conditions is calculated on the date of grant using a Monte Carlo option-pricing model. The Company calculates the fair value of all stock option awards, with the exception of the stock options issued with market-based conditions, on the date of grant using the Black-Scholes model. The fair value of stock options issued with market-based conditions is calculated on the date of grant using a Monte Carlo option-pricing model. Forfeitures are estimated based on historical experience at the time of grant and adjusted, if necessary, in subsequent periods if actual forfeitures differ from those estimates. The Company bases its fair value estimates on assumptions it believes to be reasonable but that are inherently uncertain.
For awards with performance conditions, the probability of achieving performance conditions and estimated time to achieve such performance conditions are measured at each reporting period and are used to determine when and in what amount to recognize stock-based awards with performance conditions.
Other (expense) income, net
Other expense, net for the year ended December 31, 2015 includes a $3.6 million loss on the Company's investment in preferred stock and common stock warrants of a private company, as described in Note 9, “Other non-current assets,” and a foreign exchange rate loss of $2.9 million. Other income, net for the nine months ended December 31, 2014 includes $1.1 million of interest income earned from the Company’s marketable securities, a $1.7 million loss on foreign exchange rates, $0.5 million in credit facility fees, $0.1 million realized loss on sale of marketable securities, and a $0.2 million loss on the Company's investment in common stock warrants. Other income, net for the fiscal year ended March 31, 2014 includes $3.3 million of interest income earned from the Company’s marketable securities, a $0.2 million loss on foreign exchange rates, $0.6 million in credit facility fees, and a $0.2 million realized gain on sale of marketable securities.
Income taxes
Deferred income taxes are determined using the asset and liability method. Under this method, temporary differences arise as a result of the difference between the reported amounts of assets and liabilities and their tax bases. Deferred tax assets are reduced by a valuation allowance when, in the opinion of management, it is more likely than not that some portion or the entire deferred tax asset will not be realized. Deferred tax assets and liabilities are adjusted for the effects of changes in tax law and tax rates on the date of the enactment of the change.
Concentrations of risk
Financial instruments that potentially subject the Company to concentrations of credit risk consist principally of membership fees receivable, cash and cash equivalents, and marketable securities. The credit risk with respect to membership fees receivable is generally diversified due to the large number of entities constituting the Company’s membership base, and the Company establishes allowances for potential credit losses. No one member accounted for more than 1.5% of revenue for any period presented. The Company maintains cash and cash equivalents and marketable securities with financial institutions, which may at times exceed federally insured limits.
In the year ended December 31, 2015, the Company generated approximately 2.4% of revenue from members outside the United States. In the nine months ended December 31, 2014 and the fiscal year ended March 31, 2014, the Company generated approximately 3.9% and 3.2% of revenue, respectively, from members outside the United States. The Company’s international operations subject the Company to risks related to currency exchange fluctuations. Prices for the Company’s services sold to members located outside the United States are sometimes denominated in local currencies. Increases or decreases in the value of the U.S. dollar against local currencies in countries where the Company has members may result in a foreign exchange gain or loss recognized by the Company. Such foreign exchange gains or losses are included in other (expenses) income, net in the consolidated statement of operations.
70
Earnings per share
Basic earnings per share is computed by dividing net income attributable to common stockholders by the number of weighted average common shares outstanding during the period. Diluted earnings per share (“diluted EPS”) is computed by dividing net income attributable to common stockholders by the number of weighted average common shares increased by the dilutive effects of potential common shares outstanding during the period. The number of potential common shares outstanding is determined in accordance with the treasury stock method, using the Company’s prevailing tax rates. Certain potential common share equivalents were not included in the computation because their effect was anti-dilutive.
A reconciliation of basic to diluted weighted average common shares outstanding is as follows (in thousands):
Year Ended December 31, | Nine Months Ended December 31, | Year Ended March 31, | ||||||
2015 | 2014 | 2014 | ||||||
Basic weighted average common shares outstanding | 41,888 | 36,213 | 35,909 | |||||
Effect of dilutive outstanding stock-based awards | — | — | 1,050 | |||||
Diluted weighted average common shares outstanding | 41,888 | 36,213 | 36,959 | |||||
In the year ended December 31, 2015, the nine months ended December 31, 2014, and the fiscal year ended March 31, 2014, 2.7 million shares, 2.6 million shares, and 1.0 million shares, respectively, related to share-based compensation awards have been excluded from the calculation of the effect of dilutive outstanding stock-based awards shown above because their effect was anti-dilutive.
Recent accounting pronouncements
Changes to GAAP are established by the Financial Accounting Standards Board (“FASB”) in the form of accounting standards updates (“ASUs”) to the FASB’s Accounting Standards Codification. The Company considers the applicability and impact of all recent ASUs. ASUs not identified below were assessed and determined to be not applicable or are expected to have an immaterial impact on the Company’s consolidated financial position and results of operations.
Recently adopted
In November 2015, the FASB issued guidance on the presentation of deferred taxes. The new guidance requires entities to separately present deferred tax assets and liabilities as noncurrent in a classified balance sheet. The guidance is effective for fiscal years beginning after December 15, 2016, with early adoption permitted. During the three months ended December 31, 2015, the Company elected early adoption of this standard and applied the changes prospectively. As a result, prior periods have not been adjusted to reflect this change. The adoption did not have a material effect on the Company’s consolidated financial position and results of operations.
Recently issued
In May 2014, the FASB issued accounting guidance related to revenue recognition. The new standard supersedes most of the existing revenue recognition guidance under GAAP, and requires revenue to be recognized when goods or services are transferred to a customer in an amount that reflects the consideration a company expects to receive. The new standard may require more judgment and estimates relating to the recognition of revenue, which could result in additional disclosures to the financial statements. The original effective date of the new standard was for annual and interim reporting periods beginning after December 15, 2016. In July 2015, the FASB decided to defer by one year the effective date of this new revenue recognition standard. As a result, the new standard will be effective for annual and interim reporting periods beginning after December 15, 2017, with an option that permits companies to adopt the standard as early as the original effective date. Early application prior to the original effective date is not permitted. The Company plans to adopt this standard on January 1, 2018. The Company is currently evaluating the effect that the updated standard will have on its consolidated financial statements and related disclosures and has not yet selected a transition method.
In June 2014, the FASB issued accounting guidance related to share-based payments when the terms of an award provide that a performance target could be achieved after the requisite service period. This guidance clarifies that entities should treat performance targets that can be met after the requisite service period of a share-based payment award as performance conditions that affect vesting. The standard is effective for fiscal years beginning after December 15, 2015. The Company does not expect the adoption of this guidance to have a material effect on its consolidated financial statements.
In August 2014, the FASB issued Accounting Standards Update 2014-15, Presentation of Financial Statements - Going Concern (Subtopic 205-40). This ASU requires management to assess an entity’s ability to continue as a going concern by
71
incorporating and expanding upon certain principles that are currently in U.S. auditing standards. It requires an assessment for a period of one year after the date on which the financial statements are issued. Further, based on certain conditions and circumstances, additional disclosures may be required. This ASU is effective beginning with the first annual period ending after December 15, 2016, and for all annual and interim periods thereafter. Early application is permitted. The Company does not expect this ASU to have an impact on the Company’s consolidated financial statements or related disclosures.
In February 2015, the FASB issued guidance on amendments to the consolidation analysis. The new guidance requires management to reevaluate all legal entities under a revised consolidation model that will (i) modify the evaluation of whether limited partnership and similar legal entities are variable interest entities (“VIEs”), (ii) eliminate the presumption that a general partner should consolidate a limited partnership, (iii) affect the consolidation analysis of reporting entities that are involved with VIEs, particularly those that have fee arrangements and related party relationships, and (iv) provide a scope exception from consolidation guidance for reporting entities with interests in legal entities that are required to comply with or operate in accordance with requirements that are similar to those in Rule 2a-7 under the Investment Company Act of 1940 for registered money market funds. The guidance is effective for annual reporting and interim periods beginning after December 15, 2015, with early adoption permitted. The Company does not expect the adoption of this guidance to have a material effect on its consolidated financial statements.
In April 2015, the FASB issued guidance on the presentation of debt issuance costs. The new standard requires that debt issuance costs related to a recognized debt liability be presented in the balance sheet as a direct deduction from the carrying amount of that debt liability, consistent with debt discounts. The guidance is effective for annual reporting and interim periods beginning after December 15, 2015, with early adoption permitted. The Company does not expect the adoption of this guidance to have a material effect on its consolidated financial statements.
In September 2015, the FASB issued new guidance that eliminates the requirement to restate prior period financial statements for measurement period adjustments following a business combination. The new guidance requires that the cumulative impact of a measurement period adjustment (including the impact on prior periods) be recognized in the reporting period in which the adjustment is identified. The prior period impact of the adjustment should be either presented separately on the face of the income statement or disclosed in the notes to the financial statements. The guidance is effective for annual reporting and interim periods beginning after December 15, 2015. The Company does not expect the adoption of this guidance to have a material effect on its consolidated financial statements.
In February 2016, the FASB issued accounting guidance relating to leases. The guidance requires that lessees recognize assets and liabilities on the balance sheet for the rights and obligations created by all leases with terms of more than 12 months. The new guidance also requires disclosures designed to give financial statement users information on the amount, timing, and uncertainty of cash flows arising from leases. These disclosures include qualitative and quantitative information. The guidance is effective for annual reporting and interim periods beginning after December 15, 2018, with early adoption permitted. The Company is currently evaluating the impact of the new guidance on its consolidated financial statements.
Note 3. | Acquisitions |
Increasing service to members through the introduction and expansion of new programs is a key component of the Company's growth strategy. From time to time the Company supplements its organic new program development efforts with acquisitions that allow it to introduce new programs and services to its members, or that complement and enhance the value of existing programs through the addition of new capabilities.
Royall Acquisition Co.
On January 9, 2015, the Company completed the acquisition of all of the issued and outstanding capital stock of Royall Acquisition Co. (together with its subsidiaries, “Royall”) from Royall Holdings, LLC (the “Seller”). Royall is a higher education market leader in strategic, data-driven student engagement and enrollment management solutions.
Total consideration consisted of the following (in thousands):
Net cash paid (1) | $ | 744,193 | |
Fair value of equity issued | 121,224 | ||
Total | $ | 865,417 | |
(1) Net of cash acquired of $7,065.
72
On January 9, 2015, in connection with the completion of the acquisition of Royall, the Company entered into credit facilities with various lenders. See Note 12, "Debt," for further details regarding these credit facilities.
The fair value of equity issued was approximately $121.2 million based on 2,428,364 shares of the Company's common stock valued at $49.92 per share, which was the closing price on January 9, 2015 as reported on the NASDAQ Global Select Market. The 2,428,364 shares issued to the Seller was the minimum number of shares that could have been issued under the pricing collar set forth in the purchase agreement, since the volume-weighted average trading price of the Company’s common stock on the NASDAQ Global Select Market for the 15 consecutive trading days ended on (and including) January 7, 2015 was higher than the pricing collar ceiling price of $41.18.
The total purchase price was allocated to the assets acquired, including intangible assets and liabilities assumed, based on their estimated fair values as of January 9, 2015. As of December 31, 2015, the Company had finalized the purchase price allocation.
The fair value and useful lives assigned to Royall’s trade name and customer relationships intangible assets have been estimated based on valuation studies utilizing widely accepted valuation methodologies and principles. Key assumptions in determining the fair value of these assets include expected future revenue, market-derived royalty rates, market-derived discount rates, and anticipated attrition rates.
The purchase price allocation for trade name and customer relationships is as follows (dollars in thousands):
Estimated average useful lives (years) | Estimated fair value | ||||
Trade name | 10 | $ | 10,000 | ||
Customer relationships | 17 | 252,000 | |||
Total | $ | 262,000 | |||
The fair value and useful lives assigned to Royall’s technology were based on valuation studies utilizing widely accepted valuation methodologies and principles. Key assumptions in determining the fair value of these assets include expected future revenue, market-derived royalty rates, market-derived discount rates, and anticipated economic useful lives. The technology is classified as software within property and equipment because the developed software application resides on the Company’s or its service providers’ hardware and members cannot take possession of the software.
The purchase price allocation to Royall's technology, included in property and equipment, net on the consolidated balance sheets, is as follows (dollars in thousands):
Estimated average useful lives (years) | Estimated fair value | ||||
Technology - database and analytics | 4 | $ | 13,000 | ||
Technology - developed software | 8 | 25,000 | |||
Total | $ | 38,000 | |||
73
A purchase price allocation resulting from the acquisition of Royall is set forth below (in thousands):
As of January 9, 2015 | ||||
Consideration paid for the acquisition | $ | 865,417 | ||
Allocated to: | ||||
Membership fees receivable, net | 29,239 | |||
Prepaid expenses and other current assets | 8,237 | |||
Property and equipment | 44,209 | |||
Intangible assets, net | 262,000 | |||
Deferred revenue, current | (18,300 | ) | ||
Accounts payable and accrued liabilities | (5,621 | ) | ||
Deferred income taxes, net of current portion | (102,599 | ) | ||
Fair value of net assets acquired | $ | 217,165 | ||
Allocation to goodwill | $ | 648,252 | ||
During the three months ended December 31, 2015, the Company finalized its accounting for income taxes related to the acquisition. The result was a $0.8 million increase to other current assets, $0.4 million increase to accrued liabilities, and a $5.1 million decrease to the net deferred tax liability recorded. The net impact was a $5.5 million reduction to goodwill. The impact of these changes related to accounting for income taxes was not material and was recognized entirely in the three months ended December 31, 2015.
During the three months ended June 30, 2015, the Company increased its estimate of the fair value of the acquired customer relationships by $17.0 million, resulting in a $10.0 million reduction in goodwill and a $7.0 million increase in the net deferred tax liability recorded. In addition, the Company refined its estimate of the useful lives of its customer relationship and developed software assets. The impact of these changes on amortization expense was not material and was recognized entirely in the three months ended June 30, 2015.
The goodwill is primarily attributable to the assembled workforce of Royall and synergies and economies of scale expected from combining the operations of the Company and Royall. Of the goodwill recognized, $61.4 million is deductible for tax purposes.
Acquisition-related costs of $9.9 million were incurred and included in general and administrative costs in the Company’s consolidated statements of operations. Of this amount, $3.3 million was recognized in the transition period ended December 31, 2014, and $6.6 million was recognized in the year ended December 31, 2015.
The year ended December 31, 2015 includes the operations of Royall for the period from January 9, 2015 through December 31, 2015. The condensed consolidated statements of operations for the year ended December 31, 2015 includes $102.8 million of revenues and $88.6 million of net loss (inclusive of a $99.1 million goodwill impairment charge, described in Note 8, “Goodwill and intangibles”), respectively, attributed to Royall.
The following table presents the Company’s pro forma consolidated revenues and net income (loss) attributable to common stockholders for the year ended December 31, 2015 and the nine months ended December 31, 2014. The unaudited pro forma results include the historical statements of operations information of the Company and of Royall, giving effect to the acquisition of Royall and related financing as if they had occurred on April 1, 2014. As described below under “Other 2015 Acquisition,” and “Transition Period Acquisitions,” the Company consummated certain other acquisitions during the year ended December 31, 2015 and the nine months ended December 31, 2014; however, the Company has not included the impact of these acquisitions in these pro forma results as their effect would not have been material.
The unaudited pro forma financial information presented below does not reflect the effect of any actual or anticipated synergies expected to result from the acquisition of Royall. Accordingly, the unaudited pro forma financial information is not necessarily indicative of the results of operations that would have been recognized had the acquisition of Royall and the related financing been effected on the assumed date.
74
The unaudited pro forma results are set forth below (in thousands):
Unaudited Pro Forma Results | ||||||||
Year Ended December 31, | Nine Months Ended December 31, | |||||||
2015 | 2014 | |||||||
Revenue | $ | 783,640 | $ | 502,319 | ||||
Net income (loss) attributable to common stockholders | (90,705 | ) | (29,962 | ) | ||||
For the year ended December 31, 2015 and the nine months ended December 31, 2014, the pro forma results, prepared in accordance with GAAP, include the following pro forma adjustments related to the acquisition of Royall:
(i) | an increase in non-recurring transaction expenses of $9.9 million in the nine months ended December 31, 2014 to reflect the assumption that the Royall acquisition occurred on April 1, 2014; |
(ii) | the elimination of $6.6 million of acquisition costs recorded in the year ended December 31, 2015 as these are now presented in the nine months ended December 31, 2014; |
(iii) | an increase in amortization expense related to the fair value of the identifiable intangible assets of $0.4 million in the year ended December 31, 2015 and $11.6 million in the nine months ended December 31, 2014; |
(iv) | a reduction in revenue of $12.5 million in the nine months ended December 31, 2014, representing the purchase accounting fair value effect to revenue the Company would have recognized during the year ended December 31, 2014 had the acquisition of Royall occurred on April 1, 2014 and an increase in revenue of $12.5 million in the year ended December 31, 2015, representing the purchase accounting fair value effect to revenue that was recognized in the year ended December 31, 2015; |
(v) | an increase in revenue of $2.8 million and an increase in expense of $1.7 million for the year ended December 31, 2015 for Royall's activity from January 1, 2015 to the January 9, 2015 acquisition date; |
(vi) | the elimination and replacement of the historical Royall interest expense with the interest expense from the Company's senior secured term credit facility totaling $19.9 million in the year ended December 31, 2015 and $13.6 million in the nine months ended December 31, 2014; |
(vii) | an increase in compensation expense related to the inducement equity awards issued to certain Royall employees totaling $0.1 million in the year ended December 31, 2015 and $4.4 million in the nine months ended December 31, 2014; |
(viii) | an increase in non-recurring loss on financing activities expenses of $17.4 million in the nine months ended December 31, 2014 to reflect the assumption that the Royall acquisition and related financings occurred during the nine months ended December 31, 2014; and |
(ix) | the elimination of $17.4 million of loss on financing activities recorded in the year ended December 31, 2015 as this is now presented in the corresponding period of 2014. |
Other 2015 Acquisition
Excluding the Royall acquisition discussed above, during the year ended December 31, 2015, the Company completed one additional acquisition qualifying as a business combination. The total cash purchase price of $2.5 million was allocated to identifiable assets acquired. The Company allocated $0.5 million to intangible assets with a weighted average amortization period of 3.0 years and $2.0 million to goodwill. The goodwill is deductible for tax purposes. This acquisition was not significant to the Company's consolidated results of operations.
75
Transition Period Acquisitions
During the nine months ended December 31, 2014, the Company completed three acquisitions qualifying as business combinations in exchange for aggregate net cash consideration of $71.3 million. The total purchase price has been allocated to identifiable assets acquired and liabilities assumed, including $16.6 million to intangible assets with a weighted average amortization period of 8.3 years and $57.5 million to goodwill, of which $33.9 million is tax deductible. The completed acquisitions in the nine months ended December 31, 2014, both individually and in the aggregate, were not significant to the Company's consolidated results of operations.
Fiscal 2014 Acquisitions
During the fiscal year ended March 31, 2014, the Company completed two acquisitions qualifying as business combinations in exchange for aggregate net cash consideration of $46.0 million. In the aggregate, the Company allocated $11.4 million to intangible assets with a weighted average amortization period of 7.4 years and $33.7 million to goodwill. The goodwill is not deductible for tax purposes. The completed acquisitions in the fiscal year ended March 31, 2014, both individually and in the aggregate, were not significant to the Company's consolidated results of operations.
Note 4. | Fair value measurements |
Financial assets and liabilities
The estimated fair values of financial instruments are determined based on relevant market information. These estimates involve uncertainty and cannot be determined with precision. The Company’s financial instruments consist primarily of cash, cash equivalents, marketable securities, and interest rate swaps. In addition, contingent earn-out liabilities resulting from business combinations are recorded at fair value. The following methods and assumptions are used to estimate the fair value of each class of financial assets or liabilities that are valued on a recurring basis.
Cash and cash equivalents. This includes all cash and liquid investments with an original maturity of three months or less from the date acquired. The carrying amount approximates fair value because of the short maturity of these instruments. Cash equivalents also consist of money market funds with fair values based on quoted market prices. The Company’s cash and cash equivalents are held at major commercial banks.
Marketable securities. The Company’s marketable securities, consisted of U.S. government-sponsored enterprise obligations and various state tax-exempt notes and bonds, were classified as available-for-sale and were carried at market value based on quoted market prices.
Contingent earn-out liabilities. This class of financial liabilities represents the Company’s estimated fair value of the contingent earn-out liabilities related to acquisitions based on probability assessments of certain performance achievements during the earn-out periods. Contingent earn-out liabilities expected to be paid out within the next twelve months are included in accrued liabilities on the consolidated balance sheets. Contingent earn-out liabilities expected to be paid out after the next twelve months are included in other long-term liabilities on the consolidated balance sheets.
Interest rate swaps. The Company uses interest rate swaps to manage interest rate risk. The fair values of interest rate swaps are determined using the market standard methodology of discounting the future variable cash payments, or receipts, over the life of the agreements. The variable interest rates used in the calculation of projected cash payments, or receipts, are based on observable market interest rate curves.
Measurements
Fair value is defined as the exchange price that would be received for an asset or paid to transfer a liability (an exit price) in the principal or most advantageous market for the asset or liability in an orderly transaction between market participants at the measurement date. The valuation can be determined using widely accepted valuation techniques, such as the market approach (comparable market prices) and the income approach (present value of future income or cash flow). As a basis for applying a market-based approach in fair value measurements, GAAP establishes a fair value hierarchy that prioritizes the inputs to valuation techniques used to measure fair value into three broad levels. The three levels are:
• | Level 1—Quoted prices in active markets for identical assets or liabilities. |
• | Level 2—Observable market-based inputs other than Level 1 inputs, such as quoted prices for similar assets or liabilities in active markets; quoted prices for similar or identical assets or liabilities in markets that are not active; or other inputs that are observable or can be corroborated by observable market data. |
• | Level 3—Unobservable inputs that are supported by little or no market activity, such as discounted cash flow methodologies. |
76
Assets and liabilities are classified based on the lowest level of input that is significant to the fair value measurements. The Company reviews the fair value hierarchy classification on a quarterly basis. Changes in the observability of valuation inputs may result in a reclassification of levels for certain securities within the fair value hierarchy. There were no significant transfers between Level 1, Level 2, or Level 3 during the year ended December 31, 2015 or for the nine months ended December 31, 2014.
The Company’s financial assets and liabilities subject to fair value measurements on a recurring basis and the necessary disclosures are as follows (in thousands):
Fair value as of | Fair value measurement as of December 31, 2015 using fair value hierarchy | ||||||||||||||
December 31, 2015 | Level 1 | Level 2 | Level 3 | ||||||||||||
Financial assets | |||||||||||||||
Cash and cash equivalents (1) | $ | 71,825 | $ | 71,825 | $ | — | $ | — | |||||||
Interest rate swaps (2) | 419 | — | 419 | — | |||||||||||
Financial liabilities | |||||||||||||||
Contingent earn-out liabilities (3) | 7,250 | — | — | 7,250 | |||||||||||
Fair value as of | Fair value measurement as of December 31, 2014 using fair value hierarchy | ||||||||||||||
December 31, 2014 | Level 1 | Level 2 | Level 3 | ||||||||||||
Financial assets | |||||||||||||||
Cash and cash equivalents (1) | $ | 72,936 | $ | 72,936 | $ | — | $ | — | |||||||
Available-for-sale marketable securities (2) | 14,714 | — | 14,714 | — | |||||||||||
Financial liabilities | |||||||||||||||
Contingent earn-out liabilities (3) | 12,946 | — | — | 12,946 | |||||||||||
—————————————
(1) | Fair value is based on quoted market prices. |
(2) | Fair value is determined using market standard models with observable inputs. |
(3) | This fair value measurement is based on unobservable inputs that are supported by little or no market activity and reflect the Company’s own assumptions in measuring fair value using the income approach. In developing these estimates, the Company considered certain performance projections, historical results, and general macro-economic environment and industry trends. |
Contingent earn-out liabilities
The Company’s fair value estimate of the earn-out liability related to the Company's acquisition of Southwind Health Partners, L.L.C. and Southwind Navigator, LLC (together, “Southwind”) in December 2009 was $5.6 million. The fair value of the Southwind earn-out liability was impacted by changes in the Company’s stock price and by changes in estimates regarding expected operating results through the end of the evaluation period, which was December 31, 2014. As of December 31, 2015, $20.4 million had been earned and paid in cash and shares to the former owners of the Southwind business. As of December 31, 2015, the estimated aggregate fair value of the remaining contingent obligation was $1.0 million.
The Company’s fair value estimate of the earn-out liability related to the Company’s acquisition of 360Fresh, Inc. (“360Fresh”) in November 2012 was $2.5 million. The Company paid $1.5 million in January 2015 satisfying its remaining obligation.
The Company's fair value estimate of the earn-out liability related to the Company's acquisition of Clinovations, LLC (“Clinovations”) in November 2014 was $4.5 million. The fair value of the Clinovations earn-out liability will be impacted by changes in estimates regarding expected operating results through the evaluation period, which ends on December 31, 2017. A portion of the earn-out liability will be paid in the form of the Company’s common stock. The maximum payout of the earn-out is $9.5 million, while the minimum is zero. Based on Clinovations' operating results, the contingent obligation for Clinovations as of December 31, 2015 was $2.2 million. The fair value of the Clinovations earn-out liability will also be impacted by changes in estimates of discount rates for each evaluation period, which vary from 7.4% to 8.3%, and the volatility of the Company stock, which was 30% as of December 31, 2015.
77
The Company's fair value estimate of the earn-out liability related to the Company's acquisition of ThoughtWright, LLC d/b/a GradesFirst (“GradesFirst”) in December 2014 was $3.6 million. The fair value of the GradesFirst earn-out liability was impacted by changes in estimates regarding expected operating results through the evaluation period, which ended on December 31, 2015. The maximum payout of the earn-out was $4.0 million, while the minimum could have been zero. Based on the operating results of GradesFirst, the maximum payout of $4.0 million was accrued as of December 31, 2015.
Changes in the fair value of the contingent earn-out liabilities subsequent to the acquisition date, including changes arising from events that occurred after the acquisition date, such as changes in the Company’s estimate of performance achievements, discount rates, and stock price, are recognized in earnings in the periods during which the estimated fair value changes. The following table represents a reconciliation of the change in the contingent earn-out liabilities for the year ended December 31, 2015 and the nine months ended December 31, 2014 (in thousands):
Year Ended | Nine Months Ended | ||||||
December 31, 2015 | December 31, 2014 | ||||||
Beginning balance | $ | 12,946 | $ | 8,750 | |||
Fair value change in Southwind contingent earn-out liability (1) | 261 | 500 | |||||
Fair value change in 360Fresh contingent earn-out liability (1) | — | (1,100 | ) | ||||
Fair value change in GradesFirst contingent earn-out liability (1) | 400 | — | |||||
Fair value change in Clinovations contingent earn-out liability (1) | (2,326 | ) | — | ||||
Southwind earn-out payment | (2,531 | ) | (3,348 | ) | |||
360 Fresh earn-out payment | (1,500 | ) | — | ||||
Addition of GradesFirst contingent earn-out liability | — | 3,600 | |||||
Addition of Clinovations contingent earn-out liability | — | 4,544 | |||||
Ending balance | $ | 7,250 | $ | 12,946 | |||
—————————————
(1) | Amounts were recognized in cost of services on the consolidated statements of operations. |
Financial instruments not recorded at fair value on a recurring basis
Equity method investments. The Company's equity method investments represent the Company's ownership interest in Evolent Health, Inc. and its subsidiary, Evolent Health LLC. The fair value of the Company's ownership interest in Evolent Health, Inc. and its subsidiary was $140.4 million as of December 31, 2015 based on the closing price of the common stock of Evolent Health, Inc. as reported on the New York Stock Exchange prior to any discount. For further information, see Note 9, "Investments in and advances to unconsolidated entities." The fair value of the Company's equity method investments is measured quarterly for disclosure purposes. The Company's equity method investments are recorded at fair value only if an impairment charge is recognized.
Senior secured term loan. The Company estimates that the fair value of its senior secured term loan was $453.4 million as of December 31, 2015. The fair value was determined based on discounting the future expected variable cash payments over the life of the loan. The variable interest rates used in the calculation are based on observable market interest rates. The senior secured term loan would be classified as Level 2 within the fair value hierarchy if it were measured at fair value.
Non-recurring fair value measurements
During the fiscal year ended March 31, 2014, the Company recognized a gain of $4.0 million on the conversion of notes receivable from Evolent Health, Inc. into Series B convertible preferred stock of Evolent Health LLC (“Evolent LLC”). See Note 9, “Investments in and advances to unconsolidated entities,” for additional information. The amount of the gain was based on the excess of the fair value of the Series B convertible preferred stock received over the carrying value of the notes receivable exchanged. The fair value of the Series B convertible preferred stock used to calculate the gain was determined by reference to the per share price of issuances of the Series B convertible preferred stock by Evolent LLC to a third party at the same time as the Company exchanged its notes receivable. As this transaction was not made in an active market, this measure is considered a Level 2 fair value measurement. There was no such gain for the year ended December 31, 2015 or for the nine months ended December 31, 2014.
During the year ended December 31, 2015, the Company determined that there was evidence of impairment on its cost method investment. See Note 10, "Other non-current assets," for further detail on the impairment of the cost method investment. The fair values estimated in connection with this impairment is considered a Level 3 fair value measure due to the significance of unobservable inputs to the valuation.
78
Non-financial assets and liabilities
Certain assets and liabilities are measured at fair value on a nonrecurring basis and are subject to fair value adjustments in certain circumstances (e.g., when there is evidence of impairment). During the year ended December 31, 2015, the Company determined that there was evidence of impairment on its goodwill. See Note 8, “Goodwill and intangibles,” for further detail on the recognition of goodwill impairment charges. The fair values estimated in connection with this impairment is considered a Level 3 fair value measure due to the significance of unobservable inputs to the valuation.
During the nine months ended December 31, 2014, certain of the Company’s capitalized software for sale assets were measured and recorded at fair value due to circumstances that indicated that the carrying values of the assets were not fully recoverable. As a result, the Company recognized an impairment of approximately $2.1 million within the consolidated statements of operations. The Company utilized the discounted cash flow method to determine the fair value of the capitalized software assets as of December 31, 2014. Cash flows were determined based on the Company’s estimates of future operating results and discounted using an internal rate of return consistent with that used by the Company to evaluate cash flows of other assets of a similar nature. Due to the significant unobservable inputs inherent in discounted cash flow methodologies, this method is classified as Level 3 in the fair value hierarchy. During the fiscal year ended March 31, 2014, no fair value adjustments or material fair value measurements were required for non-financial assets or liabilities.
Note 5. | Marketable securities |
As a result of the Royall acquisition on January 9, 2015, the Company liquidated its remaining marketable securities, and therefore the Company had no marketable securities as of December 31, 2015. The aggregate value, amortized cost, gross unrealized gains, and gross unrealized losses on available-for-sale marketable securities are as follows (in thousands):
As of December 31, 2014 | |||||||||||||||
Fair value | Amortized cost | Gross unrealized gains | Gross unrealized losses | ||||||||||||
U.S. government-sponsored enterprises | $ | 1,915 | $ | 1,915 | $ | — | $ | — | |||||||
Tax exempt obligations of states | 12,799 | 12,647 | 152 | — | |||||||||||
$ | 14,714 | $ | 14,562 | $ | 152 | $ | — | ||||||||
There were $1.3 million in gross realized gains on sales of available-for-sale investments and $1.4 million in gross realized losses on sales of available-for-sale investments for the nine months ended December 31, 2014, including a $0.2 million loss for investments that were deemed to be other-than-temporarily impaired. There were $0.5 million in gross realized gains on sales of available-for-sale investments and $0.4 million in gross realized losses on sales of available-for-sale investments for the fiscal year ended March 31, 2014.
The weighted average maturity on all marketable securities held by the Company as of December 31, 2014 was approximately 8.0 years. Pre-tax net unrealized gains on the Company’s investments of $0.2 million as indicated above were caused by the increase in market interest rates compared to the average interest rate of the Company’s marketable securities portfolio along with an other-than-temporary impairment of $0.2 million recognized as of December 31, 2014. The Company recognized an other-than-temporary impairment for all securities in an unrealized loss position as the difference between fair market value and amortized cost as of December 31, 2014. Following the other-than-temporary impairment, the amortized cost of the securities was equal to the fair market value as of December 31, 2014.
The Company has reflected the net unrealized gains, net of tax, in accumulated other comprehensive income on the consolidated balance sheets.
79
Note 6. | Membership fees receivable |
Membership fees receivable consist of the following (in thousands):
As of December 31, | |||||||
2015 | 2014 | ||||||
Billed fees receivable | $ | 138,100 | $ | 117,104 | |||
Unbilled fees receivable | 473,053 | 429,487 | |||||
Membership fees receivable, gross | 611,153 | 546,591 | |||||
Allowance for uncollectible revenue | (5,709 | ) | (7,530 | ) | |||
Membership fees receivable, net | $ | 605,444 | $ | 539,061 | |||
Billed fees receivable represent invoiced membership fees. Unbilled fees receivable represent fees due to be billed to members who have elected to pay for their membership on an installment basis. All of the unbilled fees recorded are expected to be billed in the next twelve months.
Note 7. | Property and equipment |
Property and equipment consists of the following (in thousands):
As of December 31, | |||||||
2015 | 2014 | ||||||
Leasehold improvements | $ | 63,608 | $ | 54,156 | |||
Furniture, fixtures and equipment | 62,790 | 51,593 | |||||
Software | 202,384 | 132,949 | |||||
Construction in progress, subject to a build-to-suit lease | 2,700 | — | |||||
Property and equipment, gross | 331,482 | 238,698 | |||||
Accumulated depreciation and amortization | (148,425 | ) | (104,375 | ) | |||
Property and equipment, net | $ | 183,057 | $ | 134,323 | |||
The Company evaluates its long-lived assets for impairment when changes in circumstances exist that suggests the carrying value of a long-lived asset may not be fully recoverable. If an indication of impairment exists, and the Company’s net book value of the related assets is not fully recoverable based upon an analysis of its estimated undiscounted future cash flows, the assets are written down to their estimated fair value. During the year ended December 31, 2015 the Company recognized a $2.7 million impairment loss related to certain internally developed software that is no longer in use. The Company did not recognize any impairment losses on any of its property and equipment for the nine months ended December 31, 2014 or the fiscal year ended March 31, 2014.
As of December 31, 2015 and 2014, the carrying value of internally developed capitalized software was $73.2 million and $61.0 million, respectively.
In December 2015, the Company entered into a build-to-suit lease agreement for a new corporate headquarters, which is currently being constructed in Washington D.C. The lease has an anticipated start date of mid-2019 with a 16-year initial term and $446.1 million of lease payments. The Company has concluded that it is the deemed owner of the building (for accounting purposes only) during the construction period. Accordingly, the Company has recorded a construction-in-progress asset as a component of property and equipment, net of $2.7 million for which there is a corresponding construction financing obligation of $2.7 million recorded in the consolidated balance sheet as of December 31, 2015. The Company will continue to increase the construction-in-progress asset and corresponding long-term liability as additional building costs are incurred by the landlord during the construction period. Upon completion of the construction, the Company will evaluate whether or not this arrangement meets the criteria for sale-leaseback accounting treatment.
80
Note 8. | Goodwill and intangibles |
Included in the Company’s goodwill and intangibles balances are goodwill and acquired intangibles and internally developed capitalized software for sale. Goodwill is not amortized as it has an estimated infinite life. Goodwill is reviewed for impairment at least annually as of October 1, the first date of the fourth quarter of the Company's fiscal year, or whenever events or changes in circumstances indicate that the carrying amount of an asset may not be recoverable.
The Company performs its goodwill impairment test at the reporting unit level, which is one level below the operating segment. The Company has one operating segment, which is consistent with the way management runs the business and allocates resources. The operating segment is then divided into two reporting units largely as a result of the recent Royall acquisition and continued integration efforts. The two reporting units are Royall and the remaining Advisory Board business ("Core ABC"). Goodwill is assigned to the reporting unit or units that benefit from the synergies arising from each business combination.
The determination of fair value of the reporting units used to perform the first step of the impairment test requires judgment and involves significant estimates and assumptions about the expected future cash flows and the impact of market conditions on those assumptions. Due to the inherent uncertainty associated with forming these estimates, actual results could differ from those estimates. Future events and changing market conditions may impact the Company’s assumptions as to future revenue growth rates, future operating margins, market-based WACC and other factors that may result in changes in the estimates of the Company’s reporting units’ fair value. Although management believes the assumptions used in testing the Company’s reporting units’ goodwill for impairment are reasonable, it is possible that market and economic conditions could change from what is expected. A decline in revenue or revenue and earnings multiple data of peer companies, among other factors, could significantly impact the impairment analysis and may result in future goodwill impairment charges that, if incurred, could have a material adverse effect on the Company’s financial condition and results of operations.
The Royall reporting unit had goodwill of $648.3 million as of October 1, 2015. The estimated fair value of the reporting unit did not exceed its carrying value and, therefore, step two of the goodwill impairment was performed. The decrease in fair value of the reporting unit from the acquisition was due to reduced projected cash flow growth rates due in part to lower than expected first year performance and lower market derived multiples between the January 9, 2015 acquisition date and the October 1, 2015 goodwill impairment assessment date. As the Company completed its calendar year 2016 forecast in the three months ended December 31, 2015, it revised its outlook for the Royall business, reducing cash flow forecasts over the projection period. The projections incorporated the effect of current market conditions, including revenue growth, customer attrition, operating margins, capital expenditures, and working capital dynamics. The market-based WACC used in the income approach for Royall was 11%. The terminal growth rate used in the discounted cash flow model was 3.5%.
As the Royall reporting unit failed the step one test, the Company performed the step two test. In connection with the step two test, the Company estimated the fair value of identifiable intangible assets and deferred revenue using methodologies consistent with those used in the original Royall purchase price allocation. Key assumptions were updated to reflect the current outlook for the Royall business as well as market conditions. The result of the step two analysis resulted in a goodwill impairment of $99.1 million.
In performing the goodwill impairment analysis for Core ABC, the calculated fair value for the reporting unit exceeded the carrying value in excess of 500%.
The Company believed that no such impairment indicators existed during the nine months ended December 31, 2014 or the fiscal year ended March 31, 2014. There was no impairment of goodwill recorded during the nine months ended December 31, 2014 or the fiscal year ended March 31, 2014.
Changes in the carrying amount of goodwill are as follows (in thousands):
As of December 31, | |||||||
2015 | 2014 | ||||||
Beginning of period | $ | 186,895 | $ | 129,424 | |||
Goodwill acquired | 650,289 | 57,471 | |||||
Goodwill impairment | (99,145 | ) | — | ||||
Purchase accounting adjustment | 161 | — | |||||
Ending balance | $ | 738,200 | $ | 186,895 | |||
Intangible assets with finite lives are amortized on a straight-line basis over their estimated useful lives, which range from two years to seventeen years. As of December 31, 2015, the weighted average remaining useful life of acquired intangibles was
81
approximately 13.9 years. As of December 31, 2015, the weighted average remaining useful life of internally developed intangibles was approximately 3.7 years.
The gross and net carrying balances and accumulated amortization of intangibles are as follows (in thousands):
As of December 31, 2015 | As of December 31, 2014 | ||||||||||||||||||||||||
Weighted average useful life | Gross carrying amount | Accumulated amortization | Net carrying amount | Gross carrying amount | Accumulated amortization | Net carrying amount | |||||||||||||||||||
Intangibles | |||||||||||||||||||||||||
Internally developed intangible for sale: | |||||||||||||||||||||||||
Capitalized software | 5.0 | $ | 16,902 | $ | (6,796 | ) | $ | 10,106 | $ | 13,268 | $ | (4,009 | ) | $ | 9,259 | ||||||||||
Acquired intangibles: | |||||||||||||||||||||||||
Developed software | 5.2 | 9,450 | (8,075 | ) | 1,375 | 19,250 | (10,238 | ) | 9,012 | ||||||||||||||||
Customer relationships | 16.2 | 277,710 | (25,769 | ) | 251,941 | 25,610 | (8,662 | ) | 16,948 | ||||||||||||||||
Trademarks | 8.6 | 14,900 | (4,490 | ) | 10,410 | 4,900 | (3,048 | ) | 1,852 | ||||||||||||||||
Non-compete agreements | 3.8 | 1,400 | (1,379 | ) | 21 | 1,600 | (1,234 | ) | 366 | ||||||||||||||||
Customer contracts | 4.7 | 6,449 | (5,581 | ) | 868 | 6,449 | (4,913 | ) | 1,536 | ||||||||||||||||
Total other intangibles | $ | 326,811 | $ | (52,090 | ) | $ | 274,721 | $ | 71,077 | $ | (32,104 | ) | $ | 38,973 | |||||||||||
During the year ended December 31, 2015 and nine months ended December 31, 2014, the Company concluded that certain acquired developed technology assets would no longer be in use. As a result, the Company recognized a $5.4 million and $2.1 million impairment on the remaining unamortized costs during the year ended December 31, 2015 and the nine months ended December 31, 2014, respectively.
Amortization expense for intangible assets for the year ended December 31, 2015, the nine months ended December 31, 2014, and the fiscal year ended March 31, 2014, recorded in depreciation and amortization on the consolidated statements of operations, was approximately $24.4 million, $7.3 million, and $8.0 million, respectively. The following approximates the aggregate amortization expense to be recorded in depreciation and amortization on the consolidated statements of operations for each of the following five fiscal years ending December 31, 2016 through 2020: $22.6 million, $21.9 million, $21.0 million, $19.3 million, and $18.0 million, respectively, and $171.9 million thereafter.
Note 9. | Investments in and advances to unconsolidated entities |
In August 2011, the Company entered into an agreement with UPMC to establish Evolent for the purpose of driving provider-led, value-driven care with innovative technology, integrated data and analytics, and services. The Company provided $10.0 million and other non-cash contributions to Evolent for an initial equity interest of 44% in Series A convertible preferred stock of Evolent and the right to appoint one person to Evolent’s board of directors. The Company exercises significant influence over Evolent, but does not control Evolent and is not the primary beneficiary of Evolent’s activities. At the time of formation, the Series A convertible preferred stock of Evolent was deemed to be in-substance common stock. As a result, the Company’s investment in Evolent was accounted for under the equity method of accounting, with the Company’s proportionate share of the income or loss recognized in the consolidated statements of operations.
In September 2013, Evolent completed a reorganization in connection with a new round of equity financing (the “Series B Issuance”). Evolent’s reorganization included the creation of Evolent Health Holdings, Inc. (“Holdings”) and the conversion of Evolent into Evolent LLC, a limited liability company that is treated as a partnership for tax purposes. The Company's investment in Evolent was converted into the equivalent investment in Holdings. Immediately following the reorganization, Holdings owned 57% of the equity interests in Evolent LLC. Holdings has no other operations other than its investment in Evolent LLC. The Company, together with certain other investors, also holds a direct equity interests in Evolent LLC, which continued as the operating company that conducts the Evolent business. The Company participated in the Series B Issuance by providing $9.6 million in cash and converting $10.1 million in principal and accrued interest of the convertible term note in exchange for 1,302,172 shares of Series B convertible preferred stock in Evolent LLC and the right to appoint an additional person to the boards of directors of both Evolent LLC and Holdings. The conversion of all outstanding principal and accrued interest under the note into equity securities generated a $4.0 million gain. The gain is included in equity in loss of unconsolidated entities on the consolidated statements of operations for the fiscal year ended March 31, 2014. There is no such gain for the year ended December 31, 2015 or the nine months ended December 31, 2014. Immediately following the Series B
82
Issuance and reorganization, the Company owned 23.6% of Holdings through its Series A convertible preferred investment and 11.5% of Evolent LLC through its Series B convertible preferred investment.
On the date of the Series B Issuance, the Company re-evaluated the accounting for its investment in Holdings’ Series A convertible preferred stock. The Company determined that its Series A convertible preferred investment in Holdings should be accounted for under the cost method instead of the equity method since the investment no longer qualified as in-substance common stock. Prior to this change, the Company's share of the losses of Evolent during the fiscal year ended March 31, 2014 was $10.1 million, of which $1.9 million was applied to the carrying value of its investment in Series A convertible preferred stock, which reduced the Company's carrying value of its Series A convertible preferred investment in Holdings to $0 as of March 31, 2014.
Evolent LLC maintained separate capital accounts for each of its members. Therefore, the Company accounted for its Series B convertible preferred investment in Evolent LLC under the equity method and recognized its portion of Evolent LLC's losses according to the earnings and loss allocation methodology provided for in the Evolent LLC Operating Agreement.
As of December 31, 2014, the Company owned 23.3% of Holdings through its Series A convertible preferred investment and Holdings owned approximately 57.2% of Evolent LLC. As of December 31, 2014, the Company owned 11.4% of Evolent LLC through its Series B convertible preferred investment.
On May 8, 2015, the Company agreed to acquire additional shares of convertible preferred stock of Holdings from another investor in Holdings, which increased the Company’s carrying value for its cost method investment in Holdings to $3.0 million.
On June 4, 2015, Holdings completed a reorganization in connection with its initial public offering (the “IPO” and together with the reorganization, the “Transaction”). The reorganization included the creation of Evolent Health, Inc. (“Evolent Inc.”) and the merger of the two entities in which Holdings was dissolved and Evolent Inc. was the surviving entity. The Company’s convertible preferred stock investment in Holdings was ultimately exchanged for shares of Class A common stock of Evolent Inc. on a 1-for-4 basis. The Class A common stock provides the Company voting and economic rights with respect to Evolent Inc. in proportion to the Company's ownership percentage in Evolent Inc. The Company carried over its basis in Holdings to its investment in Evolent Inc. in connection with the exchange. For additional information on the fair value of the Company’s investment after the IPO, see Note 4, “Fair value measurements.” The Company continues to have the right to designate two individuals to Evolent Inc.'s board of directors, who were the Company's Chief Executive Officer and the Company's Chief Financial Officer as of December 31, 2015.
Following the Transaction, the Company held a 15.4% equity ownership interest in Evolent Inc. that is accounted for under the equity method of accounting, with the Company’s proportionate share of Evolent Inc.’s losses recognized in the consolidated statements of operations. The Company’s share of the losses of Evolent Inc. that was applied to the carrying value of its investment in Evolent Inc. during the year ended December 31, 2015 was $3.0 million. The carrying balance of the Company’s investment in Evolent Inc. was $0 as of December 31, 2015.
In addition, the Company continues to hold an equity interest in Evolent LLC. As of December 31, 2014, the Company’s convertible preferred stock investment in Evolent LLC had a carrying value of $9.3 million. In connection with the Transaction described above, the Company’s convertible preferred stock investment in Evolent LLC was converted on a 1-for-4 basis to Class B common units of Evolent LLC. As of December 31, 2015, the Company holds an 8.8% equity interest in Evolent LLC that continues to be accounted for under the equity method, with the Company’s proportionate share of Evolent LLC’s losses recognized in the consolidated statements of operations. The Class B common units provide the Company economic rights with respect to Evolent LLC in proportion to the Company's ownership percentage in Evolent LLC, but no voting rights.
During the year ended December 31, 2015, the nine months ended December 31, 2014, and the fiscal year ended March 31, 2014, the Company’s share of the losses of Evolent LLC that was applied to the carrying value of its investment in Evolent LLC was $8.6 million, $6.3 million, and $3.8 million, respectively. The carrying balance of the Company’s investment in Evolent LLC was $0.7 million as of December 31, 2015.
Because of Evolent LLC's treatment as a partnership for tax purposes, the losses of Evolent LLC pass through to the Company and the other members. The Company's proportionate share of the losses of Evolent LLC is recorded net of the estimated tax benefit that the Company believes will be realized from the equity in loss of unconsolidated entities on the consolidated statements of operations. Historically, the Company had provided a full valuation allowance against the deferred tax asset resulting from these benefits. During the year ended December 31, 2015, the Company determined that it is now more-likely-than not able to realize the deferred tax assets associated with its investment in Evolent LLC as a result of the Transaction; accordingly, a tax benefit of $6.7 million was recorded to release the valuation allowance previously recorded. An additional tax benefit of $0.5 million has been recorded in the year ended December 31, 2015 for the tax effects of current year losses received from Evolent LLC.
83
The equity in loss of unconsolidated entities on the consolidated statement of operations consisted of the following (in thousands):
Year ended December 31, | Nine Months Ended December 31, | Year ended March 31, | ||||||||||
2015 | 2014 | 2014 | ||||||||||
Evolent Inc. | $ | (3,006 | ) | $ | — | — | ||||||
Evolent LLC | (8,610 | ) | (6,540 | ) | (6,051 | ) | ||||||
Tax (expense) benefits | 7,220 | — | — | |||||||||
Equity in loss of unconsolidated entities | $ | (4,396 | ) | $ | (6,540 | ) | $ | (6,051 | ) | |||
In connection with the Transaction, the Company received Class B common shares in Evolent Inc. in an amount proportionate to the amount of Class B common units of Evolent LLC owned by the Company. The class B common shares provide the Company a voting, but not economic, interest. These Class B common shares are subject to an exchange agreement under which the Company may exchange one or more Class B common units of Evolent LLC, together with an equal number of shares of Class B common stock of Evolent Inc., for shares of Class A common stock of Evolent Inc.
In connection with the Transaction, the Company and certain investors in Evolent LLC entered into a tax receivables agreement with Evolent Inc. Under the terms of that agreement, Evolent Inc. will make cash payments to the Company and certain investors in amounts equal to 85% of Evolent Inc.'s actual tax benefit realized from various tax attributes related to pre-IPO activity. Interest will be included on the tax savings at the applicable London interbank offered rate plus 100 basis points. The tax receivables agreement will generally apply to Evolent Inc.'s taxable years up to and including the 15th anniversary date of the Transaction. As of December 31, 2015, the Company has not received any payments pursuant to the terms of the tax receivables agreement. As the amount the Company will receive related to the tax receivables agreement is unknown, the Company will recognize payments, if any, associated with this agreement when received.
As of December 31, 2015, Evolent Inc. had no material operations outside of its 70.3% ownership interest in Evolent LLC. In connection with the reorganization, Evolent Inc. gained control of and now consolidates Evolent LLC in its financial statements. Evolent Inc. applied purchase accounting and pushed down its new basis to the separate Evolent LLC financial statements as included in the presentation below. The Company has not recognized the effects of the purchase accounting or push down accounting applied by Evolent Inc. and Evolent LLC, respectively. The Company had pre-existing basis differences related to its investment in Evolent LLC at the time of the reorganization. As of December 31, 2015, the Company’s carrying value in the entities was less than its proportional interest in the equity of Evolent Inc. and Evolent LLC in the amounts of $99.9 million and $83.6 million, respectively. The Company has excluded the effects of the purchase and push down accounting in its determination of the equity in loss, thereby reducing its share of losses from Evolent Inc. and Evolent LLC for the affected periods. As a result, the basis differences will decrease over time.
The following is a summary of the financial position of Evolent LLC as of the dates presented. The period from June 4 to December 31, 2015 includes the effects of purchase accounting pushed down to Evolent LLC as part of the IPO that occurred on June 4, 2015.
As of December 31, | |||||||
2015 | 2014 | ||||||
Assets: | |||||||
Current assets | $ | 184,463 | $ | 56,718 | |||
Non-current assets | 831,051 | 27,586 | |||||
Total assets | $ | 1,015,514 | $ | 84,304 | |||
Liabilities, redeemable preferred units and members’ equity: | |||||||
Current liabilities | $ | 59,506 | $ | 50,029 | |||
Non-current liabilities | 111 | 5,772 | |||||
Total liabilities | 59,617 | 55,801 | |||||
Redeemable preferred units | — | 15,734 | |||||
Members’ equity | 955,897 | 12,769 | |||||
Total liabilities and members’ equity | $ | 1,015,514 | $ | 84,304 | |||
84
The following is a summary of the operating results of Evolent LLC (or its predecessor) for the periods presented, which include the effects of purchase accounting pushed down to Evolent LLC as part of the IPO that occurred on June 4, 2015. The period from June 4 to December 31, 2015 reflects the impact of the push down accounting that was recorded on the Evolent LLC financial statements.
Period June 4 - December 31, | Period January 1 - June 3, | Nine Months Ended December 31, | Year Ended March 31, | ||||||||||||
2015 | 2015 | 2014 | 2014 | ||||||||||||
Revenue | $ | 96,878 | $ | 61,814 | $ | 80,812 | $ | 54,899 | |||||||
Cost of revenue (exclusive of depreciation and amortization) | 57,398 | 44,839 | 58,301 | 52,529 | |||||||||||
Gross profit | 39,480 | 16,975 | 22,511 | 2,370 | |||||||||||
Operating loss | (42,972 | ) | (44,119) | (40,805 | ) | (37,501 | ) | ||||||||
Net loss | (42,679 | ) | (44,079) | (40,637 | ) | (37,792 | ) | ||||||||
The following is a summary of the consolidated financial position of Evolent Health, Inc. as of the date presented:
As of December 31, | |||
2015 | |||
Assets: | |||
Current assets | $ | 184,463 | |
Non-current assets | 831,051 | ||
Total assets | $ | 1,015,514 | |
Liabilities and shareholders' equity: | |||
Current liabilities | $ | 59,506 | |
Non-current liabilities | 21,429 | ||
Total liabilities | 80,935 | ||
Total shareholders’ equity | 934,579 | ||
Total liabilities and shareholders’ equity | $ | 1,015,514 | |
The following is a summary of the consolidated operating results of Evolent Health, Inc. for the period presented:
Year Ended December 31, | ||||
2015 | ||||
Revenue | $ | 96,878 | ||
Cost of revenue (exclusive of depreciation and amortization) | 57,398 | |||
Gross profit | 39,480 | |||
Operating loss | (42,972 | ) | ||
Net income (loss) | 332,494 | |||
Evolent LLC is in the early stages of its business plan and, as a result, the Company expects both Evolent Inc. and Evolent LLC to continue to incur losses. The Company’s investment in Evolent LLC is evaluated for impairment whenever events or changes in circumstances indicate that there may be an other-than-temporary decline in value. As of December 31, 2015, the Company believes that no impairment charge is necessary.
85
Note 10. | Other non-current assets |
In June 2009, the Company invested in the convertible preferred stock of a private company that provides technology tools and support services to health care providers, including the Company’s members. In addition, the Company entered into a licensing agreement with that company. As part of its investment, the Company received warrants to purchase up to 6,015,000 shares of the company’s common stock at an exercise price of $1.00 per share as certain performance criteria are met. The warrants are exercisable through June 19, 2019. The warrants contain a net settlement feature and therefore are considered to be a derivative financial instrument. A reduction of $370,000 was made to the fair value of the warrants for the year ended December 31, 2015. The change in the fair value of the warrants for the year ended December 31, 2015 was attributable primarily to the net impact of changes in the underlying assumptions. The warrants are recorded at their fair value, which was estimated at $0 as of December 31, 2015 and $550,000 as of December 31, 2014, and are included in other non-current assets on the consolidated balance sheets. The change in the fair value of the warrants is recorded in other income, net on the consolidated statements of operations.
The convertible preferred stock investment was recorded at cost as the investment does not have a readily determinable fair value. The carrying value of the preferred stock investment, which was the amount of the Company's initial investment, was $5.0 million as of December 31, 2014. As of December 31, 2015, the Company determined that the carrying amount of the investment may not be fully recoverable based on the underlying performance and expected capital needs of the private company. The Company engaged a third-party valuation specialist to perform a valuation of the convertible preferred stock investment. The value of the Company’s investment was estimated at $1.8 million as of December 31, 2015, which is included in other non-current assets on the consolidated balance sheet. The specialist estimated the enterprise value of the private company and then used an option pricing model to derive the fair value of the Company’s preferred stock investment. The discount rate used in the fair value of the private company within the option pricing model was 25%, the underlying volatility was 50%, and expected term of the investment is one year. The impairment of $3.2 million is included in other (expense) income, net on the consolidated statements of operations.
The carrying amount of this investment is included in other non-current assets on the consolidated balance sheets. The convertible preferred stock accrues dividends at an annual rate of 8% that are payable if and when declared by the investee’s board of directors. As of December 31, 2015, no dividends had been declared by the investee or recorded by the Company. The Company reviewed the asset for impairment for the nine months ended December 31, 2014 and believed that no impairment existed.
Note 11. | Noncontrolling interest |
In July 2012, the Company entered into an agreement with an entity created for the sole purpose of providing consulting services for the Company on an exclusive basis. The Company’s relationship with the entity was governed by a services agreement and other documents, as amended, that provided the entity’s owners the conditional right to require the Company to purchase their ownership interests (“Put Option”), for a price based on a formula set forth in the agreement, at any time after certain conditions were satisfied through June 30, 2015. These agreements also provided the Company a conditional right to require the entity’s owners to sell their ownership interests to the Company (“Call Option”) over the same period. The Company determined that this entity met the definition of a variable interest entity over which it had significant influence and, as a result, had consolidated the results of this entity into its consolidated financial statements. The noncontrolling interest represents the entity’s owners’ claims on consolidated investments where the Company owns less than a 100% interest. Losses attributable to noncontrolling interest for the nine months ended December 31, 2014 and the fiscal year ended March 31, 2014 were $0.2 million and $0.1 million, respectively.
On December 5, 2014, the conditions required for the entity's owners to exercise the Put Option were satisfied and the entity's owners exercised the Put Option. The Company paid $6 million to acquire 100% of the ownership interests. The purchase price of $6.1 million is recorded as a reduction to net income attributable to common stockholders on the accompanying consolidated statements of operations. Prior to the exercise of the Put Option, the Company had a 0% interest in this entity. In conjunction with the exercise of the Put Option, the Company recorded a deferred tax asset of $3.4 million related to basis differences. As a result of the exercise of the Put Option, there was no noncontrolling interest for the year ended December 31, 2015.
86
Note 12. | Debt |
Senior secured revolving credit facility obtained in July 2012
In July 2012, the Company entered into a $150.0 million five-year senior secured revolving credit facility under a credit agreement with a syndicate of lenders which was set to mature and be payable in full on July 30, 2017. As of December 31, 2014, the Company had unamortized deferred financing fees of $0.4 million related to this transaction.
Senior secured credit facilities obtained in January 2015
On January 9, 2015, in connection with the completion of the acquisition of Royall, the Company entered into a credit agreement with various lenders. This credit agreement replaced the July 2012 secured revolving credit facility. Under the terms of the January 9, 2015 credit agreement, lenders provided the Company with $775 million of senior secured credit facilities for application to the acquisition of Royall and the Company’s corporate needs after the closing of the Royall acquisition. The credit facilities consisted of a term loan facility in the principal amount of $725 million, maturing on January 9, 2022, and a revolving credit facility under which up to $50 million principal amount of borrowings and other credit extensions could be outstanding at any time, maturing on January 9, 2020.
Amounts drawn under the term facility generally bore interest, payable quarterly, at an annual rate calculated, at the Company’s option, on the basis of either (a) an alternate base rate plus an initial margin of 3.00% or (b) the applicable London interbank offered rate (subject to a 1.00% floor) plus an initial margin of 4.00%, subject in each case to margin reductions based on the Company's total leverage ratio from time to time. The annual interest rate for the term loan facility as of January 9, 2015 was 5.00%. The revolving facility was undrawn at the facility closing date. All $725 million of term loans available under the term loan facility were drawn at the closing of the acquisition to pay the majority of the cash purchase price for the Royall capital stock. Total original issue discount of $21.8 million and deferred financing fees of $2.8 million were recorded related to this credit agreement. The Company recognized a loss of $0.2 million on the modification of the July 2012 revolving credit facility. This loss was recorded in loss on financing activities within the consolidated statements of operations.
Equity offering in January 2015
On January 21, 2015, the Company closed on a registered public offering of its common stock. The Company used the net proceeds from the offering plus available cash to repay approximately $149.9 million principal amount of loans outstanding under its $725 million senior secured term loan facility. This payment resulted in a loss on financing activities of $4.5 million related to original issue discount and $0.3 million related to deferred financing fees. The total $4.8 million loss was recognized in loss on financing activities within the consolidated statement of operations.
Senior secured credit facilities obtained in February 2015
On February 6, 2015, the Company entered into a new credit agreement with various lenders. The new credit agreement consists of a five-year senior secured term loan facility in the original principal amount of $575 million and a five-year senior secured revolving credit facility under which up to $100 million principal amount of borrowings and other credit extensions may be outstanding at any time. The proceeds of the term loan were used to repay and retire all loans outstanding under the term loan facility obtained on January 9, 2015. The revolving credit facility was not drawn down on February 6, 2015. Amounts drawn under the term loan and revolving credit facilities bore interest, payable quarterly, at an annual rate calculated, at the Company’s option, on the basis of either (a) an alternate base rate plus an initial margin of 1.75% or (b) the applicable London interbank offered rate plus an initial margin of 2.75%, subject in each case to margin reductions based on the Company’s total leverage ratio from time to time. At the time of issuance, the stated annual interest rate on the borrowing was 3.01%. Amounts due under the new credit agreement are secured by substantially all of the Company's tangible and intangible assets.
The lenders under the new credit agreement included the lenders from the January 9, 2015 agreement as well as new lenders. For those lenders to this agreement that also participated in the January 9, 2015 agreement, the Company concluded that the new credit agreement represented a modification of the debt. As a modification, the original issue discount and deferred financing fees associated with the original borrowings carried forward to the new borrowings. Any fees paid to or received from these lenders were recorded as an adjustment to the original issue discount. Any fees paid to third parties were recorded as expense. The Company received a net refund of $2.4 million from the original lenders under the January 9, 2015 agreement, which was treated as a reduction to the original issue discount and deferred financing fees. Further, because the level of participation in the borrowings by the lenders under the original credit agreement was significantly less under the new agreement than under the original agreement, the Company recognized a debt modification expense of $12.4 million related to a portion of the original issue discount and deferred financing fees from the old agreement. This $12.4 million expense was recorded as a loss on financing activities within the consolidated statement of operations. Following this write-off, the Company had original issue discount of $3.9 million, recorded as contra-debt in debt, current and debt, net of current portion
87
and deferred financing fees of $1.1 million related to the February 6, 2015 credit facilities recorded in prepaid expenses and other current assets and non-current assets on the Company's consolidated balance sheets as of December 31, 2015.
Amendment to the senior secured credit facilities
On October 30, 2015, the Company amended its senior secured credit facilities. Prior to the amendment, the outstanding principal amount of the senior secured term loan was approximately $560.6 million and no amounts were outstanding under the revolving credit facility. Pursuant to this amendment, the amount available for borrowing under the revolving credit facility was increased from $100.0 million to $200.0 million. On October 30, 2015, the Company borrowed $100.0 million under the revolving credit facility and used all of the proceeds to repay a portion of the outstanding principal amount of the senior secured term loan. Upon consummation of this prepayment transaction, $460.6 million in aggregate principal amount remained outstanding under the senior secured term loan. In addition, the Company lowered the initial margin on the alternate base rate from 1.75% to 1.25% and on the London interbank offered rate from 2.75% to 2.25%. The Company recognized no loss on financing activities related to this amendment. As of December 31, 2015, the stated annual interest rate on the borrowing was 2.68%.
As of December 31, 2015, there was $100.0 million outstanding under the revolving credit facility and $98.6 million was available for borrowing. As of December 31, 2015, the revolving credit facility had issued $1.4 million of standby letters of credit. As of December 31, 2015, the stated annual interest rate on the amounts drawn on the revolving credit facility was 2.68%. The Company is obligated to pay a commitment fee at an annual rate of 0.3% subject to reduction based on the Company’s total leverage ratio from time to time, accruing on the average daily amount of available commitments under the revolving credit facility.
Long-term debt is summarized as follows (in thousands):
As of December 31, 2015 | |||
2.68% Revolving Credit Facility due fiscal 2020 | $ | 100,000 | |
2.68% Senior Secured Note due fiscal 2020 ($453,438 face value less unamortized discount of $3,220) | 450,218 | ||
Less: amounts due in next twelve months ($28,750 face value less unamortized discount of $899) | (27,851 | ) | |
Total | $ | 522,367 | |
The credit agreement contains customary representations and warranties, events of default and financial and other covenants, including covenants that require the Company to maintain a maximum total leverage ratio and a minimum interest coverage ratio. The Company's compliance with the two financial covenants is measured as of the end of each fiscal quarter. The Company was in compliance with these financial covenants as of December 31, 2015.
Long-term debt maturing in each of the next five fiscal years, excluding the discount and premium, is as follows (in thousands):
Year Ending December 31, | |||
2016 | $ | 28,750 | |
2017 | 50,313 | ||
2018 | 79,062 | ||
2019 | 86,250 | ||
2020 | 309,063 | ||
Total | $ | 553,438 | |
Interest expense for the year ended December 31, 2015 was $21.1 million, inclusive of $1.3 million amortization of debt issuance costs and $2.0 million of payments related to the interest rate swaps described below.
Swap agreements
Through its senior secured term loan and revolving facilities, the Company is exposed to interest rate risk. To minimize the impact of changes in interest rates on its interest payments, in April 2015, the Company entered into three interest rate swap agreements with financial institutions to swap a portion of its variable-rate interest payments for fixed-rate interest payments. The interest rate swap derivative financial instruments are recorded on the consolidated balance sheet at fair value, which is based on observable market-based expectations of future interest rates.
88
At hedge inception, the Company entered into interest rate swap arrangements with notional amounts totaling $287.5 million. The swap was structured to have a declining notional amount which matches the amortization schedule of the term loan. As of December 31, 2015, the principal amount hedged was $276.8 million. Consistent with the terms of the Company's senior secured term loan facility, the interest rate swap agreements mature in February 2020 and have periodic interest settlements. Under the agreements, the Company is entitled to receive a floating rate based on the 1-month London interbank offered rate and obligated to pay an average fixed rate of 1.282% on the outstanding notional amount. The Company has designated the interest rate swap as a cash flow hedge of the variability of interest payments under its senior secured term loan facility due to changes in the LIBOR benchmark interest rate. The difference between cash paid and received is recorded within interest expense on the consolidated statements of operations.
As of December 31, 2015, the fair value of the interest rate swaps was an asset of $0.4 million and was recorded in the Company's consolidated balance sheets within other non-current assets. For the year ended December 31, 2015, the change in fair value of the swaps, net of tax, of $0.2 million was reported as a component of accumulated other comprehensive income. The Company does not expect any amount included in accumulated other comprehensive income to be reclassified into earnings during the next 12 months. There was no hedge ineffectiveness as of December 31, 2015. Changes in fair value are reclassified from accumulated other comprehensive income into earnings in the same period in which the hedged item affects earnings.
If, at any time, the swap is determined to be ineffective, in whole or in part, due to changes in the interest rate swap or underlying debt agreements, the fair value of the portion of the swap determined to be ineffective will be recognized as a gain or loss in the consolidated statements of operations for the applicable period.
Note 13. | Stockholders’ equity |
In November 2015, the Company’s board of directors authorized an increase in its cumulative share repurchase program to $550 million of the Company’s common stock. The Company repurchased 1,069,357 shares, 731,559 shares, and 376,532 shares of its common stock at a total cost of approximately $53.0 million, $36.0 million, and $21.9 million, in the year ended December 31, 2015, the nine months ended December 31, 2014, and the fiscal year ended March 31, 2014, respectively, pursuant to its share repurchase program. The total amount of common stock purchased from inception under the program as of December 31, 2015 was 17,827,542 shares at a total cost of $451.8 million. All repurchases to date have been made in the open market and shares have been retired as of December 31, 2015. No minimum number of shares subject to repurchase has been fixed and the share repurchase authorization has no expiration date. The Company has funded its share repurchases with cash on hand, proceeds from the sale of marketable securities, and cash generated from operations. As of December 31, 2015, the remaining authorized repurchase amount was $98.2 million.
During the year ended December 31, 2015, the Company retired 1,069,357 shares of its treasury stock. Upon retirement, these shares resumed the status of authorized but unissued stock. The treasury stock retirement resulted in reductions to common stock of $10,700, treasury stock of $53.0 million, and retained earnings of $53.0 million. During the nine months ended December 31, 2014, the Company retired 731,559 shares of its treasury stock. Upon retirement, these shares resumed the status of authorized but unissued stock. The treasury stock retirement resulted in reductions to common stock of $7,300, treasury stock of $36.0 million, and retained earnings of $36.0 million. A total of 17,827,542 shares of treasury stock have been retired to date. There was no effect on the total stockholders’ equity position as a result of the retirement.
Equity offering
On January 21, 2015, the Company closed the registered public offering of 3,650,000 shares of common stock by the Company, and pursuant to registration rights granted by the Company to the Seller in connection with the acquisition of Royall, the public offering of 1,755,000 shares of common stock held by the Seller that were issued to the Seller as the equity component of the acquisition consideration. The shares in the registered public offering were sold at a price to the public of $43.00 per share, less an underwriting discount of $1.935 per share, for a net per share purchase price of $41.065. The Company also incurred selling costs of $1.1 million directly related to this equity offering. The net proceeds received by the Company were approximately $148.8 million after deducting the underwriting discount and selling costs. As of December 31, 2015, the Seller held no shares of the common stock issued to it as acquisition consideration.
Note 14. | Stock-based compensation |
Equity incentive plans
The Company issues awards, including stock options and RSUs, under the Company’s 2009 Stock Incentive Plan (the “2009 Plan”). On June 9, 2015, the Company's stockholders approved an amendment to the 2009 Plan that increased the number of shares of common stock authorized for issuance under the plan by 3,800,000 shares. As of December 31, 2015,
89
there were 4,016,277 shares available for issuance under the 2009 Plan. On September 5, 2013, the Company's stockholders also approved an amendment to the 2009 Plan that increased the maximum term for stock option and freestanding stock appreciation rights awards granted under the plan from five years to seven years.
The 2009 Plan is administered by the Compensation Committee of the Company’s board of directors, which has the authority to determine which officers, directors, employees, and other service providers are awarded options or share awards pursuant to the 2009 Plan and to determine the terms of the awards. Grants may consist of treasury shares or newly issued shares. Options are rights to purchase common stock of the Company at the fair market value on the date of grant. The exercise price of a stock option or other equity-based award is equal to the closing price of the Company’s common stock on the date of grant. The Company generally awards non-qualified options, but the 2009 Plan permits the issuance of options intended to qualify as incentive stock options under Section 422 of the Internal Revenue Code. Holders of options do not participate in dividends, if any, until after the exercise of the award. RSUs are equity settled stock-based compensation arrangements of a number of shares of the Company’s common stock. RSU holders do not participate in dividends, if any, nor do they have voting rights until the restrictions lapse.
On January 9, 2015, in conjunction with the Royall acquisition, the Company created The Advisory Board Company Inducement Stock Incentive Plan for Royall Employees to enable the Company to award options and restricted stock units to persons employed by Royall as an inducement to employees entering into and continuing employment with the Company or its current or future subsidiaries upon consummation of the Royall acquisition. Under the terms of this plan, the aggregate number of shares issuable pursuant to all awards may not exceed 1,906,666. The awards consisted of performance-based stock options to purchase an aggregate of 1,751,000 shares of common stock and performance-based RSUs for an aggregate of 145,867 shares of common stock. Both the performance-based stock options and performance-based RSUs are also subject to service conditions.
Stock options granted under the inducement plan have an exercise price equal to $49.92, which was the closing price of the Company’s common stock on January 9, 2015 as reported on the NASDAQ Global Select Market. The stock options have a seven-year term and are eligible to vest, if performance-based vesting criteria are satisfied, in installments commencing in January 2017 and ending in January 2020. The RSUs were valued at $49.92 and are also eligible to vest in installments commencing in January 2017 and ending in January 2020, subject to satisfaction of performance-based vesting criteria. The vesting criteria in both cases are based on performance of the Royall programs and services. The aggregate grant date fair value of the performance-based stock options, assuming all performance targets are met, is estimated to be approximately $26.8 million. The aggregate grant date fair value of the performance-based RSUs, assuming all performance targets are met, is estimated at approximately $7.3 million. As of December 31, 2015, the Company expects that Royall will achieve 70% to 99% of the performance targets, which would result in vesting of 50% of the performance-based stock options and 50% of the RSUs eligible to vest, subject to forfeitures. The option and RSU awards are reflected in the following tables.
The actual stock-based compensation expense the Company will recognize is dependent upon, but not limited to, Royall satisfying the applicable performance conditions and continued employment of award recipients at the time performance conditions are met. The actual amount the Company will recognize may increase or decrease based on Royall's actual results and the employment status of the award recipients at the time performance conditions are met.
On June 23, 2014, the Compensation Committee of the board of directors approved a long-term incentive plan ("LTIP") pursuant to which nonqualified stock options and RSUs would be granted under the 2009 Plan to certain executive officers of the Company. As of December 31, 2015, 970,937 nonqualified stock options and 104,026 RSUs were granted to certain executive officers of the Company. The awards are subject to both performance-based and market-based conditions and will vest based upon the achievement of specified levels of both sustained contract value and sustained stock price during the performance period, which could extend to March 31, 2019. The vesting of the RSUs is also subject to a one-year service condition, which requires the recipient to remain employed with the Company for at least one year following the date on which the applicable performance and market conditions are achieved. As of December 31, 2015, the Company has concluded that it is probable that all awards will vest at the highest level of achievements over a five-year period. The estimated requisite service period, which includes the current estimate of the time to achieve the performance and market conditions at the highest level is five years for the stock options and six years for the RSUs, inclusive of the one-year service condition. The options and RSUs are included in the tables below.
Stock option activity. During the year ended December 31, 2015, the nine months ended December 31 2014, and the fiscal year ended March 31, 2014, the Company granted 2,102,916, 1,144,973, and 536,958, stock options, respectively, with a weighted average exercise price of $50.45, $52.28, and $51.71, respectively.
During the year ended December 31, 2015, the nine months ended December 31, 2014, and the fiscal year ended March 31, 2014, participants exercised 218,109, 233,999, and 1,327,358 options for a total intrinsic value of $6.6 million, $7.3 million, and $53.7 million, respectively. Intrinsic value is calculated as the number of shares exercised times the Company’s stock price at exercise less the exercise price of the option.
90
The following table summarizes the changes in common stock options during the year ended December 31, 2015, the nine months ended December 31, 2014, and the fiscal year ended March 31, 2014 for all of the Company's stock incentive plans.
Number of Performance-Based Options | Weighted Average Exercise Price | Number of Service-Based Options | Weighted Average Exercise Price | |||||||||||
Outstanding as of March 31, 2013 | 124,300 | $ | 20.57 | 2,568,053 | $ | 21.09 | ||||||||
Granted | — | $ | — | 536,958 | $ | 51.71 | ||||||||
Exercised | (104,300 | ) | $ | 18.85 | (1,223,058 | ) | $ | 16.41 | ||||||
Forfeited | — | $ | — | (71,630 | ) | $ | 32.93 | |||||||
Outstanding as of March 31, 2014 | 20,000 | $ | 29.58 | 1,810,323 | $ | 32.86 | ||||||||
Granted | 974,605 | $ | 51.40 | 170,368 | $ | 57.31 | ||||||||
Exercised | — | $ | — | (233,999 | ) | $ | 18.36 | |||||||
Forfeited | — | $ | — | — | $ | — | ||||||||
Outstanding, as of December 31, 2014 | 994,605 | $ | 50.96 | 1,746,692 | $ | 37.19 | ||||||||
Granted | 1,774,820 | $ | 49.90 | 328,096 | $ | 53.42 | ||||||||
Exercised | — | $ | — | (218,109 | ) | $ | 21.76 | |||||||
Forfeited | (756,100 | ) | $ | 49.92 | (13,569 | ) | $ | 60.27 | ||||||
Outstanding, as of December 31, 2015 | 2,013,325 | $ | 50.42 | (1) | 1,843,110 | $ | 41.73 | (3) | ||||||
Exercisable, as of December 31, 2015 | 20,000 | $ | 29.58 | (2) | 1,007,877 | $ | 32.86 | (4) | ||||||
—————————————
(1) | The weighted average remaining contractual term for all performance-based options outstanding at December 31, 2015 is approximately six years and the aggregate intrinsic value is $0.4 million. |
(2) | The weighted average remaining contractual term for all performance-based options exercisable as of December 31, 2015 is approximately three years and the aggregate intrinsic value is $0.4 million. |
(3) | The weighted average remaining contractual term for all service-based options outstanding at December 31, 2015 is approximately three years and the aggregate intrinsic value is $18.8 million. |
(4) | The weighted average remaining contractual term for all service-based options exercisable as of December 31, 2015 is approximately two years and the aggregate intrinsic value is $17.7 million. |
The aggregate intrinsic value shown in the footnotes of the table above is the sum of the amounts by which the quoted market price of the Company’s common stock on the NASDAQ Global Select Market exceeded the exercise price of the options as of December 31, 2015, for those options for which the quoted market price was in excess of the exercise price. This amount changes over time based on changes in the fair market value of the Company’s common stock. During the year ended December 31, 2015, the nine months ended December 31, 2014, and the fiscal year ended March 31, 2014, 387,748, 411,259, and 850,087 options, respectively, vested with fair values of $5.0 million, $4.2 million, and $5.3 million, respectively.
91
The following table summarizes the exercise prices and contractual lives of all options outstanding under the Company's stock incentive plans as of December 31, 2015:
Options Outstanding | ||||||||
Range of Exercise Prices | Shares | Weighted Average Exercise Price | Weighted Average Remaining Contractual Life - Years | |||||
$ 0.00 – $ 9.99 | 133,700 | $ | 9.26 | 0.3 | ||||
10.00 – 19.99 | 139,000 | 16.58 | 1.2 | |||||
20.00 – 29.99 | 272,200 | 24.85 | 1.7 | |||||
30.00 – 39.99 | — | — | 0.0 | |||||
40.00 – 49.99 | 1,733,517 | 48.34 | 4.6 | |||||
50.00 – 59.99 | 1,484,322 | 52.57 | 5.6 | |||||
60.00 – 69.99 | 93,696 | 66.90 | 5.2 | |||||
$ 0.00 – $ 69.99 | 3,856,435 | $ | 46.27 | 4.5 | ||||
Restricted stock unit activity. During the year ended December 31, 2015, the nine months ended December 31, 2014, and the fiscal year ended March 31, 2014, the Company granted 568,511, 336,113, and 550,384 RSUs, respectively, the majority of which vest in four equal annual installments on the anniversary of the grant date. The valuation of RSUs is determined as the fair market value of the underlying shares on the date of grant. The weighted average grant date fair value of RSUs granted without market conditions for the year ended December 31, 2015, the nine months ended December 31, 2014, and the fiscal year ended March 31, 2014 was $51.94, $54.67, and $53.64, respectively. The weighted average fair value of RSUs granted with market conditions during the year ended December 31, 2015 is estimated at $15.49 per share on the date of grant using the following weighted average assumptions: risk-free interest rate of 1.6%; an expected life of approximately 5 years; volatility of 31.3%; and dividend yield of 0.0% over the expected life of the RSUs. The weighted average fair value of RSUs granted with market conditions during the nine months ended December 31, 2014 is estimated at $15.75 per share on the date of grant using the following weighted average assumptions: risk-free interest rate of 1.7%; an expected life of approximately 5 years; volatility of 30.0%; and dividend yield of 0.0% over the expected life of the RSUs.
During the year ended December 31, 2015, the nine months ended December 31, 2014, and the fiscal year ended March 31, 2014, participants vested in 362,654, 387,377, and 346,310 RSUs, respectively, for a total intrinsic value of $19.0 million, $22.0 million, and $17.2 million, respectively. Intrinsic value is calculated as the number of shares vested times the Company’s closing stock price on the NASDAQ Global Select Market at the vesting date. Of the RSUs vested in the year ended December 31, 2015, the nine months ended December 31, 2014, and the fiscal year ended March 31, 2014, 115,497, 133,129, and 119,108 shares, respectively, were withheld to satisfy minimum employee tax withholding.
The following table summarizes the changes in RSUs during the year ended December 31, 2015, the nine months ended December 31, 2014, and the fiscal year ended March 31, 2014 for all of the stock incentive plans described above.
92
Number of Performance-Based RSUs | Weighted Average Grant Date Fair Value | Number of RSUs | Weighted Average Grant Date Fair Value | ||||||||||
Non-vested, March 31, 2013 | 11,000 | $ | 35.55 | 932,206 | $ | 29.42 | |||||||
Granted | 31,880 | $ | 52.12 | 518,504 | $ | 53.74 | |||||||
Forfeited | — | $ | — | (36,818 | ) | $ | 39.88 | ||||||
Vested | — | $ | — | (346,310 | ) | $ | 26.53 | ||||||
Non-vested, March 31, 2014 | 42,880 | $ | 47.87 | 1,067,582 | $ | 41.81 | |||||||
Granted | 152,957 | $ | 28.43 | 183,156 | $ | 55.02 | |||||||
Forfeited | (8,540 | ) | $ | 51.15 | (4,076 | ) | $ | 48.83 | |||||
Vested | — | $ | — | (387,377 | ) | $ | 32.27 | ||||||
Non-vested, December 31, 2014 | 187,297 | $ | 31.85 | 859,285 | $ | 48.89 | |||||||
Granted | 191,740 | $ | 49.87 | 376,771 | $ | 52.99 | |||||||
Forfeited | (78,005 | ) | $ | 48.16 | (33,789 | ) | $ | 55.74 | |||||
Vested | — | $ | — | (362,654 | ) | $ | 43.43 | ||||||
Non-vested, December 31, 2015 | 301,032 | $ | 39.10 | 839,613 | $ | 52.82 | |||||||
Employee stock purchase plan
The Company sponsors an employee stock purchase plan (“ESPP”) for all eligible employees. Under the ESPP, employees authorize payroll deductions from 1% to 15% of their eligible compensation to purchase shares of the Company’s common stock. Under the ESPP, shares of the Company’s common stock may be purchased at the end of each fiscal quarter at 95% of the closing price of the Company’s common stock. A total of 1,684,000 shares of the Company’s common stock are authorized under the ESPP. As of December 31, 2015, a total of 1,467,470 shares were available for issuance under the ESPP. During the year ended December 31, 2015, the nine months ended December 31, 2014, and the fiscal year ended March 31, 2014, the Company issued 10,496, 9,241, and 8,962 shares, respectively, under the ESPP at an average price of $48.11, $46.64, and $57.31 per share, respectively. The compensation expense related to the ESPP recorded in the year ended December 31, 2015, the nine months ended December 31, 2014, and the fiscal year ended March 31, 2014 was not material to the consolidated financial statements.
Valuation assumptions and equity based award activity
As discussed in Note 2, “Summary of significant accounting policies,” determining the estimated fair value of stock-based awards is judgmental in nature and involves the use of significant estimates and assumptions, including the term of the stock-based awards, risk-free interest rates over the vesting period, expected dividend rates, the price volatility of the Company’s shares, and forfeiture rates of the awards.
Stock option valuation
The Company calculates the fair value of all stock option awards, with the exception of the stock options issued with market-based conditions, on the date of grant using the Black-Scholes model. Those stock option awards that have market-based conditions are valued using a Monte Carlo model. The expected term for its stock options is determined through analysis of historical data on employee exercises, vesting periods of awards, and post-vesting employment termination behavior. The risk-free interest rate is based on U.S. Treasury bonds issued with life terms similar to the expected life of the grant. Volatility is calculated based on historical volatility of the daily closing price of the Company’s common stock continuously compounded with a look-back period similar to the terms of the expected life of the grant. The Company has not declared or paid any cash dividends on its common stock since the closing of its initial public offering and does not currently anticipate declaring or paying any cash dividends. The timing and amount of future cash dividends, if any, is periodically evaluated by the Company’s board of directors and would depend upon, among other factors, the Company’s earnings, financial condition, cash requirements, and contractual restrictions.
The following average key assumptions were used in the valuation of all stock options granted in each respective period:
93
Year Ended December 31, | Nine Months Ended December 31, | Year Ended March 31, | ||||||
2015 | 2014 | 2014 | ||||||
Stock option grants: | ||||||||
Risk-free interest rate | 1.18% – 1.67% | 1.53% – 1.75% | 0.34% – 1.71% | |||||
Expected lives in years | 4.00 – 5.45 | 5.00 – 5.47 | 3.25 – 5.50 | |||||
Expected volatility | 31.2% – 33.0% | 29.8% – 30.9% | 30.4% – 38.0% | |||||
Dividend yield | — | % | — | % | — | % | ||
Weighted average exercise price of options granted | 50.45 | 52.28 | 51.71 | |||||
Weighted average grant date fair value of options granted | 15.49 | 14.49 | 14.77 | |||||
Number of options granted | 2,102,916 | 1,144,973 | 536,958 | |||||
Valuation for restricted stock units
RSUs without market conditions are valued at the grant date closing price of the Company’s common stock as reported on the NASDAQ Global Select Market. Those RSU awards that have market-based conditions are valued using a Monte Carlo model. The expected term for those RSUs is based on the vesting periods of the awards. The risk-free interest rate is based on U.S. Treasury bonds issued with life terms similar to the expected life of the grant. Volatility is calculated based on historical volatility of the daily closing price of the Company’s common stock continuously compounded with a look-back period similar to the terms of the expected life of the grant. The dividend yield assumption is based on the fact that the Company has not declared or paid any cash dividends on its common stock since the closing of its initial public offering and does not currently anticipate declaring or paying any cash dividends. The timing and amount of future cash dividends, if any, is periodically evaluated by the Company’s board of directors and would depend upon, among other factors, the Company’s earnings, financial condition, cash requirements, and contractual restrictions.
Valuation for employee stock purchase rights
The value of employee stock purchase rights for shares of stock purchased under the ESPP is determined as the fair market value of the underlying shares on the date of purchase as determined by the closing price of the Company’s common stock as reported on the NASDAQ Global Select Market, less the purchase price, which is 95% of the closing price of the Company’s common stock. The ESPP enrollment begins on the first day of the quarter. Stock purchases occur on the last day of the quarter, with only eligible employee payroll deductions for the period used to calculate the shares purchased. There is no estimate of grant date fair value or estimated forfeitures, since actual compensation expense was recorded in the period on the purchase date. The fair value of employee stock purchase rights is equivalent to a 5% discount of the purchase date closing price.
Forfeitures
Forfeitures are estimated based on historical experience at the time of grant and adjusted, if necessary, in subsequent periods if actual forfeitures differ from those estimates. Stock-based compensation expense is recognized on a straight-line basis, net of an estimated forfeiture rate, for only those shares expected to vest over the requisite service period of the award, which is generally the option vesting term, and can range from six months to five years. Changes in estimated forfeitures will be recognized through a cumulative catch-up adjustment in the period of change and will also impact the amount of compensation expense to be recognized in future periods. The Company analyzes forfeiture rates using six separate groups; one group for members of the Company’s board of directors, three separate groups of executives based on seniority, and two groups for general employees. Two of these groups, the Royall executive group and the Royall general employee group, were created in the year ended December 31, 2015 in order to apply separate forfeiture rates to the Royall inducement plan awards. The Company uses an annualized forfeiture rate of 9.1% for the Royall executive team and 4.0% for the Royall general employees. During the year ended December 31, 2015, the Company also increased its estimated annualized forfeiture rate for one of its general employee groups from 4.2% to 4.6%. Annualized forfeiture rates for the remaining groups are 0%, 0.4%, and 1.0% for members of the Company's board of directors, and two groups of executives, respectively.
Compensation expense
The Company recognized stock-based compensation expense in the following consolidated statements of operations line items for stock options and RSUs and for shares issued under the Company’s ESPP, for the year ended December 31, 2015,
94
the nine months ended December 31, 2014, and the fiscal year ended March 31, 2014 (in thousands, except per share amounts):
Year Ended December 31, | Nine Months Ended December 31, | Year Ended March 31, | |||||||||
2015 | 2014 | 2014 | |||||||||
Stock-based compensation expense included in: | |||||||||||
Costs and expenses: | |||||||||||
Cost of services | $ | 9,211 | $ | 5,977 | $ | 5,527 | |||||
Member relations and marketing | 14,706 | 3,348 | 3,688 | ||||||||
General and administrative | 5,176 | 8,640 | 9,002 | ||||||||
Total costs and expenses | 29,093 | 17,965 | 18,217 | ||||||||
Operating income | $ | (29,093 | ) | $ | (17,965 | ) | $ | (18,217 | ) | ||
There are no stock-based compensation costs capitalized as part of the cost of an asset.
Stock-based compensation expense by award type is shown below (in thousands):
Year Ended December 31, | Nine Months Ended December 31, | Year Ended March 31, | |||||||||
2015 | 2014 | 2014 | |||||||||
Stock-based compensation expense by award type: | |||||||||||
Stock options | $ | 10,908 | $ | 5,431 | $ | 4,846 | |||||
Restricted stock units | 18,185 | 12,534 | 13,371 | ||||||||
Total stock-based compensation | $ | 29,093 | $ | 17,965 | $ | 18,217 | |||||
As of December 31, 2015, $59.2 million of total unrecognized compensation cost related to stock-based awards was expected to be recognized over a weighted average period of 2.7 years.
Tax benefits
The benefits of tax deductions in excess of recognized book compensation expense are reported as a financing cash inflow with a corresponding operating cash outflow in the consolidated statements of cash flows. Approximately $4.9 million, $0.4 million, and $19.5 million of tax benefits associated with the exercise of employee stock options and RSUs were recorded as cash from financing activities in the year ended December 31, 2015, the nine months ended December 31, 2014, and the fiscal year ended March 31, 2014, respectively.
95
Note 15. | Income taxes |
The provision for income taxes consists of the following (in thousands):
Year Ended December 31, | Nine Months Ended December 31, | Year Ended March 31, | |||||||||
2015 | 2014 | 2014 | |||||||||
Current tax expense | |||||||||||
Federal | $ | 6,225 | $ | 3,613 | $ | 9,493 | |||||
State and local | 1,781 | 1,680 | 1,373 | ||||||||
Foreign | 524 | 620 | 547 | ||||||||
Total current tax expense | $ | 8,530 | $ | 5,913 | $ | 11,413 | |||||
Deferred tax (benefit) expense | |||||||||||
Federal | $ | (6,376 | ) | $ | (297 | ) | $ | 7,120 | |||
State and local | 13,046 | (2,086 | ) | 204 | |||||||
Foreign | — | — | — | ||||||||
Total deferred tax (benefit) expense | $ | 6,670 | $ | (2,383 | ) | $ | 7,324 | ||||
Provision for income taxes | $ | 15,200 | $ | 3,530 | $ | 18,737 | |||||
The components of Income before provision for income taxes were as follows (in thousands):
Year Ended December 31, | Nine Months Ended December 31, | Year Ended March 31, | |||||||||
2015 | 2014 | 2014 | |||||||||
U.S. sources | $ | (101,386 | ) | $ | 10,445 | $ | 46,632 | ||||
Non-U.S. sources | 1,968 | 2,331 | 2,029 | ||||||||
Total | $ | (99,418 | ) | $ | 12,776 | $ | 48,661 | ||||
96
The provision for income taxes differs from the amount of income taxes determined by applying the applicable income tax statutory rates to income before provision for income taxes as follows:
Year Ended December 31, | Nine Months Ended December 31, | Year Ended March 31, | ||||||
2015 | 2014 | 2014 | ||||||
Statutory U.S. federal income tax rate | 35.0 | % | 35.0 | % | 35.0 | % | ||
Section 162(m) compensation | (0.8 | )% | 11.7 | % | 1.6 | % | ||
State income tax, net of U.S. federal income tax benefit | 3.5 | % | 7.4 | % | 6.0 | % | ||
Tax-exempt interest income | — | % | (2.5 | )% | (1.7 | )% | ||
Washington, D.C. QHTC income tax credits and D.C. law changes | (13.4 | )% | (9.8 | )% | (4.0 | )% | ||
Uncertain Tax Position | 0.7 | % | 5.4 | % | — | % | ||
Federal R&D credit | 1.8 | % | (25.7 | )% | — | % | ||
Return to accrual adjustment | (0.4 | )% | 3.2 | % | — | % | ||
Goodwill impairment | (38.3 | )% | — | % | — | % | ||
Other permanent differences, net | (3.4 | )% | 2.9 | % | 1.6 | % | ||
Effective tax rate on continuing operations | (15.3 | )% | 27.6 | % | 38.5 | % | ||
Deferred income taxes are provided for temporary differences between the tax bases of assets and liabilities and their reported amounts on the consolidated financial statements. The tax effect of these temporary differences is presented below (in thousands):
As of December 31, | |||||||
2015 | 2014 | ||||||
Deferred income tax assets (liabilities): | |||||||
Washington, D.C. QHTC income tax credits | $ | — | $ | 11,571 | |||
Federal R&D credits | 420 | 3,718 | |||||
Deferred compensation accrued for financial reporting purposes | 13,284 | 11,228 | |||||
Stock-based compensation | 15,724 | 11,350 | |||||
Acquired net operating loss carryforwards | 5,421 | 7,335 | |||||
Reserve for uncollectible revenue | 2,119 | 3,123 | |||||
Book/tax basis difference in investment in unconsolidated entities | 7,208 | 5,141 | |||||
Debt issuance costs | 2,801 | — | |||||
Deferred rent | 1,466 | — | |||||
Unrealized losses on available-for-sale securities | — | 39 | |||||
Other | 1,167 | 1,591 | |||||
Total deferred tax assets | 49,610 | 55,096 | |||||
Valuation allowance | (49 | ) | (5,141 | ) | |||
Total deferred tax assets, net of valuation allowance | 49,561 | 49,955 | |||||
Capitalized software development costs | (31,042 | ) | (29,157 | ) | |||
Deferred incentive compensation and other deferred charges | (11,940 | ) | (12,710 | ) | |||
Acquired intangibles and goodwill; and acquisition related costs | (97,278 | ) | (118 | ) | |||
Depreciation | (3,031 | ) | (548 | ) | |||
Other | (163 | ) | (156 | ) | |||
Total deferred tax liabilities | (143,454 | ) | (42,689 | ) | |||
Net deferred income tax (liabilities) assets | $ | (93,893 | ) | $ | 7,266 | ||
97
The Company has $5.4 million, tax effected, of U.S. federal and state net operating loss carryforwards available at December 31, 2015, some of which are a result of recent acquisitions. These carryforwards will be used to offset future income but maybe limited by the change in ownership rules in Section 382 of the Internal Revenue Code. These net operating loss carryforwards will begin to expire in 2022. The Company anticipates it will be able to use all of its acquired net operating loss carryforwards. In estimating future tax consequences, the Company generally considers all expected future events in the determination and evaluation of deferred tax assets and liabilities. The Company believes that its estimated future ordinary taxable income will be sufficient for the full realization of its deferred income tax assets. The effect of future changes in existing laws or rates is not considered in the determination and evaluation of deferred tax assets and liabilities until the new tax laws or rates are enacted.
The Company has recorded a deferred tax asset resulting from the book tax basis difference in investment in unconsolidated entities. In the year ended December 31, 2015, the Company considered the manner in which the tax-over-book basis difference would reverse and determined that, based on all available evidence; it was more-likely-than-not the Company would recover the basis difference. As result of this analysis, the Company reversed a $6.7 million valuation allowance during the three months ended June 30, 2015. The effect of the valuation allowance release was recorded as equity in loss of unconsolidated entities.
The Company uses a more-likely-than-not recognition threshold based on the technical merits of the tax position taken for the financial statement recognition and measurement of a tax position. If a tax position does not meet the more-likely-than-not initial recognition threshold, no benefit is recorded in the financial statements. The Company does not currently anticipate that the total amounts of unrecognized tax benefits will significantly change within the next twelve months. The Company classifies interest and penalties on any unrecognized tax benefits as a component of the provision for income taxes. The amount accrued for interest and penalties for the twelve months ended December 31, 2015 was immaterial. No interest or penalties were recognized in the consolidated statements of operations for the nine months ended December 31, 2014 and the year ended March 31, 2014. The Company files income tax returns in U.S. federal and state and foreign jurisdictions. With few exceptions, the Company is no longer subject to U.S. federal, state, and local tax examinations for filings in major tax jurisdictions before 2011.
Deferred U.S. income taxes have not been provided for the portion of the difference between book and tax basis in non-U.S. subsidiaries, which is essentially permanent in duration. Determination of the amount of these taxes is not practicable.
During the year ended December 31, 2015, the Company claimed $1.8 million in federal research and development credits. For the nine months ended December 31, 2014, the Company claimed $4.6 million in federal research and development credits for the 2012, 2013, and 2014 tax years.
Uncertain Tax Positions
The following table summarizes the activity related to our reserve for unrecognized tax positions (in thousands):
Year Ended December 31, | Nine Months Ended December 31, | Year Ended March 31, | |||||||||
2015 | 2014 | 2014 | |||||||||
Balance at beginning of the period | $ | 828 | $ | — | $ | — | |||||
Additions based on tax positions related to the current periods | 281 | 497 | — | ||||||||
Additions for tax positions of prior periods | — | 331 | — | ||||||||
Positions assumed in acquisition | 276 | — | — | ||||||||
Reductions for tax positions of prior periods | — | — | — | ||||||||
Reductions for lapse of statute of limitations | — | — | — | ||||||||
Settlements | — | — | — | ||||||||
Balance at end of the period | $ | 1,385 | $ | 828 | $ | — | |||||
If the Company was able to recognize the uncertain tax positions of $1.4 million, the entire balance would affect the Company’s effective tax rate.
Washington, D.C. income tax incentives
The Office of Tax and Revenue of the Government of the District of Columbia (the “Office of Tax and Revenue”) provides regulations that modify the income and franchise tax, sales and use tax, and personal property tax regulations for Qualified High Technology Companies (“QHTC”) doing business in the District of Columbia. New legislation was enacted by
98
the District of Columbia City Council in the first quarter of 2015 which affects the way that the Company will pay income taxes in future periods. As a result of the new legislation, the Company wrote-off substantially all of its District of Columbia deferred tax asset balances during the first quarter of 2015. Included in this adjustment was an entry to write-off all prior District of Columbia income tax credits, $14.2 million as of December 31, 2015.
Note 16. | Commitments and contingencies |
Operating leases
The Company leases its headquarters space under an operating lease that expires in May 2019. Leasehold improvements related to leases are depreciated over the term of the lease and totaled approximately $37.0 million, net, and $35.7 million, net, as of December 31, 2015 and 2014, respectively. The terms of the lease contain provisions for rental escalation, and the Company is required to pay its portion of executory costs such as taxes, insurance, and operating expenses. The Company also entered into a build-to-suit lease arrangement for a new corporate headquarters in December 2015. See Note 7, “Property and equipment,” for further information regarding this arrangement.
The Company also leases office space under operating leases in Birmingham, Alabama; Tucson, Arizona; San Francisco, California; Chicago, Illinois; Bloomington, Minnesota; Plymouth Meeting, Pennsylvania; Nashville, Tennessee; Austin, Texas; Houston, Texas; Richmond, Virginia; and London, England. The Company also leases office space in Chennai, India through its Indian subsidiary, ABCO Advisory Services India Private Ltd. The lease expiration dates are July 2018 for the Alabama lease, August 2016 for the Arizona lease, August 2017 for the California lease, June 2022 for the Illinois lease, July 2020 for the Minnesota lease, September 2016 for the Pennsylvania lease, April 2020 for the Tennessee leases, March 2021 for the Texas leases, March 2022 for the Virginia leases, April 2020 for the England lease, and November 2016 for the India lease.
The Company recognized rental and executory expenses of $23.1 million, $13.2 million, and $17.4 million, in the year ended December 31, 2015, the nine months ended December 31, 2014, and the fiscal year ended March 31, 2014, respectively, related to these leases. The Company subleases office space in Nashville, Tennessee. The total of minimum rentals to be received in the future under non-cancelable subleases as of December 31, 2015 is $0.3 million.
The following table details the future minimum lease payments under the Company’s current leases (in thousands):
Year Ending December 31, | Operating Leases | Build-to-Suit Lease Obligation | Total Lease Obligations | ||||||||
2016 | $ | 18,775 | $ | — | $ | 18,775 | |||||
2017 | 17,623 | — | 17,623 | ||||||||
2018 | 17,462 | — | 17,462 | ||||||||
2019 | 11,149 | 16,515 | 27,664 | ||||||||
2020 | 5,986 | 25,018 | 31,004 | ||||||||
Thereafter | 9,402 | 404,600 | 414,002 | ||||||||
Total | $ | 80,397 | $ | 446,133 | $ | 526,530 | |||||
Purchase obligation
The Company has entered into a non-cancelable agreement for the purchase of data. As of December 31, 2015, the Company’s minimum obligation in connection with this agreement extends through May 2019. The minimum payments expected to be made under this agreement for each of the following three fiscal years ending December 31, 2016 through 2018 are: $3.0 million, $2.0 million, and $1.0 million, respectively.
Benefit plan
The Company sponsors a defined contribution 401(k) plan (the “401(k) Plan”) for all employees who have reached the age of 21. The Company provides discretionary matching contributions in the range of 0% to 100%, which percentage is determined by the Company after the end of the applicable plan year, of an employee’s contribution up to a maximum of 4% of base salary. Contributions to the 401(k) Plan for the year ended December 31, 2015, the nine months ended December 31, 2014, and the fiscal year ended March 31, 2014, were approximately $4.9 million, $0.0 million, and $4.6 million, respectively.
99
Litigation
From time to time, the Company is engaged in certain legal disputes arising in the ordinary course of business, such as employment-related claims. When the likelihood of a loss contingency becomes at least reasonably possible with respect to any of these disputes, or, as applicable in the future, if there is at least a reasonable possibility that a loss exceeding amounts already recognized may have been incurred, the Company will revise its disclosures in accordance with the relevant authoritative guidance and will accrue a liability for loss contingencies when the Company believes that it is both probable that a liability has been incurred and that the amount of the loss can be reasonably estimated. The Company will review these accruals and adjust them to reflect ongoing negotiations, settlements, rulings, advice of legal counsel, and other relevant information. To the extent that new information is obtained, and the Company's views on the probable outcomes of claims, suits, assessments, investigations, or legal proceedings change, the Company will record changes in its accrued liabilities in the period in which such determination is made. As of December 31, 2015, the Company was not a party to, and its property was not subject to, any material legal proceedings.
Other
As of December 31, 2015, the Company had outstanding letters of credit totaling $1.4 million to provide security deposits for certain office space leases. The letters of credit expire annually but will automatically extend for another annual term from their expiration dates unless the Company terminates them. To date, no amounts have been drawn on these agreements.
Note 17. | Segment and geographic areas |
Operating segments are defined as components of an enterprise for which separate financial information is available and regularly evaluated by the chief operating decision maker, who is the chief executive officer, in deciding how to allocate resources and assessing performance. Under this definition, the Company has one operating segment as of December 31, 2015. Over the past few years, the Company has completed several acquisitions. These acquisitions have allowed the Company to expand its existing offerings and enhance membership services. The Company’s business operates in one operating segment because the Company’s chief operating decision maker evaluates the Company’s financial information and resources and assesses the performance of these resources on a consolidated basis. Since the Company operates in one operating segment, all required financial segment information can be found in the consolidated financial statements.
Substantially all of the Company’s identifiable assets are located in the United States. The following table sets forth revenue information for each geographic area for the year ended December 31, 2015, the nine months ended December 31, 2014, and the fiscal year ended March 31, 2014 (in thousands):
Year Ended December 31, | Nine Months Ended December 31, | Year Ended March 31, | |||||||||
2015 | 2014 | 2014 | |||||||||
United States | $ | 749,880 | $ | 417,194 | $ | 503,044 | |||||
Other countries | 18,468 | 16,808 | 16,385 | ||||||||
Total revenue | $ | 768,348 | $ | 434,002 | $ | 519,429 | |||||
Note 18. Quarterly financial data (unaudited)
As described in Note 2, "Summary of significant accounting policies," the Company revised certain items in the consolidated financial statements for certain quarters within the year ended December 31, 2015 and within the nine months ended December 31, 2014 to correct for errors attributable to timing of contingent revenue recognition, software cost capitalization and related amortization, and income tax adjustments. The impact of the errors in the prior periods was not material to the Company in any of those periods; however, an adjustment to correct the aggregate amount of the prior period errors would have been material to the Company’s current year statement of income. The Company has applied the guidance for accounting changes and error correction and has corrected these errors for all prior periods presented by revising the consolidated financial statements and other financial information included in this report. The Company has concluded that the errors are not material to any of the previously reported interim financial statements. Nevertheless, the affected interim financial statements will be revised when reissued in future periodic filings with the Securities and Exchange Commission.
100
Unaudited summarized financial data by quarter for the year ended December 31, 2015 and the nine months ended December 31, 2014 are as follows (in thousands, except per share amounts).
Three Months Ended December 31, 2015 | ||
Income statement: | ||
Revenue | 204,951 | |
Operating income | (86,542 | ) |
Income before provision for income taxes and equity in loss of unconsolidated entities | (95,549 | ) |
Net income attributable to common stockholders | (101,793 | ) |
Earnings per share: | ||
Net income attributable to common stockholders per share — basic | (2.43 | ) |
Net income attributable to common stockholders per share — diluted | (2.43 | ) |
Three Months Ended September 30, 2015 | ||||||||
As reported | Adjustments | As adjusted | ||||||
Income statement: | ||||||||
Revenue | 200,238 | 254 | 200,492 | |||||
Cost of services, excluding depreciation and amortization | 101,373 | (11 | ) | 101,362 | ||||
Depreciation and amortization | 18,494 | 15 | 18,509 | |||||
Operating income | 18,901 | 250 | 19,151 | |||||
Income before provision for income taxes and equity in loss of unconsolidated entities | 12,301 | 250 | 12,551 | |||||
Provision for income taxes | (7,156 | ) | (1,434 | ) | (8,590 | ) | ||
Net income before allocation to noncontrolling interest | 1,856 | (1,184 | ) | 672 | ||||
Net income attributable to common stockholders | 1,856 | (1,184 | ) | 672 | ||||
Earnings per share: | ||||||||
Net income attributable to common stockholders per share — basic | 0.04 | (0.02 | ) | 0.02 | ||||
Net income attributable to common stockholders per share — diluted | 0.04 | (0.02 | ) | 0.02 | ||||
Comprehensive loss | (276 | ) | (1,184 | ) | (1,460 | ) | ||
Nine Months Ended September 30, 2015 | ||||||||
As reported | Adjustments | As adjusted | ||||||
Statement of cash flows: | ||||||||
Net loss before allocation to noncontrolling interest | (13,117 | ) | (617 | ) | (13,734 | ) | ||
Depreciation and amortization | 55,067 | (784 | ) | 54,283 | ||||
Prepaid expenses and other current assets | 7,978 | (382 | ) | 7,596 | ||||
Deferred revenue | 57,172 | 1,297 | 58,469 | |||||
Net cash provided by operating activities | 108,044 | (487 | ) | 107,557 | ||||
Purchases of property and equipment | (39,985 | ) | 487 | (39,498 | ) | |||
Net cash used in investing activities | (777,935 | ) | 487 | (777,448 | ) | |||
101
Three Months Ended June 30, 2015 | ||||||||
As reported | Adjustments | As adjusted | ||||||
Income statement: | ||||||||
Revenue | 184,661 | (1,078 | ) | 183,583 | ||||
Cost of services, excluding depreciation and amortization | 92,221 | 315 | 92,536 | |||||
Depreciation and amortization | 19,499 | (1,000 | ) | 18,499 | ||||
Operating income | 12,713 | (393 | ) | 12,320 | ||||
Income before provision for income taxes and equity in loss of unconsolidated entities | 7,431 | (393 | ) | 7,038 | ||||
Provision for income taxes | (2,716 | ) | (656 | ) | (3,372 | ) | ||
Net income before allocation to noncontrolling interest | 8,715 | (1,049 | ) | 7,666 | ||||
Net income attributable to common stockholders | 8,715 | (1,049 | ) | 7,666 | ||||
Earnings per share: | ||||||||
Net income attributable to common stockholders per share — basic | 0.21 | (0.03 | ) | 0.18 | ||||
Net income attributable to common stockholders per share — diluted | 0.20 | (0.02 | ) | 0.18 | ||||
Comprehensive income | 9,462 | (1,049 | ) | 8,413 | ||||
Six Months Ended June 30, 2015 | ||||||||
As reported | Adjustments | As adjusted | ||||||
Statement of cash flows: | ||||||||
Net loss before allocation to noncontrolling interest | (14,973 | ) | 567 | (14,406 | ) | |||
Depreciation and amortization | 36,573 | (799 | ) | 35,774 | ||||
Prepaid expenses and other current assets | (178 | ) | (1,816 | ) | (1,994 | ) | ||
Deferred revenue | 45,104 | 1,551 | 46,655 | |||||
Net cash provided by operating activities | 42,227 | (498 | ) | 41,729 | ||||
Purchases of property and equipment | (23,783 | ) | 498 | (23,285 | ) | |||
Net cash used in investing activities | (758,449 | ) | 498 | (757,951 | ) | |||
102
Three Months Ended March 31, 2015 | ||||||||
As reported | Adjustments | As adjusted | ||||||
Income statement: | ||||||||
Revenue | 179,795 | (473 | ) | 179,322 | ||||
Cost of services, excluding depreciation and amortization | 95,307 | 183 | 95,490 | |||||
Depreciation and amortization | 17,074 | 200 | 17,274 | |||||
Operating income | 5,014 | (856 | ) | 4,158 | ||||
Loss before provision for income taxes and equity in loss of unconsolidated entities | (19,115 | ) | (856 | ) | (19,971 | ) | ||
Provision for income taxes | (2,194 | ) | 2,472 | 278 | ||||
Net loss before allocation to noncontrolling interest | (23,688 | ) | 1,616 | (22,072 | ) | |||
Net loss attributable to common stockholders | (23,688 | ) | 1,616 | (22,072 | ) | |||
Earnings per share: | ||||||||
Net loss attributable to common stockholders per share — basic | (0.58 | ) | 0.04 | (0.54 | ) | |||
Net loss attributable to common stockholders per share — diluted | (0.58 | ) | 0.04 | (0.54 | ) | |||
Comprehensive loss | (23,769 | ) | 1,616 | (22,153 | ) | |||
Three Months Ended March 31, 2015 | ||||||||
As reported | Adjustments | As adjusted | ||||||
Statement of cash flows: | ||||||||
Net loss before allocation to noncontrolling interest | (23,688 | ) | 1,616 | (22,072 | ) | |||
Depreciation and amortization | 17,074 | 200 | 17,274 | |||||
Prepaid expenses and other current assets | (4,353 | ) | (2,472 | ) | (6,825 | ) | ||
Deferred revenue | (19,105 | ) | 473 | (18,632 | ) | |||
Net cash provided by operating activities | 43,098 | (183 | ) | 42,915 | ||||
Purchases of property and equipment | (10,895 | ) | 183 | (10,712 | ) | |||
Net cash used in investing activities | (740,357 | ) | 183 | (740,174 | ) | |||
Three Months Ended December 31, 2014 | ||||||||
As reported | Adjustments | As adjusted | ||||||
Income statement: | ||||||||
Revenue | 150,188 | (1,139 | ) | 149,049 | ||||
Cost of services, excluding depreciation and amortization | 81,873 | — | 81,873 | |||||
Depreciation and amortization | 11,237 | (494 | ) | 10,743 | ||||
Operating loss | (1,082 | ) | (645 | ) | (1,727 | ) | ||
Loss before provision for income taxes and equity in loss of unconsolidated entities | (2,268 | ) | (645 | ) | (2,913 | ) | ||
Provision for income taxes | (188 | ) | 266 | 78 | ||||
Net loss before allocation to noncontrolling interest | (5,649 | ) | (379 | ) | (6,028 | ) | ||
Net loss attributable to common stockholders | (5,012 | ) | (379 | ) | (5,391 | ) | ||
Earnings per share: | ||||||||
Net loss attributable to common stockholders per share — basic | (0.14 | ) | (0.01 | ) | (0.15 | ) | ||
Net loss attributable to common stockholders per share — diluted | (0.14 | ) | (0.01 | ) | (0.15 | ) | ||
Comprehensive loss | (4,461 | ) | (379 | ) | (4,840 | ) | ||
103
Three Months Ended September 30, 2014 | ||||||||
As reported | Adjustments | As adjusted | ||||||
Income statement: | ||||||||
Revenue | 144,220 | (400 | ) | 143,820 | ||||
Cost of services, excluding depreciation and amortization | 74,078 | — | 74,078 | |||||
Depreciation and amortization | 9,679 | 316 | 9,995 | |||||
Operating income | 9,098 | (716 | ) | 8,382 | ||||
Income before provision for income taxes and equity in loss of unconsolidated entities | 8,247 | (716 | ) | 7,531 | ||||
Provision for income taxes | (710 | ) | 296 | (414 | ) | |||
Net income before allocation to noncontrolling interest | 6,340 | (420 | ) | 5,920 | ||||
Net income attributable to common stockholders | 6,490 | (420 | ) | 6,070 | ||||
Earnings per share: | ||||||||
Net income attributable to common stockholders per share — basic | 0.18 | (0.01 | ) | 0.17 | ||||
Net income attributable to common stockholders per share — diluted | 0.18 | (0.01 | ) | 0.17 | ||||
Comprehensive income | 6,904 | (420 | ) | 6,484 | ||||
Six Months Ended September 30, 2014 | ||||||||
As reported | Adjustments | As adjusted | ||||||
Statement of cash flows: | ||||||||
Net income before allocation to noncontrolling interest | 10,203 | (1,469 | ) | 8,734 | ||||
Depreciation and amortization | 18,757 | 816 | 19,573 | |||||
Deferred income taxes | 2,639 | (1,034 | ) | 1,605 | ||||
Deferred revenue | 10,090 | 1,087 | 11,177 | |||||
Net cash provided by operating activities | 19,576 | (600 | ) | 18,976 | ||||
Purchases of property and equipment | (26,634 | ) | 600 | (26,034 | ) | |||
Net cash provided by investing activities | 23,002 | 600 | 23,602 | |||||
104
Three Months Ended June 30, 2014 | ||||||||
As reported | Adjustments | As adjusted | ||||||
Income statement: | ||||||||
Revenue | 141,820 | (687 | ) | 141,133 | ||||
Cost of services, excluding depreciation and amortization | 74,218 | 600 | 74,818 | |||||
Depreciation and amortization | 9,078 | 501 | 9,579 | |||||
Operating income | 9,236 | (1,788 | ) | 7,448 | ||||
Income before provision for income taxes and equity in loss of unconsolidated entities | 9,946 | (1,788 | ) | 8,158 | ||||
Provision for income taxes | (3,933 | ) | 739 | (3,194 | ) | |||
Net income before allocation to noncontrolling interest | 3,863 | (1,049 | ) | 2,814 | ||||
Net loss attributable to common stockholders | (3,177 | ) | (1,049 | ) | (4,226 | ) | ||
Earnings per share: | ||||||||
Net loss attributable to common stockholders per share — basic | (0.09 | ) | (0.03 | ) | (0.12 | ) | ||
Net loss attributable to common stockholders per share — diluted | (0.09 | ) | (0.03 | ) | (0.12 | ) | ||
Comprehensive loss | (2,367 | ) | (1,049 | ) | (3,416 | ) | ||
Three Months Ended June 30, 2014 | ||||||||
As reported | Adjustments | As adjusted | ||||||
Statement of cash flows: | ||||||||
Net income before allocation to noncontrolling interest | 3,863 | (1,049 | ) | 2,814 | ||||
Depreciation and amortization | 9,078 | 501 | 9,579 | |||||
Deferred income taxes | 1,427 | (739 | ) | 688 | ||||
Deferred revenue | 22,318 | 687 | 23,005 | |||||
Net cash provided by operating activities | 2,217 | (600 | ) | 1,617 | ||||
Purchases of property and equipment | (11,965 | ) | 600 | (11,365 | ) | |||
Net cash provided by investing activities | 34,709 | 600 | 35,309 | |||||
Note 19.Subsequent events
On February 1, 2016, the Company’s equity method investment, Evolent Inc., issued 1,067,271 Class A Common Shares to one of its customers. This transaction reduced the Company’s ownership in Evolent Inc. from 15.4% to 15.0% and reduced its direct ownership in Evolent LLC from 8.8% to 8.7%. The Company is currently evaluating the effect that this dilution has on its investment and will finalize its accounting for this transaction once the final valuation report is available.
105
Item 9. Changes in and Disagreements With Accountants on Accounting and Financial Disclosure.
None.
Item 9A. Controls and Procedures.
Evaluation of disclosure controls and procedures
Our Chief Executive Officer, or “CEO,” and Chief Financial Officer, or “CFO,” have evaluated the effectiveness of our disclosure controls and procedures pursuant to Exchange Act Rule 13a-15(b) as of December 31, 2015. Our management, including our CEO and CFO, does not expect that our disclosure controls and procedures or our internal control over financial reporting will prevent all errors and all fraud. A control system, no matter how well designed and operated, can provide only reasonable, not absolute, assurance that the control system’s objectives will be met. Based upon our evaluation, our CEO and CFO have concluded that our disclosure controls and procedures were not effective as of December 31, 2015 due to the material weaknesses in internal control over financial reporting related to our revenue recognition and business combinations processes.
Changes in internal control over financial reporting
During the three months ended December 31, 2015, the Company identified errors, which included errors in prior periods, related to revenue recognition. Specifically, the Company’s controls failed to properly identify and account for customer cancellation provisions and contingent fee arrangements. These errors were attributable to insufficient qualified personnel to handle complex revenue arrangements, as well as to limitations of the Company’s revenue recognition system. These errors were not material to any individual prior period, but the correction of these errors would have been material to the current period consolidated statements of operations, consolidated balance sheets, and consolidated statements of cash flows. Therefore, the errors indicated to management that deficiencies existed in internal control over financial reporting that potentially would not prevent or detect a material misstatement. Consequently, management concluded there was a material weakness in internal control over financial reporting related to revenue recognition as of December 31, 2015. Actions are being implemented to remediate the above identified material weakness, including improvements to the process for contemporaneous review of contracts, additional subject matter expert staff, and an upgraded software solution.
In addition, the Company identified a material weakness related to the Company’s business combination process. The Company identified deficiencies in its controls over review of third-party valuations and related projected financial information. Due to the subjectivity of the estimates inherent in the process and the materiality of the transaction, management concluded that these control deficiencies potentially would not prevent or detect a material misstatement. The Company has added resources to its accounting and financial reporting function to facilitate the timely execution of these controls. Further, additional and more standardized review procedures over third-party valuations and related projections are being implemented to remediate the material weakness. For additional information about the errors and related corrections, see Note 2, “Summary of significant accounting policies,” to our consolidated financial statements included in this report.
Successful remediation of the material weaknesses described above requires review and evidence of the effectiveness of the related internal control processes as part of our periodic assessments of our internal control over financial reporting. As we continue to evaluate and work to enhance our internal control over financial reporting, we may determine that additional measures should be taken to address the material weaknesses described above or other control deficiencies, or that we should modify the remediation plan.
Except as noted in the preceding paragraph, there has been no change in our internal control over financial reporting that occurred during the quarter ended December 31, 2015 that has materially affected, or is reasonably likely to materially affect, our internal control over financial reporting.
Consistent with guidance issued by the Securities and Exchange Commission that an assessment of internal control over financial reporting of a recently acquired business may be omitted from management's evaluation, management is excluding from its assessment Royall Acquisition Co., which we acquired on January 9, 2015. The Royall assets excluded from our assessment represented approximately 7% of the Company’s total assets as of December 31, 2015 and approximately 13% of the Company’s consolidated total revenues for the calendar year ended December 31, 2015.
Item 9B. Other Information.
None.
106
PART III
Item 10. Directors, Executive Officers, and Corporate Governance.
See “Executive Officers” in Part I, Item 1 of this annual report on Form 10-K for information about our executive officers, which is incorporated by reference in this Item 10. Other information required by this Item 10 is incorporated herein by reference to our definitive proxy statement for our 2016 annual meeting of stockholders, referred to as the “ 2016 proxy statement,” which we will file with the SEC on or before 120 days after our fiscal year ended December 31, 2015, and which appears in the 2016 proxy statement, including under the captions “Proposal No. 1—Election of Directors,” “Board Corporate Governance Matters” and “Section 16(a) Beneficial Ownership Reporting Compliance.”
We have adopted a code of ethics for our senior financial officers that applies to all of our senior financial officers, including our chief executive officer, chief financial officer, chief accounting officer, controller, and any person performing similar functions. The code of ethics for our senior financial officers is available to the public in the “The Firm—Investor Relations—Governance” section of our website at www.advisory.com. Any person may request a copy of the code of ethics for our senior financial officers, without charge, by writing to us at The Advisory Board Company, 2445 M Street, N.W., Washington, D.C. 20037, Attention: Corporate Secretary. We intend to satisfy the SEC’s disclosure requirements regarding amendments to, or waivers of, the code of ethics for our senior financial officers by posting such information on our website.
Board of Directors
The following lists the members of our board of directors and the principal occupation of each director as of the date of this report.
Robert W. Musslewhite | David L. Felsenthal | |
Chairman | President, | |
Chief Executive Officer, | The Advisory Board Company | |
The Advisory Board Company | ||
Sanju K. Bansal | Peter J. Grua | |
Founder and Chief Executive Officer, | Partner, HLM Venture Partners | |
Hunch Analytics, LLC | ||
Nancy Killefer | Kelt Kindick | |
Director Emeritus, | Advisory Partner, | |
McKinsey & Company | Bain & Company, Inc. | |
Mark R. Neaman | Leon D. Shapiro | |
President and Chief Executive Officer, | Director, | |
NorthShore University HealthSystem | Vistage International, Inc. | |
LeAnne M. Zumwalt | ||
Group Vice President, | ||
DaVita HealthCare Partners Inc. | ||
107
Item 11. Executive Compensation.
Information required by this Item 11 is incorporated herein by reference to the 2016 proxy statement, including the information in the 2016 proxy statement appearing under the captions “Board Corporate Governance Matters,” “Compensation Committee Report on Executive Compensation,” “Compensation Discussion and Analysis,” “Executive Compensation” and “Potential Payments Upon Termination of Employment or Change of Control.”
Item 12. Security Ownership of Certain Beneficial Owners and Management and Related Stockholder Matters.
Information required by this Item 12 is incorporated herein by reference to the 2016 proxy statement, including the information in the 2016 proxy statement appearing under the captions “Security Ownership” and “Equity Compensation Plan Information.”
Item 13. Certain Relationships and Related Transactions, and Director Independence.
Information required by this Item 13 is incorporated herein by reference to the 2016 proxy statement, including the information in the 2016 proxy statement appearing under the caption “Board Corporate Governance Matters.”
Item 14. Principal Accountant Fees and Services.
Information required by this Item 14 is incorporated herein by reference to the 2016 proxy statement, including the information in the 2016 proxy statement appearing under the caption “Proposal No. 2—Ratification of the Selection of Ernst & Young LLP as Independent Registered Public Accounting Firm for the Fiscal Year Ending December 31, 2016.”
108
Part IV
Item 15. Exhibits, Financial Statement Schedules.
(a) The following documents are filed as part of this report:
(1) The following financial statements of the registrant and report of independent registered public accounting firm are included in Item 8 hereof:
Report of Independent Registered Public Accounting Firm on the Consolidated Financial Statements
Consolidated Balance Sheets as of December 31, 2015 and December 31, 2014
Consolidated Statements of Operations for the year ended December 31, 2015, the nine-month period ended December 31, 2014, and the year ended March 31, 2014
Consolidated Statements of Comprehensive (Loss) Income for the year ended December 31, 2015, the nine-month period ended December 31, 2014, and the year ended March 31, 2014
Consolidated Statements of Changes in Stockholders’ Equity for the year ended December 31, 2015, the nine-month period ended December 31, 2014, and the year ended March 31, 2014
Consolidated Statements of Cash Flows for the year ended December 31, 2015, the nine-month period ended December 31, 2014, and the year ended March 31, 2014
Notes to Consolidated Financial Statements.
(2) Except as provided below, all financial statement schedules for which provision is made in the applicable accounting regulations of the Securities and Exchange Commission either have been included in the Financial Statements or are not required under the related instructions, or are not applicable and therefore have been omitted.
Schedule II—Valuation and Qualifying Accounts
(3) In accordance with Rule 3-09 of Regulation S-X, the audited financial statements of Evolent Health LLC, an equity investee, are filed as an exhibit to this annual report on Form 10-K. The Company's consolidated statements of operations included in Item 8 reflect the Company's proportionate share of Evolent Health LLC's operations for the periods shown.
(4) The Company files herewith or incorporates by reference herein the exhibits identified below. The Company files Annual Reports on Form 10-K, Quarterly Reports on Form 10-Q, and Current Reports on Form 8-K under Commission File No. 000-33283.
109
Exhibit Number | Description of Exhibit | |
2.1 | Stock Purchase Agreement, dated as of December 10, 2014, by and among Royall Holdings, LLC, Royall Acquisition Co. and The Advisory Board Company (the “Company” or the "Registrant"). Incorporated by reference to Exhibit 2.1 of the Company’s Current Report on Form 8-K filed with the Securities and Exchange Commission (the “Commission”) on December 11, 2014. | |
3.1 | Restated Certificate of Incorporation of the Company. Incorporated by reference to Exhibit 3.1 of the Quarterly Report on Form 10-Q of the Company for the quarter ended September 30, 2012. | |
3.2 | Amended and Restated Bylaws of the Company. Incorporated by reference to Exhibit 3.1 of the Company’s Current Report on Form 8-K filed with the Commission on November 14, 2007. | |
4.1 | Form of Common Stock Certificate. Incorporated by reference to Exhibit 4.1 of the Company’s Registration Statement on Form S-1/A (Commission File No. 333-68146) filed with the Commission on October 29, 2001 | |
10.1* | Form of Indemnity Agreement between the Company and certain officers, directors and employees. Incorporated by reference to Exhibit 10.33 of the Company’s Registration Statement on Form S-1/A (Commission File No. 333-68146) filed with the Commission on October 29, 2001. | |
10.2* | Form of Indemnification Agreement between the Company and certain officers, directors and employees. Incorporated by reference to Exhibit 10.5 of the Company’s Quarterly Report on Form 10-Q for the quarter ended September 30, 2009. | |
10.3* | Employee Stock Purchase Plan. Incorporated by reference to Exhibit 10.34 of the Company’s Registration Statement on Form S-1/A (Commission File No. 333-68146) filed with the Commission on October 29, 2001. | |
10.4* | The Advisory Board Company 2005 Stock Incentive Plan. Incorporated by reference to Exhibit 10.1 of the Company’s Current Report on Form 8-K filed with the Commission on November 17, 2005. | |
10.5* | Form of Standard Terms and Conditions for Restricted Stock Units pursuant to The Advisory Board Company 2005 Stock Incentive Plan. Incorporated by reference to Exhibit 10.39 of the Company’s Annual Report on Form 10-K for the fiscal year ended March 31, 2006. | |
10.6* | Form of Restricted Stock Unit Award Agreement pursuant to The Advisory Board Company 2005 Stock Incentive Plan. Incorporated by reference to Exhibit 10.40 of the Company’s Annual Report on Form 10-K for the fiscal year ended March 31, 2006. | |
10.7* | The Advisory Board Company 2006 Stock Incentive Plan. Incorporated by reference to Exhibit 10.1 of the Company’s Current Report on Form 8-K filed with the Commission on November 17, 2006. | |
10.8* | Form of Restricted Stock Award Agreement pursuant to The Advisory Board Company 2005 and 2006 Stock Incentive Plans. Incorporated by reference to Exhibit 10.3 of the Company’s Quarterly Report on Form 10-Q for the quarter ended September 30, 2008. | |
10.9* | Form of Award Agreement for Non-qualified Stock Options pursuant to The Advisory Board Company 2005 and 2006 Stock Incentive Plans. Incorporated by reference to Exhibit 10.1 of the Company’s Quarterly Report on Form 10-Q for quarter ended September 30, 2008. | |
10.10* | The Advisory Board Company Amended and Restated 2009 Stock Incentive Plan. Incorporated by reference to Appendix A to the Definitive Proxy Statement of the Company filed with the Commission on July 26, 2013. | |
10.11* | Form of Award Agreement for Restricted Stock Units pursuant to The Advisory Board Company 2005 and 2009 Stock Incentive Plans. Incorporated by reference to Exhibit 10.2 of the Company’s Current Report on Form 8-K filed with the Commission on September 16, 2009. | |
10.12* | Form of Award Agreement for Qualified Stock Options pursuant to The Advisory Board Company 2005 and 2009 Stock Incentive Plans. Incorporated by reference to Exhibit 10.3 of the Company’s Current Report on Form 8-K filed with the Commission on September 16, 2009. | |
10.13* | Form of Award Agreement for Non-Qualified Stock Options pursuant to The Advisory Board Company 2005 and 2009 Stock Incentive Plans. Incorporated by reference to Exhibit 10.4 of the Company’s Current Report on Form 8-K filed with the Commission on September 16, 2009. | |
10.14* | 2014 Form of Award Agreement for Non-Qualified Stock Options for certain employees pursuant to The Advisory Board Company 2005 and 2009 Stock Incentive Plans. Incorporated by reference to Exhibit 10.18 of the Company’s Annual Report on Form 10-K for the fiscal year ended March 31, 2014. | |
10.15* | Amended and Restated Employment Agreement, dated as of April 3, 2013, between the Company and Robert W. Musslewhite. Incorporated by reference to Exhibit 10.1 of the Company’s Current Report on Form 8-K filed with the Commission on April 8, 2013. | |
110
Exhibit Number | Description of Exhibit | |
10.16* | Amended and Restated Employment Agreement, dated as of April 3, 2013, between the Company and David L. Felsenthal. Incorporated by reference to Exhibit 10.2 of the Company’s Current Report on Form 8-K filed with the Commission on April 8, 2013. | |
10.17* | Executive Nonqualified Excess Plan of The Advisory Board Company, effective May 1, 2013. Incorporated by reference to Exhibit 10.3 of the Company’s Current Report on Form 8-K filed with the Commission on April 8, 2013. | |
10.18 | Agreement of Lease, dated October 20, 2003, between the Company and 2445 M Street Property LLC. Incorporated by reference to Exhibit 10.37 of the Company’s Quarterly Report on Form 10-Q for the quarter ended September 30, 2003. | |
10.19 | Collaboration Agreement, dated as of February 6, 2007, between The Corporate Executive Board Company and the Company (the “Collaboration Agreement”). Incorporated by reference to Exhibit 10.42 of the Company’s Annual Report on Form 10-K filed for the fiscal year ended March 31, 2007. On May 27, 2008, the Commission granted confidential treatment with respect to certain portions of the Collaboration Agreement. | |
10.20 | Letter agreement, dated February 4, 2010, between the Company and The Corporate Executive Board Company concerning the Collaboration Agreement, dated February 6, 2007. Incorporated by reference to Exhibit 10.1 of the Company’s Quarterly Report on Form 10-Q for the quarter ended December 30, 2009. | |
10.21 | Letter agreement, dated November 7, 2011, between the Company and The Corporate Executive Board Company concerning the Collaboration Agreement, dated February 6, 2007. Incorporated by reference to Exhibit 10.2 of the Company’s Quarterly Report on Form 10-Q for the quarter ended September 30, 2011. | |
10.22 | Letter agreement, dated February 5, 2014, between the Company and The Corporate Executive Board Company concerning the Collaboration Agreement, dated February 6, 2007. Incorporated by reference to Exhibit 10.2 of the Company’s Quarterly Report on Form 10-Q for the quarter ended December 31, 2013. | |
10.23 | Registration Rights and Governance Agreement, dated as of January 9, 2015, among the Company and Royall Holdings, LLC. Incorporated by reference to Exhibit 10.4 of the Company’s Current Report on Form 8-K filed with the Commission on January 12, 2015. | |
10.24 | The Advisory Board Company Inducement Stock Incentive Plan for Royall Employees. Incorporated by reference to Exhibit 4.4 of the Company’s Registration Statement on Form S-8 (Commission File No. 333-201982) filed with the Commission on February 9, 2015. | |
10.25 | Form of Award Agreement for Restricted Stock Units pursuant to The Advisory Board Company Inducement Stock Incentive Plan for Royall Employees. Incorporated by reference to Exhibit 10.40 of the Company’s Transition Report on Form 10-K for the period ended December 31, 2014. | |
10.26 | Form of Award Agreement for Non-Qualified Stock Options pursuant to The Advisory Board Company Inducement Stock Incentive Plan for Royall Employees. Incorporated by reference to Exhibit 10.41 of the Company’s Transition Report on Form 10-K for the period ended December 31, 2014. | |
10.27 | Credit Agreement, dated as of February 6, 2015, among the Company, the Lenders party thereto, JPMorgan Chase Bank, N.A., as Administrative Agent, and the other parties thereto. Incorporated by reference to Exhibit 10.1 of the Company’s Current Report on Form 8-K filed with the Commission on February 10, 2015. | |
10.28 | Pledge and Security Agreement, entered into as of February 6, 2015, among the Company and the Subsidiaries of the Company party thereto, as Grantors, and JPMorgan Chase Bank, N.A., as Administrative Agent. Incorporated by reference to Exhibit 10.2 of the Company’s Current Report on Form 8-K filed with the Commission on February 10, 2015. | |
10.29 | Guaranty made as of February 6, 2015 by the Subsidiaries of the Company party thereto in favor of JPMorgan Chase Bank, N.A., as Administrative Agent. Incorporated by reference to Exhibit 10.3 of the Company’s Current Report on Form 8-K filed with the Commission on February 10, 2015. | |
10.30 | Amendment No. 1, dated as of March 31, 2015, to Credit Agreement, dated as of February 6, 2015, among the Company, the Lenders party thereto, JPMorgan Chase Bank, N.A., as Administrative Agent, and the other parties thereto. Incorporated by reference to Exhibit 10.9 of the Company's Quarterly Report on Form 10-Q for the quarter ended March 31, 2015. | |
10.31 | Amendment No. 2, dated as of October 30, 2015, to that certain Credit Agreement, dated as of February 6, 2015, among the Company, the Lenders party thereto, JPMorgan Chase Bank, N.A., as Administrative Agent, and the other parties thereto. Incorporated by reference to Exhibit 10.1 of the Company's Current Report on Form 8-K filed with the Commission on November 5, 2015. | |
111
Exhibit Number | Description of Exhibit | |
10.32 | Amendment No. 3, dated as of January 15, 2016, to that certain Credit Agreement, dated as of February 6, 2015, among the Company, the Lenders party thereto, JPMorgan Chase Bank, N.A., as Administrative Agent, and the other parties thereto. Filed herewith. | |
10.33* | The Advisory Board Company Amended and Restated 2009 Stock Incentive Plan. Incorporated by reference to Exhibit 10.1 of the Company's Quarterly Report on Form 10-Q for the quarter ended September 30, 2015. | |
10.34* | 2015 Form of Award Agreement for Restricted Stock Units pursuant to The Advisory Board Company 2009 Stock Incentive Plan. Incorporated by reference to Exhibit 10.2 of the Company's Current Report on Form 8-K filed with the Commission on June 15, 2015. | |
10.35* | 2015 Form of Award Agreement for Qualified Stock Options pursuant to The Advisory Board Company 2009 Stock Incentive Plan. Incorporated by reference to Exhibit 10.3 of the Company's Current Report on Form 8-K filed with the Commission on June 15, 2015. | |
10.36* | 2015 Form of Award Agreement for Non-Qualified Stock Options pursuant to The Advisory Board Company 2009 Stock Incentive Plan. Incorporated by reference to Exhibit 10.4 of the Company's Current Report on Form 8-K filed with the Commission on June 15, 2015. | |
10.37 | Director compensation plans. Incorporated by reference to “Board Corporate Governance Matters - Board of Directors Compensation” in the Company’s Definitive Proxy Statement on Schedule 14A for the 2015 Annual Meeting of Stockholders, filed on April 28, 2015 (Commission File No. 000-33283). | |
12.1 | Computation of Ratio of Earnings to Fixed Charges. Filed herewith. | |
21.1 | Subsidiaries of the Registrant. Filed herewith. | |
23.1 | Consent of Independent Registered Public Accounting Firm with respect to the consolidated financial statements of the Company. Filed herewith. | |
23.2 | Consent of Independent Auditor with respect to the financial statements of Evolent Health, Inc. Filed herewith. | |
23.3 | Consent of Independent Auditor with respect to the financial statements of Evolent Health LLC (Predecessor). Filed herewith. | |
23.4 | Consent of Independent Auditor with respect to the financial statements of Evolent Health LLC (Successor). Filed herewith. | |
31.1 | Certification of Chief Executive Officer pursuant to Rules 13a-14(a) and 15d-14(a) under the Securities Exchange Act of 1934, as amended. Filed herewith. | |
31.2 | Certification of Chief Financial Officer pursuant to Rules 13a-14(a) and 15d-14(a) under the Securities Exchange Act of 1934, as amended. Filed herewith. | |
32.1 | Certification of Chief Executive Officer and Chief Financial Officer pursuant to 18 U.S.C. Section 1350. Filed herewith. | |
99.1 | Audited financial statements as of December 31, 2015 and 2014, and for the three years ended December 31, 2015, of Evolent Health LLC. Filed herewith. | |
101 | XBRL (Extensible Business Reporting Language). The following financial statements from the Company’s Annual Report on Form 10-K for the period ended December 31, 2015, formatted in XBRL: (i) Consolidated Balance Sheets (ii) Consolidated Statements of Operations, (iii) Consolidated Statements of Comprehensive Income, (iv) Consolidated Statements of Changes in Stockholders’ Equity, (v) Consolidated Statements of Cash Flows, and (vi) Notes to Consolidated Financial Statements. | |
* | Management contracts or compensation plans or arrangements in which directors or executive officers participate. |
112
THE ADVISORY BOARD COMPANY
SCHEDULE II—Valuation and Qualifying Accounts
(In thousands)
Balance at Beginning of Year | Additions Charged to Revenue | Additions Charged to Other Accounts | Deductions From Reserve | Balance at End of Year | |||||||||||||||
Year ended March 31, 2014 Allowance for uncollectible revenue | $ | 5,766 | $ | 8,011 | $ | — | $ | 6,927 | $ | 6,850 | |||||||||
Nine months ended December 31, 2014 Allowance for uncollectible revenue | $ | 6,850 | $ | 8,938 | $ | — | $ | 8,258 | $ | 7,530 | |||||||||
Year ended December 31, 2015 Allowance for uncollectible revenue | $ | 7,530 | $ | 4,893 | $ | 310 | $ | 7,024 | $ | 5,709 | |||||||||
113
SIGNATURES
Pursuant to the requirements of Section 13 or 15(d) of the Securities Exchange Act of 1934, the registrant has duly caused this report to be signed on its behalf by the undersigned, thereunto duly authorized.
The Advisory Board Company | ||||
Date: March 11, 2016 | /s/ Robert W. Musslewhite | |||
Robert W. Musslewhite, | ||||
Chief Executive Officer and Chairman | ||||
Pursuant to the requirements of the Securities Exchange Act of 1934, this report has been signed below by the following persons in the capacities indicated on the dates indicated.
Signature | Title | Date | ||
/s/ Robert W. Musslewhite | Chief Executive Officer and Chairman | March 11, 2016 | ||
Robert W. Musslewhite | (Principal Executive Officer) | |||
/s/ Michael T. Kirshbaum | Chief Financial Officer and Treasurer (Principal Financial Officer and Principal Accounting Officer) | March 11, 2016 | ||
Michael T. Kirshbaum | ||||
/s/ Sanju K. Bansal | Director | March 11, 2016 | ||
Sanju K. Bansal | ||||
/s/ David L. Felsenthal | Director | March 11, 2016 | ||
David L. Felsenthal | ||||
/s/ Peter J. Grua | Director | March 11, 2016 | ||
Peter J. Grua | ||||
/s/ Nancy Killefer | Director | March 11, 2016 | ||
Nancy Killefer | ||||
/s/ Kelt Kindick | Lead Director | March 11, 2016 | ||
Kelt Kindick | ||||
/s/ Mark R. Neaman | Director | March 11, 2016 | ||
Mark R. Neaman | ||||
/s/ Leon D. Shapiro | Director | March 11, 2016 | ||
Leon D. Shapiro | ||||
/s/ LeAnne M. Zumwalt | Director | March 11, 2016 | ||
LeAnne M. Zumwalt | ||||
114
INDEX TO EXHIBITS
Exhibit Number | Description of Exhibit | |
2.1 | Stock Purchase Agreement, dated as of December 10, 2014, by and among Royall Holdings, LLC, Royall Acquisition Co. and The Advisory Board Company (the “Company” or the "Registrant"). Incorporated by reference to Exhibit 2.1 of the Company’s Current Report on Form 8-K filed with the Securities and Exchange Commission (the “Commission”) on December 11, 2014. | |
3.1 | Restated Certificate of Incorporation of the Company. Incorporated by reference to Exhibit 3.1 of the Quarterly Report on Form 10-Q of the Company for the quarter ended September 30, 2012. | |
3.2 | Amended and Restated Bylaws of the Company. Incorporated by reference to Exhibit 3.1 of the Company’s Current Report on Form 8-K filed with the Commission on November 14, 2007. | |
4.1 | Form of Common Stock Certificate. Incorporated by reference to Exhibit 4.1 of the Company’s Registration Statement on Form S-1/A (Commission File No. 333-68146) filed with the Commission on October 29, 2001 | |
10.1* | Form of Indemnity Agreement between the Company and certain officers, directors and employees. Incorporated by reference to Exhibit 10.33 of the Company’s Registration Statement on Form S-1/A (Commission File No. 333-68146) filed with the Commission on October 29, 2001. | |
10.2* | Form of Indemnification Agreement between the Company and certain officers, directors and employees. Incorporated by reference to Exhibit 10.5 of the Company’s Quarterly Report on Form 10-Q for the quarter ended September 30, 2009. | |
10.3* | Employee Stock Purchase Plan. Incorporated by reference to Exhibit 10.34 of the Company’s Registration Statement on Form S-1/A (Commission File No. 333-68146) filed with the Commission on October 29, 2001. | |
10.4* | The Advisory Board Company 2005 Stock Incentive Plan. Incorporated by reference to Exhibit 10.1 of the Company’s Current Report on Form 8-K filed with the Commission on November 17, 2005. | |
10.5* | Form of Standard Terms and Conditions for Restricted Stock Units pursuant to The Advisory Board Company 2005 Stock Incentive Plan. Incorporated by reference to Exhibit 10.39 of the Company’s Annual Report on Form 10-K for the fiscal year ended March 31, 2006. | |
10.6* | Form of Restricted Stock Unit Award Agreement pursuant to The Advisory Board Company 2005 Stock Incentive Plan. Incorporated by reference to Exhibit 10.40 of the Company’s Annual Report on Form 10-K for the fiscal year ended March 31, 2006. | |
10.7* | The Advisory Board Company 2006 Stock Incentive Plan. Incorporated by reference to Exhibit 10.1 of the Company’s Current Report on Form 8-K filed with the Commission on November 17, 2006. | |
10.8* | Form of Restricted Stock Award Agreement pursuant to The Advisory Board Company 2005 and 2006 Stock Incentive Plans. Incorporated by reference to Exhibit 10.3 of the Company’s Quarterly Report on Form 10-Q for the quarter ended September 30, 2008. | |
10.9* | Form of Award Agreement for Non-qualified Stock Options pursuant to The Advisory Board Company 2005 and 2006 Stock Incentive Plans. Incorporated by reference to Exhibit 10.1 of the Company’s Quarterly Report on Form 10-Q for quarter ended September 30, 2008. | |
10.10* | The Advisory Board Company Amended and Restated 2009 Stock Incentive Plan. Incorporated by reference to Appendix A to the Definitive Proxy Statement of the Company filed with the Commission on July 26, 2013. | |
10.11* | Form of Award Agreement for Restricted Stock Units pursuant to The Advisory Board Company 2005 and 2009 Stock Incentive Plans. Incorporated by reference to Exhibit 10.2 of the Company’s Current Report on Form 8-K filed with the Commission on September 16, 2009. | |
10.12* | Form of Award Agreement for Qualified Stock Options pursuant to The Advisory Board Company 2005 and 2009 Stock Incentive Plans. Incorporated by reference to Exhibit 10.3 of the Company’s Current Report on Form 8-K filed with the Commission on September 16, 2009. | |
10.13* | Form of Award Agreement for Non-Qualified Stock Options pursuant to The Advisory Board Company 2005 and 2009 Stock Incentive Plans. Incorporated by reference to Exhibit 10.4 of the Company’s Current Report on Form 8-K filed with the Commission on September 16, 2009. | |
10.14* | 2014 Form of Award Agreement for Non-Qualified Stock Options for certain employees pursuant to The Advisory Board Company 2005 and 2009 Stock Incentive Plans. Incorporated by reference to Exhibit 10.18 of the Company’s Annual Report on Form 10-K for the fiscal year ended March 31, 2014. | |
115
Exhibit Number | Description of Exhibit | |
10.15* | Amended and Restated Employment Agreement, dated as of April 3, 2013, between the Company and Robert W. Musslewhite. Incorporated by reference to Exhibit 10.1 of the Company’s Current Report on Form 8-K filed with the Commission on April 8, 2013. | |
10.16* | Amended and Restated Employment Agreement, dated as of April 3, 2013, between the Company and David L. Felsenthal. Incorporated by reference to Exhibit 10.2 of the Company’s Current Report on Form 8-K filed with the Commission on April 8, 2013. | |
10.17* | Executive Nonqualified Excess Plan of The Advisory Board Company, effective May 1, 2013. Incorporated by reference to Exhibit 10.3 of the Company’s Current Report on Form 8-K filed with the Commission on April 8, 2013. | |
10.18 | Agreement of Lease, dated October 20, 2003, between the Company and 2445 M Street Property LLC. Incorporated by reference to Exhibit 10.37 of the Company’s Quarterly Report on Form 10-Q for the quarter ended September 30, 2003. | |
10.19 | Collaboration Agreement, dated as of February 6, 2007, between The Corporate Executive Board Company and the Company (the “Collaboration Agreement”). Incorporated by reference to Exhibit 10.42 of the Company’s Annual Report on Form 10-K filed for the fiscal year ended March 31, 2007. On May 27, 2008, the Commission granted confidential treatment with respect to certain portions of the Collaboration Agreement. | |
10.20 | Letter agreement, dated February 4, 2010, between the Company and The Corporate Executive Board Company concerning the Collaboration Agreement, dated February 6, 2007. Incorporated by reference to Exhibit 10.1 of the Company’s Quarterly Report on Form 10-Q for the quarter ended December 30, 2009. | |
10.21 | Letter agreement, dated November 7, 2011, between the Company and The Corporate Executive Board Company concerning the Collaboration Agreement, dated February 6, 2007. Incorporated by reference to Exhibit 10.2 of the Company’s Quarterly Report on Form 10-Q for the quarter ended September 30, 2011. | |
10.22 | Letter agreement, dated February 5, 2014, between the Company and The Corporate Executive Board Company concerning the Collaboration Agreement, dated February 6, 2007. Incorporated by reference to Exhibit 10.2 of the Company’s Quarterly Report on Form 10-Q for the quarter ended December 31, 2013. | |
10.23 | Registration Rights and Governance Agreement, dated as of January 9, 2015, among the Company and Royall Holdings, LLC. Incorporated by reference to Exhibit 10.4 of the Company’s Current Report on Form 8-K filed with the Commission on January 12, 2015. | |
10.24 | The Advisory Board Company Inducement Stock Incentive Plan for Royall Employees. Incorporated by reference to Exhibit 4.4 of the Company’s Registration Statement on Form S-8 (Commission File No. 333-201982) filed with the Commission on February 9, 2015. | |
10.25 | Form of Award Agreement for Restricted Stock Units pursuant to The Advisory Board Company Inducement Stock Incentive Plan for Royall Employees. Incorporated by reference to Exhibit 10.40 of the Company’s Transition Report on Form 10-K for the period ended December 31, 2014. | |
10.26 | Form of Award Agreement for Non-Qualified Stock Options pursuant to The Advisory Board Company Inducement Stock Incentive Plan for Royall Employees. Incorporated by reference to Exhibit 10.41 of the Company’s Transition Report on Form 10-K for the period ended December 31, 2014. | |
10.27 | Credit Agreement, dated as of February 6, 2015, among the Company, the Lenders party thereto, JPMorgan Chase Bank, N.A., as Administrative Agent, and the other parties thereto. Incorporated by reference to Exhibit 10.1 of the Company’s Current Report on Form 8-K filed with the Commission on February 10, 2015. | |
10.28 | Pledge and Security Agreement, entered into as of February 6, 2015, among the Company and the Subsidiaries of the Company party thereto, as Grantors, and JPMorgan Chase Bank, N.A., as Administrative Agent. Incorporated by reference to Exhibit 10.2 of the Company’s Current Report on Form 8-K filed with the Commission on February 10, 2015. | |
10.29 | Guaranty made as of February 6, 2015 by the Subsidiaries of the Company party thereto in favor of JPMorgan Chase Bank, N.A., as Administrative Agent. Incorporated by reference to Exhibit 10.3 of the Company’s Current Report on Form 8-K filed with the Commission on February 10, 2015. | |
10.30 | Amendment No. 1, dated as of March 31, 2015, to Credit Agreement, dated as of February 6, 2015, among the Company, the Lenders party thereto, JPMorgan Chase Bank, N.A., as Administrative Agent, and the other parties thereto. Incorporated by reference to Exhibit 10.9 of the Company's Quarterly Report on Form 10-Q for the quarter ended March 31, 2015. | |
116
Exhibit Number | Description of Exhibit | |
10.31 | Amendment No. 2, dated as of October 30, 2015, to that certain Credit Agreement, dated as of February 6, 2015, among the Company, the Lenders party thereto, JPMorgan Chase Bank, N.A., as Administrative Agent, and the other parties thereto. Incorporated by reference to Exhibit 10.1 of the Company's Current Report on Form 8-K filed with the Commission on November 5, 2015. | |
10.32 | Amendment No. 3, dated as of January 15, 2016, to that certain Credit Agreement, dated as of February 6, 2015, among the Company, the Lenders party thereto, JPMorgan Chase Bank, N.A., as Administrative Agent, and the other parties thereto. Filed herewith. | |
10.33* | The Advisory Board Company Amended and Restated 2009 Stock Incentive Plan. Incorporated by reference to Exhibit 10.1 of the Company's Quarterly Report on Form 10-Q for the quarter ended September 30, 2015. | |
10.34* | 2015 Form of Award Agreement for Restricted Stock Units pursuant to The Advisory Board Company 2009 Stock Incentive Plan. Incorporated by reference to Exhibit 10.2 of the Company's Current Report on Form 8-K filed with the Commission on June 15, 2015. | |
10.35* | 2015 Form of Award Agreement for Qualified Stock Options pursuant to The Advisory Board Company 2009 Stock Incentive Plan. Incorporated by reference to Exhibit 10.3 of the Company's Current Report on Form 8-K filed with the Commission on June 15, 2015. | |
10.36* | 2015 Form of Award Agreement for Non-Qualified Stock Options pursuant to The Advisory Board Company 2009 Stock Incentive Plan. Incorporated by reference to Exhibit 10.4 of the Company's Current Report on Form 8-K filed with the Commission on June 15, 2015. | |
10.37 | Director compensation plans. Incorporated by reference to “Board Corporate Governance Matters - Board of Directors Compensation” in the Company’s Definitive Proxy Statement on Schedule 14A for the 2015 Annual Meeting of Stockholders, filed on April 28, 2015 (Commission File No. 000-33283). | |
12.1 | Computation of Ratio of Earnings to Fixed Charges. Filed herewith. | |
21.1 | Subsidiaries of the Registrant. Filed herewith. | |
23.1 | Consent of Independent Registered Public Accounting Firm with respect to the consolidated financial statements of the Company. Filed herewith. | |
23.2 | Consent of Independent Auditor with respect to the financial statements of Evolent Health, Inc. Filed herewith. | |
23.3 | Consent of Independent Auditor with respect to the financial statements of Evolent Health LLC (Predecessor). Filed herewith. | |
23.4 | Consent of Independent Auditor with respect to the financial statements of Evolent Health LLC (Successor). Filed herewith. | |
31.1 | Certification of Chief Executive Officer pursuant to Rules 13a-14(a) and 15d-14(a) under the Securities Exchange Act of 1934, as amended. Filed herewith. | |
31.2 | Certification of Chief Financial Officer pursuant to Rules 13a-14(a) and 15d-14(a) under the Securities Exchange Act of 1934, as amended. Filed herewith. | |
32.1 | Certification of Chief Executive Officer and Chief Financial Officer pursuant to 18 U.S.C. Section 1350. Filed herewith. | |
99.1 | Audited financial statements as of December 31, 2015 and 2014, and for the three years ended December 31, 2015, of Evolent Health LLC. Filed herewith. | |
101 | XBRL (Extensible Business Reporting Language). The following financial statements from the Company’s Annual Report on Form 10-K for the period ended December 31, 2015, formatted in XBRL: (i) Consolidated Balance Sheets (ii) Consolidated Statements of Operations, (iii) Consolidated Statements of Comprehensive Income, (iv) Consolidated Statements of Changes in Stockholders’ Equity, (v) Consolidated Statements of Cash Flows, and (vi) Notes to Consolidated Financial Statements. | |
* | Management contracts or compensation plans or arrangements in which directors or executive officers participate. |
117