Attached files
| file | filename |
|---|---|
| 8-K - 8-K - American Homes 4 Rent | a16-6001_18k.htm |
Exhibit 99.1
March 8, 2016 AMH and ARP Merger Call Presentation
2 The information in this presentation has been prepared solely for informational purposes. “We,” “AMH,” “AH4R,” “the Company,” “the REIT,” “our” and “us” refer to American Homes 4 Rent, a Maryland real estate investment trust, and its subsidiaries taken as a whole. This presentation contains forward-looking statements within the meaning of the Private Securities Litigation Reform Act of 1995, Section 27A of the Securities Act of 1933, as amended, and Section 21E of the Securities Exchange Act of 1934, as amended. These forward-looking statements generally can be identified by use of statements that include phrases such as “believe,” “expect,” “anticipate,” “estimate,” “intend,” “plan,” “will,” “predicted,” “likely,” or other words or phrases of similar import. Although we believe that the assumptions underlying the forward-looking statements contained herein are reasonable, any of the assumptions could be inaccurate, and therefore there can be no assurance that such statements included in this presentation will prove to be accurate. In light of the significant uncertainties inherent in the forward-looking statements included herein, the inclusion of such information should not be regarded as a representation by AMH that the results or conditions described in such statements or the objectives and plans of AMH will be achieved. Such forward-looking statements involve known and unknown risks, uncertainties, and other factors that may cause the actual results, performance, or achievements of AMH to be materially different from future results, performance or achievements expressed or implied by such forward-looking statements. Such factors include, but are not limited to, the failure to plan and manage the merger effectively and efficiently; the possibility that the anticipated benefits from the merger may not be realized or may take longer than anticipated; unexpected costs or unexpected liabilities that may arise from the merger, and certain other factors listed from time to time in our SEC reports and press releases, including, but not limited to, those described in the section entitled “Item 1A. Risk Factors” in our Annual Report on Form 10-K filed by AMH with the SEC on February 26, 2016, our Form 8-Ks filed on March 4, 2016 and today and our press release dated March 1, 2016. Any forward-looking statement in this presentation speaks only as of the date of this presentation, March 8, 2016, and AMH undertakes no obligation to update or revise any forward-looking statements, whether as a result of new developments or otherwise. Forward-Looking Statements
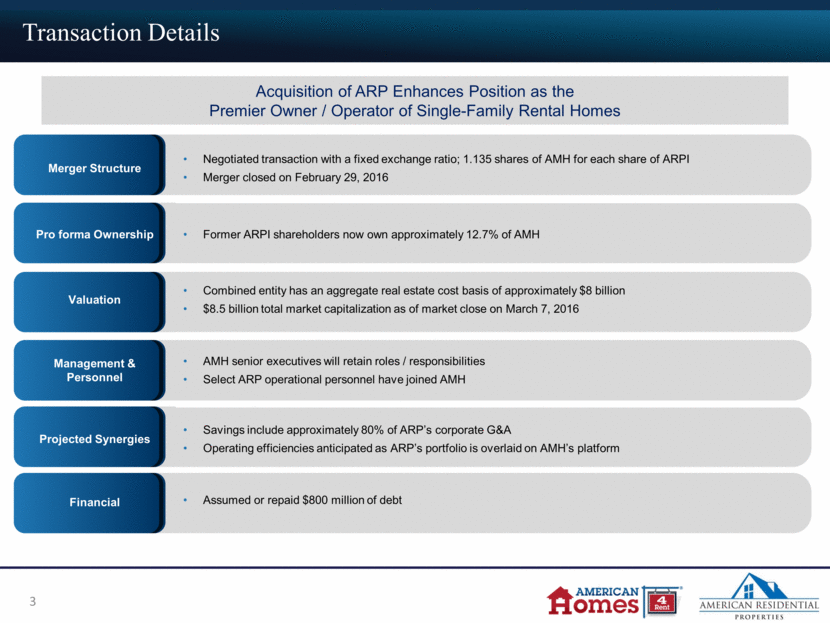
Transaction Details Acquisition of ARP Enhances Position as the Premier Owner / Operator of Single-Family Rental Homes Merger Structure Negotiated transaction with a fixed exchange ratio; 1.135 shares of AMH for each share of ARPI Merger closed on February 29, 2016 Pro forma Ownership Former ARPI shareholders now own approximately 12.7% of AMH Valuation Combined entity has an aggregate real estate cost basis of approximately $8 billion $8.5 billion total market capitalization as of market close on March 7, 2016 Management & Personnel AMH senior executives will retain roles / responsibilities Select ARP operational personnel have joined AMH Projected Synergies Savings include approximately 80% of ARP’s corporate G&A Operating efficiencies anticipated as ARP’s portfolio is overlaid on AMH’s platform Financial Assumed or repaid $800 million of debt 3
Strategic Rationale Strategic Combination Provides Substantial Benefits to Shareholders Scale Solidifies AMH’s position as the largest public owner / operator of single-family rental homes Increases AMH’s total market capitalization to $8.5 billion Improves market float Portfolio Total portfolio of approximately 48,000 homes in 22 states Adds density in key markets and sub-markets ARP portfolio similar to AMH’s high quality portfolio standards Accretion Anticipated G&A savings of approximately 80% of ARP’s corporate G&A Provides significant management, leasing, and operational efficiencies Transaction expected to be $0.04 to $0.05 accretive to 2017 Core FFO per share Capitalization Pro forma leverage of approximately 40% remains within established parameters Majority of debt is long term with fixed interest rates Disposition opportunities Including homes that may be sold Other than preferred operator homes (1) (2) 4
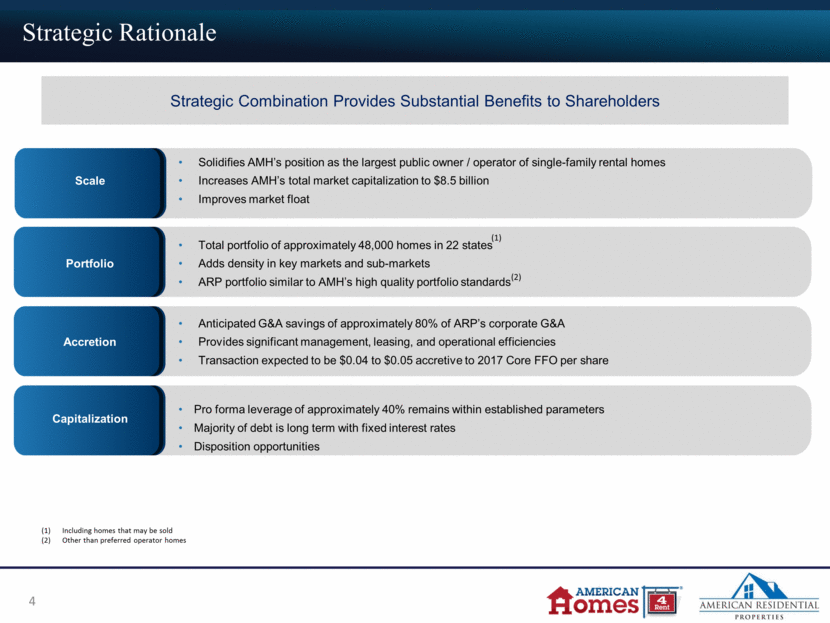
Integration Process and Progress Significant Experience in Integrating Portfolios Accounting / Data Systems AMH and ARP used the same accounting system Completed integration of accounting and data systems over weekend prior to merger close All systems operational March 1, 2016 Tenant Collections & Resident Portals Planned for completion after March rent collection period Tenant ledgers and resident portals integrated during the week of March 7, 2016 ARP Employees Select ARP operational personnel retained by AMH Retained ARP personnel already integrated into AMH offices In-House Maintenance ARP had more advanced in-house maintenance program 30 trucks and 30 technicians acquired in acquisition Accelerates AMH national roll-out Seasoned Integration Team Previously integrated more than 25 third party managers Previously integrated small and large portfolios Previously integrated 300-home portfolio managed by ARP 5
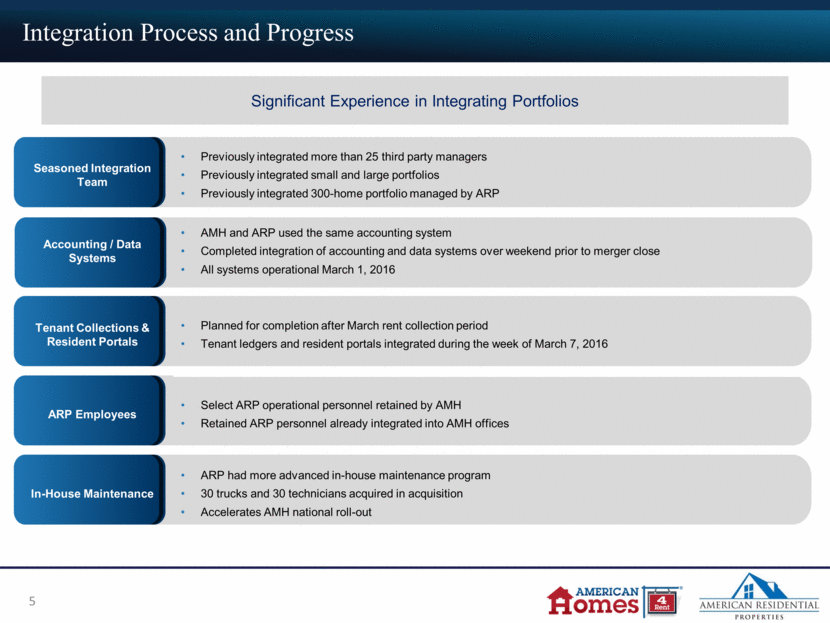
Integration Benefits and Impacts Leasing / Collections Increased rental rates using AMH pricing model Improve ARP to AMH standard (approximately 1% bad debt) Rental rates can be increased as leases expire Higher collection costs, higher vacancy, and increased turn costs while working through ARP delinquencies Maintenance Reduced maintenance cost for ARP properties on AMH platform Improved turn times Faster roll-out of in-house maintenance Approximately $8-$10 million of deferred maintenance costs to be expensed or capitalized as incurred Platform Infrastructure in place Modest incremental costs to add properties to platform Temporary personnel needed to resolve ARP legacy collection and deferred maintenance issues Preferred Operator Programs None Need to resolve master lease contracts Probable dispositions G&A Projected savings of approximately 80% of ARP G&A Transitional costs to close out ARP infrastructure Integration Benefits and Impacts Long Term Benefits Short Term Transitional Impacts 6
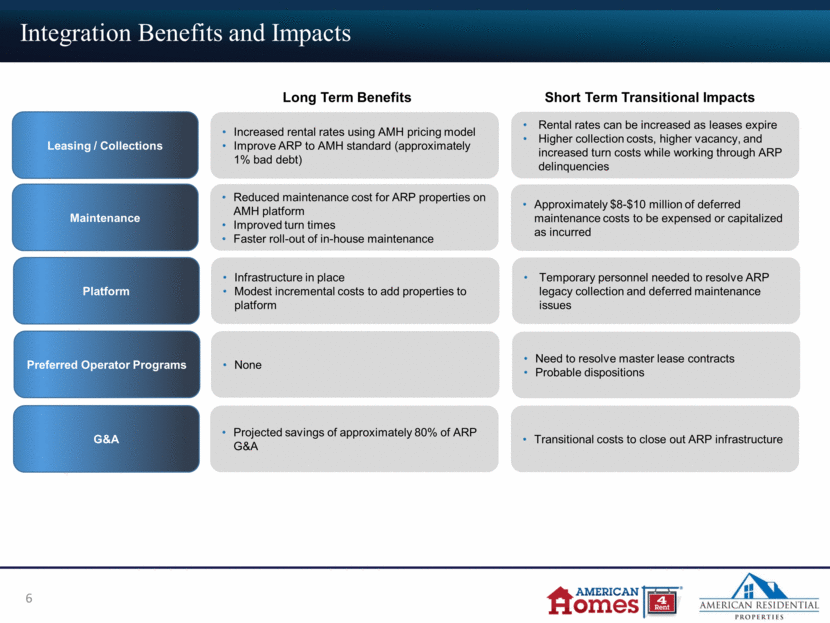
Disposition of Non-Core Assets 1,400-1,500 ARP Homes Provides Capital for Strategic Objectives Non-Core AMH Homes 1,400-1,500 ARP homes which represent less than 10% of ARP portfolio value Candidates for sale include homes that do not meet AMH quality or locational standards, as well as strategic sales Expected Proceeds of $300M-$400M Strategic Rationale Expected Benefit Improve overall growth profile of portfolio Reduce unnecessary maintenance and repair spending Proceeds to be redeployed into strategic objectives and de-leveraging 7
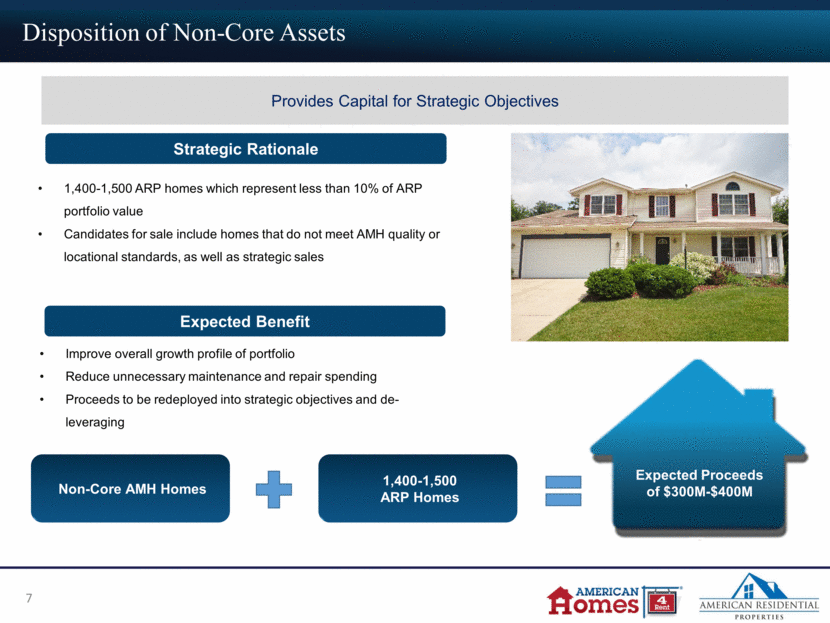
Balance Sheet Strength and Flexibility Balance Sheet Supports Strategy Balance % of Total Interest Rate (2) Years to Maturity Floating rate debt: Line of credit (3) $382,000 11% 3.19% 2.6 AH4R 2014-SFR1 (3) 472,954 14% 2.07% 3.3 ARP 2014-SFR1 (3) 342,115 10% 2.44% 3.5 Total floating rate debt 1,197,069 35% 2.53% 3.1 Fixed rate debt: AH4R 2014-SFR2 506,472 15% 4.42% 8.6 AH4R 2014-SFR3 522,253 15% 4.40% 8.8 AH4R 2015-SFR1 (4) 548,223 16% 4.14% 29.1 AH4R 2015-SFR2 (4) 476,137 14% 4.36% 29.6 Secured note payable 50,606 2% 4.06% 3.3 ARPI exchangeable notes 115,000 3% 3.25% 2.7 Total fixed rate debt 2,218,691 65% 4.26% 17.8 Total debt $3,415,760 100% 3.66% 12.7 Debt summary reflects information as of 2/29/16, with dollar amounts in thousands. Interest rate on floating rate debt presented as of period end. Years to maturity on line of credit, AH4R 2014-SFR1 and ARP 2014-SFR1 reflect fully extended, final maturity dates. AH4R 2015-SFR1 and AH4R 2015-SFR2 have maturity dates in April 2045 and October 2045, respectively, with anticipated repayment dates in April 2025 and October 2025, respectively. Market values based on AMH 3/7/16 closing share price of $15.45, with dollar amounts in millions. Debt Summary (1) Capital Structure (5) 8 Market value of shares & units (AMH Legacy) , $4,030 , 48% Market value of shares & units (ARPI S/H's) , $586 , 7% Participating preferred shares , $458 , 5% Floating rate debt , $1,197 , 14% Fixed rate debt , $2,219 , 26%
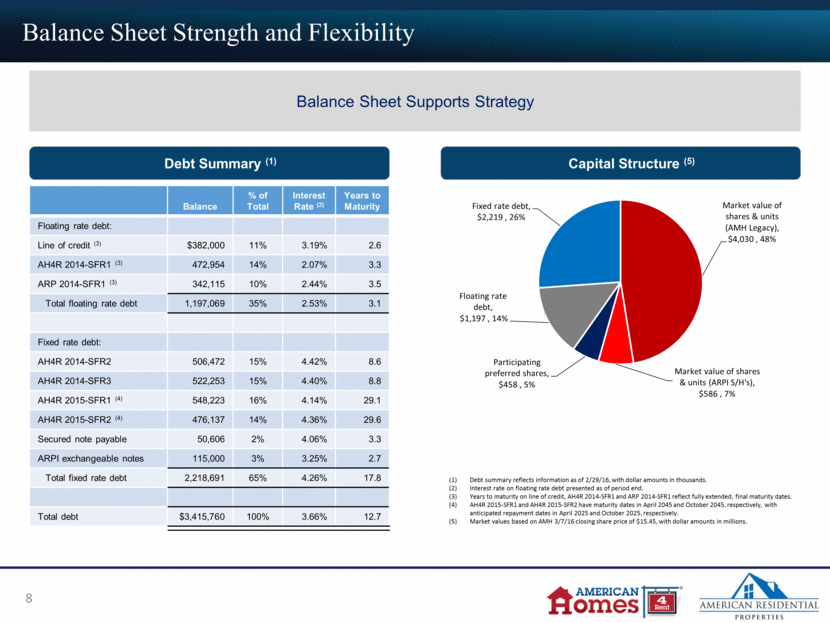
Core FFO Accretion Strategic Acquisition Expected to Provide Core FFO Per Share Accretion of $0.04 to $0.05 in 2017 G&A Elimination of 80% of ARP G&A Leasing & Collections Increase ARP average rent to reflect superior AMH pricing model, to be captured over time as leases roll Improve ARP bad debt experience to AMH standard (approximately 1%) Maintenance Platform Improve operating expenses by overlaying AMH “best practices” on ARP portfolio Reduce average maintenance, turn, and capital expenditure costs Reduce turn times Property Management More effective utilization of property management platform Modest incremental cost to manage additional homes on established infrastructure 9
Appendices 1. Portfolio 2. AMH Platform 10
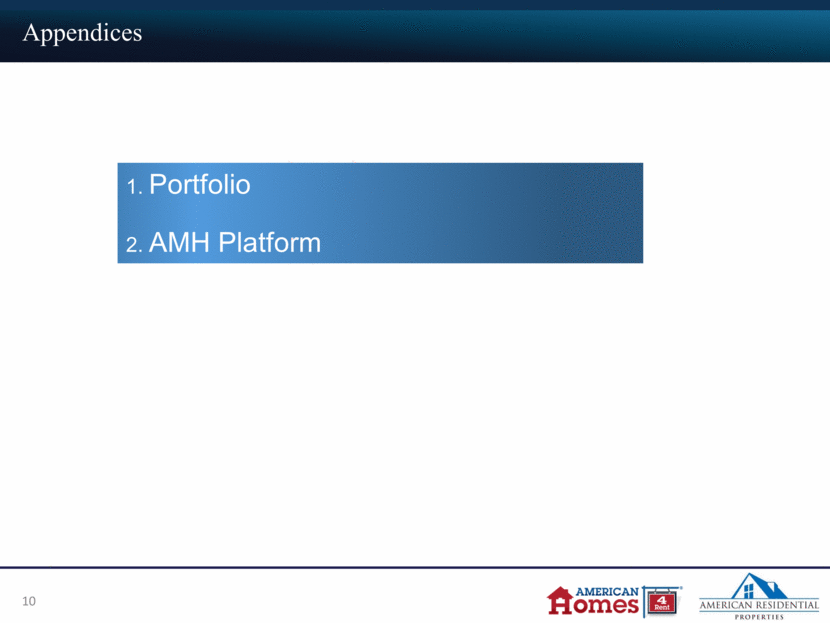
Above data as of February 29, 2016 (1) Excludes current and former preferred operator homes Appendix 1. Combined Portfolio 11 AMH AMH Pre-Merger Post-Merger Change Total non-preferred operator homes 38,973 46,580 19.5% Current preferred operator homes - 594 --% Former preferred operator homes - 735 --% Total homes 38,973 47,909 22.9% Leased percentage (1) 95.5% 95.6% 0.1% Occupied percentage (1) 94.4% 94.5% 0.1% Average contractual monthly rent (1) 1,448 $ 1,434 $ -0.9% Average SF (1) 1,965 1,957 -0.4% Average age (years) (1) 13.1 13.1 --%
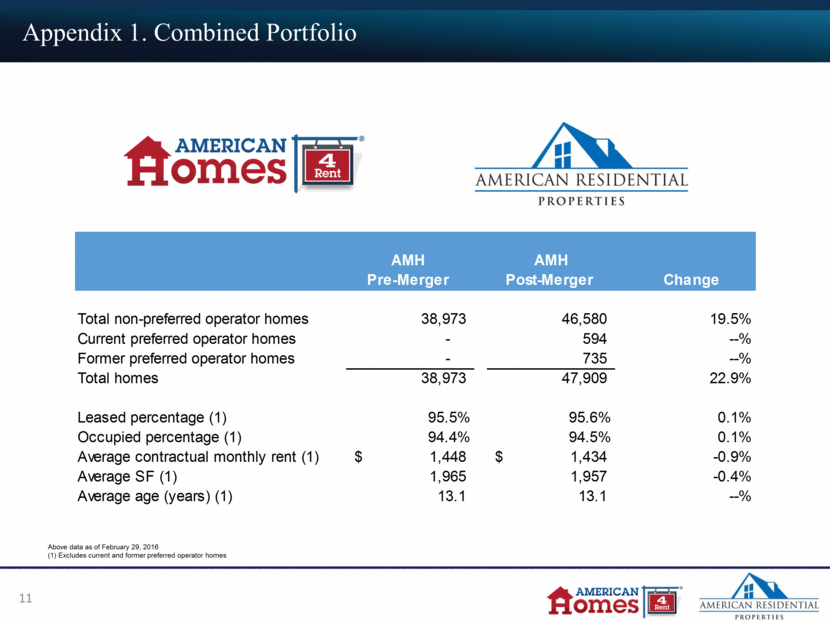
Appendix 1. Portfolio Concentrations 80% of All Homes Located in Markets with 1,000+ Homes Increased Market Concentration Markets with 2,000+ Homes Number of Homes Dallas-Fort Worth, TX 4,355 Atlanta, GA 3,798 Houston, TX 3,159 Indianapolis, IN 2,931 Phoenix, AZ 2,779 Charlotte, NC 2,697 Nashville, TN 2,357 Greater Chicago area, IL and IN 2,062 Total 24,138 Markets with 1,000-2,000 Homes Number of Homes Cincinnati, OH 1,956 Raleigh, NC 1,826 Tampa, FL 1,678 Jacksonville, FL 1,588 Orlando, FL 1,564 Columbus, OH 1,453 San Antonio, TX 1,250 Salt Lake City, UT 1,049 Las Vegas, NV 1,023 Total 13,387 All above data excludes current and former preferred operator homes. 12
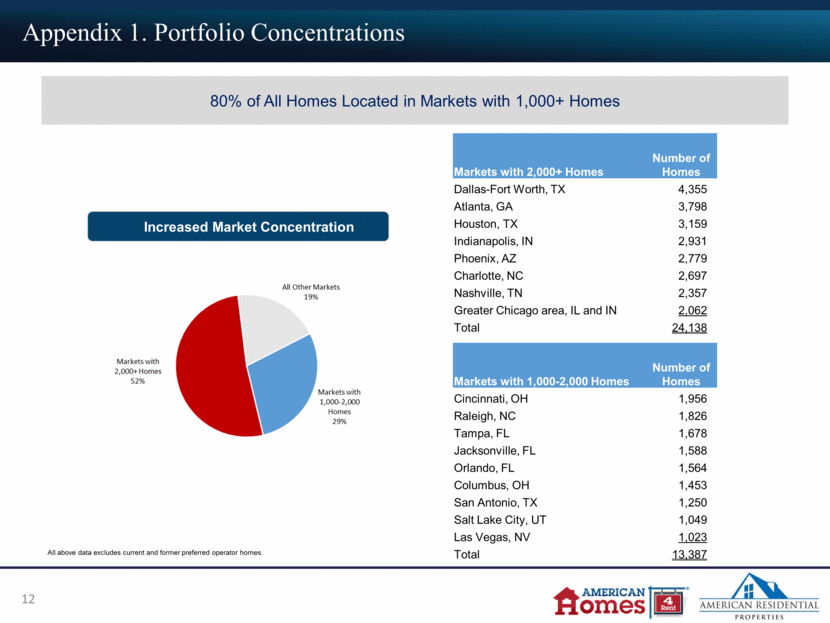
Appendix 1. Combined Portfolio Statistics by Market Above data as of February 29, 2016 13 Market Pre-Merger Post-Merger Pre-Merger Post-Merger Leased Percentage Occupied Percentage Average Contractual Monthly Rent Per Property Average Square Footage Average Age (years) Dallas-Fort Worth, TX 3,236 4,355 8.3% 9.1% 95.5% 94.7% 1,553 $ 2,119 12.4 Atlanta, GA 2,860 3,798 7.3% 7.9% 93.0% 92.1% 1,355 2,116 15.2 Houston, TX 2,053 3,159 5.3% 6.6% 94.7% 93.4% 1,560 2,114 10.3 Indianapolis, IN 2,775 2,931 7.1% 6.1% 95.9% 94.7% 1,295 1,926 13.9 Phoenix, AZ 1,602 2,779 4.1% 5.8% 98.7% 97.9% 1,132 1,815 13.3 Charlotte, NC 2,331 2,697 6.0% 5.6% 96.1% 94.8% 1,395 2,016 12.7 Nashville, TN 1,524 2,357 3.9% 4.9% 95.1% 93.8% 1,554 2,083 11.7 Greater Chicago area, IL and IN 2,062 2,062 5.3% 4.3% 96.6% 95.1% 1,700 1,896 14.5 Cincinnati, OH 1,872 1,956 4.8% 4.1% 95.9% 94.7% 1,451 1,846 13.8 Raleigh, NC 1,475 1,826 3.8% 3.8% 96.0% 95.1% 1,362 1,841 11.5 Tampa, FL 1,578 1,678 4.0% 3.5% 95.2% 94.2% 1,540 1,964 12.4 Jacksonville, FL 1,579 1,588 4.1% 3.3% 95.5% 94.3% 1,342 1,906 12.1 Orlando, FL 1,185 1,564 3.0% 3.3% 95.3% 93.9% 1,414 1,872 14.8 Columbus, OH 1,453 1,453 3.7% 3.0% 97.7% 96.5% 1,430 1,830 14.6 San Antonio, TX 898 1,250 2.3% 2.6% 96.6% 95.0% 1,469 1,983 13.5 Salt Lake City, UT 1,049 1,049 2.7% 2.2% 97.2% 96.5% 1,490 2,131 14.8 Las Vegas, NV 969 1,023 2.5% 2.1% 96.7% 95.8% 1,330 1,841 13.1 Winston Salem, NC 527 761 1.4% 1.6% 95.4% 94.0% 1,211 1,729 12.2 Austin, TX 674 696 1.7% 1.5% 96.7% 95.3% 1,385 1,850 11.8 Denver, CO 684 684 1.8% 1.4% 98.5% 97.5% 1,927 2,148 16.0 All Other 6,587 6,914 16.9% 14.4% 94.6% 93.3% 1,420 1,840 13.0 SubTotal 38,973 46,580 100.0% 97.2% 95.6% 94.5% 1,434 $ 1,957 13.1 Current preferred operator homes - 594 --% 1.2% 100.0% 100.0% 756 1,372 57.0 Former preferred operator homes - 735 --% 1.5% 94.1% 92.8% 761 1,247 45.2 Total 38,973 47,909 100.0% 100.0% 95.7% 94.5% 1,415 $ 1,939 14.1 Total Homes % of Total Homes Post-Merger
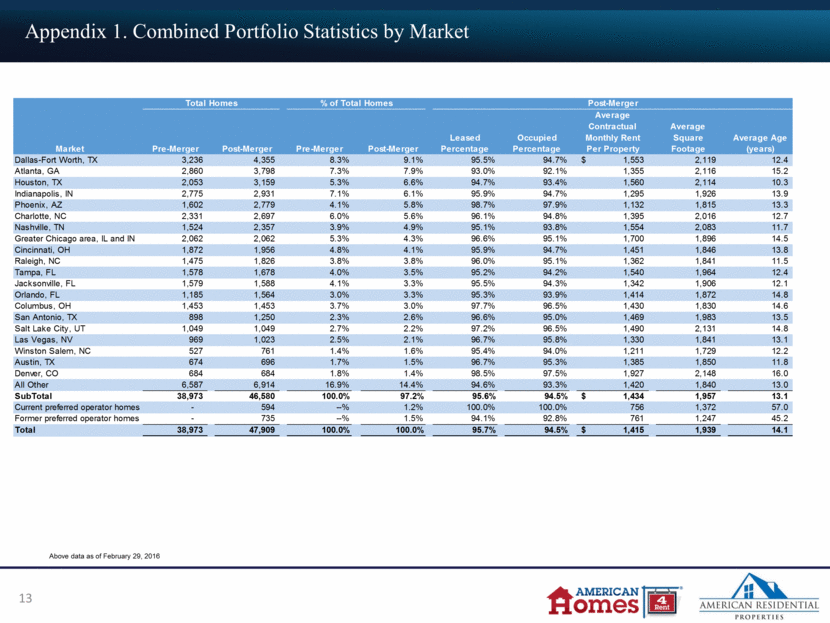
Appendix 2. National Platform SC TN WA OR CA NV UT CO AZ TX IL IN OH GA FL SC TN NC KY OK WI ID NM MS AMH Property Management Offices AMH Presence Only AMH and ARP Presence 14
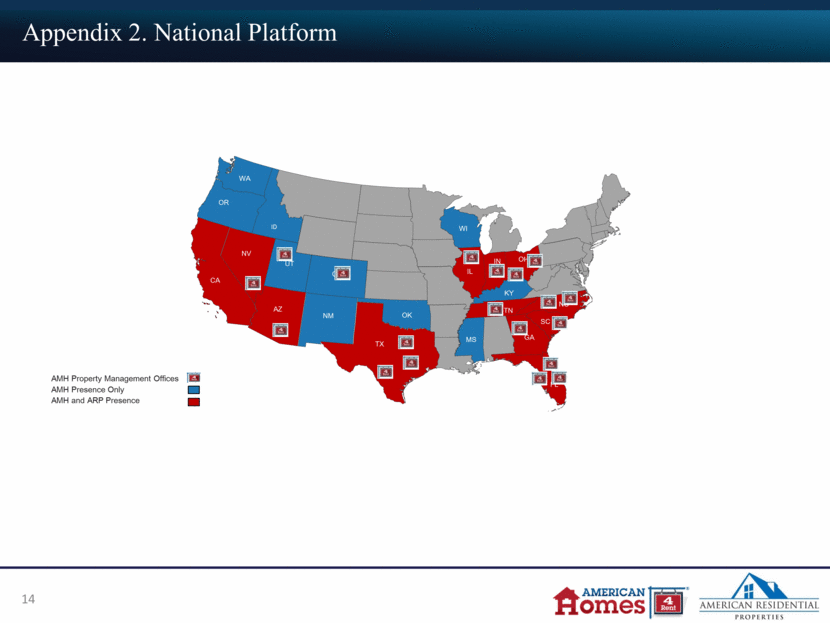
Appendix 2. Best-in-Class Platform Supports Sector-Leading Operating Performance Scalable Platform Leasing Property Management National Platform: Own approx. 48,000 Homes Bargaining power on national contracts Utilize 3,000 contractors nationwide Diversified footprint 22 states Concentrated in target neighborhoods with strong demographics and quality schools, near employment centers Best in class, state of the art call center Average: greater than 40,000 calls per month Peak leasing season: more than 60,000 calls per month Combination of in-person and automated showings Regularly perform over 1,000 showings in a day Centralized tenant underwriting ensuring consistent high quality tenant base $85,000 average household income 5x Income-to-Rent Centralized maintenance and customer service call center Centralized rent collection and receivable management Field personnel in all markets to provide customer service and manage homes Standardization of turn process Disciplined expenditure management Subject Matter Experts review and approve major repairs and replacements Scale Across National Platform plus Operational Optimization Drives Stable, Growing Cash Flow 15
Investor Relations Phone: (855) 794-AH4R (2447) Email: investors@ah4r.com www.americanhomes4rent.com
