Attached files
| file | filename |
|---|---|
| EX-99.1 - EX-99.1 - AMEDISYS INC | d142576dex991.htm |
| 8-K - 8-K - AMEDISYS INC | d142576d8k.htm |
Amedisys Earnings Call Supplemental Materials March 9, 2016 Exhibit 99.1
Forward-looking Statements This presentation may include forward-looking statements as defined by the Private Securities Litigation Reform Act of 1995. These forward-looking statements are based upon current expectations and assumptions about our business that are subject to a variety of risks and uncertainties that could cause actual results to differ materially from those described in this presentation. You should not rely on forward-looking statements as a prediction of future events. Additional information regarding factors that could cause actual results to differ materially from those discussed in any forward-looking statements are described in reports and registration statements we file with the SEC, including our Annual Report on Form 10-K and subsequent Quarterly Reports on Form 10-Q and Current Reports on Form 8-K, copies of which are available on the Amedisys internet website http://www.amedisys.com or by contacting the Amedisys Investor Relations department at (225) 292-2031. We disclaim any obligation to update any forward-looking statements or any changes in events, conditions or circumstances upon which any forward-looking statement may be based except as required by law. www.amedisys.com NASDAQ: AMED We encourage everyone to visit the Investors Section of our website at www.amedisys.com, where we have posted additional important information such as press releases, profiles concerning our business and clinical operations and control processes, and SEC filings. We intend to use our website to expedite public access to time-critical information regarding the Company in advance of or in lieu of distributing a press release or a filing with the SEC disclosing the same information.
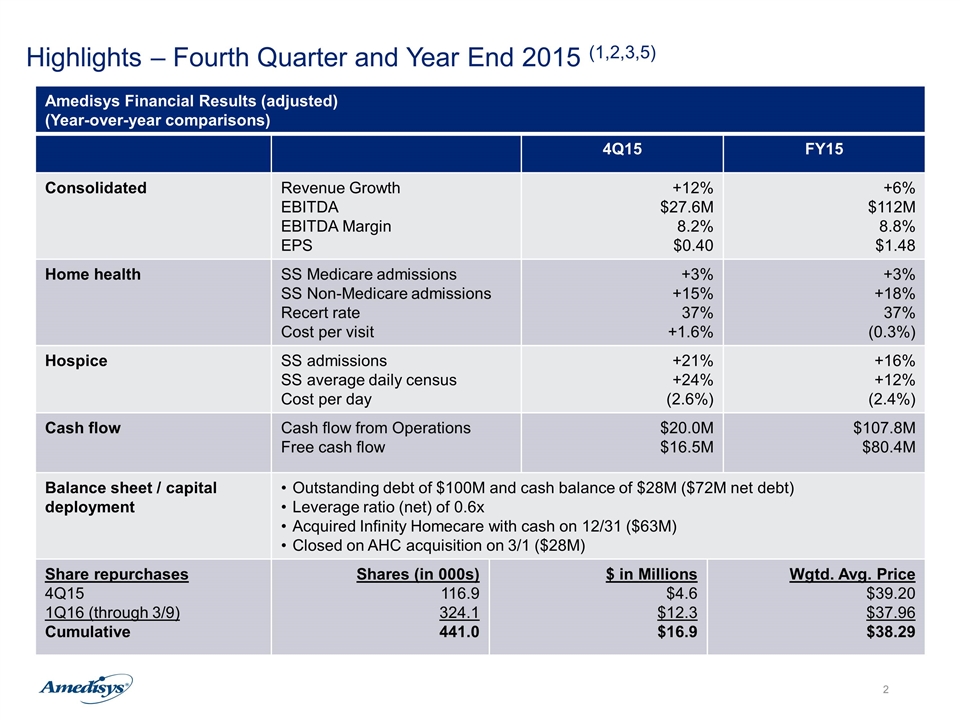
Highlights – Fourth Quarter and Year End 2015 (1,2,3,5) Amedisys Financial Results (adjusted) (Year-over-year comparisons) 4Q15 FY15 Consolidated Revenue Growth EBITDA EBITDA Margin EPS +12% $27.6M 8.2% $0.40 +6% $112M 8.8% $1.48 Home health SS Medicare admissions SS Non-Medicare admissions Recert rate Cost per visit +3% +15% 37% +1.6% +3% +18% 37% (0.3%) Hospice SS admissions SS average daily census Cost per day +21% +24% (2.6%) +16% +12% (2.4%) Cash flow Cash flow from Operations Free cash flow $20.0M $16.5M $107.8M $80.4M Balance sheet / capital deployment Outstanding debt of $100M and cash balance of $28M ($72M net debt) Leverage ratio (net) of 0.6x Acquired Infinity Homecare with cash on 12/31 ($63M) Closed on AHC acquisition on 3/1 ($28M) Share repurchases 4Q15 1Q16 (through 3/9) Cumulative Shares (in 000s) 116.9 324.1 441.0 $ in Millions $4.6 $12.3 $16.9 Wgtd. Avg. Price $39.20 $37.96 $38.29
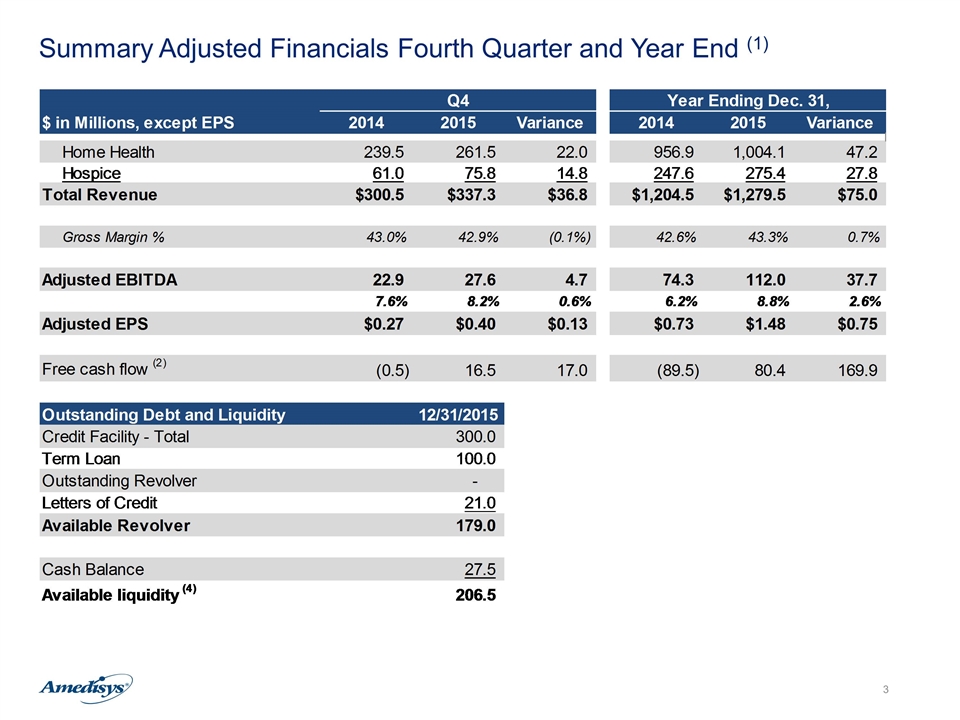
Summary Adjusted Financials Fourth Quarter and Year End (1)
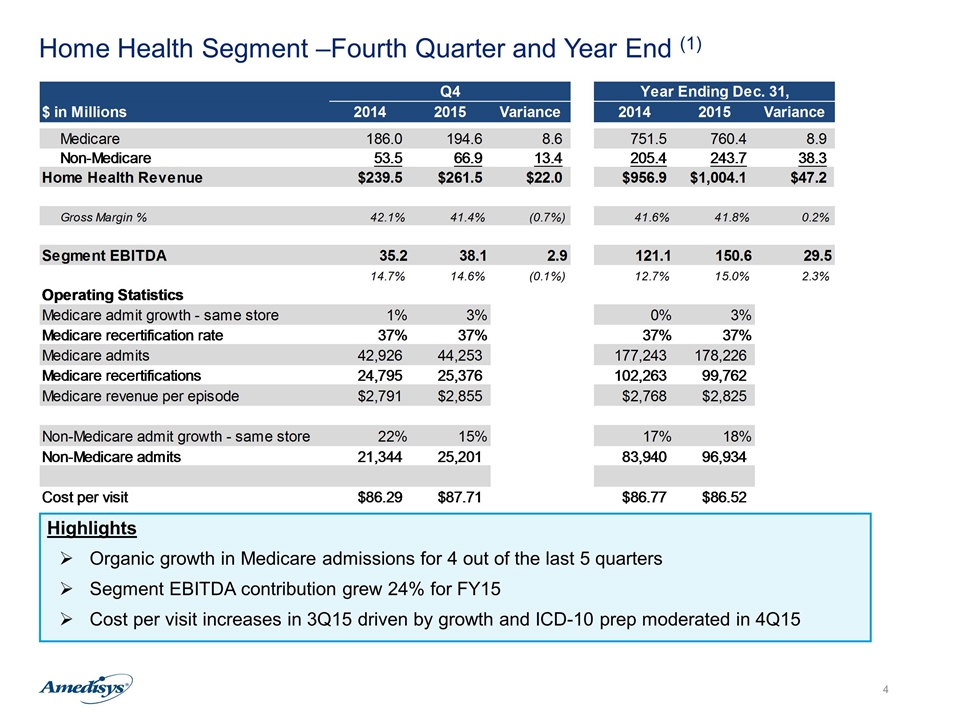
Home Health Segment –Fourth Quarter and Year End (1) Highlights Organic growth in Medicare admissions for 4 out of the last 5 quarters Segment EBITDA contribution grew 24% for FY15 Cost per visit increases in 3Q15 driven by growth and ICD-10 prep moderated in 4Q15
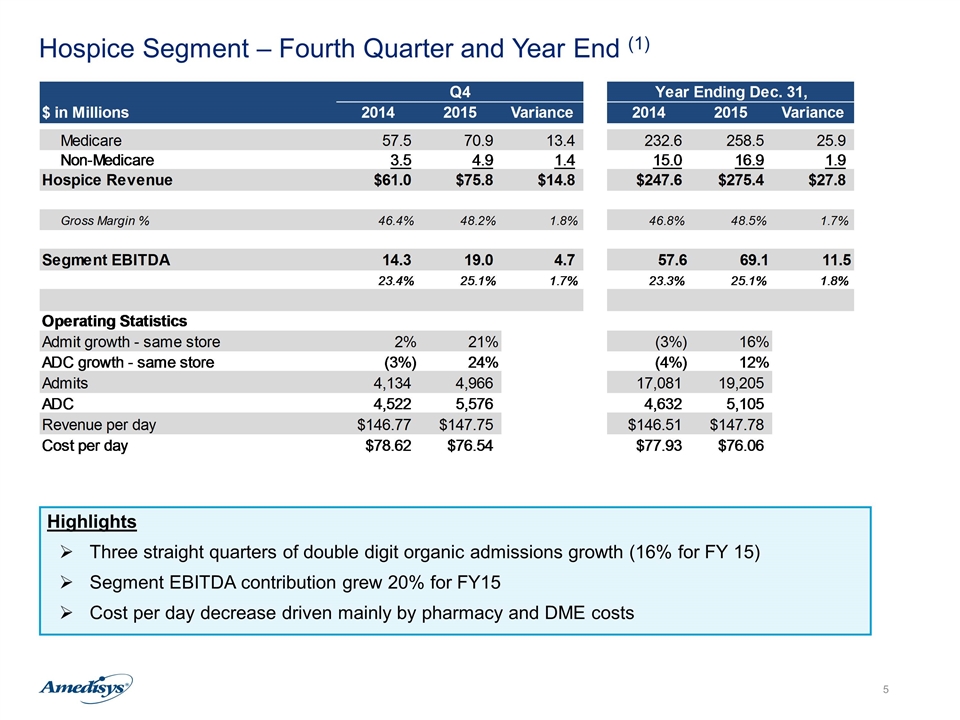
Hospice Segment – Fourth Quarter and Year End (1) Highlights Three straight quarters of double digit organic admissions growth (16% for FY 15) Segment EBITDA contribution grew 20% for FY15 Cost per day decrease driven mainly by pharmacy and DME costs
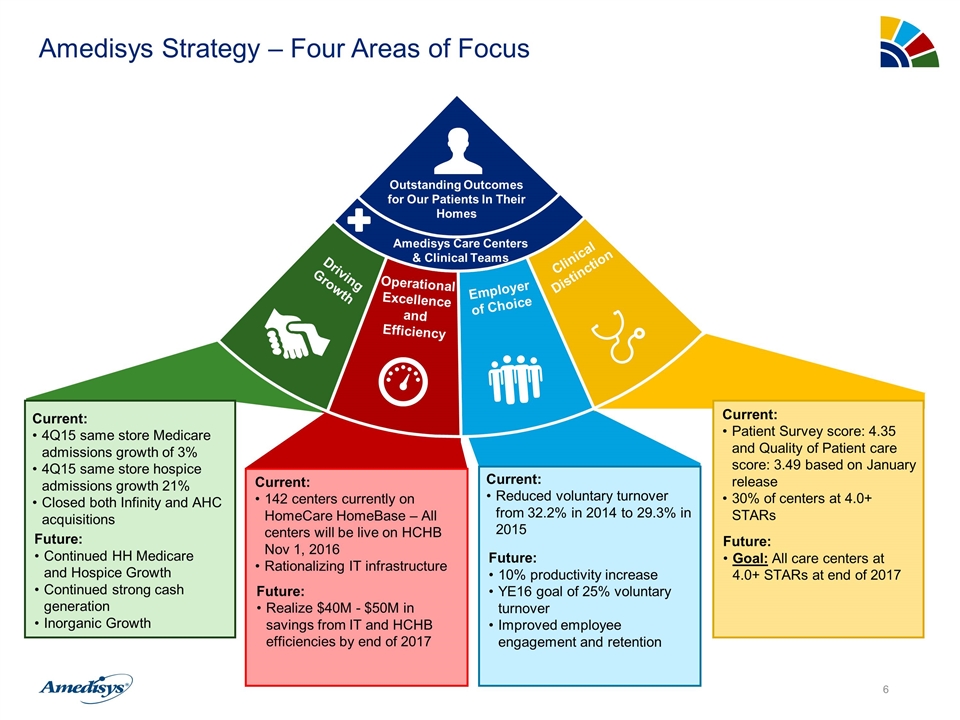
Amedisys Strategy – Four Areas of Focus Clinicians Patient Health Clinicians Patient Health Clinical Distinction Employer of Choice Operational Excellence and Efficiency Driving Growth Outstanding Outcomes for Our Patients In Their Homes Amedisys Care Centers & Clinical Teams Current: 142 centers currently on HomeCare HomeBase – All centers will be live on HCHB Nov 1, 2016 Rationalizing IT infrastructure Future: Realize $40M - $50M in savings from IT and HCHB efficiencies by end of 2017 Current: Reduced voluntary turnover from 32.2% in 2014 to 29.3% in 2015 Future: 10% productivity increase YE16 goal of 25% voluntary turnover Improved employee engagement and retention Current: Patient Survey score: 4.35 and Quality of Patient care score: 3.49 based on January release 30% of centers at 4.0+ STARs Future: Goal: All care centers at 4.0+ STARs at end of 2017 Current: 4Q15 same store Medicare admissions growth of 3% 4Q15 same store hospice admissions growth 21% Closed both Infinity and AHC acquisitions Future: Continued HH Medicare and Hospice Growth Continued strong cash generation Inorganic Growth
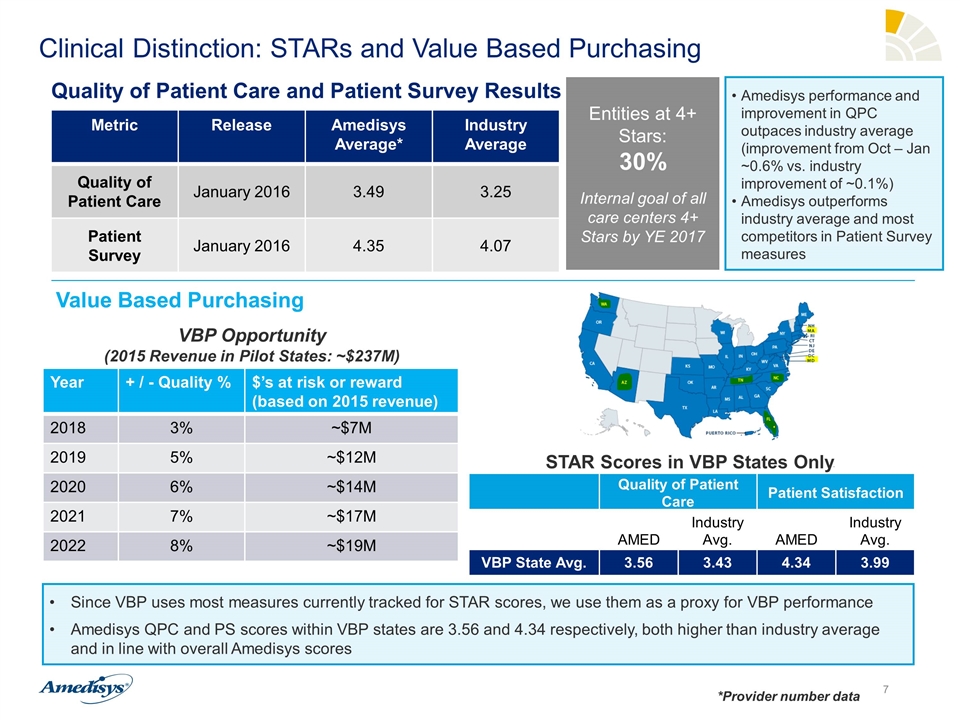
Clinical Distinction: STARs and Value Based Purchasing Metric Release Amedisys Average* Industry Average Quality of Patient Care January 2016 3.49 3.25 Patient Survey January 2016 4.35 4.07 Quality of Patient Care and Patient Survey Results Value Based Purchasing Entities at 4+ Stars: 30% Internal goal of all care centers 4+ Stars by YE 2017 *Provider number data Year + / - Quality % $’s at risk or reward (based on 2015 revenue) 2018 3% ~$7M 2019 5% ~$12M 2020 6% ~$14M 2021 7% ~$17M 2022 8% ~$19M Amedisys performance and improvement in QPC outpaces industry average (improvement from Oct – Jan ~0.6% vs. industry improvement of ~0.1%) Amedisys outperforms industry average and most competitors in Patient Survey measures Quality of Patient Care Patient Satisfaction AMED Industry Avg. AMED Industry Avg. VBP State Avg. 3.56 3.43 4.34 3.99 Since VBP uses most measures currently tracked for STAR scores, we use them as a proxy for VBP performance Amedisys QPC and PS scores within VBP states are 3.56 and 4.34 respectively, both higher than industry average and in line with overall Amedisys scores STAR Scores in VBP States Only VBP Opportunity (2015 Revenue in Pilot States: ~$237M)
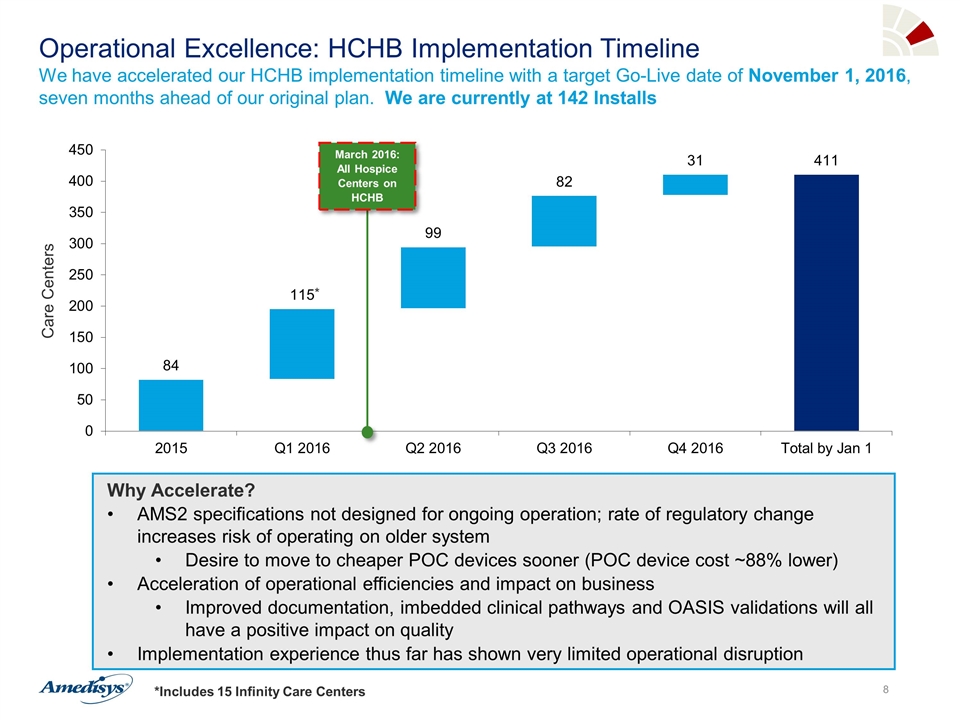
Operational Excellence: HCHB Implementation Timeline We have accelerated our HCHB implementation timeline with a target Go-Live date of November 1, 2016, seven months ahead of our original plan. We are currently at 142 Installs Care Centers Why Accelerate? AMS2 specifications not designed for ongoing operation; rate of regulatory change increases risk of operating on older system Desire to move to cheaper POC devices sooner (POC device cost ~88% lower) Acceleration of operational efficiencies and impact on business Improved documentation, imbedded clinical pathways and OASIS validations will all have a positive impact on quality Implementation experience thus far has shown very limited operational disruption March 2016: All Hospice Centers on HCHB * *Includes 15 Infinity Care Centers
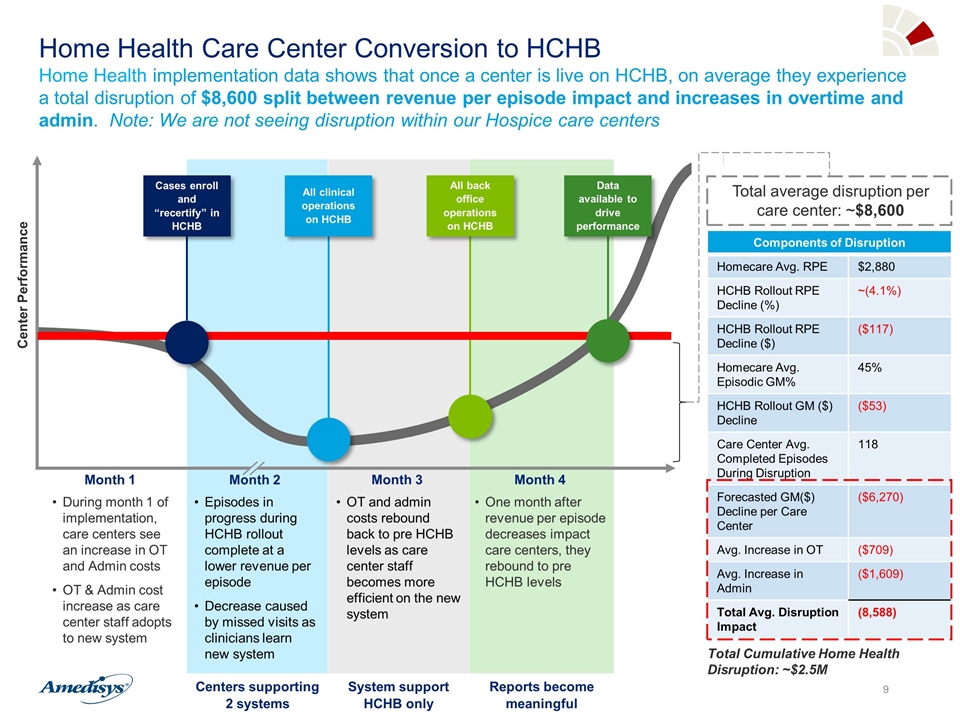
Home Health Care Center Conversion to HCHB Home Health implementation data shows that once a center is live on HCHB, on average they experience a total disruption of $8,600 split between revenue per episode impact and increases in overtime and admin. Note: We are not seeing disruption within our Hospice care centers Center Performance During month 1 of implementation, care centers see an increase in OT and Admin costs OT & Admin cost increase as care center staff adopts to new system Episodes in progress during HCHB rollout complete at a lower revenue per episode Decrease caused by missed visits as clinicians learn new system OT and admin costs rebound back to pre HCHB levels as care center staff becomes more efficient on the new system One month after revenue per episode decreases impact care centers, they rebound to pre HCHB levels Cases enroll and “recertify” in HCHB All clinical operations on HCHB All back office operations on HCHB Data available to drive performance Centers supporting 2 systems System support HCHB only Reports become meaningful Total average disruption per care center: ~$8,600 Month 1 Month 2 Month 3 Month 4 Components of Disruption Homecare Avg. RPE $2,880 HCHB Rollout RPE Decline (%) ~(4.1%) HCHB Rollout RPE Decline ($) ($117) Homecare Avg. Episodic GM% 45% HCHB Rollout GM ($) Decline ($53) Care Center Avg. Completed Episodes During Disruption 118 Forecasted GM($) Decline per Care Center ($6,270) Avg. Increase in OT ($709) Avg. Increase in Admin ($1,609) Total Avg. Disruption Impact (8,588) Total Cumulative Home Health Disruption: ~$2.5M
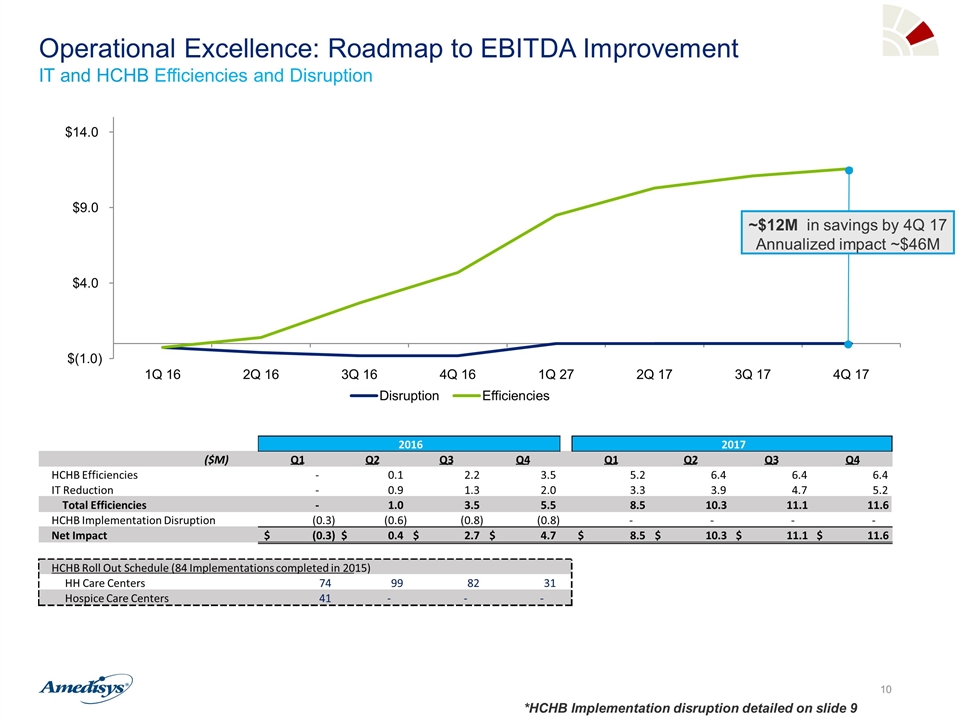
Operational Excellence: Roadmap to EBITDA Improvement IT and HCHB Efficiencies and Disruption ~$12M in savings by 4Q 17 Annualized impact ~$46M *HCHB Implementation disruption detailed on slide 9 ($M) Q1 Q2 Q3 Q4 Q1 Q2 Q3 Q4 HCHB Efficiencies - 0.1 2.2 3.5 5.2 6.4 6.4 6.4 IT Reduction - 0.9 1.3 2.0 3.3 3.9 4.7 5.2 Total Efficiencies - 1.0 3.5 5.5 8.5 10.3 11.1 11.6 HCHB Implementation Disruption (0.3) (0.6) (0.8) (0.8) - - - - Net Impact (0.3) $ 0.4 $ 2.7 $ 4.7 $ 8.5 $ 10.3 $ 11.1 $ 11.6 $ HCHB Roll Out Schedule (84 Implementations completed in 2015) HH Care Centers 74 99 82 31 Hospice Care Centers 41 - - - 2016 2017
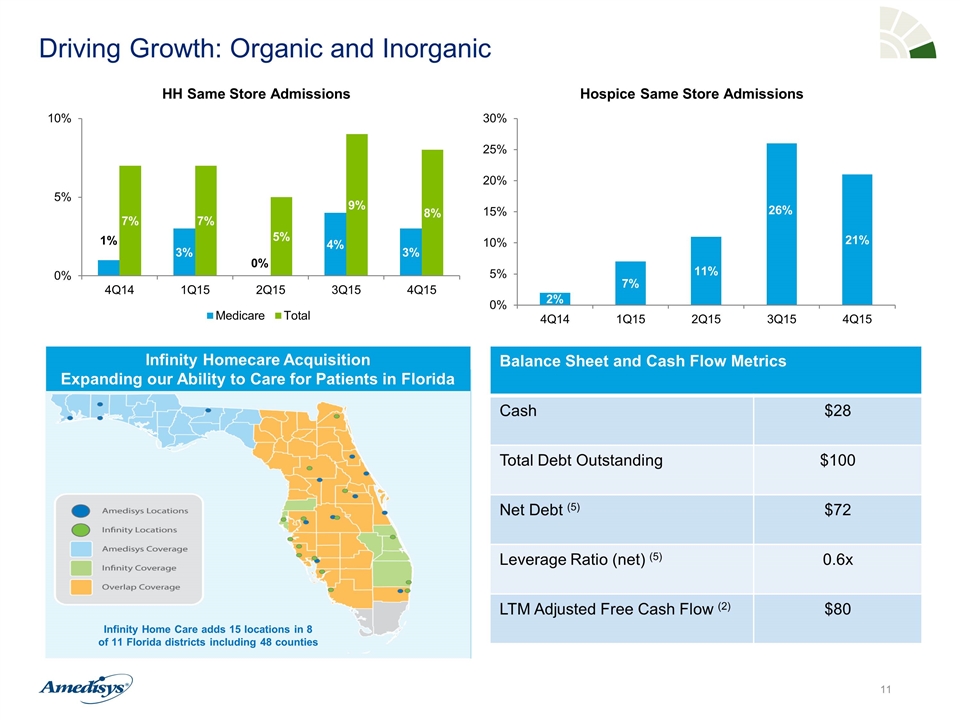
Driving Growth: Organic and Inorganic Balance Sheet and Cash Flow Metrics Cash $28 Total Debt Outstanding $100 Net Debt (5) $72 Leverage Ratio (net) (5) 0.6x LTM Adjusted Free Cash Flow (2) $80 Infinity Homecare Acquisition Expanding our Ability to Care for Patients in Florida Infinity Home Care adds 15 locations in 8 of 11 Florida districts including 48 counties
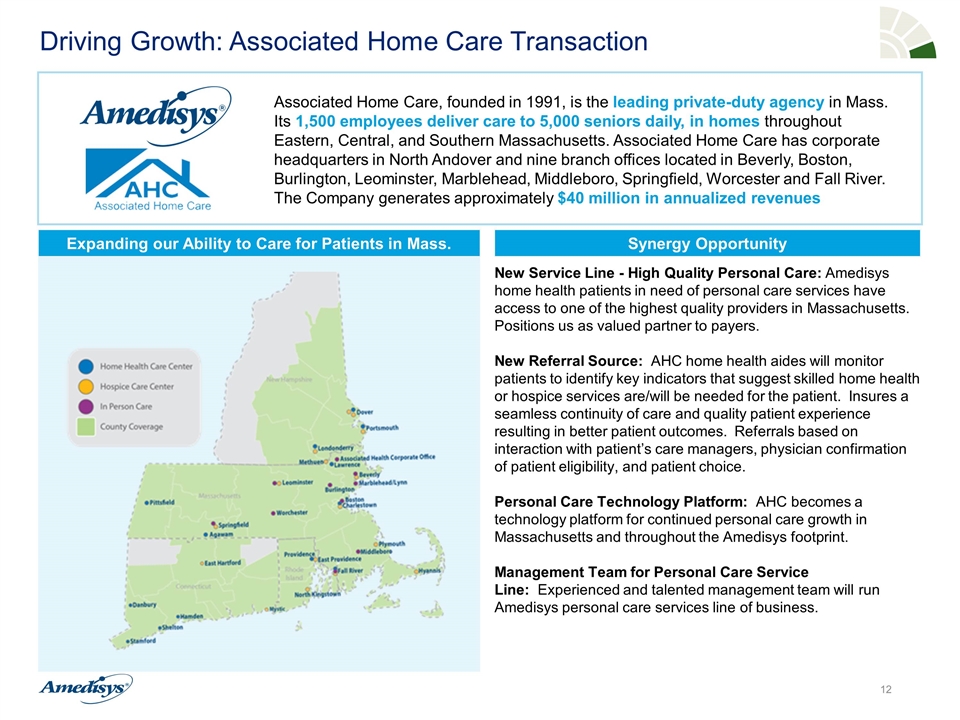
Driving Growth: Associated Home Care Transaction Synergy Opportunity Associated Home Care, founded in 1991, is the leading private-duty agency in Mass. Its 1,500 employees deliver care to 5,000 seniors daily, in homes throughout Eastern, Central, and Southern Massachusetts. Associated Home Care has corporate headquarters in North Andover and nine branch offices located in Beverly, Boston, Burlington, Leominster, Marblehead, Middleboro, Springfield, Worcester and Fall River. The Company generates approximately $40 million in annualized revenues New Service Line - High Quality Personal Care: Amedisys home health patients in need of personal care services have access to one of the highest quality providers in Massachusetts. Positions us as valued partner to payers. New Referral Source: AHC home health aides will monitor patients to identify key indicators that suggest skilled home health or hospice services are/will be needed for the patient. Insures a seamless continuity of care and quality patient experience resulting in better patient outcomes. Referrals based on interaction with patient’s care managers, physician confirmation of patient eligibility, and patient choice. Personal Care Technology Platform: AHC becomes a technology platform for continued personal care growth in Massachusetts and throughout the Amedisys footprint. Management Team for Personal Care Service Line: Experienced and talented management team will run Amedisys personal care services line of business. Expanding our Ability to Care for Patients in Mass.
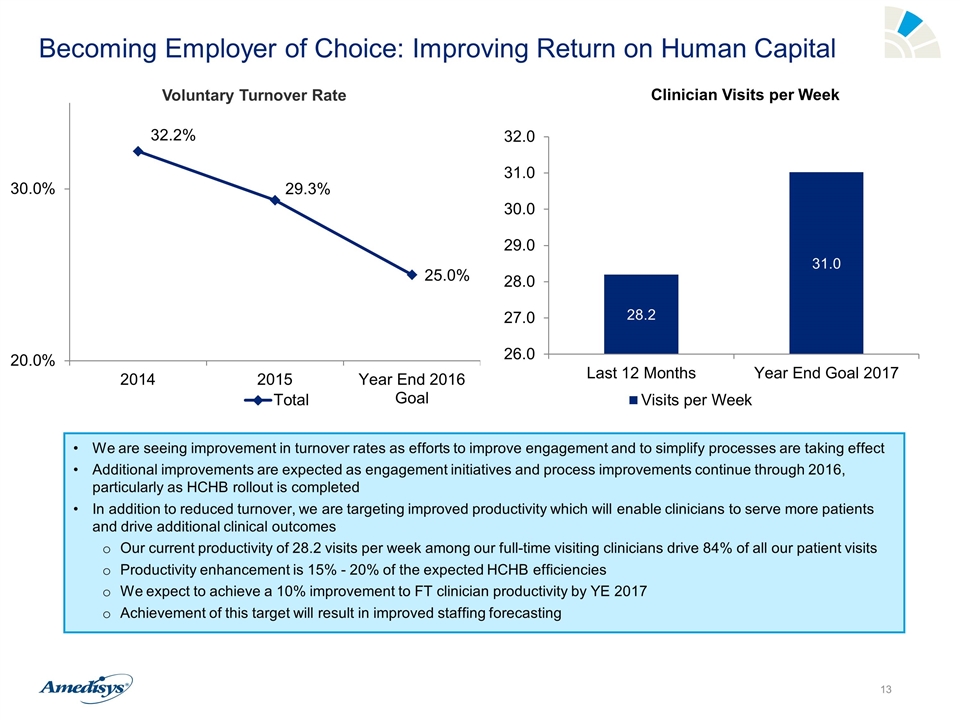
Becoming Employer of Choice: Improving Return on Human Capital We are seeing improvement in turnover rates as efforts to improve engagement and to simplify processes are taking effect Additional improvements are expected as engagement initiatives and process improvements continue through 2016, particularly as HCHB rollout is completed In addition to reduced turnover, we are targeting improved productivity which will enable clinicians to serve more patients and drive additional clinical outcomes Our current productivity of 28.2 visits per week among our full-time visiting clinicians drive 84% of all our patient visits Productivity enhancement is 15% - 20% of the expected HCHB efficiencies We expect to achieve a 10% improvement to FT clinician productivity by YE 2017 Achievement of this target will result in improved staffing forecasting 21% 15% 14% 11% 10% 12% 12% 23% 25% 23% 56% 50% Voluntary Turnover Rate
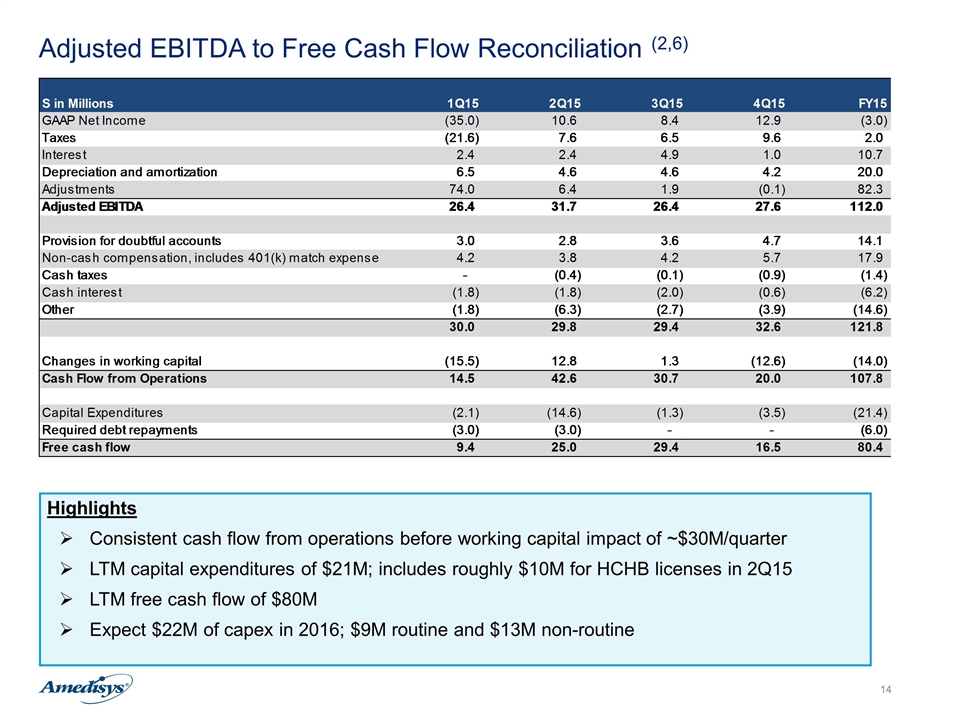
Adjusted EBITDA to Free Cash Flow Reconciliation (2,6) Highlights Consistent cash flow from operations before working capital impact of ~$30M/quarter LTM capital expenditures of $21M; includes roughly $10M for HCHB licenses in 2Q15 LTM free cash flow of $80M Expect $22M of capex in 2016; $9M routine and $13M non-routine
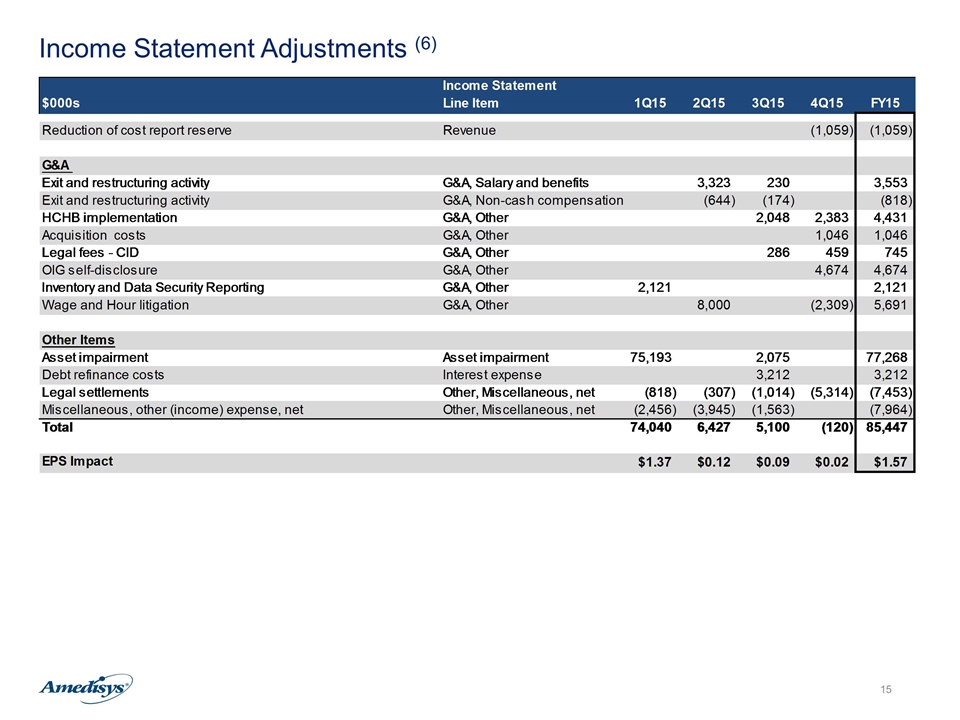
Income Statement Adjustments (6)
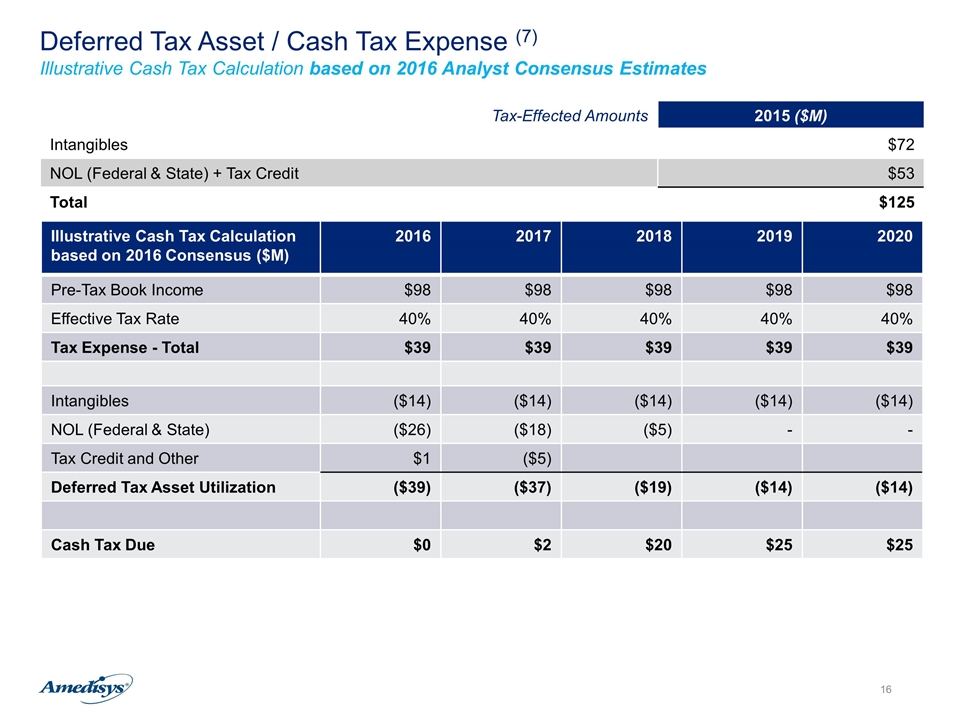
Deferred Tax Asset / Cash Tax Expense (7) Illustrative Cash Tax Calculation based on 2016 Analyst Consensus Estimates Tax-Effected Amounts 2015 ($M) Intangibles $72 NOL (Federal & State) + Tax Credit $53 Total $125 Illustrative Cash Tax Calculation based on 2016 Consensus ($M) 2016 2017 2018 2019 2020 Pre-Tax Book Income $98 $98 $98 $98 $98 Effective Tax Rate 40% 40% 40% 40% 40% Tax Expense - Total $39 $39 $39 $39 $39 Intangibles ($14) ($14) ($14) ($14) ($14) NOL (Federal & State) ($26) ($18) ($5) - - Tax Credit and Other $1 ($5) Deferred Tax Asset Utilization ($39) ($37) ($19) ($14) ($14) Cash Tax Due $0 $2 $20 $25 $25
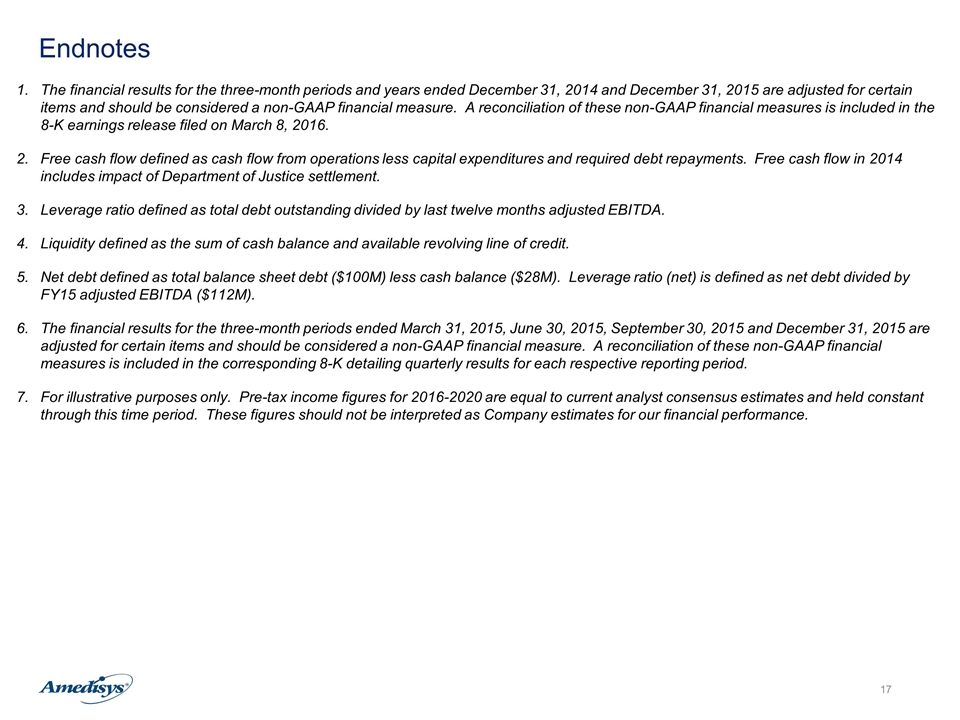
Endnotes The financial results for the three-month periods and years ended December 31, 2014 and December 31, 2015 are adjusted for certain items and should be considered a non-GAAP financial measure. A reconciliation of these non-GAAP financial measures is included in the 8-K earnings release filed on March 8, 2016. Free cash flow defined as cash flow from operations less capital expenditures and required debt repayments. Free cash flow in 2014 includes impact of Department of Justice settlement. Leverage ratio defined as total debt outstanding divided by last twelve months adjusted EBITDA. Liquidity defined as the sum of cash balance and available revolving line of credit. Net debt defined as total balance sheet debt ($100M) less cash balance ($28M). Leverage ratio (net) is defined as net debt divided by FY15 adjusted EBITDA ($112M). The financial results for the three-month periods ended March 31, 2015, June 30, 2015, September 30, 2015 and December 31, 2015 are adjusted for certain items and should be considered a non-GAAP financial measure. A reconciliation of these non-GAAP financial measures is included in the corresponding 8-K detailing quarterly results for each respective reporting period. For illustrative purposes only. Pre-tax income figures for 2016-2020 are equal to current analyst consensus estimates and held constant through this time period. These figures should not be interpreted as Company estimates for our financial performance.
