Attached files
| file | filename |
|---|---|
| EX-32.2 - EX-32.2 - MEDALLION FINANCIAL CORP | d128183dex322.htm |
| EX-32.1 - EX-32.1 - MEDALLION FINANCIAL CORP | d128183dex321.htm |
| EX-31.2 - EX-31.2 - MEDALLION FINANCIAL CORP | d128183dex312.htm |
| EX-99.1 - EX-99.1 - MEDALLION FINANCIAL CORP | d128183dex991.htm |
| EX-12.1 - EX-12.1 - MEDALLION FINANCIAL CORP | d128183dex121.htm |
| EX-21.1 - EX-21.1 - MEDALLION FINANCIAL CORP | d128183dex211.htm |
| EX-23.1 - EX-23.1 - MEDALLION FINANCIAL CORP | d128183dex231.htm |
| EX-31.1 - EX-31.1 - MEDALLION FINANCIAL CORP | d128183dex311.htm |
| EX-10.8 - EX-10.8 - MEDALLION FINANCIAL CORP | d128183dex108.htm |
Table of Contents
UNITED STATES
SECURITIES AND EXCHANGE COMMISSION
WASHINGTON, D.C. 20549
FORM 10-K
(Mark One)
| x | ANNUAL REPORT PURSUANT TO SECTION 13 OR 15(d) OF THE SECURITIES EXCHANGE ACT OF 1934 |
For the Fiscal Year Ended December 31, 2015
OR
| ¨ | TRANSITION REPORT PURSUANT TO SECTION 13 OR 15(d) OF THE SECURITIES EXCHANGE ACT OF 1934 |
For the transition period from to
Commission file number 814-00188
MEDALLION FINANCIAL CORP.
(Exact name of registrant as specified in its charter)
| DELAWARE | 04-3291176 | |
| (State of Incorporation) |
(IRS Employer Identification No.) |
437 MADISON AVENUE, 38th Floor, NEW YORK, NEW YORK 10022
(Address of principal executive offices) (Zip Code)
(212) 328-2100
(Registrant’s telephone number, including area code)
Securities registered pursuant to Section 12(b) of the Act: None
Securities registered pursuant to Section 12(g) of the Act
Common Stock, par value $0.01 per share
(Title of class)
Indicate by check mark if the registrant is a well-known seasoned issuer, as defined in Rule 405 of the Securities Act. YES ¨ NO x
Indicated by check mark if the registrant is not required to file reports pursuant to Section 13 or Section 15(d) of the Act: YES ¨ NO x
Indicate by check mark whether the Registrant (1) has filed all reports required to be filed by Section 13 or 15(d) of the Securities Exchange Act of 1934 during the preceding 12 months (or for such shorter period that the Registrant was required to file such reports), and (2) has been subject to such filing requirements for the past 90 days. YES x NO ¨
Indicate by check mark whether the Registrant has submitted electronically and posted on its corporate web site, if any, every Interactive Data File required to be submitted and posted pursuant to Rule 405 of Regulation S-T (§232.405 of this chapter) during the preceding 12 months (or such shorter period that the Registrant was required to submit and post such files). YES ¨ NO ¨
Indicate by check mark if disclosure of delinquent filers pursuant to Item 405 of Regulation S-K is not contained herein and will not be contained, to the best of the registrant’s knowledge, in definitive proxy or information statements incorporated by reference in Part III of this Form 10-K or any amendment to this Form 10-K x
Indicate by check mark whether the Registrant is a large accelerated filer, an accelerated filer, a non-accelerated filer, or a smaller reporting company. See the definitions of “large accelerated filer,” “accelerated filer,” and “smaller reporting company” in Rule 12b-2 of the Exchange Act. (check one):
| Large Accelerated Filer ¨ | Accelerated Filer x | Non Accelerated Filer ¨ | Smaller Reporting Company ¨ |
Indicate by check mark whether the Registrant is a shell company (as defined in Rule 12b-2 of the Exchange Act) YES ¨ NO x
The aggregate market value of the voting common equity held by non-affiliates of the registrant, computed by reference to the last reported price at which the stock was sold on June 30, 2015 was $176,474,929.
The number of outstanding shares of registrant’s Common Stock, par value $0.01, as of March 7, 2016 was 24,346,479.
Table of Contents
DOCUMENTS INCORPORATED BY REFERENCE
Portions of the registrant’s Definitive Proxy Statement for its 2016 Annual Meeting of Shareholders, which Definitive Proxy Statement will be filed with the Securities and Exchange Commission not later than 120 days after the registrant’s fiscal year-end of December 31, 2015, are incorporated by reference into Part III of this form 10-K
MEDALLION FINANCIAL CORP.
2015 FORM 10-K ANNUAL REPORT
2
Table of Contents
The following discussion should be read in conjunction with our financial statements and the notes to those statements and other financial information appearing elsewhere in this report.
This report contains forward-looking statements relating to future events and future performance applicable to us within the meaning of Section 27A of the Securities Act of 1933 and Section 21E of the Securities Exchange Act of 1934, including, without limitation, statements regarding our expectations, beliefs, intentions, or future strategies that are signified by the words expects, anticipates, intends, believes, or similar language. Actual results could differ materially from those anticipated in such forward-looking statements. All forward-looking statements included in this document are based on information available to us on the date hereof, and we assume no obligation to update any forward-looking statements. We caution investors that our business and financial performance are subject to substantial risks and uncertainties.
| ITEM 1. | OUR BUSINESS |
We, Medallion Financial Corp. or the Company, are a specialty finance company that has a leading position in originating, acquiring, and servicing loans that finance taxicab medallions and various types of commercial businesses. A wholly-owned portfolio company of ours, Medallion Bank, also originates consumer loans for the purchase of recreational vehicles, boats, motorcycles, trailers, and to finance small scale home improvements. Our core philosophy has been “In niches there are riches.” We try to identify markets that are profitable and where we can become an industry leader. Our investment objectives are to provide high level of distributable income, consistent with the preservation of capital, as well as long-term growth of net asset value and our stock price. These investment objectives may be changed without shareholder approval. We also provide other debt, mezzanine, and equity investment capital to companies in a variety of industries, consistent with our investment objectives. For additional information about our business and operations, see “Management’s Discussion and Analysis of Financial Condition and Results of Operations.”
Since 1996, the year in which we became a public company, we have increased our taxicab medallion loan portfolio at a compound annual growth rate of 4%, and our commercial loan portfolio at a compound annual growth rate of 4% (9% and 6% on a managed basis when combined with Medallion Bank). Since Medallion Bank acquired a consumer loan portfolio and began originating consumer loans in 2004, it has increased its consumer loan portfolio at a compound annual growth rate of 18%. Total assets under our management and the management of our unconsolidated wholly-owned subsidiaries, which includes our managed net investment portfolio, as well as assets serviced for third party investors, were $1,655,000,000 as of December 31, 2015 and $1,497,000,000 as of December 31, 2014, and have grown at a compound annual growth rate of 11% from $215,000,000 at the end of 1996. Since our initial public offering in 1996, we have paid/declared distributions in excess of $254,000,000 or $14.31 per share.
We conduct our business through various wholly-owned investment company subsidiaries including:
| • | Medallion Funding LLC, or Medallion Funding, a Small Business Investment Company, or SBIC, our primary taxicab medallion lending company; |
| • | Medallion Capital, Inc., or Medallion Capital, an SBIC and a regulated investment company, or RIC, which conducts a mezzanine financing business; and |
| • | Freshstart Venture Capital Corp., or Freshstart, an SBIC and a RIC, which originates and services taxicab medallion and commercial loans. |
We formed a wholly-owned portfolio company, Medallion Servicing Corporation, or MSC, to provide loan services to Medallion Bank, also a portfolio company wholly-owned by us. We have assigned all of our loan servicing rights for Medallion Bank, which consists of servicing taxi medallion and commercial loans originated by Medallion Bank, to MSC, which bills and collects the related service fee income from Medallion Bank, and is allocated and charged by us for MSC’s share of these servicing costs.
We also conduct business through our asset-based lending division, Medallion Business Credit, an originator of loans to small businesses for the purpose of financing inventory and receivables.
3
Table of Contents
In addition, we conduct business through a wholly-owned portfolio company, Medallion Bank, a bank regulated by the FDIC and the Utah Department of Financial Institutions which originates taxicab medallion, commercial, and consumer loans, raises deposits, and conducts other banking activities. Medallion Bank generally provides us with our lowest cost of funds which it raises through bank certificates of deposit issued to its customers. To take advantage of this low cost of funds, we refer a portion of our taxicab medallion and commercial loans to Medallion Bank, which then originates these loans, which are then serviced by MSC. However, the FDIC restricts the amount of taxicab medallion loans that Medallion Bank may finance to three times Tier 1 capital, or $485,814,000 as of December 31, 2015. MSC earns referral and servicing fees for these activities. As a non-investment company, Medallion Bank is not consolidated with the Company, which is an investment company under the Investment Company Act of 1940, or the 1940 Act.
We are a closed-end, non-diversified management investment company, organized as a Delaware corporation, under the 1940 Act. We have elected to be treated as a business development company, or BDC, under the 1940 Act. We have also elected to be treated for federal income tax purposes as a RIC under Subchapter M of the Internal Revenue Code, or the Code. As a RIC, we generally do not have to pay corporate-level federal income taxes on any net ordinary income or capital gains that we distribute to our shareholders as dividends, if we meet certain source-of-income and asset diversification requirements. Medallion Bank is not a RIC and must pay corporate-level US federal and state income taxes.
We are managed by our executive officers under the supervision of our Board of Directors. As a result, we do not pay investment advisory fees, but instead we incur the operating costs associated with employing investment and portfolio management professionals. Alvin Murstein, our chairman and chief executive officer, has over 50 years of experience in the ownership, management, and financing of taxicab medallions and other commercial businesses. Andrew M. Murstein, our president, has over 25 years of experience and is the third generation in his family to participate in the business.
Below is our organizational structure reflecting our consolidated and unconsolidated subsidiaries.
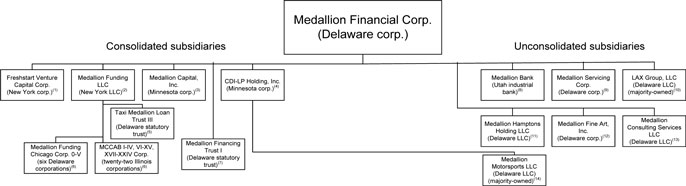
| (1) | An SBIC and a RIC which originates and services taxicab medallion and commercial loans. |
| (2) | An SBIC which is our primary taxicab medallion lending company. |
| (3) | An SBIC and a RIC which conducts a mezzanine financing business. |
| (4) | Formed for the purpose of holding and managing equity investments in a racing team, an equipment manufacturing business, and an airport and food retail business. |
| (5) | Formed for the purpose of owning medallion loans originated by Medallion Funding. |
| (6) | Formed for purpose of owning and leasing repossessed Chicago taxicab medallions. |
| (7) | Formed for the purpose of issuing unsecured preferred securities to investors. |
| (8) | A Utah industrial bank regulated by the FDIC and the Utah Department of Financial Institutions which originates taxicab medallion, commercial, and consumer loans, raises deposits, and conducts other banking activities. |
| (9) | Formed for the purpose of conducting loan servicing activities. |
| (10) | Formed for the purpose of holding an equity investment in a professional lacrosse team. |
| (11) | Formed for the purpose of holding and managing a hotel investment and such investment was sold in March 2015. |
| (12) | Formed for the purpose of engaging in art dealing. |
| (13) | Formed for the purpose of engaging in general consulting services. |
| (14) | Formed for the purpose of holding an equity investment in a racing team. |
4
Table of Contents
Our Market
We provide loans to individuals and small to mid-size businesses, both directly through our investment company subsidiaries and also through Medallion Bank, in three primary markets:
| • | loans that finance taxicab medallions; |
| • | loans that finance commercial businesses; and |
| • | loans that finance consumer purchases of recreational vehicles, boats, motorcycles, and trailers, and to finance small scale home improvements. |
The following chart shows the components of our $1,501,555,000 managed net investment portfolio as of December 31, 2015.
| (Dollars in thousands) |
On-Balance Sheet | Off-Balance Sheet (1) | Total Managed Investments | |||||||||
| Medallion loans |
$ | 308,408 | $ | 332,496 | $ | 640,904 | ||||||
| Commercial loans |
81,895 | 43,987 | 125,882 | |||||||||
| Consumer loans |
— | 619,887 | 619,887 | |||||||||
| Investments in Medallion Bank and other controlled subsidiaries |
159,913 | (137,298 | ) | 22,615 | ||||||||
| Investment securities |
49,884 | 35,524 | 85,408 | |||||||||
| Equity investments |
6,859 | — | 6,859 | |||||||||
|
|
|
|
|
|
|
|||||||
| Net investment portfolio |
$ | 606,959 | $ | 894,596 | $ | 1,501,555 | ||||||
|
|
|
|
|
|
|
|||||||
| (1) | Off-balance sheet investments are those owned by our wholly-owned unconsolidated portfolio companies, primarily Medallion Bank. |
Medallion Loans
Taxi medallion loans of $308,408,000 comprised 51% of our $606,959,000 net investment portfolio as of December 31, 2015, compared to $311,894,000 or 59% of our $527,601,000 net investment portfolio as of December 31, 2014. Managed taxi medallion loans of $640,904,000 comprised 43% of our $1,501,555,000 managed net investment portfolio as of December 31, 2015, compared to $677,155,000 or 52% of our $1,310,685,000 managed net investment portfolio as of December 31, 2014. Including loans to unaffiliated investors, the total amount of medallion loans under our management was $667,863,000 as of December 31, 2015, compared to $704,813,000 as of December 31, 2014. Since 1979, we and Medallion Bank have originated, on a combined basis, approximately $3,539,000,000 in medallion loans in New York City, Chicago, Boston, Newark, Cambridge, and other cities within the United States. In addition, our management has a long history of owning, managing, and financing taxicab fleets, taxicab medallions, and corporate car services, dating back to 1956.
Medallion loans collateralized by New York City taxicab medallions and related assets comprised 69% and 68% of the value of the medallion loan portfolio as of December 31, 2015 and 2014, and were 74% on a managed basis. Based on taxi medallion values published by the New York City Taxi and Limousine Commission, or TLC, we estimate that the total value of all of New York City taxicab medallions and related assets such as the vehicle, taximeter, and roof lights exceeded $10.7 billion as of December 31, 2015. We estimate that the total value of all taxicab medallions and related assets in our major US markets exceeded $13.5 billion as of December 31, 2015.
Although some of the medallion loans have from time to time been in arrears or in default, our loss experience on medallion loans has been negligible to date. We believe that our medallion loan portfolio is of good credit quality as all of our medallion loans are secured by the medallion and enhanced with personal guarantees of the shareholders and owners. When a borrower defaults on a loan, we can repossess the medallion collateralizing that loan. If the loan is not brought current, the medallion is sold in the traditionally active market and personal guarantees are pursued.
The following table displays information on managed medallion loans outstanding (other than those managed for third party investors) in each of our major markets at December 31, 2015. For a presentation of only the consolidated on-balance sheet medallion loans, see the Consolidated Summary Schedule of Investments in the consolidated financial statements on page F-32.
| (Dollars in thousands) |
# of Loans | % of Medallion Loan Portfolio (1) |
Average Interest Rate (2) |
Principal Balance |
||||||||||||
| Managed medallion loans |
||||||||||||||||
| New York |
774 | 74 | % | 3.61 | % | $ | 479,588 | |||||||||
| Chicago |
266 | 14 | 4.92 | 92,704 | ||||||||||||
| Newark |
146 | 5 | 5.23 | 31,659 | ||||||||||||
| Boston |
66 | 4 | 4.58 | 29,660 | ||||||||||||
5
Table of Contents
| Cambridge |
22 | 2 | 4.40 | 12,302 | ||||||||||||
| Other |
44 | 1 | 7.80 | 3,805 | ||||||||||||
|
|
|
|
|
|
|
|||||||||||
| Total managed medallion loans |
1,318 | 100 | % | 3.96 | 649,718 | |||||||||||
|
|
|
|
|
|
|
|||||||||||
| Deferred loan acquisition costs |
760 | |||||||||||||||
| Unrealized depreciation on loans |
(9,574 | ) | ||||||||||||||
|
|
|
|||||||||||||||
| Net managed medallion loans |
$ | 640,904 | ||||||||||||||
|
|
|
| (1) | Based on principal balance outstanding at December 31, 2015. |
| (2) | Based on the contractual rates of the portfolios at December 31, 2015. |
The New York City Market. A New York City taxicab medallion is the only permitted license to operate a taxicab and accept street hails in New York City, except as discussed below. As reported by the TLC, individual (owner-driver) medallions sold for approximately $715,000 and corporate medallions sold for approximately $793,000 as of December 31, 2015. Individual medallions are issued to an owner-driver who must drive the taxicab for a minimum number of hours in each calendar year whereas corporate medallions are medallions that can be aggregated by businesses, leased to drivers, and operated for more than one shift. The number of taxicab medallions is limited by law, and as a result of the limited supply of medallions, an active market for medallions has developed. The law limiting the number of medallions also stipulates that the ownership for the 13,630 medallions outstanding as of December 31, 2015 shall remain divided into 5,733 individual medallions and 7,897 fleet or corporate medallions. Corporate medallions are more valuable because they can be aggregated by businesses, leased to drivers, and operated for more than one shift. New York City auctioned 600 additional medallions during 2004, 308 during 2006, 89 during 2008, 200 in 2013, and 206 in 2014. The medallions auctioned in 2006 were restricted to hybrid fuel vehicles and wheelchair accessible vehicles. In addition, New York City auctioned an additional 63 medallions for wheelchair accessible vehicles in 2007. There was a 25% fare increase which took effect in May 2004 and a 17% fare increase that took effect in September 2012. The New York State legislature enacted a law on December 21, 2011 which was amended on February 17, 2012 to permit cars for hire to pick up street hails in the boroughs outside Manhattan. Pursuant to the law, the TLC began issuing Street Hail Livery licenses in June 2013.
A prospective medallion owner must qualify under the medallion ownership standards set and enforced by the TLC. These standards prohibit individuals with criminal records from owning medallions, require that the funds used to purchase medallions be derived from legitimate sources, and mandate that taxicab vehicles and meters meet TLC specifications. In addition, before the TLC will approve a medallion transfer, the TLC requires a letter from the seller’s insurer stating that there are no outstanding claims for personal injuries in excess of insurance coverage. After the transfer is approved, the owner’s taxicab is subject to quarterly TLC inspections.
Most New York City medallion transfers are handled through approximately 24 medallion brokers licensed by the TLC. In addition to brokering medallions, these brokers also arrange for TLC documentation insurance, vehicles, meters, and financing. We have excellent relations with many of the most active brokers, and regularly receive referrals from them. Brokers generated 24% of the loans originated during 2015, and 28% for 2014. However, we receive most of our referrals from a small number of brokers.
The Chicago Market. We estimate that Chicago medallions sold for approximately $239,000 as of December 31, 2015. Pursuant to a municipal ordinance, the number of outstanding medallions is capped at 6,995 as of December 31, 2015. We estimate that the total value of all Chicago medallions and related assets is over $1,741,755,000 as of December 31, 2015.
The Boston Market. We estimate that Boston medallions sold for approximately $389,000 as of December 31, 2015. The number of Boston medallions is capped at 1,825 as of December 31, 2015. We estimate that the total value of all Boston medallions and related assets is over $732,409,000 as of December 31, 2015.
The Newark Market. We estimate that Newark medallions sold for approximately $321,000 as of December 31, 2015. The number of Newark medallions has been limited to 600 since 1950 by local law. We estimate that the total value of all Newark medallions and related assets is over $196,350,000 as of December 31, 2015.
The Cambridge Market. We estimate that Cambridge medallions sold for approximately $301,000 as of December 31, 2015. The number of Cambridge medallions is 257 as of December 31, 2015. We estimate that the total value of all Cambridge medallions and related assets is over $80,055,000 as of December 31, 2015.
6
Table of Contents
Commercial Loans
Commercial loans finance either the purchase of the equipment and related assets necessary to open a new business or the purchase or improvement of an existing business. From the inception of the commercial loan business in 1987 through December 31, 2015, we and Medallion Bank have originated more than $908,067,000 of commercial loans. Commercial loans of $81,895,000 comprised 14% of our $606,959,000 net investment portfolio as of December 31, 2015, compared to $71,149,000 or 14% of our $527,601,000 net investment portfolio as of December 31, 2014. Managed commercial loans of $125,882,000 comprised 8% of our $1,501,555,000 net investment portfolio as of December 31, 2015, compared to $114,404,000 or 9% of our $1,310,685,000 managed net investment portfolio as of December 31, 2014. We have worked to increase our commercial loan activity in recent years, primarily because of the attractive higher yielding, floating rate nature of most of this business. The outstanding balances of managed commercial loans have grown at a compound annual rate of 6% since 1996. The increase since 1996 has been primarily driven by internal growth through the origination of additional commercial loans. We focus our marketing efforts on the manufacturing, retail trade, professional, scientific, and technical services and other services. The majority of our commercial borrowers are located in the New York metropolitan area and the Midwest. We plan to continue expanding our commercial loan activities by developing a more diverse borrower base, a wider geographic area of coverage, and by expanding targeted industries.
Commercial loans are generally secured by equipment, accounts receivable, real estate, or other assets, and have interest rates averaging 668 basis points over the prevailing prime rate at year end, up from 595 basis points over prime at the end of 2014. As with medallion loans, the vast majority of the principals of borrowers personally guarantee commercial loans. The aggregate realized loss of principal on managed commercial loans has averaged 2.5% per annum for the last five years.
The following table displays information on managed commercial loans outstanding (other than those managed for third party investors) in each of our major markets at December 31, 2015. For a presentation of only the consolidated on-balance sheet commercial loans, see the Consolidated Summary Schedule of Investments in the consolidated financial statements on F-30.
| (Dollars in thousands) |
# of Loans | % of Commercial Loan Portfolio (1) |
Average Interest Rate (2) |
Principal Balance |
||||||||||||
| Managed commercial loans |
||||||||||||||||
| Secured mezzanine |
33 | 53 | % | 13.59 | % | $ | 67,849 | |||||||||
| Asset-based |
49 | 34 | 5.31 | 44,620 | ||||||||||||
| Other secured commercial |
89 | 13 | 9.34 | 16,386 | ||||||||||||
|
|
|
|
|
|
|
|||||||||||
| Total managed commercial loans |
171 | 100 | % | 10.18 | 128,855 | |||||||||||
|
|
|
|
|
|
|
|||||||||||
| Deferred loan acquisition income |
(116 | ) | ||||||||||||||
| Unrealized depreciation on loans |
(2,857 | ) | ||||||||||||||
|
|
|
|||||||||||||||
| Net managed commercial loans |
$ | 125,882 | ||||||||||||||
|
|
|
|||||||||||||||
| (1) | Based on principal balance outstanding at December 31, 2015. |
| (2) | Based on the contractual rates of the portfolios at December 31, 2015. |
Secured Mezzanine Loans. Through our subsidiary Medallion Capital, we originate both senior and subordinated loans nationwide to businesses in a variety of industries, including manufacturing and various service providers, more than 70% of which are located in the Midwest and Northeast regions, with the rest scattered across the country. These mezzanine loans are primarily secured by a second position on all assets of the businesses and generally range in amount from $1,000,000 to $5,000,000, and represent approximately 53% of our managed commercial loan portfolio as of December 31, 2015, and were 47% as of December 31, 2014. Frequently, we also receive warrants to purchase an equity interest in the borrowers of secured mezzanine loans.
Asset Based Loans. Through our Medallion Business Credit division, we source, originate, manage, and service asset-based loans to small businesses which require working capital credit facilities ranging from $500,000 to $9,300,000. Medallion Business Credit refers most of its potential commercial loans to Medallion Bank to originate, so that we can benefit from Medallion Bank’s lower cost of funds. Additionally, from time to time, Medallion Business Credit also sells and purchases loan participations to and from independent third party lenders. Together, these loans represent approximately 34% of the managed commercial loan portfolio as of December 31, 2015, and were 37% as of December 31, 2014. These commercial loans are generally secured principally by the borrower’s accounts receivable, but may also be secured by inventory, machinery, equipment, and/or real estate, and are generally personally guaranteed by the principals. Currently, our clients are mostly located in the New York metropolitan area, and include wholesale and retail trade, transportation and warehousing, professional, scientific, and technical services, and other industrial and services businesses. We had successfully originated 49 commercial loans as of December 31, 2015.
Other Secured Commercial Loans. We originate, primarily through our subsidiary Freshstart, other commercial loans that are focused on retail trade businesses, which are typically located within 200 miles of New York City. These commercial loans are generally secured by all of the assets of the businesses and are generally personally guaranteed by the principals. Frequently, we
7
Table of Contents
receive assignments of lease from our borrowers. The loans generally range in size from under $100,000 to approximately $8,300,000. These loans represented approximately 13% of the managed commercial loan portfolio as of December 31, 2015, and were 16% as of December 31, 2014. Historically, most of the portfolio has consisted of fixed-rate loans.
Consumer Loans. Consumer loans are originated by Medallion Bank, a wholly-owned, unconsolidated portfolio company. Consumer loans of $619,887,000 comprised 41% of our $1,501,555,000 managed net investment portfolio as of December 31, 2015, compared to $472,547,000 or 36% of our $1,310,685,000 managed net investment portfolio as of December 31, 2014. The loans are collateralized by recreational vehicles, boats, motorcycles, trailers, and home improvements, located in all 50 states. The portfolio is serviced by a large third party servicer. We believe that Medallion Bank’s consumer loan portfolio is of acceptable credit quality given the high interest rates earned on the loans, which compensate for the higher degree of credit risk in the portfolio.
Other. As a business development company, we also provide debt, mezzanine, and equity investment capital to companies in a variety of industries. These investments may be venture capital style investments which may not be fully collateralized. This is a small, but growing portion of our business.
Our Strategy
Our core philosophy has been “In niches there are riches.” We try to identify markets that are profitable and where we can be an industry leader. Key elements of our strategy include:
Capitalize on our relationships with brokers and dealers. We are committed to establishing, building, and maintaining our relationships with our brokers and dealers. Our marketing efforts are focused on building relationships with brokers in the medallion market and dealers in the consumer market. We believe that our relationships with brokers and dealers provide us with, in addition to potential investment opportunities, other significant benefits, including an additional layer of due diligence and additional monitoring capabilities. We have assembled a management team that has developed an extensive network of broker and dealer relationships in our target markets over the last 50 years. We believe that our management team’s relationships with these brokers and dealers have and will continue to provide us with significant investment opportunities. In 2015, 20% of our managed originated medallion and commercial loans and 100% of our consumer loans were generated by brokers and dealers.
Employ disciplined underwriting policies and maintain rigorous portfolio monitoring. We have an extensive investment underwriting and monitoring process. We conduct a thorough analysis of each potential investment and its prospects, competitive position, financial performance, and industry dynamics. We stress the importance of credit and risk analysis in our underwriting process. We believe that our continued adherence to this disciplined process will permit us to continue to generate a stable, diversified and increasing revenue stream of current income from our debt investments to enable us to make distributions to our shareholders.
Leverage the skills of our experienced management team. Our management team is led by our Chief Executive Officer, Mr. Alvin Murstein, and our President, Mr. Andrew M. Murstein. Alvin Murstein has over 60 years of experience in the ownership, management, and financing of taxicab medallions and other commercial businesses, and Andrew M. Murstein is the third generation in his family to participate in the business and has over 25 years of experience in the ownership, management, and financing of taxicab medallions and other commercial businesses. The other members of our management team have broad investment backgrounds, with prior experience at specialty finance companies, middle market commercial banks, and other financial services companies. We believe that the experience and contacts of our management team will continue to allow us to effectively implement the key aspects of our business strategy.
Perform Strategic Acquisitions. In addition to increasing market share in existing lending markets and identifying new niches, we seek to acquire medallion financing businesses and related portfolios and specialty finance companies that make secured loans to small businesses which have experienced historically low loan losses similar to our own. Since our initial public offering in May 1996, eight specialty finance companies, five loan portfolios, and three taxicab rooftop advertising companies have been acquired.
Investment Activity
The following table sets forth the components of investment activity in the managed investment portfolio for the years indicated.
| Year ended December 31, | ||||||||||||
| (Dollars in thousands) |
2015 | 2014 | 2013 | |||||||||
| Net investments at beginning of year |
$ | 1,310,685 | $ | 1,144,596 | $ | 1,048,635 | ||||||
| Investments originated (1) |
492,127 | 469,816 | 649,776 | |||||||||
| Repayments of investments (1) |
(288,783 | ) | (288,649 | ) | (532,220 | ) | ||||||
| Net realized losses on investments |
(3,902 | ) | (12,290 | ) | (5,163 | ) | ||||||
| Net increase in unrealized appreciation (depreciation) (2) |
3,286 | 8,661 | (3,841 | ) | ||||||||
| Transfers to other assets/liabilities, net |
(8,553 | ) | (8,413 | ) | (9,519 | ) | ||||||
| Amortization of origination costs |
(3,305 | ) | (3,036 | ) | (3,072 | ) | ||||||
|
|
|
|
|
|
|
|||||||
| Net increase in investments |
190,870 | 166,089 | 95,961 | |||||||||
|
|
|
|
|
|
|
|||||||
| Net investments at end of year |
$ | 1,501,555 | $ | 1,310,685 | $ | 1,144,596 | ||||||
|
|
|
|
|
|
|
|||||||
| (1) | Includes refinancings. |
| (2) | Excludes net unrealized appreciation (depreciation) of ($10,839), ($1,759), and $6,647 for the years ended December 31, 2015, 2014, and 2013 related to investments other than securities and other assets. |
8
Table of Contents
Investment Characteristics
Medallion Loans. Our medallion loan portfolio consists of mostly fixed-rate loans, collateralized by first security interests in taxicab medallions and related assets (vehicles, meters, and the like). We estimate that the weighted average loan-to-value ratio of all of the medallion loans was 76% as of December 31, 2015. In addition, we have recourse against a vast majority of the owners of the taxicab medallions and related assets through personal guarantees.
Medallion loans generally require equal monthly payments covering accrued interest and amortization of principal over a five to twenty-five year schedule, subject to a balloon payment of all outstanding principal at maturity. Historically, we have originated loans with one-to-five year maturities where interest rates are adjusted and a new maturity period set. In most cases, borrowers may prepay medallion loans upon payment of a fee of approximately 1% to 2%.
We generally retain the medallion loans we originate; however, from time to time, we participate or sell shares of some loans or portfolios to interested third party financial institutions. In these cases, we retain the borrower relationships and service the sold loans.
Commercial Loans. We have typically originated commercial loans in principal amounts generally ranging from under $100,000 to $9,300,000, and occasionally, have originated loans in excess of that amount. These loans are generally retained and typically have maturities ranging from three to ten years and require monthly payments ranging from full amortization over the loan term to fully deferred interest and principal at maturity, with multiple payment options in between. Substantially all loans may be prepaid with a fee ranging from 30 to 120 days’ interest. The term of, and interest rate charged on, certain of our outstanding loans are subject to SBA regulations. Under SBA regulations, the maximum rate of interest permitted on loans originated by us is 19%. Unlike medallion loans, for which competition precludes us from charging the maximum rate of interest permitted under SBA regulations, we are able to charge the maximum rate on certain commercial loans. We believe that the increased yield on commercial loans compensates for their higher risk relative to medallion loans and further illustrates the benefits of diversification.
Commercial loans are generally originated at an average loan-to-value ratio of 60% to 75%. Substantially all of the commercial loans are collateralized by security interests in the assets being financed by the borrower. In addition, we have recourse against the vast majority of the principals of borrowers who personally guarantee the loans. Although personal guarantees increase the commitment of borrowers to repay their loans, we cannot assure you that the assets available under personal guarantees would, if required, be sufficient to satisfy the obligations secured by such guarantees.
Consumer Loans. Consumer loans generally require equal monthly payments covering accrued interest and amortization of principal over a negotiated term, generally around ten years. Interest rates offered are fixed. Borrowers may prepay consumer loans without any prepayment penalty. In general, Medallion Bank has established relationships with dealers in the industry, who are the sources for most of the customers of Medallion Bank.
Marketing, Origination, and Loan Approval Process
We employ 36 loan originators to originate medallion, commercial, and consumer loans. Each loan application is individually reviewed through analysis of a number of factors, including loan-to-value ratios, a review of the borrower’s credit history, public records, personal interviews, trade references, personal inspection of the premises, and approval from the TLC, SBA, or other regulatory body, if applicable. Each medallion and commercial loan applicant is required to provide personal or corporate tax returns, premises leases, and/or property deeds. Senior management establishes loan origination criteria. Loans that conform to such criteria may be processed by a loan officer with the proper credit authority, and non-conforming loans must be approved by the chief executive officer and/or the chief credit officer. Both medallion and commercial loans are sourced from brokers with extensive networks of applicants, and commercial loans are also referred by contacts with banks, attorneys, and accounting firms. Consumer loans are primarily sourced through relationships which have been established with recreational vehicle and boat dealers, and home improvement contractors throughout our market area.
9
Table of Contents
Sources of Funds
We have historically funded our lending operations primarily through credit facilities with bank syndicates and, to a lesser degree, through equity or debt offerings or private placements, and fixed-rate, senior secured notes and long-term subordinated debentures issued to or guaranteed by the SBA. Since the inception of Medallion Bank, substantially all of Medallion Bank’s funding has been provided by FDIC insured brokered certificates of deposit. The determination of funding sources is established by our management, based upon an analysis of the respective financial and other costs and burdens associated with funding sources. Our funding strategy and interest rate risk management strategy is to have the proper structuring of debt to minimize both rate and maturity risk, while maximizing returns with the lowest cost of funding over an intermediate period of time.
The table below summarizes our sources of available funds and amounts outstanding under credit facilities and their respective end of period weighted average interest rates at December 31, 2015. See Note 4 to the consolidated financial statements for additional information about each credit facility.
| Consolidated sources of funds (Dollars in thousands) |
Total | |||
| Cash |
$ | 30,912 | ||
| Bank loans |
$ | 133,997 | ||
| Amounts undisbursed |
11,568 | |||
| Amounts outstanding |
122,429 | |||
| Average interest rate |
2.60 | % | ||
| Maturity |
2/16-12/20 | |||
| Preferred securities |
$ | 33,000 | ||
| Average interest rate |
2.58 | % | ||
| Maturity |
9/37 | |||
| Lines of credit |
$ | 135,000 | ||
| Amounts undisbursed |
5,482 | |||
| Amounts outstanding |
129,518 | |||
| Average interest rate |
2.05 | % | ||
| Maturity |
12/16 | |||
| Margin loans |
$ | 45,108 | ||
| Average interest rate |
1.48 | % | ||
| Maturity |
N/A | |||
| SBA debentures |
$ | 77,485 | ||
| Amounts undisbursed |
3,000 | |||
| Amounts outstanding |
74,485 | |||
| Average interest rate |
3.52 | % | ||
| Maturity |
3/19-3/26 | |||
|
|
|
|||
| Total cash and amounts remaining undisbursed under credit facilities |
$ | 50,962 | ||
|
|
|
|||
| Total debt outstanding |
$ | 404,540 | ||
|
|
|
|||
| Medallion Bank sources of funds |
||||
| Cash |
$ | 23,094 | ||
| Deposits and other borrowings |
908,896 | |||
| Average interest rate |
1.04 | % | ||
| Maturity |
1/16-12/20 | |||
|
|
|
|||
| Total cash and amounts remaining undisbursed under credit facilities, including Medallion Bank |
$ | 74,056 | ||
|
|
|
|||
| Total debt outstanding, including Medallion Bank |
$ | 1,313,436 | ||
|
|
|
|||
We fund our fixed-rate loans with variable-rate credit lines and bank debt, and with fixed-rate SBA debentures. The mismatch between maturities and interest-rate sensitivities of these balance sheet items results in interest rate risk. We seek to manage our exposure to increases in market rates of interest to an acceptable level by:
| • | Originating adjustable rate loans; |
| • | Incurring fixed-rate debt; and |
| • | Purchasing interest rate caps to hedge a portion of variable-rate debt against increases in interest rates. |
10
Table of Contents
Nevertheless, we accept varying degrees of interest rate risk depending on market conditions. For additional discussion of our funding sources and asset liability management strategy, see Asset/Liability Management on page 54.
Competition
Banks, credit unions, and finance companies, some of which are SBICs, compete with us in originating medallion, commercial, and consumer loans. In addition, finance subsidiaries of equipment manufacturers also compete with us in originating commercial loans. Many of these competitors have greater resources than we do and certain competitors are subject to less restrictive regulations than us. As a result, we cannot assure you that we will be able to identify and complete the financing transactions that will permit us to compete successfully.
Employees
As of December 31, 2015 we employed 143 persons, including 58 at our Medallion Bank subsidiary. We believe that relations with all of our employees are good.
MATERIAL US FEDERAL INCOME TAX CONSIDERATIONS
The following discussion is a general summary of the material US federal income tax considerations applicable to us and to an investment in shares of our common stock. This summary does not purport to be a complete description of the income tax considerations applicable to such an investment. For example, we have not described tax consequences that we assume to be generally known by investors or certain considerations that may be relevant to certain types of holders subject to special treatment under US federal income tax laws, including shareholders subject to the alternative minimum tax, tax-exempt organizations, insurance companies, dealers in securities, pension plans and trusts, and financial institutions. This summary assumes that investors hold our common stock as capital assets (within the meaning of the Code). The discussion is based upon the Code, Treasury regulations, and administrative and judicial interpretations, each as of the date of this annual report and all of which are subject to change, possibly retroactively, which could affect the continuing validity of this discussion. We have not sought and will not seek any ruling from the Internal Revenue Service, or the IRS, regarding an investment in our common stock. This summary does not discuss any aspects of the Medicare Contribution tax, US estate or gift tax, or foreign, state, or local tax. It does not discuss the special treatment under US federal income tax laws that could result if we invested in tax-exempt securities or certain other investment assets.
As used herein, a “US person” is a person that is for US federal income tax purposes:
| • | a citizen or individual resident of the United States; |
| • | a corporation, or other entity treated as a corporation for US federal income tax purposes, created or organized in or under the laws of the US or any state thereof or the District of Columbia; or |
| • | a trust or an estate, the income of which is subject to US federal income taxation regardless of its source. |
A “US shareholder” is a beneficial owner of shares of our common stock that is a US person.
A “non-US shareholder” is a beneficial owner of shares of our common stock that is not a US shareholder and is not a partnership for US federal income tax purposes.
11
Table of Contents
If a partnership (including an entity treated as a partnership for US federal income tax purposes) holds shares of our common stock, the tax treatment of a partner in the partnership will generally depend upon the status of the partner and the activities of the partnership. A prospective shareholder that is a partner of a partnership holding shares of our common stock should consult its tax advisors with respect to the purchase, ownership, and disposition of shares of our common stock.
Tax matters are very complicated and the tax consequences to an investor of an investment in our shares will depend on the facts of his, her, or its particular situation. We encourage investors to consult their own tax advisors regarding the specific consequences of such an investment, including tax reporting requirements, the applicability of federal, state, local, and foreign tax laws, eligibility for the benefits of any applicable tax treaty and the effect of any possible changes in the tax laws.
Election to Be Taxed as a RIC
As a business development company, we have elected to be treated as a RIC under Subchapter M of the Code. As a RIC, we generally will not have to pay corporate-level US federal income taxes on any ordinary income or capital gains that we distribute to our shareholders as dividends. To qualify as a RIC, we must, among other things, meet certain source-of-income and asset diversification requirements (as described below). In addition, to obtain RIC tax treatment we must distribute to our shareholders, for each taxable year, at least 90% of our “investment company taxable income,” which is generally our ordinary income plus the excess of realized net short-term capital gains over realized net long-term capital losses. We refer to this distribution requirement as the Annual Distribution Requirement.
Taxation as a RIC
If we:
| • | qualify as a RIC; and |
| • | satisfy the Annual Distribution Requirement; |
then we will not be subject to US federal income tax on the portion of our investment company taxable income and net capital gain (i.e., net long-term capital gains in excess of net short-term capital losses) we distribute to shareholders. We will be subject to US federal income tax at the regular corporate rates on any income or capital gain not distributed (or deemed distributed) to our shareholders.
We will be subject to a 4% nondeductible US federal excise tax on certain undistributed income of RICs unless we distribute in a timely manner an amount at least equal to the sum of (1) 98% of our ordinary income for each calendar year, (2) 98.2% of our capital gain net income for the one-year period ending October 31 in that calendar year, and (3) any income realized, but not distributed, in preceding years. We refer to this distribution requirement as the Excise Tax Avoidance Requirement. We currently intend to make sufficient distributions each taxable year to satisfy the Excise Tax Avoidance Requirement.
In order to qualify as a RIC for US federal income tax purposes, we must, among other things:
| • | qualify to be treated as a business development company under the 1940 Act at all times during each taxable year; |
| • | derive in each taxable year at least 90% of our gross income from dividends, interest, payments with respect to certain securities loans, gains from the sale of stock or other securities, or foreign currencies, or other income derived with respect to our business of investing in such stock or securities or currencies, and net income derived from interests in “qualified publicly traded partnerships” (i.e., partnerships that are traded on an established securities market or tradable on a secondary market, other than partnerships that derive 90% of their income from interest, dividends, capital gains, and other traditionally permitted mutual fund income described in this paragraph) or the 90% Income Test; and |
| • | diversify our holdings so that at the end of each quarter of the taxable year: |
| • | at least 50% of the value of our assets consists of cash, cash equivalents, US Government securities, securities of other RICs, and other securities if such other securities of any one issuer do not represent more than 5% of the value of our assets or more than 10% of the outstanding voting securities of the issuer; and |
| • | no more than 25% of the value of our assets is invested in the securities, other than US Government securities or securities of other RICs, of one issuer or of two or more issuers that are controlled, as determined under applicable tax rules, by us and that are engaged in the same or similar or related trades or businesses or in the securities of one or more qualified publicly traded partnerships. We refer to these two requirements as the Diversification Tests. |
12
Table of Contents
We may be required to recognize taxable income in circumstances in which we do not receive cash. For example, if we hold debt obligations that are treated under applicable tax rules as having original issue discount (such as debt instruments with payment-in-kind interest or, in certain cases, increasing interest rates or issued with warrants), we must include in income each year a portion of the original issue discount that accrues over the life of the obligation, regardless of whether cash representing such income is received by us in the same taxable year. Because any original issue discount accrued will be included in our investment company taxable income for the year of accrual, we may be required to make a distribution to our shareholders in order to satisfy the Annual Distribution Requirement, even though we will not have received any corresponding cash amount.
Gain or loss realized by us from warrants acquired by us as well as any loss attributable to the lapse of such warrants generally will be treated as capital gain or loss. Such gain or loss generally will be long-term or short-term, depending on how long we held a particular warrant.
We are authorized to borrow funds and to sell assets in order to satisfy distribution requirements. However, under the 1940 Act, we are not permitted to make distributions to our shareholders while our debt obligations and other senior securities are outstanding unless certain “asset coverage” tests are met. See “Regulation—Senior Securities.” Moreover, our ability to dispose of assets to meet our distribution requirements may be limited by (1) the illiquid nature of our portfolio and/or (2) other requirements relating to our status as a RIC, including the Diversification Tests. If we dispose of assets in order to meet the Annual Distribution Requirement or the Excise Tax Avoidance Requirement, we may make such dispositions at times that, from an investment standpoint, are not advantageous.
If we fail to satisfy the Annual Distribution Requirement or otherwise fail to qualify as a RIC in any taxable year, we will be subject to tax in that year on all of our taxable income, regardless of whether we make any distributions to our shareholders. In that case, all of our income will be subject to corporate-level US federal income tax, reducing the amount available to be distributed to our shareholders. In contrast, assuming we qualify as a RIC, our corporate-level federal US income tax should be substantially reduced or eliminated. See “Election to be Taxed as a RIC” above.
The remainder of this discussion assumes that we qualify as a RIC and have satisfied the Annual Distribution Requirement.
Taxation of US Shareholders
Distributions by us generally are taxable to US shareholders as ordinary income or capital gains. Distributions of our “investment company taxable income” (which is, generally, our ordinary income plus realized net short-term capital gains in excess of realized net long-term capital losses) will be taxable as ordinary income to US shareholders to the extent of our current or accumulated earnings and profits, whether paid in cash or reinvested in additional common stock. To the extent such distributions paid by us to non-corporate shareholders (including individuals) are attributable to dividends from US corporations and certain qualified foreign corporations, such distributions generally will be eligible for a maximum tax rate of 20%. In this regard, it is anticipated that distributions paid by us will generally not be attributable to dividends and, therefore, generally will not qualify for the 20% maximum rate. Distributions of our net capital gains (which is generally our realized net long-term capital gains in excess of realized net short-term capital losses) properly reported by us as “capital gain dividends” will be taxable to a US shareholder as long-term capital gains (currently at a maximum rate of 20% in the case of individuals, trusts, or estates), regardless of the US shareholder’s holding period for his, her, or its common stock, and regardless of whether paid in cash or reinvested in additional common stock. Distributions in excess of our earnings and profits first will reduce a US shareholder’s adjusted tax basis in such shareholder’s common stock and, after the adjusted basis is reduced to zero, will constitute capital gains to such US shareholder.
Although we currently intend to distribute any long-term capital gains at least annually, we may in the future decide to retain some or all of our long-term capital gains but designate the retained amount as a “deemed distribution.” In that case, among other consequences, we will pay tax on the retained amount, each US shareholder will be required to include his, her, or its share of the deemed distribution in income as if it had been actually distributed to the US shareholder, and the US shareholder will be entitled to claim a credit equal to his, her, or its allocable share of the tax paid thereon by us. The amount of the deemed distribution net of such tax will be added to the US shareholder’s tax basis for his, her, or its common stock. Since we expect to pay tax on any retained capital gains at our regular corporate tax rate, and since that rate is in excess of the maximum rate currently payable by individuals on long-term capital gains, the amount of tax that individual shareholders will be treated as having paid and for which they will receive a credit will exceed the tax they owe on the retained net capital gain. Such excess generally may be claimed as a credit against the US shareholder’s other US federal income tax obligations or may be refunded to the extent it exceeds a shareholder’s liability for US
13
Table of Contents
federal income tax. A shareholder that is not subject to federal income tax or otherwise required to file a US federal income tax return would be required to file a US federal income tax return on the appropriate form in order to claim a refund for the taxes we paid. In order to utilize the deemed distribution approach, we must provide written notice to our shareholders prior to the expiration of 60 days after the close of the relevant taxable year. We cannot treat any of our investment company taxable income as a “deemed distribution.”
For purposes of determining (1) whether the Annual Distribution Requirement is satisfied for any year and (2) the amount of capital gain dividends paid for that year, we may, under certain circumstances, elect to treat a dividend that is paid during the following taxable year as if it had been paid during the taxable year in question. If we make such an election, the US shareholder will still be treated as receiving the dividend in the taxable year in which the distribution is made. However, any dividend declared by us in October, November, or December of any calendar year, payable to shareholders of record on a specified date in such a month and actually paid during January of the following year, will be treated as if it had been received by our US shareholders on December 31 of the year in which the dividend was declared.
If an investor purchases shares of our common stock shortly before the record date of a distribution, the price of the shares will include the value of the distribution and the investor will be subject to tax on the distribution even though it represents a return of his, her, or its investment.
A shareholder generally will recognize taxable gain or loss if the shareholder sells or otherwise disposes of his, her, or its shares of our common stock. Any gain arising from such sale or disposition generally will be treated as capital gain or loss if the shareholder has held his, her or its shares for more than one year. Otherwise, it would be classified as short-term capital gain or loss. However, any capital loss arising from the sale or disposition of shares of our common stock held for six months or less will be treated as long-term capital loss to the extent of the amount of capital gain dividends received, or undistributed capital gain deemed received, with respect to such shares. In addition, all or a portion of any loss recognized upon a disposition of shares of our common stock may be disallowed if other shares of our common stock are purchased (whether through reinvestment of distributions or otherwise) within 30 days before or after the disposition.
In general, individual and other non-corporate US shareholders currently are subject to a maximum US federal income tax rate of 20% on their net capital gain, i.e., the excess of realized net long-term capital gain over realized net short-term capital loss for a taxable year, including a long-term capital gain derived from an investment in our shares. Such rate is lower than the maximum rate on ordinary income currently payable by individuals. Corporate US shareholders currently are subject to US federal income tax on net capital gain at the maximum 35% rate also applied to ordinary income. Non-corporate shareholders with net capital losses for a year (i.e., capital losses in excess of capital gains) generally may deduct up to $3,000 of such losses against their ordinary income each year; any net capital losses of a non-corporate shareholder in excess of $3,000 generally may be carried forward and used in subsequent years as provided in the Code. Corporate shareholders generally may not deduct any net capital losses against ordinary income for a year, but may carryback such losses for three years or carry forward such losses for five years.
We will send to each of our US shareholders, as promptly as possible after the end of each calendar year, a notice detailing, on a per share basis, the amounts includible in such US shareholder’s taxable income for such year as ordinary income and as long-term capital gain. In addition, the US federal tax status of each year’s distributions generally will be reported to the IRS (including the amount of dividends, if any, eligible for the 20% maximum rate applicable to qualifying dividends). Distributions may also be subject to additional state, local, and foreign taxes depending on a US shareholder’s particular situation. Dividends distributed by us generally will not be eligible for the dividends-received deduction or the 20% maximum rate applicable to qualifying dividends.
We may be required to withhold US federal income tax (“backup withholding”) currently at a rate of 28% from all taxable distributions to any non-corporate US shareholder (1) who fails to furnish us with a correct taxpayer identification number or a certificate that such shareholder is exempt from backup withholding, or (2) with respect to whom the IRS notifies us that such shareholder has failed to properly report certain interest and dividend income to the IRS and to respond to notices to that effect. An individual’s taxpayer identification number is his or her social security number. Any amount withheld under backup withholding is allowed as a credit against the US shareholder’s federal income tax liability and may entitle such shareholder to a refund, provided that proper information is timely provided to the IRS.
The exercise of a warrant to purchase common stock generally will not constitute a taxable event. Accordingly, a holder of a warrant that is a US person generally will not recognize gain or loss upon the exercise of a warrant. Rather, a holder of a warrant that is a US person will recognize taxable gain or loss if and when such holder disposes of the common stock received pursuant to the exercise of the warrant in a taxable transaction. The aggregate tax basis of a US person that is a holder of a warrant in the common stock received pursuant to the exercise of the warrant equals the amount paid upon the exercise of the warrant plus the holder’s basis in the warrant. The holding period of the common stock received pursuant to the exercise of the warrant would begin on the day that the warrant is exercised.
14
Table of Contents
Generally, for United States federal income tax purposes, a holder of a warrant that is a US person will recognize taxable gain or loss upon the sale or other disposition of the warrants in an amount equal to the difference between the amounts realized for the warrants and the holder’s tax basis in the warrants. Such gain or loss will generally be treated as capital gain or loss.
If a warrant is allowed to lapse unexercised, a holder of a warrant that is a US person will recognize a capital loss equal to such holder’s basis in the warrant. Such loss will be long-term if the warrant has been held for more than one year.
The exercise price of the warrants will be adjusted in certain circumstances. Under Section 305(c) of the Code, adjustments (or failures to make adjustments) that have the effect of increasing a holder’s proportionate interest in our assets or earnings may in some circumstances result in a deemed distribution to such holder. Adjustments to the exercise price made pursuant to a bona fide reasonable adjustment formula that has the effect of preventing the dilution of the interest of the holders of the warrants, however, will generally not be considered to result in a deemed distribution to holders. Certain of the possible exercise price adjustments provided in the warrants (including, without limitation, adjustments in respect of taxable dividends to holders of our common stock) may not qualify as being pursuant to a bona fide reasonable adjustment formula. If such adjustments are made, a warrant holder will be deemed to have received a distribution even though such holder has not received any cash or property as a result of such adjustments. Any deemed distributions will be taxable as a dividend, return of capital, or capital gain in accordance with the earnings and profits rules under the Code. US shareholders should consult their own tax advisors regarding the possible application of Section 305(c) of the Code.
Taxation of Non-US Shareholders
Whether an investment in our common stock is appropriate for a non-US shareholder will depend upon that person’s particular circumstances. An investment in our common stock by a non-US shareholder may have adverse tax consequences. Non-US shareholders should consult their tax advisers before investing in our common stock.
Dividends paid by us to non-US shareholders are generally subject to withholding at a 30% rate or a reduced rate specified by an applicable income tax treaty to the extent derived from net investment company income. In order to obtain a reduced rate of withholding, a non-US shareholder will be required to provide an IRS Form W-8BEN or IRS Form W-8BEN-E certifying its entitlement to benefits under a treaty. The withholding tax does not apply to regular dividends paid to a non-US shareholder who provides a Form W-8ECI, certifying that the dividends are effectively connected with the non-US shareholder’s conduct of a trade or business within the United States. Instead, the effectively connected dividends will be subject to regular US income tax as if the non-US shareholder were a US shareholder. A non-US corporation receiving effectively connected dividends may also be subject to additional “branch profits tax” imposed at a rate of 30% (or lower treaty rate). A non-US shareholder who fails to provide an IRS Form W-8BEN or IRS Form W-8BEN-E or other applicable form may be subject to backup withholding at the appropriate rate.
In general, US federal withholding tax will not apply to any gain or income realized by a non-US shareholder in respect of any distributions of net long-term capital gains over net short-term capital losses, exempt-interest dividends, or upon the sale or other disposition of shares of our common stock.
Properly reported dividends are generally exempt from US federal withholding tax where they (i) are paid in respect of our “qualified net interest income” (generally, our US source interest income, other than certain contingent interest and interest from obligations of a corporation or partnership in which we are at least a 10% shareholder, reduced by expenses that are allocable to such income) or (ii) are paid in respect of our “qualified short-term capital gains” (generally, the excess of our net short-term capital gain over our long-term capital loss for such taxable year). However, depending on certain circumstances, we may report all, some, or none of our potentially eligible dividends as such qualified net interest income or as qualified short-term capital gains and/or treat such dividends, in whole or in part, as ineligible for this exemption from withholding. In order to qualify for this exemption from withholding, a non-US shareholder would need to comply with applicable certification requirements relating to its non-US status (including, in general, furnishing an IRS Form W-8BEN or substitute Form). In the case of shares held through an intermediary, the intermediary could withhold even if we designate the payment as qualified net interest income or qualified short-term capital gain. Non-US shareholders should contact their intermediaries with respect to the application of these rules to their accounts.
A 30% withholding tax is currently imposed on dividends, and will be imposed on certain redemption proceeds paid after December 31, 2018, to foreign financial institutions including non-US investment funds and certain other non-financial foreign entities unless they comply with certain information reporting requirements. Non-US persons holding our common shares and warrants should consult with their tax advisors as to the effect of any such withholding tax on their investments.
15
Table of Contents
Non-US persons should consult their own tax advisors with respect to the US federal income tax and withholding tax, and state, local, and foreign tax consequences of an investment in the shares.
Failure to Qualify as a RIC
If we were unable to qualify for treatment as a RIC, we would be subject to tax on all of our taxable income at regular corporate rates. We would not be able to deduct distributions to shareholders, nor would they be required to be made. Distributions would generally be taxable to our shareholders as ordinary dividend income eligible for the 20% maximum rate to the extent of our current and accumulated earnings and profits for US federal tax purposes. Subject to certain limitations under the Code, corporate distributees would be eligible for the dividends received deduction. Distributions in excess of our current and accumulated earnings and profits would be treated first as a return of capital to the extent of the shareholder’s tax basis, and any remaining distributions would be treated as a capital gain.
GOVERNMENT REGULATION
Regulation by the SEC and under the 1940 Act
We are a closed-end, management investment company that has elected to be treated as a business development company (BDC) under the 1940 Act. We conduct our business through various wholly-owned investment company subsidiaries including Medallion Funding LLC, a closed end investment company, Medallion Capital, Inc., a BDC, and Freshstart Venture Capital Corp., a BDC. Pursuant to various exemptive orders, we operate and are regulated as a single BDC. The 1940 Act contains prohibitions and restrictions relating to transactions between BDCs and their affiliates (including any investment advisers or sub-advisers), principal underwriters and affiliates of those affiliates or underwriters, and requires that a majority of the directors be persons other than “interested persons,” as that term is defined in the 1940 Act. In addition, the 1940 Act provides that we may not change the nature of our business so as to cease to be, or to withdraw our election as, a BDC unless approved by a majority of our outstanding voting securities voting as a class.
We may invest up to 100% of our assets in securities acquired directly from issuers in privately negotiated transactions. With respect to such securities, we may, for the purpose of public resale, be deemed an “underwriter” as that term is defined in the Securities Act of 1933. Similarly, in connection with an acquisition, we may acquire rights to require the issuers of acquired securities or their affiliates to repurchase them under certain circumstances. We also do not intend to acquire securities issued by any investment company that exceed the limits imposed by the 1940 Act. Under these limits, we generally cannot acquire more than 3% of the voting stock of any registered investment company, invest more than 5% of the value of our total assets in the securities of one investment company or invest more than 10% of the value of our total assets in the securities of more than one investment company. Certain of these limits are not applicable to our investments in our wholly-owned SBIC subsidiaries. With regard to that portion of our portfolio invested in securities issued by investment companies, it should be noted that such investments might subject our stockholders to additional expenses. None of our policies are fundamental, and each may be changed without stockholder approval.
Qualifying Assets
Under the 1940 Act, a BDC may not acquire any asset other than assets of the type listed in Section 55(a) of the 1940 Act, which are referred to as qualifying assets, unless, at the time the acquisition is made, qualifying assets represent at least 70% of the company’s total assets. The principal categories of qualifying assets relevant to our business are the following:
| (1) | Securities purchased in transactions not involving any public offering from the issuer of such securities, which issuer (subject to certain limited exceptions) is an eligible portfolio company, or from any person who is, or has been during the preceding 13 months, an affiliated person of an eligible portfolio company, or from any other person, subject to such rules as may be prescribed by the SEC. An eligible portfolio company is generally defined in the 1940 Act as any issuer which: |
| (a) | is organized under the laws of, and has its principal place of business in, any state in the US; |
| (b) | is not an investment company (other than a small business investment company wholly owned by the BDC) or a company that would be an investment company but for certain exclusions under the 1940 Act; and |
| (c) | satisfies any of the following: |
| • | does not have any class of securities listed on a national securities exchange, or has a class of securities listed on a national securities exchange, but has an aggregate market value of outstanding voting and non-voting common equity of less than $250 million; |
16
Table of Contents
| • | is controlled by a BDC or a group of companies including a BDC, and the BDC in fact exercises a controlling influence on the management or policies of such eligible portfolio company and, as a result of such control, has an affiliated person who is a director of the eligible portfolio company; or |
| • | is a small and solvent company having total assets of not more than $4 million and capital and surplus of not less than $2 million. |
| (2) | Securities of any eligible portfolio company which we control. |
| (3) | Securities purchased in transactions not involving any public offering from a US issuer that is not an investment company or from an affiliated person of the issuer, or in transactions incident thereto, if the issuer is in bankruptcy and subject to reorganization or if the issuer, immediately prior to the purchase of its securities was unable to meet its obligations as they came due without material assistance other than conventional lending or financing arrangements. |
| (4) | Securities of an eligible portfolio company purchased from any person in a private transaction if there is no ready market for such securities and we already own at least 60% of the outstanding equity of the eligible portfolio company. |
| (5) | Securities received in exchange for or distributed on or with respect to securities described in (1) through (4) above, or pursuant to the exercise of warrants or rights relating to such securities. |
| (6) | Cash, cash equivalents, US Government securities or high-quality debt securities maturing in one year or less from the time of investment. |
| (7) | Subject to certain conditions, securities issued by a company that met the definition of eligible portfolio company at the time of our initial investment but subsequently does not meet the definition because the company no longer meets the definition set forth above. |
Managerial Assistance to Portfolio Companies
In addition, a BDC must have been organized and have its principal place of business in the US and must be operated for the purpose of making investments in the types of securities described in (1), (2), or (3) above. However, in order to count portfolio securities as qualifying assets for the purpose of the 70% test, the BDC must either control the issuer of the securities or must offer to make available to the issuer of the securities (other than small and solvent companies described above) significant managerial assistance; except that, where the BDC purchases such securities in conjunction with one or more other persons acting together, one of the other persons in the group may make available such managerial assistance. Making available managerial assistance means, among other things, any arrangement whereby the BDC, through its directors, officers, or employees, offers to provide, and, if accepted, does so provide, significant guidance and counsel concerning the management, operations, or business objectives and policies of a portfolio company.
Temporary Investments
Pending investment in other types of “qualifying assets,” as described above, our investments may consist of cash equivalents, US government securities, or high-quality debt securities maturing in one year or less from the time of investment, which we refer to, collectively, as temporary investments, so that 70% of our assets are qualifying assets. Typically, we will invest in US Treasury bills or in repurchase agreements, provided that such agreements are fully collateralized by cash or securities issued by the US government or its agencies. A repurchase agreement involves the purchase by an investor, such as us, of a specified security and the simultaneous agreement by the seller to repurchase it at an agreed-upon future date and at a price which is greater than the purchase price by an amount that reflects an agreed-upon interest rate. There is no percentage restriction on the proportion of our assets that may be invested in such repurchase agreements.
Senior Securities
We are permitted, under specified conditions, to issue multiple classes of indebtedness and one class of stock senior to our common stock if our asset coverage, as defined in the 1940 Act, is at least equal to 200% immediately after each such issuance. In addition, while any senior securities remain outstanding, we must make provisions to prohibit any distribution to our shareholders or the repurchase of such securities or shares unless we meet the applicable asset coverage ratios at the time of the distribution or repurchase. We may also borrow amounts up to 5% of the value of our total assets for temporary purposes without regard to full asset coverage requirements. In addition to the 1940 Act, we are subject to two exemptive orders which govern how we calculate our senior securities and under which we have agreed that we will meet the applicable asset coverage ratios both individually and on a consolidated basis. For a discussion of the risks associated with leverage, see “Risk Factors—Risks Relating to Our Business and Structure—Regulations governing our operation as a BDC will affect our ability to, and the way in which we raise additional capital.”
17
Table of Contents
Regulation by the SBA
Medallion Funding, Medallion Capital, and Freshstart each operate as SBICs. The SBIA authorizes the organization of SBICs as vehicles for providing equity capital, long term financing, and management assistance to small business concerns. The SBIA and the SBA regulations define a “small business concern” as a business that is independently owned and operated, which does not dominate its field of operation, and which (i) has a net worth, together with any affiliates, of $18.0 million or less and average annual net income after US federal income taxes for the preceding two years of $6.0 million or less (average annual net income is computed without the benefit of any carryover loss), or (ii) satisfies alternative criteria under SBA regulations that focus on the industry in which the business is engaged and the number of persons employed by the business or its gross revenues. In addition, at the end of each year, at least 25% of the total amount of loans made after April 25, 1994 must be made in “smaller businesses” which have a net worth of $6.0 million or less, and average net income after federal income taxes for the preceding two years of $2.0 million or less. SBA regulations also prohibit an SBIC from providing funds to a small business concern for certain purposes, such as relending and reinvestment.
Medallion Funding is authorized to make loans to borrowers other than disadvantaged businesses (that is, businesses that are at least 50% owned, and controlled, and managed, on a day to day basis, by a person or persons whose participation in the free enterprise system is hampered because of social or economic disadvantage) if, at the time of the loan, Medallion Funding has in its portfolio outstanding loans to disadvantaged businesses with an aggregate cost basis equal to or exceeding the value of the unamortized repurchase discount under the preferred stock repurchase agreement between Medallion Funding and the SBA, which is currently zero.
Under current SBA Regulations, the maximum rate of interest that Medallion Funding may charge may not exceed the higher of (i) 19% or (ii) the sum of (a) the higher of (i) that company’s weighted average cost of qualified borrowings, as determined under SBA Regulations, or (ii) the current SBA debenture rate, plus (b) 11%, rounded to the next lower eighth of one percent. As of December 31, 2015, the maximum rate of interest permitted on loans originated by Medallion Funding, Medallion Capital, and Freshstart was 19%. As of December 31, 2015, our outstanding medallion loans had a weighted average rate of interest 4.09% and our outstanding commercial loans had a weighted average rate of interest of 12.80%. Current SBA regulations also require that each loan originated by an SBIC has a term between one and 20 years; loans to disadvantaged businesses also may be for a minimum term of one year.
The SBA restricts the ability of SBICs to repurchase their capital stock, to retire their SBA debentures, and to lend money to their officers, directors, and employees, or invest in affiliates thereof. The SBA also prohibits, without prior SBA approval, a “change of control” or transfers which would result in any person (or group of persons acting in concert) owning 10% or more of any class of capital stock of an SBIC. A “change of control” is any event which would result in the transfer of the power, direct or indirect, to direct the management and policies of an SBIC, whether through ownership, contractual arrangements, or otherwise.
Under SBA Regulations, without prior SBA approval, loans by licensees with outstanding SBA leverage to any single small business concern may not exceed 30% of an SBIC’s regulatory capital, as defined. Under the terms of the respective conversion agreements with the SBA, however, Medallion Funding is authorized to make loans to disadvantaged borrowers in amounts not exceeding 30% of its respective regulatory capital.
SBICs must invest idle funds that are not being used to make loans in investments permitted under SBA regulations. These permitted investments include direct obligations of, or obligations guaranteed as to principal and interest by, the government of the US with a term of 15 months or less and deposits maturing in one year or less issued by an institution insured by the FDIC. These permitted investments must be maintained in (i) direct obligations of, or obligations guaranteed as to principal and interest by, the US, which mature within 15 months from the date of the investment; (ii) repurchase agreements with federally insured institutions with a maturity of seven days or less if the securities underlying the repurchase agreements are direct obligations of, or obligations guaranteed as to principal and interest by the US, and such securities must be maintained in a custodial account in a federally insured institution; (iii) certificates of deposit with a maturity of one year or less, issued by a federally insured institution; (iv) a deposit account in a federally insured institution, subject to withdrawal restriction of one year or less; (v) a checking account in a federally insured institution; or (vi) a reasonable petty cash fund.
SBICs may purchase voting securities of small business concerns in accordance with SBA regulations. Although prior regulations prohibited an SBIC from controlling a small business concern except in limited circumstances, regulations adopted by the SBA on October 22, 2002 (pursuant to Public Law 106-554) now allow an SBIC to exercise control over a small business for a period of seven years from the date on which the SBIC initially acquires its control position. This control period may be extended for an additional period of time with the SBA’s prior written approval.
18
Table of Contents
Regulation of Medallion Bank as an Industrial Bank
In May 2002, we formed Medallion Bank, which received approval from the FDIC for federal deposit insurance in October 2003. Medallion Bank, a Utah-chartered industrial bank, is a depository institution subject to regulatory oversight and examination for safety and soundness by both the FDIC and the Utah Department of Financial Institutions. Numerous other federal and state laws and regulations govern almost all aspects of Medallion Bank’s operations and, to some degree, our operations and those of our non-bank subsidiaries as institution-affiliated parties. Under its banking charter, Medallion Bank is empowered to make consumer and commercial loans, and may accept all FDIC-insured deposits other than demand deposits (checking accounts). Medallion Bank provides stable and low-cost bank deposit funding for our key lending business activities.
In addition, the FDIC has regulatory authority to prohibit Medallion Bank from engaging in any unsafe or unsound practice in conducting its business.
Medallion Bank is subject to risk-based and leverage capital standards issued by the federal banking regulators. These standards are designed to make regulatory capital requirements more sensitive to differences in risk profiles among banking organizations, to account for off-balance sheet exposure, to minimize disincentives for holding liquid assets, and to achieve greater consistency in evaluating the capital adequacy of major banks throughout the world. Under the risk-based capital standards, assets and off-balance sheet items are assigned to broad risk categories, each with designated weights, and the resulting capital ratios represent capital as a percentage of total risk-weighted assets and off-balance sheet items.
In July 2013, the Federal Reserve, the FDIC, and the Office of the Comptroller of the Currency adopted the U.S. Basel III capital rules, which implement many aspects of the Basel Committee on Banking Supervision’s Basel III capital framework and are aimed at increasing both the quantity and quality of regulatory capital. The requirements in the U.S. Basel III capital rules began to phase in on January 1, 2015, for many covered banking organizations, including Medallion Bank. Most requirements in the U.S. Basel III capital rules will be fully phased in by January 1, 2019. Because Medallion Bank was already subject to a capital maintenance agreement with the FDIC that required it to hold capital in excess of the then applicable capital requirements, we do not believe that the U.S. Basel III capital rules will have a material impact on Medallion Bank’s business.
Under the U.S. Basel III capital rules, Medallion Bank is subject to the following minimum capital ratios:
| • | a new Common Equity Tier 1 risk-based capital ratio of 4.5%; |
| • | a Tier 1 risk-based capital ratio of 6%; |
| • | a Total risk-based capital ratio of 8%; and |
| • | a Tier 1 leverage ratio of 4%. |
In addition, Medallion Bank is subject to a Common Equity Tier 1 capital conservation buffer on top of the minimum risk-based capital ratios, which is being phased in over three years beginning January 1, 2016. Including the buffer, by January 1, 2019, Medallion Bank will be required to maintain the following minimum capital ratios: a Common Equity Tier 1 risk-based capital ratio of greater than 7.0%, a Tier 1 risk-based capital ratio of greater than 8.5% and a total risk-based capital ratio of greater than 10.5%. The new and highest form of capital, Common Equity Tier 1 capital, consists solely of common stock (plus related surplus), retained earnings, accumulated other comprehensive income, and limited amounts of qualifying minority interests that are in the form of common stock.
The U.S. Basel III capital rules retain or modify certain deductions from and adjustments to regulatory capital and also provide for new ones. In addition, the U.S. Basel III capital rules provide for limited recognition in Common Equity Tier 1 capital, and deduction from Common Equity Tier 1 capital above certain thresholds, of three categories of assets: (i) deferred tax assets arising from temporary differences that cannot be realized through net operating loss carrybacks (net of related valuation allowances and of deferred tax liabilities), (ii) mortgage servicing assets (net of associated deferred tax liabilities) and (iii) investments in more than 10% of the issued and outstanding common stock of unconsolidated financial institutions (net of associated deferred tax liabilities).
For purposes of calculating the denominator of the three risk-based capital ratios, the assets of covered banking organizations are given risk weights that, under the U.S. Basel III capital rules, range from 0% to 1,250%, depending on the nature of the asset. Direct obligations of the U.S. Treasury or obligations unconditionally guaranteed by the U.S. government have a 0% risk weight, while general obligation claims on states or other political subdivisions of the United States are assigned a 20% risk weight, except for municipal or state revenue bonds, which have a 50% risk weight. Most first-lien residential mortgage exposures that are prudently underwritten and performing according to their original terms carry a 50% risk weight, with a 100% risk weight for other residential mortgage exposures. In addition, certain off-balance sheet items are assigned credit conversion factors to convert them to asset equivalent amounts to which an appropriate risk weight is applied. For example, the unused portion of unconditionally cancellable commitments is assigned a 0% conversion factor, while self-liquidating, transaction-related contingent items with an original maturity of one year or less and the amount of a commitment with an initial maturity of one year or less that is not unconditionally cancellable by the covered banking organization are converted at 20%. Transaction-related contingencies such as bid bonds and standby letters of credit backing nonfinancial obligations, as well as the amount of a commitment with an original maturity of more than one year that is not unconditionally cancellable, have a 50% conversion factor. General guarantees and standby letters of credit backing financial obligations are given a 100% conversion factor.
In addition, pursuant to provisions of the FDIC Improvement Act of 1991, or FDICIA, and related regulations with respect to prompt corrective action, FDIC-insured institutions such as Medallion Bank may only accept brokered deposits without FDIC permission if they meet specified capital standards, and are subject to restrictions with respect to the interest they may pay on deposits unless they are well capitalized. The U.S. Basel III capital rules revised the capital threshold to be well capitalized. Effective January 1, 2015, in order to qualify as well capitalized, an insured depository institution must maintain a Common Equity Tier 1 risk-based capital ratio of at least 6.5% , a Tier 1 risk-based capital ratio of at least 8.0%, a total risk-based capital ratio of at least 10.0%, and a Tier 1 leverage ratio of at least 5.0%, and the bank must not be under any order or directive from the appropriate regulatory agency to meet and maintain a specific capital level.
Pursuant to a capital maintenance agreement with the FDIC, we and Medallion Bank have agreed that the capital levels of Medallion Bank will at all times meet or exceed the levels required for Medallion Bank to be considered well-capitalized under the FDIC rules and regulations, that Medallion Bank’s Tier 1 capital to total assets leverage ratio will be maintained at not less than 15%, and that Medallion Bank will maintain an adequate allowance for loan and lease losses.
Medallion Bank is also subject to certain federal laws that restrict and control its ability to extend credit and provide or receive services between affiliates. Sections 23A and 23B of the Federal Reserve Act and Regulation W promulgated thereunder limit the transfer of funds by a depository institution to certain of its affiliates, including us, in the form of loans, extensions of credit, investments, or purchases of assets. Sections 23A and 23B and Regulation W also require generally that the depository institution’s transactions with its affiliates be on terms no less favorable to Medallion Bank than comparable transactions with unrelated third parties.
The USA Patriot Act and the International Money Laundering Abatement and Anti-Terrorist Financing Act of 2001, or the Patriot Act, was enacted on October 26, 2001, and is intended to detect and prosecute terrorism and international money laundering. The Patriot Act establishes new standards for verifying customer identification incidental to the opening of new accounts. Medallion
19
Table of Contents
Bank has undertaken appropriate measures to comply with the Patriot Act and associated regulations. Other provisions of the Patriot Act provide for special information sharing procedures governing communications with the government and other financial institutions with respect to suspected terrorists and money laundering activity, and enhancements to suspicious activity reporting, including electronic filing of suspicious activity reports over a secure filing network. The compliance programs required by the Patriot Act are intended to supplement pre-existing compliance requirements that apply to financial institutions under the Bank Secrecy Act and the Office of Foreign Assets Control, or OFAC, regulations to which Medallion Bank is also subject. The Bank Secrecy Act requires all financial institutions, including banks, to, among other things, establish a risk-based system of internal controls reasonably designed to prevent money laundering and the financing of terrorism. The Bank Secrecy Act includes a variety of record-keeping and reporting requirements (such as cash and suspicious activity reporting), as well as due diligence/know-your-customer documentation requirements. Medallion Bank has in place policies, procedures and internal controls in order to comply with Bank Secrecy Act and OFAC laws and regulations. Bank regulators routinely examine institutions for compliance with these obligations and are required to consider compliance in connection with the regulatory review of applications.
Federal and state banking agencies require Medallion Bank to prepare annual reports on financial condition and to conduct an annual audit of financial affairs in compliance with minimum standards and procedures. Medallion Bank must undergo regular on-site examinations by the appropriate banking agency, which will examine for adherence to a range of legal and regulatory compliance responsibilities. A bank regulator conducting an examination has complete access to the books and records of the examined institution. The results of the examination are confidential. The cost of examinations may be assessed against the examined institution as the agency deems necessary or appropriate.
Other
Because Medallion Bank is an “insured depository institution” within the meaning of the Federal Deposit Insurance Act and the Change in Bank Control Act and we are a “financial institution holding company” within the meaning of the Utah Financial Institutions Act, federal and Utah law and regulations prohibit any person or company from acquiring control of us and, indirectly, Medallion Bank, without, in most cases, prior written approval of the FDIC or the Commissioner of Utah Department of Financial Institutions, as applicable. Under the Change in Bank Control Act, control is conclusively presumed if, among other things, a person or company acquires 25% or more of any class of our voting stock. A rebuttable presumption of control arises if a person or company acquires 10% or more of any class of voting stock and is subject to a number of specified “control factors” as set forth in the applicable regulations. Under the Utah Financial Institutions Act, control is defined as the power to vote 20% or more of any class of our voting securities by an individual or to vote more than 10% of any class of our voting securities by a person other than an individual. Investors are responsible for ensuring that they do not, directly or indirectly, acquire shares of our common stock in excess of the amount which can be acquired without regulatory approval. Although Medallion Bank is an “insured depository institution” within the meaning of the Federal Deposit Insurance Act and the Change in Bank Control Act, your investment in Medallion Financial Corp. is not guaranteed by the FDIC and is subject to loss.
We may also be prohibited under the 1940 Act from knowingly participating in certain transactions with our affiliates without the prior approval of our Board of Directors who are not interested persons and, in some cases, prior approval by the SEC.
We are periodically examined by the SEC for compliance with the 1940 Act. We are examined by the SBA annually for compliance with applicable SBA regulations. We are also periodically examined by the FDIC and the Utah Department of Financial Institutions (DFI). Medallion Bank is examined annually by the FDIC and the Utah Department of Financial Institutions.
We are required to provide and maintain a bond issued by a reputable fidelity insurance company to protect us against larceny and embezzlement. Furthermore, as a BDC, we are prohibited from protecting any director or officer against any liability to us or our shareholders arising from willful misfeasance, bad faith, gross negligence, or reckless disregard of the duties involved in the conduct of such person’s office.
We have adopted and implemented written policies and procedures reasonably designed to prevent violation of the federal securities laws, and intend to review these policies and procedures annually for their adequacy and the effectiveness of their implementation. We have designated a chief compliance officer to be responsible for administering our policies and procedures.
In addition to the regulations detailed above, our operations are subject to supervision and regulation by other federal, state, and local laws and regulations. Additionally, our operations may be subject to various laws and judicial and administrative decisions. This oversight may serve to:
| • | regulate credit granting activities, including establishing licensing requirements, if any, in various jurisdictions; |
| • | establish maximum interest rates, finance charges and other charges; |
20
Table of Contents
| • | require disclosures to customers; |
| • | govern secured transactions; |
| • | set collection, foreclosure, repossession and claims handling procedures and other trade practices; |
| • | prohibit discrimination in the extension of credit and administration of loans; and |
| • | regulate the use and reporting of information related to a borrower’s credit experience and other data collection. |
Changes to laws of states in which we do business could affect the operating environment in substantial and unpredictable ways. We cannot accurately predict whether such changes will occur or, if they occur, the ultimate effect they would have upon our financial condition or results of operations.
Compliance with the Sarbanes-Oxley Act of 2002 and NASDAQ Corporate Governance Regulations
The Sarbanes-Oxley Act of 2002, or the Sarbanes-Oxley Act, imposes a wide variety of regulatory requirements on publicly-held companies and their insiders. Many of these requirements affect us. The Sarbanes-Oxley Act has required us to review our policies and procedures to determine whether we comply with the Sarbanes-Oxley Act and the regulations promulgated thereunder. We will continue to monitor our compliance with all future regulations that are adopted under the Sarbanes-Oxley Act and will take actions necessary to ensure that we are in compliance therewith.
In addition, NASDAQ has adopted or is in the process of adopting corporate governance changes to its listing standards. We believe we are in compliance with such corporate governance listing standards. We will continue to monitor our compliance with all future listing standards and will take actions necessary to ensure that we are in compliance therewith.
AVAILABLE INFORMATION
Our corporate website is located at www.medallion.com. We make copies of our Annual Reports on Form 10-K, Quarterly Reports on Form 10-Q, Current Reports on Form 8-K, and any amendment to those reports filed with or furnished to the SEC available to investors on or through our website free of charge as soon as reasonably practicable after we electronically file them with or furnish them to the SEC. Our SEC filings can be found in the For Investors section of our website, the address of which is
http://www.medallion.com/investors.htm. Our Code of Ethical Conduct and Insider Trading Policy can be located in the Corporate Governance section of our website at http://www.medallion.com/investors_governance.htm. These documents, as well as our SEC filings are available in print to any stockholder who requests a copy from our Secretary.
| ITEM 1A. | RISK FACTORS |
Risks Relating to Our Business and Structure
Changes in the taxicab and for-hire vehicle industries have resulted in increased competition and could have a material adverse effect on our business, financial condition and operations.
There have been recent changes in the taxicab and for-hire vehicle industries that have resulted in increased competition in all of our taxi medallion markets. Ridesharing applications, or ridesharing apps, utilized by for-hire vehicles were introduced in New York City in 2011 and continue to expand domestically and globally. Many of these for-hire vehicle operators operate outside of the regulatory regime with which we and our borrowers operate, which poses an increased risk of competition because such operators are able to pass the cost savings of not having to comply with certain regulations to its passengers. According to the Taxi and Limousine Commission, or TLC, between January 2015 and January 2016, approximately 13,000 new for-hire vehicle licenses were issued, increasing the total number of for-hire vehicles to approximately 72,000 as of January 31, 2016, a 22% increase from January 2015.
In addition, the New York State legislature enacted a law on December 21, 2011, which was amended on February 17, 2012, to permit cars for-hire to pickup street hails in boroughs outside of Manhattan. Pursuant to this law the TLC has issued approximately 8,100 Street Hail Livery licenses since June 2013, of which approximately 6,100 are active.
TLC six month data through June 2015 has shown a 5.2% reduction in the average daily New York City taxicab fare totals, including tips, compared to the same period in 2014, and an 8.5% reduction in the average daily number of New York City taxicab trips. Such reductions in fare totals and taxicab trips are likely the result of a combination of ridesharing apps, Street Hail Livery licenses, and other forms of public transportation.
21
Table of Contents
As of December 31, 2015, 4.1% of our managed medallion loan portfolio and 3.0% of our on-balance sheet was 90 days or more past due, compared to 0% at December 31, 2014. As discussed in further detail below, there have also been recent decreases in the values of our medallion loan collateral and our Chicago medallions purchased out of foreclosure. Increased competition from ridesharing apps and Street Hail Livery licenses has reduced our market share, the overall market for taxicab services, the supply of taxicab drivers, income from operating medallions and the value of taxicab medallions. If these trends continue and intensify, there would be a material increase to our loan to value ratios, loan delinquencies, and loan defaults resulting in a material adverse effect on our business, financial condition, and results of operations.
Decreases in the value of our medallion loan collateral and our Chicago medallions purchased out of foreclosure would have a material adverse effect on our business.
A significant portion of our loan revenue is derived from loans collateralized by New York City taxicab medallions. According to TLC data, over the past 20 years New York City taxicab medallions have appreciated in value from under $200,000 to $1,320,000 for corporate medallions and $1,050,000 for individual medallions in 2014. Over approximately the last year, however, taxicab medallions have declined in value. Since the September 30, 2014 peak valuation, the value of New York City taxicab medallions decreased by approximately 32% for individual medallions and 40% for corporate medallions.
We own 159 Chicago taxicab medallions that were purchased out of foreclosure. Additionally, a portion of our loan revenue is derived from loans collateralized by Chicago taxicab medallions. Since we acquired the Chicago medallions in 2003, they had appreciated in value from $50,000 to approximately $370,000 in 2013. Over approximately the past year and a half, however, there has been a decline in the value of Chicago taxicab medallions. Since December 31, 2013, the value of Chicago taxicab medallions decreased 35%.
Decreases in the value of our medallion loan collateral has resulted in an increase in the loan-to-value ratios of our medallion loans. We estimate that the weighted average loan-to-value ratio of all of our medallion loans was approximately 76% as of December 31, 2015 and 60% as of December 31, 2014. If taxicab medallion values continue to decline, there would be an increase in medallion loan delinquencies, foreclosures and borrower bankruptcies. Our ability to recover on defaulted medallion loans by foreclosing on and selling the medallion collateral would be diminished, which would result in material losses on defaulted medallion loans which would have a material adverse effect on our business. A substantial decrease in the value of our Chicago medallions purchased out of foreclosure would adversely affect our ability to dispose of such medallions at times when it may be advantageous for us to do so. If we are required to liquidate all or a portion of our medallions quickly, we would realize less than the value at which we had previously recorded such medallions.
We borrow money, which magnifies the potential for gain or loss on amounts invested, and may increase the risk of investing in us.
Borrowings, also known as leverage, magnify the potential for gain or loss on amounts invested, and therefore increase the risk associated with investing in us. We borrow from and issue senior debt securities to banks and other lenders, and through long-term subordinated SBA debentures. These creditors have fixed dollar claims on our assets that are superior to the claims of our shareholders. If the value of our assets increases, then leveraging would cause the net asset value to increase more sharply than it would have had we not leveraged. Conversely, if the value of our assets decreases, leveraging would cause net asset value to decline more sharply than it otherwise would have had we not leveraged. Similarly, any increase in our income in excess of interest payable on the borrowed funds would cause our net income to increase more than it would without the leverage, while any decrease in our income would cause net income to decline more sharply than it would have had we not borrowed. Such a decline could reduce the amount available for distribution payments.
As of December 31, 2015, we had $404,540,000 of outstanding indebtedness, which had a weighted average borrowing cost of 2.47% at December 31, 2015, and our wholly-owned unconsolidated portfolio companies, primarily Medallion Bank, had $908,896,000 of outstanding indebtedness at a weighted average borrowing cost of 1.04%.
Consumer lending by Medallion Bank carries a higher risk of loss and could be adversely affected by an economic downturn.
By its nature, lending to consumers carries with it a higher risk of loss than commercial lending. Although the net interest margins should be higher to compensate Medallion Bank for this increased risk, an economic downturn could result in higher loss rates and lower returns than expected, and could affect the profitability of Medallion Bank’s consumer loan portfolio.
22
Table of Contents
We are dependent upon our key investment personnel for our future success.
We depend on the diligence, skill, and network of business contacts of the investment professionals we employ for sourcing, evaluating, negotiating, structuring, and monitoring our investments. Our future success will also depend, to a significant extent, on the continued service and coordination of our senior management team, particularly, Alvin Murstein, our Chairman and Chief Executive Officer, Andrew M. Murstein, our President, and Larry D. Hall, our Chief Financial Officer. The departure of Messrs. Murstein or Mr. Hall, or any member of our senior management team, could have a material adverse effect on our ability to achieve our investment objective.
Changes in taxicab industry regulations that result in the issuance of additional medallions or increases in the expenses involved in operating a medallion would lead to a decrease in the value of our medallion loan collateral and our Chicago medallions purchased out of foreclosure.
Every city in which we originate medallion loans, and most other major cities in the United States, limits the supply of taxicab medallions. This regulation results in supply restrictions that support the value of medallions. Actions that loosen these restrictions and result in the issuance of additional medallions into a market could decrease the value of medallions in that market. If this were to occur, the value of the collateral securing our then outstanding medallion loans in that market would be adversely affected. We are unable to forecast with any degree of certainty whether any other potential increases in the supply of medallions will occur.
In New York City, Chicago, Boston, and other markets where we originate medallion loans, taxicab fares are generally set by government agencies. Expenses associated with operating taxicabs are largely unregulated. As a result, the ability of taxicab operators to recoup increases in expenses is limited in the short term. Escalating expenses, such as rising gas prices and increase in interest rates, can render taxicab operations less profitable, could cause borrowers to default on loans from us and would adversely affect the value of our collateral.
We operate in a highly regulated environment, and if we are found to be in violation of any of the federal, state, or local laws or regulations applicable to us, our business could suffer.
The 1940 Act imposes numerous constraints on the operations of BDC’s. For example, BDC’s are required to invest at least 70% of their total assets in qualifying assets, primarily securities of “eligible portfolio companies” (as defined under the 1940 Act), cash, cash equivalents, US government securities, and other high quality debt investments that mature in one year or less. Our regulatory requirements may hinder our ability to take advantage of attractive investment opportunities and, as a result, achieve our investment objective. In addition, we rely upon several exemptive orders from the SEC permitting us to consolidate our financial reporting and operate our business as presently conducted. Our failure to satisfy the conditions set forth in those exemptive orders could result in our inability to rely upon such orders or to cause the SEC to revoke the orders which could result in material changes in our financial reporting or the way in which we conduct our business. Furthermore, any failure to comply with the requirements imposed on BDC’s by the 1940 Act could have material adverse consequences to us or our investors, including possible enforcement action by the SEC and the possible loss of our ability to qualify as a RIC that is exempt from corporate-level income tax under the Code. If we do not remain a BDC, we might be regulated as a closed-end investment company under the 1940 Act, which would further significantly decrease our operating flexibility.
The Dodd-Frank Wall Street Reform and Consumer Protection Act, or the Dodd-Frank Act, was enacted in 2010. The Dodd-Frank Act significantly changed federal financial services regulation and affects, among other things, the lending, deposit, investment, trading, and operating activities of financial institutions and their holding companies. In addition to the statutory requirements under the Dodd-Frank Act, the legislation also delegated authority to US banking, securities and derivatives regulators to impose additional restrictions through required rulemaking. The Dodd-Frank Act requires a company that owns an industrial bank to serve as a “source of strength” to the institution. We believe that we have historically served, and will serve in the future, as a source of strength to our industrial bank subsidiary, Medallion Bank. We do not believe that the codification of this requirement under the Dodd-Frank Act materially impacts our obligations. A company that owns an industrial bank is also subject to the Dodd-Frank Act “Volcker Rule.” We do not believe that the “Volcker Rule” materially impacts our operations as presently conducted.
Other changes in the laws or regulations applicable to us more generally, may negatively impact the profitability of our business activities, require us to change certain of our business practices, materially affect our business model, limit the activities in which we may engage, affect retention of key personnel, require us to raise additional regulatory capital, increase the amount of liquid assets that we hold, otherwise affect our funding profile or expose us to additional costs (including increased compliance costs). Any such changes may also require us to invest significant management attention and resources to make any necessary changes and may adversely affect our ability to conduct our business as previously conducted or our results of operations or financial condition.
23
Table of Contents
We are also subject to a wide range of federal, state, and local laws and regulations, such as local licensing requirements, and retail financing, debt collection, consumer protection, environmental, health and safety, creditor, wage-hour, anti-discrimination, whistleblower and other employment practices laws and regulations and we expect these costs to increase going forward. The violation of these or future requirements or laws and regulations could result in administrative, civil, or criminal sanctions against us, which may include fines, a cease and desist order against the subject operations or even revocation or suspension of our license to operate the subject business. As a result, we have incurred and will continue to incur capital and operating expenditures and other costs to comply with these requirements and laws and regulations.
Changes in laws, regulations, or policies may adversely affect our business.
The post-financial crisis era has been marked by an increase in regulation, regulatory intensity, and enforcement. We are unable to predict all of the ways in which this change in the regulatory environment could impact our business models or objectives. The laws and regulations governing our lending, servicing, and debt collection activities or the regulatory or enforcement environment at the federal level or in any of the states in which we operate may change at any time which may have an adverse effect on our business.
We expect, however, to see an increase over time in regulatory scrutiny and enforcement in the area of consumer financial products regulation, as a result of the establishment of the Consumer Financial Protection Bureau, or the CFPB, by the Dodd-Frank Act. The CFPB is responsible for interpreting and enforcing a broad range of consumer protection laws that govern the provision of deposit accounts and the making of loans, including the regulation of mortgage lending and servicing and automobile finance. While Medallion Bank’s size currently falls below the threshold that would give the CFPB direct authority over it, Medallion Bank’s existing bank supervisors may pursue similar policies and make similar information requests to those of the CFPB with respect to consumer financial products and other matters within the scope of the CFPB’s authority. We believe that the CFPB’s regulatory reforms, together with other provisions of the Dodd-Frank Act, and increased regulatory supervision, may increase our cost of doing business, impose new restrictions on the way in which we conduct our business, or add significant operational constraints that might impair our profitability.
We are unable to predict how these or any other future legislative proposals or programs will be administered or implemented or in what form, or whether any additional or similar changes to statutes or regulations, including the interpretation or implementation thereof, will occur in the future. Any such action could affect us in substantial and unpredictable ways and could have an adverse effect on our results of operations and financial condition.
Our inability to remain in compliance with regulatory requirements in a particular jurisdiction could have a material adverse effect on our operations in that market and on our reputation generally. No assurance can be given that applicable laws or regulations will not be amended or construed differently or that new laws and regulations will not be adopted, either of which could materially adversely affect our business, financial condition, or results of operations.
Federal and state law may discourage certain acquisitions of our common stock which could have a material adverse effect on our shareholders.
Because Medallion Bank is an “insured depository institution” within the meaning of the Federal Deposit Insurance Act and the Change in Bank Control Act and we are a “financial institution holding company” within the meaning of the Utah Financial Institutions Act, federal and Utah law and regulations prohibit any person or company from acquiring control of us and, indirectly Medallion Bank, without, in most cases, prior written approval of the FDIC or the Commissioner of the Utah Department of Financial Institutions, as applicable. Under the Change in Bank Control Act, control is conclusively presumed if, among other things, a person or company acquires 25% or more of any class of our voting stock. A rebuttable presumption of control arises if a person or company acquires 10% or more of any class of voting stock and is subject to a number of specified “control factors” as set forth in the applicable regulations. Under the Utah Financial Institutions Act, control is defined as the power to vote 20% or more of any class of our voting securities by an individual or to vote more than 10% of any class of our voting securities by a person other than an individual. Investors are responsible for ensuring that they do not, directly or indirectly, acquire shares of our common stock in excess of the amount which can be acquired without regulatory approval. These provisions could delay or prevent a third party from acquiring us, despite the possible benefit to our shareholders, or otherwise adversely affect the market price of our common stock. Although Medallion Bank is an “insured depository institution” within the meaning of the Federal Deposit Insurance Act and the Change in Bank Control Act, your investment in Medallion Financial Corp. is not guaranteed by the FDIC and is subject to loss.
24
Table of Contents
Regulations governing our operation as a BDC may affect our ability to, and the way in which, we raise additional capital.
Our business may periodically require capital. We may acquire additional capital from the following sources:
Senior Securities and Other Indebtedness. We may issue debt securities or preferred stock, and/or borrow money from banks or other financial institutions, which we refer to collectively as senior securities, up to the maximum amount permitted by the 1940 Act. If we issue senior securities, including debt or preferred stock, we will be exposed to additional risks, including the following:
| • | Under the provisions of the 1940 Act, we are permitted, as a BDC, to issue senior securities only in amounts such that our asset coverage, as defined in the 1940 Act, equals at least 200% after each issuance of senior securities. If the value of our assets declines, we may be unable to satisfy this test. If that happens, we may be restricted from issuing additional debt, may be limited in making distributions on our stock, and may be required to sell a portion of our investments and, depending on the nature of our leverage, to repay a portion of our debt at a time when such sales and/or repayments may be disadvantageous. In addition to the 1940 Act, we are subject to two exemptive orders which govern how we calculate our senior securities and under which we have agreed that we will meet the applicable asset coverage ratios both individually and on a consolidated basis. |
| • | Any amounts that we use to service our debt or make payments on preferred stock will not be available for distributions to our common shareholders. |
| • | It is likely that any senior securities or other indebtedness we issue will be governed by an indenture or other instrument containing covenants restricting our operating flexibility. Additionally, some of these securities or other indebtedness may be rated by rating agencies, and in obtaining a rating for such securities and other indebtedness, we may be required to abide by operating and investment guidelines that further restrict operating and financial flexibility. |
| • | We and, indirectly, our shareholders will bear the cost of issuing and servicing such securities and other indebtedness. |
| • | Preferred stock or any convertible or exchangeable securities that we issue in the future may have rights, preferences, and privileges more favorable than those of our common stock, including separate voting rights, and could delay or prevent a transaction or a change in control to the detriment of the holders of our common stock. |
Additional Common Stock. We are not generally able to issue and sell our common stock at a price below net asset value (less any distributing commission or discount) per share. We may, however, sell our common stock, warrants, options, or rights to acquire our common stock, at a price below the current net asset value of the common stock if our Board of Directors determines that such sale is in our best interests and that of our shareholders, and our shareholders approve such sale. In any such case, the price at which our securities are to be issued and sold may not be less than a price which, in the determination of our Board of Directors, closely approximates the market value of such securities (less any distributing commission or discount). We may also make rights offerings to our shareholders at prices per share less than the net asset value per share, subject to applicable requirements of the 1940 Act. If we raise additional funds by issuing more common stock or senior securities convertible into, or exchangeable for, our common stock, the percentage ownership of our shareholders at that time would decrease and they may experience dilution. Moreover, we can offer no assurance that we will be able to issue and sell additional equity securities in the future, on favorable terms or at all.
If our investments in assets that are not “qualifying assets” are determined to exceed 30% of our total assets, we could be deemed to be in violation of the 1940 Act or could be precluded from investing in what we believe are attractive investments, which could have a material adverse effect on our business.
As a business development company, we are not permitted to acquire any assets other than “qualifying assets” unless, at the time of such acquisition, at least 70% of our total assets are qualifying assets. Our investment in Medallion Bank and City of Chicago taxicab medallions purchased out of foreclosure, which are carried in investments other than securities on the consolidated balance sheet, are non-qualifying assets. As of December 31, 2015, the percentage of our total assets that were invested in non-qualifying assets were up to 28.6% on an unconsolidated basis and up to 29.1% on a consolidated basis.
At the end of each fiscal quarter, we may take proactive steps to prospectively preserve investment flexibility in the next quarter which is assessed against our total assets at our most recent quarter end. We can accomplish this in many ways including purchasing US Treasury bills or other investment-grade debt securities, and closing out our position on a net cash basis subsequent to quarter end. However, if such proactive measures are ineffective or our primary investments are deemed not to be qualifying assets, or if the fair value of our non-qualifying assets increases or is determined to be higher than previously determined, or if the fair value of our qualifying assets decreases or is determined to be lower than previously determined, we could be deemed in violation of the 1940 Act, or could be precluded from investing in what we believe are attractive investments or from making follow-on investments in existing portfolio companies that are non-qualifying assets, or could be required to dispose of non-qualifying assets at times or on terms that may be disadvantageous to us. Medallion Bank may also not be able to grow as quickly if we are precluded from providing additional funding to Medallion Bank. Any of the foregoing consequences could have a material adverse effect on us. In addition, if we are found to be in violation of the requirements applicable to business development companies under the 1940 Act, we could be unable to qualify as a RIC under the Code.
25
Table of Contents
We will be subject to corporate-level income tax if we are unable to qualify as a RIC under Subchapter M of the Code.
To obtain and maintain RIC tax treatment under the Code, we must meet the following annual distribution, income source, and asset diversification requirements.
| • | The annual distribution requirement for a RIC will be satisfied if we distribute to our shareholders on an annual basis at least 90% of our net ordinary income and realized net short-term capital gains in excess of realized net long-term capital losses, if any, and at least 90% of our net tax-exempt income. Because we use debt financing, we are subject to certain asset coverage ratio requirements under the 1940 Act and financial covenants under loan and credit agreements that could, under certain circumstances, restrict us from making distributions necessary to satisfy the distribution requirement. If we are unable to obtain cash from other sources, we could fail to qualify for RIC tax treatment and thus become subject to corporate-level income tax. |
| • | The income source requirement will be satisfied if we obtain at least 90% of our income for each year from dividends, interest, gains from the sale of stock or securities, or similar sources. |
| • | The asset diversification requirement will be satisfied if we meet certain asset diversification requirements at the end of each quarter of our taxable year. Failure to meet those requirements may result in our having to dispose of certain investments quickly in order to prevent the loss of RIC status. Because most of our investments will be in private companies, and therefore will be relatively illiquid, any such dispositions could be made at disadvantageous prices and could result in substantial losses. |
If we do not qualify as a RIC for more than two consecutive years, and then seek to requalify and elect RIC status, we would be required to recognize gain to the extent of any unrealized appreciation on our assets unless we make a special election to pay corporate-level tax on any such unrealized appreciation recognized during the succeeding 10-year period.
If we fail to qualify for RIC tax treatment for any reason and are subject to corporate income tax, the resulting corporate taxes could substantially reduce our net assets, the amount of income available for distribution and the amount of our distributions. In addition, the asset coverage and distribution requirements impose significant cash flow management restrictions on us and limit our ability to retain earnings to cover periods of loss, provide for future growth, and pay for extraordinary items. Additionally, we could fail to satisfy the requirement that a RIC derive at least 90% of its gross income from qualifying sources, with the result that we would not qualify as a RIC. Qualification as a RIC is made on an annual basis and, although we and some of our subsidiaries have qualified in the past, we cannot assure you that we will qualify for such treatment in the future.
The Code’s diversification requirements may limit our ability to expand our business.
RIC qualification rules require that at the end of each quarter of our taxable year, (i) at least 50% of the market value of our assets must be represented by cash, securities of other RICs, US government securities, and other securities, with such other securities limited, in respect of any one issuer, to an amount not greater than 5% of our assets and not greater than 10% of the outstanding voting securities of such issuer and (ii) not more than 25% of the value of our assets may be invested in the securities (other than US government securities or securities of other RICs) of any one issuer, any two or more issuers of which 20% or more of the voting stock is held by us and that are determined to be engaged in the same or similar trades or businesses or related trades or businesses or in the securities of one or more qualified publicly traded partnerships. As of December 31, 2015, our largest investment subject to this test was our investment in Medallion Bank, representing 24.97% of our RIC assets. No other investments were more than 5% of our RIC assets. We will continue to monitor the levels of this and any other investment concentrations in conjunction with the diversification tests.
We may have difficulty paying our required distributions if we recognize income before or without receiving cash representing such income.
For US federal income tax purposes, we will include in taxable income certain amounts that we have not yet received in cash, such as original issue discount, which may arise if we receive warrants in connection with the origination of a loan or possibly in other circumstances, or contractual payment-in-kind interest, which represents contractual interest added to the loan balance and due at the end of the loan term. Such original issue discount or increases in loan balances as a result of payment-in-kind interest will be included in income before we receive any corresponding cash payments. We also may be required to include in income certain other amounts that we will not receive in cash.
26
Table of Contents
Since, in certain cases, we may recognize income before or without receiving cash representing such income, we may have difficulty meeting the annual distribution requirement necessary to achieve and maintain RIC tax treatment under the Code. Accordingly, we may have to sell some of our investments at times and/or at prices we would not consider advantageous, raise additional debt or equity capital, or reduce new investment originations for this purpose. If we are not able to obtain cash from other sources, we may fail to qualify for RIC tax treatment and thus become subject to corporate-level income tax.
As Medallion Bank grows, a greater portion of our business will be subject to corporate-level tax.
Medallion Bank must pay corporate-level US federal and state income taxes. As Medallion Bank grows its business, more of its income will be taxed, which will reduce the amount of cash available for distribution to us and, in turn, to our shareholders.
Our SBIC subsidiaries may be unable to meet the investment company requirements, which could result in the imposition of an entity-level tax.
Some of our subsidiaries are subject to the SBIA. Our SBIC subsidiaries that are also RICs may be prohibited by the SBIA from making the distributions necessary to qualify as a RIC. The SBA has agreed that our SBIC subsidiaries can make these distributions provided we reinvest the distributions in our SBIC subsidiaries. Normally, we would report this reinvested capital as paid-in surplus; however, the SBA has required us to categorize this reinvested capital as undistributed net realized earnings. We cannot assure you that this will continue to be the SBA’s policy or that our subsidiaries will have adequate capital to make the required adjustments. If our subsidiaries are unable to obtain a waiver, compliance with the SBA regulations may result in loss of RIC status and a consequent imposition of an entity-level tax at the subsidiary level. In the event we are granted a waiver, we will be required to reinvest the distribution into the SBIC as capital. This may result in us recognizing taxable income without receiving a corresponding amount of cash to pay the distribution. Any failure to pay the distribution could cause a loss of RIC status and the imposition of entity level tax.
Our SBIC subsidiaries are licensed by the SBA, and are therefore subject to SBA regulations.
Our SBIC subsidiaries are licensed to act as SBICs and are regulated by the SBA. The SBA also places certain limitations on the financing terms of investments by SBICs in portfolio companies and prohibits SBICs from providing funds for certain purposes or to businesses in a few prohibited industries. Compliance with SBA requirements may cause the SBIC subsidiaries to forego attractive investment opportunities that are not permitted under SBA regulations.
Further, SBA regulations require that a licensed SBIC be periodically examined and audited by the SBA to determine its compliance with the relevant SBA regulations. The SBA prohibits, without prior SBA approval, a “change of control” of an SBIC or transfers that would result in any person (or a group of persons acting in concert) owning 10% or more of a class of capital stock of a licensed SBIC. If the SBIC subsidiaries fail to comply with applicable SBIC regulations, the SBA could, depending on the severity of the violation, limit or prohibit their use of debentures, declare outstanding debentures immediately due and payable, and/or limit them from making new investments. In addition, the SBA can revoke or suspend a license for willful or repeated violation of, or willful or repeated failure to observe, any provision of the SBIA or any rule or regulation promulgated thereunder. Such actions by the SBA would, in turn, negatively affect us.
We may materially change our corporate structure and the nature of our business.
We are very much affected by the legal, regulatory, tax and accounting regimes under which we operate. We periodically evaluate whether those regimes and our existing corporate structure are the optimum means for the operation and capitalization of our business. As a result of these evaluations, we may decide to proceed with structural and organizational changes (certain of which may require the approval of our shareholders), which could result in material dispositions of various assets, changes in our corporate form, termination of our election to be regulated as a BDC, our conversion from an investment company to an operating company or other fundamental changes. If we were no longer an investment company, our accounting practices would change and, for example, lead to the consolidation of certain majority owned companies with which we do not now consolidate as an investment company. Additionally, if we were no longer an investment company, our shareholders would not benefit from the investor protections provided by the 1940 Act. We may incur certain costs in completing these evaluations and may receive no benefit from these expenditures, particularly if we do not proceed with any changes. No decisions have been made with respect to any such changes and there is no timetable for making any decisions, including any decision not to proceed with any such changes.
We operate in a highly competitive market for investment opportunities.
We compete for investments with other business development companies and other investment funds as well as traditional financial services companies such as commercial banks and credit unions. Many of our competitors are substantially larger and have considerably greater financial, technical, and marketing resources than we do. For example, some competitors may have a lower cost of funds and access to funding sources that are not available to us. In addition, some of our competitors may have higher risk
27
Table of Contents
tolerances or different risk assessments. These characteristics could allow our competitors to consider a wider variety of investments, establish more relationships, and offer better pricing and more flexible structuring than us. We may be unwilling to match our competitors’ pricing, terms, and structure of certain loans and investments opportunities due to potential risks, which may result in us earning less income than our competitors. If we are forced to match our competitors’ pricing, terms, and structure, we may not be able to achieve acceptable returns on our investments or may bear substantial risk of capital loss. Furthermore, many of our competitors are not subject to the regulatory restrictions that the 1940 Act imposes on us as a BDC.
We cannot assure you that the competitive pressures we face will not have a material adverse effect on our business, financial condition, and results of operations. Also, as a result of this competition, we may not be able to take advantage of attractive investment opportunities from time to time.
Changes in interest rates may affect our cost of capital and net investment income.
Because we borrow to fund our investments, a portion of our income is dependent upon the difference between the interest rate at which we borrow funds and the interest rate at which we invest these funds. A portion of our investments, such as taxi medallion loans, will have fixed interest rates, while a portion of our borrowings will likely have floating interest rates. As a result, a significant change in market interest rates could have a material adverse effect on our net investment income. In periods of rising interest rates, our cost of funds could increase, which would reduce our net investment income. We may hedge against interest rate fluctuations by using standard hedging instruments, subject to applicable legal requirements. These activities may limit our ability to participate in the benefits of lower interest rates with respect to the hedged portfolio. Adverse developments resulting from changes in interest rates or hedging transactions could have a material adverse effect on our business, financial condition, and results of operations. Also, we will have to rely on our counterparties to perform their obligations under such hedges.
A decrease in prevailing interest rates may lead to more loan prepayments, which could adversely affect our business.
Our borrowers generally have the right to prepay their loans upon payment of a fee ranging from 1% to 2% for standard commodity loans, and for higher amounts, as negotiated, for larger more custom loan arrangements. A borrower is likely to exercise prepayment rights at a time when the interest rate payable on the borrower’s loan is high relative to prevailing interest rates. In a lower interest rate environment, we will have difficulty re-lending prepaid funds at comparable rates, which may reduce the net interest income that we receive. When this occurs, we will generally reinvest these proceeds in temporary investments, pending their future investment in new portfolio companies. These temporary investments will typically have substantially lower yields than the debt being prepaid, and we could experience significant delays in reinvesting these amounts. Any future investment in a new portfolio company may also be at lower yields than the debt that was repaid. As a result, our results of operations could be materially adversely affected if a substantial number of our portfolio companies elect to prepay amounts owed to us and we are not able to reinvest the proceeds for comparable yields in a timely fashion. Additionally, prepayments could negatively impact our return on equity, which could result in a decline in the market price of our common stock.
An increase in prevailing interest rates could adversely affect our business.
The majority of our loan portfolio is comprised of fixed-rate loans. Abrupt increase in market rates of interest may have an adverse impact on our earnings until we are able to originate new loans at higher prevailing interest rates.
We depend on cash flow from our subsidiaries to make distribution payments to our shareholders.
We are primarily a holding company, and we derive most of our operating income and cash flow from our subsidiaries. As a result, we rely heavily upon distributions from our subsidiaries to generate the funds necessary to make distribution payments to our shareholders. Funds are provided to us by our subsidiaries through dividends and payments on intercompany indebtedness, but we cannot assure you that our subsidiaries will be in a position to continue to make these dividend or debt payments. The Utah Department of Financial Institutions and FDIC have the authority to prohibit or to limit the payment of dividends by Medallion Bank. In addition, as a condition to receipt of FDIC insurance, Medallion Bank entered into a capital maintenance agreement with the FDIC requiring it to maintain a 15% leverage ratio (Tier 1 capital to total assets). Medallion Bank may be restricted from declaring and paying dividends if doing so were to cause it to fall below a 15% leverage ratio.
Medallion Bank’s use of brokered deposit sources for its deposit-gathering activities may not be available when needed.
Medallion Bank relies on the established brokered deposit market to originate deposits to fund its operations. Medallion Bank’s brokered deposits consist of deposits raised through the brokered deposit market rather than through retail branches. While Medallion Bank has developed contractual relationships with a diversified group of investment brokers, and the brokered deposit market is well
28
Table of Contents
developed and utilized by many banking institutions, conditions could change that might affect the availability of deposits. If the capital levels at Medallion Bank fall below the “well-capitalized” level as defined by the FDIC or the capital level currently required by the FDIC pursuant to its capital maintenance agreement, or if Medallion Bank experiences a period of sustained operating losses, the cost of attracting deposits from the brokered deposit market could increase significantly, and the ability of Medallion Bank to raise deposits from this source could be impaired. Brokered deposits may also not be as stable as other types of deposits. Medallion Bank’s ability to manage its growth to stay within the “well-capitalized” level, and the capital level currently required by the FDIC pursuant to its capital maintenance agreement, which is also considerably higher than the level required to be classified as “well-capitalized”, is critical to Medallion Bank’s retaining open access to this funding source. For more information, see “Regulation of Medallion Bank as an Industrial Bank.”
Our investment portfolio is, and will continue to be, recorded at fair value as determined in good faith by our Board of Directors and, as a result, there is, and will continue to be, uncertainty as to the value of our portfolio investments which could adversely affect our net asset value.
Under the 1940 Act, we are required to carry our portfolio investments at market value or, if there is no readily available market value, at fair value as determined by our Board of Directors. Unlike other lending institutions, we are not permitted to establish reserves for loan losses. Instead, we are required by the 1940 Act to specifically value each individual investment and record an unrealized gain or loss for any asset we believe has increased or decreased in value. Typically, there is not a public market for most of the investments in which we have invested and will generally continue to invest. As a result, our Board of Directors values our investments on a quarterly basis based on a determination of their fair value made in good faith and in accordance with the written guidelines approved by our Board of Directors. Our Board of Directors regularly reviews the appropriateness and accuracy of the method used in valuing our investments, and makes any necessary adjustments. The types of factors that may be considered in determining the fair value pricing of our investments include the nature and realizable value of any collateral, the portfolio company’s earnings and its ability to make payments on its indebtedness, the markets in which the portfolio company does business, market conditions for loans (e.g., values used by other lenders and any active bid/ask market), comparison to publicly traded companies, discounted cash flow, comparable sales and valuations of companies similar to the portfolio company, regulatory factors that may limit the value of the portfolio company, and other relevant factors. Because such valuations, and particularly valuations of private securities and private companies, are inherently uncertain, the valuations may fluctuate over short periods of time and may be based on estimates. As a result, our determinations of fair value may differ materially from the values that would have been used if a ready market for these investments existed, and may cause our net asset value on a given date to materially understate or overstate the value that we may ultimately realize upon the sale or disposition of one or more of our investments. Investors purchasing our securities in connection with an offering based on an overstated net asset value would pay a higher price than the value of our investments might warrant, and investors purchasing our securities in connection with an offering based on an understated net asset value would pay a lower price than the value of our investments might warrant. Our net asset value could be adversely affected if our determinations regarding the fair value of our investments were materially higher than the values that we ultimately realize upon the disposal of such securities. Considering these factors, we have determined that the fair value of our portfolio is above its cost basis. As of December 31, 2015, our net unrealized appreciation on investments, other than on investments other than securities, was $15,527,000 or 2.63% of our investment portfolio.
Uncertainty relating to the reporting of collateral values for our loans may adversely affect the value of our portfolio.
Medallion loans and the asset-based portion of the commercial loan portfolio are primarily collateral-based lending, whereby the collateral value exceeds the amount of the loan, providing sufficient excess collateral to protect us against losses. Collateral values for medallion loans reflect recent sales prices and are typically obtained from the regulatory agency in a particular local market. Collateral values for asset based loans are confirmed through daily analysis of funds availability based on cash collection and receivables agings, confirmations obtained from a borrower’s underlying customers, and field examinations by us or third parties engaged by us. We rely on the integrity of the collateral value benchmarks obtained by the applicable regulatory agencies and other third parties. If these benchmarks are artificially influenced by market participants we could suffer losses. We have experienced a significant downward movement in medallion collateral values which may continue, and has caused a negative impact on our valuation analysis and could result in a significantly lower fair market value measurement of our portfolio.
We require an objective benchmark in determining the fair value of our portfolio. If the benchmarks that we currently use are deemed to be unreliable, we will need to use other intrinsic factors in determining the collateral values for our loans.
29
Table of Contents
Failure to obtain an extension of our existing credit facilities could have a material adverse effect on our results of operations and financial position.
We utilize secured revolving credit facilities and other facilities to fund our investments. We cannot guarantee that our credit facilities will continue to be available beyond their current maturity dates on reasonable terms or at all or that we will be able to otherwise obtain funds by selling assets or raising equity to make required payments on maturing indebtedness. The availability of revolving credit facilities depends, in part, on factors outside of our control, including regulatory capital treatment for unfunded bank lines of credit, the financial strength and strategic objectives of the banks that participate in our credit facilities and the availability of bank liquidity in general. If the credit facilities are not renewed or extended by our lenders by their maturity dates, we will not be able to make further borrowings under the facilities after they mature and the outstanding principal balances under such facilities will be due and payable at maturity. If we are unable to refinance our indebtedness at maturity or meet our payment obligations, our financial condition would be adversely affected and our lenders may foreclose on the property securing such indebtedness. If we are unable to extend or replace these facilities or arrange new credit facilities or other types of interim financing, we may need to curtail or suspend loan origination and funding activities which could have a material adverse effect on our results of operations and financial position.
We are subject to certain financial covenants and other restrictions under our loan and credit arrangements, which could affect our ability to finance future operations or capital needs or to engage in other business activities.
Our loan and credit agreements contain financial covenants and other restrictions relating to borrowing base eligibility, tangible net worth, net income, leverage ratios, shareholders’ equity and collateral values. Our ability to meet these financial covenants and restrictions could be affected by events beyond our control, such as a substantial decline in collateral values or a rise in borrower delinquencies. A breach of these covenants could result in an event of default under the applicable debt instrument. Such a default, if not cured or waived, may allow the creditors to accelerate the related debt and may result in the acceleration of any other debt that is subject to an applicable cross-acceleration or cross-default provision. Certain other events can constitute an event of default. In addition, an event of default under the credit agreements would permit the lenders under our credit facilities to terminate all commitments to extend further credit under the facilities. Furthermore, if we were unable to repay the amounts due and payable under our credit facilities, those lenders could proceed against the collateral granted to them to secure that indebtedness. In the event our lenders or holders of the related notes accelerate the repayment of our borrowings, we and our subsidiaries may not have sufficient assets to repay that indebtedness. Based on the foregoing factors, the operating and financial restrictions and covenants in our current credit agreements and any future financing agreements could adversely affect our ability to finance future operations or capital needs or to engage in other business activities.
The lack of liquidity in our investments may adversely affect our business.
We generally make investments in private companies. Substantially all of these securities are subject to legal and other restrictions on resale or are otherwise less liquid than publicly traded securities. The illiquidity of our investments may make it difficult for us to sell such investments if the need arises. In addition, if we are required to liquidate all or a portion of our portfolio quickly, we may realize significantly less than the value at which we had previously recorded our investments. We may also face other restrictions on our ability to liquidate an investment in a portfolio company to the extent that we have material non-public information regarding such portfolio company.
In addition, the illiquidity of our loan portfolio and investments may adversely affect our ability to dispose of loans at times when it may be advantageous for us to liquidate such portfolio or investments. In addition, if we were required to liquidate some or all of the investments in the portfolio, the proceeds of such liquidation may be significantly less than the current value of such investments. Because we borrow money to make loans and investments, our net operating income is dependent upon the difference between the rate at which we borrow funds and the rate at which we invest these funds. As a result, there can be no assurance that a significant change in market interest rates will not have a material adverse effect on our interest income. In periods of sharply rising interest rates, our cost of funds would increase, which would reduce our net operating income before net realized and unrealized gains. We use a combination of long-term and short-term borrowings and equity capital to finance our investing activities. Our long-term fixed-rate investments are financed primarily with short-term floating-rate debt, and to a lesser extent by term fixed-rate debt. We may use interest rate risk management techniques in an effort to limit our exposure to interest rate fluctuations. Such techniques may include various interest rate hedging activities to the extent permitted by the 1940 Act. We have analyzed the potential impact of changes in interest rates on net interest income. Assuming that the balance sheet were to remain constant and no actions were taken to alter the existing interest rate sensitivity, and including the impact on Medallion Bank, a hypothetical immediate 1% increase in interest rates would result in an increase to the line item “net increase in net assets resulting from operations” as of December 31, 2015 by approximately $692,000 on an annualized basis, compared to a positive impact of $1,279,000 at December 31, 2014, and the impact of such an immediate increase of 1% over a one year period would have been approximately ($1,855,000) at December 31, 2015, compared to ($1,634,000) at December 31, 2014. Although management believes that this measure is indicative of our sensitivity to interest rate changes, it does not adjust for potential changes in credit quality, size, and composition of the assets on the balance sheet, and other business developments that could affect net increase in net assets resulting from operations in a particular quarter or for the year taken as a whole. Accordingly, no assurances can be given that actual results would not differ materially from the potential outcome simulated by these estimates.
30
Table of Contents
We may experience fluctuations in our quarterly results.
We could experience fluctuations in our quarterly operating results due to a number of factors, including our ability to make investments in companies that meet our investment criteria, the interest rate payable on the debt securities we acquire, the level of our expenses, variations in and the timing of the recognition of realized and unrealized gains or losses, the degree to which we encounter competition in our markets, and general economic conditions. As a result of these factors, results for any period should not be relied upon as being indicative of performance in future periods.
Security breaches and other disruptions could compromise our information and expose us to liability, which would cause our business and reputation to suffer.
In the ordinary course of our business, we collect and store sensitive data, including our proprietary business information and that of our customers and personally identifiable information of our customers and employees, in our data centers, and on our networks. The secure processing, maintenance, and transmission of this information is critical to our operations. Despite our security measures, our information technology and infrastructure may be vulnerable to attacks by hackers or breached due to employee error, malfeasance or other disruptions. Any such breach could compromise our networks and the information stored there could be accessed, publicly disclosed, lost or stolen. Any such access, disclosure or other loss of information could result in legal claims or proceedings, liability under laws that protect the privacy of personal information and regulatory penalties, disrupt our operations and damage our reputation, which could adversely affect our business.
We experienced a period of capital markets disruption and severe recession beginning in 2008, and the impact of resulting changes on the financial markets may not be fully known for some time.
The global financial crisis that began in 2008 materially and adversely affected the debt and equity capital markets in the United States. The US capital markets experienced extreme volatility and disruption for an extended period of time as evidenced by a lack of liquidity in the debt capital markets, significant write-offs in the financial services sector, the repricing of credit risk in the broadly syndicated credit market, and the failure of major financial institutions. These events contributed to worsening general economic conditions that materially and adversely impacted the broader financial and credit markets and reduced the availability of credit and equity capital for the markets as a whole, and financial services firms in particular. In response to the crisis, the US and other governments and the Federal Reserve and certain foreign central banks took steps to support financial markets, including by keeping interest rates at historically low levels. More recently, the Federal Reserve has reduced its market support activities. Further reduction or withdrawal of this support, failure of efforts in response to the crisis, or investor perception that such efforts are not succeeding could negatively affect financial markets generally as well as the value and liquidity of certain securities. While recent market conditions have improved, there have been continuing periods of volatility and there can be no assurance that adverse market conditions will not repeat themselves or worsen in the future. A prolonged period of market volatility or illiquidity could have an adverse effect on our business, financial condition, and results of operations. Unfavorable economic conditions also could increase our funding costs, limit our access to the capital markets or result in a decision by lenders not to extend credit to us. Equity capital may be difficult to raise because, subject to some limited exceptions, we generally are not able to issue and sell our common stock at a price below net asset value per share. In addition, the debt capital that will be available, if at all, may be at a higher cost and on less favorable terms and conditions.
Terrorist attacks, other acts of violence or war, and natural disasters may affect any market for our securities, impact the businesses in which we invest, and harm our operations and profitability.
Terrorist attacks and natural disasters may harm our results of operations and your investment. We cannot assure you that there will not be further terrorist attacks against the US or US businesses or major natural disasters hitting the United States. Such attacks or natural disasters in the US or elsewhere may impact the businesses in which we invest directly, or indirectly by undermining economic conditions in the United States. In addition, a substantial portion of our business is focused in the New York City metropolitan area, which suffered a terrorist attack in 2001. Another terrorist attack in New York City or elsewhere could severely impact our results of operations. Losses resulting from terrorist attacks are generally uninsurable.
31
Table of Contents
Our financial condition and results of operations will depend on our ability to manage growth effectively.
Our ability to achieve our investment objective will depend on our ability to grow, which will depend, in turn, on our management team’s ability to identify, evaluate, and monitor, and our ability to finance and invest in, companies that meet our investment criteria.
Accomplishing this result on a cost-effective basis will be largely a function of our management team’s handling of the investment process, its ability to provide competent, attentive, and efficient services, and our access to financing on acceptable terms. In addition to monitoring the performance of our existing investments, members of our management team and our investment professionals may also be called upon to provide managerial assistance to our portfolio companies. These demands on their time may distract them or slow the rate of investment. In order to grow, we will need to hire, train, supervise, and manage new employees. However, we cannot assure you that any such employees will contribute to the success of our business. Any failure to manage our future growth effectively could have a material adverse effect on our business, financial condition, and results of operations.
Acquisitions may lead to difficulties that could adversely affect our operations.
By their nature, corporate acquisitions entail certain risks, including those relating to undisclosed liabilities, the entry into new markets, operational, and personnel matters. We may have difficulty integrating acquired operations or managing problems due to sudden increases in the size of our loan portfolio. In such instances, we might be required to modify our operating systems and procedures, hire additional staff, obtain and integrate new equipment, and complete other tasks appropriate for the assimilation of new business activities. We cannot assure you that we would be successful, if and when necessary, in minimizing these inherent risks or in establishing systems and procedures which will enable us to effectively achieve our desired results in respect of any future acquisitions.
Our ability to enter into transactions with our affiliates is restricted.
The 1940 Act restricts our ability to knowingly participate in certain transactions with our affiliates. These restrictions limit our ability to buy or sell any security from or to our affiliates, or engage in “joint” transactions with our affiliates, which could include investments in the same portfolio company (whether at the same or different times). With respect to controlling or certain closely affiliated persons, we will generally be prohibited from engaging in such transactions absent the prior approval of the SEC. With respect to other affiliated persons, we may engage in such transactions only with the prior approval of our independent directors.
The SBA restricts the ability of SBICs to lend money to their officers, directors, and employees, or invest in affiliates thereof.
Medallion Bank is subject to certain federal laws that restrict and control its ability to provide or receive services between affiliates. Sections 23A and 23B of the Federal Reserve Act and applicable regulations also impose restrictions on Medallion Bank. These restrictions limit the transfer of funds by a depository institution to certain of its affiliates, including us, in the form of loans, extensions of credit, investments, or purchases of assets. Sections 23A and 23B also require generally that the depository institution’s transactions with its affiliates be on terms no less favorable to Medallion Bank than comparable transactions with unrelated third parties.
Our Board of Directors may change our operating policies and strategies without prior notice or shareholder approval, the effects of which may be adverse.
Our Board of Directors has the authority to modify or waive our current operating policies and strategies without prior notice and without shareholder approval. We cannot predict the effect any changes to our current operating policies and strategies would have on our business, operating results, and value of our stock. However, the effects might be adverse, which could negatively impact our ability to pay you distributions and cause you to lose all or part of your investment.
Risks Relating to Our Investments
Lending to small businesses involves a high degree of risk and is highly speculative.
Lending to small businesses involves a high degree of business and financial risk, which can result in substantial losses and should be considered speculative. Our borrower base consists primarily of small business owners that may have limited resources and that are generally unable to obtain financing from traditional sources. There is generally no publicly available information about these small business owners, and we must rely on the diligence of our employees and agents to obtain information in connection with our credit decisions. In addition, these small businesses often do not have audited financial statements. Some smaller businesses have narrower product lines and market shares than their competition. Therefore, they may be more vulnerable to customer preferences, market conditions, or economic downturns, which may adversely affect the return on, or the recovery of, our investment in these businesses.
32
Table of Contents
Our portfolio is and may continue to be concentrated in a limited number of portfolio companies and industries, which will subject us to a risk of significant loss if any of these companies defaults on its obligations to us or by a downturn in the particular industry.
Our portfolio is and may continue to be concentrated in a limited number of portfolio companies and industries. In addition, taxicab companies that constitute separate issuers may have related management or guarantors and constitute larger business relationships to us. As of December 31, 2015, investments in New York City taxi medallion loans represented approximately 74% of our managed taxi medallion loans, which in turn represented 43% of our managed net investment portfolio. Beyond the asset diversification requirements associated with our qualification as a RIC, we do not have fixed guidelines for diversification, and while we are not targeting any specific industries, our investments are, and could continue to be, concentrated in relatively few industries. As a result, the aggregate returns we realize may be adversely affected if a small number of investments perform poorly or if we need to write down the value of any one investment. If our larger borrowers were to significantly reduce their relationships with us and seek financing elsewhere, the size of our loan portfolio and operating results could decrease. In addition, larger business relationships may also impede our ability to immediately foreclose on a particular defaulted portfolio company as we may not want to impair an overall business relationship with either the portfolio company management or any related funding source. Additionally, a downturn in any particular industry in which we are invested could also negatively impact the aggregate returns we realize.
If we are unable to continue to diversify geographically, our business may be adversely affected if the New York City taxicab industry experiences a sustained economic downturn.
A significant portion of our loan revenue is derived from New York City medallion loans collateralized by New York City taxicab medallions. An economic downturn in the New York City taxicab industry could lead to an increase in defaults on our medallion loans. We cannot assure you that we will be able to sufficiently diversify our operations geographically.
An economic downturn could result in certain of our commercial and consumer loan customers experiencing declines in business activities and/or personal resources, which could lead to difficulties in their servicing of their loans with us, and increasing the level of delinquencies, defaults, and loan losses in our commercial and consumer loan portfolios.
Laws and regulations implemented in response to climate change could result in increased operating costs for our portfolio companies.
Congress and other governmental authorities have either considered or implemented various laws and regulations in response to climate change and the reduction of greenhouse gases. Existing environmental regulations could be revised or reinterpreted, new laws and regulations could be adopted, and future changes in environmental laws and regulations could occur, which could impose additional costs on the operation of our portfolio companies. For example, regulations to cut gasoline use and control greenhouse gas emissions from new cars could adversely affect our medallion portfolio companies. Our portfolio companies may have to make significant capital and other expenditures to comply with these laws and regulations. Changes in, or new, environmental restrictions may force our portfolio companies to incur significant expenses or expenses that may exceed their estimates. There can be no assurance that such companies would be able to recover all or any increased environmental costs from their customers or that their business, financial condition or results of operations would not be materially and adversely affected by such expenditures or any changes in environmental laws and regulations, in which case the value of these companies could be adversely affected.
Our portfolio companies may incur debt that ranks equally with, or senior to, our investments in such companies.
We invest in our portfolio companies primarily through senior secured loans, junior secured loans, and subordinated debt issued by small- to mid-sized companies. Our portfolio companies may have, or may be permitted to incur, other debt that ranks equally with, or senior to, the debt in which we invest. By their terms, such debt instruments may entitle the holders to receive payment of interest or principal on or before the dates on which we are entitled to receive payments with respect to the debt instruments in which we invest. Also, in the event of insolvency, liquidation, dissolution, reorganization, or bankruptcy of a portfolio company, holders of debt instruments ranking senior to our investment in that portfolio company would typically be entitled to receive payment in full before we receive any distribution. After repaying such senior creditors, such portfolio company may not have any remaining assets to use for repaying its obligation to us. In the case of debt ranking equally with debt instruments in which we invest, we would have to share on an equal basis any distributions with other creditors holding such debt in the event of an insolvency, liquidation, dissolution, reorganization, or bankruptcy of the relevant portfolio company.
33
Table of Contents
A third party finance company sold various participations in asset based loans to Medallion Business Credit and Medallion Bank. In April 2013, the aggregate balance of the participations was approximately $13.8 million, $12.9 million of which were held by Medallion Bank. That amount was divided between seven separate borrowers operating in a variety of industries. In April 2013, the third party finance company became the subject of an involuntary bankruptcy petition filed by its bank lenders. Among other things, the bank lenders alleged that the third party finance company fraudulently misrepresented its borrowing availability under its credit facility with the bank lenders and are seeking the third party finance company’s liquidation. In May 2013, the bankruptcy court presiding over the third party finance company’s case entered an order converting the involuntary chapter 7 case to a chapter 11 case. On May 31, 2013, we commenced an adverse proceeding against the third party finance company and the bank lenders seeking declaratory judgment that our loan participations are true participations and not subject to the bankruptcy estate or to the bank lender’s security interest in the third party finance company’s assets. The third party finance company and bank lenders are contesting our position. In April 2014, we received a decision from the court granting summary judgment in our favor with respect to the issue of whether our loan participations are true participations. In March 2015, we and Medallion Bank received a decision from the court finding that the bank lenders generally held a first lien on our and Medallion Bank’s loan participations subject to, among other things, defenses still pending prosecution by the parties and adjudication by the court. We and Medallion Bank are appealing the decision. The remaining issues are still being litigated. Although we believe the claims raised by the third party finance company and the senior lenders are without merit and will vigorously defend against them, we cannot at this time predict the outcome of this litigation or determine our potential exposure. If we are incorrect in our assessments our results of operations could be materially adversely affected. At December 31, 2015, five of the seven secured borrowers had refinanced their loans in full with third parties, and the related proceeds are held in escrow pending resolution of the bankruptcy proceedings. In September 2015, one loan was sold at a discount to a third party, and the related proceeds are held in escrow pending resolution of the bankruptcy proceedings. One loan was charged off in September 2014. See page 46 for additional information regarding this matter.
There may be circumstances where our debt investments could be subordinated to claims of other creditors or we could be subject to lender liability claims.
Even though we may have structured most of our investments as senior loans, if one of our portfolio companies were to go bankrupt, depending on the facts and circumstances, including the extent to which we actually provided managerial assistance to that portfolio company, a bankruptcy court might recharacterize our debt investment and subordinate all or a portion of our claim to that of other creditors. We may also be subject to lender liability claims for actions taken by us with respect to a borrower’s business or instances where we exercise control over the borrower. It is possible that we could become subject to a lender’s liability claim, including as a result of actions taken in rendering significant managerial assistance.
We may not control many of our portfolio companies.
We may not control many of our portfolio companies, even though we may have board representation or board observation rights, and our debt agreements may contain certain restrictive covenants. As a result, we are subject to the risk that a portfolio company in which we invest may make business decisions with which we disagree, and the management of such company may take risks or otherwise act in ways that do not serve our interests as debt investors.
We may not realize gains from our equity investments.
Certain investments that we have made in the past and may make in the future include warrants or other equity securities. In addition, we may from time to time make non-control, equity co-investments in companies in conjunction with private equity sponsors. Our goal is ultimately to realize gains upon our disposition of such equity interests. However, the equity interests we receive may not appreciate in value and, in fact, may decline in value. Accordingly, we may not be able to realize gains from our equity interests, and any gains that we do realize on the disposition of any equity interests may not be sufficient to offset any other losses we experience. We also may be unable to realize any value if a portfolio company does not have a liquidity event, such as a sale of the business, recapitalization, or public offering, which would allow us to sell the underlying equity interests.
| ITEM 1B. | UNRESOLVED STAFF COMMENTS |
None.
| ITEM 2. | PROPERTIES |
We lease approximately 19,000 square feet of office space in New York City for our corporate headquarters under a lease expiring in April 2027, and lease a facility in Long Island City, New York, of approximately 6,000 square feet for certain corporate back-office operations. We also lease office space for loan origination offices and subsidiary operations in Boston, MA, Chicago, IL, Cleveland, OH, and Minneapolis, MN. Medallion Bank leases space in Salt Lake City, UT, and Seattle, WA. We do not own any real property, other than foreclosed properties obtained as a result of lending relationships. We believe that our leased properties, taken as a whole, are in good operating condition and are suitable for our current business operations.
34
Table of Contents
| ITEM 3. | LEGAL PROCEEDINGS |
We and our subsidiaries are currently involved in various legal proceedings incident to the ordinary course of our business, including collection matters with respect to certain loans. We intend to vigorously defend any outstanding claims and pursue our legal rights. In the opinion of our management and based upon the advice of legal counsel, there is no proceeding pending, or to the knowledge of management threatened, which in the event of an adverse decision would result in a material adverse effect on our results of operations or financial condition.
| ITEM 4. | MINE SAFETY DISCLOSURES |
Not applicable.
ITEM 5. MARKET FOR REGISTRANT’S COMMON EQUITY, RELATED STOCKHOLDER MATTERS AND ISSUER PURCHASES OF EQUITY SECURITIES
STOCK PERFORMANCE GRAPH
The following graph commences as of December 31, 2010 and compares the Company’s Common Stock with the cumulative total return for the NASDAQ Composite Index and the Russell 2000 Index. Furthermore, the following graph assumes the investment of $100 on December 31, 2010 in each of the Company’s Common Stock, the stocks comprising the NASDAQ Composite Index and the Russell 2000 Index and assumes dividends are reinvested.
35
Table of Contents
Cumulatiave Total Return
Based on Initial Investment of $100 on December 31, 2010
with dividends reinvested
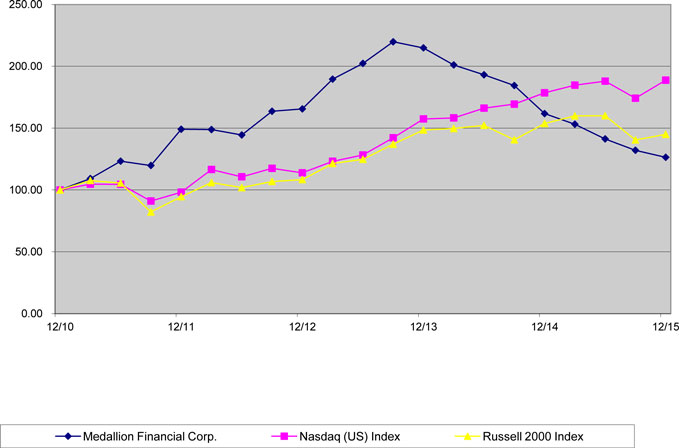
Our common stock is quoted on NASDAQ under the symbol “TAXI.” Our common stock commenced trading on May 23, 1996. As of March 4, 2016, there were approximately 210 holders of record of our common stock.
On March 4, 2016, the last reported sale price of our common stock was $8.76 per share. Since our initial public offering, our common stock has traded at a premium to net asset value per share more frequently than at a discount to net asset value per share, but there can be no assurance that our stock will trade at a premium in the future.
36
Table of Contents
The following table sets forth, for the periods indicated, the range of high and low closing prices for our common stock on the Nasdaq Global Select Market.
| DISTRIBUTIONS DECLARED |
HIGH | LOW | ||||||||||
| 2015 | ||||||||||||
| Fourth Quarter |
$ | 0.25 | $ | 8.76 | $ | 6.36 | ||||||
| Third Quarter |
0.25 | 9.23 | 6.17 | |||||||||
| Second Quarter |
0.25 | 11.01 | 8.35 | |||||||||
| First Quarter |
0.25 | 10.80 | 9.06 | |||||||||
|
|
|
|
|
|
|
|||||||
| 2014 |
||||||||||||
| Fourth Quarter |
$ | 0.24 | $ | 11.84 | $ | 9.70 | ||||||
| Third Quarter |
0.24 | 12.73 | 11.14 | |||||||||
| Second Quarter |
0.24 | 14.23 | 11.58 | |||||||||
| First Quarter |
0.24 | 14.56 | 13.08 | |||||||||
Information about our equity compensation plans is incorporated by reference in all information under the caption “Equity Compensation Plan Information” included in our definitive Proxy Statement for the Annual Meeting of Stockholders to be held on June 17, 2016.
As a RIC, we intend to distribute at least 90% of our investment company taxable income to our shareholders. Distributions of our income are generally required to be made within the calendar year the income was earned as a RIC; however, in certain circumstances distributions can be made up to a full calendar year after the income has been earned. Investment company taxable income includes, among other things, interest, dividends, and capital gains reduced by deductible expenses. Our ability to make distributions as a RIC is restricted by certain asset coverage requirements under the 1940 Act and has been dependent upon maintenance of our status as a RIC under the Code in the past, by SBA regulations, and under the terms of the SBA debentures. There can be no assurances, however, that we will have sufficient earnings to pay such distributions in the future.
We have adopted a dividend reinvestment plan pursuant to which shareholders may elect to have distributions reinvested in additional shares of common stock. When we declare a distribution, all participants will have credited to their plan accounts the number of full and fractional shares (computed to three decimal places) that could be obtained with the cash, net of any applicable withholding taxes that would have been paid to them if they were not participants. The number of full and fractional shares is computed at the weighted average price of all shares of common stock purchased for plan participants within the 30 days after the distribution is declared plus brokerage commissions. The automatic reinvestment of distributions will not release plan participants of any income tax that may be payable on the distribution. Shareholders may terminate their participation in the dividend reinvestment plan by providing written notice to the Plan Agent at least 10 days before any given distribution payment date. Upon termination, we will issue to a shareholder both a certificate for the number of full shares of common stock owned and a check for any fractional shares, valued at the then current market price, less any applicable brokerage commissions and any other costs of sale. There are no additional fees or expenses for participation in the dividend reinvestment plan. Shareholders may obtain additional information about the dividend reinvestment plan by contacting the American Stock Transfer & Trust Company, LLC at 6201 15th Avenue, Brooklyn, NY, 11219.
37
Table of Contents
ISSUER PURCHASES OF EQUITY SECURITIES (1)
| Period |
Total Number of Shares Purchased |
Average Price Paid per Share |
Total Number of Shares Purchased as Part of Publicly Announced Plans or Programs |
Maximum Number of Shares (or Approximate Dollar Value) that May Yet Be Purchased Under the Plans or Programs |
||||||||||||
| November 5 through December 31, 2003 |
10,816 | $ | 9.20 | 10,816 | $ | 9,900,492 | ||||||||||
| January 1 through December 31, 2004 |
952,517 | 9.00 | 952,517 | 11,329,294 | ||||||||||||
| January 1 through December 31, 2005 |
389,900 | 9.26 | 389,900 | 7,720,523 | ||||||||||||
| January 1 through December 31, 2006 |
— | — | — | 7,720,523 | ||||||||||||
| January 1 through December 31, 2007 |
33,200 | 9.84 | 33,200 | 7,393,708 | ||||||||||||
| January 1 through December 31, 2008 |
7,691 | 9.66 | 7,691 | 7,319,397 | ||||||||||||
| January 1 through December 31, 2009 |
— | — | — | 7,319,397 | ||||||||||||
| January 1 through December 31, 2010 |
177,844 | 6.82 | 177,844 | 6,106,354 | ||||||||||||
| January 1 through December 31, 2011 |
8,647 | 9.06 | 8,647 | 6,028,027 | ||||||||||||
| January 1 through December 31, 2012 |
— | — | — | 6,028,027 | ||||||||||||
| January 1 through December 31, 2013 |
— | — | — | 6,028,027 | ||||||||||||
| January 1 through December 31, 2014 |
576,143 | 10.21 | 576,143 | 14,120,043 | ||||||||||||
| January 1 through December 31, 2015 |
413,193 | 7.77 | 413,193 | 24,398,115 | ||||||||||||
|
|
|
|
|
|
|
|||||||||||
| Total |
2,569,951 | 8.97 | 2,569,951 | |||||||||||||
|
|
|
|
|
|
|
|||||||||||
| (1) | We publicly announced our Stock Repurchase Program in a press release dated November 5, 2003, after the Board of Directors approved the repurchase of up to $10,000,000 of our outstanding common stock, which was increased by an additional $10,000,000 authorization on November 3, 2004, which was further increased to a total of $20,000,000 in July 2014, and which was further increased to a total of $26,000,000 in July 2015. The stock repurchase program expires 180 days after the commencement of the purchases. If we have not repurchased the common stock remaining in the repurchase authorization by the end of such period, we are permitted to extend the stock repurchase program for additional 180-day periods until we have repurchased the total amount authorized. In October 2015, we extended the terms of the Stock Repurchase Program. Purchases were to commence no earlier than November 2015 and were to conclude 180 days after the commencement of the purchases. |
38
Table of Contents
ITEM 6. SELECTED FINANCIAL DATA
Summary Consolidated Financial Data
You should read the consolidated financial information below with the Consolidated Financial Statements and Notes thereto for the years ended December 31, 2015, 2014, 2013, 2012, and 2011.
| Year ended December 31, | ||||||||||||||||||||
| (Dollars in thousands, except per share data) |
2015 | 2014 | 2013 | 2012 | 2011 | |||||||||||||||
| Statement of operations |
||||||||||||||||||||
| Investment income |
$ | 42,653 | $ | 41,068 | $ | 34,929 | $ | 32,344 | $ | 37,227 | ||||||||||
| Interest expense |
9,422 | 8,543 | 8,361 | 10,858 | 13,538 | |||||||||||||||
|
|
|
|
|
|
|
|
|
|
|
|||||||||||
| Net interest income |
33,231 | 32,525 | 26,568 | 21,486 | 23,689 | |||||||||||||||
| Noninterest income |
319 | 509 | 1,282 | 1,135 | 1,185 | |||||||||||||||
| Operating expenses |
16,724 | 17,889 | 15,661 | 13,856 | 14,111 | |||||||||||||||
|
|
|
|
|
|
|
|
|
|
|
|||||||||||
| Net investment income before income taxes |
16,826 | 15,145 | 12,189 | 8,765 | 10,763 | |||||||||||||||
| Income tax (provision) benefit |
— | — | — | — | — | |||||||||||||||
|
|
|
|
|
|
|
|
|
|
|
|||||||||||
| Net investment income after income taxes |
16,826 | 15,145 | 12,189 | 8,765 | 10,763 | |||||||||||||||
| Net realized gains (losses) on investments |
7,636 | (5,607 | ) | 692 | (6,731 | ) | (546 | ) | ||||||||||||
| Net change in unrealized appreciation on Medallion Bank and other controlled subsidiaries (1) |
16,830 | 15,643 | 5,060 | 7,896 | 7,668 | |||||||||||||||
| Net change in unrealized appreciation (depreciation) on investments (1) |
(2,295 | ) | 6,412 | 1,020 | 5,077 | (3,002 | ) | |||||||||||||
| Net change in unrealized appreciation on investments other than securities |
(9,621 | ) | (2,901 | ) | 6,815 | 9,510 | 4,280 | |||||||||||||
|
|
|
|
|
|
|
|
|
|
|
|||||||||||
| Net increase in net assets resulting from operations |
$ | 29,376 | $ | 28,692 | $ | 25,776 | $ | 24,517 | $ | 19,163 | ||||||||||
|
|
|
|
|
|
|
|
|
|
|
|||||||||||
| Per share data |
||||||||||||||||||||
| Net investment income |
$ | 0.69 | $ | 0.60 | $ | 0.55 | $ | 0.43 | $ | 0.61 | ||||||||||
| Income tax (provision) benefit |
— | — | — | — | — | |||||||||||||||
| Net realized gains (losses) on investments |
0.31 | (0.22 | ) | 0.03 | (0.33 | ) | (0.03 | ) | ||||||||||||
| Net change in unrealized appreciation on investments (1) |
0.20 | 0.76 | 0.58 | 1.11 | 0.51 | |||||||||||||||
|
|
|
|
|
|
|
|
|
|
|
|||||||||||
| Net increase in net assets resulting from operations |
$ | 1.20 | $ | 1.14 | $ | 1.16 | $ | 1.21 | $ | 1.09 | ||||||||||
|
|
|
|
|
|
|
|
|
|
|
|||||||||||
| Distributions declared per share |
$ | 1.00 | $ | 0.96 | $ | 0.90 | $ | 0.85 | $ | 0.74 | ||||||||||
|
|
|
|
|
|
|
|
|
|
|
|||||||||||
| Weighted average common shares outstanding |
||||||||||||||||||||
| Basic |
24,315,427 | 24,850,496 | 21,850,415 | 19,912,883 | 17,426,097 | |||||||||||||||
| Diluted |
24,391,959 | 25,073,323 | 22,225,783 | 20,180,694 | 17,659,831 | |||||||||||||||
|
|
|
|
|
|
|
|
|
|
|
|||||||||||
| Balance sheet data |
||||||||||||||||||||
| Net investments |
$ | 606,959 | $ | 527,601 | $ | 473,157 | $ | 455,010 | $ | 451,835 | ||||||||||
| Total assets |
689,050 | 632,287 | 595,053 | 543,465 | 537,031 | |||||||||||||||
| Total funds borrowed |
404,540 | 348,795 | 314,958 | 322,770 | 357,779 | |||||||||||||||
| Total liabilities |
410,962 | 357,617 | 321,558 | 327,147 | 365,527 | |||||||||||||||
| Total shareholders’ equity |
278,088 | 274,670 | 273,495 | 216,318 | 171,504 | |||||||||||||||
|
|
|
|
|
|
|
|
|
|
|
|||||||||||
| Managed balance sheet data (2) |
||||||||||||||||||||
| Net investments |
$ | 1,501,555 | $ | 1,310,685 | $ | 1,144,596 | $ | 1,048,635 | $ | 956,626 | ||||||||||
| Total assets |
1,631,118 | 1,469,751 | 1,305,809 | 1,174,124 | 1,080,239 | |||||||||||||||
| Total funds borrowed |
1,313,436 | 1,156,735 | 997,295 | 924,921 | 872,108 | |||||||||||||||
| Total liabilities |
1,353,030 | 1,195,081 | 1,032,314 | 957,806 | 908,735 | |||||||||||||||
39
Table of Contents
| Year ended December 31, | ||||||||||||||||||||
| 2015 | 2014 | 2013 | 2012 | 2011 | ||||||||||||||||
| Selected financial ratios and other data |
||||||||||||||||||||
| Return on average assets (ROA) (3) |
||||||||||||||||||||
| Net investment income after taxes |
2.59 | % | 2.51 | % | 2.19 | % | 1.68 | % | 2.01 | % | ||||||||||
| Net increase in net assets resulting from operations |
4.53 | 4.75 | 4.64 | 4.69 | 3.57 | |||||||||||||||
| Return on average equity (ROE) (4) |
||||||||||||||||||||
| Net investment income after taxes |
6.08 | 5.48 | 5.40 | 4.44 | 6.46 | |||||||||||||||
| Net increase in net assets resulting from operations |
10.61 | 10.39 | 11.42 | 12.41 | 11.49 | |||||||||||||||
|
|
|
|
|
|
|
|
|
|
|
|||||||||||
| Weighted average yield |
7.74 | % | 8.25 | % | 7.60 | % | 7.37 | % | 8.01 | % | ||||||||||
| Weighted average cost of funds |
1.71 | 1.71 | 1.82 | 2.48 | 2.91 | |||||||||||||||
|
|
|
|
|
|
|
|
|
|
|
|||||||||||
| Net interest margin (5) |
6.03 | 6.54 | 5.78 | 4.89 | 5.10 | |||||||||||||||
|
|
|
|
|
|
|
|
|
|
|
|||||||||||
| Noninterest income ratio (6) |
0.06 | 0.10 | 0.28 | 0.26 | 0.26 | |||||||||||||||
| Total expense ratio (7) |
4.75 | 5.31 | 5.23 | 5.63 | 5.95 | |||||||||||||||
| Operating expense ratio (8) |
3.04 | 3.60 | 3.41 | 3.16 | 3.04 | |||||||||||||||
|
|
|
|
|
|
|
|
|
|
|
|||||||||||
| As a percentage of net investment portfolio |
||||||||||||||||||||
| Medallion loans |
51 | % | 59 | % | 63 | % | 65 | % | 68 | % | ||||||||||
| Commercial loans |
14 | 14 | 13 | 12 | 12 | |||||||||||||||
| Investment in Medallion Bank and other controlled subsidiaries |
26 | 26 | 23 | 22 | 19 | |||||||||||||||
| Equity investments |
1 | 1 | 1 | 1 | 1 | |||||||||||||||
| Investment securities |
8 | — | — | — | — | |||||||||||||||
|
|
|
|
|
|
|
|
|
|
|
|||||||||||
| Investments to assets (9) |
88 | % | 83 | % | 80 | % | 84 | % | 84 | % | ||||||||||
| Equity to assets (10) |
40 | 43 | 46 | 40 | 32 | |||||||||||||||
| Debt to equity (11) |
145 | 127 | 115 | 149 | 209 | |||||||||||||||
| (1) | Unrealized appreciation (depreciation) on investments represents the increase (decrease) for the year in the fair value of our investments, including the results of operations for Medallion Bank and other controlled subsidiaries, where applicable. |
| (2) | Includes the balances of wholly-owned, unconsolidated portfolio companies, primarily Medallion Bank. |
| (3) | ROA represents the net investment income after taxes or net increase in net assets resulting from operations, divided by average total assets. |
| (4) | ROE represents the net investment income after taxes or net increase in net assets resulting from operations, divided by average shareholders’ equity. |
| (5) | Net interest margin represents net interest income for the year divided by average interest earning assets, and included interest recoveries and bonuses of $817 in 2015, $4,160 in 2014, $2,326 in 2013, $444 in 2012, and $4,070 in 2011, and also included dividends from Medallion Bank and other controlled subsidiaries of $18,889 in 2015, $15,000 in 2014, $12,000 in 2013, $10,500 in 2012, and $5,500 in 2011. On a managed basis, combined with Medallion Bank, the net interest margin was 6.98%, 7.09%, 6.66%, 6.31%, and 6.68% for 2015, 2014, 2013, 2012, and 2011. |
| (6) | Noninterest income ratio represents noninterest income divided by average interest earning assets. |
| (7) | Total expense ratio represents total expenses (interest expense, operating expenses, and income taxes) divided by average interest earning assets. |
| (8) | Operating expense ratio represents operating expenses divided by average interest earning assets. |
| (9) | Represents net investments divided by total assets as of December 31. |
| (10) | Represents total shareholders’ equity divided by total assets as of December 31. |
| (11) | Represents total funds borrowed divided by total shareholders’ equity as of December 31. |
ITEM 7. MANAGEMENT’S DISCUSSION AND ANALYSIS OF FINANCIAL CONDITION AND RESULTS OF OPERATIONS
The information contained in this section should be read in conjunction with the Consolidated Financial Statements and Notes thereto for the years ended December 31, 2015, 2014, and 2013. In addition, this section contains forward-looking statements. These forward-looking statements are subject to the inherent uncertainties in predicting future results and conditions. Certain factors that could cause actual results and conditions to differ materially from those projected in these forward-looking statements are described in the Risk Factors section on page 21. Additionally, more information about our business activities can be found in “Business”.
CRITICAL ACCOUNTING POLICIES
The SEC has issued cautionary advice regarding disclosure about critical accounting policies. The SEC defines critical accounting policies as those that are both most important to the portrayal of a company’s financial condition and results, and that require management’s most difficult, subjective, or complex judgments, often as a result of the need to make estimates about matters that are inherently uncertain and may change materially in subsequent periods. The preparation of our consolidated financial statements requires estimates and assumptions that affect amounts reported and disclosed in the financial statements and related notes. Significant estimates made by us include valuation of loans, equity investments, and investments in subsidiaries, evaluation of the recoverability of accounts receivable and income tax assets, and the assessment of litigation and other contingencies. The matters that
40
Table of Contents
give rise to such provisions are inherently uncertain and may require complex and subjective judgments. Although we believe that estimates and assumptions used in determining the recorded amounts of net assets and liabilities at December 31, 2015 are reasonable, actual results could differ materially from the estimated amounts recorded in our financial statements.
GENERAL
We are a specialty finance company that has a leading position in originating, acquiring, and servicing loans that finance taxicab medallions and various types of commercial businesses. A wholly-owned portfolio company of ours, Medallion Bank, also originates consumer loans for the purchase of recreational vehicles, boats, motorcycles, and trailers, and to finance small-scale home improvements. Since 1996, the year in which we became a public company, we have increased our taxicab medallion loan portfolio at a compound annual growth rate of 4%, and our commercial loan portfolio at a compound annual growth rate of 4% (9% and 6% on a managed basis when combined with Medallion Bank). Since Medallion Bank acquired a consumer loan portfolio and began originating consumer loans in 2004, it has increased its consumer loan portfolio at a compound annual growth rate of 18%. Total assets under our management and the management of our unconsolidated wholly-owned subsidiaries, which includes our managed net investment portfolio, as well as assets serviced for third party investors, were $1,655,000,000 as of December 31, 2015 and $1,497,000,000 as of December 31, 2014, and have grown at a compound annual growth rate of 11% from $215,000,000 at the end of 1996.
Our loan-related earnings depend primarily on our level of net interest income. Net interest income is the difference between the total yield on our loan portfolio and the average cost of borrowed funds. We fund our operations through a wide variety of interest-bearing sources, such as revolving bank facilities, bank certificates of deposit issued to customers, debentures issued to and guaranteed by the SBA, and bank term debt. Net interest income fluctuates with changes in the yield on our loan portfolio and changes in the cost of borrowed funds, as well as changes in the amount of interest-bearing assets and interest-bearing liabilities held by us. Net interest income is also affected by economic, regulatory, and competitive factors that influence interest rates, loan demand, and the availability of funding to finance our lending activities. We, like other financial institutions, are subject to interest rate risk to the degree that our interest-earning assets reprice on a different basis than our interest-bearing liabilities.
We also provide debt, mezzanine, and equity investment capital to companies in a variety of industries, consistent with our investment objectives. These investments may be venture capital style investments which may not be fully collateralized. Medallion Capital’s investments are typically in the form of secured debt instruments with fixed interest rates accompanied by membership interests and/or warrants to purchase an equity interest for a nominal exercise price (such warrants are included in equity investments on the consolidated balance sheets). Interest income is earned on the debt instruments.
We are a closed-end, management investment company under the 1940 Act. We have elected to be treated as a BDC under the 1940 Act. We have also elected to be treated for federal income tax purposes as a RIC under Subchapter M of the Code. As a RIC, we generally do not have to pay corporate-level federal income taxes on any net ordinary income or capital gains that we distribute to our shareholders as distributions if we meet certain source-of-income and asset diversification requirements. Medallion Bank is not a RIC and must pay corporate-level US federal and state income taxes.
Our wholly-owned portfolio company, Medallion Bank, is a bank regulated by the FDIC and the Utah Department of Financial Institutions which originates taxicab medallion, commercial, and consumer loans, raises deposits, and conducts other banking activities. Medallion Bank generally provides us with our lowest cost of funds which it raises through bank certificates of deposit issued to its customers. To take advantage of this low cost of funds, we refer a portion of our taxicab medallion and commercial loans to Medallion Bank, which then originates these loans. However, the FDIC restricts the amount of taxicab medallion loans that Medallion Bank may finance to three times Tier 1 capital, or $485,814,000 as of December 31, 2015. We earn referral fees for these activities. All of these servicing activities have been assigned to MSC. As a non-investment company, Medallion Bank is not consolidated with the Company.
Realized gains or losses on investments are recognized when the investments are sold or written off. The realized gains or losses represent the difference between the proceeds received from the disposition of portfolio assets, if any, and the cost of such portfolio assets. In addition, changes in unrealized appreciation or depreciation on investments are recorded and represent the net change in the estimated fair values of the portfolio assets at the end of the period as compared with their estimated fair values at the beginning of the period. Generally, realized gains (losses) on investments and changes in unrealized appreciation (depreciation) on investments are inversely related. When an appreciated asset is sold to realize a gain, a decrease in the previously recorded unrealized appreciation occurs. Conversely, when a loss previously recorded as unrealized depreciation is realized by the sale or other disposition of a depreciated portfolio asset, the reclassification of the loss from unrealized to realized causes a decrease in net unrealized depreciation and an increase in realized loss.
41
Table of Contents
Our investment in Medallion Bank, as a wholly owned portfolio investment, is also subject to quarterly assessments of fair value. We conduct a thorough valuation analysis as described previously, and determine whether any factors give rise to a valuation different than recorded book value, including various regulatory restrictions that were established at Medallion Bank’s inception, by the FDIC and State of Utah, and also by additional marketplace restrictions, such as the ability to transfer industrial bank charters. Because of these restrictions and other factors, our Board of Directors had previously determined that Medallion Bank had little value beyond its recorded book value. As a result of this valuation process, we had previously used Medallion Bank’s actual results of operations as the best estimate of changes in fair value, and recorded the results as a component of unrealized appreciation (depreciation) on investments. In the second quarter of 2015, we became aware of external interest in Medallion Bank and its portfolio assets at values in excess of their book value. We incorporated these new factors in the Medallion Bank fair value analysis, and the Board of Directors determined that Medallion Bank had a fair value in excess of book value. We also engaged a valuation specialist to assist the Board of Directors in its determination of Medallion Bank’s fair value, and this appreciation of $15,500,000 was thereby recorded in 2015 as a component of unrealized appreciation (depreciation) on investments, in addition to Medallion Bank’s actual results of operations for the year ended December 31, 2015.
42
Table of Contents
Trends in Investment Portfolio
Our investment income is driven by the principal amount of and yields on our investment portfolio. To identify trends in the balances and yields, the following table illustrates our investments at fair value, grouped by medallion loans, commercial loans, equity investments, and investment securities, and also presents the portfolio information for Medallion Bank, at the dates indicated.
| December 31, 2015 | December 31, 2014 | December 31, 2013 | ||||||||||||||||||||||
| Interest | Investment | Interest | Investment | Interest | Investment | |||||||||||||||||||
| (Dollars in thousands) |
Rate (1) | Balances | Rate (1) | Balances | Rate (1) | Balances | ||||||||||||||||||
| Medallion loans |
||||||||||||||||||||||||
| New York |
3.72 | % | $ | 213,356 | 3.60 | % | $ | 213,099 | 3.52 | % | $ | 202,954 | ||||||||||||
| Chicago |
4.87 | 39,406 | 4.97 | 39,280 | 4.94 | 42,175 | ||||||||||||||||||
| Boston |
4.63 | 26,436 | 4.69 | 27,277 | 4.91 | 23,622 | ||||||||||||||||||
| Newark |
5.26 | 24,585 | 5.28 | 25,043 | 5.58 | 21,681 | ||||||||||||||||||
| Cambridge |
4.64 | 6,607 | 4.80 | 6,006 | 5.06 | 6,008 | ||||||||||||||||||
| Other |
7.27 | 1,043 | 6.59 | 814 | 6.52 | 1,178 | ||||||||||||||||||
|
|
|
|
|
|
|
|||||||||||||||||||
| Total medallion loans |
4.09 | 311,433 | 4.03 | 311,519 | 4.02 | 297,618 | ||||||||||||||||||
|
|
|
|
|
|
|
|||||||||||||||||||
| Deferred loan acquisition costs |
413 | 375 | 243 | |||||||||||||||||||||
| Unrealized depreciation on loans |
(3,438 | ) | — | — | ||||||||||||||||||||
|
|
|
|
|
|
|
|||||||||||||||||||
| Net medallion loans |
$ | 308,408 | $ | 311,894 | $ | 297,861 | ||||||||||||||||||
|
|
|
|
|
|
|
|||||||||||||||||||
| Commercial loans |
||||||||||||||||||||||||
| Secured mezzanine |
13.59 | % | $ | 67,849 | 12.88 | % | $ | 55,059 | 11.69 | % | $ | 46,100 | ||||||||||||
| Asset based |
5.82 | 3,750 | 5.82 | 3,633 | 5.32 | 7,803 | ||||||||||||||||||
| Other secured commercial |
10.68 | 12,622 | 9.91 | 15,506 | 9.89 | 13,336 | ||||||||||||||||||
|
|
|
|
|
|
|
|||||||||||||||||||
| Total commercial loans |
12.80 | 84,221 | 11.91 | 74,198 | 10.60 | 67,239 | ||||||||||||||||||
|
|
|
|
|
|
|
|||||||||||||||||||
| Deferred loan acquisition income |
(87 | ) | (100 | ) | (79 | ) | ||||||||||||||||||
| Unrealized depreciation on loans |
(2,239 | ) | (2,949 | ) | (6,992 | ) | ||||||||||||||||||
|
|
|
|
|
|
|
|||||||||||||||||||
| Net commercial loans |
$ | 81,895 | $ | 71,149 | $ | 60,168 | ||||||||||||||||||
|
|
|
|
|
|
|
|||||||||||||||||||
| Investment in Medallion Bank and other controlled subsidiaries, net |
12.74 | % | $ | 141,273 | 11.44 | % | $ | 131,150 | 11.13 | % | $ | 107,809 | ||||||||||||
|
|
|
|||||||||||||||||||||||
| Unrealized appreciation on subsidiary investments |
18,640 | 5,698 | 814 | |||||||||||||||||||||
|
|
|
|
|
|
|
|||||||||||||||||||
| Investment in Medallion Bank and other controlled subsidiaries |
$ | 159,913 | $ | 136,848 | $ | 108,623 | ||||||||||||||||||
|
|
|
|
|
|
|
|||||||||||||||||||
| Equity investments |
0.72 | % | $ | 4,277 | 0.86 | % | $ | 6,102 | 0.86 | % | $ | 6,124 | ||||||||||||
|
|
|
|
|
|
|
|||||||||||||||||||
| Unrealized appreciation on equities |
2,582 | 1,608 | 381 | |||||||||||||||||||||
|
|
|
|
|
|
|
|||||||||||||||||||
| Net equity investments |
$ | 6,859 | $ | 7,710 | $ | 6,505 | ||||||||||||||||||
|
|
|
|
|
|
|
|||||||||||||||||||
| Investment securities |
0.35 | % | $ | 49,902 | — | % | $ | — | — | % | $ | — | ||||||||||||
|
|
|
|
|
|
|
|||||||||||||||||||
| Unrealized depreciation on investment securities |
(18 | ) | — | — | ||||||||||||||||||||
|
|
|
|
|
|
|
|||||||||||||||||||
| Net investment securities |
$ | 49,884 | $ | — | $ | — | ||||||||||||||||||
|
|
|
|
|
|
|
|||||||||||||||||||
| Investments at cost (2) |
7.06 | % | $ | 591,106 | 6.97 | % | $ | 522,969 | 6.51 | % | $ | 478,790 | ||||||||||||
|
|
|
|
|
|
|
|||||||||||||||||||
| Deferred loan acquisition costs |
326 | 275 | 164 | |||||||||||||||||||||
| Unrealized appreciation on controlled subsidiaries, equity investments, and investment securities |
21,204 | 7,306 | 1,195 | |||||||||||||||||||||
| Unrealized depreciation on loans |
(5,677 | ) | (2,949 | ) | (6,992 | ) | ||||||||||||||||||
|
|
|
|
|
|
|
|||||||||||||||||||
| Net investments |
$ | 606,959 | $ | 527,601 | $ | 473,157 | ||||||||||||||||||
|
|
|
|
|
|
|
|||||||||||||||||||
| Medallion Bank investments |
||||||||||||||||||||||||
| Consumer loans |
14.06 | % | $ | 626,132 | 14.71 | % | $ | 478,027 | 15.67 | % | $ | 353,355 | ||||||||||||
| Medallion loans |
3.84 | 338,285 | 3.84 | 366,397 | 3.77 | 349,015 | ||||||||||||||||||
| Commercial loans |
5.23 | 44,634 | 4.68 | 44,499 | 4.91 | 53,786 | ||||||||||||||||||
| Investment securities |
2.30 | 35,713 | 2.53 | 27,376 | 2.47 | 24,925 | ||||||||||||||||||
|
|
|
|
|
|
|
|||||||||||||||||||
| Medallion Bank investments at cost (2) |
9.97 | 1,044,764 | 9.51 | 916,299 | 9.19 | 781,081 | ||||||||||||||||||
|
|
|
|
|
|
|
|||||||||||||||||||
| Deferred loan acquisition costs |
11,400 | 9,937 | 9,553 | |||||||||||||||||||||
| Unrealized depreciation on investment securities |
(501 | ) | 252 | (803 | ) | |||||||||||||||||||
| Premiums paid on purchased securities |
311 | 272 | 342 | |||||||||||||||||||||
| Unrealized depreciation on loans |
(24,081 | ) | (17,797 | ) | (16,434 | ) | ||||||||||||||||||
|
|
|
|
|
|
|
|||||||||||||||||||
| Medallion Bank net investments |
$ | 1,031,893 | $ | 908,963 | $ | 773,739 | ||||||||||||||||||
|
|
|
|
|
|
|
|||||||||||||||||||
| (1) | Represents the weighted average interest or dividend rate of the respective portfolio as of the date indicated. |
| (2) | The weighted average interest rate for the entire managed loan portfolio (medallion, commercial, and consumer loans) was 9.03%, 8.46%, and 8.05% at December 31, 2015, 2014, and 2013. |
43
Table of Contents
PORTFOLIO SUMMARY
Total Portfolio Yield
The weighted average yield (which is calculated by dividing the aggregate yield of each investment in the portfolio by the aggregate portfolio balance and does not include expenses and sales load for any offering) of the total portfolio at December 31, 2015 was 7.06% (5.95% for the loan portfolio), an increase of 9 basis points from 6.97% at December 31, 2014, which was an increase of 46 basis points from 6.51% at December 31, 2013. The weighted average yield of the total managed portfolio at December 31, 2015 was 8.53% (9.03% for the loan portfolio), an increase of 26 basis points from 8.27% at December 31, 2014, which was an increase of 42 basis points from 7.85% at December 31, 2013. The increase from 2015 was attributed to increased yields on most of our investment categories.
Medallion Loan Portfolio
Our medallion loans comprised 51% of the net portfolio of $606,959,000 at December 31, 2015, compared to 59% of the net portfolio of $527,601,000 at December 31, 2014, and 63% of $473,157,000 at December 31, 2013. Our managed medallion loans of $640,904,000 comprised 43% of the net managed portfolio of $1,501,555,000 at December 31, 2015, compared to 52% the net managed portfolio of $1,310,685,000 at December 31, 2014, and 56% of $1,144,596,000 at December 31, 2013. The medallion loan portfolio decreased by $3,486,000 or 1% in 2015 (and decreased by $36,251,000 or 5% on a managed basis), primarily reflecting increases in valuation reserves reflecting current market conditions. The decrease in the managed portfolio reflected the above and portfolio decreases in the New York and Chicago markets, reflecting management’s decision to cull weaker and less profitable borrowers from the portfolio. Total medallion loans serviced for third parties were $26,959,000, $27,658,000, and $24,875,000 at December 31, 2015, 2014, and 2013.
The weighted average yield of the medallion loan portfolio at December 31, 2015 was 4.09%, an increase of 6 basis points from 4.03% at December 31, 2014, which was an increase of 1 basis point from 4.02% at December 31, 2013. The weighted average yield of the managed medallion loan portfolio at December 31, 2015 was 3.96%, an increase of 3 basis points from 3.93% at December 31, 2014, which was an increase of 4 basis points from 3.89% at December 31, 2013. The slight changes in 2015 reflected our increasing rates as loans refinance. At December 31, 2015, 31% of the medallion loan portfolio represented loans outside New York, compared to 32% at year-end 2014 and 2013. At December 31, 2015, 26% of the managed medallion loan portfolio represented loans outside New York, compared to 26% at year-end 2014 and 2013. We continue to focus our efforts on originating higher yielding medallion loans outside the New York market.
Commercial Loan Portfolio
Our commercial loans represented 14% of the net investment portfolio as of December 31, 2015, compared to 14% and 13% at December 31, 2014 and 2013, and were 8%, 9%, and 10% on a managed basis. Commercial loans increased by $10,746,000 or 15% during 2015 (increased by $11,478,000 or 10% on a managed basis), primarily reflecting growth in the high-yield mezzanine portfolio, partially offset by a decrease in the other secured commercial loan portfolio, and in the managed portfolio, also by an increase in asset-based loan participations purchased. Net commercial loans serviced by third parties were $3,419,000, $118,000, and $255,000 at December 31, 2015, 2014, and 2013.
The weighted average yield of the commercial loan portfolio at December 31, 2015 was 12.80%, an increase of 89 basis points from 11.91% at December 31, 2014, which was an increase of 131 basis points from 10.60% at December 31, 2013. The weighted average yield of the managed commercial loan portfolio at December 31, 2015 was 10.18%, an increase of 98 basis points from 9.20% at December 31, 2014, which was an increase of 113 basis points from 8.07% at December 31, 2013. The increases primarily represented the greater proportion of higher yielding mezzanine loans in the portfolio. We continue to originate adjustable-rate and floating-rate loans tied to the prime rate to help mitigate our interest rate risk in a rising interest rate environment. At December 31, 2015, variable-rate loans represented 9% of the commercial portfolio, compared to 6% and 12% at December 31, 2014 and 2013, and were 38%, 38%, and 49% on a managed basis. Although this strategy initially produces a lower yield, we believe that this strategy mitigates interest rate risk by better matching our earning assets to their adjustable-rate funding sources.
Consumer Loan Portfolio
Our managed consumer loans, all of which are held in the portfolio managed by Medallion Bank, represented 41% of the managed net investment portfolio as of December 31, 2015, compared to 36% and 31% at December 31, 2014 and 2013. Medallion Bank originates adjustable rate consumer loans secured by recreational vehicles, boats, motorcycles, trailers and home improvements located in all 50 states. The portfolio is serviced by a third party subsidiary of a major commercial bank.
44
Table of Contents
The weighted average gross yield of the managed consumer loan portfolio was 14.06% at December 31, 2015, compared to 14.71% and 15.67% at December 31, 2014 and 2013. The decreases primarily reflected the change in portfolio mix to include a higher proportion of lower-yielding home improvement loans. Adjustable rate loans represented 20% of the managed consumer portfolio at December 31, 2015, compared to 37% and 68% at December 31, 2014 and 2013.
Delinquency and Loan Loss Experience
We generally follow a practice of discontinuing the accrual of interest income on our loans that are in arrears as to payments for a period of 90 days or more. We deliver a default notice and begin foreclosure and liquidation proceedings when management determines that pursuit of these remedies is the most appropriate course of action under the circumstances. A loan is considered to be delinquent if the borrower fails to make a payment on time; however, during the course of discussion on delinquent status, we may agree to modify the payment terms of the loan with a borrower that cannot make payments in accordance with the original loan agreement. For loan modifications, the loan will only be returned to accrual status if all past due interest and principal payments are brought fully current. For credit that is collateral based, we evaluate the anticipated net residual value we would receive upon foreclosure of such loans, if necessary. There can be no assurance, however, that the collateral securing these loans will be adequate in the event of foreclosure. For credit that is cash flow-based, we assess our collateral position, and evaluate most of these relationships as ongoing businesses, expecting to locate and install a new operator to run the business and reduce the debt.
For the consumer loan portfolio, the process to repossess the collateral is started at 60 days past due. If the collateral is not located and the account reaches 120 days delinquent, the account is charged off to realized losses. If the collateral is repossessed, a realized loss is recorded to write the collateral down to its net realizable value, and the collateral is sent to auction. When the collateral is sold, the net auction proceeds are applied to the account, and any remaining balance is written off as a realized loss, and any excess proceeds are recorded as a realized gain. Proceeds collected on charged off accounts are recorded as realized gains. All collection, repossession, and recovery efforts are handled on behalf of Medallion Bank by the servicer.
The following table shows the trend in loans 90 days or more past due as of December 31.
| 2015 | 2014 | 2013 | ||||||||||||||||||||||
| (Dollars in thousands) |
Amount | %(1) | Amount | %(1) | Amount | %(1) | ||||||||||||||||||
| Medallion loans |
$ | 11,880 | 3.0 | % | $ | — | 0.0 | % | $ | — | 0.0 | % | ||||||||||||
|
|
|
|
|
|
|
|
|
|
|
|
|
|||||||||||||
| Commercial loans |
||||||||||||||||||||||||
| Secured mezzanine |
1,390 | 0.4 | 1,391 | 0.3 | 2,018 | 0.6 | ||||||||||||||||||
| Asset-based |
— | 0.0 | 303 | 0.1 | 494 | 0.1 | ||||||||||||||||||
| Other secured commercial |
945 | 0.2 | — | 0.0 | — | 0.0 | ||||||||||||||||||
|
|
|
|
|
|
|
|
|
|
|
|
|
|||||||||||||
| Total commercial loans |
2,335 | 0.6 | 1,694 | 0.4 | 2,512 | 0.7 | ||||||||||||||||||
|
|
|
|
|
|
|
|
|
|
|
|
|
|||||||||||||
| Total loans 90 days or more past due |
$ | 14,215 | 3.6 | % | $ | 1,694 | 0.4 | % | $ | 2,512 | 0.7 | % | ||||||||||||
|
|
|
|
|
|
|
|
|
|
|
|
|
|||||||||||||
| Total Medallion Bank loans |
$ | 17,154 | 1.7 | % | $ | 3,113 | 0.4 | % | $ | 3,817 | 0.5 | % | ||||||||||||
|
|
|
|
|
|
|
|
|
|
|
|
|
|||||||||||||
| Total managed loans 90 days or more past due |
$ | 31,369 | 2.2 | % | $ | 4,807 | 0.4 | % | $ | 6,329 | 0.6 | % | ||||||||||||
|
|
|
|
|
|
|
|
|
|
|
|
|
|||||||||||||
| (1) | Percentages are calculated against the total or managed loan portfolio, as appropriate. |
A third party finance company sold various participations in asset based loans to Medallion Business Credit and Medallion Bank. In April 2013, the aggregate balance of the participations was approximately $13.8 million, $12.9 million of which were held by Medallion Bank. That amount was divided between seven separate borrowers operating in a variety of industries. In April 2013, the third party finance company became the subject of an involuntary bankruptcy petition filed by its bank lenders. Among other things, the bank lenders alleged that the third party finance company fraudulently misrepresented its borrowing availability under its credit facility with the bank lenders and are seeking the third party finance company’s liquidation. In May 2013, the bankruptcy court presiding over the third party finance company’s case entered an order converting the involuntary chapter 7 case to a chapter 11 case. We and Medallion Bank have placed these loans on nonaccrual, and reversed interest income. In addition, we have established valuation allowances against the outstanding balances. On May 31, 2013, we commenced an adverse proceeding against the third party finance company and the bank lenders seeking declaratory judgment that our loan participations are true participations and not subject to the bankruptcy estate or to the bank lender’s security interest in the third party finance company’s assets. The third party finance company and bank lenders are contesting our position. In April 2014, we and Medallion Bank received a decision from the
45
Table of Contents
court granting summary judgment in our favor with respect to the issue of whether our loan participations are true participations. In March 2015, we and Medallion Bank received a decision from the court finding that the bank lenders generally held a first lien on our and Medallion Bank’s loan participations subject to, among other things, defenses still pending prosecution by the parties and adjudication by the court. We and Medallion Bank are appealing the decision. The remaining issues are still being litigated. Although we believe the claims raised by the third party finance company and the bank lenders are without merit and will vigorously defend against them, we cannot at this time predict the outcome of this litigation or determine our potential exposure. At December 31, 2015, five of the seven secured borrowers had refinanced their loans in full with third parties, and the related proceeds are held in escrow pending resolution of the bankruptcy proceedings. In September 2015, one loan was sold at a discount to a third party, and the related proceeds are held in escrow pending resolution of the bankruptcy proceedings. One loan was charged off in September 2014. The balances related to the paid off loans have been reclassified to other assets on the consolidated balance sheet. The table below summarizes these receivables and their status with the Company and Medallion Bank.
| (Dollars in thousands) |
The Company | Medallion Bank | Total | |||||||||
| Loans outstanding |
$ | 258 | $ | 1,953 | $ | 2,211 | ||||||
| Loans charged off (1) |
(258 | ) | (1,953 | ) | (2,211 | ) | ||||||
| Valuation allowance |
— | — | — | |||||||||
|
|
|
|
|
|
|
|||||||
| Net loans outstanding |
— | — | — | |||||||||
|
|
|
|
|
|
|
|||||||
| Other receivables |
590 | 11,062 | 11,652 | |||||||||
| Valuation allowance |
(236 | ) | (4,425 | ) | (4,661 | ) | ||||||
|
|
|
|
|
|
|
|||||||
| Net other receivables |
354 | 6,637 | 6,991 | |||||||||
| Total net outstanding |
354 | 6,637 | 6,991 | |||||||||
|
|
|
|
|
|
|
|||||||
| Income foregone in 2015 |
16 | 24 | 40 | |||||||||
| Total income foregone |
$ | 74 | $ | 108 | $ | 182 | ||||||
|
|
|
|
|
|
|
|||||||
| (1) | The income foregone on the charged off loan was $99 for the Company and $213 for Medallion Bank. |
The increase in medallion loan delinquencies reflected our borrowers experiencing declining cash flows with competitive car sharing services and decreases in medallion values stressing certain borrowers, all of whom we continue to work with, and for whom we continue to provide short term solutions. Secured mezzanine delinquencies decreased as a result of a borrower’s bankruptcy settlement. Asset based delinquencies decreased due to loan chargeoffs. Other secured commercial delinquencies increased reflecting several borrowers in the process of selling their businesses, and not having adequate cash flows for monthly payments. Medallion Bank delinquencies increased from a year ago due to a weaker portfolio performance attributed to the increase in medallion loan delinquencies. We are actively working with each delinquent borrower/obligor to bring them current, and believe that any potential loss exposure is reflected in our mark-to-market estimates on each investment. Although there can be no assurances as to changes in the trend rate and further negative changes in the economy, management believes that any loss exposures are properly reflected in reported asset values.
We monitor delinquent loans for possible exposure to loss by analyzing various factors, including the value of the collateral securing the loan and the borrower’s prior payment history. Under the 1940 Act, our loan portfolio must be recorded at fair value or “marked-to-market.” Unlike other lending institutions, we are not permitted to establish reserves for loan losses. Instead, the valuation of our portfolio is adjusted quarterly to reflect our estimate of the current realizable value of our loan portfolio. Since no ready market exists for this portfolio, fair value is subject to the good faith determination of our Board of Directors. Because of the subjectivity of these estimates, there can be no assurance that in the event of a foreclosure or the sale of portfolio loans we would be able to recover the amounts reflected on our balance sheet. For more information, see “Risk Factors—Risks Relating to Our Business and Structure—Our investment portfolio is, and will continue to be, recorded at fair value as determined in good faith by our Board of Directors and, as a result, there is, and will continue to be, uncertainty as to the value of our portfolio investments which could adversely affect our net asset value.”
In determining the value of our portfolio, the Board of Directors may take into consideration various factors such as the financial condition of the borrower and the adequacy of the collateral. For example, in a period of sustained increases in market interest rates, the Board of Directors could decrease its valuation of the portfolio if the portfolio consists primarily of long-term, fixed-rate loans. Our valuation procedures are designed to generate values that approximate that which would have been established by market forces, and are therefore subject to uncertainties and variations from reported results. Based upon these factors, net unrealized appreciation or depreciation on investments is determined, based on the fluctuations of our estimate of the current realizable value of our portfolio from our cost basis.
46
Table of Contents
The following table sets forth the changes in our unrealized appreciation (depreciation) on investments, for the years ended December 31, 2015, 2014, and 2013.
| (Dollars in thousands) |
Medallion Loans |
Commercial Loans |
Investment in Subsidiaries |
Equity Investments |
Investment Securities |
Investments Other Than Securities |
Total | |||||||||||||||||||||
| Balance December 31, 2012 |
$ | — | ($ | 7,844 | ) | $ | — | $ | 44 | $ | — | $ | 33,757 | $ | 25,957 | |||||||||||||
| Net change in unrealized |
||||||||||||||||||||||||||||
| Appreciation on investments |
— | — | 814 | 820 | — | 6,815 | 8,449 | |||||||||||||||||||||
| Depreciation on investments |
— | (129 | ) | — | (376 | ) | — | (56 | ) | (561 | ) | |||||||||||||||||
| Reversal of unrealized appreciation (depreciation) related to realized |
||||||||||||||||||||||||||||
| Gains on investments |
— | — | — | — | — | — | — | |||||||||||||||||||||
| Losses on investments |
— | 397 | — | 365 | — | — | 762 | |||||||||||||||||||||
| Other |
— | 584 | — | (472 | ) | — | (112 | ) | — | |||||||||||||||||||
|
|
|
|
|
|
|
|
|
|
|
|
|
|
|
|||||||||||||||
| Balance December 31, 2013 |
— | (6,992 | ) | 814 | 381 | — | 40,404 | 34,607 | ||||||||||||||||||||
| Net change in unrealized |
||||||||||||||||||||||||||||
| Appreciation on investments |
— | — | 4,884 | 195 | — | (2,900 | ) | 2,179 | ||||||||||||||||||||
| Depreciation on investments |
— | (1,365 | ) | — | 358 | — | 1,141 | 134 | ||||||||||||||||||||
| Reversal of unrealized appreciation (depreciation) related to realized |
||||||||||||||||||||||||||||
| Gains on investments |
— | — | — | — | — | — | — | |||||||||||||||||||||
| Losses on investments |
— | 5,408 | — | 674 | — | — | 6,082 | |||||||||||||||||||||
|
|
|
|
|
|
|
|
|
|
|
|
|
|
|
|||||||||||||||
| Balance December 31, 2014 |
— | (2,949 | ) | 5,698 | 1,608 | — | 38,645 | 43,002 | ||||||||||||||||||||
| Net change in unrealized |
||||||||||||||||||||||||||||
| Appreciation on investments |
— | — | 18,132 | 1,141 | — | (9,621 | ) | 9,652 | ||||||||||||||||||||
| Depreciation on investments |
(3,568 | ) | (176 | ) | 586 | (1,426 | ) | (18 | ) | (68 | ) | (4,670 | ) | |||||||||||||||
| Reversal of unrealized appreciation (depreciation) related to realized |
||||||||||||||||||||||||||||
| Gains on investments |
— | — | (4,809 | ) | (9 | ) | — | — | (4,818 | ) | ||||||||||||||||||
| Losses on investments |
130 | 886 | — | 301 | — | 1,317 | ||||||||||||||||||||||
| Other (1) |
— | — | (967 | ) | 967 | — | — | — | ||||||||||||||||||||
|
|
|
|
|
|
|
|
|
|
|
|
|
|
|
|||||||||||||||
| Balance December 31, 2015 |
($ | 3,438 | ) | ($ | 2,239 | ) | $ | 18,640 | $ | 2,582 | ($ | 18 | ) | $ | 28,956 | $ | 44,483 | |||||||||||
|
|
|
|
|
|
|
|
|
|
|
|
|
|
|
|||||||||||||||
| (1) | Reclassification of Medallion Motorsports from equity investments to controlled subsidiaries. |
The following table presents credit-related information for the investment portfolios as of December 31.
| (Dollars in thousands) |
2015 | 2014 | 2013 | |||||||||
| Total loans |
||||||||||||
| Medallion loans |
$ | 308,408 | $ | 311,894 | $ | 297,861 | ||||||
| Commercial loans |
81,895 | 71,149 | 60,168 | |||||||||
|
|
|
|
|
|
|
|||||||
| Total loans |
390,303 | 383,043 | 358,029 | |||||||||
| Investment in Medallion Bank and other controlled subsidiaries |
159,913 | 136,848 | 108,623 | |||||||||
| Equity investments (1) |
6,859 | 7,710 | 6,505 | |||||||||
| Investment securities |
49,884 | — | — | |||||||||
|
|
|
|
|
|
|
|||||||
| Net investments |
$ | 606,959 | $ | 527,601 | $ | 473,157 | ||||||
|
|
|
|
|
|
|
|||||||
| Net investments at Medallion Bank and other controlled subsidiaries |
$ | 1,031,893 | $ | 908,963 | $ | 773,739 | ||||||
| Managed net investments |
$ | 1,501,555 | $ | 1,310,685 | $ | 1,144,596 | ||||||
|
|
|
|
|
|
|
|||||||
| Unrealized appreciation (depreciation) on investments |
||||||||||||
| Medallion loans |
($ | 3,438 | ) | $ | — | $ | — | |||||
| Commercial loans |
(2,239 | ) | (2,949 | ) | (6,992 | ) | ||||||
|
|
|
|
|
|
|
|||||||
| Total loans |
(5,677 | ) | (2,949 | ) | (6,992 | ) | ||||||
| Investment in Medallion Bank and other controlled subsidiaries |
18,640 | 5,698 | 814 | |||||||||
| Equity investments |
2,582 | 1,608 | 381 | |||||||||
| Investment securities |
(18 | ) | — | — | ||||||||
|
|
|
|
|
|
|
|||||||
| Total unrealized appreciation (depreciation) on investments |
$ | 15,527 | $ | 4,357 | ($ | 5,797 | ) | |||||
|
|
|
|
|
|
|
|||||||
| Net unrealized depreciation on investments at Medallion Bank and other controlled subsidiaries |
($ | 24,582 | ) | ($ | 17,545 | ) | ($ | 17,237 | ) | |||
| Managed total unrealized depreciation on investments |
($ | 9,055 | ) | ($ | 13,188 | ) | ($ | 23,034 | ) | |||
|
|
|
|
|
|
|
|||||||
| Unrealized appreciation (depreciation) as a % of balances outstanding (2) |
||||||||||||
| Medallion loans |
(1.10 | %) | — | % | — | % | ||||||
| Commercial loans |
(2.66 | ) | (3.97 | ) | (10.40 | ) | ||||||
| Total loans |
(1.43 | ) | (0.76 | ) | (1.92 | ) | ||||||
| Investment in Medallion Bank and other controlled subsidiaries |
13.19 | 4.34 | 0.75 | |||||||||
| Equity investments |
60.39 | 26.35 | 6.22 | |||||||||
| Investment securities |
— | — | — | |||||||||
| Net investments |
2.63 | 0.83 | (1.21 | ) | ||||||||
|
|
|
|
|
|
|
|||||||
| Net investments at Medallion Bank and other controlled subsidiaries |
(2.35 | %) | (1.91 | %) | (2.21 | %) | ||||||
| Managed net investments |
(0.60 | %) | (1.00 | %) | (1.99 | %) | ||||||
| (1) | Represents common stock, warrants, preferred stocks, and limited partnership interests held as investments. |
| (2) | Unlike other lending institutions, we are not permitted to establish reserves for loan losses. Instead, the valuation of our portfolio is adjusted quarterly to reflect estimates of the current realizable value of the investment portfolio. These percentages represent the discount or premium that investments are carried on the books at, relative to their par or gross value. |
47
Table of Contents
The following table presents the gain/loss experience on the investment portfolio for the years ended December 31, 2015, 2014, and 2013.
| (Dollars in thousands) |
2015 | 2014 | 2013 | |||||||||
| Realized gains (losses) on loans and equity investments |
||||||||||||
| Medallion loans |
($ | 140 | ) | $ | — | $ | 40 | |||||
| Commercial loans |
(946 | ) | (4,983 | ) | 1,017 | |||||||
|
|
|
|
|
|
|
|||||||
| Total loans |
(1,086 | ) | (4,983 | ) | 1,057 | |||||||
| Investment in Medallion Bank and other controlled subsidiaries |
8,108 | — | — | |||||||||
| Equity investments |
614 | (624 | ) | (365 | ) | |||||||
| Investment securities |
— | — | — | |||||||||
|
|
|
|
|
|
|
|||||||
| Total realized gains (losses) on loans and equity investments |
$ | 7,636 | ($ | 5,607 | ) | $ | 692 | |||||
|
|
|
|
|
|
|
|||||||
| Net realized losses on investments at Medallion Bank and other controlled subsidiaries |
(10,388 | ) | (6,682 | ) | (5,855 | ) | ||||||
|
|
|
|
|
|
|
|||||||
| Total managed realized gains (losses) on loans and equity investments |
($ | 2,752 | ) | ($ | 12,289 | ) | ($ | 5,163 | ) | |||
|
|
|
|
|
|
|
|||||||
| Realized gains (losses) as a % of average balances outstanding |
||||||||||||
| Medallion loans |
(0.04 | %) | — | % | 0.01 | % | ||||||
| Commercial loans |
(1.23 | ) | (7.30 | ) | 1.48 | |||||||
| Total loans |
(0.28 | ) | (1.33 | ) | 0.29 | |||||||
| Investment in Medallion Bank and other controlled subsidiaries |
6.07 | — | — | |||||||||
| Equity investments |
10.87 | (10.51 | ) | (7.01 | ) | |||||||
| Investment securities |
— | — | — | |||||||||
| Net investments |
1.40 | (1.11 | ) | 0.15 | ||||||||
|
|
|
|
|
|
|
|||||||
| Net investments at Medallion Bank and other controlled subsidiaries |
(1.06 | %) | (0.77 | %) | (0.79 | %) | ||||||
| Managed net investments |
(0.20 | %) | (0.98 | %) | (0.46 | %) | ||||||
The table below summarizes components of unrealized and realized gains and losses in the investment portfolio for the years ended December 31, 2015, 2014, and 2013.
| (Dollars in thousands) |
2015 | 2014 | 2013 | |||||||||
| Net change in unrealized appreciation (depreciation) on investments |
||||||||||||
| Unrealized appreciation |
$ | 288 | $ | 553 | $ | 820 | ||||||
| Unrealized depreciation |
(3,822 | ) | (1,365 | ) | (506 | ) | ||||||
| Net unrealized appreciation on investment in Medallion Bank and other controlled subsidiaries |
21,638 | 15,643 | 5,060 | |||||||||
| Realized gains |
(4,818 | ) | — | — | ||||||||
| Realized losses |
1,317 | 6,082 | 762 | |||||||||
| Net unrealized gains (losses) on investments other than securities and other assets |
(9,689 | ) | (1,759 | ) | 6,759 | |||||||
|
|
|
|
|
|
|
|||||||
| Total |
$ | 4,914 | $ | 19,154 | $ | 12,895 | ||||||
|
|
|
|
|
|
|
|||||||
| Net realized gains (losses) on investments |
||||||||||||
| Realized gains |
$ | 4,818 | $ | — | $ | — | ||||||
| Realized losses |
(1,317 | ) | (6,082 | ) | (762 | ) | ||||||
| Other gains |
4,261 | 434 | 1,368 | |||||||||
| Direct recoveries (chargeoffs) |
(126 | ) | 41 | 86 | ||||||||
| Realized losses on investments other than securities and other assets |
— | — | — | |||||||||
|
|
|
|
|
|
|
|||||||
| Total |
$ | 7,636 | ($ | 5,607 | ) | $ | 692 | |||||
|
|
|
|
|
|
|
|||||||
Investment in Medallion Bank and Other Controlled Subsidiaries
Investment in Medallion Bank and other controlled subsidiaries were 26%, 26%, and 23% of our total portfolio at December 31, 2015, 2014, and 2013. The portfolio company investments primarily represent the wholly-owned unconsolidated subsidiaries of ours, substantially all of which is represented by our investment in Medallion Bank, a non-pass-through, taxpaying entity. In addition, to facilitate maintenance of Medallion Bank’s capital ratio requirement and to provide the necessary capital for continued growth, we periodically make capital contributions to Medallion Bank, including $8,000,000 and $10,000,000 in 2015 and 2014. Separately, Medallion Bank declared dividends to us of $18,000,000 in 2015, $15,000,000 in 2014, and $12,000,000 in 2013. See Note 3 of the consolidated financial statements for additional information about these investments.
48
Table of Contents
Equity Investments
Equity investments were 1% of our total portfolio at December 31, 2015, 2014, and 2013. Equity investments were less than 1%, 1%, and 1% of our total managed portfolio at December 31, 2015, 2014, and 2013. Equity investments are comprised of common stock, warrants, preferred stock, and limited partnership interests.
Investment Securities
Investment securities were 8%, 0%, and 0% of our total portfolio at December 31, 2015, 2014, and 2013. Investment securities were 6%, 2%, and 2% of our total managed portfolio at December 31, 2015, 2014, and 2013. The investment securities are primarily U.S. Treasury bills and adjustable-rate mortgage-backed securities purchased by Medallion Bank to better utilize required cash liquidity.
Trend in Interest Expense
Our interest expense is driven by the interest rates payable on our short-term credit facilities with banks, bank certificates of deposit, fixed-rate, long-term debentures issued to the SBA, and other short-term notes payable. We established a medallion lending relationship with DZ Bank in December 2008 that provides for growth in the portfolio at generally lower rates than under prior facilities. In addition, Medallion Bank began raising brokered bank certificates of deposit during 2004, which are at our lowest borrowing costs at December 31, 2015. As a result of Medallion Bank raising funds through certificates of deposit as previously noted, we were able to transfer certain of our medallion loans and related assets to Medallion Bank at the time of the origination of Medallion Bank allowing us and our subsidiaries to use cash generated through these transactions to retire debt with higher interest rates. In addition, Medallion Bank is able to bid on these deposits at a wide variety of maturity levels which allows for improved interest rate management strategies.
Our cost of funds is primarily driven by the rates paid on our various debt instruments and their relative mix, and changes in the levels of average borrowings outstanding. See Note 4 to the consolidated financial statements for details on the terms of all outstanding debt. Our debentures issued to the SBA typically have terms of ten years.
We measure our borrowing costs as our aggregate interest expense for all of our interest-bearing liabilities divided by the average amount of such liabilities outstanding during the period. The following table shows the average borrowings and related borrowing costs for the years ended December 31, 2015, 2014, and 2013. Our average balances increased during the year reflecting recent portfolio growth and Medallion Bank’s average balances increased, reflecting the strong growth in the consumer loan portfolio. The decrease in our borrowing costs reflected the adjustable rate nature of much of our borrowings, and changes in our funding mix, and Medallion Bank’s borrowing costs increased reflecting the lengthening of the maturity profile of its certificates of deposits.
| (Dollars in thousands) |
Interest Expense |
Average Balance |
Average Borrowing Costs |
|||||||||
| December 31, 2015 |
||||||||||||
| Revolving lines of credit |
$ | 2,413 | $ | 122,482 | 1.97 | % | ||||||
| Notes payable to banks |
3,247 | 124,666 | 2.60 | |||||||||
| SBA debentures |
2,776 | 68,018 | 4.08 | |||||||||
| Preferred securities |
812 | 33,000 | 2.46 | |||||||||
| Margin loans |
174 | 13,572 | 1.28 | |||||||||
|
|
|
|
|
|||||||||
| Total |
$ | 9,422 | $ | 361,738 | 2.60 | |||||||
|
|
|
|
|
|||||||||
| Medallion Bank borrowings |
9,205 | 851,474 | 1.08 | |||||||||
|
|
|
|
|
|||||||||
| Total managed borrowings |
$ | 18,627 | $ | 1,213,212 | 1.54 | |||||||
|
|
|
|
|
|||||||||
| December 31, 2014 |
||||||||||||
| Revolving lines of credit |
$ | 2,459 | $ | 127,115 | 1.93 | % | ||||||
| Notes payable to banks |
2,663 | 97,012 | 2.75 | |||||||||
| SBA debentures |
2,628 | 59,715 | 4.40 | |||||||||
| Preferred securities |
793 | 33,000 | 2.40 | |||||||||
|
|
|
|
|
|||||||||
| Total |
$ | 8,543 | $ | 316,842 | 2.70 | |||||||
|
|
|
|
|
|||||||||
| Medallion Bank borrowings |
7,008 | 755,163 | 0.93 | |||||||||
|
|
|
|
|
|||||||||
| Total managed borrowings |
$ | 15,551 | $ | 1,072,005 | 1.45 | |||||||
|
|
|
|
|
|||||||||
| December 31, 2013 |
||||||||||||
| Revolving lines of credit |
$ | 2,489 | $ | 152,686 | 1.63 | % | ||||||
| Notes payable to banks |
2,255 | 70,960 | 3.18 | |||||||||
| SBA debentures |
2,810 | 59,802 | 4.70 | |||||||||
| Preferred securities |
807 | 33,000 | 2.44 | |||||||||
|
|
|
|
|
|||||||||
| Total |
$ | 8,361 | $ | 316,448 | 2.64 | |||||||
|
|
|
|
|
|||||||||
| Medallion Bank borrowings |
5,271 | 639,016 | 0.83 | |||||||||
|
|
|
|
|
|||||||||
| Total managed borrowings |
$ | 13,632 | $ | 955,464 | 1.43 | |||||||
|
|
|
|
|
|||||||||
49
Table of Contents
We will continue to seek SBA funding to the extent it offers attractive rates. SBA financing subjects its recipients to limits on the amount of secured bank debt they may incur. We use SBA funding to fund loans that qualify under Small Business Investment Act (SBIA) and SBA regulations. We believe that financing operations primarily with short-term floating rate secured bank debt has generally decreased our interest expense, but has also increased our exposure to the risk of increases in market interest rates, which we mitigate with certain interest rate strategies. At December 31, 2015, 2014, and 2013, short-term adjustable rate debt constituted 75%, 72%, and 68% of total debt, and was 23%, 22%, and 22% on a fully managed basis including the borrowings of Medallion Bank.
Factors Affecting Net Assets
Factors that affect our net assets include net realized gain or loss on investments and change in net unrealized appreciation or depreciation on investments. Net realized gain or loss on investments is the difference between the proceeds derived upon sale or foreclosure of a loan or an equity investment and the cost basis of such loan or equity investment. Change in net unrealized appreciation or depreciation on investments is the amount, if any, by which our estimate of the fair value of our investment portfolio is above or below the previously established fair value or the cost basis of the portfolio. Under the 1940 Act, our loan portfolio and other investments must be recorded at fair value.
Unlike certain lending institutions, we are not permitted to establish reserves for loan losses, but adjust quarterly the valuation of the investment portfolio to reflect our estimate of the current value of the total investment portfolio. Since no ready market exists for our investments, fair value is subject to our Board of Directors’ good faith determination. In determining such fair value, our Board of Directors considers factors such as the financial condition of our borrowers and the adequacy of their collateral. Any change in the fair value of portfolio investments or other investments as determined by our Board of Directors is reflected in net unrealized depreciation or appreciation on investments and affects net increase in net assets resulting from operations, but has no impact on net investment income or distributable income.
Our investment in Medallion Bank, as a wholly-owned portfolio investment, is also subject to quarterly assessments of fair value. We conduct a thorough valuation analysis as described previously, and also receive an opinion regarding the valuation from an independent third party to assist the Board of Directors in its determination of the fair value of Medallion Bank on an annual basis. Our analysis includes factors such as various regulatory restrictions that were established at Medallion Bank’s inception, by the FDIC and State of Utah, and also by additional regulatory restrictions, such as the prior moratorium imposed by the Dodd-Frank Act on the acquisition of control of an industrial bank by a “commercial firm” (a company whose gross revenues are primarily derived from non-financial activities) which expired in July 2013 and the lack of any new charter issuances since the moratorium’s expiration. Because of these restrictions and other factors, our Board of Directors had previously determined that Medallion Bank had little value beyond its recorded book value. As a result of this valuation process, we had previously used Medallion Bank’s actual results of operations as the best estimate of changes in fair value, and recorded the results as a component of unrealized appreciation (depreciation) on investments. In the second quarter of 2015, we became aware of external interest in Medallion Bank and its portfolio’s assets at values in excess of their book value. We incorporated these new factors in the Medallion Bank’s fair value analysis and the Board of Directors determined that Medallion Bank had a fair value in excess of book value. We also engaged a valuation specialist to assist the Board of Directors in their determination of Medallion Bank’s fair value, and this appreciation of $15,500,000 was thereby recorded in 2015 as a component of unrealized appreciation (depreciation) on investments, in addition to Medallion Bank’s actual results of operations for the year ended December 31, 2015. See Note 3 for additional information about Medallion Bank.
Consolidated Results of Operations
For the Years Ended December 31, 2015 and 2014
Net increase in net assets resulting from operations was $29,376,000 or $1.20 per diluted common share in 2015, up $684,000 or 2% from $28,692,000 or $1.14 per share in 2014, primarily reflecting lower operating expenses and higher net interest income, partially offset by lower net realized/unrealized gains and noninterest income. Net investment income after income taxes was $16,826,000 or $0.69 per share in 2015, up $1,681,000 or 11% from $15,145,000 or $0.60 in 2014.
Investment income was $42,653,000 in 2015, up $1,585,000 or 4% from $41,068,000 a year ago, and included $864,000 from interest recoveries and bonuses on certain investments in 2015, compared to $4,363,000 in 2014. Also included in 2015 and 2014 were $18,889,000 and $15,000,000 in dividends from Medallion Bank and other controlled subsidiaries. Excluding those items,
50
Table of Contents
investment income increased $1,195,000 or 6%, primarily reflecting portfolio growth, partially offset by the repricing of the portfolios to lower current market interest rates. Investment income also reflected a $326,000 or 19% reduction in lease revenue received from our owned Chicago medallions, reflecting the tightening of the market and increased competition in Chicago. The yield on the investment portfolio was 7.74% in 2015, down 6% from 8.25% in 2014. Excluding the extra interest and dividends, the 2015 yield was down 5% to 4.16% from 4.36% in 2014, reflecting the general decrease in market interest rates and changes in the portfolio mix. Average investments outstanding were $550,763,000 in 2015, up 11% from $497,536,000 a year ago, primarily reflecting portfolio growth, partially offset by loan payments received.
Medallion loans were $308,408,000 at year end, down $3,486,000 or 1% from $311,894,000 a year ago, representing 51% of the investment portfolio, compared to 59% a year ago, and were yielding 4.09% compared to 4.03% a year ago, up 1%, reflecting our increasing rates as loans refinance. The decrease in outstandings primarily reflected increases in valuation reserves reflecting current market conditions, and relatively stable portfolio markets. The managed medallion portfolio, which includes loans at Medallion Bank and those serviced for third parties, was $667,863,000 at year end, down $36,950,000 or 5% from $704,813,000 a year ago, reflecting the above and portfolio decreases in the New York and Chicago markets, reflecting management’s decision to cull weaker and less profitable borrowers from the portfolio. The commercial loan portfolio was $81,895,000 at year end, compared to $71,149,000 a year ago, an increase of $10,746,000 or 15%, and represented 14% of the investment portfolio in both years. The increase primarily reflected growth in the high-yield mezzanine portfolio, partially offset by a decrease in the other secured commercial loan portfolio. Commercial loans yielded 12.80% at year end, up 7% from 11.91% a year ago, reflecting the change in portfolio mix and higher yields on the mezzanine portfolio. The net managed commercial loan portfolio, which includes loans at Medallion Bank and those serviced for or by third parties, was $122,463,000 at year end, up $8,177,000 or 7% from $114,286,000 a year ago, primarily reflecting the changes described above, and an increase in asset-based loan participations purchased. Approximately $11,652,000 of managed asset-based loans ($6,991,000 after valuation adjustments) has been reclassified to other assets awaiting the outcome of legal proceedings as described further on page 46. Investments in Medallion Bank and other controlled subsidiaries were $159,913,000 at year end, up $23,065,000 or 17% from $136,848,000 a year ago, primarily reflecting our equity in the earnings of Medallion Bank other portfolio company investments, capital contributions made, dividends paid, portfolio sales, and net appreciation, and which represented 26% of the investment portfolio in both years, and which yielded 12.74% at year end, compared to 11.44% a year ago, primarily reflecting the dividends from Medallion Bank. See Notes 3 and 10 of the consolidated financial statements for additional information about Medallion Bank and the other controlled subsidiaries. Equity investments were $6,859,000 at year end, down $851,000 or 11% from $7,710,000 a year ago, primarily reflecting increased equity investments offset by portfolio depreciation and the transfer of an investment to investment in controlled subsidiaries, and which represented 1% of the investment portfolio at both year ends, and had a dividend yield of 0.72%, compared to 0.86% a year ago. Investment securities were $49,884,000 at year end, compared to $0 a year ago, representing 8% of the net investment portfolio, and had a yield of 0.35%, reflecting new investment activity. See page 43 for a table that shows balances and yields by type of investment.
Interest expense was $9,422,000 in 2015, up $879,000 or 10% from $8,543,000 in 2014. The increase in interest expense was primarily due to increased borrowing levels. The cost of borrowed funds was 2.60% in 2015, compared to 2.70% a year ago, a decrease of 4%, reflecting the adjustable rate nature of much of our borrowings, and changes in our funding mix. Average debt outstanding was $361,738,000 in 2015, compared to $316,842,000 a year ago, up 14%, primarily reflecting increased borrowings required to fund portfolio growth and investment activity. See page 49 for a table that shows average balances and cost of funds for our funding sources.
Net interest income was $33,231,000 and the net interest margin was 6.03% in 2015, up $706,000 or 2% from $32,525,000 a year ago, which represented a net interest margin of 6.54%, all reflecting the items discussed above.
Noninterest income, which is comprised of management fees, prepayment fees, servicing fee income, late charges, and other miscellaneous income was $319,000 in 2015, down $190,000 or 37% from $509,000 a year ago, primarily reflecting lower servicing and other fees generated from the portfolio base at Medallion Bank, and lower prepayment fees.
Operating expenses were $16,724,000 in 2015, down $1,165,000 or 7% from $17,889,000 in 2014. Salaries and benefits expense was $11,644,000 in the year, down $1,159,000 or 9% from $12,803,000 in 2014, primarily reflecting lower bonus accruals, partially offset by higher salaries and health insurance costs, and also by lower salary deferrals related to loan originations. Professional fees were $1,486,000 in 2015, up $292,000 or 24% from $1,194,000 a year ago, primarily reflecting higher legal expenses for a variety of corporate and investment-related matters. Occupancy expense was $877,000 in 2015, up $79,000 or 10% from $798,000 in 2014, primarily reflecting rent previously allocated to a sold unconsolidated portfolio company. Other operating expenses of $2,717,000 in 2015 were down $377,000 or 12% from $3,094,000 a year ago, primarily reflecting lower advertising expenses.
51
Table of Contents
Income tax expense was $0 in 2015 and 2014.
Net change in unrealized appreciation on investments was $4,914,000 in 2015, compared to $19,154,000 in 2014, a decrease in appreciation of $14,240,000 or 74%. Net change in unrealized appreciation other than the portion related to Medallion Bank and the other controlled subsidiaries, was depreciation of $11,916,000 in 2015, compared to appreciation of $3,511,000 in 2014, resulting in decreased appreciation of $15,427,000 in 2015. Unrealized appreciation (depreciation) arises when we make valuation adjustments to the investment portfolio. When investments are sold or written off, any resulting realized gain (loss) is grossed up to reflect previously recorded unrealized components. As a result, movement between periods can appear distorted. The 2015 activity resulted from net appreciation on Medallion Bank and other controlled subsidiaries of $16,830,000, reversals of unrealized depreciation associated with fully depreciated loans which were charged off of $1,015,000, net reversals of unrealized depreciation associated with equity investments which were sold of $292,000, and net unrealized appreciation on equity investments of $209,000, partially offset by net depreciation on investments other than securities of $9,621,000, net unrealized depreciation on loans of $3,743,000, and net depreciation on other assets of $68,000. The 2014 activity resulted from net appreciation on Medallion Bank and other controlled subsidiaries of $15,643,000, reversals of unrealized depreciation associated with fully depreciated loans which were charged off of $5,408,000, net appreciation on other assets of $1,141,000, reversals of unrealized depreciation associated with equity investments which were sold of $674,000, and net unrealized appreciation on equity investments of $553,000, partially offset by net depreciation on investments other than securities of $2,900,000 and net unrealized depreciation on loans of $1,365,000. The net appreciation on Medallion Bank and other controlled subsidiaries described above is net of the dividends declared by them to us of $18,889,000 in 2015 and $15,000,000 in 2014.
Our net realized gains on investments were $7,636,000 in 2015, compared to losses of $5,607,000 in 2014, an increase in realized gains of $13,243,000 in 2015. The 2015 activity reflected the reversals described in the unrealized paragraph above, and reversals of $4,809,000 of unrealized appreciation related to sales of other controlled subsidiaries, $3,296,000 of other gains from the other controlled subsidiaries sales, and other gains on equity investments of $913,000, partially offset by net direct chargeoffs of loans and equity investments of $75,000. The 2014 activity reflected the reversals described in the unrealized paragraph above and other gains on loans of $385,000, other gains on equity investments of $49,000, and net direct loan recoveries of $41,000.
Our net realized/unrealized gains on investments were $12,550,000 in 2015, compared to $13,547,000 in 2014, a decrease of $997,000 or 7% of net gains in the year, reflecting the above.
For the Years Ended December 31, 2014 and 2013
Net increase in net assets resulting from operations was $28,692,000 or $1.14 per diluted common share in 2014, up $2,916,000 or 11% from $25,776,000 or $1.16 per share in 2013, primarily reflecting higher net interest income, partially offset by higher operating expenses and lower noninterest income and net realized/unrealized gains. Net investment income after income taxes was $15,145,000 or $0.60 per share in 2014, up $2,956,000 or 24% from $12,189,000 or $0.55 in 2013.
Investment income was $41,068,000 in 2014, up $6,139,000 or 18% from $34,929,000 a year ago, and included $4,160,000 from interest recoveries and bonuses on certain investments in 2014, compared to $2,326,000 in 2013. Also included in 2014 and 2013 were $15,000,000 and $12,000,000 in dividends from Medallion Bank. Excluding those items, investment income increased $1,305,000 or 6%, primarily reflecting portfolio growth, partially offset by the repricing of the portfolios to lower current market interest rates, and the sourcing of loans to Medallion Bank. The yield on the investment portfolio was 8.25% in 2014, up 9% from 7.60% in 2013. Excluding the extra interest and dividends, the 2014 yield was down 3% to 4.36% from 4.49% in 2013, reflecting the general decrease in market interest rates and changes in the portfolio mix. Average investments outstanding were $497,536,000 in 2014, up 8% from $459,374,000 a year ago, primarily reflecting portfolio growth, partially offset by loan payments received.
Medallion loans were $311,894,000 at year end, up $14,033,000 or 5% from $297,861,000 a year ago, representing 59% of the investment portfolio, compared to 63% a year ago, and were yielding 4.03% compared to 4.02% a year ago, essentially unchanged, reflecting the bottoming of current market interest rates. The increase in outstandings primarily reflected portfolio growth in New York, Boston, and Newark, partially offset by a decline in Chicago and the other markets. The managed medallion portfolio, which includes loans at Medallion Bank and those serviced for third parties, was $704,813,000 at year end, up $33,968,000 or 5% from $670,845,000 a year ago, reflecting the above and the strong overall portfolio growth at Medallion Bank, and an increase in third party participations sold. The commercial loan portfolio was $71,149,000 at year end, compared to $60,168,000 a year ago, an
52
Table of Contents
increase of $10,981,000 or 18%, and represented 14% of the investment portfolio compared to 13% a year ago. The increase primarily reflected growth in the high-yield mezzanine and other secured commercial loan portfolios, partially offset by a decrease in the asset-based loan portfolio. Commercial loans yielded 11.91% at year end, up 12% from 10.60% a year ago, reflecting the change in portfolio mix and higher yields on the mezzanine portfolio. The net managed commercial loan portfolio, which includes loans at Medallion Bank and those serviced for or by third parties, was $114,286,000 at year end, up $2,435,000 or 2% from $111,851,000 a year ago, primarily reflecting the changes described above, and further decreases and reserve increases in the asset-based loan portfolio at Medallion Bank. Approximately $11,202,000 of managed asset-based loans ($7,841,000 after valuation adjustments) has been reclassified to other assets awaiting the outcome of legal proceedings as described further on page 46. Investments in Medallion Bank and other controlled subsidiaries were $136,848,000 at year end, up $28,225,000 or 26% from $108,623,000 a year ago, primarily reflecting our equity in the earnings of Medallion Bank and other portfolio company investments, capital contributions made, and net appreciation, and which represented 26% of the investment portfolio, compared to 23% a year ago, and which yielded 11.44% at year end, compared to 11.13% a year ago, reflecting the dividends from Medallion Bank. See Notes 3 and 10 of the consolidated financial statements for additional information about Medallion Bank and the other controlled subsidiaries. Equity investments were $7,710,000 at year end, up $1,205,000 or 19% from $6,505,000 a year ago, primarily reflecting portfolio appreciation and acquisitions, partially offset by portfolio dispositions and distributions, and which represented 1% of the investment portfolio and had a dividend yield of 0.86% at both year ends. Investment securities were zero at both year ends. See page 43 for a table that shows balances and yields by type of investment.
Interest expense was $8,543,000 in 2014, up $182,000 or 2% from $8,361,000 in 2013. The increase in interest expense was primarily due to higher cost of funds. The cost of borrowed funds was 2.70% in 2014, compared to 2.64% a year ago, an increase of 2%, reflecting the adjustable rate nature of much of our borrowings, and changes in our funding mix. Average debt outstanding was $316,842,000 in 2014, compared to $316,448,000 a year ago, essentially unchanged, primarily reflecting borrowing stability, as proceeds from the recent equity raises has been utilized to fund portfolio growth. See page 49 for a table that shows average balances and cost of funds for our funding sources.
Net interest income was $32,525,000 and the net interest margin was 6.54% in 2014, up $5,957,000 or 22% from $26,568,000 a year ago, which represented a net interest margin of 5.78%, all reflecting the items discussed above.
Noninterest income, which is comprised of prepayment fees, servicing fee income, late charges, and other miscellaneous income was $509,000 in 2014, down $773,000 or 60% from $1,282,000 a year ago, primarily reflecting lower prepayment fees, late charges, and servicing and other fees generated from the portfolio base at Medallion Bank.
Operating expenses were $17,889,000 in 2014, up $2,228,000 or 14% from $15,661,000 in 2013. Salaries and benefits expense was $12,803,000 in the year, up $2,016,000 or 19% from $10,787,000 in 2013, primarily reflecting higher bonus accruals and salaries, and also by lower salary deferrals related to loan originations. Professional fees were $1,194,000 in 2014, down $346,000 or 22% from $1,540,000 a year ago, primarily reflecting lower legal fees, partially offset by higher accounting, tax, and consultant costs, all related to the realization of certain portfolio investments, other investment activities and legal matters, portfolio valuations, and assistance with enhancements to the operating and structural environment. Occupancy expense was $798,000 in 2014, up $33,000 or 4% from $765,000 in 2013, primarily reflecting a relatively stable rent environment. Other operating expenses of $3,094,000 in 2014 were up $525,000 or 20% from $2,569,000 a year ago, primarily reflecting higher marketing, computer, franchise taxes, and other operating expenses, partially offset by higher expense reimbursements from Medallion Bank.
Income tax expense was $0 in 2014 and 2013.
Net change in unrealized appreciation on investments was $19,154,000 in 2014, compared to $12,895,000 in 2013, an increase in appreciation of $6,259,000 or 49%. Net change in unrealized appreciation other than the portion related to Medallion Bank and the other controlled subsidiaries, was appreciation of $3,511,000 in 2014, compared to $7,835,000 in 2013, resulting in decreased appreciation of $4,324,000 or 55% in 2014. Unrealized appreciation (depreciation) arises when we make valuation adjustments to the investment portfolio. When investments are sold or written off, any resulting realized gain (loss) is grossed up to reflect previously recorded unrealized components. As a result, movement between periods can appear distorted. The 2014 activity resulted from net appreciation on Medallion Bank and other controlled subsidiaries of $15,643,000, reversals of unrealized depreciation associated with fully depreciated loans which were charged off of $5,408,000, net appreciation on other assets of $1,141,000, reversals of unrealized depreciation associated with equity investments which were sold of $674,000, and net unrealized appreciation on equity investments of $553,000, partially offset by net depreciation on investments other than securities of $2,900,000 and net unrealized depreciation on
53
Table of Contents
loans of $1,365,000. The 2013 activity resulted from net appreciation on investments other than securities and other assets of $6,759,000, net appreciation on Medallion Bank and other controlled subsidiaries of $5,060,000, net unrealized appreciation on equity investments of $443,000, reversals of unrealized depreciation associated with fully depreciated loans which were charged off of $397,000, and reversals of unrealized depreciation associated with equity investments which were charged off of $365,000, partially offset by net unrealized depreciation on loans of $129,000. The net appreciation on Medallion Bank and other controlled subsidiaries described above is net of the dividends declared by them to us of $15,000,000 in 2014 and $12,000,000 in 2013.
Our net realized losses on investments were $5,607,000 in 2014, compared to gains of $692,000 in 2013, a decrease in realized gains of $6,299,000 in 2014. The 2014 activity reflected the reversals described in the unrealized paragraph above and other gains on loans of $385,000, other gains on equity investments of $49,000, and net direct loan recoveries of $41,000. The 2013 activity reflected the reversals described in the unrealized paragraph above and gains on the sale of equity investments of $1,368,000 and net direct recoveries of $86,000.
Our net realized/unrealized gains on investments were $13,547,000 in 2014, compared to $13,587,000 in 2013, a decrease of $40,000 of net gains in the year, reflecting the above.
ASSET/LIABILITY MANAGEMENT
Interest Rate Sensitivity
We, like other financial institutions, are subject to interest rate risk to the extent that our interest-earning assets (consisting of medallion, commercial, and consumer loans; and investment securities) reprice on a different basis over time in comparison to our interest-bearing liabilities (consisting primarily of credit facilities with banks and other lenders, bank certificates of deposit, and SBA debentures).
Having interest-bearing liabilities that mature or reprice more frequently on average than assets may be beneficial in times of declining interest rates, although such an asset/liability structure may result in declining net earnings during periods of rising interest rates. Abrupt increases in market rates of interest may have an adverse impact on our earnings until we are able to originate new loans at the higher prevailing interest rates. Conversely, having interest-earning assets that mature or reprice more frequently on average than liabilities may be beneficial in times of rising interest rates, although this asset/liability structure may result in declining net earnings during periods of falling interest rates. This mismatch between maturities and interest rate sensitivities of our interest-earning assets and interest-bearing liabilities results in interest rate risk.
The effect of changes in interest rates is mitigated by regular turnover of the portfolio. Based on past experience, we anticipate that approximately 40% of the taxicab medallion portfolio will mature or be prepaid each year. We believe that the average life of our loan portfolio varies to some extent as a function of changes in interest rates. Borrowers are more likely to exercise prepayment rights in a decreasing interest rate environment because the interest rate payable on the borrower’s loan is high relative to prevailing interest rates. Conversely, borrowers are less likely to prepay in a rising interest rate environment. However, borrowers may prepay for a variety of other reasons, such as to monetize increases in the underlying collateral values, particularly in the medallion loan portfolio.
In addition, we manage our exposure to increases in market rates of interest by incurring fixed-rate indebtedness, such as ten year subordinated SBA debentures, and by setting repricing intervals or the maturities of tranches drawn under the revolving lines of credit or issued as certificates of deposit, for terms of up to five years. We had outstanding SBA debentures of $74,485,000 with a weighted average interest rate of 3.52%, constituting 18% of our total indebtedness as of December 31, 2015. Also, as of December 31, 2015, portions of the adjustable rate debt with banks repriced at intervals of as long as 2 months, and certain of the certificates of deposit were for terms of up to 59 months, further mitigating the immediate impact of changes in market interest rates.
A relative measure of interest rate risk can be derived from our interest rate sensitivity gap. The interest rate sensitivity gap represents the difference between interest-earning assets and interest-bearing liabilities, which mature and/or reprice within specified intervals of time. The gap is considered to be positive when repriceable assets exceed repriceable liabilities, and negative when repriceable liabilities exceed repriceable assets. A relative measure of interest rate sensitivity is provided by the cumulative difference between interest sensitive assets and interest sensitive liabilities for a given time interval expressed as a percentage of total assets.
54
Table of Contents
The following table presents our interest rate sensitivity gap at December 31, 2015, compared to the respective positions at the end of 2014 and 2013. The principal amounts of interest earning assets are assigned to the time frames in which such principal amounts are contractually obligated to be repriced. We have not reflected an assumed annual prepayment rate for such assets in this table.
| December 31, 2015 Cumulative Rate Gap (1) | ||||||||||||||||||||||||||||||||
| (Dollars in thousands) |
Less Than 1 Year | More Than 1 and Less Than 2 Years |
More Than 2 and Less Than 3 Years |
More Than 3 and Less Than 4 Years |
More Than 4 and Less Than 5 Years |
More Than 5 and Less Than 6 Years |
Thereafter | Total | ||||||||||||||||||||||||
| Earning assets |
||||||||||||||||||||||||||||||||
| Floating-rate |
$ | 3,750 | $ | — | $ | — | $ | — | $ | — | $ | — | $ | — | $ | 3,750 | ||||||||||||||||
| Adjustable rate |
5,439 | — | 3,518 | — | — | — | — | 8,957 | ||||||||||||||||||||||||
| Fixed-rate |
183,344 | 134,862 | 62,963 | 19,453 | 23,249 | 4,189 | 4,789 | 432,849 | ||||||||||||||||||||||||
| Cash |
30,912 | — | — | — | — | — | — | 30,912 | ||||||||||||||||||||||||
|
|
|
|
|
|
|
|
|
|
|
|
|
|
|
|
|
|||||||||||||||||
| Total earning assets |
$ | 223,445 | $ | 134,862 | $ | 66,481 | $ | 19,453 | $ | 23,249 | $ | 4,189 | $ | 4,789 | $ | 476,468 | ||||||||||||||||
|
|
|
|
|
|
|
|
|
|
|
|
|
|
|
|
|
|||||||||||||||||
| Interest bearing liabilities |
||||||||||||||||||||||||||||||||
| Revolving lines of credit |
$ | 129,518 | $ | — | $ | — | $ | — | $ | — | $ | — | $ | — | $ | 129,518 | ||||||||||||||||
| Notes payable to banks |
122,167 | 180 | 42 | — | 40 | — | — | 122,429 | ||||||||||||||||||||||||
| SBA debentures |
8,500 | — | — | 3,000 | — | 15,985 | 47,000 | 74,485 | ||||||||||||||||||||||||
| Preferred securities |
33,000 | — | — | — | — | — | — | 33,000 | ||||||||||||||||||||||||
| Margin loan |
45,108 | — | — | — | — | — | — | 45,108 | ||||||||||||||||||||||||
|
|
|
|
|
|
|
|
|
|
|
|
|
|
|
|
|
|||||||||||||||||
| Total liabilities |
$ | 338,293 | $ | 180 | $ | 42 | $ | 3,000 | $ | 40 | $ | 15,985 | $ | 47,000 | $ | 404,540 | ||||||||||||||||
|
|
|
|
|
|
|
|
|
|
|
|
|
|
|
|
|
|||||||||||||||||
| Interest rate gap |
($ | 114,848 | ) | $ | 134,682 | $ | 66,439 | $ | 16,453 | $ | 23,209 | ($ | 11,796 | ) | ($ | 42,211 | ) | $ | 71,928 | |||||||||||||
|
|
|
|
|
|
|
|
|
|
|
|
|
|
|
|
|
|||||||||||||||||
| Cumulative interest rate gap (2) |
($ | 114,848 | ) | $ | 19,834 | $ | 86,273 | $ | 102,726 | $ | 125,935 | $ | 114,139 | $ | 71,928 | — | ||||||||||||||||
|
|
|
|
|
|
|
|
|
|
|
|
|
|
|
|
|
|||||||||||||||||
| December 31, 2014 (2) |
($ | 160,108 | ) | ($ | 47,283 | ) | $ | 73,765 | $ | 108,360 | $ | 124,790 | $ | 131,736 | $ | 84,006 | ||||||||||||||||
| December 31, 2013 (2) |
($ | 143,126 | ) | ($ | 72,980 | ) | $ | 78,325 | $ | 122,575 | $ | 146,584 | $ | 143,584 | $ | 102,071 | ||||||||||||||||
|
|
|
|
|
|
|
|
|
|
|
|
|
|
|
|||||||||||||||||||
| (1) | The ratio of the cumulative one year gap to total interest rate sensitive assets was (24%), (37%), and (34%), as of December 31, 2015, 2014, and 2013, and was (14%), (19%), and (28%) on a combined basis with Medallion Bank. |
| (2) | Adjusted for the medallion loan 40% prepayment assumption results in a cumulative one year negative interest rate gap and related ratio of ($43,838) or (9%) for December 31, 2015, compared to ($53,066) or (12%) and ($30,301) or (7%) for December 31, 2014 and 2013, and was ($77,488) or (5%), ($28,650) or (2%), and ($97,043) or (8%) on a combined basis with Medallion Bank. |
Our interest rate sensitive assets were $476,468,000 and interest rate sensitive liabilities were $404,540,000 at December 31, 2015. The one-year cumulative interest rate gap was a negative $114,848,000 or 24% of interest rate sensitive assets, compared to a negative $160,108,000 or 37% at December 31, 2014 and $143,126,000 or 34% at December 31, 2013. However, using our estimated 40% prepayment/refinancing rate for medallion loans to adjust the interest rate gap resulted in a negative gap of $43,838,000 or 9% at December 31, 2015. We seek to manage interest rate risk by originating adjustable-rate loans, by incurring fixed-rate indebtedness, by evaluating appropriate derivatives, pursuing securitization opportunities, and by other options consistent with managing interest rate risk.
On a combined basis with Medallion Bank, our interest rate sensitive assets were $1,544,326,000 and interest rate sensitive liabilities were $1,313,436,000 at December 31, 2015. The one-year cumulative interest rate gap was a negative $220,686,000 or 14% of interest rate sensitive assets, compared to a negative $257,578,000 or 19% and $341,843,000 or 28% at December 31, 2014 and 2013. Using our estimated 40% prepayment/refinancing rate for medallion loans to adjust the interest rate gap resulted in a negative gap of $77,488,000 or 5% at December 31, 2015.
55
Table of Contents
Interest Rate Cap Agreements
We manage our exposure to increases in market rates of interest by periodically purchasing interest rate caps to lock in the cost of funds of our variable-rate debt in the event of a rapid run up in interest rates. We entered into contracts to purchase interest rate caps on $170,000,000 of notional value of principal from various multinational banks, with termination dates ranging to September 2018. The caps provide for payments to us if various LIBOR thresholds are exceeded during the cap terms. Total cap purchases were generally fully expensed when paid, including $81,000, $75,000, and $41,000, in 2015, 2014, and 2013, and all are carried at $0 on the balance sheet at December 31, 2015.
Liquidity and Capital Resources
Our sources of liquidity are the revolving lines of credit with DZ Bank and with a variety of local and regional banking institutions, unfunded commitments to sell debentures to the SBA, loan amortization and prepayments, private issuances of debt securities, and participations or sales of loans to third parties. As a RIC, we are required to distribute at least 90% of our investment company taxable income; consequently, we have primarily relied upon external sources of funds to finance growth. Trust III’s $135,000,000 secured revolving line of credit with DZ Bank had $5,482,000 of availability, $11,568,000 was available under revolving credit agreements with commercial banks, and there were $3,000,000 unfunded commitments from SBA.
Additionally, Medallion Bank, our wholly-owned, unconsolidated portfolio company has access to independent sources of funds for our business originated there, primarily through brokered certificates of deposit. At the current required capital levels, it is expected, although there can be no guarantee, that deposits of approximately $7,500,000 could be raised by Medallion Bank to fund future loan origination activities, and Medallion Bank also has $25,000,000 available under Fed Funds lines with several commercial banks. In addition, Medallion Bank, as a non-RIC subsidiary of ours, is allowed to retain all earnings in the business to fund future growth.
The components of our debt were as follows at December 31, 2015. See Note 4 to the consolidated financial statements on page F-18 for details of the contractual terms of our borrowings.
| (Dollars in thousands) |
Balance | Percentage | Rate (1) | |||||||||
| Revolving lines of credit |
$ | 129,518 | 32 | % | 2.05 | % | ||||||
| Notes payable to banks |
122,429 | 31 | 2.60 | |||||||||
| SBA debentures |
74,485 | 18 | 3.52 | |||||||||
| Margin loans |
45,108 | 11 | 1.48 | |||||||||
| Preferred securities |
33,000 | 8 | 2.58 | |||||||||
|
|
|
|
|
|
|
|||||||
| Total outstanding debt |
$ | 404,540 | 100 | % | 2.47 | |||||||
|
|
|
|
|
|
|
|||||||
| Deposits and other borrowings at Medallion Bank |
908,896 | — | 1.04 | % | ||||||||
|
|
|
|
|
|
|
|||||||
| Total outstanding debt, including Medallion Bank |
$ | 1,313,436 | — | 1.48 | ||||||||
|
|
|
|
|
|
|
|||||||
| (1) | Weighted average contractual rate as of December 31, 2015. |
Our contractual obligations expire on or mature at various dates through September 2037. The following table shows all contractual obligations at December 31, 2015.
| Payments due by period | ||||||||||||||||||||||||||||
| (Dollars in thousands) |
Less than 1 year | 1 – 2 years | 2 – 3 years | 3 –4 years | 4 –5 years | More than 5 years | Total | |||||||||||||||||||||
| Revolving lines of credit |
$ | 129,518 | $ | — | $ | — | $ | — | $ | — | $ | — | $ | 129,518 | ||||||||||||||
| Notes payable to banks |
122,167 | 180 | 42 | — | 40 | — | 122,429 | |||||||||||||||||||||
| SBA debentures |
— | — | — | 3,000 | — | 71,485 | 74,485 | |||||||||||||||||||||
| Margin loans |
45,108 | — | — | — | — | — | 45,108 | |||||||||||||||||||||
| Preferred securities |
— | — | — | — | — | 33,000 | 33,000 | |||||||||||||||||||||
|
|
|
|
|
|
|
|
|
|
|
|
|
|
|
|||||||||||||||
| Total |
$ | 296,793 | $ | 180 | $ | 42 | $ | 3,000 | $ | 40 | $ | 104,485 | $ | 404,540 | ||||||||||||||
|
|
|
|
|
|
|
|
|
|
|
|
|
|
|
|||||||||||||||
| Deposits and other borrowings at Medallion Bank |
393,359 | 265,336 | 164,721 | 72,393 | 13,087 | — | 908,896 | |||||||||||||||||||||
|
|
|
|
|
|
|
|
|
|
|
|
|
|
|
|||||||||||||||
| Total, including Medallion Bank |
$ | 690,152 | $ | 265,516 | $ | 164,763 | $ | 75,393 | $ | 13,127 | $ | 104,485 | $ | 1,313,436 | ||||||||||||||
|
|
|
|
|
|
|
|
|
|
|
|
|
|
|
|||||||||||||||
We value our portfolio at fair value as determined in good faith by the Board of Directors in accordance with our valuation policy. Unlike certain lending institutions, we are not permitted to establish reserves for loan losses. Instead, we must value each individual investment and portfolio loan on a quarterly basis. We record unrealized depreciation on investments and loans when we believe that an asset has been impaired and full collection is unlikely. We record unrealized appreciation on equities if we have a clear indication that the underlying portfolio company has appreciated in value and, therefore, our equity investment has also appreciated in value. Without a readily ascertainable market value, the estimated value of our portfolio of investments and loans may differ significantly from the values that would be placed on the portfolio if there existed a ready market for the investments. We adjust the valuation of the portfolio quarterly to reflect our Board of Directors’ estimate of the current fair value of each investment in the portfolio. Any changes in estimated fair value are recorded in our statement of operations as net unrealized appreciation (depreciation) on investments. Our investment in Medallion Bank, as a wholly-owned portfolio investment, is also subject to quarterly assessments
56
Table of Contents
of its fair value. We conduct a thorough valuation analysis, and also receive an opinion regarding the valuation from an independent third party to assist the Board of Directors in its determination of the fair value of Medallion Bank. We determine whether any factors give rise to valuation different than recorded book value. As a result of this valuation process, we had previously used Medallion Bank’s actual results of operations as the best estimate of changes in fair value, and recorded the results as a component of unrealized appreciation (depreciation) on investments. In the second quarter of 2015, we became aware of external interest in Medallion Bank and its portfolio’s assets at values in excess of their book value. We incorporated these new factors in the Medallion Bank’s fair value analysis and the Board of Directors determined that Medallion Bank had a fair value in excess of book value. We also engaged a valuation specialist to assist the Board of Directors in their determination of Medallion Bank’s fair value, and this appreciation of $15,500,000 was thereby recorded in 2015 as a component of unrealized appreciation (depreciation) on investments, in addition to Medallion Bank’s actual results of operations for the year ended December 31, 2015. For more information, see “Risk Factors – Risks Relating to Our Business and Structure – Our investment portfolio is, and will continue to be, recorded at fair value as determined in good faith by our Board of Directors and, as a result, there is, and will continue to be, uncertainty as to the value of our portfolio investments which could adversely affect our net asset value.”
In addition, the illiquidity of our loan portfolio and investments may adversely affect our ability to dispose of loans at times when it may be advantageous for us to liquidate such portfolio or investments. In addition, if we were required to liquidate some or all of the investments in the portfolio, the proceeds of such liquidation may be significantly less than the current value of such investments. Because we borrow money to make loans and investments, our net operating income is dependent upon the difference between the rate at which we borrow funds and the rate at which we invest these funds. As a result, there can be no assurance that a significant change in market interest rates will not have a material adverse effect on our interest income. In periods of sharply rising interest rates, our cost of funds would increase, which would reduce our net operating income before net realized and unrealized gains. We use a combination of long-term and short-term borrowings and equity capital to finance our investing activities. Our long-term fixed-rate investments are financed primarily with short-term floating-rate debt, and to a lesser extent by term fixed-rate debt. We may use interest rate risk management techniques in an effort to limit our exposure to interest rate fluctuations. Such techniques may include various interest rate hedging activities to the extent permitted by the 1940 Act. We have analyzed the potential impact of changes in interest rates on net interest income. Assuming that the balance sheet were to remain constant and no actions were taken to alter the existing interest rate sensitivity, and including the impact on Medallion Bank, a hypothetical immediate 1% increase in interest rates would result in an increase to the line item “net increase in net assets resulting from operations” as of December 31, 2015 by $692,000 on an annualized basis, compared to a positive impact of $1,279,000 at December 31, 2014, and the impact of such an immediate increase of 1% over a one year period would have been ($1,855,000) at December 31, 2015, compared to ($1,634,000) at December 31, 2014. Although management believes that this measure is indicative of our sensitivity to interest rate changes, it does not adjust for potential changes in credit quality, size, and composition of the assets on the balance sheet, and other business developments that could affect net increase in net assets resulting from operations in a particular quarter or for the year taken as a whole. Accordingly, no assurances can be given that actual results would not differ materially from the potential outcome simulated by these estimates.
We continue to work with investment banking firms and other financial intermediaries to investigate the viability of a number of other financing options which include, among others, the sale or spin off certain assets or divisions, the development of a securitization conduit program, and other independent financing for certain subsidiaries or asset classes. These financing options would also provide additional sources of funds for both external expansion and continuation of internal growth.
The following table illustrates sources of available funds for us and each of our subsidiaries, and amounts outstanding under credit facilities and their respective end of period weighted average interest rates at December 31, 2015. See Note 4 to the consolidated financial statements for additional information about each credit facility.
| (Dollars in thousands) |
The Company | MFC | MCI | MBC | FSVC | MB | 12/31/2015 Total |
12/31/2014 | ||||||||||||||||||||||||
| Cash |
$ | 10,850 | $ | 10,009 | $ | 6,401 | $ | 1,825 | $ | 1,827 | $ | — | $ | 30,912 | $ | 47,083 | ||||||||||||||||
| Bank loans |
102,103 | 31,644 | — | — | 250 | — | 133,997 | $ | 179,016 | |||||||||||||||||||||||
| Amounts undisbursed |
4,625 | (1) | 6,943 | — | — | — | — | 11,568 | 54,500 | |||||||||||||||||||||||
| Amounts outstanding |
97,478 | 24,701 | — | — | 250 | — | 122,429 | 124,516 | ||||||||||||||||||||||||
| Average interest rate |
2.44 | % | 3.19 | % | — | — | 6.53 | % | — | 2.60 | % | 2.51 | % | |||||||||||||||||||
| Maturity |
3/16-11/16 | 2/16-12/20 | — | — | 3/16-11/18 | — | 2/16-12/20 | 1/15-4/17 | ||||||||||||||||||||||||
| Preferred securities |
33,000 | — | — | — | — | — | 33,000 | $ | 33,000 | |||||||||||||||||||||||
| Average interest rate |
2.58 | % | — | — | — | — | — | 2.58 | % | 2.36 | % | |||||||||||||||||||||
| Maturity |
9/37 | — | — | — | — | — | 9/37 | 9/37 | ||||||||||||||||||||||||
| Lines of credit |
— | 135,000 | — | — | — | — | 135,000 | $ | 150,000 | |||||||||||||||||||||||
| Amounts undisbursed |
— | 5,482 | — | — | — | — | 5,482 | 27,206 | ||||||||||||||||||||||||
57
Table of Contents
| Amounts outstanding |
— | 129,518 | — | — | — | — | 129,518 | 122,794 | ||||||||||||||||||||||||
| Average interest rate |
— | 2.05 | % | — | — | — | — | 2.05 | % | 1.84 | % | |||||||||||||||||||||
| Maturity |
— | 12/16 | — | — | — | — | 12/16 | 12/16 | ||||||||||||||||||||||||
| Margin loan |
45,108 | — | — | — | — | — | 45,108 | — | ||||||||||||||||||||||||
| Average interest rate |
1.48 | % | — | — | — | — | — | 1.48 | % | — | ||||||||||||||||||||||
| Maturity |
N/A | — | — | — | — | — | N/A | — | ||||||||||||||||||||||||
| SBA debentures |
— | — | 44,000 | — | 33,485 | — | 77,485 | $ | 68,485 | |||||||||||||||||||||||
| Amounts undisbursed |
— | — | 3,000 | — | — | — | 3,000 | — | ||||||||||||||||||||||||
| Amounts outstanding |
— | — | 41,000 | — | 33,485 | — | 74,485 | 68,485 | ||||||||||||||||||||||||
| Average interest rate |
— | — | 3.20 | % | — | 3.92 | % | — | 3.52 | % | 3.71 | % | ||||||||||||||||||||
| Maturity |
— | — | 3/21-3/26 | — | 3/19-9/23 | — | 3/19-3/26 | 3/15-3/25 | ||||||||||||||||||||||||
|
|
|
|
|
|
|
|
|
|
|
|
|
|
|
|
|
|||||||||||||||||
| Total cash and amounts remaining undisbursed under credit facilities |
$ | 15,475 | $ | 22,434 | $ | 9,401 | $ | 1,825 | $ | 1,827 | $ | — | $ | 50,962 | $ | 128,789 | ||||||||||||||||
|
|
|
|
|
|
|
|
|
|
|
|
|
|
|
|
|
|||||||||||||||||
| Total debt outstanding |
$ | 175,586 | $ | 154,219 | $ | 41,000 | $ | — | $ | 33,735 | $ | — | $ | 404,540 | $ | 348,795 | ||||||||||||||||
|
|
|
|
|
|
|
|
|
|
|
|
|
|
|
|
|
|||||||||||||||||
| Including Medallion Bank |
||||||||||||||||||||||||||||||||
| Cash |
— | — | — | — | — | $ | 23,094 | $ | 23,094 | $ | 30,372 | |||||||||||||||||||||
| Deposits and other borrowings |
— | — | — | — | — | 908,896 | 908,896 | 807,940 | ||||||||||||||||||||||||
| Average interest rate |
— | — | — | — | — | 1.04 | % | 1.04 | % | 0.86 | % | |||||||||||||||||||||
| Maturity |
— | — | — | — | — | 1/16-12/20 | 1/16-12/20 | 1/15-9/19 | ||||||||||||||||||||||||
|
|
|
|
|
|
|
|
|
|
|
|
|
|
|
|
|
|||||||||||||||||
| Total cash and amounts remaining undisbursed under credit facilities |
$ | 15,475 | $ | 22,434 | $ | 9,401 | $ | 1,825 | $ | 1,827 | $ | 23,094 | $ | 74,056 | $ | 159,161 | ||||||||||||||||
|
|
|
|
|
|
|
|
|
|
|
|
|
|
|
|
|
|||||||||||||||||
| Total debt outstanding |
$ | 175,586 | $ | 154,219 | $ | 41,000 | $ | — | $ | 33,735 | $ | 908,896 | $ | 1,313,436 | $ | 1,156,735 | ||||||||||||||||
|
|
|
|
|
|
|
|
|
|
|
|
|
|
|
|
|
| (1) | $275 of this availability can be used by MFC. |
Loan amortization, prepayments, and sales also provide a source of funding for us. Prepayments on loans are influenced significantly by general interest rates, medallion loan market values, economic conditions, and competition.
We have available liquidity of $5,482,000 under our revolving credit agreement with DZ Bank as of December 31, 2015. We also generate liquidity through deposits generated at Medallion Bank, borrowing arrangements with other banks, and through the issuance of SBA debentures, as well as from cash flow from operations. In addition, we may choose to participate a greater portion of our loan portfolio to third parties. We are actively seeking additional sources of liquidity, however, given current market conditions, we cannot assure you that we will be able to secure additional liquidity on terms favorable to us or at all. If that occurs, we may be unable to cure borrowing base deficiencies, we may decline to underwrite lower yielding loans in order to conserve capital until credit conditions in the market become more favorable; or we may be required to dispose of assets when we would not otherwise do so, and at prices which may be below the net book value of such assets in order for us to repay indebtedness on a timely basis. Also, Medallion Bank is not a RIC, and therefore is able to retain earnings to finance growth.
Recently Issued Accounting Standards
In February 2016, the Financial Accounting Standards Board (FASB) issued Accounting Standards Update (ASU) 2016-02, “Leases (Topic 842)”. ASU 2016-02 requires the recognition of lease assets and lease liabilities by lessees for leases classified as operating under current GAAP. ASU 2016-02 applies to all entities and is effective for fiscal years beginning after December 15, 2018 for public entities, with early adoption permitted. We are assessing the impact the update will have on our financial condition and results of operations.
In January 2016, the FASB issued ASU 2016-01, “Financial Instruments—Overall (Topic 825-10): Recognition and Measurement of Financial Assets and Financial Liabilities.” The main objective of this Update is to enhance the reporting model for financial instruments and provide users of financial statements with more decision-useful information. ASU 2016-01 requires equity investments to be measured at fair value, simplifies the impairment assessment of equity investment without readily determinable fair value, eliminates the requirements to disclose the fair value of financial instruments measured at amortized cost, and requires public business entities to use the exit price notion when measuring the fair value of financial instruments. The update, as amended, is effective for fiscal years, and interim periods within those fiscal years, beginning after December 15, 2017. We do not believe this update will have a material impact on our financial condition.
In August 2015, the FASB issued ASU 2015-15, “Interest—Imputation of Interest (Subtopic 835-30): Presentation and Subsequent Measurement of Debt Issuance Costs Associated with Line-of-Credit Arrangements—Amendments to SEC Paragraphs Pursuant to Staff Announcement at June 18, 2015 EITF Meeting.” ASU 2015-15 adds SEC paragraphs whereby the SEC staff addresses the absence of guidance under ASU 2015-03, “Interest – Imputation of Interest (Subtopic 835-30),” for costs related to line-of-credit arrangements. The SEC staff will not object to an entity deferring and presenting debt issuance costs as an asset and subsequently amortizing the deferred debt issuance costs ratably over the term of the line-of-credit arrangement, regardless of whether there are any outstanding borrowings on the line-of-credit arrangement. ASU 2015-03 requires that debt issuance costs related to a recognized debt liability be presented in the balance sheet as a direct deduction from the carrying amount of that debt liability, consistent with debt discounts. The update, as amended, is effective for fiscal years, and interim periods within those fiscal years, beginning after December 15, 2015. We do not believe this update will have a material impact on our financial condition.
58
Table of Contents
In May 2015, the FASB issued ASU 2015-07, “Fair Value Measurement (Topic 820) – Disclosures for Investments in Certain Entities That Calculate Net Asset Value per Share (or Its Equivalent). ASU 2015-07 removes the requirement to categorize within the fair value hierarchy all investments for which fair value is measured using the net asset value per share practical expedient. Additionally, the amendment removes the requirement to make certain disclosures for all investments that are eligible to be measured at fair value using the net asset value per share practical expedient, limiting those disclosures to investments for which the entity has elected to measure the fair value using that practical expedient. The update is effective for fiscal years, and interim periods within those fiscal years, beginning after December 15, 2015. We do not believe this update will have a material impact on our disclosures.
In August 2014, the FASB issued ASU 2014-13, “Consolidation – (Topic 810): Measuring the Financial Assets and the Financial Liabilities of a Consolidated Collateralized Financing”. ASU 2014-13 provides an alternative to Topic 820 for measuring the financial assets and the financial liabilities of a consolidated collateralized financing entity to eliminate any differences between their respective fair values. In the event a reporting entity does not elect to utilize the measurement alternative, the update clarifies that the fair value of the financial assets and liabilities of the consolidated collateralized financing entity should be measured using the requirements of Topic 820 and any differences should be reflected in earnings and attributed to the reporting entity in the consolidated statement of income (loss). This update is effective for periods beginning after December 15, 2015. We do not believe this update will have an impact on our financial condition or results of operations.
| ITEM 7A. | QUANTITATIVE AND QUALITATIVE DISCLOSURES ABOUT MARKET RISK |
Our business activities contain elements of risk. We consider the principal types of risk to be fluctuations in interest rates and portfolio valuations. We consider the management of risk essential to conducting our businesses. Accordingly, our risk management systems and procedures are designed to identify and analyze our risks, to set appropriate policies and limits, and to continually monitor these risks and limits by means of reliable administrative and information systems and other policies and programs.
We value our portfolio at fair value as determined in good faith by the Board of Directors in accordance with our valuation policy. Unlike certain lending institutions, we are not permitted to establish reserves for loan losses. Instead, we must value each individual investment and portfolio loan on a quarterly basis. We record unrealized depreciation on investments and loans when we believe that an asset has been impaired and full collection is unlikely. We record unrealized appreciation on equities if we have a clear indication that the underlying portfolio company has appreciated in value and, therefore, our equity investment has also appreciated in value. Without a readily ascertainable market value, the estimated value of our portfolio of investments and loans may differ significantly from the values that would be placed on the portfolio if there existed a ready market for the investments. We adjust the valuation of the portfolio quarterly to reflect our Board of Directors’ estimate of the current fair value of each investment in the portfolio. Any changes in estimated fair value are recorded in our statement of operations as net unrealized appreciation (depreciation) on investments. Our investment in Medallion Bank, as a wholly-owned portfolio investment, is also subject to quarterly assessments of its fair value. We conduct a thorough valuation analysis, and also receive an opinion regarding the valuation from an independent third party to assist the Board of Directors in its determination of the fair value of Medallion Bank. We determine whether any factors give rise to valuation different than recorded book value. As a result of this valuation process, we had previously used Medallion Bank’s actual results of operations as the best estimate of changes in fair value, and recorded the results as a component of unrealized appreciation (depreciation) on investments. In the second quarter of 2015, we became aware of external interest in Medallion Bank and its portfolio’s assets at values in excess of their book value. We incorporated these new factors in the Medallion Bank’s fair value analysis and the Board of Directors determined that Medallion Bank had a fair value in excess of book value. We also engaged a valuation specialist to assist the Board of Directors in their determination of Medallion Bank’s fair value, and this appreciation of $15,500,000 was thereby recorded in 2015 as a component of unrealized appreciation (depreciation) on investments, in addition to Medallion Bank’s actual results of operations for the year ended December 31, 2015. For more information, see “Risk Factors – Risks Relating to Our Business and Structure – Our investment portfolio is, and will continue to be, recorded at fair value as determined in good faith by our Board of Directors and, as a result, there is, and will continue to be, uncertainty as to the value of our portfolio investments which could adversely affect our net asset value.”
In addition, the illiquidity of our loan portfolio and investments may adversely affect our ability to dispose of loans at times when it may be advantageous for us to liquidate such portfolio or investments. In addition, if we were required to liquidate some or all of the investments in the portfolio, the proceeds of such liquidation may be significantly less than the current value of such investments. Because we borrow money to make loans and investments, our net operating income is dependent upon the difference between the rate at which we borrow funds and the rate at which we invest these funds. As a result, there can be no assurance that a significant change in market interest rates will not have a material adverse effect on our interest income. In periods of sharply rising interest rates, our cost of funds would increase, which would reduce our net operating income before net realized and unrealized gains.
59
Table of Contents
We use a combination of long-term and short-term borrowings and equity capital to finance our investing activities. Our long-term fixed-rate investments are financed primarily with short-term floating-rate debt, and to a lesser extent by term fixed-rate debt. We may use interest rate risk management techniques in an effort to limit our exposure to interest rate fluctuations. Such techniques may include various interest rate hedging activities to the extent permitted by the 1940 Act. We have analyzed the potential impact of changes in interest rates on net interest income. Assuming that the balance sheet were to remain constant and no actions were taken to alter the existing interest rate sensitivity, and including the impact on Medallion Bank, a hypothetical immediate 1% increase in interest rates would result in an increase to the line item “net increase in net assets resulting from operations” as of December 31, 2015 by $692,000 on an annualized basis, compared to a positive impact of $1,279,000 at December 31, 2014, and the impact of such an immediate increase of 1% over a one year period would have been ($1,855,000) at December 31, 2015, compared to ($1,634,000) at December 31, 2014. Although management believes that this measure is indicative of our sensitivity to interest rate changes, it does not adjust for potential changes in credit quality, size, and composition of the assets on the balance sheet, and other business developments that could affect net increase in net assets resulting from operations in a particular quarter or for the year taken as a whole. Accordingly, no assurances can be given that actual results would not differ materially from the potential outcome simulated by these estimates.
| ITEM 8. | FINANCIAL STATEMENTS AND SUPPLEMENTARY DATA |
Reference is made to the financial statements set forth under Item 15 (A) (1) in this Annual Report on Form 10-K, which financial statements are incorporated herein by reference in response to this Item 8.
| ITEM 9. | CHANGES IN AND DISAGREEMENTS WITH ACCOUNTANTS ON ACCOUNTING AND FINANCIAL DISCLOSURE |
None.
| ITEM 9A. | CONTROLS AND PROCEDURES |
Disclosure Controls and Procedures
As required by Rule 13a-15(b) under the Exchange Act, our management, including our Chief Executive Officer and Chief Financial Officer, have evaluated the effectiveness of our disclosure controls and procedures as of the end of the fiscal year covered by this annual report. As a result of this evaluation, we have concluded that our disclosure controls and procedures were effective as of December 31, 2015.
Changes in Internal Control over Financial Reporting
As required by Rule 13a-15(d) under the Exchange Act, our management, including our Chief Executive Officer and Chief Financial Officer, have evaluated our internal control over financial reporting to determine whether any changes occurred during the 2015 fourth quarter that have materially affected, or are reasonably likely to materially affect, our internal control over financial reporting, and have concluded that there have been no changes that occurred during the 2015 fourth quarter that have materially affected, or are reasonably likely to materially affect, our internal control over financial reporting.
60
Table of Contents
Management’s Annual Report on Internal Control over Financial Reporting
Our management is responsible for establishing and maintaining adequate internal control over financial reporting. Internal control over financial reporting is defined in Rule 13a-15(f) and 15d-15(f) promulgated under the Exchange Act as a process designed by, or under the supervision of, our principal executive and principal financial officers and effected by our Board of Directors, management, and other personnel, to provide reasonable assurance regarding the reliability of financial reporting and the preparation of financial statements for external purposes in accordance with generally accepted accounting principles, and includes those policies and procedures that:
| • | Pertain to the maintenance of records that in reasonable detail accurately and fairly reflect the transactions and dispositions of our assets; |
| • | Provide reasonable assurance that transactions are recorded as necessary to permit preparation of financial statements in accordance with generally accepted accounting principles, and that our receipts and expenditures are being made only in accordance with authorizations of our management and directors; and |
| • | Provide reasonable assurance regarding prevention or timely detection of unauthorized acquisition, use, or disposition of our assets that could have a material effect on the financial statements. |
Because of its inherent limitations, internal control over financial reporting may not prevent or detect misstatements. Projections of any evaluation of effectiveness to future periods are subject to the risk that controls may become inadequate because of changes in conditions, or that the degree of compliance with the policies or procedures may deteriorate.
Our management assessed the effectiveness of our internal control over financial reporting as of December 31, 2015. In making this assessment, management used the criteria set forth by the Committee of Sponsoring Organizations of the Treadway Commission (“COSO”) in Internal Control-Integrated Framework (2013). Based on its assessment and those criteria, management believes that we maintained effective internal control over financial reporting as of December 31, 2015.
We believe that the consolidated financial statements included in this report fairly represent our consolidated financial position and consolidated results of operations for all periods presented.
Our Independent Registered Public Accounting Firm, WeiserMazars LLP, has audited and issued a report on management’s assessment of our internal control over financial reporting. The report of WeiserMazars LLP appears below.
61
Table of Contents
Report Of Independent Registered Public Accounting Firm
To the Board of Directors and Shareholders of Medallion Financial Corp.
We have audited Medallion Financial Corp. and subsidiaries’ (the “Company”) internal control over financial reporting as of December 31, 2015, based on criteria established in Internal Control – Integrated Framework (2013) issued by the Committee of Sponsoring Organizations of the Treadway Commission (“COSO”). The Company’s management is responsible for maintaining effective internal control over financial reporting and for its assessment of the effectiveness of internal control over financial reporting, included in the accompanying Management’s Annual Report on Internal Control over Financial Reporting. Our responsibility is to express an opinion on the Company’s internal control over financial reporting based on our audit.
We conducted our audit in accordance with the standards of the Public Company Accounting Oversight Board (United States). Those standards require that we plan and perform the audit to obtain reasonable assurance about whether effective internal control over financial reporting was maintained in all material respects. Our audit of internal control over financial reporting included obtaining an understanding of internal control over financial reporting, assessing the risk that a material weakness exists, and testing and evaluating the design and operating effectiveness of internal control, based on the assessed risk. Our audit also included performing such other procedures as we considered necessary in the circumstances. We believe that our audit provides a reasonable basis for our opinion.
A company’s internal control over financial reporting is a process designed to provide reasonable assurance regarding the reliability of financial reporting and the preparation of financial statements for external purposes in accordance with generally accepted accounting principles. A company’s internal control over financial reporting includes those policies and procedures that (1) pertain to the maintenance of records that, in reasonable detail, accurately and fairly reflect the transactions and dispositions of the assets of the company; (2) provide reasonable assurance that transactions are recorded as necessary to permit preparation of financial statements in accordance with generally accepted accounting principles, and that receipts and expenditures of the company are being made only in accordance with authorizations of management and directors of the company; and (3) provide reasonable assurance regarding prevention or timely detection of unauthorized acquisition, use, or disposition of the company’s assets that could have a material effect on the financial statements.
Because of its inherent limitations, internal control over financial reporting may not prevent or detect misstatements. Also, projections of any evaluation of effectiveness to future periods are subject to the risk that controls may become inadequate because of changes in conditions, or that the degree of compliance with the policies and procedures may deteriorate.
In our opinion, the Company maintained, in all material respects, effective internal control over financial reporting as of December 31, 2015, based on criteria established in Internal Control-Integrated Framework (2013) issued by the Committee of Sponsoring Organizations of the Treadway Commission.
We also have audited, in accordance with the standards of the Public Company Accounting Oversight Board (United States), the consolidated balance sheets of the Company including the consolidated summary schedule of investments, as of December 31, 2015 and 2014, and the related consolidated statements of operations, changes in net assets, and cash flows for each of the three years in the three-year period ended December 31, 2015, and the selected financial ratios and other data for each of the five years in the five-year period ended December 31, 2015, and our report dated March 7, 2016 expressed an unqualified opinion.
/s/ WeiserMazars LLP
New York, New York
March 7, 2016
62
Table of Contents
| ITEM 9B. | OTHER INFORMATION |
None.
| ITEM 10. | DIRECTORS, EXECUTIVE OFFICERS AND CORPORATE GOVERNANCE |
Incorporated by reference from our Definitive Proxy Statement expected to be filed by April 29, 2016 for our fiscal year 2016 Annual Meeting of Shareholders under the captions “Our Directors and Executive Officers” and “Corporate Governance.”
| ITEM 11. | EXECUTIVE COMPENSATION |
Incorporated by reference from our Definitive Proxy Statement expected to be filed by April 29, 2016 for our fiscal year 2016 Annual Meeting of Shareholders under the caption “Executive Compensation.”
| ITEM 12. | SECURITY OWNERSHIP OF CERTAIN BENEFICIAL OWNERS AND MANAGEMENT AND RELATED STOCKHOLDER MATTERS |
Incorporated by reference from our Definitive Proxy Statement expected to be filed by April 29, 2016 for our fiscal year 2016 Annual Meeting of Shareholders under the captions “Stock Ownership of Certain Beneficial Owners and Management” and “Equity Compensation Plan Information.”
| ITEM 13. | CERTAIN RELATIONSHIPS AND RELATED TRANSACTIONS, AND DIRECTOR INDEPENDENCE |
Incorporated by reference from our Definitive Proxy Statement expected to be filed by April 29, 2016 for our fiscal year 2016 Annual Meeting of Shareholders under the captions “Certain Relationships and Related Party Transactions”, “Our Directors and Executive Officers,” and “Corporate Governance.”
| ITEM 14. | PRINCIPAL ACCOUNTANT FEES AND SERVICES |
Incorporated by reference from our Definitive Proxy Statement expected to be filed by April 29, 2016 for our fiscal year 2016 Annual Meeting of Shareholders under the caption “Principal Accountant Fees and Services.”
| ITEM 15. | EXHIBITS AND FINANCIAL STATEMENT SCHEDULES |
(A) 1. FINANCIAL STATEMENTS
The consolidated financial statements of Medallion Financial Corp. and the Report of Independent Public Accountants thereon are included as set forth on the Index to Financial Statements on F-1.
2. FINANCIAL STATEMENT SCHEDULES
See Index to Financial Statements on F-1.
3. EXHIBITS
63
Table of Contents
| Number |
Description | |
| 3.1(a) | Restated Medallion Financial Corp. Certificate of Incorporation. Filed as Exhibit 2(a) to the Company’s Registration Statement on Form N-2 (File No. 333-1670) and incorporated by reference herein. | |
| 3.1(b) | Amendment to Restated Certificate of Incorporation. Filed as Exhibit 3.1.1 to the Quarterly Report on Form 10-Q for the quarterly period ended June 30, 1998 (File No. 814-00188) and incorporated by reference herein. | |
| 3.2 | Restated By-Laws. Filed as Exhibit (b) to the Company’s Registration Statement on Form N-2 (File No. 333-1670) and incorporated by reference herein. | |
| 4.1 | Fixed/Floating Rate Junior Subordinated Note, dated June 7, 2007, by Medallion Financial Corp., in favor of Medallion Financing Trust I. Filed as Exhibit 4.1 to the Current Report on Form 8-K filed on June 11, 2007 (File No. 814-00188) and incorporated by reference herein. | |
| 10.1 | First Amended and Restated Employment Agreement, between Medallion Financial Corp. and Alvin Murstein dated May 29, 1998. Filed as Exhibit 10.19 to the Annual Report on Form 10-K for the fiscal year ended December 31, 1998 (File No. 814-00188) and incorporated by reference herein.* | |
| 10.2 | First Amended and Restated Employment Agreement, between Medallion Financial Corp. and Andrew Murstein dated May 29, 1998. Filed as Exhibit 10.20 to the Annual Report on Form 10-K for the fiscal year ended December 31, 1998 (File No. 814-00188) and incorporated by reference herein.* | |
| 10.3 | Employment Agreement, dated August 3, 2006, by and between Medallion Financial Corp. and Michael Kowalsky. Filed as Exhibit 10.1 to the Current Report on Form 8-K filed on August 4, 2006 (File No. 814-00188) and incorporated by reference herein.* | |
| 10.4 | Medallion Financial Corp. Amended and Restated 1996 Stock Option Plan. Filed as Exhibit 10.1 to the Quarterly Report on Form 10-Q for the quarterly period ended June 30, 2002 (File No. 814-00188) and incorporated by reference herein.* | |
| 10.5 | 2006 Employee Stock Option Plan. Filed as Exhibit II to our definitive proxy statement for our 2006 Annual Meeting of Shareholders filed on April 28, 2006 (File No. 814-00188) and incorporated by reference herein.* | |
| 10.6 | First Amended and Restated 2006 Non-Employee Director Stock Option Plan. Filed as Exhibit B to Amendment No. 3 to Form 40-APP filed on June 18, 2012 (File No. 812-13666) and incorporated by reference herein.* | |
| 10.7 | 2009 Employee Restricted Stock Plan. Filed as Exhibit I to our definitive proxy statement for our 2010 Annual Meeting of Shareholders filed on April 29, 2010 (File No. 814-00188) and incorporated by reference herein.* | |
| 10.8 | Non-Employee Director Compensation Summary Sheet. Filed herewith.* | |
| 10.9 | Indenture of Lease, dated October 31, 1997, by and between Sage Realty Corporation, as Agent and Landlord, and Medallion Financial Corp., as Tenant. Filed as Exhibit 10.64 to the Annual Report on Form 10-K for the fiscal year ended December 31, 1997 (File No. 814-00188) and incorporated by reference herein. | |
| 10.10 | First Amendment of Lease, dated September 6, 2005, by and between Medallion Financial Corp. and Sage Realty Corporation. Filed as Exhibit 10.1 to the Current Report on Form 8-K filed on September 12, 2005 (File No. 814-00188) and incorporated by reference herein. | |
| 10.11 | Second Amendment of Lease, dated August 5, 2015, by and between Sage Realty Corporation and Medallion Financial Corp. Filed as Exhibit 10.1 to the Current Report on form 8-K filed on August 7, 2015 (File No. 814-00188) and incorporated by reference herein. | |
64
Table of Contents
| 10.12 | Amended and Restated Loan and Security Agreement, dated as of March 28, 2011, by and among Medallion Financial Corp., Medallion Funding LLC and Sterling National Bank. Filed as Exhibit 10.1 to the Current Report on Form 8-K filed on April 1, 2011 (File No. 814-00188) and incorporated by reference herein. | |
| 10.13 | First Amendment to Amended and Restated Loan and Security Agreement, dated September 1, 2011, by and among Medallion Financial Corp., Medallion Funding LLC and Sterling National Bank. Filed as Exhibit 10.1 to the Current Report on Form 8-K filed on September 7, 2011 (File No. 814-00188) and incorporated by reference herein. | |
| 10.14 | Second Amendment to Amended and Restated Loan and Security Agreement, dated January 8, 2013, by and among Medallion Financial Corp., Medallion Funding LLC and Sterling National Bank. Filed as Exhibit 10.1 to the Current Report on Form 8-K filed on January 11, 2013 (File No. 814-00188) and incorporated by reference herein. | |
| 10.15 | Third Amendment to Amended and Restated Loan and Security Agreement, dated October 23, 2013, by and among Medallion Financial Corp., Medallion Funding LLC and Sterling National Bank. Filed as Exhibit 10.1 to the Current Report on Form 8-K filed on November 5, 2013 (File No. 814-00188) and incorporated by reference herein. | |
| 10.16 | Fourth Amendment to Amended and Restated Loan and Security Agreement, dated August 11, 2014, by and among Medallion Financial Corp., Medallion Funding LLC and Sterling National Bank. Filed as Exhibit 10.1 to the Current Report on Form 8-K filed on August 14, 2014 (File No. 814-00188) and incorporated by reference herein. | |
| 10.17 | Amended and Restated Unlimited Guaranty, dated March 28, 2011, by Medallion Funding LLC, in favor of Sterling National Bank. Filed as Exhibit 10.2 to the Current Report on Form 8-K filed on April 1, 2011 (File No. 814-00188) and incorporated by reference herein. | |
| 10.18 | Commitment Letter, dated March 1, 2006, by the Small Business Administration to Medallion Capital, Inc., accepted and agreed to by Medallion Capital, Inc. on March 8, 2006. Filed as Exhibit 10.1 to the Current Report on Form 8-K filed on March 9, 2006 (File No. 814-00188) and incorporated by reference herein. | |
| 10.19 | Commitment Letter, dated September 20, 2006, by the Small Business Administration to Freshstart Venture Capital Corp., accepted and agreed to by Freshstart Venture Capital Corp. on October 10, 2006. Filed as Exhibit 10.1 to the Current Report on Form 8-K filed on October 11, 2006 (File No. 814-00188) and incorporated by reference herein. | |
| 10.20 | Commitment Letter, dated September 1, 2010, by the Small Business Administration to Medallion Capital, Inc., accepted and agreed to by Medallion Capital, Inc. on September 7, 2010. Filed as Exhibit 10.2 to the Current Report on Form 8-K filed on September 13, 2010 (File No. 814-00188) and incorporated by reference herein. | |
| 10.21 | Commitment Letter, dated September 1, 2010, by the Small Business Administration to Freshstart Venture Capital Corp., accepted and agreed to by Freshstart Venture Capital Corp. on September 8, 2010. Filed as Exhibit 10.1 to the Current Report on Form 8-K filed on September 13, 2010 (File No. 814-00188) and incorporated by reference herein. | |
| 10.22 | Commitment Letter, dated January 25, 2013, by the Small Business Administration to Medallion Capital, Inc., accepted and agreed to by Medallion Capital, Inc. on January 28, 2013. Filed as Exhibit 10.1 to the Current Report on Form 8-K filed on January 30, 2013 (File No. 814-00188) and incorporated by reference herein. | |
| 10.23 | Commitment Letter, dated February 6, 2013, by the Small Business Administration to Freshstart Venture Capital Corp., accepted and agreed to by Freshstart Venture Capital Corp. on February 13, 2013. Filed as Exhibit 10.1 to Current Report on Form 8-K filed on February 14, 2013 (File No. 814-00188) and incorporated by reference herein. | |
| 10.24 | Commitment Letter, dated July 29, 2013, by the Small Business Administration to Freshstart Venture Capital Corp., accepted and agreed to by Freshstart Venture Capital Corp. on August 1, 2013. Filed as Exhibit 10.1 to the Current Report on Form 8-K filed on August 5, 2013 (File No. 814-00188) and incorporated by reference herein. | |
65
Table of Contents
| 10.25 | Commitment Letter, dated September 2, 2014, by the Small Business Administration to Medallion Capital, Inc., accepted and agreed to by Medallion Capital, Inc. on September 2, 2014. Filed as Exhibit 10.1 to the Quarterly period ended September 30, 2014 (File No. 814.00188) and incorporated by reference herein. | |
| 10.26 | Commitment Letter, dated April 15, 2015, by the Small Business Administration to Medallion Capital, Inc., accepted and agreed to by Medallion Capital, Inc. on April 20, 2015. Filed as Exhibit 10.1 to the Current Report on Form 8-K filed on April 21, 2015 (File No. 814-00188) and incorporated by reference herein. | |
| 10.27 | Commitment Letter, dated October 27, 2015, by the Small Business Administration to Medallion Capital, Inc., accepted and agreed to by Medallion Capital, Inc. on November 2, 2015. Filed as Exhibit 10.1 to the Current Report on Form 8-K filed on November 3, 2015 (filed No. 814-00188) and incorporated by reference herein. | |
| 10.28 | Junior Subordinated Indenture, dated as of June 7, 2007, between Medallion Financing Trust I and Wilmington Trust Company as trustee. Filed as Exhibit 10.1 to the Current Report on Form 8-K filed on June 11, 2007 (File No. 814-00188) and incorporated by reference herein. | |
| 10.29 | Amended and Restated Trust Agreement, dated as of June 7, 2007, among Medallion Financial Corp. as depositor, Wilmington Trust Company as property trustee and Delaware trustee and the Administrative Trustees named therein. Filed as Exhibit 10.2 to the Current Report on Form 8-K filed on June 11, 2007 (File No. 814-00188) and incorporated by reference herein. | |
| 10.30 | Purchase Agreement, dated as of June 7, 2007, among Medallion Financial Corp., Medallion Financing Trust I, and Merrill Lynch International. Filed as Exhibit 10.3 to the Current Report on Form 8-K filed on June 11, 2007 (File No. 814-00188) and incorporated by reference herein. | |
| 10.31 | Loan and Security Agreement, dated as of December 12, 2008, among Taxi Medallion Loan Trust III, Autobahn Funding Company LLC, as Lender, and DZ Bank AG Deutsche Zentral-Genossenschaftsbank, Frankfurt am Main, as Agent. Filed as Exhibit 10.1 to the Current Report on Form 8-K filed on December 16, 2008 (File No. 814-00188) and incorporated by reference herein. | |
| 10.32 | Amendment No. 1 to Loan and Security Agreement, dated as of August 5, 2009, by and among Taxi Medallion Loan Trust III, Autobahn Funding Company LLC, as Lender, and DZ Bank AG Deutsche Zentral-Genossenschaftsbank, Frankfurt am Main, as Agent. Filed as Exhibit 10.1 to the Current Report on Form 8-K filed on August 10, 2009 (File No. 814-00188) and incorporated by reference herein. | |
| 10.33 | Servicing Agreement, dated as of December 12, 2008, by and among Taxi Medallion Loan Trust III, Medallion Funding Corp., and DZ Bank AG Deutsche Zentral-Genossenschaftsbank, Frankfurt am Main. Filed as Exhibit 10.2 to the Current Report on Form 8-K filed on December 16, 2008 (File No. 814-00188) and incorporated by reference herein. | |
| 10.34 | Loan Sale and Contribution Agreement, dated December 12, 2008, by and between Medallion Funding Corp. and Taxi Medallion Loan Trust III. Filed as Exhibit 10.3 to the Current Report on Form 8-K filed on December 16, 2008 (File No. 814-00188) and incorporated by reference herein. | |
| 10.35 | Limited Recourse Guaranty, dated as of December 12, 2008, by Medallion Funding Corp., in favor of Autobahn Funding Company LLC, as Lender, and DZ Bank AG Deutsche Zentral-Genossenschaftsbank, Frankfurt am Main, as Agent. Filed as Exhibit 10.5 to the Current Report on Form 8-K filed on December 16, 2008 (File No. 814-00188) and incorporated by reference herein. | |
| 10.36 | Performance Guaranty, dated as of December 12, 2008, by Medallion Financial Corp., in favor of Taxi Medallion Loan Trust III, Autobahn Funding Company LLC, as Lender, and DZ Bank AG Deutsche Zentral-Genossenschaftsbank, Frankfurt am Main, as Agent. Filed as Exhibit 10.6 to the Current Report on Form 8-K filed on December 16, 2008 (File No. 814-00188) and incorporated by reference herein. | |
66
Table of Contents
| 10.37 | Reaffirmation Agreement, dated as of February 26, 2010, by and among Medallion Funding LLC, Taxi Medallion Loan Trust III, DZ Bank AG Deutsche Zentral-Genossenschaftsbank, Frankfurt am Main, in its capacity as Agent, and Wells Fargo Bank, National Association. Filed as Exhibit 10.2 to the Current Report on Form 8-K filed on March 5, 2010 (File No. 814-00188) and incorporated by reference herein. | |
| 10.38 | Custodial Agreement, dated as of December 12, 2008, among DZ Bank AG Deutsche Zentral-Genossenschaftsbank, Frankfurt am Main, Taxi Medallion Loan Trust III, Wells Fargo Bank, National Association, and Medallion Funding Corp. Filed as Exhibit j.2 to the Registration Statement on Form N-2 filed on December 20, 2011 (File No. 333-178644) and incorporated by reference herein. | |
| 10.39 | Omnibus Amendment, dated as of December 12, 2013, by and among Taxi Medallion Loan Trust III, Medallion Funding LLC, Medallion Financial Corp., Medallion Capital, Inc., Freshstart Venture Capital Corp., Autobahn Funding Company LLC, and DZ Bank AG Deutsche Zentral-Genossenschaftsbank, Frankfurt am Main. Filed as Exhibit 10.1 to the Current Report on Form 8-K filed on December 16, 2013 (File No. 814-00188) and incorporated by reference herein. | |
| 10.40 | Amendment No. 4 to Loan and Security Agreement, dated as of December 28, 2015, by and among Taxi Medallion Loan Trust III, Autobahn Funding Company LLC, and DZ Bank AG Deutsche Zentral-Genossenschaftsbank, Frankfurt am Main. Filed as Exhibit 10.1 to the Current Report on Form 8-K filed on December 29, 2015 (File No. 814-00188) and incorporated by reference herein. | |
| 10.41 | Second Amended and Restated Trust Agreement, dated as of December 12, 2013, by and between Medallion Funding LLC and US Bank Trust, N.A. Filed as Exhibit 10.2 to the Current Report on Form 8-K filed on December 16, 2013 (File No. 814-00188) and incorporated by reference herein. | |
| 10.42 | Custodian Agreement, effective July 23, 2003, among Wells Fargo Bank Minnesota, National Association, as custodian, and Medallion Financial Corp., Medallion Funding Corp. and Freshstart Venture Capital Corp. Filed as Exhibit j.1 to the Registration Statement on Form N-2 filed on December 20, 2011 (File No. 333-178644) and incorporated by reference herein. | |
| 12.1 | Computation of ratio of debt to equity. Filed herewith. | |
| 21.1 | List of Subsidiaries of Medallion Financial Corp. Filed herewith. | |
| 23.1 | Consent of WeiserMazars LLP, independent registered public accounting firm, related to reports on financial statements of Medallion Financial Corp. and Medallion Bank. Filed herewith. | |
| 31.1 | Certification of Alvin Murstein pursuant to Rule 13a-14(a) and 15d-14(a) as adopted pursuant to section 302 of the Sarbanes-Oxley Act of 2002. Filed herewith. | |
| 31.2 | Certification of Larry D. Hall pursuant to Rule 13a-14(a) and 15d-14(a) as adopted pursuant to section 302 of the Sarbanes-Oxley Act of 2002. Filed herewith. | |
| 32.1 | Certification of Alvin Murstein pursuant to 18 USC. Section 1350, as adopted, pursuant to Section 906 of the Sarbanes-Oxley Act of 2002. Filed herewith. | |
| 32.2 | Certification of Larry D. Hall pursuant to 18 USC. Section 1350, as adopted, pursuant to Section 906 of the Sarbanes-Oxley Act of 2002. Filed herewith. | |
| 99.1 | Consolidated Schedule of Investments for the years ended December 31, 2015 and 2014. | |
| * | Compensatory plan or arrangement required to be identified pursuant to Item 15(a)(3) of this Annual Report on Form 10-K. |
67
Table of Contents
IMPORTANT INFORMATION RELATING TO FORWARD-LOOKING STATEMENTS
The Private Securities Litigation Reform Act of 1995 provides a safe harbor for forward-looking statements so long as those statements are identified as forward-looking and are accompanied by meaningful cautionary statements identifying important factors that could cause actual results to differ materially from those projected in such statements. In connection with certain forward-looking statements contained in this Form 10-K and those that may be made in the future by or on behalf of the Company, the Company notes that there are various factors that could cause actual results to differ materially from those set forth in any such forward-looking statements. The forward-looking statements contained in this Form 10-K were prepared by management and are qualified by, and subject to, significant business, economic, competitive, regulatory, and other uncertainties and contingencies, all of which are difficult or impossible to predict, and many of which are beyond control of the Company. Accordingly, there can be no assurance that the forward-looking statements contained in this Form 10-K will be realized or that actual results will not be significantly higher or lower. The statements have not been audited by, examined by, compiled by, or subjected to agreed-upon procedures by independent accountants, and no third-party has independently verified or reviewed such statements. Readers of this Form 10-K should consider these facts in evaluating the information contained herein. In addition, the business and operations of the Company are subject to substantial risks which increase the uncertainty inherent in the forward-looking statements contained in this Form 10-K. The inclusion of the forward-looking statements contained in this Form 10-K should not be regarded as a representation by the Company or any other person that the forward-looking statements contained in this Form 10-K will be achieved. In light of the foregoing, readers of this Form 10-K are cautioned not to place undue reliance on the forward-looking statements contained herein. These risks and others that are detailed in this Form 10-K and other documents that the Company files from time to time with the Securities and Exchange Commission, including quarterly reports on Form 10-Q and any current reports on Form 8-K, must be considered by any investor or potential investor in the Company.
68
Table of Contents
Pursuant to the requirements of Section 13 or 15(d) of the Securities Exchange of Act of 1934, registrant has duly caused this report to be signed on its behalf by the undersigned, thereunto duly authorized.
MEDALLION FINANCIAL CORP.
| Date: March 7, 2016 | ||
| By: | /s/ Alvin Murstein | |
| Alvin Murstein | ||
| Chairman and Chief Executive Officer | ||
69
Table of Contents
Pursuant to the requirements of the Securities Exchange Act of 1934, this report has been signed below by the following persons on behalf of the Registrant and in the capacities and on the dates indicated.
| Signatures |
Title |
Date | ||
| /s/ Alvin Murstein |
Chairman of the Board of Directors and Chief Executive Officer (Principal Executive Officer) |
March 7, 2016 | ||
| Alvin Murstein |
||||
| /s/Larry D. Hall |
Senior Vice President and Chief Financial Officer (Principal Financial and Accounting Officer) |
March 7, 2016 | ||
| Larry D. Hall |
||||
| /s/ Andrew M. Murstein |
President and Director | March 7, 2016 | ||
| Andrew M. Murstein |
||||
| /s/ Henry L. Aaron |
Director | March 7, 2016 | ||
| Henry L. Aaron |
||||
| /s/ Henry D. Jackson |
Director | March 7, 2016 | ||
| Henry D. Jackson |
||||
| /s/ Stanley Kreitman |
Director | March 7, 2016 | ||
| Stanley Kreitman |
||||
| /s/ Frederick A. Menowitz |
Director | March 7, 2016 | ||
| Frederick A. Menowitz |
||||
| /s/ David L. Rudnick |
Director | March 7, 2016 | ||
| David L. Rudnick |
||||
| /s/ Lowell P. Weicker, Jr. |
Director | March 7, 2016 | ||
| Lowell P. Weicker, Jr. |
||||
70
Table of Contents
MEDALLION FINANCIAL CORP.
INDEX TO FINANCIAL STATEMENTS
F-1
Table of Contents
Report of Independent Registered Public Accounting Firm
To the Board of Directors and Shareholders of Medallion Financial Corp.
We have audited the accompanying consolidated balance sheets of Medallion Financial Corp. and subsidiaries (the “Company”), including the consolidated summary schedule of investments, as of December 31, 2015 and 2014, and the related consolidated statements of operations, changes in net assets, and cash flows for each of the three years in the three-year period ended December 31, 2015 and the selected financial ratios and other data (see note 13) for each of the five years in the five-year period ended December 31, 2015. We have also audited the consolidated schedules of investments in and advances to affiliates as of and for the years ended December 31, 2015 and 2014. These consolidated financial statements, selected financial ratios and other data, and schedules are the responsibility of the Company’s management. Our responsibility is to express an opinion on these consolidated financial statements, selected financial ratios and other data, and schedules based on our audits.
We conducted our audits in accordance with the standards of the Public Company Accounting Oversight Board (United States). Those standards require that we plan and perform the audit to obtain reasonable assurance about whether the consolidated financial statements, selected financial ratios and other data, and schedules are free of material misstatement. An audit includes examining, on a test basis, evidence supporting the amounts and disclosures in the consolidated financial statements. Our procedures included physical inspection or confirmation of securities owned as of December 31, 2015 and 2014. An audit also includes assessing the accounting principles used and significant estimates made by management, as well as evaluating the overall consolidated financial statement presentation. We believe that our audits provide a reasonable basis for our opinion.
In our opinion, the consolidated financial statements and the selected financial ratios and other data referred to above present fairly, in all material respects, the consolidated financial position of the Company as of December 31, 2015 and 2014, and the consolidated results of their operations, changes in net assets, and cash flows for each of the three years in the three-year period ended December 31, 2015 and the selected financial ratios and other data for each of the five years in the five-year period ended December 31, 2015, in conformity with US generally accepted accounting principles. Also, in our opinion, the consolidated schedules of investments in and advances to affiliates, when considered in relation to the basic consolidated financial statements taken as a whole, present fairly, in all material respects, the information set forth therein.
We have also audited, in accordance with the standards of the Public Company Accounting Oversight Board (United States), the Company’s internal control over financial reporting as of December 31, 2015, based on the criteria established in Internal Control- Integrated Framework (2013) issued by the Committee of Sponsoring Organizations of the Treadway Commission (“COSO”), and our report dated March 7, 2016 expressed an unqualified opinion on the effectiveness of the Company’s internal control over financial reporting.
/s/ WeiserMazars LLP
New York, New York
March 7, 2016
F-2
Table of Contents
MEDALLION FINANCIAL CORP.
CONSOLIDATED STATEMENTS OF OPERATIONS
| (Dollars in thousands, except per share data) |
2015 | 2014 | 2013 | |||||||||
| Interest income on investments |
$ | 19,638 | $ | 22,646 | $ | 20,190 | ||||||
| Dividend income from controlled subsidiaries |
18,889 | 15,000 | 12,000 | |||||||||
| Interest income from affiliated investments |
1,748 | 503 | 609 | |||||||||
| Medallion lease income |
1,388 | 1,714 | 1,663 | |||||||||
| Interest income from controlled subsidiaries |
944 | 765 | 406 | |||||||||
| Dividends and interest income on short-term investments |
46 | 440 | 61 | |||||||||
|
|
|
|
|
|
|
|||||||
| Total investment income |
42,653 | 41,068 | 34,929 | |||||||||
|
|
|
|
|
|
|
|||||||
| Total interest expense(1) |
9,422 | 8,543 | 8,361 | |||||||||
|
|
|
|
|
|
|
|||||||
| Net interest income |
33,231 | 32,525 | 26,568 | |||||||||
|
|
|
|
|
|
|
|||||||
| Total noninterest income |
319 | 509 | 1,282 | |||||||||
|
|
|
|
|
|
|
|||||||
| Salaries and benefits |
11,644 | 12,803 | 10,787 | |||||||||
| Professional fees |
1,486 | 1,194 | 1,540 | |||||||||
| Occupancy expense |
877 | 798 | 765 | |||||||||
| Other operating expenses (2) |
2,717 | 3,094 | 2,569 | |||||||||
|
|
|
|
|
|
|
|||||||
| Total operating expenses |
16,724 | 17,889 | 15,661 | |||||||||
|
|
|
|
|
|
|
|||||||
| Net investment income before income taxes (3) |
16,826 | 15,145 | 12,189 | |||||||||
| Income tax (provision) benefit |
— | — | — | |||||||||
|
|
|
|
|
|
|
|||||||
| Net investment income after income taxes |
16,826 | 15,145 | 12,189 | |||||||||
|
|
|
|
|
|
|
|||||||
| Net realized gains (losses) on investments(4) |
7,636 | (5,607 | ) | 692 | ||||||||
|
|
|
|
|
|
|
|||||||
| Net change in unrealized appreciation on Medallion Bank and other controlled subsidiaries |
16,830 | 15,643 | 5,060 | |||||||||
| Net change in unrealized appreciation (depreciation) on investments other than securities |
(9,621 | ) | (2,901 | ) | 6,815 | |||||||
| Net change in unrealized appreciation (depreciation) on investments |
(2,295 | ) | 6,412 | 1,020 | ||||||||
|
|
|
|
|
|
|
|||||||
| Net unrealized appreciation on investments |
4,914 | 19,154 | 12,895 | |||||||||
|
|
|
|
|
|
|
|||||||
| Net realized/unrealized gains on investments |
12,550 | 13,547 | 13,587 | |||||||||
|
|
|
|
|
|
|
|||||||
| Net increase in net assets resulting from operations |
$ | 29,376 | $ | 28,692 | $ | 25,776 | ||||||
|
|
|
|
|
|
|
|||||||
| Net increase in net assets resulting from operations per common share |
||||||||||||
| Basic |
$ | 1.21 | $ | 1.15 | $ | 1.18 | ||||||
| Diluted |
$ | 1.20 | $ | 1.14 | $ | 1.16 | ||||||
|
|
|
|
|
|
|
|||||||
| Distributions declared per share |
$ | 1.00 | $ | 0.96 | $ | 0.90 | ||||||
|
|
|
|
|
|
|
|||||||
| Weighted average common shares outstanding |
||||||||||||
| Basic |
24,315,427 | 24,850,496 | 21,850,415 | |||||||||
| Diluted |
24,391,959 | 25,073,323 | 22,225,783 | |||||||||
|
|
|
|
|
|
|
|||||||
| (1) | Average borrowings outstanding were $361,738, $316,842, and $316,448, and the related average borrowing costs were 2.60%, 2.70%, and 2.64% for the years ended December 31, 2015, 2014, and 2013. |
| (2) | See note 12 for the components of other operating expenses. |
| (3) | Includes $951, $1,020, and $925 of net revenues received from Medallion Bank for the years ended December 31, 2015, 2014, and 2013 primarily for servicing fees, loan origination fees, and expense reimbursements. See notes 3 and 10 for additional information. |
| (4) | There were no net losses on investment securities of affiliate issuers for the years ended December 31, 2015, 2014, and 2013. |
The accompanying notes should be read in conjunction with these consolidated financial statements.
F-3
Table of Contents
MEDALLION FINANCIAL CORP.
| (Dollars in thousands, except per share data) |
December 31, 2015 | December 31, 2014 | ||||||
| Assets |
||||||||
| Medallion loans, at fair value |
$ | 308,408 | $ | 311,894 | ||||
| Commercial loans, at fair value |
58,051 | 55,614 | ||||||
| Commercial loans to affiliated entities, at fair value |
15,496 | 8,798 | ||||||
| Commercial loans to controlled subsidiaries, at fair value |
8,348 | 6,737 | ||||||
| Investment in Medallion Bank and other controlled subsidiaries, at fair value |
159,913 | 136,848 | ||||||
| Equity investments, at fair value |
4,447 | 4,521 | ||||||
| Equity investments in affiliated entities, at fair value |
2,412 | 3,189 | ||||||
| Investment securities, at fair value |
49,884 | — | ||||||
|
|
|
|
|
|||||
| Net investments ($290,151 at December 31, 2015 and $250,684 at December 31, 2014 pledged as collateral under borrowing arrangements) |
606,959 | 527,601 | ||||||
| Cash and cash equivalents ($7,831 at December 31, 2015 and $1,900 at December 31, 2014 restricted as to use by lender (1) |
30,912 | 47,083 | ||||||
| Accrued interest receivable |
1,003 | 988 | ||||||
| Fixed assets, net |
198 | 256 | ||||||
| Investments other than securities (2) |
37,882 | 47,502 | ||||||
| Goodwill, net |
5,099 | 5,099 | ||||||
| Other assets, net (3) |
6,997 | 3,758 | ||||||
|
|
|
|
|
|||||
| Total assets |
$ | 689,050 | $ | 632,287 | ||||
|
|
|
|
|
|||||
| Liabilities |
||||||||
| Accounts payable and accrued expenses |
$ | 5,120 | $ | 6,651 | ||||
| Accrued interest payable |
1,302 | 2,171 | ||||||
| Funds borrowed |
404,540 | 348,795 | ||||||
|
|
|
|
|
|||||
| Total liabilities |
410,962 | 357,617 | ||||||
|
|
|
|
|
|||||
| Commitments and contingencies (4) |
— | — | ||||||
| Shareholders’ equity (net assets) |
||||||||
| Preferred stock (1,000,000 shares of $0.01 par value stock authorized – none outstanding) |
— | — | ||||||
| Common stock (50,000,000 shares of $0.01 par value stock authorized – 26,936,762 shares at December 31, 2015 and 26,797,499 shares at December 31, 2014 issued) |
269 | 268 | ||||||
| Treasury stock at cost (2,590,069 shares at December 31, 2015 and 2,176,876 shares at December 31, 2014) |
(23,396 | ) | (20,184 | ) | ||||
| Capital in excess of par value |
272,349 | 270,775 | ||||||
| Accumulated undistributed net investment loss |
(15,617 | ) | (19,191 | ) | ||||
| Accumulated undistributed net realized gains on investments |
— | — | ||||||
| Net unrealized appreciation on investments |
44,483 | 43,002 | ||||||
|
|
|
|
|
|||||
| Total shareholders’ equity (net assets) |
278,088 | 274,670 | ||||||
|
|
|
|
|
|||||
| Total liabilities and shareholders’ equity |
$ | 689,050 | $ | 632,287 | ||||
|
|
|
|
|
|||||
| Number of common shares outstanding |
24,346,693 | 24,620,623 | ||||||
| Net asset value per share |
$ | 11.42 | $ | 11.16 | ||||
|
|
|
|
|
|||||
| (1) | See Note 2 for additional information. |
| (2) | See Note 17 for additional information. |
| (3) | Includes $3,000 and $0 of dividends receivable from Medallion Bank at December 31, 2015 and 2014. |
| (4) | See Note 9 for additional information. |
The accompanying notes should be read in conjunction with these consolidated financial statements.
F-4
Table of Contents
MEDALLION FINANCIAL CORP.
CONSOLIDATED STATEMENTS OF CHANGES IN NET ASSETS
| Year Ended December 31, | ||||||||||||
| (Dollars in thousands, except per share data) |
2015 | 2014 | 2013 | |||||||||
| Net investment income after income taxes |
$ | 16,826 | $ | 15,145 | $ | 12,189 | ||||||
| Net realized gains (losses) on investments |
7,636 | (5,607 | ) | 692 | ||||||||
| Net unrealized appreciation on investments |
4,914 | 19,154 | 12,895 | |||||||||
|
|
|
|
|
|
|
|||||||
| Net increase in net assets resulting from operations |
29,376 | 28,692 | 25,776 | |||||||||
|
|
|
|
|
|
|
|||||||
| Investment income, net |
(20,042 | ) | (14,974 | ) | (10,608 | ) | ||||||
| Return of capital |
(4,330 | ) | (8,918 | ) | (8,933 | ) | ||||||
| Realized gains from investment transactions, net |
— | — | — | |||||||||
|
|
|
|
|
|
|
|||||||
| Distributions to shareholders (1) |
(24,372 | ) | (23,892 | ) | (19,541 | ) | ||||||
|
|
|
|
|
|
|
|||||||
| Issuance of common stock(2) |
— | — | 45,407 | |||||||||
| Stock – based compensation expense |
1,294 | 1,490 | 1,459 | |||||||||
| Exercise of stock options |
281 | 882 | 4,068 | |||||||||
| Treasury stock acquired |
(3,212 | ) | (5,880 | ) | — | |||||||
| Capitalized stock issuance costs (3) |
— | (117 | ) | — | ||||||||
|
|
|
|
|
|
|
|||||||
| Capital share transactions |
(1,637 | ) | (3,625 | ) | 50,934 | |||||||
| Other, distributions not paid on forfeited restricted stock grants |
51 | — | 8 | |||||||||
|
|
|
|
|
|
|
|||||||
| Total increase in net assets |
3,418 | 1,175 | 57,177 | |||||||||
| Net assets at the beginning of the year |
274,670 | 273,495 | 216,318 | |||||||||
|
|
|
|
|
|
|
|||||||
| Net assets at the end of the year(4) |
$ | 278,088 | $ | 274,670 | $ | 273,495 | ||||||
|
|
|
|
|
|
|
|||||||
| Capital share activity |
||||||||||||
| Common stock issued, beginning of year |
26,797,499 | 26,570,355 | 23,251,937 | |||||||||
| Issuance of common stock(2) |
— | — | 2,900,000 | |||||||||
| Exercise of stock options |
30,449 | 98,396 | 410,765 | |||||||||
| Issuance of restricted stock, net |
108,814 | 128,748 | 7,653 | |||||||||
|
|
|
|
|
|
|
|||||||
| Common stock issued, end of year |
26,936,762 | 26,797,499 | 26,570,355 | |||||||||
|
|
|
|
|
|
|
|||||||
| Treasury stock, beginning of year |
(2,176,876 | ) | (1,600,733 | ) | (1,600,733 | ) | ||||||
| Treasury stock acquired |
(413,193 | ) | (576,143 | ) | — | |||||||
|
|
|
|
|
|
|
|||||||
| Treasury stock, end of year |
(2,590,069 | ) | (2,176,876 | ) | (1,600,733 | ) | ||||||
|
|
|
|
|
|
|
|||||||
| Common stock outstanding |
24,346,693 | 24,620,623 | 24,969,622 | |||||||||
|
|
|
|
|
|
|
|||||||
| (1) | Distributions declared were $1.00, $0.96, and $0.90 per share for the years ended December 31, 2015, 2014, and 2013. |
| (2) | On December 6, 2013, the Company sold 2,900,000 shares at an offering price of $16.40 per share, resulting in net proceeds after closing costs, underwriting commissions, etc. of $45,407 as of December 31, 2013. |
| (3) | Represents additional costs associated with the December 2013 equity offering applied to capital. |
| (4) | Includes $0, $0, and $0 of undistributed net investment income and $0, $0, and $0 of undistributed net realized gains on investments, and $1,447, $9,245, and $9,010 of capital loss carryforwards at December 31, 2015, 2014, and 2013. |
The accompanying notes should be read in conjunction with these consolidated financial statements.
F-5
Table of Contents
MEDALLION FINANCIAL CORP.
CONSOLIDATED STATEMENTS OF CASH FLOWS
| Year ended December 31, | ||||||||||||
| (Dollars in thousands) |
2015 | 2014 | 2013 | |||||||||
| CASH FLOWS FROM OPERATING ACTIVITIES |
||||||||||||
| Net increase in net assets resulting from operations |
$ | 29,376 | $ | 28,692 | $ | 25,776 | ||||||
| Adjustments to reconcile net increase in net assets resulting from operations to net cash provided by operating activities: |
||||||||||||
| Depreciation and amortization |
415 | 483 | 1,095 | |||||||||
| Amortization (accretion) of origination costs (deferred fees), net |
(49 | ) | (103 | ) | 161 | |||||||
| Net change in unrealized (appreciation) depreciation on investments |
2,295 | (6,412 | ) | (1,020 | ) | |||||||
| Net change in unrealized (appreciation) depreciation on investments other than securities |
9,621 | 2,901 | (6,815 | ) | ||||||||
| Increase in unrealized appreciation on Medallion Bank and other controlled subsidiaries |
(16,830 | ) | (15,643 | ) | (5,060 | ) | ||||||
| Net realized (gains) losses on investments |
(7,636 | ) | 5,607 | (692 | ) | |||||||
| Stock-based compensation expense |
1,294 | 1,490 | 1,459 | |||||||||
| (Increase) decrease in accrued interest receivable |
(15 | ) | (81 | ) | 49 | |||||||
| (Increase) decrease in other assets, net |
(3,582 | ) | 9,960 | (2,050 | ) | |||||||
| Increase (decrease) in accounts payable and accrued expenses |
(1,481 | ) | 1,176 | 2,332 | ||||||||
| Increase (decrease) in accrued interest payable |
(869 | ) | 1,047 | (108 | ) | |||||||
|
|
|
|
|
|
|
|||||||
| Net cash provided by operating activities |
12,539 | 29,117 | 15,127 | |||||||||
|
|
|
|
|
|
|
|||||||
| CASH FLOWS FROM INVESTING ACTIVITIES |
||||||||||||
| Investments originated |
(117,540 | ) | (110,477 | ) | (219,231 | ) | ||||||
| Proceeds from principal receipts, sales, and maturities of investments |
57,026 | 83,993 | 211,782 | |||||||||
| (Investments in) capital returned by Medallion Bank and other controlled subsidiaries, net |
(8,525 | ) | (12,581 | ) | (4,480 | ) | ||||||
| Net cash received on disposition of other controlled subsidiaries |
11,969 | — | — | |||||||||
| Capital expenditures |
(82 | ) | 29 | (23 | ) | |||||||
|
|
|
|
|
|
|
|||||||
| Net cash used for investing activities |
(57,152 | ) | (39,036 | ) | (11,952 | ) | ||||||
|
|
|
|
|
|
|
|||||||
| CASH FLOWS FROM FINANCING ACTIVITIES |
||||||||||||
| Proceeds from funds borrowed |
99,242 | 111,980 | 263,981 | |||||||||
| Repayments of funds borrowed |
(49,497 | ) | (84,643 | ) | (273,843 | ) | ||||||
| Issuance of SBA debentures |
12,500 | 12,500 | 25,500 | |||||||||
| Repayments of SBA debentures |
(6,500 | ) | (6,000 | ) | (23,450 | ) | ||||||
| Issuance of common stock, net |
— | (117 | ) | 45,407 | ||||||||
| Proceeds from exercise of stock options |
281 | 882 | 4,068 | |||||||||
| Payments of declared distributions |
(24,372 | ) | (23,892 | ) | (19,541 | ) | ||||||
| Purchase of treasury stock at cost |
(3,212 | ) | (5,880 | ) | — | |||||||
|
|
|
|
|
|
|
|||||||
| Net cash provided by financing activities |
28,442 | 4,830 | 22,122 | |||||||||
|
|
|
|
|
|
|
|||||||
| NET INCREASE (DECREASE) IN CASH AND CASH EQUIVALENTS |
(16,171 | ) | (5,089 | ) | 25,297 | |||||||
| CASH and cash equivalents, beginning of year |
47,083 | 52,172 | 26,875 | |||||||||
|
|
|
|
|
|
|
|||||||
| CASH and cash equivalents, end of year |
$ | 30,912 | $ | 47,083 | $ | 52,172 | ||||||
|
|
|
|
|
|
|
|||||||
| SUPPLEMENTAL INFORMATION |
||||||||||||
| Cash paid during the year for interest |
$ | 10,015 | $ | 7,175 | $ | 7,552 | ||||||
| Cash paid during the year for income taxes |
— | — | — | |||||||||
| Non-cash investing activities-net transfers to (from) other assets |
30 | — | 560 | |||||||||
|
|
|
|
|
|
|
|||||||
The accompanying notes should be read in conjunction with these consolidated financial statements.
F-6
Table of Contents
MEDALLION FINANCIAL CORP.
NOTES TO CONSOLIDATED FINANCIAL STATEMENTS
DECEMBER 31, 2015
(1) ORGANIZATION OF MEDALLION FINANCIAL CORP. AND ITS SUBSIDIARIES
Medallion Financial Corp. (the Company) is a closed-end management investment company organized as a Delaware corporation. The Company has elected to be regulated as a business development company (BDC) under the Investment Company Act of 1940, as amended (the 1940 Act). The Company conducts its business through various wholly-owned subsidiaries including its primary operating company, Medallion Funding LLC (MFC), a Small Business Investment Company (SBIC) which originates and services taxicab medallion and commercial loans.
The Company formed a wholly-owned portfolio company, Medallion Servicing Corporation (MSC), to provide loan services to Medallion Bank, also a portfolio company wholly-owned by the Company. The Company has assigned all of its loan servicing rights for Medallion Bank, which consists of servicing taxi medallion and commercial loans originated by Medallion Bank, to MSC, who bills and collects the related service fee income from Medallion Bank, and is allocated and charged by the Company for MSC’s share of these servicing costs.
The Company also conducts business through Medallion Capital, Inc. (MCI), an SBIC which conducts a mezzanine financing business, and Freshstart Venture Capital Corp. (FSVC), an SBIC which originates and services taxicab medallion and commercial loans. MFC, MCI, and FSVC, as SBICs, are regulated by the Small Business Administration (SBA). MCI and FSVC are financed in part by the SBA. The Company also conducts business through its asset-based lending division, Medallion Business Credit (MBC), an originator of loans to small businesses for the purpose of financing inventory and receivables.
MFC established a wholly-owned subsidiary, Taxi Medallion Loan Trust III (Trust III), for the purpose of owning medallion loans originated by MFC or others. Trust III is a separate legal and corporate entity with its own creditors who, in any liquidation of Trust III, will be entitled to be satisfied out of Trust III’s assets prior to any value in Trust III becoming available to Trust III’s equity holders. The assets of Trust III, aggregating $192,851,000 at December 31, 2015, are not available to pay obligations of its affiliates or any other party, and the assets of affiliates or any other party are not available to pay obligations of Trust III. Trust III’s loans are serviced by MFC.
The Company established a wholly-owned subsidiary, Medallion Financing Trust I (Fin Trust) for the purpose of issuing unsecured preferred securities to investors. Fin Trust is a separate legal and corporate entity with its own creditors who, in any liquidation of Fin Trust, will be entitled to be satisfied out of Fin Trust’s assets prior to any value in Fin Trust becoming available to Fin Trust’s equity holders. The assets of Fin Trust, aggregating $36,151,000 at December 31, 2015, are not available to pay obligations of its affiliates or any other party, and the assets of affiliates or any other party are not available to pay obligations of Fin Trust.
MFC through several wholly-owned subsidiaries (together, Medallion Chicago), purchased $8,689,000 of City of Chicago taxicab medallions out of foreclosure, which are leased to fleet operators while being held for sale. The 159 medallions are carried at a fair value of $37,882,000 on the consolidated balance sheet at December 31, 2015, compared to $47,502,000 a year ago, and are considered non-qualifying assets under the 1940 Act.
A wholly-owned portfolio investment, Medallion Bank, a Federal Deposit Insurance Corporation (FDIC) insured industrial bank, originates medallion loans, commercial loans, and consumer loans, raises deposits, and conducts other banking activities (see Note 3). Medallion Bank is subject to competition from other financial institutions and to the regulations of certain federal and state agencies, and undergoes examinations by those agencies.
Medallion Bank is not an investment company, and therefore, is not consolidated with the Company, but instead is treated as a portfolio investment. It was initially formed for the primary purpose of originating commercial loans in three categories: 1) loans to finance the purchase of taxicab medallions, 2) asset-based commercial loans, and 3) SBA 7(a) loans. The loans are marketed and serviced by Medallion Bank’s affiliates who have extensive prior experience in these asset groups. Subsequent to its formation, Medallion Bank began originating consumer loans to finance the purchases of RVs, boats, and other related items, and to finance small scale home improvements.
F-7
Table of Contents
(2) SUMMARY OF SIGNIFICANT ACCOUNTING POLICIES
Use of Estimates
The preparation of the consolidated financial statements in conformity with accounting principles generally accepted in the US requires management to make estimates that affect the amounts reported in the consolidated financial statements and the accompanying notes. Accounting estimates and assumptions are those that management considers to be the most critical to an understanding of the consolidated financial statements because they inherently involve significant judgments and uncertainties. All of these estimates reflect management’s best judgment about current economic and market conditions and their effects based on information available as of the date of these consolidated financial statements. If such conditions change, it is reasonably possible that the judgments and estimates could change, which may result in future impairments of loans and other receivables, investments other than securities, loans held for sale, and investments, among other effects.
Principles of Consolidation
The consolidated financial statements include the accounts of the Company and its wholly-owned subsidiaries, except for Medallion Bank and other portfolio investments. All significant intercompany transactions, balances, and profits have been eliminated in consolidation. As a non-investment company, Medallion Bank is not consolidated with the Company, which is an investment company under the 1940 Act. See Note 3 for the presentation of financial information for Medallion Bank and other controlled subsidiaries.
Cash and Cash Equivalents
The Company considers all highly liquid instruments with an original purchased maturity of three months or less to be cash equivalents. Cash balances are generally held in accounts at large national or regional banking organizations in amounts that frequently exceed the federally insured limits, and includes $1,500,000 related to compensating balance requirements of several regional banking institutions, and $7,831,000 and $1,900,000 pledged to a lender of an affiliate as of December 31, 2015 and 2014.
Fair Value of Assets and Liabilities
The Company follows FASB Accounting Standards Codification Topic 820, Fair Value Measurements and Disclosures, (FASB ASC 820), which defines fair value, establishes a framework for measuring fair value, and expands disclosures about fair value measurements. FASB ASC 820 defines fair value as an exit price (i.e. a price that would be received to sell, as opposed to acquire, an asset or transfer a liability), and emphasizes that fair value is a market-based measurement. It establishes a fair value hierarchy that distinguishes between assumptions developed based on market data obtained from independent external sources and the reporting entity’s own assumptions. Further, it specifies that fair value measurement should consider adjustment for risk, such as the risk inherent in the valuation technique or its inputs. See also Notes 2, 15, and 16 to the consolidated financial statements.
Investment Valuation
The Company’s loans, net of participations and any unearned discount, are considered investment securities under the 1940 Act and are recorded at fair value. As part of the fair value methodology, loans are valued at cost adjusted for any unrealized appreciation (depreciation). Since no ready market exists for these loans, the fair value is determined in good faith by the Board of Directors. In determining the fair value, the Board of Directors considers factors such as the financial condition of the borrower, the adequacy of the collateral, individual credit risks, cash flows of the borrower, market conditions for loans (e.g., values used by other lenders and any active bid/ask market), historical loss experience, and the relationships between current and projected market rates and portfolio rates of interest and maturities. Investments other than securities, which represent collateral received from defaulted borrowers, are valued similarly.
Equity investments (common stock and stock warrants, including certain controlled subsidiary portfolio investments) and investment securities (US Treasuries and mortgage backed bonds), in total representing 35% and 27% of the investment portfolio at December 31, 2015 and 2014, are recorded at fair value, represented as cost, plus or minus unrealized appreciation or depreciation. The fair value of investments that have no ready market are determined in good faith by the Board of Directors, based upon the financial condition and operating performance of the underlying investee companies as well as general market trends for businesses in the same industry. Included in equity investments were marketable securities of $570,000 and $1,408,000 at December 31, 2015 and 2014, and non-marketable securities of $6,289,000 and $6,302,000 in the comparable periods. The $159,913,000 and $136,848,000 related to portfolio investments in controlled subsidiaries at December 31, 2015 and 2014 were all non-marketable in each period. Because of the inherent uncertainty of valuations, the Board of Directors’ estimates of the values of the investments may differ significantly from the values that would have been used had a ready market for the investments existed, and the differences could be material.
The Company’s investment in Medallion Bank, as a wholly owned portfolio investment, is also subject to quarterly assessments of fair value. The Company conducts a thorough valuation analysis as described previously, and also receives an opinion regarding the valuation from an independent third party to assist the Board of Directors in its determination of the fair value of Medallion Bank on an annual basis. The Company’s analysis includes factors such as various regulatory restrictions that were established at Medallion Bank’s inception, by the FDIC and State of Utah, and also by additional regulatory restrictions, such as the
F-8
Table of Contents
prior moratorium imposed by the Dodd-Frank Act on the acquisition of control of an industrial bank by a “commercial firm” (a company whose gross revenues are primarily derived from non-financial activities) which expired in July 2013 and the lack of any new charter issuances since the moratorium’s expiration. Because of these restrictions and other factors, the Company’s Board of Directors had previously determined that Medallion Bank had little value beyond its recorded book value. As a result of this valuation process, the Company had previously used Medallion Bank’s actual results of operations as the best estimate of changes in fair value, and recorded the results as a component of unrealized appreciation (depreciation) on investments. In the second quarter of 2015, the Company became aware of external interest in Medallion Bank and its portfolio’s assets at values in excess of their book value. The Company incorporated these new factors in the Medallion Bank’s fair value analysis and the Board of Directors determined that Medallion Bank had a fair value in excess of book value. The Company also engaged a valuation specialist to assist the Board of Directors in their determination of Medallion Bank’s fair value, and this appreciation of $15,500,000 was thereby recorded in 2015. See Note 3 for additional information about Medallion Bank.
A majority of the Company’s investments consist of long-term loans to persons defined by SBA regulations as socially or economically disadvantaged, or to entities that are at least 50% owned by such persons. Approximately 51% and 59% of the Company’s investment portfolio at December 31, 2015 and 2014 had arisen in connection with the financing of taxicab medallions, taxicabs, and related assets, of which 69% and 68% were in New York City at December 31, 2015 and 2014. These loans are secured by the medallions, taxicabs, and related assets, and are personally guaranteed by the borrowers, or in the case of corporations, are generally guaranteed personally by the owners. A portion of the Company’s portfolio (14% at December 31, 2015 and 2014) represents loans to various commercial enterprises in a wide variety of industries, including manufacturing, retail trade, information services, and other services. Approximately 28% of these loans are made primarily in the metropolitan New York City area, 39% in the Midwest, and the balance is widely scattered across the United States. Investments in controlled unconsolidated subsidiaries, equity investments, and investment securities were 26%, 1%, and 8% at December 31, 2015, and 26%, 1%, and 0% at December 31, 2014.
On a managed basis, which includes the investments of Medallion Bank after eliminating the Company’s investment in Medallion Bank, medallion loans were 43% and 52% at December 31, 2015 and 2014 (74% and 74% in New York City), commercial loans were 8% and 9%, and 41% and 36% were consumer loans in all 50 states collateralized by recreational vehicles, boats, motorcycles, trailers, and home improvements. Investment securities were 6% and 2% at December 31, 2015 and 2014, and equity investments (including investments in controlled subsidiaries) were 2% and 1% at both year ends.
Investment Transactions and Income Recognition
Loan origination fees and certain direct origination costs are deferred and recognized as an adjustment to the yield of the related loans. At December 31, 2015 and 2014, net loan origination costs were $326,000 and $275,000. Net amortization expense (income accretion) for the years ended December 31, 2015, 2014, and 2013 was ($49,000), ($103,000), and $161,000.
Investment securities are purchased from time-to-time in the open market at prices that are greater or lesser than the par value of the investment. The resulting premium or discount is deferred and recognized as an adjustment to the yield of the related investment. At December 31, 2015 and 2014, there were no premiums or discounts on investment securities, and their related income accretion or amortization was immaterial for 2015, 2014, and 2013.
Interest income is recorded on the accrual basis. Taxicab medallion and commercial loans are placed on nonaccrual status, and all uncollected accrued interest is reversed, when there is doubt as to the collectability of interest or principal, or if loans are 90 days or more past due, unless management has determined that they are both well-secured and in the process of collection. Interest income on nonaccrual loans is generally recognized when cash is received, unless a determination has been made to apply all cash receipts to principal. At December 31, 2015, 2014, and 2013, total non-accrual loans were $16,873,000, $11,092,000, and $16,760,000, and represented 4%, 3%, and 5% of the gross medallion and commercial loan portfolio at each year end, and were primarily concentrated in the medallion portfolio. The amount of interest income on nonaccrual loans that would have been recognized if the loans had been paying in accordance with their original terms was $8,306,000, $8,444,000, and $9,826,000 as of December 31, 2015, 2014, and 2013, of which $1,315,000, $1,524,000, and $2,077,000 would have been recognized in the years ended December 31, 2015, 2014, and 2013. The reduction in nonaccrual interest foregone and principal balances reflects the recognition of certain loans as realized losses, and hence removal from the nonaccrual disclosures.
Loan Sales and Servicing Fee Receivable
The Company accounts for its sales of loans in accordance with FASB Accounting Standards Codification Topic 860, Transfers and Servicing (FASB ASC 860) which provides accounting and reporting standards for transfers and servicing of financial assets and extinguishments of liabilities. In accordance with FASB ASC 860, we have elected the fair value measurement method for our servicing assets and liabilities. The principal portion of loans serviced for others by the Company and its affiliates was
F-9
Table of Contents
$406,460,000 and $438,455,000 at December 31, 2015 and 2014, and included $382,919,000 and $410,915,000 of loans serviced for Medallion Bank. The Company has evaluated the servicing aspect of its business in accordance with FASB ASC 860, most of which relates to servicing assets held by Medallion Bank, and determined that no material servicing asset or liability exists as of December 31, 2015 and 2014. The Company has assigned its servicing rights to the Medallion Bank portfolio to MSC, a wholly-owned unconsolidated portfolio investment. The costs of servicing are allocated to MSC by the Company, and the servicing fee income is billed to and collected from Medallion Bank by MSC.
Unrealized Appreciation (Depreciation) and Realized Gains (Losses) on Investments
Unrealized appreciation (depreciation) on investments is the amount by which the fair value estimated by the Company is greater (less) than the cost basis of the investment portfolio. Realized gains or losses on investments are generated through sales of investments, foreclosure on specific collateral, and writeoffs of loans or assets acquired in satisfaction of loans, net of recoveries. Unrealized appreciation on net investments was $44,483,000, $43,002,000, and $34,607,000 as of December 31, 2015, 2014, and 2013. Our investment in Medallion Bank, a wholly owned portfolio investment, is a also subject to quarterly assessments of fair value. We conduct a thorough valuation analysis as described previously, and determine whether any factors give rise to a valuation different than recorded book value, including various regulatory restrictions that were established at Medallion Bank’s inception, by the FDIC and State of Utah, and also by additional marketplace restrictions, such as the ability to transfer industrial bank charters. Because of these restrictions and other factors, the Company’s Board of Directors had previously determined that Medallion Bank had little value beyond its recorded book value. As a result of this valuation process, we had previously used Medallion Bank’s actual results of operations as the best estimate of changes in fair value, and recorded the results as a component of unrealized appreciation (depreciation) on investments. In the second quarter of 2015, we became aware of external interest in Medallion Bank and its portfolio’s assets at values in excess of their book value. We incorporated these new factors in the Medallion Bank’s fair value analysis and the Board of Directors determined that Medallion Bank had a fair value in excess of book value. We also engaged a valuation specialist to assist the Board of Directors in their determination of Medallion Bank’s fair value, and this appreciation of $15,500,000 was thereby recorded in 2015 as a component of unrealized appreciation (depreciation) on investments, in addition to Medallion Bank’s actual results of operations for the quarter. See Note 3 for additional information about Medallion Bank.
The following table sets forth the changes in our unrealized appreciation (depreciation) on investments for the years ended December 31, 2015, 2014, and 2013.
| (Dollars in thousands) |
Medallion Loans |
Commercial Loans |
Investment in Subsidiaries |
Equity Investments |
Investment Securities |
Investments Other Than Securities |
Total | |||||||||||||||||||||
| Balance December 31, 2012 |
$ | — | ($ | 7,844 | ) | $ | — | $ | 44 | $ | — | $ | 33,757 | $ | 25,957 | |||||||||||||
| Net change in unrealized |
||||||||||||||||||||||||||||
| Appreciation on investments |
— | — | 814 | 820 | — | 6,815 | 8,449 | |||||||||||||||||||||
| Depreciation on investments |
— | (129 | ) | — | (376 | ) | — | (56 | ) | (561 | ) | |||||||||||||||||
| Reversal of unrealized appreciation (depreciation) related to realized |
||||||||||||||||||||||||||||
| Gains on investments |
— | — | — | — | — | — | — | |||||||||||||||||||||
| Losses on investments |
— | 397 | — | 365 | — | — | 762 | |||||||||||||||||||||
| Other |
— | 584 | — | (472 | ) | — | (112 | ) | — | |||||||||||||||||||
|
|
|
|
|
|
|
|
|
|
|
|
|
|
|
|||||||||||||||
| Balance December 31, 2013 |
— | (6,992 | ) | 814 | 381 | — | 40,404 | 34,607 | ||||||||||||||||||||
| Net change in unrealized |
||||||||||||||||||||||||||||
| Appreciation on investments |
— | — | 4,884 | 195 | — | (2,900 | ) | 2,179 | ||||||||||||||||||||
| Depreciation on investments |
— | (1,365 | ) | — | 358 | — | 1,141 | 134 | ||||||||||||||||||||
| Reversal of unrealized appreciation (depreciation) related to realized |
||||||||||||||||||||||||||||
| Gains on investments |
— | — | — | — | — | — | — | |||||||||||||||||||||
| Losses on investments |
— | 5,408 | — | 674 | — | — | 6,082 | |||||||||||||||||||||
|
|
|
|
|
|
|
|
|
|
|
|
|
|
|
|||||||||||||||
| Balance December 31, 2014 |
— | (2,949 | ) | 5,698 | 1,608 | — | 38,645 | 43,002 | ||||||||||||||||||||
| Net change in unrealized |
||||||||||||||||||||||||||||
| Appreciation on investments |
— | — | 18,132 | 1,141 | — | (9,621 | ) | 9,652 | ||||||||||||||||||||
| Depreciation on investments |
(3,568 | ) | (176 | ) | 586 | (1,426 | ) | (18 | ) | (68 | ) | (4,670 | ) | |||||||||||||||
| Reversal of unrealized appreciation (depreciation) related to realized |
||||||||||||||||||||||||||||
| Gains on investments |
— | — | (4,809 | ) | (9 | ) | — | — | (4,818 | ) | ||||||||||||||||||
| Losses on investments |
130 | 886 | — | 301 | — | — | 1,317 | |||||||||||||||||||||
| Other (1) |
— | — | (967 | ) | 967 | — | — | — | ||||||||||||||||||||
|
|
|
|
|
|
|
|
|
|
|
|
|
|
|
|||||||||||||||
| Balance December 31, 2015 |
($ | 3,438 | ) | ($ | 2,239 | ) | $ | 18,640 | $ | 2,582 | ($ | 18 | ) | $ | 28,956 | $ | 44,483 | |||||||||||
|
|
|
|
|
|
|
|
|
|
|
|
|
|
|
|||||||||||||||
| (1) | Reclassification of Medallion Motorsports from equity investments to controlled subsidiaries. |
F-10
Table of Contents
The table below summarizes components of unrealized and realized gains and losses in the investment portfolio for the years ended December 31, 2015, 2014, and 2013.
| (Dollars in thousands) |
2015 | 2014 | 2013 | |||||||||
| Net change in unrealized appreciation (depreciation) on investments |
||||||||||||
| Unrealized appreciation |
$ | 288 | $ | 553 | $ | 820 | ||||||
| Unrealized depreciation |
(3,822 | ) | (1,365 | ) | (506 | ) | ||||||
| Net unrealized appreciation on investment in Medallion Bank and other controlled subsidiaries |
21,638 | 15,643 | 5,060 | |||||||||
| Realized gains |
(4,818 | ) | — | — | ||||||||
| Realized losses |
1,317 | 6,082 | 762 | |||||||||
| Net unrealized gains (losses) on investments other than securities and other assets |
(9,689 | ) | (1,759 | ) | 6,759 | |||||||
|
|
|
|
|
|
|
|||||||
| Total |
$ | 4,914 | $ | 19,154 | $ | 12,895 | ||||||
|
|
|
|
|
|
|
|||||||
| Net realized gains (losses) on investments |
||||||||||||
| Realized gains |
$ | 4,818 | $ | — | $ | — | ||||||
| Realized losses |
(1,317 | ) | (6,082 | ) | (762 | ) | ||||||
| Other gains |
4,261 | 434 | 1,368 | |||||||||
| Direct recoveries (chargeoffs) |
(126 | ) | 41 | 86 | ||||||||
| Realized losses on investments other than securities and other assets |
— | — | — | |||||||||
|
|
|
|
|
|
|
|||||||
| Total |
$ | 7,636 | $ | (5,607 | ) | $ | 692 | |||||
|
|
|
|
|
|
|
|||||||
The following table provides additional information on attributes of the nonperforming loan portfolio as of December 31, 2015 and 2014.
| (Dollars in thousands) |
Recorded Investment (1) (2) |
Unpaid Principal Balance |
Average Recorded Investment |
|||||||||
| December 31, 2015 |
||||||||||||
| Medallion (3) |
$ | 12,973 | $ | 13,051 | $ | 13,010 | ||||||
| Commercial (3) |
3,900 | 10,401 | 4,293 | |||||||||
| December 31, 2014 |
||||||||||||
| Medallion |
— | — | — | |||||||||
| Commercial (3) |
11,106 | 17,953 | 11,224 | |||||||||
| (1) | As of December 31, 2015 and 2014, $5,621 and $2,898 of unrealized depreciation had been recorded as a valuation allowance on these loans. |
| (2) | Interest income of $585 and $372 was recognized on these loans for the years ended December 31, 2015 and 2014. |
| (3) | Included in the unpaid principal balance is unearned and paid-in-kind interest on nonaccrual loans of $6,579 and $7,180, which is included in the nonaccrual disclosures in the section titled “Investment Transactions and Income Recognition” on page F-9, as of December 31, 2015 and 2014. |
The following tables show the aging of medallion and commercial loans as of December 31, 2015 and 2014.
| December 31, 2015 (Dollars in thousands) |
Days Past Due | Total | Current | Total | Recorded Investment > 90 Days and Accruing |
|||||||||||||||||||||||
| 31 – 60 | 61 – 90 | 91 + | ||||||||||||||||||||||||||
| Medallion loans |
$ | 17,354 | $ | 10,224 | $ | 11,880 | $ | 39,458 | $ | 271,975 | $ | 311,433 | $ | — | ||||||||||||||
|
|
|
|
|
|
|
|
|
|
|
|
|
|
|
|||||||||||||||
| Commercial loans |
||||||||||||||||||||||||||||
| Secured mezzanine |
— | — | 1,390 | 1,390 | 66,459 | 67,849 | — | |||||||||||||||||||||
| Asset-based receivable |
— | — | — | — | 3,750 | 3,750 | — | |||||||||||||||||||||
| Other secured commercial |
202 | 92 | 945 | 1,239 | 11,383 | 12,622 | — | |||||||||||||||||||||
|
|
|
|
|
|
|
|
|
|
|
|
|
|
|
|||||||||||||||
| Total commercial loans |
202 | 92 | 2,335 | 2,629 | 81,592 | 84,221 | — | |||||||||||||||||||||
|
|
|
|
|
|
|
|
|
|
|
|
|
|
|
|||||||||||||||
| Total |
$ | 17,556 | $ | 10,316 | $ | 14,215 | $ | 42,087 | $ | 353,567 | $ | 395,654 | $ | — | ||||||||||||||
|
|
|
|
|
|
|
|
|
|
|
|
|
|
|
|||||||||||||||
| December 31, 2014 (Dollars in thousands) |
Days Past Due | Total | Current | Total | Recorded Investment > 90 Days and Accruing |
|||||||||||||||||||||||
| 31 – 60 | 61 – 90 | 91 + | ||||||||||||||||||||||||||
| Medallion loans |
$ | 4,279 | $ | 2,463 | $ | — | $ | 6,742 | $ | 304,777 | $ | 311,519 | $ | — | ||||||||||||||
|
|
|
|
|
|
|
|
|
|
|
|
|
|
|
|||||||||||||||
| Commercial loans |
||||||||||||||||||||||||||||
| Secured mezzanine |
— | — | 1,391 | 1,391 | 53,668 | 55,059 | — | |||||||||||||||||||||
| Asset-based receivable |
— | — | 303 | 303 | 3,330 | 3,633 | — | |||||||||||||||||||||
| Other secured commercial |
263 | 390 | — | 653 | 14,853 | 15,506 | — | |||||||||||||||||||||
|
|
|
|
|
|
|
|
|
|
|
|
|
|
|
|||||||||||||||
| Total commercial loans |
263 | 390 | 1,694 | 2,347 | 71,851 | 74,198 | — | |||||||||||||||||||||
|
|
|
|
|
|
|
|
|
|
|
|
|
|
|
|||||||||||||||
| Total |
$ | 4,542 | $ | 2,853 | $ | 1,694 | $ | 9,089 | $ | 376,628 | $ | 385,717 | $ | — | ||||||||||||||
|
|
|
|
|
|
|
|
|
|
|
|
|
|
|
|||||||||||||||
F-11
Table of Contents
A third party finance company sold various participations in asset based loans to Medallion Business Credit and Medallion Bank. In April 2013 the aggregate balance of the participations was approximately $13.8 million, $12.9 million of which were held by Medallion Bank. That amount was divided between seven separate borrowers operating in a variety of industries. In April 2013, the third party finance company became the subject of an involuntary bankruptcy petition filed by its bank lenders. Among other things, the bank lenders alleged that the third party finance company fraudulently misrepresented its borrowing availability under its credit facility with the bank lenders and are seeking the third party finance company’s liquidation. In May 2013, the bankruptcy court presiding over the third party finance company’s case entered an order converting the involuntary chapter 7 case to a chapter 11 case. The Company and Medallion Bank have placed these loans on nonaccrual, and reversed interest income. In addition, the Company and Medallion Bank have established valuation allowances against the outstanding balances. On May 31, 2013, the Company and Medallion Bank commenced an adverse proceeding against the third party finance company and the bank lenders seeking declaratory judgment that the Company’s and Medallion Bank’s loan participations are true participations and not subject to the bankruptcy estate or to the bank lender’s security interest in the third party finance company’s assets. The third party finance company and bank lenders are contesting the Company’s and Medallion Bank’s position. In April 2014, the Company and Medallion Bank received a decision from the court granting summary judgment in their favor with respect to the issue of whether the Company’s and Medallion Bank’s loan participations are true participations. In March 2015, the Company and Medallion Bank received a decision from the court finding that the bank lenders generally held a first lien on the Company’s and Medallion Bank’s loan participations subject to, among other things, defenses still pending prosecution by the parties and adjudication by the court. The Company and Medallion Bank are appealing the decision. The remaining issues are still being litigated. Although the Company and Medallion Bank believe the claims raised by the third party finance company and the bank lenders are without merit and will vigorously defend against them, the Company and Medallion Bank cannot at this time predict the outcome of this litigation or determine their potential exposure. At December 31, 2015, five of the seven secured borrowers had refinanced their loans in full with third parties, and the related proceeds are held in escrow pending resolution of the bankruptcy proceedings. In September 2015, one loan was sold at a discount to a third party, and the related proceeds are held in escrow pending resolution of the bankruptcy proceeding. One loan was charged off in September 2014. The balances related to the paid off loans have been reclassified to other assets on the consolidated balance sheet. The table below summarizes these receivables and their status with the Company and Medallion Bank as of December 31, 2015.
| (Dollars in thousands) |
The Company | Medallion Bank | Total | |||||||||
| Loans outstanding |
$ | 258 | $ | 1,953 | $ | 2,211 | ||||||
| Loans charged off (1) |
(258 | ) | (1,953 | ) | (2,211 | ) | ||||||
| Valuation allowance |
— | — | — | |||||||||
|
|
|
|
|
|
|
|||||||
| Net loans outstanding |
— | — | — | |||||||||
|
|
|
|
|
|
|
|||||||
| Other receivables |
590 | 11,062 | 11,652 | |||||||||
| Valuation allowance |
(236 | ) | (4,425 | ) | (4,661 | ) | ||||||
|
|
|
|
|
|
|
|||||||
| Net other receivables |
354 | 6,637 | 6,991 | |||||||||
| Total net outstanding |
354 | 6,637 | 6,991 | |||||||||
|
|
|
|
|
|
|
|||||||
| Income foregone in 2015 |
16 | 24 | 40 | |||||||||
| Total income foregone |
$ | 74 | $ | 108 | $ | 182 | ||||||
| (1) | The income foregone on the charged off loan was $99 for the Company and $213 for Medallion Bank. |
The following table shows troubled debt restructurings which the Company entered into during the year ended December 31, 2015.
| Troubled Debt Restructuring that Subsequently Defaulted |
||||||||||||||||||||
| December 31, 2015 |
Number of Loans | Pre-Modification Investment |
Post-Modification Investment |
Number of Loans | Recorded Investment |
|||||||||||||||
| (Dollars in thousands) |
||||||||||||||||||||
| Medallion loans |
24 | $ | 13,620 | $ | 15,143 | 12 | $ | 9,459 | ||||||||||||
|
|
|
|
|
|
|
|
|
|
|
|||||||||||
| Commercial loans |
||||||||||||||||||||
| Secured mezzanine |
— | — | — | — | — | |||||||||||||||
| Asset-based receivable |
— | — | — | — | — | |||||||||||||||
| Other secured commercial |
— | — | — | — | — | |||||||||||||||
|
|
|
|
|
|
|
|
|
|
|
|||||||||||
| Total commercial loans |
— | — | — | — | — | |||||||||||||||
|
|
|
|
|
|
|
|
|
|
|
|||||||||||
| Total |
24 | $ | 13,620 | $ | 15,143 | 12 | $ | 9,459 | ||||||||||||
|
|
|
|
|
|
|
|
|
|
|
|||||||||||
F-12
Table of Contents
The Company did not enter into any troubled debt restructurings during the year ended December 31, 2014.
Goodwill
In accordance with ASC Topic 350, “Intangibles – Goodwill and Other,” the Company has determined that it is more likely than not that the relevant reporting unit’s fair value is greater than its carrying amount as of December 31, 2015 and 2014. The results of this evaluation demonstrated no impairment in goodwill for any period evaluated, and management believes, and the Board of Directors concurs, that there is no impairment as of December 31, 2015. The Company conducts annual, and if necessary, more frequent, appraisals of its goodwill, and will recognize any impairment in the period any impairment is identified as a charge to operating expenses.
Fixed Assets
Fixed assets are carried at cost less accumulated depreciation and amortization, and are depreciated on a straight-line basis over their estimated useful lives of 3 to 10 years. Leasehold improvements are amortized on a straight-line basis over the shorter of the lease term or the estimated economic useful life of the improvement. Depreciation and amortization expense was $140,000, $160,000, and $179,000 for the years ended December 31, 2015, 2014, and 2013.
Deferred Costs
Deferred financing costs, included in other assets, represent costs associated with obtaining the Company’s borrowing facilities, and is amortized on a straight line basis over the lives of the related financing agreements. Amortization expense was $276,000, $322,000, and $917,000 for the years ended December 31, 2015, 2014, and 2013. In addition, the Company capitalizes certain costs for transactions in the process of completion (other than business combinations), including those for potential investments, and the sourcing of other financing alternatives. Upon completion or termination of the transaction, any accumulated amounts will be amortized against income over an appropriate period, or written off. The amounts on the balance sheet for all of these purposes were $2,126,000 and $1,815,000 at December 31, 2015 and 2014.
Federal Income Taxes
The Company and each of its major subsidiaries other than Medallion Bank and Medallion Funding LLC (the RIC subsidiaries) have qualified to be treated for federal income tax purposes as regulated investment companies (RICs) under the Internal Revenue Code of 1986, as amended (the Code). As RICs, the Company and each of the RIC subsidiaries are not subject to US federal income tax on any gains or investment company taxable income (which includes, among other things, dividends and interest income reduced by deductible expenses) that it distributes to its shareholders, if at least 90% of its investment company taxable income for that taxable year is distributed. It is the Company’s and the RIC subsidiaries’ policy to comply with the provisions of the Code. The Company’s RIC qualification is determined on an annual basis, and it qualified and filed its federal tax returns as a RIC for 2014 and 2013, and anticipates qualifying and filing as a RIC for 2015. As a result, no provisions for income taxes have been recorded for the years ended December 31, 2015, 2014, and 2013. State and local tax treatment follows the federal model.
The Company has filed tax returns in many states. Federal, New York State, and New York City tax filings of the Company for the tax years 2012 through the present are the more significant filings that are open for examination.
Medallion Bank is not a RIC and is taxed as a regular corporation. Fin Trust, Medallion Funding LLC, and Trust III are not subject to federal income taxation, instead their taxable income is treated as having been earned by the Company.
Net Increase in Net Assets Resulting from Operations per Share (EPS)
Basic earnings per share are computed by dividing net increase in net assets resulting from operations available to common shareholders by the weighted average number of common shares outstanding for the period. Diluted earnings per share reflect the potential dilution that could occur if option contracts to issue common stock were exercised, or if restricted stock vests, and has been computed after giving consideration to the weighted average dilutive effect of the Company’s stock options and restricted stock. The Company uses the treasury stock method to calculate diluted EPS, which is a method of recognizing the use of proceeds that could be obtained upon exercise of options and warrants, including unvested compensation expense related to the shares, in computing diluted EPS. It assumes that any proceeds would be used to purchase common stock at the average market price during the period.
The table below shows the calculation of basic and diluted EPS.
| Years Ended December 31, | ||||||||||||
| (Dollars in thousands) |
2015 | 2014 | 2013 | |||||||||
| Net increase in net assets resulting from operations available to common shareholders |
$ | 29,376 | $ | 28,692 | $ | 25,776 | ||||||
|
|
|
|
|
|
|
|||||||
| Weighted average common shares outstanding applicable to basic EPS |
24,315,427 | 24,850,496 | 21,850,415 | |||||||||
F-13
Table of Contents
| Effect of dilutive stock options |
10,378 | 97,057 | 215,429 | |||||||||
| Effect of restricted stock grants |
66,154 | 125,770 | 159,939 | |||||||||
|
|
|
|
|
|
|
|||||||
| Adjusted weighted average common shares outstanding applicable to diluted EPS |
24,391,959 | 25,073,323 | 22,225,783 | |||||||||
|
|
|
|
|
|
|
|||||||
| Basic earnings per share |
$ | 1.21 | $ | 1.15 | $ | 1.18 | ||||||
| Diluted earnings per share |
1.20 | 1.14 | 1.16 |
Potentially dilutive common shares excluded from the above calculations aggregated 435,254, 148,267, and no shares as of December 31, 2015, 2014, and 2013.
Stock Compensation
The Company follows FASB Accounting Standard Codification Topic 718 (ASC 718), “Compensation – Stock Compensation”, for its stock option and restricted stock plans, and accordingly, the Company recognizes the expense of these grants as required. Stock-based employee compensation costs pertaining to stock options is reflected in net increase in net assets resulting from operations for any new grants using the fair values established by usage of the Black-Scholes option pricing model, expensed over the vesting period of the underlying option. Stock-based employee compensation costs pertaining to restricted stock are reflected in net increase in net assets resulting from operations for any new grants using the grant date fair value of the shares granted, expensed over the vesting period of the underlying stock.
During 2015, 2014, and 2013, the Company issued 162,576, 129,126, and 11,742 restricted shares of stock-based compensation awards, and issued 27,000, 32,000, and 18,000 shares of other stock-based compensation awards, and recognized $1,294,000, $1,490,000, and $1,459,000, or $0.05, $0.06, and $0.07 per diluted common share for each respective year, of non-cash stock-based compensation expense related to the grants. As of December 31, 2015, the total remaining unrecognized compensation cost related to unvested stock options and restricted stock was $1,137,000, which is expected to be recognized over the next 10 quarters (see Note 5).
Distributions to Shareholders
The table below shows the tax character of distributions for tax reporting purposes.
| Years Ended December 31, | ||||||||||||
| (Dollars in thousands) |
2015 | 2014 | 2013 | |||||||||
| Distributions paid from |
||||||||||||
| Investment income, net |
$ | 20,042 | $ | 14,974 | $ | 10,608 | ||||||
| Return of capital |
4,330 | 8,918 | 8,933 | |||||||||
| Realized gains from investment transactions, net |
— | — | — | |||||||||
|
|
|
|
|
|
|
|||||||
| Total distributions |
$ | 24,372 | $ | 23,892 | $ | 19,541 | ||||||
|
|
|
|
|
|
|
|||||||
Our ability to make distributions is restricted by SBA regulations and under the terms of the SBA debentures. As of December 31, 2015, the Company had no undistributed net investment income or realized gains.
Derivatives
The Company manages its exposure to increases in market rates of interest by periodically purchasing interest rate caps to lock in the cost of funds of its variable-rate debt in the event of a rapid run up in interest rates. The Company entered into contracts to purchase interest rate caps on $170,000,000 of notional value of principal from various multinational banks, with termination dates ranging to September 2018. The caps provide for payments to the Company if various LIBOR thresholds are exceeded during the cap terms. Total cap purchases were generally fully expensed when paid, including $81,000, $75,000, and $41,000 in 2015, 2014, and 2013, and all are carried at $0 on the balance sheet at December 31, 2015.
Reclassifications
Certain reclassifications have been made to prior year balances to conform with the current year presentation. These reclassifications have no effect on the previously reported results of operations.
F-14
Table of Contents
(3) INVESTMENT IN MEDALLION BANK AND OTHER CONTROLLED SUBSIDIARIES
The following table presents information derived from Medallion Bank’s statement of comprehensive income and other valuation adjustments on other controlled subsidiaries for the years ended December 31, 2015, 2014, and 2013.
| (Dollars in thousands) |
2015 | 2014 | 2013 | |||||||||
| Statement of comprehensive income |
||||||||||||
| Investment income |
$ | 91,021 | $ | 77,291 | $ | 63,744 | ||||||
| Interest expense |
9,205 | 7,008 | 5,271 | |||||||||
|
|
|
|
|
|
|
|||||||
| Net interest income |
81,816 | 70,283 | 58,473 | |||||||||
| Noninterest income |
291 | 344 | 117 | |||||||||
| Operating expenses (1) |
21,621 | 19,812 | 18,584 | |||||||||
|
|
|
|
|
|
|
|||||||
| Net investment income before income taxes |
60,486 | 50,815 | 40,006 | |||||||||
| Income tax provision |
18,974 | 16,508 | 10,718 | |||||||||
|
|
|
|
|
|
|
|||||||
| Net investment income after income taxes |
41,512 | 34,307 | 29,288 | |||||||||
| Net realized/unrealized losses of Medallion Bank (1) |
(18,275 | ) | (7,386 | ) | (11,872 | ) | ||||||
|
|
|
|
|
|
|
|||||||
| Net increase in net assets resulting from operations of Medallion Bank |
23,237 | 26,921 | 17,416 | |||||||||
| Unrealized depreciation on Medallion Bank (2) |
(2,763 | ) | (15,263 | ) | (12,263 | ) | ||||||
| Net realized/unrealized gains (losses) on controlled subsidiaries other than Medallion Bank |
(3,644 | ) | 3,985 | (93 | ) | |||||||
|
|
|
|
|
|
|
|||||||
| Net increase in net assets resulting from operations of Medallion Bank and other controlled subsidiaries |
$ | 16,830 | $ | 15,643 | $ | 5,060 | ||||||
|
|
|
|
|
|
|
|||||||
| (1) | Excluded from operating expenses and included in net realized/unrealized losses of Medallion Bank were $1,150, $0 and $1,064 of unrealized losses on other assets for 2015, 2014 and 2013. |
| (2) | Unrealized depreciation on Medallion Bank reflects the adjustment to the investment carrying amount to reflect the dividends declared to the Company and the US Treasury, and in 2015, the fair value adjustments to the carrying amount of Medallion Bank. |
The following table presents Medallion Bank’s balance sheets and the net investment in other controlled subsidiaries as of December 31, 2015 and 2014.
| (Dollars in thousands) |
2015 | 2014 | ||||||
| Loans |
$ | 996,375 | $ | 881,075 | ||||
| Investment securities, at fair value |
35,524 | 27,900 | ||||||
|
|
|
|
|
|||||
| Net investments (1) |
1,031,899 | 908,975 | ||||||
| Cash |
23,094 | 30,372 | ||||||
| Other assets, net |
24,827 | 24,696 | ||||||
|
|
|
|
|
|||||
| Total assets |
$ | 1,079,820 | $ | 964,043 | ||||
|
|
|
|
|
|||||
| Other liabilities |
$ | 6,106 | $ | 2,730 | ||||
| Due to affiliates |
1,387 | 3,032 | ||||||
| Deposits and other borrowings, including accrued interest payable |
909,909 | 808,837 | ||||||
|
|
|
|
|
|||||
| Total liabilities |
917,402 | 814,599 | ||||||
| Medallion Bank equity (2) |
162,418 | 149,444 | ||||||
|
|
|
|
|
|||||
| Total liabilities and equity |
$ | 1,079,820 | $ | 964,043 | ||||
|
|
|
|
|
|||||
| Investment in other controlled subsidiaries |
$ | 7,747 | $ | 11,821 | ||||
| Total investment in Medallion Bank and other controlled subsidiaries (3) |
159,913 | 136,848 | ||||||
|
|
|
|
|
|||||
| (1) | Included in Medallion Bank’s net investments is $6 and $15 for purchased loan premium at December 31, 2015 and 2014. |
| (2) | Includes $26,303 of preferred stock issued to the US Treasury under the Small Business Lending Fund Program (SBLF). |
| (3) | Includes $15,500 and $0 of unrealized appreciation on Medallion Bank, in excess of Medallion Bank’s book value as of December 31, 2015 and 2014. |
The following paragraphs summarize the accounting and reporting policies of Medallion Bank, and provide additional information relating to the tables presented above.
Investment securities are purchased from time-to-time in the open market at prices that are greater or lesser than the par value of the investment. The resulting premium or discount is deferred and recognized on a level yield basis as an adjustment to the yield of the related investment. At December 31, 2015 and 2014, the net premium on investment securities totaled $311,000 and $272,000, and $83,000, $64,000, and $105,000 was amortized to interest income for the years ended December 31, 2015, 2014, and 2013.
Loan origination fees and certain direct origination costs are deferred and recognized as an adjustment to the yield of the related loans. At December 31, 2015 and 2014, net loan origination costs were $11,400,000 and $9,937,000. Net amortization expense for the years ended December 31, 2015, 2014, and 2013 was $3,354,000, $3,138,000, and $2,911,000.
Medallion Bank’s policies regarding nonaccrual of medallion and commercial loans are similar to those of the Company. The consumer portfolio has different characteristics compared to commercial loans, typified by a larger number of lower dollar loans that have similar characteristics. These loans are placed on nonaccrual, when they become 90 days past due, or earlier if they enter bankruptcy, and are charged off in their entirety when deemed uncollectible, or when they become 120 days past due, whichever occurs first, at which time appropriate collection and recovery efforts against both the borrower and the underlying collateral are initiated. At December 31, 2015, $3,381,000 or 1% of consumer loans, no commercial loans, and $21,722,000 or 6% of medallion
F-15
Table of Contents
loans were on nonaccrual, compared to $2,536,000 or 1% of consumer loans, $1,351,000 or 3% of commercial loans, and no medallion loans on nonaccrual at December 31, 2014, and $2,266,000 or 1% of consumer loans, $2,291,000 or 4% of commercial loans, and no medallion loans on nonaccrual at December 31, 2013. The amount of interest income on nonaccrual loans that would have been recognized if the loans had been paying in accordance with their original terms was $233,000, $90,000, and $85,000 as of December 31, 2015, 2014, and 2013. See also the paragraph and table on page F-12 following the delinquency table for a discussion of other past due amounts.
Medallion Bank’s loan and investment portfolios are assessed for collectability on a monthly basis, and a loan loss allowance is established for any realizability concerns on specific investments, and general reserves have also been established for any unknown factors. Adjustments to the value of this portfolio are based on the Company’s own historical loan loss data developed since 2004, adjusted for changes in delinquency trends and other factors as described previously in Note 2.
Medallion Bank raises deposits to fund loan originations. The deposits were raised through the use of investment brokerage firms who package deposits qualifying for FDIC insurance into pools that are sold to Medallion Bank. The rates paid on the deposits are highly competitive with market rates paid by other financial institutions, and include a brokerage fee, depending on the maturity of the deposit, which averages 0.14% and, which is capitalized and amortized to interest expense over the life of the respective pool. The total amount capitalized at December 31, 2015 and 2014 was $2,034,000 and $2,205,000, and $1,314,000, $1,251,000, and $1,220,000 was amortized to interest expense during 2015, 2014, and 2013. Interest on the deposits is accrued daily and paid monthly, quarterly, semiannually, or at maturity.
The outstanding balances of fixed rate borrowings were as follows:
| Payments Due for the Year Ending December 31, | December 31, 2015 |
December 31, 2014 |
Interest Rate (1) |
|||||||||||||||||||||||||||||||||
| (Dollars in thousands) |
2016 | 2017 | 2018 | 2019 | 2020 | Thereafter | ||||||||||||||||||||||||||||||
| Deposits and other borrowings |
$ | 393,359 | $ | 265,336 | $ | 164,721 | $ | 72,393 | $ | 13,087 | $ | — | $ | 908,896 | $ | 807,940 | 1.04 | % | ||||||||||||||||||
| (1) | Weighted average contractual rate as of December 31, 2015. |
Medallion Bank is subject to various regulatory capital requirements administered by the FDIC and State of Utah Department of Financial Institutions. Failure to meet minimum capital requirements can initiate certain mandatory and possibly additional discretionary actions by regulators that, if undertaken, could have a direct material effect on Medallion Bank’s and our financial statements. Under capital adequacy guidelines and the regulatory framework for prompt corrective action, Medallion Bank must meet specific capital guidelines that involve quantitative measures of Medallion Bank’s assets, liabilities, and certain off-balance sheet items as calculated under regulatory accounting practices. Medallion Bank’s capital amounts and classification are also subject to qualitative judgments by Medallion Bank regulators about components, risk weightings, and other factors.
FDIC-insured banks, including Medallion Bank, are subject to certain federal laws, which impose various legal limitations on the extent to which banks may finance or otherwise supply funds to certain of their affiliates. In particular, Medallion Bank is subject to certain restrictions on any extensions of credit to, or other covered transactions, such as certain purchases of assets, with the Company or its affiliates.
Quantitative measures established by regulation to ensure capital adequacy require Medallion Bank to maintain minimum amounts and ratios as defined in the regulations (set forth in the table below). Additionally, as conditions of granting Medallion Bank’s application for federal deposit insurance, the FDIC ordered that the leverage capital ratio (Tier 1 capital to average assets) be not less than 15%, and that an adequate allowance for loan losses be maintained. As a result, to facilitate maintenance of the capital ratio requirement and to provide the necessary capital for continued growth, the Company periodically makes capital contributions to Medallion Bank, including $8,000,000 in 2015, $10,000,000 in 2014, and $5,000,000 in 2013. Separately, Medallion Bank declared dividends to the Company of $18,000,000 in 2015, $15,000,000 in 2014, and $12,000,000 in 2013.
On February 27, 2009 and December 22, 2009, Medallion Bank issued, and the US Treasury purchased under the TARP Capital Purchase Program (the CPP) Medallion Bank’s fixed rate non-cumulative Perpetual Preferred Stock, Series A, B, C, and D for an aggregate purchase price of $21,498,000 in cash. On July 21, 2011, Medallion Bank issued, and the US Treasury purchased 26,303 shares of Senior Non-Cumulative Perpetual Preferred Stock, Series E (Series E) for an aggregate purchase price of $26,303,000 under the Small Business Lending Fund Program (SBLF). The SBLF is a voluntary program intended to encourage small business lending by providing capital to qualified smaller banks at favorable rates. In connection with the issuance of the Series E, the Bank exited the CPP by redeeming the Series A, B, C, and D; and received approximately $4,000,000, net of dividends due on the repaid securities. The Bank pays a dividend rate of 1% on the Series E. Beginning in the first quarter of 2016, the Bank will pay a dividend rate of 9%.
The following table represents Medallion Bank’s actual capital amounts and related ratios as of December 31, 2015 and 2014, compared to required regulatory minimum capital ratios and the ratios required to be considered well capitalized. As of December 31, 2015, Medallion Bank meets all capital adequacy requirements to which it is subject, and is well-capitalized.
F-16
Table of Contents
| Regulatory | ||||||||||||||||
| (Dollars in Thousands) |
Minimum | Well-capitalized | December 31, 2015 | December 31, 2014 | ||||||||||||
| Common equity tier I capital(1) |
$ | — | $ | — | $ | 135,635 | N/A | |||||||||
| Tier 1 capital |
— | — | 161,938 | $ | 148,510 | |||||||||||
| Total capital |
— | — | 175,533 | 160,220 | ||||||||||||
| Average assets |
— | — | 1,071,980 | 961,944 | ||||||||||||
| Risk-weighted assets |
— | — | 1,077,103 | 930,737 | ||||||||||||
| Common equity tier I capital ratio (1) |
5 | % | 7 | % | 12.6 | % | N/A | |||||||||
| Leverage ratio (2) |
4 | 5 | 15.1 | 15.5 | % | |||||||||||
| Tier 1 capital ratio (3) |
6 | 8 | 15.0 | 16.0 | ||||||||||||
| Total capital ratio (3) |
8 | 10 | 16.3 | 17.2 | ||||||||||||
| (1) | Not required until 2015 |
| (2) | Calculated by dividing Tier 1 capital by average assets. |
| (3) | Calculated by dividing Tier 1 or total capital by risk-weighted assets. |
(4) FUNDS BORROWED
The outstanding balances of funds borrowed were as follows:
| Payments Due for the Year Ending December 31, | December 31, 2015 |
December 31, 2014 |
Interest Rate (1) |
|||||||||||||||||||||||||||||||||
| (Dollars in thousands) |
2016 | 2017 | 2018 | 2019 | 2020 | Thereafter | ||||||||||||||||||||||||||||||
| Revolving lines of credit |
$ | 129,518 | $ | — | $ | — | $ | — | $ | — | $ | — | $ | 129,518 | $ | 122,794 | 2.05 | % | ||||||||||||||||||
| Notes payable to banks |
122,167 | 180 | 42 | — | 40 | — | 122,429 | 124,516 | 2.60 | |||||||||||||||||||||||||||
| SBA debentures |
— | — | — | 3,000 | — | 71,485 | 74,485 | 68,485 | 3.52 | |||||||||||||||||||||||||||
| Margin loan |
45,108 | — | — | — | — | — | 45,108 | — | 1.48 | |||||||||||||||||||||||||||
| Preferred securities |
— | — | — | — | — | 33,000 | 33,000 | 33,000 | 2.58 | |||||||||||||||||||||||||||
|
|
|
|
|
|
|
|
|
|
|
|
|
|
|
|
|
|||||||||||||||||||||
| Total |
$ | 296,793 | $ | 180 | $ | 42 | $ | 3,000 | $ | 40 | $ | 104,485 | $ | 404,540 | $ | 348,795 | 2.47 | |||||||||||||||||||
|
|
|
|
|
|
|
|
|
|
|
|
|
|
|
|
|
|||||||||||||||||||||
| (1) | Weighted average contractual rate as of December 31, 2015. |
F-17
Table of Contents
(A) REVOLVING LINES OF CREDIT
In December 2008, Trust III entered into a revolving line of credit agreement with DZ Bank, to provide up to $200,000,000 of financing through a commercial paper conduit to acquire medallion loans from MFC (DZ line), which was extended in December 2013 until December 2016, and the line reduced to $150,000,000, and which was further reduced in stages in December 2015 to $135,000,000, and to $125,000,000 on July 1, 2016; and of which $129,518,000 was outstanding at December 31, 2015. Borrowings under Trust III’s revolving line of credit are collateralized by Trust III’s assets. MFC is the servicer of the loans owned by Trust III. The DZ line includes a borrowing base covenant and rapid amortization in certain circumstances. In addition, if certain financial tests are not met, MFC can be replaced as the servicer. The interest rate with the 2013 extension is a pooled short-term commercial paper rate which approximates LIBOR (30 day LIBOR was 0.43% at December 31, 2015) plus 1.65%, and previously was the lesser of a pooled short-term commercial paper rate, plus 0.95%.
(B) SBA DEBENTURES
In 2015, the SBA approved $15,500,000 of commitments for MCI for a four year term and a 1% fee, which was paid. In 2014, the SBA approved $10,000,000 of commitments for MCI for a four year term and a 1% fee, which was paid. In 2013, the SBA approved $23,000,000 and $5,000,000 of commitments for FSVC and MCI, respectively, for a four year term and a 1% fee, which was paid, and of which FSVC issued $23,000,000 of debentures, $18,150,000 of which was used to repay maturing debentures, and MCI issued $2,500,000 of debentures. As of December 31, 2015, $162,485,000 of commitments had been fully utilized, there were $3,000,000 commitments available, and $74,485,000 was outstanding.
The notes are collateralized by substantially all of FSVC’s and MCI’s assets and are subject to the terms and conditions of agreements with the SBA which, among other things, restrict stock redemptions, disposition of assets, new indebtedness, dividends or distributions, and changes in management, ownership, investment policy, or operations. The debentures have been issued in various tranches for terms of ten years with interest payable semiannually.
(C) NOTES PAYABLE TO BANKS/OTHER LENDERS
The Company and its subsidiaries have entered into (i) note agreements and (ii) participation agreements with a variety of local and regional banking institutions over the years, as well as with other non-bank lenders. The notes are typically secured by various assets of the underlying borrower. The Company believes the participation agreements represent legal true sales of the loans to the lender, but for accounting purposes these participations are treated as financings, and are included in funds borrowed as shown on our consolidated balance sheets. The table below summarizes the key attributes of our various borrowing arrangements with these lenders as of December 31, 2015.
| (Dollars in thousands) |
||||||||||||||||||||||||||||||||
| Borrower |
# of Lenders/ Notes |
Note Dates |
Maturity Dates |
Type |
Note Amounts |
Balance Outstanding at December 31, 2015 |
Monthly Payment |
Average Interest Rate at December 31, 2015 |
Interest Rate Index(1) |
|||||||||||||||||||||||
| The Company |
6/6 |
|
4/11 - 8/14 |
|
|
4/16 - 7/16 |
|
Revolving line of credit secured by pledged loans | $ | 98,195 | (2) | $ | 93,570 | Interest only | |
2.44% (includes unused fee) |
|
Various | (2) | |||||||||||||
| Medallion Chicago |
3/28 |
|
11/11 - 12/11 |
|
12/16 | Term loans secured by owned Chicago medallions(3) | 25,708 | 23,495 | $121 principal & interest | 3.12 | % | N/A | ||||||||||||||||||||
| The Company |
1/1 | 1/11 | 11/16 | Participated loans treated as financings | 3,915 | 3,908 | Proportionate to the payments received on the participated loans | 2.50 | % | N/A | ||||||||||||||||||||||
| FSVC |
3/5 | |
2/12 - 4/14 |
|
|
03/16 - 11/18 |
|
Participated loans treated as financings | 256 | 250 | Proportionate to the payments received on the participated loans | 6.53 | % | N/A | ||||||||||||||||||
| MFC |
2/3 | |
2/13 - 12/15 |
|
|
2/16 - 12/20 |
|
Participated loans treated as financings | 155 | 149 | Proportionate to the payments received on the participated loans | 9.05 | % | N/A | ||||||||||||||||||
| MFC |
1/1 | 1/05 | 5/16 | Revolving line of credit secured by pledged loans | 8,000 | 1,057 | Interest only | — | |
Prime + 0.50 |
% | |||||||||||||||||||||
|
|
|
|
|
|||||||||||||||||||||||||||||
| $ | 136,229 | $ | 122,429 | |||||||||||||||||||||||||||||
|
|
|
|
|
|||||||||||||||||||||||||||||
| (1) | At December 31, 2015, 30 day LIBOR was 0.43%, 360 day LIBOR was 1.18%, and the prime rate was 3.50%. |
| (2) | $48,195 of these lines can also be used by MFC ($275 which is available) of which $20,695 of such usage would be guaranteed by the Company. Interest rates on these lines range from LIBOR plus 2% to LIBOR + 2.125%, and all contain prime rate options from prime minus 0.25% to prime, and one note has a floor, and two notes have an unused fee. |
| (3) | $14,488 guaranteed by the Company. |
F-18
Table of Contents
(D) PREFERRED SECURITIES
In June 2007, the Company issued and sold $36,083,000 aggregate principal amount of unsecured junior subordinated notes to Fin Trust which, in turn, sold $35,000,000 of preferred securities to Merrill Lynch International and issued 1,083 shares of common stock to the Company. The notes bore a fixed rate of interest of 7.68% to September 2012, and thereafter a variable rate of interest of 90 day LIBOR (0.61% at December 31, 2015) plus 2.13%. The notes mature in September 2037 and are prepayable at par. Interest is payable quarterly in arrears. The terms of the preferred securities and the notes are substantially identical. In December 2007, $2,000,000 of the preferred securities were repurchased from a third party investor. At December 31, 2015, $33,000,000 was outstanding on the preferred securities.
(E) MARGIN LOAN
In June 2015, the Company entered into a margin loan agreement with Morgan Stanley. The margin loan is secured by the pledge of short-term, high-quality investment securities held by the Company, and is initially available at 90% of the current fair market value of the securities. The margin loan bears interest at 30-day LIBOR (0.43% at December 31, 2015) plus 1.00%. As of December 31, 2015, $45,108,000 was outstanding under this margin loan.
(F) COVENANT COMPLIANCE
In the normal course of business, the Company and its subsidiaries enter into agreements, or are subject to regulatory requirements, that result in loan restrictions. Certain of our debt agreements contain restrictions that require the Company to maintain certain financial ratios, including debt to equity and minimum net worth. In addition, the Company’s wholly-owned subsidiary Medallion Bank is subject to various regulatory requirements (see Note 3).
(5) STOCK OPTIONS AND RESTRICTED STOCK
The Company has a stock option plan (2006 Stock Option Plan) available to grant both incentive and nonqualified stock options to employees. The 2006 Stock Option Plan, which was approved by the Board of Directors on February 15, 2006 and shareholders on June 16, 2006, provides for the issuance of a maximum of 800,000 shares of common stock of the Company. At December 31, 2015, 150,708 shares of the Company’s common stock remained available for future grants. The 2006 Stock Option Plan is administered by the Compensation Committee of the Board of Directors. The option price per share may not be less than the current market value of the Company’s common stock on the date the option is granted. The term and vesting periods of the options are determined by the Compensation Committee, provided that the maximum term of an option may not exceed a period of ten years.
The Company’s Board of Directors approved the 2009 Employee Restricted Stock Plan (the Employee Restricted Stock Plan) on April 16, 2009. The Employee Restricted Stock Plan became effective upon the Company’s receipt of exemptive relief from the SEC and approval of the Employee Restricted Stock Option Plan by the Company’s shareholders on June 11, 2010. No additional shares are available for issuance under the Employee Restricted Stock Plan. The terms of the Employee Restricted Stock Plan provide for grants of restricted stock awards to the Company’s employees. A grant of restricted stock is a grant of shares of the Company’s common stock which, at the time of issuance, is subject to certain forfeiture provisions, and thus is restricted as to transferability until such forfeiture restrictions have lapsed. A total of 800,000 shares of the Company’s common stock were issuable under the Employee Restricted Stock Plan, and as of December 31, 2015, none of the Company’s common stock remained available for future grants. Awards under the 2009 Employee Plan are subject to certain limitations as set forth in the Employee Restricted Stock Plan. The Employee Restricted Stock Plan will terminate when all shares of common stock authorized for delivery under the Employee Restricted Stock Plan have been delivered and the forfeiture restrictions on all awards have lapsed, or by action of the Board of Directors pursuant to the Employee Restricted Stock Plan, whichever first occurs.
The Company’s Board of Directors approved the First Amended and Restated 2006 Director Plan (the Amended Director Plan) on April 16, 2009, which was approved by the Company’s shareholders on June 5, 2009, and on which exemptive relief to implement the Amended Director Plan was received from the SEC on July 17, 2012. A total of 200,000 shares of the Company’s common stock are issuable under the Amended Director Plan, and as of December 31, 2015, 37,000 shares of the Company’s common stock remained available for future grants. Under the Amended Director Plan, unless otherwise determined by a committee of the Board of Directors comprised of directors who are not eligible for grants under the Amended Director Plan, the Company will grant options to purchase 9,000 shares of the Company’s common stock to an Eligible Director upon election to the Board of Directors, with an adjustment for directors who are elected to serve less than a full term. The option price per share may not be less than the current market value of the Company’s common stock on the date the option is granted. Options granted under the Amended Director Plan are exercisable annually, as defined in the Amended Director Plan. The term of the options may not exceed ten years.
F-19
Table of Contents
The Company’s 1996 Stock Option Plan and 1996 Director Plan terminated on May 21, 2006 and no additional shares are available for future issuance. At December 31, 2015, 446,254 options on the Company’s common stock were outstanding under the 1996 and 2006 plans, of which 391,921 options were exercisable, and there were 209,040 unvested shares of the Company’s common stock outstanding under the Employee Restricted Stock Plan.
The fair value of each restricted stock grant is determined on the date of grant by the closing market price of the Company’s common stock on the grant date. The fair value of each option grant is estimated on the date of grant using the Black-Scholes option-pricing model. The weighted average fair value of options granted was $0.90, $1.54, and $1.41 per share for the years ended December 31, 2015, 2014, and 2013. The following assumption categories are used to determine the value of any option grants.
| Year ended December 31, | ||||||||||||
| 2015 | 2014 | 2013 | ||||||||||
| Risk free interest rate |
1.87 | % | 1.82 | % | 1.24 | % | ||||||
| Expected dividend yield |
8.90 | 7.21 | 8.07 | |||||||||
| Expected life of option in years (1) |
6.00 | 6.00 | 6.00 | |||||||||
| Expected volatility (2) |
30.00 | % | 30.00 | % | 30.00 | % | ||||||
| (1) | Expected life is calculated using the simplified method. |
| (2) | We determine our expected volatility based on our historical volatility. |
The following table presents the activity for the stock option program under the 1996 and 2006 Stock Option Plans and the Amended Director Plan for the years ended December 31, 2015, 2014, and 2013.
| Number of Options | Exercise Price Per Share |
Weighted Average Exercise Price |
||||||||||
| Outstanding at December 31, 2012 |
971,500 | $ | 3.50-13.06 | $ | 9.80 | |||||||
| Granted |
18,000 | 13.84 | 13.84 | |||||||||
| Cancelled |
(518 | ) | 9.22 | 9.22 | ||||||||
| Exercised (1) |
(410,765 | ) | 3.50-13.06 | 9.90 | ||||||||
|
|
|
|
|
|
|
|||||||
| Outstanding at December 31, 2013 |
578,217 | 7.17-13.84 | 9.85 | |||||||||
| Granted |
32,000 | 11.42-13.53 | 12.61 | |||||||||
| Cancelled |
(50,000 | ) | 8.51 | 8.51 | ||||||||
| Exercised (1) |
(98,396 | ) | 7.17-11.21 | 8.96 | ||||||||
|
|
|
|
|
|
|
|||||||
| Outstanding at December 31, 2014 |
461,821 | 7.49-13.84 | 10.38 | |||||||||
| Granted |
27,000 | 9.38 | 9.38 | |||||||||
| Cancelled |
(12,118 | ) | 9.22-13.06 | 11.07 | ||||||||
| Exercised (1) |
(30,449 | ) | 9.22 | 9.22 | ||||||||
|
|
|
|
|
|
|
|||||||
| Outstanding at December 31, 2015 (2) |
446,254 | $ | 7.49-13.84 | $ | 10.38 | |||||||
|
|
|
|
|
|
|
|||||||
| Options exercisable at |
||||||||||||
| December 31, 2013 |
556,550 | $ | 7.17-13.06 | $ | 9.71 | |||||||
| December 31, 2014 |
416,821 | 7.49-13.84 | 10.10 | |||||||||
| December 31, 2015 (2) |
391,921 | 7.49-13.84 | 10.27 | |||||||||
|
|
|
|
|
|
|
|||||||
| (1) | The aggregate intrinsic value, which represents the difference between the price of the Company’s common stock at the exercise date and the related exercise price of the underlying options, was $0, $464,000, and $1,794,000 for 2015, 2014, and 2013. |
| (2) | The aggregate intrinsic value, which represents the difference between the price of the Company’s common stock at December 31, 2015 and the related exercise price of the underlying options, was $0 for outstanding options and $0 for exercisable options as of December 31, 2015. The remaining contractual life was 3.11 years for outstanding options and 2.30 years for exercisable options at December 31, 2015. |
The following table presents the activity for the restricted stock program under the 2009 Employee Restricted Stock Plan for the years ended December 31, 2015, 2014, and 2013.
| Number of Shares | Grant Price Per Share |
Weighted Average Grant Price |
||||||||||
| Outstanding at December 31, 2012 |
300,317 | $ | 7.99-12.55 | $ | 10.76 | |||||||
| Granted |
11,742 | 13.12-15.61 | 15.31 | |||||||||
| Cancelled |
(4,088 | ) | 7.99-13.12 | 10.12 | ||||||||
| Vested (1) |
(73,703 | ) | 11.08-12.55 | 11.56 | ||||||||
| Outstanding at December 31, 2013 |
234,268 | 7.99-15.61 | 10.72 | |||||||||
| Granted |
129,126 | 10.08-13.46 | 12.82 | |||||||||
| Cancelled |
(378 | ) | 11.08-15.61 | 12.65 | ||||||||
| Vested (1) |
(153,651 | ) | 7.99-15.61 | 10.11 | ||||||||
| Outstanding at December 31, 2014 |
209,365 | 10.08-15.61 | 12.47 | |||||||||
| Granted |
162,576 | 9.08-10.38 | 9.89 | |||||||||
| Cancelled |
(53,761 | ) | 9.92-15.61 | 11.16 | ||||||||
| Vested (1) |
(109,140 | ) | 10.08-15.61 | 12.16 | ||||||||
| Outstanding at December 31, 2015 (2) |
209,040 | $ | 9.08-15.61 | $ | 10.96 | |||||||
| (1) | The aggregate fair value of the restricted stock vested was $916,000, $2,023,000, and $1,062,000 for 2015, 2014, and 2013. |
| (2) | The aggregate fair value of the restricted stock was $1,472,000 as of December 31, 2015. The remaining vesting period was 1.83 years at December 31, 2015. |
F-20
Table of Contents
The following table presents the activity for the unvested options outstanding under the plans for the year ended December 31, 2015.
| Number of Options |
Exercise Price Per Share |
Weighted Average Exercise Price |
||||||||||
| Outstanding at December 31, 2014 |
45,000 | $ | 11.42-13.84 | $ | 12.93 | |||||||
| Granted |
27,000 | 9.38 | 9.38 | |||||||||
| Cancelled |
— | — | — | |||||||||
| Vested |
(17,667 | ) | 11.42-13.84 | 13.02 | ||||||||
|
|
|
|
|
|
|
|||||||
| Outstanding at December 31, 2015 |
54,333 | $ | 9.38-13.84 | $ | 11.14 | |||||||
|
|
|
|
|
|
|
|||||||
The intrinsic value of the options vested was $0, $0, and $143,000 in 2015, 2014, and 2013.
(6) QUARTERLY RESULTS OF OPERATIONS (UNAUDITED)
The following table presents the Company’s quarterly results of operations for the years ended December 31, 2015, 2014, and 2013.
| (Dollars in thousands, except per share data) |
March 31 | June 30 | September 30 | December 31 | ||||||||||||
| 2015 Quarter Ended |
||||||||||||||||
| Investment income |
$ | 11,831 | $ | 10,838 | $ | 10,665 | $ | 9,319 | ||||||||
| Net investment income after income taxes |
4,904 | 4,330 | 4,236 | 3,356 | ||||||||||||
| Net increase in net assets resulting from operations |
7,068 | 8,086 | 7,312 | 6,911 | ||||||||||||
| Net increase in net assets resulting from operations per common share |
||||||||||||||||
| Basic |
$ | 0.29 | $ | 0.33 | $ | 0.30 | $ | 0.29 | ||||||||
| Diluted |
0.29 | 0.33 | 0.30 | 0.29 | ||||||||||||
| 2014 Quarter Ended |
||||||||||||||||
| Investment income |
$ | 9,035 | $ | 9,875 | $ | 11,379 | $ | 10,779 | ||||||||
| Net investment income after income taxes |
3,450 | 3,803 | 5,228 | 2,664 | ||||||||||||
| Net increase in net assets resulting from operations |
6,766 | 7,105 | 6,694 | 8,127 | ||||||||||||
| Net increase in net assets resulting from operations per common share |
||||||||||||||||
| Basic |
$ | 0.27 | $ | 0.29 | $ | 0.27 | $ | 0.33 | ||||||||
| Diluted |
0.27 | 0.28 | 0.27 | 0.33 | ||||||||||||
| 2013 Quarter Ended |
||||||||||||||||
| Investment income |
$ | 8,245 | $ | 7,543 | $ | 9,435 | $ | 9,706 | ||||||||
| Net investment income after income taxes |
2,463 | 1,742 | 4,415 | 3,569 | ||||||||||||
| Net increase in net assets resulting from operations |
6,472 | 6,249 | 6,397 | 6,658 | ||||||||||||
| Net increase in net assets resulting from operations per common share |
||||||||||||||||
| Basic |
$ | 0.30 | $ | 0.29 | $ | 0.29 | $ | 0.29 | ||||||||
| Diluted |
0.30 | 0.28 | 0.29 | 0.29 | ||||||||||||
(7) RECENTLY ISSUED ACCOUNTING STANDARDS
In February 2016, the Financial Accounting Standards Board (FASB) issued Accounting Standards Update (ASU) 2016-02, “Leases (Topic 842)”. ASU 2016-02 requires the recognition of lease assets and lease liabilities by lessees for leases classified as operating under current GAAP. ASU 2016-02 applies to all entities and is effective for fiscal years beginning after December 15, 2018 for public entities, with early adoption permitted. The Company is assessing the impact the update will have on its financial condition and results of operations.
F-21
Table of Contents
In January 2016, the FASB issued ASU 2016-01, “Financial Instruments—Overall (Topic 825-10): Recognition and Measurement of Financial Assets and Financial Liabilities.” The main objective of this Update is to enhance the reporting model for financial instruments and provide users of financial statements with more decision-useful information. ASU 2016-01 requires equity investments to be measured at fair value, simplifies the impairment assessment of equity investment without readily determinable fair value, eliminates the requirements to disclose the fair value of financial instruments measured at amortized cost, and requires public business entities to use the exit price notion when measuring the fair value of financial instruments. The update, as amended, is effective for fiscal years, and interim periods within those fiscal years, beginning after December 15, 2017. The Company does not believe this update will have a material impact on its financial condition.
In August 2015, the FASB issued ASU 2015-15, “Interest—Imputation of Interest (Subtopic 835-30): Presentation and Subsequent Measurement of Debt Issuance Costs Associated with Line-of-Credit Arrangements—Amendments to SEC Paragraphs Pursuant to Staff Announcement at June 18, 2015 EITF Meeting.” ASU 2015-15 adds SEC paragraphs whereby the SEC staff addresses the absence of guidance under ASU 2015-03, “Interest – Imputation of Interest (Subtopic 835-30),” for costs related to line-of-credit arrangements. The SEC staff will not object to an entity deferring and presenting debt issuance costs as an asset and subsequently amortizing the deferred debt issuance costs ratably over the term of the line-of-credit arrangement, regardless of whether there are any outstanding borrowings on the line-of-credit arrangement. ASU 2015-03 requires that debt issuance costs related to a recognized debt liability be presented in the balance sheet as a direct deduction from the carrying amount of that debt liability, consistent with debt discounts. The update, as amended, is effective for fiscal years, and interim periods within those fiscal years, beginning after December 15, 2015. The Company does not believe this update will have a material impact on its financial condition.
In May 2015, the FASB issued ASU 2015-07, “Fair Value Measurement (Topic 820) – Disclosures for Investments in Certain Entities That Calculate Net Asset Value per Share (or Its Equivalent). ASU 2015-07 removes the requirement to categorize within the fair value hierarchy all investments for which fair value is measured using the net asset value per share practical expedient. Additionally, the amendment removes the requirement to make certain disclosures for all investments that are eligible to be measured at fair value using the net asset value per share practical expedient, limiting those disclosures to investments for which the entity has elected to measure the fair value using that practical expedient. The update is effective for fiscal years, and interim periods within those fiscal years, beginning after December 15, 2015. The Company does not believe this update will have a material impact on its disclosures.
In August 2014, the FASB issued ASU 2014-13, “Consolidation – (Topic 810): Measuring the Financial Assets and the Financial Liabilities of a Consolidated Collateralized Financing”. ASU 2014-13 provides an alternative to Topic 820 for measuring the financial assets and the financial liabilities of a consolidated collateralized financing entity to eliminate any differences between their respective fair values. In the event a reporting entity does not elect to utilize the measurement alternative, the update clarifies that the fair value of the financial assets and liabilities of the consolidated collateralized financing entity should be measured using the requirements of Topic 820 and any differences should be reflected in earnings and attributed to the reporting entity in the consolidated statement of income (loss). This update is effective for periods beginning after December 15, 2015. The Company does not believe this update will have an impact on its financial condition or results of operations.
(8) SEGMENT REPORTING
We have one business segment, our lending and investing operations. This segment originates and services medallion, secured commercial, and consumer loans, and invests in both marketable and nonmarketable securities.
(9) COMMITMENTS AND CONTINGENCIES
(a) Employment Agreements
The Company has employment agreements with certain key officers for either a one or five-year term. Annually, the contracts with a five-year term will renew for new five-year terms unless prior to the end of the first year, either the Company or the executive provides notice to the other party of its intention not to extend the employment period beyond the current five-year term. Annually, the contracts with a one-year term will renew for new one-year terms unless prior to the term either the Company or the executive provides notice to the other party of its intention not to extend the employment period beyond the current one-year term. In the event of a change in control, as defined, during the employment period, the agreements provide for severance compensation to the executive in an amount equal to the balance of the salary, bonus, and value of fringe benefits which the executive would be entitled to receive for the remainder of the employment period.
F-22
Table of Contents
Employment agreements expire at various dates through 2020. At December 31, 2015, minimum payments under employment agreements are as follows:
| (Dollars in thousands) |
||||
| 2016 |
$ | 2,110 | ||
| 2017 |
988 | |||
| 2018 |
651 | |||
| 2019 |
651 | |||
| 2020 |
271 | |||
| Thereafter |
— | |||
|
|
|
|||
| Total |
$ | 4,671 | ||
|
|
|
|||
(b) Other Commitments
The Company had no portfolio commitments outstanding at December 31, 2015. Generally, commitments are on the same terms as loans to or investments in existing borrowers or investees, and generally have fixed expiration dates. Since some commitments are expected to expire without being drawn upon, the total commitment amounts do not necessarily represent future cash requirements. In addition, the Company had approximately $41,680,000 of undisbursed funds relating to revolving credit facilities with borrowers, $38,028,000 of which would be disbursed by Medallion Bank. These amounts may be drawn upon at the customer’s request if they meet certain credit requirements.
Commitments for leased premises expire at various dates through December 31, 2027. At December 31, 2015, minimum rental commitments for non-cancelable leases are as follows:
| (Dollars in thousands) |
||||
| 2016 |
$ | 696 | ||
| 2017 |
1,616 | |||
| 2018 |
1,518 | |||
| 2019 |
1,774 | |||
| 2020 |
1,776 | |||
| Thereafter |
11,373 | |||
|
|
|
|||
| Total |
$ | 18,753 | ||
|
|
|
|||
Occupancy expense was $877,000, $798,000, and $765,000 for the years ended December 31, 2015, 2014, and 2013.
(c) Litigation
The Company and its subsidiaries become defendants to various legal proceedings arising from the normal course of business. In the opinion of management, based on the advice of legal counsel, there is no proceeding pending, or to the knowledge of management threatened, which in the event of an adverse decision would result in a material adverse impact on the financial condition or results of operations of the Company.
(d) Regulatory
In the ordinary course of business, the Company and its subsidiaries are subject to inquiries from certain regulators. During 2014, FSVC was examined by the SBA. The SBA issued a report related to such examination in February 2015 and discussed the report with FSVC. FSVC has responded to the SBA’s report. The ultimate outcome of the foregoing regulatory examination cannot be predicted with any certainty at this time.
(10) RELATED PARTY TRANSACTIONS
Certain directors, officers, and shareholders of the Company are also directors and officers of its wholly-owned subsidiaries, MFC, MCI, FSVC, and Medallion Bank, as well as of certain portfolio investment companies. Officer salaries are set by the Board of Directors of the Company.
A member of the Board of Directors of the Company from 1996 through 2014 was also of counsel in the Company’s primary law firm. Amounts paid to the law firm were approximately $208,000, $187,000, and $354,000 in 2015, 2014, and 2013.
F-23
Table of Contents
Jeffrey Rudnick, the son of one of the Company’s directors, is an officer of LAX Group, LLC (LAX), one of the Company’s portfolio companies. Mr. Rudnick receives a salary from LAX of $162,000 per year, and certain equity from LAX consisting of 10% ownership in LAX Class B stock, vesting at 3.34% per year; 5% of any new equity raised from outside investors at a valuation of $1,500,000 or higher; and 10% of LAX’s profits as a year end bonus. In addition, Mr. Rudnick provides consulting services to the Company directly for a monthly retainer of $4,200.
At December 31, 2015, 2014, and 2013, MSC serviced $382,919,000, $410,915,000, and $402,801,000 of loans for Medallion Bank. Included in net investment income were amounts as described in the table below that were received from Medallion Bank for services rendered in originating and servicing loans, and also for reimbursement of certain expenses incurred on their behalf.
The Company has assigned its servicing rights to the Medallion Bank portfolio to MSC, a wholly-owned unconsolidated portfolio investment. The costs of servicing are allocated to MSC by the Company, and the servicing fee income is billed and collected from Medallion Bank by MSC. As a result, $5,658,000, $5,946,000, and $5,920,000 of servicing fee income was earned by MSC in the years ended December 31, 2015, 2014, and 2013.
F-24
Table of Contents
The following table summarizes the net revenues received from Medallion Bank.
| Year ended December 31, | ||||||||||||
| (Dollars in thousands) |
2015 | 2014 | 2013 | |||||||||
| Reimbursement of operating expenses |
$ | 775 | $ | 743 | $ | 571 | ||||||
| Loan origination fees |
168 | 262 | 336 | |||||||||
| Servicing fees |
8 | 15 | 18 | |||||||||
|
|
|
|
|
|
|
|||||||
| Total other income |
$ | 951 | $ | 1,020 | $ | 925 | ||||||
|
|
|
|
|
|
|
|||||||
The Company had a loan to Medallion Fine Art, Inc. in the amount of $8,348,000 and $6,737,000 as of December 31, 2015 and 2014. The loan bears interest at a rate of 12%, all of which is paid in kind. During 2015 and 2014, the Company advanced $1,225,000, and $0, and was repaid $550,000 and $0 with respect to this loan. Additionally, the Company recognized $944,000, $765,000, and $406,000 of interest income in 2015, 2014, and 2013.
MCI had a loan to an affiliate of Medallion Motorsports LLC in the amount of $5,033,000 and $4,485,000 as of December 31, 2015 and 2014. The loan bears interest at a rate of 10%, all of which is paid in kind. During 2015, 2014, and 2013 MCI recognized $547,000, $355,000, and $389,000 of interest income with respect to this loan.
(11) SHAREHOLDERS’ EQUITY
On December 6, 2013, the Company sold 2,900,000 shares at an offering price of $16.40 per share, resulting in gross proceeds of $47,560,000, less (i) underwriters’ discounts and commissions of $1,902,400 and (ii) offering costs of $250,600 as of December 31, 2013 (an additional $117,000 of offering costs were applied in 2014).
In November 2003, the Company announced a stock repurchase program which authorized the repurchase of up to $10,000,000 of common stock during the following six months, with an option for the Board of Directors to extend the time frame for completing the purchases, which expires in May 2016. In November 2004, the repurchase program was increased by an additional $10,000,000, which was further increased to a total of $20,000,000 in July 2014, and which was further increased to a total of $26,000,000 in July 2015. As of December 31, 2015, a total of 2,569,951 shares had been repurchased for $23,063,623. Purchases in 2015 were 413,193 shares for $3,212,000, and were 576,143 shares for $5,880,000 in 2014, and were none in 2013.
(12) NONINTEREST INCOME AND OTHER OPERATING EXPENSES
The major components of noninterest income were as follows.
| Year ended December 31, | ||||||||||||
| (Dollars in thousands) |
2015 | 2014 | 2013 | |||||||||
| Management fees |
$ | 75 | $ | 75 | $ | 75 | ||||||
| Prepayment fees |
65 | 139 | 743 | |||||||||
| Servicing fees |
51 | 142 | 193 | |||||||||
| Late charges |
49 | 49 | 143 | |||||||||
| Other |
79 | 104 | 128 | |||||||||
|
|
|
|
|
|
|
|||||||
| Total noninterest income |
$ | 319 | $ | 509 | $ | 1,282 | ||||||
|
|
|
|
|
|
|
|||||||
Prepayment fees decreased in 2015 compared to 2014, reflecting a slowdown in prepayment activity in general, and the receipt of larger than normal fees from mezzanine loan prepayments in 2013. The decreases in servicing fees reflected the slowdown in the servicing and loan origination activities performed for Medallion Bank.
The major components of other operating expenses were as follows.
| Year ended December 31, | ||||||||||||
| (Dollars in thousands) |
2015 | 2014 | 2013 | |||||||||
| Travel, meals, and entertainment |
$ | 940 | $ | 931 | $ | 892 | ||||||
| Directors’ fees |
396 | 425 | 432 | |||||||||
| Computer expense |
315 | 272 | 116 | |||||||||
| Office expense |
216 | 224 | 193 | |||||||||
| Miscellaneous taxes |
213 | 276 | 169 | |||||||||
| Insurance |
173 | 209 | 214 | |||||||||
| Depreciation and amortization |
140 | 160 | 179 | |||||||||
| Other expenses |
324 | 597 | 374 | |||||||||
|
|
|
|
|
|
|
|||||||
| Total other operating expenses |
$ | 2,717 | $ | 3,094 | $ | 2,569 | ||||||
|
|
|
|
|
|
|
|||||||
F-25
Table of Contents
Computer expense increased due to systems upgrades, upgrades of desktop hardware, a storage area network, and network redundancy equipment in the data centers. Miscellaneous taxes, which include franchise, excise, road, and other governmental assessments, were high in 2014, and also reflected a tax benefit in 2013. Other operating expenses reflected higher accruals in 2014, and accrual reversals in 2015 and 2013.
(13) SELECTED FINANCIAL RATIOS AND OTHER DATA
The following table provides selected financial ratios and other data:
| Year ended December 31, | ||||||||||||||||||||
| (Dollars in thousands, except per share data) |
2015 | 2014 | 2013 | 2012 | 2011 | |||||||||||||||
| Net share data |
||||||||||||||||||||
| Net asset value at the beginning of the year |
$ | 11.16 | $ | 10.95 | $ | 9.99 | $ | 9.68 | $ | 9.35 | ||||||||||
| Net investment income |
0.69 | 0.60 | 0.55 | 0.43 | 0.61 | |||||||||||||||
| Income tax (provision) benefit |
0.00 | 0.00 | 0.00 | 0.00 | 0.00 | |||||||||||||||
| Net realized gains (losses) on investments |
0.31 | (0.22 | ) | 0.03 | (0.33 | ) | (0.03 | ) | ||||||||||||
| Net change in unrealized appreciation on investments |
0.20 | 0.76 | 0.58 | 1.11 | 0.51 | |||||||||||||||
|
|
|
|
|
|
|
|
|
|
|
|||||||||||
| Net increase in net assets resulting from operations |
1.20 | 1.14 | 1.16 | 1.21 | 1.09 | |||||||||||||||
| Issuance of common stock |
— | (0.01 | ) | 0.67 | (0.07 | ) | (0.04 | ) | ||||||||||||
| Repurchase of common stock |
0.06 | 0.03 | — | — | — | |||||||||||||||
| Distribution of net investment income |
(0.81 | ) | (0.60 | ) | (0.48 | ) | (0.39 | ) | (0.70 | ) | ||||||||||
| Return of capital |
(0.18 | ) | (0.35 | ) | (0.41 | ) | (0.44 | ) | — | |||||||||||
| Distribution of net realized gains on investments |
— | — | — | — | — | |||||||||||||||
|
|
|
|
|
|
|
|
|
|
|
|||||||||||
| Total distributions |
(0.99 | ) | (0.95 | ) | (0.89 | ) | (0.83 | ) | (0.70 | ) | ||||||||||
| Other |
(0.01 | ) | — | 0.02 | — | (0.02 | ) | |||||||||||||
|
|
|
|
|
|
|
|
|
|
|
|||||||||||
| Total increase in net asset value |
0.26 | 0.21 | 0.96 | 0.31 | 0.33 | |||||||||||||||
|
|
|
|
|
|
|
|
|
|
|
|||||||||||
| Net asset value at the end of the year (1) |
$ | 11.42 | $ | 11.16 | $ | 10.95 | $ | 9.99 | $ | 9.68 | ||||||||||
|
|
|
|
|
|
|
|
|
|
|
|||||||||||
| Per share market value at beginning of year |
$ | 10.01 | $ | 14.35 | $ | 11.74 | $ | 11.38 | $ | 8.20 | ||||||||||
| Per share market value at end of year |
7.04 | 10.01 | 14.35 | 11.74 | 11.38 | |||||||||||||||
| Total return (2) |
(22 | %) | (25 | %) | 29 | % | 11 | % | 49 | % | ||||||||||
|
|
|
|
|
|
|
|
|
|
|
|||||||||||
| Ratios/supplemental data |
||||||||||||||||||||
| Total shareholders’ equity (net assets) |
$ | 278,088 | $ | 274,670 | $ | 273,495 | $ | 216,318 | $ | 171,504 | ||||||||||
| Average net assets |
276,745 | 276,254 | 225,653 | 197,504 | 166,738 | |||||||||||||||
| Total expense ratio (3) (4) |
9.45 | % | 9.57 | % | 11 | % | 13 | % | 17 | % | ||||||||||
| Operating expenses to average net assets (4) |
6.04 | 6.48 | 6.94 | 7.02 | 8.46 | |||||||||||||||
| Net investment income after income taxes to average net assets (4) |
6.08 | 5.48 | 5.40 | 4.44 | 6.46 | |||||||||||||||
|
|
|
|
|
|
|
|
|
|
|
|||||||||||
| (1) | Includes $0.00, $0.00, $0.00, $0.00, and $0.06 of undistributed net investment income per share as of December 31, 2015, 2014, 2013, 2012, and 2011, and $0.00 of undistributed net realized gains per share for all years presented. |
| (2) | Total return is calculated by dividing the change in market value of a share of common stock during the year, assuming the reinvestment of distributions on the payment date, by the per share market value at the beginning of the year. |
| (3) | Total expense ratio represents total expenses (interest expense, operating expenses, and income taxes) divided by average net assets. |
| (4) | MSC has assumed certain of the Company’s servicing obligations, and as a result, servicing fee income of $5,658, $5,946, $5,920, $6,066, and $5,492 and operating expenses of $6,044, $6,005, $5,841, $6,359, and $5,659 which formerly were the Company’s, were now MSC’s for the years ended December 31, 2015, 2014, 2013, 2012, and 2011. Excluding the impact of the MSC amounts, the total expense ratio, operating expense ratio, and net investment income ratio would have been 11.63%, 8.23%, and 5.94% in 2015, 11.74%, 8.65%, and 5.46% in 2014, 13.23%, 9.53%, and 5.39% in 2013, 15.73%, 10.23%, and 4.29% in 2012, and 20%, 12%, and 6.36% in 2011. |
(14) EMPLOYEE BENEFIT PLANS
The Company has a 401(k) Investment Plan (the 401(k) Plan) which covers all full-time and part-time employees of the Company who have attained the age of 21 and have a minimum of one year of service, including the employees of Medallion Bank. Under the 401(k) Plan, an employee may elect to defer not less than 1% and no more than 15% of the total annual compensation that would otherwise be paid to the employee, provided, however, that employee’s contributions may not exceed certain maximum amounts determined under the Internal Revenue Code. Employee contributions are invested in various mutual funds according to the directions of the employee. The Company matches employee contributions to the 401(k) Plan in an amount per employee up to one-third of such employee’s contribution but in no event greater than 2% of the portion of such employee’s annual salary eligible for 401(k) Plan benefits. The Company’s 401(k) plan expense, including amounts for the employees of Medallion Bank and other unconsolidated, wholly-owned portfolio companies, was approximately $185,000, $181,000, and $161,000 for the years ended December 31, 2015, 2014, and 2013.
F-26
Table of Contents
(15) FAIR VALUE OF FINANCIAL INSTRUMENTS
FASB ASC Topic 825, “Financial Instruments,” requires disclosure of fair value information about certain financial instruments, whether assets, liabilities, or off-balance-sheet commitments, if practicable. The following methods and assumptions were used to estimate the fair value of each class of financial instrument. Fair value estimates that were derived from broker quotes cannot be substantiated by comparison to independent markets and, in many cases, could not be realized in immediate settlement of the instrument.
(a) Investments—The Company’s investments are recorded at the estimated fair value of such investments.
(b) Floating rate borrowings—Due to the short-term nature of these instruments, the carrying amount approximates fair value.
(c) Commitments to extend credit—The fair value of commitments to extend credit is estimated using the fees currently charged to enter into similar agreements, taking into account the remaining terms of the agreements and present creditworthiness of the counter parties. For fixed rate loan commitments, fair value also includes a consideration of the difference between the current levels of interest rates and the committed rates. At December 31, 2015 and 2014, the estimated fair value of these off-balance-sheet instruments was not material.
(d) Fixed rate borrowings—The fair value of the debentures payable to the SBA is estimated based on current market interest rates for similar debt.
| December 31, 2015 | December 31, 2014 | |||||||||||||||
| (Dollars in thousands) |
Carrying Amount | Fair Value | Carrying Amount | Fair Value | ||||||||||||
| Financial assets |
||||||||||||||||
| Investments |
$ | 606,959 | $ | 606,959 | $ | 527,601 | $ | 527,601 | ||||||||
| Cash (1) |
30,912 | 30,912 | 47,083 | 47,083 | ||||||||||||
| Accrued interest receivable (2) |
1,003 | 1,003 | 988 | 988 | ||||||||||||
| Financial liabilities |
||||||||||||||||
| Funds borrowed(2) |
404,540 | 404,540 | 348,795 | 348,795 | ||||||||||||
| Accrued interest payable(2) |
1,302 | 1,302 | 2,171 | 2,171 | ||||||||||||
| (1) | Categorized as level 1 within the fair value hierarchy. |
| (2) | Categorized as level 3 within the fair value hierarchy. |
(16) FAIR VALUE OF ASSETS AND LIABILITIES
The Company follows the provisions of FASB ASC 820, which defines fair value, establishes a framework for measuring fair value, establishes a fair value hierarchy based on the quality of inputs used to measure fair value, and enhances disclosure requirements for fair value measurements. The Company accounts for substantially all of its financial instruments at fair value or considers fair value in its measurement, in accordance with the accounting guidance for investment companies. See Note 2 sections “Fair Value of Assets and Liabilities” and “Investment Valuation” for a description of our valuation methodology which is unchanged during 2015.
In accordance with FASB ASC 820, the Company has categorized its assets and liabilities measured at fair value, based on the priority of the inputs to the valuation technique, into a three-level fair value hierarchy. The fair value hierarchy gives the highest priority to quoted prices in active markets for identical assets or liabilities (level 1) and the lowest priority to unobservable inputs (level 3). Our assessment and classification of an investment within a level can change over time based upon maturity or liquidity of the investment and would be reflected at the beginning of the quarter in which the change occurred.
As required by FASB ASC 820, when the inputs used to measure fair value fall within different levels of the hierarchy, the level within which the fair value measurement is categorized is based on the lowest level input that is significant to the fair value measurement in its entirety. For example, a level 3 fair value measurement may include inputs that are observable (level 1 and 2) and unobservable (level 3). Therefore gains and losses for such assets and liabilities categorized within the level 3 table below may include changes in fair value that are attributable to both observable inputs (level 1 and 2) and unobservable inputs (level 3).
F-27
Table of Contents
Assets and liabilities measured at fair value, recorded on the consolidated balance sheets, are categorized based on the inputs to the valuation techniques as follows:
Level 1. Assets and liabilities whose values are based on unadjusted quoted prices for identical assets or liabilities in an active market that the Company has the ability to access (examples include active exchange-traded equity securities, exchange-traded derivatives, most US Government and agency securities, and certain other sovereign government obligations).
Level 2. Assets and liabilities whose values are based on quoted prices in markets that are not active or model inputs that are observable either directly or indirectly for substantially the full term of the asset or liability. Level 2 inputs include the following:
| A) | Quoted prices for similar assets or liabilities in active markets (for example, restricted stock); |
| B) | Quoted price for identical or similar assets or liabilities in non-active markets (for example, corporate and municipal bonds, which trade infrequently); |
| C) | Pricing models whose inputs are observable for substantially the full term of the asset or liability (examples include most over-the-counter derivatives, including interest rate and currency swaps); and |
| D) | Pricing models whose inputs are derived principally from or corroborated by observable market data through correlation or other means for substantially the full term of the asset or liability (examples include certain residential and commercial mortgage-related assets, including loans, securities, and derivatives). |
Level 3. Assets and liabilities whose values are based on prices or valuation techniques that require inputs that are both unobservable and significant to the overall fair value measurement. These inputs reflect management’s own assumptions about the assumptions a market participant would use in pricing the assets or liability (examples include certain private equity investments, and certain residential and commercial mortgage-related assets, including loans, securities, and derivatives).
A review of fair value hierarchy classification is conducted on a quarterly basis. Changes in the observability of valuation inputs may result in a reclassification for certain assets or liabilities. Reclassifications impacting level 3 of the fair value hierarchy are reported as transfers in/out of the level 3 category as of the beginning of the quarter in which the reclassifications occur. The following paragraphs describe the sensitivity of the various level 3 valuations to the factors that are relevant in their valuation analysis.
Medallion loans and the asset-based portion of the commercial loan portfolio are primarily collateral-based lending, whereby the collateral value exceeds the amount of the loan, providing sufficient excess collateral to protect against losses to the Company. As a result, the initial valuation assessment is that as long as the loan is current and performing, its fair value approximates the par value of the loan. To the extent a loan becomes nonperforming, the collateral value has almost always been adequate to result in a complete recovery. In a case where the collateral value was inadequate, an unrealized loss would be recorded to reflect any shortfall. Collateral values for medallion loans are typically obtained from transfer prices reported by the regulatory agency in a particular local market (e.g. New York City Taxi and Limousine Commission). Collateral values for asset based loans are confirmed through daily borrowing base analysis of borrower availability, confirmations obtained from a borrower’s underlying customers, and field examinations by us or third parties engaged by us. These portfolios have historically been at very low loan to collateral value ratios, and as a result, are generally not highly sensitive to changes in collateral values as only a very significant downward movement would have an impact on the Company’s valuation analysis, potentially resulting in a significantly lower fair market value measurement.
The mezzanine and other secured commercial portions of the commercial loan portfolio are a combination of cash flow and collateral based lending. The initial valuation assessment is that as long as the loan is current and performing, its fair value approximates the par value of the loan. If a loan becomes nonperforming, an evaluation is performed which considers and analyzes a variety of factors which may include the financial condition and operating performance of the borrower, the adequacy of the collateral, individual credit risks, historical loss experience, the relationships between current and projected market rates and portfolio rates of interest and maturities, as well as general market trends for businesses in the same industry. Since each individual nonperforming loan has its own unique attributes, the factors analyzed, and their relative importance to each valuation analysis, differ between each asset, and may differ from period to period for a particular asset. The valuation is highly sensitive to changes in the assumptions used. To the extent that any assumption in the analysis changes significantly from one period to another, that change could result in a significantly lower or higher fair market value measurement. For example, if a borrower’s valuation was determined primarily on the cash flow generated from their business, then if that cash flow deteriorated significantly from a prior period valuation, that could have a material impact on the valuation in the current period.
F-28
Table of Contents
The investment in Medallion Bank is subject to a thorough valuation analysis as described previously, and on an annual basis, the Company also receives an opinion regarding the valuation from an independent third party to assist the Board of Directors in its determination of the fair value. The Company determines whether any factors give rise to a valuation different than recorded book value, including various regulatory restrictions that were established at Medallion Bank’s inception, by the FDIC and State of Utah, and also by additional regulatory restrictions, such as the prior moratorium imposed by the Dodd-Frank Act on the acquisition of control of an industrial bank by a “commercial firm” (a company whose gross revenues are primarily derived from non-financial activities) which expired in July 2013, and the lack of any new charter issuances since the moratorium’s expiration. Because of these restrictions and other factors, the Company’s Board of Directors had previously determined that Medallion Bank had little value beyond its recorded book value. As a result of this valuation process, the Company had previously used Medallion Bank’s actual results of operations as the best estimate of changes in fair value, and recorded the results as a component of unrealized appreciation (depreciation) on investments. In 2015 the Company became aware of external interest in Medallion Bank and its portfolio’s assets at values in excess of their carrying amount. The Company incorporated these new factors in the Medallion Bank’s fair value analysis and the Board of Directors determined that Medallion Bank had a fair value in excess of book value. The Company also engaged a valuation specialist to assist the Board of Directors in their determination of Medallion Bank’s fair value, and this appreciation of $15,500,000 was thereby recorded in 2015. See Note 3 for additional information about Medallion Bank.
Investments in controlled subsidiaries, other than Medallion Bank, equity investments, and investments other than securities are valued similarly, while also considering available current market data, including relevant and applicable market trading and transaction comparables, the nature and realizable value of any collateral, applicable interest rates and market yields, the portfolio company’s ability to make payments, its earnings and cash flows, the markets in which the portfolio company does business, and borrower financial analysis, among other factors. As a result of this valuation process, the Company uses the actual results of operations of the controlled subsidiaries as the best estimate of changes in fair value, in most cases, and records the results as a component of unrealized appreciation (depreciation) on investments. For the balance of controlled subsidiary investments, equity investments, and investments other than securities positions, the result of the analysis results in changes to the value of the position if there is clear evidence that it’s value has either decreased or increased in light of the specific facts considered for each investment. The valuation is highly sensitive to changes in the assumptions used. To the extent that any assumption in the analysis changes significantly from one period to another, that change could result in a significantly lower or higher fair market value measurement. For example, if an investee’s valuation was determined primarily on the cash flow generated from their business, then if that cash flow deteriorated significantly from a prior period valuation, that could have a material impact on the valuation in the current period.
The following tables present the Company’s fair value hierarchy for those assets and liabilities measured at fair value on a recurring basis as of December 31, 2015 and 2014.
| (Dollars in thousands) |
Level 1 | Level 2 | Level 3 | Total | ||||||||||||
| 2015 Assets |
||||||||||||||||
| Medallion loans |
$ | — | $ | — | $ | 308,408 | $ | 308,408 | ||||||||
| Commercial loans |
— | — | 81,895 | 81,895 | ||||||||||||
| Investment in Medallion Bank and other controlled subsidiaries |
— | — | 159,913 | 159,913 | ||||||||||||
| Equity investments |
62 | — | 6,797 | 6,859 | ||||||||||||
| Investment securities |
49,884 | — | — | 49,884 | ||||||||||||
| Investments other than securities |
— | — | 37,882 | 37,882 | ||||||||||||
| Other assets |
— | — | 354 | 354 | ||||||||||||
| 2014 Assets |
||||||||||||||||
| Medallion loans |
$ | — | $ | — | $ | 311,894 | $ | 311,894 | ||||||||
| Commercial loans |
— | — | 71,149 | 71,149 | ||||||||||||
| Investment in Medallion Bank and other controlled subsidiaries |
— | — | 136,848 | 136,848 | ||||||||||||
| Equity investments |
178 | — | 7,532 | 7,710 | ||||||||||||
| Investments other than securities |
— | 47,502 | — | 47,502 | ||||||||||||
| Other assets |
— | — | 392 | 392 | ||||||||||||
Included in level 3 investments in Medallion Bank and other controlled subsidiaries is primarily the investment in Medallion Bank, as well as other consolidated subsidiaries such as MSC, a start-up business engaged in media-buying consulting, and other securities detailed in the consolidated summary schedule of investments following these footnotes. Included in level 3 equity investments are unregistered shares of common stock in a publicly-held company, as well as certain private equity positions in non-marketable securities.
F-29
Table of Contents
The following tables provide a summary of changes in fair value of the Company’s level 3 assets and liabilities for the years ended December 31, 2015 and 2014.
| (Dollars in thousands) |
Medallion Loans |
Commercial Loans(3) |
Investment in Medallion Bank & Other Controlled Subs(2) |
Equity Investments(2) |
Investments Other Than Securities(4) |
Other Assets(3) |
||||||||||||||||||
| December 31, 2014 |
$ | 311,894 | $ | 71,149 | $ | 136,848 | $ | 7,532 | $ | 0 | $ | 392 | ||||||||||||
| Gains (losses) included in earnings |
(3,578 | ) | (236 | ) | 43,384 | 1,113 | (1,570 | ) | (68 | ) | ||||||||||||||
| Purchases, investments, and issuances |
38,966 | 27,255 | 10,604 | 1,447 | — | — | ||||||||||||||||||
| Sales, maturities, settlements, and distributions |
(38,874 | ) | (16,243 | ) | (32,535 | ) | (1,683 | ) | — | — | ||||||||||||||
| Transfers in (out) |
— | (30 | ) | 1,612 | (1,612 | ) | 39,452 | 30 | ||||||||||||||||
|
|
|
|
|
|
|
|
|
|
|
|
|
|||||||||||||
| December 31, 2015 |
$ | 308,408 | $ | 81,895 | $ | 159,913 | $ | 6,797 | $ | 37,882 | $ | 354 | ||||||||||||
|
|
|
|
|
|
|
|
|
|
|
|
|
|||||||||||||
| Amounts related to held assets(1) |
($ | 3,438 | ) | ($ | 175 | ) | $ | 40,154 | $ | 207 | ($ | 9,621 | ) | (68 | ) | |||||||||
|
|
|
|
|
|
|
|
|
|
|
|
|
|||||||||||||
| (1) | Total unrealized gains (losses) included in income for the year which relate to assets held as of December 31, 2015. |
| (2) | During 2015, the investment in Medallion Motorsports was transferred from equity investment to controlled subsidiary at fair value in the amount of $1,612. |
| (3) | During 2015, a commercial loan was settled, the proceeds of which are held in escrow subject to litigation. The investment was transferred from commercial loan to other assets at fair value in the amount of $30. |
| (4) | During 2015, the investments other than securities were transferred from level 2 to level 3. |
| (Dollars in thousands) |
Medallion Loans |
Commercial Loans |
Investment in Medallion Bank & Other Controlled Subs |
Equity Investments |
Other Assets |
|||||||||||||||
| December 31, 2013 |
$ | 297,861 | $ | 60,168 | $ | 108,623 | $ | 6,225 | $ | 392 | ||||||||||
| Gains (losses) included in earnings |
— | (940 | ) | 30,643 | 781 | — | ||||||||||||||
| Purchases, investments, and issuances |
88,526 | 20,747 | 11,982 | 1,174 | — | |||||||||||||||
| Sales, maturities, settlements, and distributions |
(74,493 | ) | (8,826 | ) | (14,400 | ) | (648 | ) | — | |||||||||||
| Transfers in (out) |
— | — | — | — | — | |||||||||||||||
|
|
|
|
|
|
|
|
|
|
|
|||||||||||
| December 31, 2014 |
$ | 311,894 | $ | 71,149 | $ | 136,848 | $ | 7,532 | $ | 392 | ||||||||||
|
|
|
|
|
|
|
|
|
|
|
|||||||||||
| Amounts related to held assets(1) |
$ | — | ($ | 1,328 | ) | $ | 30,643 | $ | 731 | — | ||||||||||
|
|
|
|
|
|
|
|
|
|
|
|||||||||||
| (1) | Total unrealized gains (losses) included in income for the year which relate to assets held as of December 31, 2014. |
Significant Unobservable Inputs
ASC Topic 820 requires disclosure of quantitative information about the significant unobservable inputs used in the valuation of assets and liabilities classified as Level 3 within the fair value hierarchy. The tables below are not intended to be all-inclusive, but rather to provide information on significant unobservable inputs and valuation techniques used by the Company.
The valuation techniques and significant unobservable inputs used in recurring Level 3 fair value measurements of assets and liabilities as of December 31, 2015 and 2014 were as follows.
| (Dollars in thousands) | Fair Value at 12/31/15 |
Valuation Techniques | Unobservable Inputs | Range (Weighted Average) |
||||||||
| Medallion Loans |
$ | 308,408 | Precedent market transactions |
Adequacy of collateral (loan to value) |
1% - 155% (79%) | |||||||
| Commercial Loans – Asset-Based |
3,678 | Borrower collateral analysis |
Adequacy of collateral (loan to value) |
0% - 84% (54%) | ||||||||
| Commercial Loans – Mezzanine and Other |
78,217 | Borrower financial analysis |
Financial condition and operating performance of the borrower |
N/A | ||||||||
| Portfolio yields | 3% - 19.00% (13.13%) | |||||||||||
| Investment in Medallion Bank |
152,166 | Third party valuation using a weighting of the three methods utilized |
Comparable Transactions Analysis Control Premium Discount rate in Cash |
|
(11.4% premium to book value)
(32%)
(20%) |
| ||||||
| Investee book value and equity pickup |
Financial condition and operating performance of the investee |
N/A | ||||||||||
| Premium on portfolio assets |
(1.56% premium recorded) | |||||||||||
| Investment in Other Controlled Subsidiaries |
4,234 | Investee book value and equity pickup, adjusted for asset appreciation |
Financial condition and operating performance of the investee |
N/A | ||||||||
| 986 | Investee book value and equity pickup |
Third party valuation/ offer to purchase assets |
N/A | |||||||||
| Collateral support | N/A | |||||||||||
| Financial condition and operating performance of the investee |
N/A | |||||||||||
| 2,527 | Investee financial analysis |
Financial condition and operating performance |
N/A | |||||||||
| Equity Investments |
1,957 | Investee book value | Valuation indicated by investee filings |
N/A | ||||||||
| 509 | Market comparables | Discount for lack of marketability |
10% (10%) | |||||||||
| 4,331 | Investee financial analysis |
Financial condition and operating performance of the borrower |
N/A | |||||||||
| Collateral support | N/A | |||||||||||
| Investments Other Than Securities |
37,882 | Precedent market transaction |
Transfer prices of Chicago medallions |
$150 - $238 ($194) | ||||||||
| Cash flow analysis | Discount rate in cash flow analysis |
6% | ||||||||||
| Other Assets |
354 | Borrower collateral analysis |
Adequacy of collateral (loan to value) |
0% | ||||||||
F-30
Table of Contents
| (Dollars in thousands) |
Fair Value at 12/31/14 |
Valuation Techniques | Unobservable Inputs | Range (Weighted Average) | ||||||||
| Medallion Loans |
$ | 311,894 | Precedent market transactions |
Adequacy of collateral (loan to value) |
0% -111% (60%) | |||||||
| Commercial Loans - Asset-Based |
3,467 | Borrower collateral analysis |
Adequacy of collateral (loan to value) |
2% -80% (52%) (1) | ||||||||
| Commercial Loans – Mezzanine and Other |
67,682 | Borrower financial analysis |
Financial condition and operating performance of the borrower |
N/A | ||||||||
| Portfolio yields | 3.00% - 17.00% (12.22%) | |||||||||||
| Investment in Medallion Bank |
125,027 | Investee book value and equity pickup |
Financial condition and operating performance of the investee |
N/A | ||||||||
| Investment in Other Controlled Subsidiaries |
9,463 | Market comparables | Valuation indicated by private company offers |
N/A | ||||||||
| 2,358 | Investee book value and equity pickup |
Collateral support | N/A | |||||||||
| Financial condition and operating performance of the investee |
N/A | |||||||||||
| Equity Investments |
2,599 | Investee book value | Valuation indicated by investee filings |
N/A | ||||||||
| 1,230 | Market comparables | Discount for lack of marketability |
10% (10%) | |||||||||
| 3,703 | Investee financial analysis |
Financial condition and operating performance of the borrower |
N/A | |||||||||
| Collateral support | N/A | |||||||||||
| Other Assets |
392 | Borrower collateral analysis |
Adequacy of collateral (loan to value) |
0% | ||||||||
| (1) | As of December 31, 2014, the Company had one asset based loan in the amount of $205 which had $0 collateral. |
(17) INVESTMENTS OTHER THAN SECURITIES
The following table presents the Company’s investments other than securities as of December 31, 2015 and 2014.
| Investment Type (Dollars in thousands) |
Number of Investments |
Investment Cost |
Value as of 12/31/15 |
Value as of 12/31/14 |
||||||||||||
| City of Chicago Taxicab Medallions |
154 | (1) | $ | 8,411 | $ | 36,806 | (2) | $ | 46,154 | (2) | ||||||
| City of Chicago Taxicab Medallions (handicap accessible) |
5 | (1) | 278 | 1,076 | (3) | 1,348 | (3) | |||||||||
|
|
|
|
|
|
|
|||||||||||
| Total Investments Other Than Securities |
$ | 8,689 | $ | 37,882 | $ | 47,502 | ||||||||||
| (1) | Investment is not readily marketable, is considered income producing, is not subject to option, and is a non-qualifying asset under the 1940 Act. |
| (2) | Gross unrealized appreciation, gross unrealized depreciation, and net unrealized appreciation for Federal income tax purposes was $34,240, $0, and $34,240 as of December 31, 2015, and was $43,027, $0, and $43,027 as of December 31, 2014. The aggregate cost for Federal income tax purposes was $2,566 at December 31, 2015 and $3,127 at December 31, 2014. |
| (3) | Gross unrealized appreciation, gross unrealized depreciation, and net unrealized appreciation for Federal income tax purposes was $989, $0, and $989 as of December 31, 2015 and is $1,244, $0, and $1,244 as of December 31, 2014. The aggregate cost for Federal income tax purposes was $84 at December 31, 2015 and $103 at December 31, 2014. |
(18) SUBSEQUENT EVENTS
We have evaluated subsequent events that have occurred through the date of financial statement issuance.
The Company’s Board of Directors approved the 2015 Employee Restricted Stock Plan (2015 Restricted Stock Plan) on February 13, 2015, which was approved by the Company’s shareholders on June 5, 2015, and on which exemptive relief to implement the 2015 Restricted Stock Plan was received from the SEC on March 1, 2016. A total of 700,000 shares of the Company’s common stock are available for issuance under the 2015 Restricted Stock Plan. The terms of the 2015 Restricted Stock Plan provide for grants of restricted stock awards to the Company’s employees. A grant of restricted stock is a grant of shares of the Company’s common stock which, at the time of issuance, is subject to certain forfeiture provisions, and thus is restricted as to transferability until such forfeiture restrictions have lapsed. Awards under the 2015 Restricted Stock Plan are subject to certain limitations as set forth in the 2015 Restricted Stock Plan. The 2015 Restricted Stock Plan will terminate when all shares of common stock authorized for issuance under the 2015 Restricted Stock Plan have been delivered and the forfeiture restrictions on all awards have lapsed, or by action of the Board of Directors pursuant to the 2015 Restricted Stock Plan, whichever first occurs.
The Company’s Board of Directors approved the 2015 Non-Employee Director Stock Option Plan (2015 Director Plan) on March 12, 2015, which was approved by the Company’s shareholders on June 5, 2015, and on which exemptive relief to implement the 2015 Director Plan was received from the SEC on February 29, 2016. A total of 300,000 shares of the Company’s common stock are issuable under the 2015 Director Plan. Under the 2015 Director Plan, unless otherwise determined by the Board of Directors, the Company will grant options to purchase 12,000 shares of the Company’s common stock to an non-employee director upon election to the Board of Directors, with an adjustment for directors who are elected to serve less than a full term. The option price per share may not be less than the current market value of the Company’s common stock on the date the option is granted. Options granted under the 2015 Director Plan are exercisable annually, as defined in the 2015 Director Plan. The term of the options is ten years.
On February 12, 2016, the Company’s board of directors declared a $0.25 per share common stock distribution, payable on April 11, 2016 to shareholders of record on March 31, 2016.
In 2016, the $3,000,000 of available SBA commitments were utilized.
F-31
Table of Contents
Medallion Financial Corp.
Consolidated Summary Schedule of Investments
December 31, 2015
| (Dollars in thousands) |
Obligor Name/Interest Rate Range |
Security Type (all restricted unless otherwise noted) |
Acquisition Date |
Maturity Date |
No. of Invest. |
% of Net Assets |
Interest Rate (1) |
Original Cost of 2015 Acquisitions (5) |
Principal Outstanding |
Cost (4) | Fair Value |
|||||||||||||||||||||||||||||||
| Medallion Loans |
||||||||||||||||||||||||||||||||||||||||||
| New York |
391 | 77 | % | 3.72 | % | $ | 25,051 | $ | 213,374 | $ | 213,356 | $ | 213,278 | |||||||||||||||||||||||||||||
| Real Cab Corp ## | Term Loan | 07/20/07 | 07/20/17 | 1 | 1 | % | 2.81 | % | $ | 2,545 | $ | 2,545 | $ | 2,545 | ||||||||||||||||||||||||||||
| Real Cab Corp | Term Loan | 08/19/14 | 07/20/17 | 1 | * | 3.31 | % | $ | 903 | $ | 903 | $ | 903 | |||||||||||||||||||||||||||||
| Real Cab Corp | Term Loan | 07/20/07 | 07/20/17 | 1 | * | 2.81 | % | $ | 350 | $ | 350 | $ | 351 | |||||||||||||||||||||||||||||
| Sean Cab Corp ## | Term Loan | 12/09/11 | 11/23/18 | 1 | 1 | % | 4.63 | % | $ | 3,376 | $ | 3,376 | $ | 3,374 | ||||||||||||||||||||||||||||
| Slo Cab Corp ## | Term Loan | 07/20/07 | 07/20/17 | 1 | 1 | % | 2.81 | % | $ | 1,527 | $ | 1,527 | $ | 1,527 | ||||||||||||||||||||||||||||
| Slo Cab Corp ## | Term Loan | 08/19/14 | 07/20/17 | 1 | * | 3.31 | % | $ | 542 | $ | 542 | $ | 542 | |||||||||||||||||||||||||||||
| Slo Cab Corp ## | Term Loan | 07/20/07 | 07/20/17 | 1 | * | 2.81 | % | $ | 210 | $ | 210 | $ | 211 | |||||||||||||||||||||||||||||
| Whispers Taxi Inc ## | Term Loan | 05/28/13 | 05/28/16 | 1 | 1 | % | 3.35 | % | $ | 2,046 | $ | 2,046 | $ | 2,045 | ||||||||||||||||||||||||||||
| Esg Hacking Corp ## | Term Loan | 03/12/14 | 03/12/17 | 1 | 1 | % | 3.50 | % | $ | 1,760 | $ | 1,760 | $ | 1,763 | ||||||||||||||||||||||||||||
| Sag Taxi LLC ## | Term Loan | 03/28/14 | 03/28/17 | 1 | 1 | % | 3.50 | % | $ | 1,754 | $ | 1,754 | $ | 1,755 | ||||||||||||||||||||||||||||
| Pontios Taxi LLC ## | Term Loan | 03/28/14 | 03/28/17 | 1 | 1 | % | 3.50 | % | $ | 1,753 | $ | 1,753 | $ | 1,754 | ||||||||||||||||||||||||||||
| Kos Taxi LLC ## | Term Loan | 03/28/14 | 03/28/17 | 1 | 1 | % | 3.50 | % | $ | 1,752 | $ | 1,752 | $ | 1,753 | ||||||||||||||||||||||||||||
| Ikaria Taxi LLC ## | Term Loan | 03/28/14 | 03/28/17 | 1 | 1 | % | 3.50 | % | $ | 1,752 | $ | 1,752 | $ | 1,753 | ||||||||||||||||||||||||||||
| Yosi Transit Inc ## | Term Loan | 07/20/07 | 07/20/17 | 1 | * | 2.81 | % | $ | 1,018 | $ | 1,018 | $ | 1,018 | |||||||||||||||||||||||||||||
| Yosi Transit Inc ## | Term Loan | 08/19/14 | 07/20/17 | 1 | * | 3.31 | % | $ | 361 | $ | 361 | $ | 361 | |||||||||||||||||||||||||||||
| Yosi Transit Inc ## | Term Loan | 07/20/07 | 07/20/17 | 1 | * | 2.81 | % | $ | 140 | $ | 140 | $ | 141 | |||||||||||||||||||||||||||||
| Hamilton Transit LLC ## | Term Loan | 03/26/14 | 03/26/17 | 1 | 1 | % | 3.38 | % | $ | 1,502 | $ | 1,502 | $ | 1,505 | ||||||||||||||||||||||||||||
| Silke Hacking Corp ## | Term Loan | 03/26/14 | 03/26/17 | 1 | 1 | % | 3.38 | % | $ | 1,502 | $ | 1,502 | $ | 1,503 | ||||||||||||||||||||||||||||
| Daytona Hacking Corp ## | Term Loan | 03/26/14 | 03/26/17 | 1 | 1 | % | 3.38 | % | $ | 1,502 | $ | 1,502 | $ | 1,503 | ||||||||||||||||||||||||||||
| Kaderee M & G Corp ## | Term Loan | 03/26/14 | 03/26/17 | 1 | 1 | % | 3.38 | % | $ | 1,502 | $ | 1,502 | $ | 1,503 | ||||||||||||||||||||||||||||
| Christian Cab Corp | Term Loan | 11/27/12 | 11/27/18 | 1 | 1 | % | 3.75 | % | $ | 1,490 | $ | 1,490 | $ | 1,490 | ||||||||||||||||||||||||||||
| Bunty & Jyoti Inc ## | Term Loan | 03/13/13 | 03/13/16 | 1 | 1 | % | 3.75 | % | $ | 1,467 | $ | 1,467 | $ | 1,466 | ||||||||||||||||||||||||||||
| Junaid Trans Corp ## | Term Loan | 04/30/13 | 04/30/16 | 1 | 1 | % | 3.75 | % | $ | 1,446 | $ | 1,446 | $ | 1,445 | ||||||||||||||||||||||||||||
| Ocean Hacking Corp ## | Term Loan | 12/20/13 | 12/20/16 | 1 | 1 | % | 3.50 | % | $ | 1,424 | $ | 1,424 | $ | 1,425 | ||||||||||||||||||||||||||||
| Jacal Hacking Corp ## | Term Loan | 12/20/13 | 12/20/16 | 1 | 1 | % | 3.50 | % | $ | 1,424 | $ | 1,424 | $ | 1,424 | ||||||||||||||||||||||||||||
| Anniversary Taxi Corp ## | Term Loan | 04/11/14 | 04/11/17 | 1 | 1 | % | 3.25 | % | $ | 1,395 | $ | 1,395 | $ | 1,395 | ||||||||||||||||||||||||||||
| Avi Taxi Corporation ## | Term Loan | 04/11/14 | 04/11/17 | 1 | 1 | % | 3.25 | % | $ | 1,395 | $ | 1,395 | $ | 1,395 | ||||||||||||||||||||||||||||
| Kby Taxi Inc ## | Term Loan | 04/11/14 | 04/11/17 | 1 | 1 | % | 3.25 | % | $ | 1,395 | $ | 1,395 | $ | 1,395 | ||||||||||||||||||||||||||||
| Apple Cab Corp ## | Term Loan | 04/11/14 | 04/11/17 | 1 | 1 | % | 3.25 | % | $ | 1,395 | $ | 1,395 | $ | 1,395 | ||||||||||||||||||||||||||||
| Hj Taxi Corp ## | Term Loan | 04/11/14 | 04/11/17 | 1 | 1 | % | 3.25 | % | $ | 1,395 | $ | 1,395 | $ | 1,395 | ||||||||||||||||||||||||||||
| Various New York && ## |
2.75% to 10.00% | Term Loan | |
03/23/01 to 12/28/15 |
|
|
01/03/16 to 09/10/23 |
|
361 | 62 | % | 3.78 | % | $ | 25,051 | $ | 171,351 | $ | 171,333 | $ | 171,243 | |||||||||||||||||||||
| Chicago |
112 | 14 | % | 4.87 | % | $ | 4,656 | $ | 39,412 | $ | 39,406 | $ | 39,260 | |||||||||||||||||||||||||||||
| Sweetgrass Peach &Chadwick Cap ## | Term Loan | 08/28/12 | 02/24/18 | 1 | 1 | % | 5.00 | % | $ | 1,517 | $ | 1,517 | $ | 1,516 | ||||||||||||||||||||||||||||
| Various Chicago && ## |
3.25% to 12.00% | Term Loan |
|
01/22/10 to 12/22/15 |
|
|
10/19/15 to 12/22/20 |
|
111 | 14 | % | 4.87 | % | $ | 4,656 | $ | 37,895 | $ | 37,889 | $ | 37,744 | |||||||||||||||||||||
| Newark && ## |
4.50% to 7.00% | Term Loan | |
04/09/10 to |
|
|
02/14/16 to 05/14/25 |
|
115 | 9 | % | 5.26 | % | $ | 1,749 | $ | 24,585 | $ | 24,585 | $ | 24,654 | |||||||||||||||||||||
| Boston |
56 | 9 | % | 4.63 | % | $ | 3,268 | $ | 26,471 | $ | 26,436 | $ | 25,883 | |||||||||||||||||||||||||||||
| Chiso Trans Inc & | Term Loan | 11/26/13 | 11/07/16 | 1 | * | 4.25 | % | $ | 819 | $ | 819 | $ | 820 | |||||||||||||||||||||||||||||
| Chiso Trans Inc & | Term Loan | 04/20/12 | 04/20/18 | 1 | * | 5.50 | % | $ | 581 | $ | 581 | $ | 581 | |||||||||||||||||||||||||||||
| Various Boston && ## |
4.00% to 6.15% | Term Loan | |
06/12/07 to 09/29/15 |
|
|
12/07/15 to 11/06/25 |
|
54 | 9 | % | 4.62 | % | $ | 3,268 | $ | 25,071 | $ | 25,036 | $ | 24,482 | |||||||||||||||||||||
| Cambridge && ## |
3.75% to 5.50% | Term Loan | |
05/06/11 to 12/15/15 |
|
|
03/22/16 to 01/26/20 |
|
14 | 2 | % | 4.64 | % | $ | 2,414 | $ | 6,624 | $ | 6,607 | $ | 4,287 | |||||||||||||||||||||
| Various Other && ## |
4.75% to 11.50% | Term Loan | |
04/28/08 to 07/30/15 |
|
|
07/01/15 to 09/01/23 |
|
11 | 0 | % | 7.27 | % | $ | 320 | $ | 1,045 | $ | 1,043 | $ | 1,046 | |||||||||||||||||||||
|
|
|
|
|
|
|
|
|
|
|
|
|
|
|
|||||||||||||||||||||||||||||
| Total medallion loans ($238,103 pledged as collateral under borrowing arrangements) |
699 | 111 | % | 4.09 | % | $ | 37,458 | $ | 311,511 | $ | 311,433 | $ | 308,408 | |||||||||||||||||||||||||||||
|
|
|
|
|
|
|
|
|
|
|
|
|
|
|
|||||||||||||||||||||||||||||
| Commercial Loans |
||||||||||||||||||||||||||||||||||||||||||
| Secured mezzanine (23% Minnesota, 10% Oklahoma, 8% Pennsylvania, 8% Ohio, 8% North Carolina, 5% Kansas, 5% New York, 5% Massachusetts, 5% Rhode Island, 4% Wisconsin, 4% Illinois, 4% Deleware, 4% Michigan, 3% Texas and 4% all other states) (2) |
|
|||||||||||||||||||||||||||||||||||||||||
| Manufacturing (51% of the total) |
MicroGroup, Inc. (interest rate includes PIK interest of 2.00%) | Term Loan | 06/29/15 | 06/29/20 | 1 | 1 | % | 14.00 | % | $ | 3,200 | $ | 3,233 | $ | 3,233 | $ | 3,233 | |||||||||||||||||||||||||
| (capitalized interest of $33 per footnote 2) | ||||||||||||||||||||||||||||||||||||||||||
| AA Plush Holdings, LLC (interest rate includes PIK interest of 2.00%) | Term Loan | 08/15/14 | 08/15/19 | 1 | 1 | % | 14.00 | % | $ | 3,085 | $ | 3,085 | $ | 3,075 | ||||||||||||||||||||||||||||
| (capitalized interest of $85 per footnote 2) | ||||||||||||||||||||||||||||||||||||||||||
| EGC Operating Company, LLC (interest rate includes PIK interest of 2.00%) | Term Loan | 09/30/14 | 09/30/19 | 1 | 1 | % | 15.00 | % | $ | 2,945 | $ | 2,945 | $ | 2,954 | ||||||||||||||||||||||||||||
F-32
Table of Contents
Medallion Financial Corp.
Consolidated Summary Schedule of Investments
December 31, 2015
| (Dollars in thousands) |
Obligor Name/Interest Rate Range |
Security Type (all restricted unless otherwise noted) |
Acquisition Date |
Maturity Date |
No. of Invest. |
% of Net Assets |
Interest Rate (1) |
Original Cost of 2015 Acquisitions (5) |
Principal Outstanding |
Cost (4) | Fair Value |
|||||||||||||||||||||||||||||||||
| (capitalized interest of $15 per footnote 2) | ||||||||||||||||||||||||||||||||||||||||||||
| Pinnacle Products International, Inc. (interest rate includes PIK interest of 3.00%) | Term Loan | 10/09/15 | 10/09/20 | 1 | 1 | % | 15.00 | % | $ | 2,800 | $ | 2,820 | $ | 2,820 | $ | 2,820 | ||||||||||||||||||||||||||||
| (capitalized interest of $20 per footnote 2) | ||||||||||||||||||||||||||||||||||||||||||||
| Tech Cast Holdings, LLC (interest rate includes PIK interest of 3.00%) | Term Loan | 12/12/14 | 12/12/19 | 1 | 1 | % | 15.00 | % | $ | 2,690 | $ | 2,690 | $ | 2,661 | ||||||||||||||||||||||||||||||
| + |
Production Services Associates LLC (d/b/a American Card Services) (interest rate includes PIK interest of 2.00%) | Term Loan | 02/17/15 | 02/17/20 | 1 | 1 | % | 16.00 | % | $ | 2,600 | $ | 2,646 | $ | 2,646 | $ | 2,624 | |||||||||||||||||||||||||||
| (capitalized interest of $46 per footnote 2) | ||||||||||||||||||||||||||||||||||||||||||||
| BB Opco, LLC d/b/a BreathableBaby, LLC (interest rate includes PIK interest of 2.00%) | Term Loan | 08/01/14 | 08/01/19 | 1 | 1 | % | 14.00 | % | $ | 2,573 | $ | 2,573 | $ | 2,577 | ||||||||||||||||||||||||||||||
| (capitalized interest of $73 per footnote 2) | ||||||||||||||||||||||||||||||||||||||||||||
| WRWP, LLC (interest rate includes PIK interest of 3.00%) | Term Loan | 12/30/14 | 12/30/19 | 1 | 1 | % | 15.00 | % | $ | 2,311 | $ | 2,311 | $ | 2,319 | ||||||||||||||||||||||||||||||
| (capitalized interest of $70 per footnote 2) | ||||||||||||||||||||||||||||||||||||||||||||
| Dynamic Systems, Inc. (interest rate includes PIK interest of 3.50%) | Term Loan | 12/23/10 | 12/23/17 | 1 | 1 | % | 15.50 | % | $ | 2,066 | $ | 2,066 | $ | 2,066 | ||||||||||||||||||||||||||||||
| (capitalized interest of $241 per footnote 2) | ||||||||||||||||||||||||||||||||||||||||||||
| American Cylinder, Inc. d/b/a All Safe (interest rate includes PIK interest of 7.00%) | Term Loan | 07/03/13 | 01/03/18 | 1 | 1 | % | 19.00 | % | $ | 1,577 | $ | 1,577 | $ | 1,575 | ||||||||||||||||||||||||||||||
| (capitalized interest of $77 per footnote 2) | ||||||||||||||||||||||||||||||||||||||||||||
| + |
GAF Manufacturing, LLC (interest rate includes PIK interest of 2.00%) | Term Loan | 03/06/14 | 03/06/19 | 1 | 1 | % | 14.00 | % | $ | 1,556 | $ | 1,556 | $ | 1,562 | |||||||||||||||||||||||||||||
| (capitalized interest of $56 per footnote 2) | ||||||||||||||||||||||||||||||||||||||||||||
| + |
Respiratory Technologies, Inc. | Term Loan | 04/25/12 | 04/25/17 | 1 | 1 | % | 12.00 | % | $ | 1,500 | $ | 1,500 | $ | 1,503 | |||||||||||||||||||||||||||||
| + |
Various Other && 12.00% to 17.00% | Term Loan | |
03/10/99 to 07/17/12 |
|
|
03/31/10 to 01/31/19 |
|
5 | 2 | % | 13.97 | % | $ | 5,561 | $ | 5,561 | $ | 5,561 | |||||||||||||||||||||||||
| Professional, Scientific, and Technical Services (12% of the total) |
Weather Decision Technologies, Inc. {One-time on 1/1/18 to 15%} (interest rate includes PIK interest of 9.00%) | Term Loan | 12/11/15 | 12/11/20 | 1 | 1 | % | 18.00 | % | $ | 3,500 | $ | 3,517 | $ | 3,517 | $ | 3,505 | |||||||||||||||||||||||||||
| (capitalized interest of $18 per footnote 2) | ||||||||||||||||||||||||||||||||||||||||||||
| JR Thompson Company LLC (interest rate includes PIK interest of 2.00%) | Term Loan | 05/21/15 | 05/21/22 | 1 | 1 | % | 14.00 | % | $ | 2,800 | $ | 2,273 | $ | 2,273 | $ | 2,273 | ||||||||||||||||||||||||||||
| (capitalized interest of $12 per footnote 2) | ||||||||||||||||||||||||||||||||||||||||||||
| + |
DPIS Engineering, LLC | Term Loan | 12/01/14 | 06/30/20 | 1 | 1 | % | 12.00 | % | $ | 2,000 | $ | 2,000 | $ | 1,997 | |||||||||||||||||||||||||||||
| Information (11% of the total) |
US Internet Corp. | Term Loan | 06/12/13 | 09/18/20 | 1 | 1 | % | 14.50 | % | $ | 3,000 | $ | 3,000 | $ | 3,013 | |||||||||||||||||||||||||||||
| US Internet Corp. | Term Loan | 03/18/15 | 09/18/20 | 1 | 1 | % | 14.50 | % | $ | 1,750 | $ | 1,750 | $ | 1,750 | $ | 1,741 | ||||||||||||||||||||||||||||
| Centare Holdings, Inc. (interest rate includes PIK interest of 2.00%) | Term Loan | 08/30/13 | 08/30/18 | 1 | 1 | % | 14.00 | % | $ | 2,500 | $ | 2,500 | $ | 2,490 | ||||||||||||||||||||||||||||||
| Arts, Entertainment, and Recreation (8% of the total) |
RPAC Racing, LLC (interest rate includes PIK interest of 10.00%) | Term Loan | 11/19/10 | 01/15/17 | 1 | 2 | % | 10.00 | % | $ | 5,033 | $ | 5,033 | $ | 5,033 | |||||||||||||||||||||||||||||
| (capitalized interest of $1,994 per footnote 2) | ||||||||||||||||||||||||||||||||||||||||||||
| Transportation and Warehousing (5% of the total) |
LLL Transport, Inc. (interest rate includes PIK interest of 3.00%) | Term Loan | 10/23/15 | 04/23/21 | 1 | 1 | % | 15.00 | % | $ | 3,500 | $ | 3,514 | $ | 3,514 | $ | 3,511 | |||||||||||||||||||||||||||
| (capitalized interest of $14 per footnote 2) | ||||||||||||||||||||||||||||||||||||||||||||
| Administrative and Support Services (5% of the total) |
Staff One, Inc. | Term Loan | 06/30/08 | 03/31/17 | 1 | 1 | % | 3.00 | % | $ | 2,931 | $ | 2,931 | $ | 2,931 | |||||||||||||||||||||||||||||
| Staff One, Inc. | Term Loan | 09/15/11 | 03/31/17 | 1 | * | 3.00 | % | $ | 369 | $ | 369 | $ | 369 | |||||||||||||||||||||||||||||||
| Wholesale Trade (5% of the total) |
Fit & Fresh, Inc (interest rate includes PIK interest of 2.00%) | Term Loan | 03/02/15 | 03/02/20 | 1 | 1 | % | 14.00 | % | $ | 3,000 | $ | 3,051 | $ | 3,051 | $ | 3,057 | |||||||||||||||||||||||||||
| (capitalized interest of $51 per footnote 2) | ||||||||||||||||||||||||||||||||||||||||||||
| Construction (2% of the total) |
Highland Crossing-M, LLC | Term Loan | 01/07/15 | 02/01/25 | 1 | 1 | % | 11.50 | % | $ | 2,200 | $ | 1,450 | $ | 1,450 | $ | 1,450 | |||||||||||||||||||||||||||
| Accommodation and Food Services (1% of the total) |
Various Other && 9.25% to 10.00% | Term Loan | |
06/30/00 to 11/05/10 |
|
|
09/30/16 to 11/05/20 |
|
3 | * | 9.81 | % | $ | 1,674 | $ | 1,674 | $ | 535 | ||||||||||||||||||||||||||
| Retail Trade (0% of the total) |
Various Other && 10.00% | Term Loan | 06/30/00 | 09/30/16 | 1 | * | 10.00 | % | $ | 224 | $ | 224 | $ | 36 | ||||||||||||||||||||||||||||||
|
|
|
|
|
|
|
|
|
|
|
|
|
|
|
|||||||||||||||||||||||||||||||
| Total secured mezzanine (2) |
33 | 24 | % | 13.59 | % | $ | 25,350 | $ | 67,849 | $ | 67,849 | $ | 66,471 | |||||||||||||||||||||||||||||||
|
|
|
|
|
|
|
|
|
|
|
|
|
|
|
|||||||||||||||||||||||||||||||
F-33
Table of Contents
Medallion Financial Corp.
Consolidated Summary Schedule of Investments
December 31, 2015
| (Dollars in thousands) |
Obligor Name/Interest Rate Range |
Security Type (all restricted unless otherwise noted) |
Acquisition Date |
Maturity Date |
No. of Invest. |
% of Net Assets |
Interest Rate (1) |
Original Cost of 2015 Acquisitions (5) |
Principal Outstanding |
Cost (4) |
Fair Value |
|||||||||||||||||||||||
| Asset-based (43% New Jersey, 34% New York, 13% Florida, 7% Virginia and 3% all other states) |
||||||||||||||||||||||||||||||||||
| Wholesale Trade (24% of the total) |
Various Other 4.00% to 6.50% ## | Revolving line of credit | 01/23/99 to 07/21/15 |
01/14/16 to 11/30/16 |
9 | * | 5.46 | % | $ | 425 | $ | 880 | $ 880 | $ | 895 | |||||||||||||||||||
| {Daily-Prime + .75% to 3.25%} | ||||||||||||||||||||||||||||||||||
| Retail Trade (17% of the total) |
Various Other 4.75% to 7.25% ## | Revolving line of credit | 10/19/98 to 08/31/06 |
08/31/16 to 10/19/16 |
3 | * | 5.11 | % | $ | 649 | $ 649 | $ | 630 | |||||||||||||||||||||
| {Daily-Prime + 1.5% to 4%} | ||||||||||||||||||||||||||||||||||
| Transportation and Warehousing (14% of the total) |
Various Other 6.00% ## | Revolving line of credit | 12/31/01 | 12/31/16 | 1 | * | 6.00 | % | $ | 506 | $ 506 | $ | 499 | |||||||||||||||||||||
| {Daily-Prime + 2.75%} | ||||||||||||||||||||||||||||||||||
| Professional, Scientific, and Technical Services (11% of the total) |
Various Other 6.75% | Revolving line of credit | 12/22/14 | 12/22/16 | 1 | * | 6.75 | % | $ | 408 | $ 408 | $ | 408 | |||||||||||||||||||||
| {Daily-Prime + 3.5%} | ||||||||||||||||||||||||||||||||||
| Construction (9% of the total) |
Various Other 5.75% ## | Revolving line of credit | 07/20/99 | 07/20/16 | 1 | * | 5.75 | % | $ | 354 | $ 354 | $ | 349 | |||||||||||||||||||||
| {Daily-Prime + 2.5%} | ||||||||||||||||||||||||||||||||||
| Health Care and Social Assistance (7% of the total) |
Various Other 5.50% to 5.75% ## | Revolving line of credit | 10/02/07 to 11/09/12 |
10/02/16 to 11/09/16 |
2 | * | 5.72 | % | $ | 294 | $ 294 | $ | 273 | |||||||||||||||||||||
| {Daily-Prime + 2.25% to 2.5%} | ||||||||||||||||||||||||||||||||||
| Finance and Insurance (7% of the total) |
Various Other 7.00% | Revolving line of credit | 08/26/15 | 08/26/16 | 1 | * | 7.00 | % | $ | 95 | $ | 250 | $ 250 | $ | 242 | |||||||||||||||||||
| {Daily-Prime + 3.75%} | ||||||||||||||||||||||||||||||||||
| Manufacturing (6% of the total) |
Various Other 5.75% to 7.25% ## | Revolving line of credit | 07/07/04 to 11/10/15 |
01/27/16 to 11/29/16 |
6 | * | 6.38 | % | $ | 53 | $ | 236 | $ 236 | $ | 215 | |||||||||||||||||||
| {Daily-Prime + 2.5% to 4%} | ||||||||||||||||||||||||||||||||||
| Administrative and Support Services (5% of the total) |
Various Other 5.50% | Revolving line of credit | 06/30/07 | 06/30/16 | 1 | * | 5.50 | % | $ | 173 | $ 173 | $ | 167 | |||||||||||||||||||||
| {Daily-Prime + 2.25%} | ||||||||||||||||||||||||||||||||||
| Real Estate and Rental and Leasing (0% of the total) |
Various Other 7.75% | Revolving line of credit | 12/24/15 | 12/24/16 | 1 | * | 7.75 | % | $ | 0 | $ 0 | $ | 0 | |||||||||||||||||||||
| {Daily-Prime + 4.5%} | ||||||||||||||||||||||||||||||||||
|
|
|
|
|
|
|
|
|
|
|
|
|
|
||||||||||||||||||||||
| Total asset-based ($2,164 pledged as collateral under borrowing arrangements) |
26 | 1 | % | 5.82 | % | $ | 573 | $ | 3,750 | $ 3,750 | $ | 3,678 | ||||||||||||||||||||||
|
|
|
|
|
|
|
|
|
|
|
|
|
|
||||||||||||||||||||||
| Other secured commercial (80% New York, 16% New Jersey, 3% Illinois and 1% all other states) |
||||||||||||||||||||||||||||||||||
| Retail Trade (90% of the total) |
Medallion Fine Art Inc (interest rate includes PIK interest of 12%) | Term Loan | 12/17/12 | 12/17/17 | 1 | 3 | % | 12.00 | % | $ | 8,348 | $ 8,348 | $ | 8,348 | ||||||||||||||||||||
| (capitalized interest of $2,073 per footnote 2) | ||||||||||||||||||||||||||||||||||
| Various Other && 4.75% to 10.50% | Term Loan | 10/28/08 to 12/23/15 |
03/15/17 to 02/13/21 |
10 | 1 | % | 8.58 | % | $ | 954 | $ | 3,129 | $ 3,073 | $ | 2,300 | |||||||||||||||||||
| Accommodation and Food Services (5% of the total) |
Various Other && 6.75% to 9.00% | Term Loan | 11/29/05 to 06/06/14 |
03/16/16 to 09/06/19 |
3 | * | 8.29 | % | $ | 786 | $ 721 | $ | 615 | |||||||||||||||||||||
| Transportation and Warehousing (3% of the total) |
Various Other && 4.00% to 4.25% | Term Loan | 09/19/14 to 03/17/15 |
09/10/18 to 02/05/20 |
2 | * | 4.08 | % | $ | 120 | $ | 301 | $ 301 | $ | 303 | |||||||||||||||||||
| Real Estate and Rental and Leasing (1% of the total) |
Various Other && 4.00% to 5.00% | Term Loan | 07/15/13 to 03/31/15 |
07/15/16 to 03/31/20 |
2 | * | 4.93 | % | $ | 100 | $ | 99 | $ 99 | $ | 99 | |||||||||||||||||||
| Health Care and Social Assistance (1% of the total) |
Various Other 7.50% | Term Loan | 05/14/13 | 05/14/18 | 1 | * | 7.50 | % | $ | 80 | $ 80 | $ | 81 | |||||||||||||||||||||
|
|
|
|
|
|
|
|
|
|
|
|
|
|
||||||||||||||||||||||
| Total Other Commercial Loans |
19 | 4 | % | 10.68 | % | $ | 1,174 | $ | 12,743 | $ 12,622 | $ | 11,746 | ||||||||||||||||||||||
|
|
|
|
|
|
|
|
|
|
|
|
|
|
||||||||||||||||||||||
| Total commercial loans ($2,164 pledged as collateral under borrowing arrangements) (2) |
78 | 29 | % | 12.80 | % | $ | 27,097 | $ | 84,342 | $ 84,221 | $ | 81,895 | ||||||||||||||||||||||
|
|
|
|
|
|
|
|
|
|
|
|
|
|
||||||||||||||||||||||
| Investment in Medallion Bank and other controlled subsidiaries |
||||||||||||||||||||||||||||||||||
| Commercial Banking |
Medallion Bank ** | 100% of common stock | 05/16/02 | None | 1 | 55 | % | 13.17 | % | $136,666 | $ | 152,166 | ||||||||||||||||||||||
| NASCAR Race Team |
Medallion MotorSports, LLC | 75% of LLC units | 11/24/10 | None | 1 | 1 | % | 0.00 | % | $ 2,832 | $ | 2,527 | ||||||||||||||||||||||
| Art Dealer |
Medallion Fine Art, Inc. | 100% of common stock | 12/03/12 | None | 1 | 2 | % | 0.00 | % | $ 789 | $ | 4,234 | ||||||||||||||||||||||
F-34
Table of Contents
| (Dollars in thousands) |
Obligor Name/Interest Rate Range |
Security Type (all restricted unless otherwise noted) |
Acquisition Date |
Maturity Date |
No. of Invest. |
% of Net Assets |
Interest Rate (1) |
Original Cost of 2015 Acquisitions (5) |
Principal Outstanding |
Cost (4) | Fair Value |
|||||||||||||||||||||||||||||||
| Loan Servicing |
Medallion Servicing Corp. | 100% of common stock | 11/05/10 | None | 1 | * | 0.00 | % | $ | 631 | $ | 631 | ||||||||||||||||||||||||||||||
| Professional Sports Team |
LAX Group LLC | 44.31% of membership interests | 05/23/12 | None | 1 | * | 0.00 | % | $ | 355 | $ | 355 | ||||||||||||||||||||||||||||||
|
|
|
|
|
|
|
|
|
|
|
|
|
|
|
|||||||||||||||||||||||||||||
| Investment in Medallion Bank and other controlled subsidiaries, net |
|
5 | 58 | % | 12.74 | % | $ | 0 | $ | 141,273 | $ | 159,913 | ||||||||||||||||||||||||||||||
|
|
|
|
|
|
|
|
|
|
|
|
|
|
|
|||||||||||||||||||||||||||||
| Equity investments |
||||||||||||||||||||||||||||||||||||||||||
| Commercial Finance |
Convergent Capital, Ltd ** | 7% of limited partnership interest | 07/20/07 | None | 1 | 1 | % | 0.00 | % | $ | 326 | $ | 1,957 | |||||||||||||||||||||||||||||
| Gift card service & marketing |
+ |
Production Services Associates d/b/a American Card Services | 5.65% of LLC units | 02/17/15 | None | 1 | * | 0.00 | % | $ | 250 | $ | 250 | $ | 1,179 | |||||||||||||||||||||||||||
| Weather forecasting services |
Weather Decision Technologies, Inc. | 2.2% preferred stock | 12/11/15 | None | 1 | * | 0.00 | % | $ | 500 | $ | 500 | $ | 500 | ||||||||||||||||||||||||||||
| Employee Leasing Services |
Staff One, Inc. | 46.4% preferred stock | 06/30/08 | None | 2 | * | 0.00 | % | $ | 472 | $ | 472 | ||||||||||||||||||||||||||||||
| Stuffed Toy Manufacturer |
AA Plush Holdings, LLC | 1.6% LLC common units | 08/15/14 | None | 1 | * | 0.00 | % | $ | 300 | $ | 300 | ||||||||||||||||||||||||||||||
| Investment Castings |
Tech Cast Holdings LLC | 4.14% LLC units | 12/12/14 | 12/12/19 | 1 | * | 0.00 | % | $ | 300 | $ | 300 | ||||||||||||||||||||||||||||||
| Machine Shop |
MicroGroup, Inc. | 5.5% common stock | 06/29/15 | None | 1 | * | 0.00 | % | $ | 300 | $ | 300 | $ | 300 | ||||||||||||||||||||||||||||
| Baby Sleep Products |
BB Opco, LLC d/b/a BreathableBaby, LLC | 3.6% LLC units | 08/01/14 | None | 1 | * | 0.00 | % | $ | 250 | $ | 250 | ||||||||||||||||||||||||||||||
| Wire Manufacturer |
WRWP LLC | 10.3% preferred LLC units, 7.23% common LLC units | 12/30/14 | 12/30/19 | 1 | * | 0.00 | % | $ | 224 | $ | 224 | ||||||||||||||||||||||||||||||
| Marketing Services |
Third Century JRT Inc. | 13% common stock | 05/21/15 | None | 1 | * | 0.00 | % | $ | 200 | $ | 200 | $ | 200 | ||||||||||||||||||||||||||||
| Manufacture space heaters, etc. |
Pinnacle Products International, Inc. | 0.5% common stock | 10/09/15 | None | 1 | * | 0.00 | % | $ | 135 | $ | 135 | $ | 135 | ||||||||||||||||||||||||||||
| IT Services |
Centare Holdings, Inc. | 7.23% of common stock, 3.88% of preferred stock | 08/30/13 | None | 1 | * | 0.00 | % | $ | 104 | $ | 104 | ||||||||||||||||||||||||||||||
| Various Other # |
+ |
** | * Various | |
09/10/98 to 7/24/15 |
|
|
None to 6/30/22 |
|
7 | * | 3.37 | % | $ | 50 | $ | 916 | $ | 938 | |||||||||||||||||||||||
|
|
|
|
|
|
|
|
|
|
|
|
|
|||||||||||||||||||||||||||||||
| Equity investments, net |
20 | 2 | % | 0.72 | % | $ | 1,435 | $ | 4,277 | $ | 6,859 | |||||||||||||||||||||||||||||||
|
|
|
|
|
|
|
|
|
|
|
|
|
|||||||||||||||||||||||||||||||
| Investment securities |
||||||||||||||||||||||||||||||||||||||||||
| Investment securities |
US Treasury Note AAA | 06/30/15 | 07/15/16 | 1 | 4 | % | 0.63 | % | $ | 10,059 | $ | 10,000 | $ | 10,059 | $ | 10,029 | ||||||||||||||||||||||||||
| US Treasury Bill | 07/30/15 | 07/21/16 | 1 | 4 | % | 0.33 | % | $ | 9,936 | $ | 10,000 | $ | 9,936 | $ | 9,972 | |||||||||||||||||||||||||||
| US Treasury Bill | 09/22/15 | 09/15/16 | 1 | 4 | % | 0.39 | % | $ | 9,968 | $ | 10,000 | $ | 9,968 | $ | 9,964 | |||||||||||||||||||||||||||
| US Treasury Bill | 10/30/15 | 10/13/16 | 1 | 7 | % | 0.21 | % | $ | 19,939 | $ | 20,000 | $ | 19,939 | $ | 19,919 | |||||||||||||||||||||||||||
|
|
|
|
|
|
|
|
|
|
|
|
|
|
|
|||||||||||||||||||||||||||||
| Investment securities, net |
4 | 18 | % | 0.35 | % | $ | 49,902 | $ | 50,000 | $ | 49,902 | $ | 49,884 | |||||||||||||||||||||||||||||
|
|
|
|
|
|
|
|
|
|
|
|
|
|
|
|||||||||||||||||||||||||||||
| Net Investments ($240,267 pledged as collateral under borrowing arrangements)(3) |
|
|||||||||||||||||||||||||||||||||||||||||
| 806 | 218 | % | 7.06 | % | $ | 115,892 | $ | 445,853 | $ | 591,106 | $ | 606,959 | ||||||||||||||||||||||||||||||
|
|
|
|
|
|
|
|
|
|
|
|
|
|
|
|||||||||||||||||||||||||||||
| (1) | Represents the actual or weighted average interest or dividend rate of the respective security or portfolio as of the date indicated. Investments without an interest rate or with a rate of 0.00% are considered non-income producing. |
| (2) | Included in secured mezzanine commercial loans and other commercial loans was $4,878 of interest income capitalized into the outstanding investment balances, in accordance with the terms of the investment contract. |
| (3) | The ratio of restricted securities fair value to net assets is 218%. |
| (4) | Gross unrealized appreciation, gross unrealized depreciation and net appreciation for federal income tax purposes totaled $79,139, $5,896 and $73,243, respectively. The tax cost of investments was $533,716. |
| (5) | For revolving lines of credit the amount shown is the cost at December 31, 2015. |
| * | Less than 1.0% |
| ** | Not an eligible portfolio company as such term is defined in Section 2(a)(46) of the 1940 Act. The percentage value of all non-eligible portfolio companies to totaled assets of Medallion Financial on an unconsolidated basis was up to 29% and up to 29% on a consolidated basis. Under the 1940 Act, we may not acquire any non-qualifying assets, unless at the time such acquisition is made, qualifying assets, which include securities of eligible portfolio companies, represent at least 70% of our total assets. The status of these assets under the 1940 Act are subject to change. We monitor the status of these assets on an ongoing basis. |
| & | Loan is on nonaccrual status, or past due on contractual payments, and is therefore considered non-income producing. |
| && | Some or all of the securities are non-income producing as per & above. |
| # | Publicly traded but sales subject to applicable Rule 144 limitations. |
| ## | Pledged as collateral under borrowing arrangements. |
| + | Includes various warrants, all of which have a cost and fair value of zero at December 31, 2015. |
The Summary Schedule of Investments does not reflect the Company’s complete portfolio holdings. It includes the Company’s 50 largest holdings and each investment of any issuer that exceeds 1% of the Company’s net assets. “Various Other” represents all issues not required to be disclosed under the rules adopted by the U.S. Securities and Exchange Commission (“SEC”). Footnotes above may apply to securities that are included in “Various Other”. For further detail, the complete schedule of portfolio holdings is available (i) without charge, upon request, by calling (877) MEDALLION; and (ii) on the SEC’s website at http://www.sec.gov. Filed as Exhibit 99.1 to the Annual Report on Form 10-K for the fiscal year ended December 31, 2015, filed on March 7, 2016 (File No. 814-00188)
F-35
Table of Contents
Medallion Financial Corp
CONSOLIDATED SCHEDULE OF INVESTMENTS IN AND ADVANCES TO AFFIILIATES
As of and for the year ended December 31, 2015
| Name of issuer and title of issue |
Number of shares (all restricted unless otherwise noted) |
Equity in net profit and (loss) |
Amount of dividends or interest (1) |
Value as of 12/31/15 |
||||||||||
| (Dollars in thousands) | ||||||||||||||
| Medallion Bank—common stock |
1,000,000 shares—100% of common stock | $ | 38,474 | $ | 18,000 | $ | 152,166 | |||||||
| Medallion Fine Art, Inc.—common stock (2) |
1,000 shares—100% of common stock | 2,552 | 0 | 4,234 | ||||||||||
| Medallion Motorsports, LLC—membership interest (3) |
75% of membership interest | 150 | 0 | 2,527 | ||||||||||
| Medallion Servicing Corp.—common stock |
1,000 shares—100% of common stock | (394 | ) | 0 | 631 | |||||||||
| LAX Group LLC—membership interest |
44.31% of membership interest | (627 | ) | 0 | 355 | |||||||||
| Generation Outdoor, Inc. |
3,206 | 889 | 0 | |||||||||||
| Medallion Hamptons Holding LLC—membership interest |
100% of membership interest | 24 | 0 | 0 | ||||||||||
|
|
|
|
|
|
|
|||||||||
| Total investments in Medallion Bank and other controlled subsidiaries |
43,385 | 18,889 | 159,913 | |||||||||||
|
|
|
|
|
|
|
|||||||||
| Appliance Recycling Centers of America Inc.—common stock |
8.86% of common stock | 0 | 0 | 509 | ||||||||||
| Micro Group, Inc. (5) |
5.5% of common stock | 0 | 0 | 300 | ||||||||||
| Production Services Associates LLC (4) |
5.65% of membership interest | 0 | 0 | 1,179 | ||||||||||
| WRWP, LLC – membership interest (6) |
7.23% of membership interest | 0 | 0 | 224 | ||||||||||
| Third Century JRT, Inc. (7) |
13% of common stock | 0 | 0 | 200 | ||||||||||
| Summit Medical, Inc.—common stock |
0 | 0 | 0 | |||||||||||
|
|
|
|
|
|
|
|||||||||
| Total equity investments in affiliates |
— | 0 | 2,412 | |||||||||||
|
|
|
|
|
|
|
|||||||||
| (1) | Investments with an amount of 0 are considered non-income producing. |
| (2) | Additionally, the Company has a loan due from Medallion Fine Art, Inc. in the amount of $8,348 as of December 31, 2015, and on which $944 of interest income was earned during 2015. |
| (3) | Additionally, a controlled subsidiary of the Company has a loan due from an affiliate of Medallion Motorsports, LLC in the amount of $5,033, and on which $547 of interest income was earned during 2015. |
| (4) | Additionally, the Company has a loan due from Production Services Associates LLC in the amount of $2,646 as of December 31, 2015, on which $367 of interest income was earned during 2015. |
| (5) | Additionally, the Company has a loan due from Micro Group, Inc. in the amount of $3,233 as of December 31, 2015, on which $230 of interest income was earned during 2015. |
| (6) | Additionally, the Company has a loan due from WRWP, LLC in the amount of $2,311 as of December 31, 2015, on which $348 of interest income was earned during 2015. |
| (7) | Additionally, the Company has a loan due from Third Century JRT, Inc., in the amount of $2,273 as of December 31, 2015, on which $230 of interest income was earned during 2015. |
F-36
Table of Contents
The table below provides a recap of the changes in the investment in the respective issuers for the year ended December 31, 2015.
| Name of |
Medallion Bank |
Medallion Fine Art, Inc. |
Medallion Motorsports, LLC |
Appliance Recycling Centers of America, Inc. |
Medallion Servicing Corp. |
LAX Group, LLC |
Production Services Associates, LLC (3) |
Micro Group, Inc. (4) |
WRWP, LLC | Third Century JRT, Inc. (6) |
Generation Outdoor, Inc. |
Medallion Hamptons Holding, LLC |
Summit Medical, Inc. |
|||||||||||||||||||||||||||||||||||||||
| Title of Issue |
Common Stock |
Common Stock(1) |
Membership Interest (2) |
Common Stock |
Common Stock |
Membership Interest |
Membership Interest |
Common Stock |
Membership Interest(5) |
Common Stock |
Common Stock |
Membership Interest |
Common Stock |
|||||||||||||||||||||||||||||||||||||||
| (Dollars in thousands) |
|
|||||||||||||||||||||||||||||||||||||||||||||||||||
| Value as of 12/31/14 |
$ | 125,027 | $ | 1,157 | $ | 1,600 | $ | 1,231 | $ | 852 | $ | 349 | $ | 0 | $ | 0 | $ | 224 | $ | 0 | $ | 5,063 | $ | 4,400 | $ | 135 | ||||||||||||||||||||||||||
| Gross additions / investments |
8,000 | 525 | 777 | — | 600 | 633 | 250 | 300 | — | 200 | — | 80 | — | |||||||||||||||||||||||||||||||||||||||
| Gross reductions / distributions |
(19,335 | ) | — | — | — | (427 | ) | — | — | — | — | — | (8,269 | ) | (4,504 | ) | (369 | ) | ||||||||||||||||||||||||||||||||||
| Net equity in profit and loss, and unrealized appreciation and (depreciation) |
38,474 | 2,552 | 150 | (722 | ) | (394 | ) | (627 | ) | 929 | — | — | — | 3,206 | 24 | 234 | ||||||||||||||||||||||||||||||||||||
| Other adjustments |
— | — | — | — | — | — | — | — | — | — | — | — | — | |||||||||||||||||||||||||||||||||||||||
|
|
|
|
|
|
|
|
|
|
|
|
|
|
|
|
|
|
|
|
|
|
|
|
|
|
|
|||||||||||||||||||||||||||
| Value as of 12/31/15 |
152,166 | 4,234 | 2,527 | 509 | 631 | 355 | 1,179 | 300 | 224 | 200 | — | — | — | |||||||||||||||||||||||||||||||||||||||
|
|
|
|
|
|
|
|
|
|
|
|
|
|
|
|
|
|
|
|
|
|
|
|
|
|
|
|||||||||||||||||||||||||||
| (1) | Additionally, the Company has a loan due from Medallion Fine Art, Inc. in the amount of $8,348 as of December 31, 2015, $2,161 of which was advanced during 2015, and for which $550 was repaid. |
| (2) | In addition to the equity ownership, a controlled subsidiary of the Company has a loan due from an affiliate of Medallion Motorsports, LLC in the amount of $5,033, $548 of which was advanced during 2015. |
| (3) | Additionally, the Company has a loan due from Production Services Associates LLC in the amount of $2,646 as of December 31, 2015, all of which was advanced during 2015, on which there were $367 of interest income was earned during 2015. |
| (4) | Additionally, the Company has a loan due from Micro Group, Inc. in the amount of $3,233 as of December 31, 2015 all of which was advanced during 2015. |
| (5) | Additionally, the Company has a loan due from WRWP LLC in the amount of $2,311 as of December 31, 2015, $69 of which was advanced during 2015. |
| (6) | Additionally, the Company has a loan due from J. R. Thompson Company, LLC, an affiliate of Third Century JRT, INC in the amount of $2,273 as of December 31, 2015, all of which was advanced during 2015. |
F-37
Table of Contents
Consolidated Summary Schedule of Investments
December 31, 2014
| (Dollars in thousands) |
Obligor Name/Interest Rate Range |
Security Type (all restricted unless otherwise noted) |
Acquisition Date |
Maturity Date |
No. of Invest. |
% of Net Assets |
Interest Rate (1) |
Original Cost of 2014 Acquisitions (5) |
|
Cost (4) |
Fair Value |
|||||||||||||||||||||||||||||
| Medallion Loans |
||||||||||||||||||||||||||||||||||||||||
| New York |
368 | 78 | % | 3.60 | % | $ | 73,250 | $ | 213,099 | $ | 213,248 | |||||||||||||||||||||||||||||
| Real Cab Corp ## | Term Loan | 07/20/07 | 07/20/17 | 1 | 1 | % | 2.81 | % | $ | 2,545 | $ | 2,545 | ||||||||||||||||||||||||||||
| Real Cab Corp ## | Term Loan | 08/19/14 | 07/20/17 | 1 | 1 | % | 3.31 | % | $ | 1,627 | $ | 1,449 | $ | 1,449 | ||||||||||||||||||||||||||
| Real Cab Corp ## | Term Loan | 07/20/07 | 07/20/17 | 1 | * | 2.81 | % | $ | 350 | $ | 350 | |||||||||||||||||||||||||||||
| Sean Cab Corp ## | Term Loan | 12/09/11 | 12/08/15 | 1 | 1 | % | 3.60 | % | $ | 3,480 | $ | 3,471 | ||||||||||||||||||||||||||||
| Slo Cab Corp ## | Term Loan | 07/20/07 | 07/20/17 | 1 | 1 | % | 2.81 | % | $ | 1,527 | $ | 1,527 | ||||||||||||||||||||||||||||
| Slo Cab Corp ## | Term Loan | 08/19/14 | 07/20/17 | 1 | * | 3.31 | % | $ | 976 | $ | 870 | $ | 870 | |||||||||||||||||||||||||||
| Slo Cab Corp ## | Term Loan | 07/20/07 | 07/20/17 | 1 | * | 2.81 | % | $ | 210 | $ | 210 | |||||||||||||||||||||||||||||
| Whispers Taxi Inc ## | Term Loan | 05/28/13 | 05/28/16 | 1 | 1 | % | 3.35 | % | $ | 2,107 | $ | 2,102 | ||||||||||||||||||||||||||||
| Esg Hacking Corp ## | Term Loan | 03/12/14 | 03/12/17 | 1 | 1 | % | 3.50 | % | $ | 1,842 | $ | 1,806 | $ | 1,812 | ||||||||||||||||||||||||||
| Pontios Taxi LLC ## | Term Loan | 03/28/14 | 03/28/17 | 1 | 1 | % | 3.50 | % | $ | 1,828 | $ | 1,798 | $ | 1,800 | ||||||||||||||||||||||||||
| Ikaria Taxi LLC ## | Term Loan | 03/28/14 | 03/28/17 | 1 | 1 | % | 3.50 | % | $ | 1,828 | $ | 1,797 | $ | 1,799 | ||||||||||||||||||||||||||
| Kos Taxi LLC ## | Term Loan | 03/28/14 | 03/28/17 | 1 | 1 | % | 3.50 | % | $ | 1,828 | $ | 1,797 | $ | 1,799 | ||||||||||||||||||||||||||
| Sag Taxi LLC ## | Term Loan | 03/28/14 | 03/28/17 | 1 | 1 | % | 3.50 | % | $ | 1,828 | $ | 1,793 | $ | 1,795 | ||||||||||||||||||||||||||
| Yosi Transit Inc ## | Term Loan | 07/20/07 | 07/20/17 | 1 | * | 2.81 | % | $ | 1,018 | $ | 1,018 | |||||||||||||||||||||||||||||
| Yosi Transit Inc ## | Term Loan | 08/19/14 | 07/20/17 | 1 | * | 3.31 | % | $ | 651 | $ | 580 | $ | 580 | |||||||||||||||||||||||||||
| Yosi Transit Inc ## | Term Loan | 07/20/07 | 07/20/17 | 1 | * | 2.81 | % | $ | 140 | $ | 140 | |||||||||||||||||||||||||||||
| Sifnos, Kitriani Incs ## | Term Loan | 06/08/10 | 05/01/15 | 1 | 1 | % | 4.00 | % | $ | 1,558 | $ | 1,554 | ||||||||||||||||||||||||||||
| Hamilton Transit LLC ## | Term Loan | 03/26/14 | 03/26/17 | 1 | 1 | % | 3.38 | % | $ | 1,570 | $ | 1,540 | $ | 1,546 | ||||||||||||||||||||||||||
| Kaderee M & G Corp ## | Term Loan | 03/26/14 | 03/26/17 | 1 | 1 | % | 3.38 | % | $ | 1,570 | $ | 1,540 | $ | 1,542 | ||||||||||||||||||||||||||
| Daytona Hacking Corp ## | Term Loan | 03/26/14 | 03/26/17 | 1 | 1 | % | 3.38 | % | $ | 1,570 | $ | 1,540 | $ | 1,542 | ||||||||||||||||||||||||||
| Silke Hacking Corp ## | Term Loan | 03/26/14 | 03/26/17 | 1 | 1 | % | 3.38 | % | $ | 1,570 | $ | 1,540 | $ | 1,542 | ||||||||||||||||||||||||||
| Nancy Transit Inc ## | Term Loan | 03/11/13 | 03/11/16 | 1 | 1 | % | 3.50 | % | $ | 1,513 | $ | 1,511 | ||||||||||||||||||||||||||||
| Bunty & Jyoti Inc ## | Term Loan | 03/13/13 | 03/13/16 | 1 | 1 | % | 3.75 | % | $ | 1,508 | $ | 1,505 | ||||||||||||||||||||||||||||
| Lety Cab Corp ## | Term Loan | 10/21/10 | 10/20/15 | 1 | 1 | % | 3.13 | % | $ | 1,507 | $ | 1,503 | ||||||||||||||||||||||||||||
| Christian Cab Corp | Term Loan | 11/27/12 | 11/27/15 | 1 | 1 | % | 4.00 | % | $ | 1,501 | $ | 1,501 | ||||||||||||||||||||||||||||
| Junaid Trans Corp ## | Term Loan | 04/30/13 | 04/30/16 | 1 | 1 | % | 3.75 | % | $ | 1,485 | $ | 1,482 | ||||||||||||||||||||||||||||
| Ocean Hacking Corp ## | Term Loan | 12/20/13 | 12/20/16 | 1 | 1 | % | 3.50 | % | $ | 1,461 | $ | 1,463 | ||||||||||||||||||||||||||||
| Jacal Hacking Corp ## | Term Loan | 12/20/13 | 12/20/16 | 1 | 1 | % | 3.50 | % | $ | 1,461 | $ | 1,461 | ||||||||||||||||||||||||||||
| Penegali Taxi LLC | Term Loan | 12/11/14 | 12/10/17 | 1 | 1 | % | 3.75 | % | $ | 1,400 | $ | 1,400 | $ | 1,402 | ||||||||||||||||||||||||||
| Various New York && ## |
2.75% to 10.00% | Term Loan | |
12/20/00 to 12/18/14 |
|
|
01/09/15 to 09/10/23 |
|
339 | 62 | % | 3.65 | % | $ | 53,162 | $ | 170,278 | $ | 170,427 | |||||||||||||||||||||
| Chicago |
108 | 14 | % | 4.97 | % | $ | 11,638 | $ | 39,280 | $ | 39,355 | |||||||||||||||||||||||||||||
| Sweetgrass Peach &Chadwick Cap ## | Term Loan | 08/28/12 | 08/28/15 | 1 | 1 | % | 5.50 | % | $ | 1,663 | $ | 1,659 | ||||||||||||||||||||||||||||
| Various Chicago && ## |
3.75% to 7.25% | Term Loan | |
01/22/10 to 12/08/14 |
|
|
01/18/15 to 12/08/19 |
|
107 | 14 | % | 4.95 | % | $ | 11,638 | $ | 37,617 | $ | 37,696 | |||||||||||||||||||||
| Newark && ## |
4.50% to 8.00% | Term Loan | |
07/25/08 to 12/11/14 |
|
|
02/17/15 to 01/10/23 |
|
114 | 9 | % | 5.28 | % | $ | 8,446 | $ | 25,043 | $ | 25,138 | |||||||||||||||||||||
| Boston |
57 | 10 | % | 4.69 | % | $ | 9,549 | $ | 27,277 | $ | 27,317 | |||||||||||||||||||||||||||||
| Chiso Trans Inc | Term Loan | 11/26/13 | 11/26/16 | 1 | * | 4.25 | % | $ | 820 | $ | 822 | |||||||||||||||||||||||||||||
| Chiso Trans Inc | Term Loan | 04/20/12 | 04/20/15 | 1 | * | 5.50 | % | $ | 582 | $ | 582 | |||||||||||||||||||||||||||||
| Various Boston && ## |
4.00% to 6.15% | Term Loan | |
06/12/07 to 11/17/14 |
|
|
02/17/15 to 10/08/18 |
|
55 | 9 | % | 4.68 | % | $ | 9,549 | $ | 25,875 | $ | 25,913 | |||||||||||||||||||||
| Cambridge |
15 | 2 | % | 4.80 | % | $ | 1,184 | $ | 6,006 | $ | 6,021 | |||||||||||||||||||||||||||||
| Gcf Taxi Inc, Et Al | Term Loan | 12/30/13 | 12/30/16 | 1 | * | 6.00 | % | $ | 1,365 | $ | 1,365 | |||||||||||||||||||||||||||||
| Gcf Taxi Inc Et Al/Note 2 | Term Loan | 12/29/14 | 09/29/15 | 1 | * | 4.00 | % | $ | 97 | $ | 61 | $ | 63 | |||||||||||||||||||||||||||
| Various Cambridge && ## |
4.00% to 5.50% | Term Loan | |
05/06/11 to 07/01/14 |
|
|
01/26/15 to 10/08/18 |
|
13 | 2 | % | 4.46 | % | $ | 1,087 | $ | 4,580 | $ | 4,593 | |||||||||||||||||||||
| Various Other && ## |
4.75% to 11.50% | Term Loan | |
04/28/08 to 01/03/14 |
|
|
07/01/15 to 09/01/23 |
|
9 | 0 | % | 6.59 | % | $ | 278 | $ | 814 | $ | 815 | |||||||||||||||||||||
|
|
|
|
|
|
|
|
|
|
|
|
|
|
|
|
|
|
|
|
||||||||||||||||||||||
| Total medallion loans ($247,525 pledged as collateral under borrowing arrangements) |
|
671 | 114 | % | 4.03 | % | $ | 104,345 | $ | 311,519 | $ | 311,894 | ||||||||||||||||||||||||||||
|
|
|
|
|
|
|
|
|
|
|
|
|
|
|
|
|
|
|
|
||||||||||||||||||||||
| Commercial Loans |
| |||||||||||||||||||||||||||||||||||||||
| Secured mezzanine (32% Minnesota, 10% Ohio, 10% Texas, 9% North Carolina, 7% New York, 7% Oklahoma, 6% Pennsylvania, 5% Wisconsin, 5% Delaware, 4% Arizona and 5% all other states) (2) |
| |||||||||||||||||||||||||||||||||||||||
F-38
Table of Contents
| (Dollars in |
Obligor Name/Interest Rate Range |
Security Type (all restricted unless otherwise noted) |
Acquisition Date |
Maturity Date |
No. of Invest. |
% of Net Assets |
Interest Rate (1) |
Original Cost of 2014 Acquisitions (5) |
Cost (4) | Fair Value |
||||||||||||||||||||||||||||
| Manufacturing (65% of the total) |
||||||||||||||||||||||||||||||||||||||
| Tech Cast Holdings LLC (interest rate includes PIK interest of 3 %) | Term Loan | 12/12/14 | 12/12/19 | 1 | 1 | % | 15.00 | % | $ | 3,350 | $ | 3,353 | $ | 3,318 | ||||||||||||||||||||||||
| EGC Operating Company, LLC (interest rate includes PIK interest of 3 %) | Term Loan | 09/30/14 | 09/30/19 | 1 | 1 | % | 15.00 | % | $ | 3,100 | $ | 3,124 | $ | 3,135 | ||||||||||||||||||||||||
| (capitalized interest of $24 per footnote 2) | ||||||||||||||||||||||||||||||||||||||
| AA Plush Holdings, LLC (interest rate includes PIK interest of 2 %) | Term Loan | 08/15/14 | 08/15/19 | 1 | 1 | % | 14.00 | % | $ | 3,000 | $ | 3,023 | $ | 3,011 | ||||||||||||||||||||||||
| (capitalized interest of $23 per footnote 2) | ||||||||||||||||||||||||||||||||||||||
| + |
Bluff Holdings, Inc. (interest rate includes PIK interest of 3.5 %) | Term Loan | 12/14/12 | 12/14/17 | 1 | 1 | % | 15.50 | % | $ | 3,000 | $ | 3,007 | |||||||||||||||||||||||||
| BB Opco, LLC d/b/a BreathableBaby, LLC (interest rate includes PIK interest of 2 %) | Term Loan | 08/01/14 | 08/01/19 | 1 | 1 | % | 14.00 | % | $ | 2,500 | $ | 2,521 | $ | 2,526 | ||||||||||||||||||||||||
| (capitalized interest of $21 per footnote 2) | ||||||||||||||||||||||||||||||||||||||
| American Cylinder, Inc. d/b/a All Safe (interest rate includes PIK interest of 5 %) | Term Loan | 07/03/13 | 01/03/18 | 1 | 1 | % | 17.00 | % | $ | 1,618 | $ | 1,618 | ||||||||||||||||||||||||||
| (capitalized interest of $118 per footnote 2) | ||||||||||||||||||||||||||||||||||||||
| American Cylinder, Inc. d/b/a All Safe | Term Loan | 07/03/13 | 07/03/17 | 1 | * | 10.00 | % | $ | 800 | $ | 797 | |||||||||||||||||||||||||||
| WRWP LLC (interest rate includes PIK interest of 3 %) | Term Loan | 12/30/14 | 12/30/19 | 1 | 1 | % | 15.00 | % | $ | 2,242 | $ | 2,242 | $ | 2,252 | ||||||||||||||||||||||||
| + |
Packaging Specialists, Inc. Southwest (interest rate includes PIK interest of 6 %) | Term Loan | 04/01/08 | 06/30/15 | 1 | 1 | % | 14.00 | % | $ | 2,000 | $ | 2,000 | |||||||||||||||||||||||||
| Dynamic Systems, Inc. (interest rate includes PIK interest of 3.5 %) | Term Loan | 12/23/10 | 12/23/17 | 1 | 1 | % | 15.50 | % | $ | 1,994 | $ | 1,994 | ||||||||||||||||||||||||||
| (capitalized interest of $170 per footnote 2) | ||||||||||||||||||||||||||||||||||||||
| + |
GAF Manufacturing, LLC (interest rate includes PIK interest of 2 %) | Term Loan | 03/06/14 | 03/06/19 | 1 | 1 | % | 14.00 | % | $ | 1,500 | $ | 1,525 | $ | 1,532 | |||||||||||||||||||||||
| (capitalized interest of $25 per footnote 2) | ||||||||||||||||||||||||||||||||||||||
| + |
PACA Foods, LLC & | Term Loan | 12/31/10 | 12/31/15 | 1 | 1 | % | 13.00 | % | $ | 2,127 | $ | 1,526 | |||||||||||||||||||||||||
| + |
Respiratory Technologies, Inc. | Term Loan | 04/25/12 | 04/25/17 | 1 | 1 | % | 12.00 | % | $ | 1,500 | $ | 1,505 | |||||||||||||||||||||||||
| + |
Various Other && 12.00% to 17.00% | Term Loan | |
03/10/99 to 07/17/12 |
|
|
03/31/10 to 01/31/19 |
|
5 | 2 | % | 13.93 | % | $ | 0 | $ | 5,670 | $ | 5,671 | |||||||||||||||||||
| Information (10% of the total) |
US Internet Corp. | Term Loan | 06/12/13 | 06/12/20 | 1 | 1 | % | 14.50 | % | $ | 3,000 | $ | 3,016 | |||||||||||||||||||||||||
| Centare Holdings, Inc. (interest rate includes PIK interest of 2 %) | Term Loan | 08/30/13 | 08/30/18 | 1 | 1 | % | 14.00 | % | $ | 2,500 | $ | 2,486 | ||||||||||||||||||||||||||
| Professional, Scientific, and Technical Services (9% of the total) + |
Portu-Sunberg Marketing, LLC | Term Loan | 12/31/12 | 12/31/17 | 1 | 1 | % | 12.00 | % | $ | 2,500 | $ | 2,508 | |||||||||||||||||||||||||
| + |
DPIS Engineering, LLC | Term Loan | 12/01/14 | 06/30/20 | 1 | 1 | % | 12.00 | % | $ | 2,000 | $ | 2,000 | $ | 1,996 | |||||||||||||||||||||||
| Arts, Entertainment, and Recreation (9% of the total) |
RPAC Racing, LLC & (interest rate includes PIK interest of 10 %) | Term Loan | 11/19/10 | 11/19/15 | 1 | 2 | % | 10.00 | % | $ | 4,485 | $ | 4,485 | |||||||||||||||||||||||||
| (capitalized interest of $1,446 per footnote 2) | ||||||||||||||||||||||||||||||||||||||
| Administrative and Support Services (7% of the total) + |
Staff One, Inc. | Term Loan | 06/30/08 | 03/31/16 | 1 | 1 | % | 3.00 | % | $ | 2,964 | $ | 2,964 | |||||||||||||||||||||||||
| + |
Staff One, Inc. | Term Loan | 09/15/11 | 03/31/16 | 1 | * | 3.00 | % | $ | 485 | $ | 485 | ||||||||||||||||||||||||||
| Accommodation and Food Services (0% of the total) |
Various Other && 9.25% to 10.00% | Term Loan | |
06/30/00 to 11/05/10 |
|
|
10/01/15 to 11/05/15 |
|
3 | * | 9.83 | % | $ | 0 | $ | 2,245 | $ | 609 | ||||||||||||||||||||
| Retail Trade (0% of the total) |
Various Other && 10.00% | Term Loan | 06/30/00 | 10/01/15 | 1 | * | 10.00 | % | $ | 0 | $ | 383 | $ | 36 | ||||||||||||||||||||||||
|
|
|
|
|
|
|
|
|
|
|
|
|
|||||||||||||||||||||||||||
| Total secured mezzanine (2) |
29 | 19 | % | 12.88 | % | $ | 17,692 | $ | 55,059 | $ | 52,477 | |||||||||||||||||||||||||||
|
|
|
|
|
|
|
|
|
|
|
|
|
|||||||||||||||||||||||||||
F-39
Table of Contents
| (Dollars in |
Obligor Name/Interest Rate Range |
Security Type (all restricted unless otherwise noted) |
Acquisition Date |
Maturity Date |
No. of Invest. |
% of Net Assets |
Interest Rate (1) |
Original Cost of 2014 Acquisitions (5) |
Cost (4) |
Fair Value |
||||||||||||||||||||||||||
| Asset-based (67% New York, 24% New Jersey, 6% Florida and 3% all other states) |
|
|||||||||||||||||||||||||||||||||||
| Wholesale Trade (29% of the total) |
Various Other 4.50% to 6.50% ## | Revolving line of credit | |
01/23/99 to 06/30/14 |
|
|
01/14/15 to 11/30/15 |
|
9 | * | 5.17 | % | $ | 15 | $ | 1,047 | $ | 992 | ||||||||||||||||||
| Transportation and Warehousing (26% of the total) |
Various Other && 6.00% to 8.00% ## | Revolving line of credit | |
12/31/01 to 05/02/06 |
|
|
05/02/15 to 12/31/15 |
|
2 | * | 6.45 | % | $ | 0 | $ | 914 | $ | 890 | ||||||||||||||||||
| Health Care and Social Assistance (12% of the total) |
Various Other 5.75% to 5.78% ## | Revolving line of credit | |
10/02/07 to 11/09/12 |
|
|
10/02/15 to 11/09/15 |
|
2 | * | 5.77 | % | $ | 0 | $ | 456 | $ | 425 | ||||||||||||||||||
| Retail Trade (9% of the total) |
Various Other 4.75% to 7.25% ## | Revolving line of credit | |
10/19/98 to 08/31/06 |
|
|
07/24/15 to 12/21/15 |
|
5 | * | 5.49 | % | $ | 0 | $ | 342 | $ | 320 | ||||||||||||||||||
| Construction (9% of the total) |
Various Other 5.75% to 6.75% ## | Revolving line of credit | |
07/20/99 to 07/23/13 |
|
|
07/20/15 to 07/23/15 |
|
2 | * | 5.77 | % | $ | 0 | $ | 311 | $ | 303 | ||||||||||||||||||
| Professional, Scientific, and Technical Services (6% of the total) |
Various Other 6.75% | Revolving line of credit | 12/22/14 | 12/22/15 | 1 | * | 6.75 | % | $ | 202 | $ | 202 | $ | 206 | ||||||||||||||||||||||
| Manufacturing (6% of the total) |
Various Other 5.75% to 7.25% ## | Revolving line of credit | |
07/07/04 to 01/27/14 |
|
|
01/27/15 to 11/29/15 |
|
5 | * | 6.38 | % | $ | 10 | $ | 223 | $ | 200 | ||||||||||||||||||
| Finance and Insurance (3% of the total) |
Various Other && 5.50% | Revolving line of credit | 02/14/08 | 02/14/15 | 1 | * | 5.50 | % | $ | 0 | $ | 99 | $ | 96 | ||||||||||||||||||||||
| Administrative and Support Services (0% of the total) |
Various Other 5.50% | Revolving line of credit | 06/30/07 | 06/30/15 | 1 | * | 5.50 | % | $ | 0 | $ | 39 | $ | 35 | ||||||||||||||||||||||
|
|
|
|
|
|
|
|
|
|
|
|
|
|||||||||||||||||||||||||
| Total asset-based ($2,889 pledged as collateral under borrowing arrangements) |
|
28 | 1 | % | 5.82 | % | $ | 227 | $ | 3,633 | $ | 3,467 | ||||||||||||||||||||||||
|
|
|
|
|
|
|
|
|
|
|
|
|
|||||||||||||||||||||||||
| Other secured commercial (74% New York, 22% New Jersey and 4% all other states) |
|
|||||||||||||||||||||||||||||||||||
| Retail Trade (77% of the total) |
Medallion Fine Art Inc (interest rate includes PIK interest of 12.00%) | Term Loan | 12/17/12 | 12/17/17 | 1 | 2 | % | 12.00 | % | $ | 6,737 | $ | 6,737 | |||||||||||||||||||||||
| (capitalized interest of $1,137 per footnote 2) | ||||||||||||||||||||||||||||||||||||
| Various Other && 0.00% to 10.50% | Term Loan | |
09/13/06 to 08/13/14 |
|
|
12/17/14 to 08/13/20 |
|
17 | 2 | % | 8.97 | % | $ | 1,640 | $ | 5,098 | $ | 4,897 | ||||||||||||||||||
| Accommodation and Food Services (18% of the total) |
Dune Deck Owners Corp ## | Term Loan | 04/24/07 | 03/31/16 | 1 | 1 | % | 7.00 | % | $ | 2,071 | $ | 2,071 | |||||||||||||||||||||||
| Various Other && 6.75% to 9.00% | Term Loan | |
11/29/05 to 06/06/14 |
|
|
03/16/16 to 09/06/19 |
|
3 | * | 8.33 | % | $ | 375 | $ | 837 | $ | 734 | |||||||||||||||||||
| Arts, Entertainment, and Recreation (3% of the total) |
Various Other 8.00% | Term Loan | 10/31/14 | 12/31/14 | 1 | * | 8.00 | % | $ | 500 | $ | 503 | $ | 504 | ||||||||||||||||||||||
| (capitalized interest of $3 per footnote 2) | ||||||||||||||||||||||||||||||||||||
| Real Estate and Rental and Leasing (1% of the total) |
Various Other 4.00% to 6.00% | Term Loan | |
04/22/99 to 07/15/13 |
|
|
04/01/15 to 07/15/16 |
|
3 | * | 5.27 | % | $ | 0 | $ | 151 | $ | 152 | ||||||||||||||||||
| Health Care and Social Assistance (1% of the total) |
Various Other 7.50% | Term Loan | 05/14/13 | 05/14/18 | 1 | * | 7.50 | % | $ | 0 | $ | 109 | $ | 110 | ||||||||||||||||||||||
|
|
|
|
|
|
|
|
|
|
|
|
|
|||||||||||||||||||||||||
| Total other secured commercial loans ($2,071 pledged as collateral under borrowing arrangements) |
|
27 | 6 | % | 9.91 | % | $ | 2,515 | $ | 15,506 | $ | 15,205 | ||||||||||||||||||||||||
|
|
|
|
|
|
|
|
|
|
|
|
|
|||||||||||||||||||||||||
| Total commercial loans ($4,960 pledged as collateral under borrowing arrangements) (2) |
|
84 | 26 | % | 11.91 | % | $ | 20,434 | $ | 74,198 | $ | 71,149 | ||||||||||||||||||||||||
|
|
|
|
|
|
|
|
|
|
|
|
|
|||||||||||||||||||||||||
| Investment in Medallion Bank and other controlled subsidiaries |
|
|||||||||||||||||||||||||||||||||||
| Commercial Banking |
Medallion Bank ** | 100% of common stock | 05/16/02 | None | 1 | 46 | % | 12.00 | % | $ | 125,027 | $ | 125,027 | |||||||||||||||||||||||
| Art Dealer |
Medallion Fine Art, Inc. | 100% of common stock | 12/03/12 | None | 1 | * | 0.00 | % | $ | 1,157 | $ | 1,157 | ||||||||||||||||||||||||
| Real Estate |
Medallion Hamptons Holding LLC | 100% of membership interests | 06/21/05 | None | 1 | 2 | % | 0.00 | % | $ | 3,014 | $ | 4,400 | |||||||||||||||||||||||
| Advertising |
Generation Outdoor, Inc. | 100% of common stock | 12/20/04 | None | 1 | 2 | % | 0.00 | % | $ | 751 | $ | 5,063 | |||||||||||||||||||||||
| Various Other |
|
11/05/10 to 5/23/12 |
|
None | 2 | * | 0.00 | % | $ | 1,201 | $ | 1,201 | ||||||||||||||||||||||||
|
|
|
|
|
|
|
|
|
|
|
|
|
|||||||||||||||||||||||||
| Investment in Medallion Bank and other controlled subsidiaries, net |
|
6 | 50 | % | 11.44 | % | $ | 0 | $ | 131,150 | $ | 136,848 | ||||||||||||||||||||||||
|
|
|
|
|
|
|
|
|
|
|
|
|
|||||||||||||||||||||||||
| Equity investments |
||||||||||||||||||||||||||||||||||||
F-40
Table of Contents
| (Dollars in |
Obligor Name/Interest Rate Range |
Security Type (all |
Acquisition Date |
Maturity Date |
No. of Invest. |
% of Net Assets |
Interest Rate (1) |
Original Cost of 2014 Acquisitions (5) |
Cost (4) | Fair Value |
||||||||||||||||||||||
| Commercial Finance |
Convergent Capital, Ltd ** | 7% of limited partnership interest | 07/20/07 | None | 1 | 1 | % | 0.00 | % | $ | 968 | $ | 2,600 | |||||||||||||||||||
| NASCAR Race Team |
Medallion MotorSports, LLC | 75% of limited liability interest | 11/24/10 | None | 1 | 1 | % | 0.00 | % | $ | 2,054 | $ | 1,600 | |||||||||||||||||||
| Employee Leasing Services |
Staff One, Inc. | 46.4% preferred stock | 06/30/08 | None | 1 | * | 0.00 | % | $ | 472 | $ | 472 | ||||||||||||||||||||
| Investment Castings |
Tech Cast Holdings LLC | 4.14% LLC units | 12/12/14 | 12/12/19 | 1 | * | 0.00 | % | $ | 300 | $ | 300 | ||||||||||||||||||||
| Stuffed Toy Manufacturer |
AA Plush Holdings, LLC | 1.6% LLC common units | 08/15/14 | None | 1 | * | 0.00 | % | $ | 300 | $ | 300 | ||||||||||||||||||||
| Baby Sleep Products |
BB Opco, LLC d/b/a BreathableBaby, LLC | 3.6% LLC units | 08/01/14 | None | 1 | * | 0.00 | % | $ | 250 | $ | 250 | ||||||||||||||||||||
| IT Services |
Centare Holdings, Inc. | 7.23% of common stock, 3.88% of preferred stock | 08/30/13 | None | 1 | * | 0.00 | % | $ | 103 | $ | 103 | ||||||||||||||||||||
| Wire Manufacturer |
WRWP LLC | 10.3% preferred LLC units, 7.23% common stock | 12/30/14 | 12/30/19 | 1 | * | 0.00 | % | $ | 224 | $ | 224 | ||||||||||||||||||||
| Various Other # + |
** | * Various | 09/10/98 to 3/30/12 |
None | 6 | 1 | % | 3.68 | % | $ | 1,431 | $ | 1,861 | |||||||||||||||||||
|
|
|
|
|
|
|
|
|
|
|
|
|
|||||||||||||||||||||
| 14 | 3 | % | 0.86 | % | $ | 0 | $ | 6,102 | $ | 7,710 | ||||||||||||||||||||||
|
|
|
|
|
|
|
|
|
|
|
|
|
|||||||||||||||||||||
| Investment securities |
||||||||||||||||||||||||||||||||
| Investment securities, net |
||||||||||||||||||||||||||||||||
|
|
|
|
|
|
|
|
|
|
|
|
|
|||||||||||||||||||||
| 0 | 0 | % | 0.00 | % | $ | 0 | $ | 0 | $ | 0 | ||||||||||||||||||||||
|
|
|
|
|
|
|
|
|
|
|
|
|
|||||||||||||||||||||
| Net Investments ($252,485 pledged as collateral under borrowing arrangements) (3) |
775 | 192 | % | 6.97 | % | $ | 124,779 | $ | 522,969 | $ | 527,601 | |||||||||||||||||||||
|
|
|
|
|
|
|
|
|
|
|
|
|
|||||||||||||||||||||
| (1) | Represents the actual or weighted average interest or dividend rate of the respective security or portfolio as of the date indicated. Investments without an interest rate or with a rate of 0.00% are considered non-income producing. |
| (2) | Included in secured mezzanine commercial loans and other commercial loans was $2,971 of interest income capitalized into the outstanding investment balances, in accordance with the terms of the investment contract. |
| (3) | The ratio of restricted securities fair value to net assets is 192%. |
| (4) | Gross unrealized appreciation, gross unrealized depreciation, and net appreciation for federal income tax purposes totaled $62,743, $5,370 and $57,373, respectively. The tax cost of investments was $470,228. |
| (5) | For revolving lines of credit the amount shown is the cost at December 31, 2014. |
| * | Less than 1.0% |
| ** | Not an eligible portfolio company as such term is defined in Section 2(a)(46) of the 1940 Act. The percentage value of all non-eligible portfolio companies to totaled assets of Medallion Financial on an unconsolidated basis was up to 25% and up to 29% on a consolidated basis. Under the 1940 Act, we may not acquire any non-qualifying assets, unless at the time such acquisition is made, qualifying assets, which include securities of eligible portfolio companies, represent at least 70% of our total assets. The status of these assets under the 1940 Act are subject to change. We monitor the status of these assets on an ongoing basis. |
| & | Loan is on nonaccrual status, or past due on contractual payments, and is therefore considered non-income producing. |
| && | Some or all of the securities are non-income producing as per & above. |
| # | Publicly traded but sales subject to applicable Rule 144 limitations. |
| ## | Pledged as collateral under borrowing arrangements. |
| + | Includes various warrants, all of which have a cost and fair value of zero at December 31, 2014. |
The Summary Schedule of Investments does not reflect the Company’s complete portfolio holdings. It includes the Company’s 50 largest holdings and each investment of any issuer that exceeds 1% of the Company’s net assets. “Various Other” represents all issues not required to be disclosed under the rules adopted by the U.S. Securities and Exchange Commission (“SEC”). Footnotes above may apply to securities that are included in “Various Other”. For further detail, the complete schedule of portfolio holdings is available (i) without charge, upon request, by calling (877) MEDALLION; and (ii) on the SEC’s website at http://www.sec.gov. Filed as Exhibit 99.1 to the Annual Report on Form 10-K for the fiscal year ended December 31, 2014, filed on March 11, 2015 (File No. 814-00188)
F-41
Table of Contents
Medallion Financial Corp
CONSOLIDATED SCHEDULE OF INVESTMENTS IN AND ADVANCES TO AFFILIATES
As of and for the year ended December 31, 2014
| Name of issuer and title of issue |
Number of shares (all restricted unless otherwise noted) |
Equity in net profit and (loss) |
Amount of dividends or interest (1) |
Value as of 12/31/14 |
||||||||||
| (Dollars in thousands) | ||||||||||||||
| Medallion Bank – common stock |
1,000,000 shares -100% of common stock | $ | 26,658 | $ | 15,000 | $ | 125,027 | |||||||
| Generation Outdoor, Inc. – common stock |
1,000 shares - 100% of common stock | 4,803 | 7 | 5,063 | ||||||||||
| Medallion Hamptons Holding LLC – membership interest |
100% of membership interest | 572 | 0 | 4,400 | ||||||||||
| Medallion Fine Art, Inc. – common stock (2) |
1,000 shares - 100% of common stock | (723 | ) | 0 | 1,157 | |||||||||
| Medallion Servicing Corp. – common stock |
1,000 shares - 100% of common stock | (110 | ) | 0 | 852 | |||||||||
| LAX Group LLC – membership interest |
42% of membership interest | (557 | ) | 0 | 349 | |||||||||
|
|
|
|
|
|
|
|||||||||
| Total investments in Medallion Bank and other controlled subsidiaries |
30,643 | 15,007 | 136,848 | |||||||||||
|
|
|
|
|
|
|
|||||||||
| Medallion Motorsports, LLC – membership interest (3) |
75% of membership interest | 0 | 0 | 1,600 | ||||||||||
| Appliance Recycling Centers of America Inc. – common stock |
8.86% of common stock | 0 | 0 | 1,230 | ||||||||||
| Western Reserve Wire – membership interest (4) |
7.23% of membership interest | 0 | 0 | 224 | ||||||||||
| Summit Medical, Inc. – common stock |
9.25% of common stock | 0 | 0 | 135 | ||||||||||
| Other equity investments other than in investments in and advances to affiliates |
— | — | 4,521 | |||||||||||
|
|
|
|
|
|
|
|||||||||
| Total equity investments |
— | 0 | 7,710 | |||||||||||
|
|
|
|
|
|
|
|||||||||
| Total investments in Medallion Bank and other controlled subsidiaries and equity investments |
15,007 | $ | 144,558 | |||||||||||
|
|
|
|
|
|||||||||||
| Other interest and dividend income other than from investments in and advances to affiliates |
|
433 | ||||||||||||
|
|
|
|||||||||||||
| Total dividend and interest income on short term investments |
$ | 15,440 | ||||||||||||
|
|
|
|||||||||||||
| Total investments in and advances to affiliates |
140,037 | |||||||||||||
| Other equity investments other than in investments in and advances to affiliates |
|
4,521 | ||||||||||||
|
|
|
|||||||||||||
| Total investments in Medallion Bank and other controlled subsidiaries and equity investments |
|
$ | 144,558 | |||||||||||
|
|
|
|||||||||||||
| (1) | Investments with an amount of $0 are considered non-income producing. |
| (2) | The Company has a loan due from Medallion Fine Art, Inc. in the amount of $5,600 which is carried at $6,737 as of December 31, 2014, and on which $764 of interest income was earned in 2014. |
| (3) | In addition to the equity ownership, a controlled subsidiary of the Company has a $3,039 loan to an affiliate of Medallion Motorsports, LLC which is carried at $4,485, and on which $355 of interest income was earned in 2014. |
| (4) | The Company has a loan due from Western Reserve Wire in the amount of $2,242 as of December 31, 2014, on which there were no earnings in 2014. |
The table below provides a recap of the changes in the investment in the respective issuers for the year ended December 31, 2014.
| Name of Issuer |
Medallion Bank |
Medallion Hamptons Holding LLC |
Medallion Motorsports, LLC |
Medallion Fine Art, Inc. |
Appliance Recycling Centers of America Inc. |
Medallion Servicing Corp. |
Generation Outdoor, Inc. |
Western Reserve Wire |
LAX Group LLC |
|||||||||||||||||||||||||||
| Title of Issue |
Common Stock |
Membership Interest |
Membership Interest (1) |
Common Stock (2) |
Common Stock |
Common Stock |
Common Stock |
Membership Interest (3) |
Membership Interest |
|||||||||||||||||||||||||||
| (Dollars in thousands) |
||||||||||||||||||||||||||||||||||||
| Value as of 12/31/13 |
$ | 101,478 | $ | 3,750 | $ | 1,954 | $ | 1,880 | $ | 1,299 | $ | 822 | $ | 439 | $ | — | $ | 254 | ||||||||||||||||||
| Gross additions / investments |
10,000 | 90 | 100 | — | — | 331 | 1,220 | 224 | 652 | |||||||||||||||||||||||||||
| Gross reductions / distributions |
(13,109 | ) | (12 | ) | — | — | — | (192 | ) | (1,399 | ) | — | — | |||||||||||||||||||||||
| Net equity in profit and loss, and unrealized appreciation and (depreciation) |
26,658 | 572 | (454 | ) | (723 | ) | (68 | ) | (110 | ) | 4,803 | — | (557 | ) | ||||||||||||||||||||||
| Other adjustments |
— | — | — | — | — | 1 | — | — | — | |||||||||||||||||||||||||||
|
|
|
|
|
|
|
|
|
|
|
|
|
|
|
|
|
|
|
|||||||||||||||||||
| Value as of 12/31/14 |
$ | 125,027 | $ | 4,400 | $ | 1,600 | $ | 1,157 | $ | 1,231 | $ | 852 | $ | 5,063 | $ | 224 | $ | 349 | ||||||||||||||||||
|
|
|
|
|
|
|
|
|
|
|
|
|
|
|
|
|
|
|
|||||||||||||||||||
| (1) | In addition to the equity ownership, a controlled subsidiary of the Company has a $3,039 loan to an affiliate of Medallion Motorsports, LLC which is carried at $4,485, and on which $355 of interest income was earned in 2014. |
| (2) | The Company has a loan due from Medallion Fine Art, Inc. in the amount of $5,600, which is carried at $6,737 as of December 31, 2014, $761, and on which $764 of interest income was earned in 2014. |
| (3) | The Company has a loan due from Western Reserve Wire in the amount of $2,242 as of December 31, 2014, on which there were no earnings in 2014. |
F-42
Table of Contents
(A wholly owned subsidiary of Medallion Financial Corp.)
Financial Statements for the years ended December 31, 2015, 2014, and 2013
F-43
Table of Contents
Report of Independent Registered Public Accounting Firm
To the Board of Directors and Shareholder of Medallion Bank
We have audited the accompanying balance sheets of Medallion Bank (the “Bank”) (a wholly owned subsidiary of Medallion Financial Corp.) as of December 31, 2015 and 2014, and the related statements of comprehensive income, changes in shareholder’s equity, and cash flows for each of the three years in the three-year period ended December 31, 2015. These financial statements are the responsibility of the Bank’s management. Our responsibility is to express an opinion on these financial statements based on our audits.
We conducted our audits in accordance with the standards of the Public Company Accounting Oversight Board (United States). Those standards require that we plan and perform the audit to obtain reasonable assurance about whether the financial statements are free of material misstatement. An audit includes examining, on a test basis, evidence supporting the amounts and disclosures in the financial statements. An audit also includes assessing the accounting principles used and significant estimates made by management, as well as evaluating the overall financial statement presentation. We believe that our audits provide a reasonable basis for our opinion.
In our opinion, the financial statements referred to above present fairly, in all material respects, the financial position of the Bank as of December 31, 2015 and 2014, and the results of its operations and its cash flows for each of the three years in the three-year period ended December 31, 2015, in conformity with US generally accepted accounting principles.
/s/ WeiserMazars LLP
New York, New York
March 7, 2016
F-44
Table of Contents
Medallion Bank
Statements of Comprehensive Income
For the years ended December 31,
| (Dollars in thousands) |
2015 | 2014 | 2013 | |||||||||
| Interest income |
||||||||||||
| Investments |
$ | 793 | $ | 729 | $ | 616 | ||||||
| Loan interest including fees |
90,228 | 76,562 | 63,128 | |||||||||
|
|
|
|
|
|
|
|||||||
| Total interest income |
91,021 | 77,291 | 63,744 | |||||||||
| Interest expense |
9,205 | 7,008 | 5,271 | |||||||||
|
|
|
|
|
|
|
|||||||
| Net interest income |
81,816 | 70,283 | 58,473 | |||||||||
| Provision for loan losses |
16,701 | 8,056 | 10,290 | |||||||||
|
|
|
|
|
|
|
|||||||
| Net interest income after provision for loan losses |
65,115 | 62,227 | 48,183 | |||||||||
| Noninterest income |
291 | 344 | 117 | |||||||||
| Gain/(loss) on sale of repossessed loan collateral |
(2 | ) | 11 | 506 | ||||||||
| Gain on sale of investment securities |
31 | — | — | |||||||||
| Noninterest expense |
||||||||||||
| Loan servicing |
9,072 | 8,844 | 8,215 | |||||||||
| Salaries and benefits |
5,299 | 4,997 | 4,397 | |||||||||
| Professional fees |
2,594 | 1,859 | 2,194 | |||||||||
| Collection costs |
1,362 | 1,245 | 1,307 | |||||||||
| Regulatory fees |
877 | 807 | 672 | |||||||||
| Affiliate services |
500 | 502 | 355 | |||||||||
| Occupancy and equipment |
274 | 283 | 297 | |||||||||
| Insurance |
201 | 199 | 176 | |||||||||
| Credit reports |
204 | 177 | 173 | |||||||||
| Director’s fees |
174 | 140 | 128 | |||||||||
| Provision for losses on other assets |
1,150 | — | 1,064 | |||||||||
| Other |
1,064 | 759 | 670 | |||||||||
|
|
|
|
|
|
|
|||||||
| Total noninterest expense |
22,771 | 19,812 | 19,648 | |||||||||
|
|
|
|
|
|
|
|||||||
| Income before income taxes |
42,664 | 42,770 | 29,158 | |||||||||
| Provision for income taxes |
18,974 | 16,508 | 10,718 | |||||||||
|
|
|
|
|
|
|
|||||||
| Net income |
23,690 | 26,262 | 18,440 | |||||||||
| Other comprehensive income, net of tax |
||||||||||||
| Net change in unrealized gains on investment securities |
(453 | ) | 659 | (1,024 | ) | |||||||
|
|
|
|
|
|
|
|||||||
| Total comprehensive income |
$ | 23,237 | $ | 26,921 | $ | 17,416 | ||||||
|
|
|
|
|
|
|
|||||||
The accompanying notes are an integral part of these financial statements.
F-45
Table of Contents
Medallion Bank
December 31,
| (Dollars in thousands) |
2015 | 2014 | ||||||
| Assets |
||||||||
| Cash and cash equivalents, substantially all of which are federal funds sold |
$ | 23,094 | $ | 30,372 | ||||
| Investment securities, available-for-sale |
35,524 | 27,900 | ||||||
| Loans, inclusive of net deferred loan acquisition costs |
1,020,456 | 898,874 | ||||||
| Allowance for loan losses |
(24,081 | ) | (17,799 | ) | ||||
|
|
|
|
|
|||||
| Loans, net |
996,375 | 881,075 | ||||||
| Repossessed loan collateral |
1,048 | 1,203 | ||||||
| Fixed assets, net |
85 | 120 | ||||||
| Deferred and other tax assets, net |
5,112 | 5,422 | ||||||
| Accrued interest receivable and other assets |
18,582 | 17,951 | ||||||
|
|
|
|
|
|||||
| Total assets |
$ | 1,079,820 | $ | 964,043 | ||||
|
|
|
|
|
|||||
| Liabilities and shareholder’s equity |
||||||||
| Liabilities |
||||||||
| Funds borrowed |
$ | 908,896 | $ | 807,940 | ||||
| Accrued interest payable |
1,013 | 696 | ||||||
| Other liabilities |
6,106 | 2,931 | ||||||
| Due to affiliates |
1,387 | 3,032 | ||||||
|
|
|
|
|
|||||
| Total liabilities |
917,402 | 814,599 | ||||||
|
|
|
|
|
|||||
| Commitments and contingencies (Note 9) |
— | — | ||||||
| Shareholder’s equity |
||||||||
| Preferred stock, $1.00 par value, 26,303 shares at December 31, 2015 and 2014 authorized, issued, and outstanding |
26,303 | 26,303 | ||||||
| Common stock, $1 par value, 7,000,000 shares authorized, 1,000,000 issued and outstanding |
1,000 | 1,000 | ||||||
| Additional paid in capital |
74,500 | 66,500 | ||||||
| Accumulated other comprehensive income/(loss), net of tax |
(296 | ) | 157 | |||||
| Retained earnings |
60,911 | 55,484 | ||||||
|
|
|
|
|
|||||
| Total shareholder’s equity |
162,418 | 149,444 | ||||||
|
|
|
|
|
|||||
| Total liabilities and shareholder’s equity |
$ | 1,079,820 | $ | 964,043 | ||||
|
|
|
|
|
|||||
The accompanying notes are an integral part of these financial statements.
F-46
Table of Contents
Medallion Bank
Statements of Changes in Shareholder’s Equity
For the years ended December 31, 2015, 2014, and 2013
| (Dollars in thousands) |
Preferred Stock | Common Stock | ||||||||||||||||||||||||||||||
| Shares Outstanding |
Amount | Shares Outstanding |
Amount | Additional Paid in Capital |
Accumulated Other Comprehensive Income (Loss) |
Retained Earnings |
Total Shareholder’s Equity |
|||||||||||||||||||||||||
| Balance at December 31, 2012 |
26,303 | $ | 26,303 | 1,000,000 | $ | 1,000 | $ | 51,500 | $ | 522 | $ | 38,308 | $ | 117,633 | ||||||||||||||||||
| Capital contributions |
— | — | — | — | 5,000 | — | — | 5,000 | ||||||||||||||||||||||||
| Net income |
18,440 | 18,440 | ||||||||||||||||||||||||||||||
| Dividends declared to parent |
— | — | — | — | — | — | (12,000 | ) | (12,000 | ) | ||||||||||||||||||||||
| Dividends declared to US Treasury |
— | — | — | — | — | — | (263 | ) | (263 | ) | ||||||||||||||||||||||
| Net change in unrealized gains on investment securities, net of tax |
— | — | — | — | — | (1,024 | ) | — | (1,024 | ) | ||||||||||||||||||||||
|
|
|
|
|
|
|
|
|
|
|
|
|
|
|
|
|
|||||||||||||||||
| Balance at December 31, 2013 |
26,303 | $ | 26,303 | 1,000,000 | $ | 1,000 | $ | 56,500 | $ | (502 | ) | $ | 44,485 | $ | 127,786 | |||||||||||||||||
| Capital contributions |
— | — | — | — | 10,000 | — | — | 10,000 | ||||||||||||||||||||||||
| Net income |
26,262 | 26,262 | ||||||||||||||||||||||||||||||
| Dividends declared to parent |
— | — | — | — | — | — | (15,000 | ) | (15,000 | ) | ||||||||||||||||||||||
| Dividends declared to US Treasury |
— | — | — | — | — | — | (263 | ) | (263 | ) | ||||||||||||||||||||||
| Net change in unrealized gains on investment securities, net of tax |
— | — | — | — | — | 659 | — | 659 | ||||||||||||||||||||||||
|
|
|
|
|
|
|
|
|
|
|
|
|
|
|
|
|
|||||||||||||||||
| Balance at December 31, 2014 |
26,303 | $ | 26,303 | 1,000,000 | $ | 1,000 | $ | 66,500 | $ | 157 | $ | 55,484 | $ | 149,444 | ||||||||||||||||||
| Capital contributions |
— | — | — | — | 8,000 | — | — | 8,000 | ||||||||||||||||||||||||
| Net income |
23,690 | 23,690 | ||||||||||||||||||||||||||||||
| Dividends declared to parent |
— | — | — | — | — | — | (18,000 | ) | (18,000 | ) | ||||||||||||||||||||||
| Dividends declared to US Treasury |
— | — | — | — | — | — | (263 | ) | (263 | ) | ||||||||||||||||||||||
| Net change in unrealized gains on investment securities, net of tax |
— | — | — | — | — | (453 | ) | — | (453 | ) | ||||||||||||||||||||||
|
|
|
|
|
|
|
|
|
|
|
|
|
|
|
|
|
|||||||||||||||||
| Balance at December 31, 2015 |
26,303 | $ | 26,303 | 1,000,000 | $ | 1,000 | $ | 74,500 | $ | (296 | ) | $ | 60,911 | $ | 162,418 | |||||||||||||||||
|
|
|
|
|
|
|
|
|
|
|
|
|
|
|
|
|
|||||||||||||||||
The accompanying notes are an integral part of these financial statements.
F-47
Table of Contents
Medallion Bank
For the years ended December 31,
| (Dollars in thousands) |
2015 | 2014 | 2013 | |||||||||
| Cash flows from operating activities |
||||||||||||
| Net income from operations |
$ | 23,690 | $ | 26,262 | $ | 18,440 | ||||||
| Adjustments to reconcile net income to net cash flows provided by operating activities: |
||||||||||||
| Depreciation and amortization |
4,816 | 4,542 | 4,379 | |||||||||
| Deferred tax benefit |
(2,623 | ) | (397 | ) | (1,049 | ) | ||||||
| Provision for loan losses |
16,701 | 8,056 | 10,290 | |||||||||
| Provision for losses on other assets |
1,150 | — | 1,064 | |||||||||
| Gain from sale of repossessed loan collateral and other assets, net |
(1 | ) | (16 | ) | (513 | ) | ||||||
| Changes in operating assets and liabilities: |
||||||||||||
| Interest receivable |
(1,171 | ) | (689 | ) | (338 | ) | ||||||
| Other tax assets |
3,233 | (28 | ) | (782 | ) | |||||||
| Other assets |
(1,926 | ) | (2,286 | ) | (1,596 | ) | ||||||
| Interest payable |
317 | 121 | 91 | |||||||||
| Other liabilities |
175 | 482 | 672 | |||||||||
|
|
|
|
|
|
|
|||||||
| Net cash provided by operating activities |
44,361 | 36,047 | 30,658 | |||||||||
|
|
|
|
|
|
|
|||||||
| Cash flows from investing activities |
||||||||||||
| Increase in loans, net |
(139,720 | ) | (148,006 | ) | (110,700 | ) | ||||||
| Purchase of investments |
(15,046 | ) | (5,604 | ) | (9,738 | ) | ||||||
| Proceeds from maturity/sale of investments |
6,587 | 3,158 | 5,662 | |||||||||
| Proceeds from sale of repossessed loan collateral |
4,514 | 4,646 | 4,656 | |||||||||
| Purchase of fixed assets |
(22 | ) | (41 | ) | (102 | ) | ||||||
|
|
|
|
|
|
|
|||||||
| Net cash used in investing activities |
(143,687 | ) | (145,847 | ) | (110,222 | ) | ||||||
|
|
|
|
|
|
|
|||||||
| Cash flows from financing activities |
||||||||||||
| Issuance of time deposits and other borrowed funds |
475,926 | 576,822 | 642,189 | |||||||||
| Repayments of funds borrowed |
(374,970 | ) | (451,019 | ) | (556,003 | ) | ||||||
| Federal funds purchased |
35,043 | 27,000 | 24,000 | |||||||||
| Repayments of federal funds purchased |
(35,043 | ) | (27,000 | ) | (30,000 | ) | ||||||
| Change in due to affiliates |
(1,645 | ) | 2,165 | (596 | ) | |||||||
| Additional paid-in capital contributed by parent |
8,000 | 10,000 | 5,000 | |||||||||
| Dividends paid to parent |
(15,000 | ) | (15,000 | ) | (12,000 | ) | ||||||
| Dividends paid to US Treasury |
(263 | ) | (263 | ) | (329 | ) | ||||||
|
|
|
|
|
|
|
|||||||
| Net cash provided by financing activities |
92,048 | 122,705 | 72,261 | |||||||||
|
|
|
|
|
|
|
|||||||
| Net change in cash and cash equivalents |
(7,278 | ) | 12,905 | (7,303 | ) | |||||||
| Cash and cash equivalents, beginning of the year |
30,372 | 17,467 | 24,770 | |||||||||
|
|
|
|
|
|
|
|||||||
| Cash and cash equivalents, end of the year |
$ | 23,094 | $ | 30,372 | $ | 17,467 | ||||||
|
|
|
|
|
|
|
|||||||
| SUPPLEMENTAL DISCLOSURE OF CASH FLOW INFORMATION |
||||||||||||
| Cash paid for interest |
$ | 7,575 | $ | 5,636 | $ | 3,960 | ||||||
| Cash paid for income taxes |
18,364 | 16,933 | 12,550 | |||||||||
| Non-cash investing activities - loans transferred to repossessed loan collateral |
8,523 | 8,413 | 8,959 | |||||||||
| Non-cash investing activities - loans transferred to other assets |
338 | — | 8,514 | |||||||||
| Non-cash financing activity - dividends payable to parent |
3,000 | — | — | |||||||||
The accompanying notes are an integral part of these financial statements.
F-48
Table of Contents
Medallion Bank
December 31, 2015
1. Organization and summary of significant accounting policies
Description of business – Medallion Bank (the Bank) is a limited service industrial bank headquartered in Salt Lake City, Utah. The Bank was formed in May 2002 for the purpose of obtaining an industrial bank (IB) charter pursuant to the laws of the State of Utah. The Bank is a wholly owned subsidiary of Medallion Financial Corp. (Medallion). The Bank originates asset-based commercial loans (secured by accounts receivable, inventory, and machinery and equipment) and medallion commercial loans to finance the purchase of taxi medallions, both of which are marketed and serviced by the Bank’s affiliates who have extensive prior experience in these asset groups. The Bank originates consumer loans on a national basis that are secured by marine, recreational vehicle, and trailer products to customers with prior credit blemishes. The Bank also originates unsecured home improvement consumer loans on a national basis. The loans are financed primarily with time certificates of deposits which are originated nationally through a variety of brokered deposit relationships.
Basis of presentation – The Bank’s financial statements are presented in accordance with accounting principles generally accepted in the US and prevailing industry practices, which require management to make estimates that affect the reported amounts of assets and liabilities and disclosure of contingent assets and liabilities. Estimates, by their nature, are based upon judgment and available information. Actual results could differ materially from those estimates.
Cash and cash equivalents – The Bank considers all highly liquid instruments with an original purchased maturity of three months or less to be cash equivalents. A non-interest bearing compensating balance of $100,000 is maintained at a correspondent bank. Cash balances are generally held in accounts at large national or regional banking organizations in amounts that frequently exceed the federally insured limits.
Investment securities – FASB ASC Topic 320, “Investments – Debt and Equity Securities,” requires that all applicable investments be classified as trading securities, available-for-sale securities, or held-to-maturity securities. Investment securities are purchased from time-to-time in the open market at prices that are greater or lesser than the par value of the investment. The resulting premium or discount is deferred and recognized on a level yield basis as an adjustment to the yield of the related investment. At December 31, 2015 and 2014, the net premium on investment securities totaled $311,000 and $272,000, and $83,000, $64,000, and $105,000 was amortized to interest income for the years ended December 31, 2015, 2014, and 2013. The Bank had $35,524,000 and $27,900,000 of available-for-sale securities at fair value as of December 31, 2015 and 2014. The topic further requires that held-to-maturity securities be reported at amortized cost and available-for-sale securities be reported at fair value, with unrealized gains and losses excluded from earnings at the date of the financial statements, and reported in accumulated other comprehensive income (loss) as a separate component of shareholder’s equity, net of the effect of income taxes, until they are sold. The Bank had $501,000 of pretax net unrealized loss on available-for-sale securities as of December 31, 2015, and $252,000 of pretax net unrealized gain on available-for-sale securities as of December 31, 2014. At the time of sale, any gains or losses, calculated by the specific identification method, will be recognized as a component of operating results and any amounts previously included in shareholder’s equity, which were recorded net of the income tax effect, will be reversed.
Loans – Loans are reported at the principal amount outstanding, inclusive of deferred loan acquisition costs, which primarily includes deferred fees paid to loan originators, and which is amortized to interest income over the life of the loan.
Loan origination fees and certain direct origination costs are deferred and recognized as an adjustment to the yield of the related loans. At December 31, 2015 and 2014, net loan origination costs were $11,399,000 and $9,937,000. Net amortization expense for the years ended December 31, 2015, 2014, and 2013 was $3,354,000, $3,138,000, and $2,911,000.
Interest income is recognized on an accrual basis. Taxicab medallion and commercial loans are placed on nonaccrual status, and all uncollected accrued interest is reversed, when there is doubt as to the collectability of interest or principal, or if loans are 90 days or more past due, unless management has determined that they are both well-secured and in the process of collection. Interest income on nonaccrual loans is generally recognized when cash is received, unless a determination has been made to apply all cash receipts to principal. The consumer portfolio has different characteristics compared to commercial loans, typified by a larger number of lower dollar loans that have similar characteristics. A loan is considered to be impaired, or nonperforming, when based on current information and events, it is likely the Bank will be unable to collect all amounts due according to the contractual terms of the original loan agreement. Management considers loans that are in bankruptcy status, but have not been charged-off, to be impaired. These loans are placed on nonaccrual, when they become 90 days past due, or earlier if they enter bankruptcy, and are charged off in their entirety when deemed uncollectible, or when they become 120 days past due (loans in bankruptcy are not charged-off at 120 days),
F-49
Table of Contents
whichever occurs first, at which time appropriate collection and recovery efforts against both the borrower and the underlying collateral are initiated. Other loans are charged off when management determines that a loss has occurred. All interest accrued but not collected for loans that are charged off is reversed against interest income. For the recreational consumer loan portfolio, the process to repossess the collateral is started at 60 days past due. If the collateral is not located and the account reaches 120 days delinquent, the account is charged off. If the collateral is repossessed, a loss is recorded to write the collateral down to its fair value less selling costs, and the collateral is sent to auction. When the collateral is sold, the net auction proceeds are applied to the account, and any remaining balance is written off. Proceeds collected on charged off accounts are recorded as a recovery. Total loans more than 90 days past due were $17,153,000, $3,114,000, and $3,817,000 at December 31, 2015, 2014, and 2013, or 1.7%, 0.4%, and 0.5% of the total loan portfolio.
At December 31, 2015, $3,381,000 or 1% of consumer loans, no commercial loans, and $21,722,000 or 6% of medallion loans were on nonaccrual, compared to $2,536,000 or 1% of consumer loans, and $1,351,000 or 3% of commercial loans and no medallion loans on nonaccrual at December 31, 2014, and $2,266,000 or 1% of consumer loans, and $2,291,000 or 4% of commercial loans and no medallion loans on nonaccrual at December 31, 2013. The amount of interest income on nonaccrual loans that would have been recognized if the loans had been paying in accordance with their original terms was $183,000, $90,000, and $85,000 as of December 31, 2015, 2014, and 2013.
These loans are charged-down to fair value and placed on nonaccrual status. Fair value is determined based upon comparable market prices for substantially similar collateral plus management’s estimate of disposal costs. All interest accrued but not collected for loans that are placed on nonaccrual is reversed against interest income. The interest on these loans is accounted for on the cash basis until qualifying for return to accrual status. Loans are returned to accrual status when all the principal and interest amounts contractually due are brought current and future payments are reasonably assured.
Troubled Debt Restructurings (TDRs) – In situations where, for economic or legal reasons related to a borrower’s financial difficulties, the Bank grants a concession for other than an insignificant period of time to the borrower that the Bank would not otherwise consider, the related loan is classified as a TDR. The Bank strives to identify borrowers in financial difficulty early and work with them to modify their loan to more affordable terms before it reaches nonaccrual status. These modified terms may include rate reductions, principal forgiveness, term extensions, payment forbearance and other actions intended to minimize the economic loss to the Bank and to avoid foreclosure or repossession of the collateral. For modifications where the Bank forgives principal, the entire amount of such principal forgiveness is immediately charged off. Loans classified as TDRs are considered impaired loans.
When the Bank identifies a loan as impaired, the Bank measures the impairment based on the present value of expected future cash flows, discounted at the loan’s effective interest rate. When collateral is the sole source of repayment for the loan, the Bank may measure impairment based on the fair value of the collateral. If foreclosure is probable, the Bank uses the current fair value of the collateral less selling costs, instead of discounted cash flows.
If the Bank determines that the value of an impaired loan is less than the recorded investment in the loan (net of previous chargeoffs, deferred loan fees or costs and unamortized premium or discount), the Bank recognizes impairment. When the value of an impaired loan is calculated by discounting expected cash flows, interest income is recognized using the loan’s effective interest rate over the remaining life of the loan.
Allowance for loan losses – In analyzing the adequacy of the allowance for loan losses, the Bank uses historical delinquency and actual loss rates with a one year lookback period. The allowance for loan losses is evaluated on a regular basis by management and is based upon management’s periodic review of the collectability of the loans in light of historical experience, the nature and volume of the loan portfolio, adverse situations that may affect the borrower’s ability to repay, estimated value of any underlying collateral, prevailing economic conditions, and excess concentration risks. This evaluation is inherently subjective, as it requires estimates that are susceptible to significant revision as more information becomes available. Credit losses are deducted from the allowance and subsequent recoveries are added back to the allowance.
Fixed assets – Fixed assets are stated at cost less accumulated depreciation and amortization. Maintenance and repairs are charged to expense while significant improvements are capitalized. Depreciation and amortization are computed using the straight-line method over the estimated useful lives of the related assets. Capitalized leasehold improvements are amortized over the lesser of the estimated useful life of the asset or the remaining lease term.
Income taxes – The Bank uses the asset and liability method in providing income taxes on all transactions that have been recognized in the financial statements. Deferred tax assets and liabilities are recognized for the future tax consequences attributable to differences between the financial statement carrying amounts of existing assets and liabilities and their existing tax bases. The Bank files its tax returns on a separate company basis.
F-50
Table of Contents
Other comprehensive income (loss) – The Bank had $(453,000), $659,000, and $(1,024,000) of net unrealized gains/(loss) due to the mark-to-market of available-for-sale securities for the years ended December 31, 2015, 2014, and 2013. The Bank had no other components of comprehensive income (loss).
Restrictions on dividends, loans, and advances – Banking regulations place certain restrictions on dividends paid and loans or advances made by the Bank to Medallion. The total amount of dividends that may be paid at any date is generally limited to the retained earnings of the Bank. However, dividends paid by the Bank would be prohibited if the effect thereof would cause the Bank’s capital to be reduced below applicable minimum standards.
Financial instruments – FASB ASC Topic 825, “Financial Instruments,” requires disclosure of fair value information about certain financial instruments, whether assets, liabilities, or off-balance-sheet commitments, if practicable.
Fair value of assets and liabilities – The Bank follows FASB ASC Topic 820, “Fair Value Measurements and Disclosures,” (FASB ASC 820), which defines fair value, establishes a framework for measuring fair value, and expands disclosures about fair value measurements. FASB ASC 820 defines fair value as an exit price (i.e. a price that would be received to sell, as opposed to acquire, an asset or transfer a liability), and emphasizes that fair value is a market-based measurement. It establishes a fair value hierarchy that distinguishes between assumptions developed based on market data obtained from independent external sources and the reporting entities own assumptions. Further, it specifies that fair value measurement should consider adjustment for risk, such as the risk inherent in the valuation technique or its inputs. See also Note 12 to the financial statements.
Reclassifications – Certain reclassifications have been made to prior year balances to conform with the current year presentation. These reclassifications have no effect on the previously reported results of operations.
Recently issued accounting standards –– In February 2016, the FASB issued Accounting Standards Update (ASU) 2016-02, “Leases (Topic 842)”. ASU 2016-02 requires the recognition of lease assets and lease liabilities by lessees for leases classified as operating under current GAAP. ASU 2016-02 applies to all entities and is effective for fiscal years beginning after December 15, 2018 for public entities and is effective for fiscal years beginning after December 15, 2019 for all other entities, with early adoption permitted. The Bank is assessing the impact the update will have on its financial condition.
In January 2016, the FASB issued ASU 2016-01, “Financial Instruments—Overall (Topic 825-10): Recognition and Measurement of Financial Assets and Financial Liabilities.” The main objective of this Update is to enhance the reporting model for financial instruments and provide users of financial statements with more decision-useful information. ASU 2016-01 requires equity investments to be measured at fair value, simplifies the impairment assessment of equity investment without readily determinable fair value, eliminates the requirements to disclose the fair value of financial instruments measured at amortized cost, and requires public business entities to use the exit price notion when measuring the fair value of financial instruments. The update, as amended, is effective for fiscal years, and interim periods within those fiscal years, beginning after December 15, 2017. The Bank does not believe this update will have a material impact on its financial condition.
In August 2015, the FASB issued ASU 2015-15, “Interest—Imputation of Interest (Subtopic 835-30): Presentation and Subsequent Measurement of Debt Issuance Costs Associated with Line-of-Credit Arrangements—Amendments to SEC Paragraphs Pursuant to Staff Announcement at June 18, 2015 EITF Meeting.” ASU 2015-15 adds SEC paragraphs whereby the SEC staff addresses the absence of guidance under ASU 2015-03, “Interest – Imputation of Interest (Subtopic 835-30),” for costs related to line of credit arrangements. The SEC staff will not object to an entity deferring and presenting debt issuance costs as an asset and subsequently amortizing the deferred debt issuance costs ratably over the term of the line-of-credit arrangement, regardless of whether there are any outstanding borrowings on the line-of-credit arrangement. ASU 2015-03 requires that debt issuance costs related to a recognized debt liability be presented in the balance sheet as a direct deduction from the carrying amount of that debt liability, consistent with debt discounts. The update, as amended, is effective for fiscal years, and interim periods within those fiscal years, beginning after December 15, 2015. The Bank does not believe this update will have a material impact on its financial condition.
In May 2015, the FASB issued ASU 2015-07, “Fair Value Measurement (Topic 820) – Disclosures for Investments in Certain Entities That Calculate Net Asset Value per Share (or Its Equivalent). ASU 2015-07 removes the requirement to categorize within the fair value hierarchy all investments for which fair value is measured using the net asset value per share practical expedient. Additionally, the amendment removes the requirement to make certain disclosures for all investments that are eligible to be measured at fair value using the net asset value per share practical expedient, limiting those disclosures to investments for which the entity has elected to measure the fair value using that practical expedient. The update is effective for fiscal years, and interim periods within those fiscal years, beginning after December 15, 2015. The Bank does not believe this update will have a material impact on its disclosures.
F-51
Table of Contents
2. Investment securities
Fixed maturity securities available-for-sale at December 31 consisted of the following.
| (Dollars in thousands) |
Amortized Cost | Gross Unrealized Gains |
Gross Unrealized Losses |
Fair Value | ||||||||||||
| 2015 |
||||||||||||||||
| Mortgage-backed securities, principally obligations of US federal agencies |
$ | 25,888 | $ | 133 | $ | 351 | $ | 25,670 | ||||||||
| State and municipalities |
10,137 | 37 | 320 | 9,854 | ||||||||||||
|
|
|
|
|
|
|
|
|
|||||||||
| Total |
$ | 36,025 | $ | 170 | $ | 671 | $ | 35,524 | ||||||||
|
|
|
|
|
|
|
|
|
|||||||||
| 2014 |
||||||||||||||||
| Mortgage-backed securities, principally obligations of US federal agencies |
$ | 18,526 | $ | 351 | $ | 177 | $ | 18,700 | ||||||||
| State and municipalities |
9,122 | 157 | 79 | 9,200 | ||||||||||||
|
|
|
|
|
|
|
|
|
|||||||||
| Total |
$ | 27,648 | $ | 508 | $ | 256 | $ | 27,900 | ||||||||
|
|
|
|
|
|
|
|
|
|||||||||
The amortized cost and estimated market value of investment securities as of December 31, 2015 by contractual maturity are shown below. Actual maturities will differ from contractual maturities because borrowers may have the right to call or prepay obligations with or without call or prepayment penalties.
| (Dollars in thousands) |
Amortized Cost |
Market Value |
||||||
| Due in one year or less |
$ | 245 | $ | 248 | ||||
| Due after one year through five years |
2,176 | 2,177 | ||||||
| Due after five years through ten years |
14,715 | 14,451 | ||||||
| Due after ten years |
18,889 | 18,648 | ||||||
|
|
|
|
|
|||||
| Total |
$ | 36,025 | $ | 35,524 | ||||
|
|
|
|
|
|||||
Information pertaining to securities with gross unrealized losses at December 31, aggregated by investment category and length of time that individual securities have been in a continuous loss position follows.
| Less than Twelve Months | Twelve Months and Over | |||||||||||||||
| (Dollars in thousands) |
Gross Unrealized Losses |
Fair Value | Gross Unrealized Losses |
Fair Value | ||||||||||||
| 2015 |
||||||||||||||||
| Mortgage-backed securities, principally obligations of US federal agencies |
$ | 170 | $ | 14,083 | $ | 181 | $ | 7,797 | ||||||||
| State and municipalities |
125 | 4,630 | 194 | 2,492 | ||||||||||||
|
|
|
|
|
|
|
|
|
|||||||||
| Total |
$ | 295 | $ | 18,713 | $ | 375 | $ | 10,289 | ||||||||
|
|
|
|
|
|
|
|
|
|||||||||
| 2014 |
||||||||||||||||
| Mortgage-backed securities, principally obligations of US federal agencies |
$ | 24 | $ | 2,240 | $ | 153 | $ | 8,085 | ||||||||
| State and municipalities |
10 | 1,990 | 69 | 2,256 | ||||||||||||
|
|
|
|
|
|
|
|
|
|||||||||
| Total |
$ | 34 | $ | 4,230 | $ | 222 | $ | 10,341 | ||||||||
|
|
|
|
|
|
|
|
|
|||||||||
Unrealized losses on securities have not been recognized into income because the issuers’ bonds are of high credit quality, and the Bank has the intent and ability to hold the securities for the foreseeable future. The fair value is expected to recover as the bonds approach the maturity date.
3. Loans and allowance for loan losses
Loans are summarized as follows at December 31,
| Loans (Dollars in thousands) |
2015 | 2014 | ||||||
| Consumer (1) |
$ | 626,138 | $ | 478,041 | ||||
| Medallion (2) |
338,285 | 366,397 | ||||||
| Commercial: (2) |
||||||||
| Asset-based |
40,869 | 40,668 | ||||||
| Construction |
315 | 2,039 | ||||||
| Other commercial |
3,450 | 1,792 | ||||||
|
|
|
|
|
|||||
| Total commercial |
44,634 | 44,499 | ||||||
| Deferred loan acquisition costs, net |
11,399 | 9,937 | ||||||
|
|
|
|
|
|||||
| Total loans |
$ | 1,020,456 | $ | 898,874 | ||||
|
|
|
|
|
|||||
| (1) | Collectively evaluated for impairment |
| (2) | Individually evaluated for impairment |
F-52
Table of Contents
Changes in the allowance for loan losses are summarized as follows.
| (Dollars in thousands) |
Medallion (2) | Asset-based and commercial (2) |
Construction (2) | Consumer (1) | Total | |||||||||||||||
| Balance at 12/31/12 |
$ | 1,687 | $ | 988 | $ | 50 | $ | 11,909 | $ | 14,634 | ||||||||||
| Provision for loan losses |
62 | 3,012 | (3) | (16 | ) | 7,233 | 10,291 | |||||||||||||
| Loan charge-offs |
— | (2,128 | ) | — | (9,226 | ) | (11,354 | ) | ||||||||||||
| Recoveries |
— | — | — | 2,863 | 2,863 | |||||||||||||||
|
|
|
|
|
|
|
|
|
|
|
|||||||||||
| Balance at 12/31/13 |
1,749 | 1,872 | 34 | 12,779 | 16,434 | |||||||||||||||
| Provision for loan losses |
92 | 333 | (3 | ) | 7,634 | 8,056 | ||||||||||||||
| Loan charge-offs |
— | (940 | ) | — | (8,913 | ) | (9,853 | ) | ||||||||||||
| Recoveries |
— | — | — | 3,162 | 3,162 | |||||||||||||||
|
|
|
|
|
|
|
|
|
|
|
|||||||||||
| Balance at 12/31/14 |
1,841 | 1,265 | 31 | 14,662 | 17,799 | |||||||||||||||
| Provision for loan losses |
4,295 | 361 | (26 | ) | 12,071 | 16,701 | ||||||||||||||
| Loan charge-offs |
— | (1,013 | ) | — | (12,667 | ) | (13,680 | ) | ||||||||||||
| Recoveries |
— | — | — | 3,261 | 3,261 | |||||||||||||||
|
|
|
|
|
|
|
|
|
|
|
|||||||||||
| Balance at 12/31/15 |
$ | 6,136 | $ | 613 | $ | 5 | $ | 17,327 | $ | 24,081 | ||||||||||
|
|
|
|
|
|
|
|
|
|
|
|||||||||||
| (1) | Collectively evaluated for impairment |
| (2) | Individually evaluated for impairment |
| (3) | Includes $2,128 reflecting the provision charged, and the subsequent transfer to other assets of valuation reserves related to loans transferred to other assets as described in the section “Other assets” on page F-55. |
The loan charge-offs and recoveries resulted primarily from the consumer portfolio. There were no loans acquired with deteriorated credit quality.
See Note 1 to the financial statements, which describes the nature of the portfolios, their collection and income recognition processes, and the methodology used to assess the adequacy of the allowance.
The medallion and asset-based loan portfolios are primarily collateral-based lending, whereby the collateral value exceeds the amount of the loan, providing sufficient excess collateral to protect against losses to the Bank. The adequacy of these amounts is demonstrated by the minimal loss experience in these portfolios since the Bank’s inception. The asset-based and medallion portfolios are analyzed and evaluated in the aggregate, as a pool of loans, until becoming nonperforming, at which time they receive individualized attention.
Other commercial or construction loans are infrequent, and made on a case by case basis, after performing thorough borrower review, credit, and collateral checks. The risk associated with these types of loans is individual to that particular credit, and they are monitored and tracked closely.
The consumer loan portfolio is primarily customer driven, whereby borrowers are assessed a score based on income level, home ownership, FICO score, and other factors weighted in a credit scoring model that determines whether a borrower is qualified. Loan losses in this portfolio fluctuate with economic conditions, and can range widely over time. The consumer loan portfolio is analyzed and evaluated in the aggregate, as a pool of loans.
Allocations for the allowance for credit losses may be made for specific loans, but the allowance is general in nature and is available to absorb losses from any loan type.
The following table provides a summary of the loan portfolio by its performance status and by type.
| Performing | Nonperforming | Total | ||||||||||||||||||||||
| (Dollars in thousands) |
2015 | 2014 | 2015 | 2014 | 2015 | 2014 | ||||||||||||||||||
| Medallion |
$ | 315,652 | $ | 366,397 | $ | 22,633 | $ | — | $ | 338,285 | $ | 366,397 | ||||||||||||
| Asset-based and commercial |
44,634 | 41,109 | — | 1,351 | 44,634 | 42,460 | ||||||||||||||||||
| Construction |
— | 2,039 | — | — | — | 2,039 | ||||||||||||||||||
| Consumer |
622,504 | 475,215 | 3,634 | 2,826 | 626,138 | 478,041 | ||||||||||||||||||
|
|
|
|
|
|
|
|
|
|
|
|
|
|||||||||||||
| Total |
$ | 982,790 | $ | 884,760 | $ | 26,267 | $ | 4,177 | $ | 1,009,057 | $ | 888,937 | ||||||||||||
|
|
|
|
|
|
|
|
|
|
|
|
|
|||||||||||||
F-53
Table of Contents
The following tables provide additional information on attributes of the nonperforming loan portfolio.
| (Dollars in thousands) December 31, 2015 |
Recorded Investment |
Unpaid Principal Balance |
Related Allowance |
Average Recorded Investment |
Interest Income Recognized |
|||||||||||||||
| With no related allowance recorded |
||||||||||||||||||||
| Medallion |
$ | — | $ | — | $ | — | $ | — | $ | — | ||||||||||
| Asset–based and commercial |
— | — | — | — | — | |||||||||||||||
| Construction |
— | — | — | — | — | |||||||||||||||
| Consumer |
— | — | — | — | — | |||||||||||||||
| With an allowance recorded |
||||||||||||||||||||
| Medallion |
22,633 | 22,633 | 1,350 | 5,635 | 118 | |||||||||||||||
| Asset–based and commercial |
— | — | — | — | — | |||||||||||||||
| Construction |
— | — | — | — | — | |||||||||||||||
| Consumer |
3,633 | 3,633 | 108 | 2,721 | 261 | |||||||||||||||
|
|
|
|
|
|
|
|
|
|
|
|||||||||||
| Total |
||||||||||||||||||||
| Medallion |
22,633 | 22,633 | 1,350 | 5,635 | 118 | |||||||||||||||
| Asset –based and commercial |
— | — | — | — | — | |||||||||||||||
| Construction |
— | — | — | — | — | |||||||||||||||
| Consumer |
$ | 3,633 | $ | 3,633 | $ | 108 | $ | 2,721 | $ | 261 | ||||||||||
| (Dollars in thousands) December 31, 2014 |
Recorded Investment |
Unpaid Principal Balance |
Related Allowance |
Average Recorded Investment |
Interest Income Recognized |
|||||||||||||||
| With no related allowance recorded |
||||||||||||||||||||
| Medallion |
$ | — | $ | — | $ | — | $ | — | $ | — | ||||||||||
| Asset–based and commercial |
— | — | — | — | — | |||||||||||||||
| Construction |
— | — | — | — | — | |||||||||||||||
| Consumer |
— | — | — | — | — | |||||||||||||||
| With an allowance recorded |
||||||||||||||||||||
| Medallion |
— | — | — | — | — | |||||||||||||||
| Asset–based and commercial |
1,351 | 1,351 | 675 | 2,002 | — | |||||||||||||||
| Construction |
— | — | — | — | — | |||||||||||||||
| Consumer |
2,826 | 2,826 | 87 | 2,309 | 283 | |||||||||||||||
|
|
|
|
|
|
|
|
|
|
|
|||||||||||
| Total |
||||||||||||||||||||
| Medallion |
— | — | — | — | — | |||||||||||||||
| Asset –based and commercial |
1,351 | 1,351 | 675 | 2,002 | — | |||||||||||||||
| Construction |
— | — | — | — | — | |||||||||||||||
| Consumer |
$ | 2,826 | $ | 2,826 | $ | 87 | $ | 2,309 | $ | 283 | ||||||||||
The table below shows the aging of all loan types as of December 31,
| (Dollars in thousands) |
Days Past Due | Recorded Investment >90 Days and Accruing |
||||||||||||||||||||||||||
| 2015 |
31-60 | 61-90 | 91 + | Total Past Due | Current | Total | ||||||||||||||||||||||
| Medallion |
$ | 5,166 | $ | 13,908 | $ | 14,949 | $ | 34,023 | $ | 304,262 | $ | 338,285 | $ | — | ||||||||||||||
| Asset–based and commercial |
265 | — | — | 265 | 44,369 | 44,634 | — | |||||||||||||||||||||
| Construction |
— | — | — | — | — | — | — | |||||||||||||||||||||
| Consumer |
9,903 | 3,207 | 2,204 | 15,314 | 610,824 | 626,138 | — | |||||||||||||||||||||
|
|
|
|
|
|
|
|
|
|
|
|
|
|
|
|||||||||||||||
| Total |
$ | 15,334 | $ | 17,115 | $ | 17,153 | $ | 49,602 | $ | 959,455 | $ | 1,009,057 | $ | — | ||||||||||||||
|
|
|
|
|
|
|
|
|
|
|
|
|
|
|
|||||||||||||||
| (Dollars in thousands) |
Days Past Due | Recorded Investment >90 Days and Accruing |
||||||||||||||||||||||||||
| 2014 |
31-60 | 61-90 | 91 + | Total Past Due | Current | Total | ||||||||||||||||||||||
| Medallion |
$ | 590 | $ | — | $ | — | $ | 590 | $ | 365,807 | $ | 366,397 | $ | — | ||||||||||||||
| Asset–based and commercial |
— | — | 1,351 | 1,351 | 41,109 | 42,460 | — | |||||||||||||||||||||
| Construction |
— | — | — | — | 2,039 | 2,039 | — | |||||||||||||||||||||
| Consumer |
9,651 | 3,301 | 1,763 | 14,715 | 463,326 | 478,041 | — | |||||||||||||||||||||
|
|
|
|
|
|
|
|
|
|
|
|
|
|
|
|||||||||||||||
| Total |
$ | 10,241 | $ | 3,301 | $ | 3,114 | $ | 16,656 | $ | 872,281 | $ | 888,937 | $ | — | ||||||||||||||
|
|
|
|
|
|
|
|
|
|
|
|
|
|
|
|||||||||||||||
F-54
Table of Contents
Other assets
A third party finance company sold various participations in asset based loans to Medallion Business Credit and Medallion Bank. In April 2013, the aggregate balance of the participations was approximately $13.8 million, $12.9 million of which were held by Medallion Bank. That amount was divided between seven separate borrowers operating in a variety of industries. In April 2013, the third party finance company became the subject of an involuntary bankruptcy petition filed by its bank lenders. Among other things, the bank lenders alleged that the third party finance company fraudulently misrepresented its borrowing availability under its credit facility with the bank lenders and are seeking the third party finance company’s liquidation. In May 2013, the bankruptcy court presiding over the third party finance company’s case entered an order converting the involuntary chapter 7 case to a chapter 11 case. The Bank has placed these loans on nonaccrual, and reversed interest income. In addition, the Bank has established valuation allowances against the outstanding balances. On May 31, 2013, Medallion Bank commenced an adverse proceeding against the third party finance company and the bank lenders seeking declaratory judgment that Medallion Bank’s loan participations are true participations and not subject to the bankruptcy estate or to the bank lender’s security interest in the third party finance company’s assets. The third party finance company and bank lenders are contesting the Bank’s position. In April 2014, the Bank received a decision from the court granting summary judgment in their favor with respect to the issue of whether the Bank’s loan participations are true participations. In March 2015, the Bank received a decision from the court finding that the bank lenders generally held a first lien on the Bank’s loan participations subject to, among other things, defenses still pending prosecution by the parties and adjudication by the court. The Bank is appealing the decision. The remaining issues are still being litigated. Although the Bank believed the claims raised by the third party finance company and the bank lenders are without merit and will vigorously defend against them, the Bank cannot at this time predict the outcome of this litigation or determine their potential exposure. At December 31, 2015, five of the seven secured borrowers had refinanced their loans in full with third parties, and the related proceeds are held in escrow pending resolution of the bankruptcy proceedings. In September 2015, one loan was sold at a discount to a third party, and the related proceeds are held in escrow pending resolution of the bankruptcy proceeding. One loan was charged off in September 2014. The balances related to the paid off loans have been reclassified to other assets on the balance sheet. The table below summarizes these receivables and their status with the Bank as of December 31, 2015.
| (Dollars in thousands) |
Medallion Bank | |||
| Loans outstanding |
$ | 1,953 | ||
| Loans charged off (1) |
(1,953 | ) | ||
| Valuation allowance |
— | |||
|
|
|
|||
| Net loans outstanding |
— | |||
|
|
|
|||
| Other receivables |
11,062 | |||
| Valuation allowance |
(4,425 | ) | ||
|
|
|
|||
| Net other receivables |
6,637 | |||
| Total net outstanding |
6,637 | |||
|
|
|
|||
| Income foregone in 2015 |
24 | |||
| Total income foregone |
$ | 108 | ||
|
|
|
|||
| (1) | The income foregone on the charged off loan was $213 for the Bank. |
F-55
Table of Contents
The table below shows loans that were modified during 2015 and 2014.
| (Dollars in thousands) |
Troubled Debt Restructuring | Troubled Debt Restructuring that Subsequently Defaulted |
||||||||||||||||||
| Number of Loans |
Pre-Modification Outstanding Recorded Investments |
Post-Modification Outstanding Recorded Investments |
Number of Loans |
Recorded Investments |
||||||||||||||||
| 2015 |
||||||||||||||||||||
| Troubled debt restructuring |
||||||||||||||||||||
| Medallion |
11 | $ | 6,307 | $ | 5,607 | — | $ | — | ||||||||||||
| Commercial real estate |
— | — | — | — | — | |||||||||||||||
| Consumer |
1 | 19 | 18 | — | — | |||||||||||||||
|
|
|
|
|
|
|
|
|
|
|
|||||||||||
| 2014 | ||||||||||||||||||||
| Troubled debt restructuring | ||||||||||||||||||||
| Medallion |
— | $ | — | $ | — | — | $ | — | ||||||||||||
| Commercial real estate |
— | — | — | — | — | |||||||||||||||
| Consumer |
— | — | — | — | — | |||||||||||||||
4. Fixed assets
Fixed assets and their related useful lives at December 31 were as follows:
| (Dollars in thousands) |
Useful lives | 2015 | 2014 | |||||||||
| Computer software |
3 years | $ | 16 | $ | 183 | |||||||
| Equipment |
5 years | 44 | 145 | |||||||||
| Furniture and fixtures |
5-10 years | 83 | 139 | |||||||||
| Leasehold improvements |
3-5 years | 13 | 93 | |||||||||
| Telephone equipment |
3 years | 33 | 82 | |||||||||
| Deposit system |
3 years | 14 | 14 | |||||||||
|
|
|
|
|
|||||||||
| 203 | 656 | |||||||||||
| Less accumulated depreciation and amortization |
|
(118 | ) | (536 | ) | |||||||
|
|
|
|
|
|||||||||
| Net fixed assets |
$ | 85 | $ | 120 | ||||||||
|
|
|
|
|
|||||||||
Depreciation expense was $56,000, $63,000, and $86,000 for the years ended December 31, 2015, 2014, and 2013.
5. Deposits and other borrowings
At December 31, 2015, the scheduled maturities of all borrowed funds, which were primarily composed of brokered certificates of time deposit as follows.
| (Dollars in thousands) | ||||
| 2016 |
$ | 393,359 | ||
| 2017 |
265,336 | |||
| 2018 |
164,721 | |||
| 2019 |
72,393 | |||
| 2020 |
13,087 | |||
|
|
|
|||
| Total |
$ | 908,896 | ||
|
|
|
|||
All time deposits are in denominations of less than $100,000 and have been originated through Certificate of Deposit Broker relationships. The weighted average interest rate of deposits outstanding at December 31, 2015 was 1.04%.
Deposits are raised through the use of investment brokerage firms who package deposits qualifying for FDIC insurance into pools that are sold to Medallion Bank. The rates paid on the deposits are highly competitive with market rates paid by other financial institutions. Additionally, a brokerage fee is paid, depending on the maturity of the deposits, which averages 0.14%, and which is capitalized and amortized to interest expense over the life of the respective pool. The total amount capitalized at December 31, 2015 and 2014 was $2,034,000 and $2,205,000, and $1,314,000, $1,251,000, and $1,220,000 was amortized to interest expense during 2015, 2014, and 2013. Interest on the deposits is accrued daily and paid monthly, quarterly, semiannually, or at maturity.
At December 31, 2015, the Bank had unsecured and undrawn Federal Funds lines with correspondent banks of $25,000,000.
F-56
Table of Contents
6. Income taxes
The components of the provisions for income taxes were as follows for the years ended December 31,
| (Dollars in thousands) |
2015 | 2014 | 2013 | |||||||||
| Current |
||||||||||||
| Federal |
$ | 15,997 | $ | 15,396 | $ | 11,527 | ||||||
| State |
5,600 | 1,508 | 239 | |||||||||
| Deferred |
||||||||||||
| Federal |
(1,849 | ) | (360 | ) | (1,025 | ) | ||||||
| State |
(774 | ) | (36 | ) | (23 | ) | ||||||
|
|
|
|
|
|
|
|||||||
| Net provision for income taxes |
$ | 18,974 | $ | 16,508 | $ | 10,718 | ||||||
|
|
|
|
|
|
|
|||||||
The following table reconciles the provision for income taxes to the US federal statutory income tax rate for the years ended December 31, 2015, 2014, and 2013.
| 2015 | 2014 | 2013 | ||||||||||
| US federal statutory tax rate |
35.0 | % | 35.0 | % | 35.0 | % | ||||||
| State taxes |
6.0 | 2.3 | 2.0 | |||||||||
| Change in state nexus |
3.5 | — | (1.5 | ) | ||||||||
| Other |
— | 1.3 | 1.3 | |||||||||
|
|
|
|
|
|
|
|||||||
| Effective income tax rate |
44.5 | % | 38.6 | % | 36.8 | % | ||||||
|
|
|
|
|
|
|
|||||||
The Bank files its tax returns on a separate company basis.
Deferred tax and other asset balances reflected in the balance sheet were as follows as of December 31,
| (Dollars in thousands) |
2015 | 2014 | ||||||
| Provision for loan losses |
$ | 11,451 | $ | 7,755 | ||||
| Deferred loan acquisition costs |
(4,490 | ) | (3,686 | ) | ||||
| Unrealized gains on investments |
205 | (95 | ) | |||||
| Other |
347 | 615 | ||||||
|
|
|
|
|
|||||
| Net deferred tax asset |
7,513 | 4,589 | ||||||
| Prepaid (accrued) taxes |
(2,401 | ) | 832 | |||||
|
|
|
|
|
|||||
| Net deferred tax and other assets |
$ | 5,112 | $ | 5,421 | ||||
|
|
|
|
|
|||||
In assessing the realizability of deferred tax assets, management considers whether it is more likely than not that some portion or all of the deferred tax assets will not be realized. The realization of deferred tax assets is dependent upon the generation of future taxable income during the periods in which temporary differences become deductible pursuant to ASC Topic 740, “Income Taxes.” Management considers the reversal of deferred tax liabilities, projected future taxable income, and tax planning strategies in making this assessment. Management’s evaluation of the realizability of deferred tax assets must consider both positive and negative evidence. The weight given to the potential effects of positive and negative evidence is based on the extent to which it can be objectively verified. Based on these considerations, no valuation allowance was deemed necessary as of December 31, 2015 and 2014.
The Bank has filed US Federal tax returns as well as tax returns with various states. Generally, tax years 2012 through the present are open for examination. Currently the Bank is undergoing a state tax examination covering the years 2010 to 2013. In 2015, the Bank’s state tax accruals have increased due to changes in the state nexus rules in a state and locality where the Bank conducts business. In addition, the Bank began accruing additional state income tax due to a change in their determination regarding nexus in certain other states where the Bank conducts business.
7. Other transactions with affiliates
The Bank’s taxi medallion, asset-based commercial, and certain other construction loans aggregated $382,919,000 and $410,915,000 at December 31, 2015 and 2014. These loans are sourced and serviced by its affiliates. The Bank paid $8,000, $15,000, and $18,000 for loan servicing fees to Medallion for 2015, 2014, and 2013, and also in 2015, 2014, and 2013, paid $5,658,000, $5,946,000, and $5,920,000 to another Medallion affiliate. Origination fees of $198,000, $523,000, and $904,000 were paid to Medallion for 2015, 2014, and 2013. Amortization costs were $367,000, $507,000, and $738,000 for 2015, 2014, and 2013.
F-57
Table of Contents
At December 31, 2015 and 2014, the Bank owed $1,387,000 and $3,032,000 to affiliates for origination fees, monthly servicing fees on loans, charges for corporate overhead, and legal and business development expenses due to the affiliates, partially offset by payments due the Bank from collection of loan payments by affiliates. The Bank reimbursed the parent for expenses incurred on its behalf of $775,000, $743,000, and $571,000 for 2015, 2014, and 2013.
8. 401(k) plan
The Bank participates in the 401(k) plan offered by Medallion. The 401(k) Plan covers all full and part-time employees of the Bank who have attained the age of 21 and have a minimum of one year of service. Under the 401(k) Plan, an employee may elect to defer not less than 1% and no more than 15% of the total annual compensation that would otherwise be paid to the employee, provided however, that employees’ contributions may not exceed certain maximum amounts determined under the Internal Revenue Code. Employee contributions are invested in various mutual funds according to the directions of the employee. At the discretion of Medallion’s Board of Directors, the Bank can provide for employer matching contributions. Medallion has elected to match employee contributions up to one-third of the employee’s contribution, but not greater than 2% of the portion of the employee’s annual salary eligible for 401(k) benefits. For the years ended December 31, 2015, 2014, and 2013, the Bank provided $55,000, $42,000, and $28,000 in employer matching, which amount is included in salaries and benefits expense on the accompanying statement of comprehensive income.
9. Commitments and contingencies
Loans – At December 31, 2015, the Bank had commitments to extend credit of $38,028,000 to asset-based customers as long as there is no violation of any condition established in the contract. The Bank had commitments to extend credit of $4,936,000 to taxi medallion customers for unfunded amounts.
Leases – The Bank leases office space under two non-cancelable operating leases that expire in August 2017 and November 2017. Rental expense related to the leases was $217,000, $220,000, and $210,000 for the years ended December 31, 2015, 2014, and 2013.
Future minimum lease payments under these operating leases as of December 31, 2015 were as follows:
| (Dollars in thousands) | ||||
| 2016 |
$ | 233 | ||
| 2017 |
190 | |||
|
|
|
|||
| Total |
$ | 423 | ||
|
|
|
|||
10. Capital requirements
The Bank is subject to various regulatory capital requirements administered by the Federal Deposit Insurance Corporation (FDIC) and the Utah Department of Financial Institutions (UDFI). Failure to meet minimum capital requirements can initiate certain mandatory and possible additional discretionary actions by regulators that, if undertaken, could have a direct material effect on the Bank’s financial statements. Under capital adequacy guidelines and the regulatory framework for prompt corrective action, the Bank must meet specific capital guidelines that involve quantitative measures of the Bank’s assets, liabilities, and certain off-balance sheet items as calculated under regulatory accounting practices. The Bank’s capital amounts and classifications are also subject to qualitative judgments by the bank regulators about components, risk weightings, and other factors.
Quantitative measures established by regulation to ensure capital adequacy require the Bank to maintain minimum amounts and ratios as defined in the regulations (set forth in the table below). Additionally, as conditions of granting the Bank’s application for federal deposit insurance, the FDIC ordered that the Tier 1 leverage capital to total assets ratio, as defined, be not less than 15%, and that an adequate allowance for loan losses be maintained. As of December 31, 2015, the Bank’s Tier 1 leverage capital ratio was 15.1%. The Bank’s actual capital amounts and ratios as of December 31, 2015 and 2014, and the regulatory minimum ratios are presented in the following tables.
F-58
Table of Contents
| (Dollars in thousands) |
As of December 31, 2015 | As of December 31, 2014 | Minimum Ratio for Capital Adequacy Purposes |
Minimum Ratio To be Well Capitalized Under Prompt Corrective Action Provisions |
||||||||||||||||||||
| Amount | Ratio | Amount | Ratio | |||||||||||||||||||||
| Tier 1 Capital (to average assets) |
$ | 161,938 | 15.1 | % | $ | 148,510 | 15.4 | % | 4.0 | % | 5.0 | % | ||||||||||||
| Common Equity Tier 1 (to risk-weighted assets) (1) |
135,635 | 12.6 | — | — | 4.5 | 6.5 | ||||||||||||||||||
| Tier 1 Capital (to risk-weighted assets) |
161,938 | 15.0 | 148,510 | 16.0 | 6.0 | 8.0 | ||||||||||||||||||
| Total Capital (to risk-weighted assets) |
175,533 | 16.3 | 160,220 | 17.2 | 8.0 | 10.0 | ||||||||||||||||||
| (1) | Effective on January 1, 2015 all banks are required to report Common Equity Tier 1 Risk-based capital. |
11. Fair value of financial instruments
FASB ASC Topic 825, “Financial Instruments,” requires disclosure of fair value information about certain financial instruments, whether assets, liabilities, or off-balance-sheet commitments, if practicable. The following methods and assumptions were used to estimate the fair value of each class of financial instrument. Fair value estimates that were derived from broker quotes cannot be substantiated by comparison to independent markets and, in many cases, could not be realized in immediate settlement of the instrument.
(a) Loans – Current fair value most closely approximates book value.
(b) Investments—The Bank’s investments are recorded at the estimated fair value of such investments.
(c) Cash – Book value equals market value.
(d) Floating rate borrowings—Due to the short-term nature of these instruments, the carrying amount approximates fair value.
(e) Commitments to extend credit—The fair value of commitments to extend credit is estimated using the fees currently charged to enter into similar agreements, taking into account the remaining terms of the agreements and present creditworthiness of the counter parties. For fixed rate loan commitments, fair value also includes a consideration of the difference between the current levels of interest rates and the committed rates. At December 31, 2015 and 2014, the estimated fair value of these off-balance-sheet instruments was not material.
(f) Fixed rate borrowings – Due to the short-term nature of these instruments, the carrying amount approximates fair value.
| December 31, 2015 | December 31, 2014 | |||||||||||||||
| (Dollars in thousands) |
Carrying Amount | Fair Value | Carrying Amount | Fair Value | ||||||||||||
| Financial Assets |
||||||||||||||||
| Loans |
$ | 996,375 | $ | 996,375 | $ | 881,075 | $ | 881,075 | ||||||||
| Investment securities |
35,524 | 35,524 | 27,900 | 27,900 | ||||||||||||
| Cash |
23,094 | 23,094 | 30,372 | 30,372 | ||||||||||||
| Accrued interest receivable |
5,966 | 5,966 | 4,794 | 4,794 | ||||||||||||
| Financial Liabilities |
||||||||||||||||
| Funds borrowed |
908,896 | 908,896 | 807,940 | 807,940 | ||||||||||||
| Accrued interest payable |
1,013 | 1,013 | 696 | 696 | ||||||||||||
F-59
Table of Contents
12. Fair value of assets and liabilities
The Bank follows the provisions of FASB ASC 820, which defines fair value, establishes a framework for measuring fair value, establishes a fair value hierarchy based on the quality of inputs used to measure fair value, and enhances disclosure requirements for fair value measurements.
In accordance with FASB ASC 820, the Bank has categorized its assets and liabilities measured at fair value, based on the priority of the inputs to the valuation technique, into a three-level fair value hierarchy. The fair value hierarchy gives the highest priority to quoted prices in active markets for identical assets or liabilities (level 1) and the lowest priority to unobservable inputs (level 3).
As required by FASB ASC 820, when the inputs used to measure fair value fall within different levels of the hierarchy, the level within which the fair value measurement is categorized is based on the lowest level input that is significant to the fair value measurement in its entirety. For example, a level 3 fair value measurement may include inputs that are observable (level 1 and 2) and unobservable (level 3). Therefore gains and losses for such assets and liabilities categorized within the level 3 table below may include changes in fair value that are attributable to both observable inputs (level 1 and 2) and unobservable inputs (level 3).
Assets and liabilities measured at fair value, recorded on the balance sheets are categorized based on the inputs to the valuation techniques as follows:
Level 1. Assets and liabilities whose values are based on unadjusted quoted prices for identical assets or liabilities in an active market that the Bank has the ability to access (examples include active exchange-traded equity securities, exchange-traded derivatives, most US Government and agency securities, and certain other sovereign government obligations).
Level 2. Assets and liabilities whose values are based on quoted prices in markets that are not active or model inputs that are observable either directly or indirectly for substantially the full term of the asset or liability. Level 2 inputs include the following:
| A) | Quoted prices for similar assets or liabilities in active markets (for example, restricted stock); |
| B) | Quoted price for identical or similar assets or liabilities in non-active markets (for example, corporate and municipal bonds, which trade infrequently); |
| C) | Pricing models whose inputs are observable for substantially the full term of the asset or liability (examples include most over-the-counter derivatives, including interest rate and currency swaps); and |
| D) | Pricing models whose inputs are derived principally from or corroborated by observable market data through correlation or other means for substantially the full term of the asset or liability (examples include certain residential and commercial mortgage-related assets, including loans, securities, and derivatives). |
Level 3. Assets and liabilities whose values are based on prices or valuation techniques that require inputs that are both unobservable and significant to the overall fair value measurement. These inputs reflect management’s own assumptions about the assumptions a market participant would use in pricing the assets or liability (examples include certain private equity investments, and certain residential and commercial mortgage-related assets, (including loans, securities, and derivatives).
Changes in the observability of valuation inputs may result in a reclassification for certain assets or liabilities.
Reclassifications impacting level 3 of the fair value hierarchy are reported as transfer in/out of the level 3 category.
The following tables present the Bank’s fair value hierarchy for those assets and liabilities measured at fair value on a recurring basis as of December 31, 2015 and 2014.
| 2015 (Dollars in thousands) |
Level 1 | Level 2 | Level 3 | Total | ||||||||||||
| Assets |
||||||||||||||||
| Available-for-sale investment securities (1) |
$ | — | $ | 35,524 | $ | — | $ | 35,524 | ||||||||
| (1) | Total unrealized loss of $453, net of tax was included in accumulated other comprehensive income (loss) for 2015 related to these assets. |
F-60
Table of Contents
| 2014 (Dollars in thousands) |
Level 1 | Level 2 | Level 3 | Total | ||||||||||||
| Assets |
||||||||||||||||
| Available-for-sale investment securities (1) |
$ | — | $ | 27,900 | $ | — | $ | 27,900 | ||||||||
| (1) | Total unrealized gains of $659, net of tax were included in accumulated other comprehensive income (loss) for 2014 related to these assets. |
The following tables present the Bank’s fair value hierarchy for those assets and liabilities measured at fair value on a non-recurring basis as of December 31, 2015 and 2014.
| 2015 (Dollars in thousands) |
Level 1 | Level 2 | Level 3 | Total | ||||||||||||
| Assets (1) |
||||||||||||||||
| Impaired loans |
$ | — | $ | — | $ | 24,856 | $ | 24,856 | ||||||||
| Repossessed loan collateral |
1,048 | 1,048 | ||||||||||||||
| Other receivables |
6,637 | 6,637 | ||||||||||||||
|
|
|
|
|
|
|
|
|
|||||||||
| Total |
$ | — | $ | — | $ | 32,541 | $ | 32,541 | ||||||||
|
|
|
|
|
|
|
|
|
|||||||||
| (1) | Total unrealized losses of $499 for impaired loans, $0 for repossessed loan collateral, and $1,150 for other receivables were included in income for 2015 related to these assets. |
| 2014 (Dollars in thousands) |
Level 1 | Level 2 | Level 3 | Total | ||||||||||||
| Assets (1) |
||||||||||||||||
| Impaired loans |
$ | — | $ | — | $ | 3,415 | $ | 3,415 | ||||||||
| Repossessed loan collateral |
1,203 | 1,203 | ||||||||||||||
| Other receivables |
7,449 | 7,449 | ||||||||||||||
|
|
|
|
|
|
|
|
|
|||||||||
| Total |
$ | — | $ | — | $ | 12,067 | $ | 12,067 | ||||||||
|
|
|
|
|
|
|
|
|
|||||||||
| (1) | Total unrealized losses of $87 for impaired loans, $0 for repossessed loan collateral, and $0 for other receivables were included in income for 2014 related to these assets. |
F-61
Table of Contents
13. Small Business Lending Fund Program (SBLF) and Troubled Assets Relief Program (TARP)
On February 27, 2009 and December 22, 2009, Medallion Bank issued, and the US Treasury purchased under the TARP Capital Purchase Program (the CPP) Medallion Bank’s fixed rate non-cumulative Perpetual Preferred Stock, Series A, B, C, and D for an aggregate purchase price of $21,498,000 in cash. On July 21, 2011, Medallion Bank issued, and the US Treasury purchased 26,303 shares of Senior Non-Cumulative Perpetual Preferred Stock, Series E (Series E) for an aggregate purchase price of $26,303,000 under the SBLF. The SBLF is a voluntary program intended to encourage small business lending by providing capital to qualified smaller banks at favorable rates. In connection with the issuance of the Series E, the Bank exited the CPP by redeeming the Series A, B, C, and D; and received approximately $4,000,000, net of dividends due on the repaid securities. The Bank pays an initial dividend rate of 1% on the Series E. Beginning in the first quarter of 2016, the Bank will pay a dividend rate of 9%.
14. Subsequent Events
We have evaluated subsequent events that have occurred through March 7, 2016, the date of financial statement issuance.
F-62