Attached files
| file | filename |
|---|---|
| EX-32.1 - EXHIBIT 32.1 01302016 - STAPLES INC | splsex321013016.htm |
| EX-32.2 - EXHIBIT 32.2 01302016 - STAPLES INC | splsex322013016.htm |
| EX-31.1 - EXHIBIT 31.1 01302016 - STAPLES INC | splsex311013016.htm |
| EX-23.1 - EXHIBIT 23.1 01302016 - STAPLES INC | splsex23101302016.htm |
| EX-31.2 - EXHIBIT 31.2 01302016 - STAPLES INC | splsex312013016.htm |
| EX-21.1 - EXHIBIT 21.1 01302016 - STAPLES INC | splsex21101302016.htm |
| EX-10.35 - EXHIBIT 10.35 01302016 - STAPLES INC | splsex103501302016.htm |
UNITED STATES
SECURITIES AND EXCHANGE COMMISSION
WASHINGTON, DC 20549
____________________________________________________________________________
FORM 10-K
____________________________________________________________________________
(Mark one) | ||
ý | ANNUAL REPORT PURSUANT TO SECTION 13 OR 15(d) OF THE SECURITIES EXCHANGE ACT OF 1934 | |
or | ||
o | TRANSITION REPORT PURSUANT TO SECTION 13 OR 15(d) OF THE SECURITIES EXCHANGE ACT OF 1934 | |
For the transition period from ____________________ to ____________________ | ||
For the fiscal year ended: January 30, 2016 | Commission File Number: 0-17586 | |
STAPLES, INC. (Exact name of registrant as specified in its charter) | ||

Delaware (State or other jurisdiction of incorporation or organization) | Five Hundred Staples Drive, Framingham, MA 01702 (Address of principal executive office and zip code) | 04-2896127 (I.R.S. Employer Identification No.) |
508-253-5000
(Registrant's telephone number, including area code)
Securities registered pursuant to Section 12(b) of the Act:
Title of each class | Name of each exchange on which registered | |
Common Stock, par value $0.0006 per share | The NASDAQ Global Select Market | |
Securities registered pursuant to Section 12(g) of the Act:
None
___________________________________________________________________________
Indicate by check mark if the registrant is a well-known seasoned issuer, as defined in Rule 405 of the Securities Act. Yes ý No o
Indicate by check mark if the registrant is not required to file reports pursuant to Section 13 or Section 15(d) of the Act. Yes o No ý
Indicate by check mark whether the registrant (1) has filed all reports required to be filed by Section 13 or 15(d) of the Securities Exchange Act of 1934 during the preceding 12 months (or for such shorter period that the registrant was required to file such reports), and (2) has been subject to such filing requirements for the past 90 days. Yes ý No o
Indicate by check mark whether the registrant has submitted electronically and posted on its corporate Web site, if any, every Interactive Data File required to be submitted and posted pursuant to Rule 405 of Regulation S-T (§ 232.405 of this chapter) during the preceding 12 months (or for such shorter period that the registrant was required to submit and post such files). Yes ý No o
Indicate by check mark if disclosure of delinquent filers pursuant to Item 405 of Regulation S-K is not contained herein, and will not be contained, to the best of the registrant's knowledge, in definitive proxy or information statements incorporated by reference in Part III of this Form 10-K or any amendment to this Form 10-K. o
Indicate by check mark whether the registrant is a large accelerated filer, an accelerated filer, a non-accelerated filer, or a smaller reporting company. See the definitions of "large accelerated filer," "accelerated filer," and "smaller reporting company" in Rule 12b-2 of the Exchange Act.
Large accelerated filer ý | Accelerated filer o | Non-accelerated filer o (Do not check if a smaller reporting company) | Smaller reporting company o | |||
Indicate by check mark whether the registrant is a shell company (as defined in Rule 12b-2 of the Exchange Act). Yes o No ý
The aggregate market value of common stock held by non-affiliates of the registrant, based on the last sale price of Staples' common stock on July 31, 2015, as reported by NASDAQ, was approximately $9.4 billion. In determining the market value of non-affiliate voting stock, shares of Staples' common stock beneficially owned by each executive officer and director have been excluded. This determination of affiliate status is not necessarily a conclusive determination for other purposes.
The registrant had 645,757,022 shares of common stock, par value $0.0006, outstanding as of March 2, 2016.
Documents Incorporated By Reference
Listed below is the document incorporated by reference and the part of the Form 10-K into which the document is incorporated:
Portions of the Proxy Statement for the 2016 Annual Meeting of Stockholders | Part III | |||
PART I
Item 1. Business
Staples, Inc. and its subsidiaries (''we'', ''Staples'' or the ''Company'') is a world-class provider of products and services that serve the needs of business customers and consumers. We are committed to providing superior value to our customers through a broad selection of products, easy to use websites and mobile platforms, an integrated retail and online shopping experience and a wide range of copy and print and technology services. We pioneered the office products superstore concept by opening the first office products superstore in Brighton, Massachusetts in 1986 to serve the needs of small businesses, and we currently serve businesses of all sizes and consumers in North America, Europe, Australia, South America and Asia. Our delivery businesses account for a majority of our sales and many of our delivery customers place their orders online, making Staples one of the largest internet resellers in the world. We operate three business segments: North American Stores & Online, North American Commercial and International Operations. Additional information regarding our operating segments is presented in Management's Discussion and Analysis of Financial Condition and Results of Operations contained in this Annual Report on Form 10-K, and financial information regarding these segments, and regarding geographic areas, is provided in Note P - Segment Reporting in the Notes to the Consolidated Financial Statements contained in this Annual Report on Form 10-K.
Strategy
Our vision is we help businesses succeed. This reflects a multi-year effort to evolve our business to become the product and service destination for businesses in a rapidly evolving and competitive marketplace. We view the industry in which we sell our products and services as large, fragmented, and diversified. We reach our customers through contract, online, and retail sales channels. Our retail stores primarily target small businesses, home offices and consumers. Our public websites primarily target small businesses and organizations with up to 20 office workers. Our contract businesses primarily serve mid-size businesses and organizations with 20 to 500 office workers, as well as larger regional customers and Fortune 1000 companies. Our ability to address our customers' needs expands our market opportunities and increases awareness of the Staples brand. Serving customers in a global business allows us to benefit from a number of important economies of scale, such as enhanced efficiencies in purchasing, distribution, advertising, and general and administrative expenses.
Our top priority is to continue to improve the service and value we offer customers in a highly competitive industry. We will focus on building scale and credibility in categories beyond office supplies, including facilities supplies and breakroom supplies, mail and ship supplies and services; increasing mid-market penetration; improving traffic in stores and online; and improving the productivity and efficiency of our store network. Additionally, we are engaged in an ongoing effort to change the way we work and aggressively reduce costs in areas like supply chain, merchandising, store operations and real estate, marketing, salesforce, business process and IT outsourcing, and customer service.
Acquisition of Office Depot
On February 4, 2015, we announced that we had entered into a definitive agreement to acquire Office Depot, Inc. The acquisition will better position us to serve the changing needs of customers and compete more effectively against a large and diverse set of competitors. On December 7, 2015, the United States Federal Trade Commission filed an administrative complaint charging that the proposed acquisition would violate antitrust laws, and authorized its staff to seek in federal court a temporary restraining order and a preliminary injunction to prevent Staples and Office Depot from consummating the merger. Also on December 7, 2015, the Canadian Competition Bureau filed an application to block the transaction with the Canadian Competition Tribunal. On February 2, 2016, Office Depot and Staples each agreed to waive, until May 16, 2016, its respective rights to terminate the definitive agreement due to a failure to complete the merger by February 4, 2016 or a legal restraint under antitrust laws. The extension allows for the expected completion of the ongoing federal court litigation with the Federal Trade Commission.
On February 10, 2016, we announced that we had received approval from European Union regulatory authorities to acquire Office Depot, on the condition that we divest Office Depot’s European contract business and all of Office Depot’s operations in Sweden. We intend to meet these conditions, and to also divest of Office Depot’s retail, catalog and online operations in Europe. The divestitures are subject to the closing of the acquisition. We have also received regulatory clearances in Australia, New Zealand and China.
On February 16, 2016, Staples and Office Depot announced they had entered into an agreement to sell customer contracts representing more than $550 million of revenue and related assets to Essendant Inc., for a purchase price of approximately $22.5 million. The revenue related to the divested contracts comes primarily from large corporate customers. The divestiture is subject to the closing of the Office Depot acquisition, as well as other customary closing conditions.
1
North American Stores & Online
Our North American Stores & Online segment includes the company's retail stores and Staples.com businesses in the U.S. and Canada. Our strategy for North American Stores & Online focuses on offering easy-to-shop stores and websites with products that are readily available and easy to find, and courteous, helpful and knowledgeable sales associates to support customers. Our goals are to continue to be a destination for core office supply categories like ink, toner and paper and to build scale and creditability for products and services beyond office supplies, such as copy and print services, facilities and breakroom supplies, packaging and shipping supplies and services. Our associates are trained to deliver excellent service by engaging with customers, focusing on solution selling, and encouraging customers to shop across channels.
We operate a portfolio of retail store formats, tailored to the unique characteristics of each location. Our North American Stores & Online segment consisted of 1,302 stores in the United States and 305 stores in Canada at the end of fiscal 2015. In an effort to improve store productivity and effectively manage our cost structure, we closed 242 stores in 2014 and 2015 combined, and we expect to close approximately 50 additional stores in 2016. In 2016 we also plan to continue reducing excess capacity in our retail store network through downsizes and relocations. We remain committed to improving store productivity and aggressively managing retail store expenses.
Staples.com and Staples.ca are designed to reach a variety of customers, including small businesses, home offices and consumers, offering next business day delivery for most orders in the majority of our markets. We have recently made significant investments in talent, technology, pricing, and marketing while significantly expanding our assortment to enhance the customer experience online. We have successfully launched new desktop and mobile platforms, improved site speed, enhanced usability, and increased customer conversion.
We believe that our integrated network of stores and online businesses provide a differentiated experience for our customers. We have increased our focus on maximizing the synergies between Staples.com and our retail stores with the introduction of new omni-channel capabilities including in store kiosks and buy online pickup in store. We have also recently announced a ship from store offering. These new capabilities offer customers a more seamless shopping experience, regardless of whether they physically visit our retail stores or our websites.
North American Commercial
Our North American Commercial segment consists of the U.S. and Canadian businesses, including Staples Advantage and Quill.com, that sell and deliver products and services directly to businesses. Our strategies for North American Commercial focus on expanding our offering in categories beyond office supplies, increasing our share of wallet with existing customers, and acquiring new customers, with a particular focus on small and mid-sized businesses. We are also focused on serving our customers by evolving our team-based contract selling model to be more unified and collaborative. We are driving growth in categories beyond core office supplies by adding specialists who have expertise in selling products like facilities and breakroom supplies, furniture, promotional products and technology.
Our Staples Advantage contract business focuses on serving the needs of mid-sized businesses and organizations as well as larger regional businesses and Fortune 1000 companies. We offer full service account management, free delivery, customized pricing and payment terms, usage reporting, the stocking of certain proprietary items and a wide assortment of environmentally friendly products and services.
Quill.com is an internet and catalog business with a targeted approach to serving the needs of small and mid-sized businesses in the United States. Quill.com has rapidly expanded its assortment in categories beyond office supplies to serve the evolving needs of its customers. To attract and retain its customers, Quill.com seeks to offer outstanding customer service, and builds loyalty through its Quill brand products and special services. Quill.com also offers a specialized assortment of office supplies and products for health care professionals. Quill.com is viewed separately from our Staples.com business in that its customer base is somewhat different and it targets exclusively the business customer.
International Operations
Our International Operations segment consists of businesses in 23 countries in Europe, Australia, South America and Asia. The markets for office products and services in these countries are highly fragmented.
2
Our European Office Products businesses represent a multi-channel portfolio serving contract, retail, internet, and catalog customers in 16 countries. Our contract business includes sizable operations in Scandinavia, Germany, the United Kingdom and the Netherlands. We operate 278 retail stores in Europe, with the largest concentration of stores in the United Kingdom, Germany, the Netherlands and Portugal. We operate internet and direct mail catalog businesses with a significant concentration of sales in France, Italy and the United Kingdom.
Our strategies for our European Office Products businesses focus on expanding our assortment beyond office supplies and increasing our mix of business services with a focus on copy and print, streamlining our information technology systems, further developing our ecommerce platform, and leveraging best practices from our North American businesses, including our mid-market contract selling model. We are also focused on improving profitability by consolidating sub-scale businesses, streamlining operations to improve efficiencies, increasing sales of higher margin Staples brand products and improving the performance of our supply chain.
Staples Australia serves primarily contract and government customers in Australia and New Zealand. In addition, we operate a public website which targets small business and home office customers. Our strategies focus on improving sales force productivity by increasing customer acquisition and retention, and by providing customers with a broad assortment of products and services, including office products, facility and breakroom supplies, technology, business furniture and print management.
We continue to build a foundation for growth in Asia and South America. We operate delivery businesses in China, Argentina, Taiwan and Brazil.
Merchandising and Marketing
We sell a wide variety of office supplies, business technology products, facilities supplies and breakroom supplies, computers and mobility products, copy and print services, and office furniture. Our merchandising team constantly reviews and updates our product assortment to respond to changing customer needs and to maximize the performance of our key categories. Ink and toner remain important categories, and we offer our customers a wide assortment of these products at competitive prices which are supported by our loyalty programs. One of our top priorities is to continue to expand our product offering beyond office supplies. Over the past few years we have had success driving growth in adjacent product categories, such as facilities supplies and breakroom supplies. These positive results have reinforced our strategy and we continue to broaden our offering.
Our merchandising team uses integrated systems to perform the vast majority of our merchandise planning and product purchasing centrally. Some of our business units, particularly Quill.com, our Canadian operations and our international businesses, leverage our global buying and merchandising staff along with local staff to meet their specific buying and merchandising needs. We purchase products from thousands of vendors around the world and we believe that competitive sources of supply are available to us for substantially all of the products we carry.
Our product offering includes Staples, Quill, and other proprietary branded products, which represented approximately
28% of our sales in 2015. We offer more than 10,000 own brand products and services, including an assortment of products with various environmentally friendly attributes, which includes our “Sustainable Earth” brand products. Own brand products deliver value to our customers with prices that are on average are at least 10% lower than the national brand, while generating higher gross margin rates on average than national brands. Our own brand strategy is based on offering a portfolio of products that meet our customers’ needs across a variety of product categories and price points. The largest portion of our portfolio focuses on offering national brand quality at lower prices. We have developed a selection of opening price point products for more price conscious customers. We have also developed a number of unique and innovative own brand products to help differentiate Staples in the marketplace. Our sourcing office in Shenzhen, China supports our own brand strategy by driving higher quality and lower costs, and by bringing new products to market more quickly. In addition to our proprietary branded products, we also differentiate our core product offering through exclusive third-party relationships.
In addition to products, we also offer a broad array of services, which represented 9.5% of our sales in 2015. This includes copy and print services that we provide to our retail and delivery customers, as well as technology services that we provide through our “EasyTech” business in North American Stores & Online. As with the markets for our products, the market for these services is highly fragmented, and we believe we have a significant opportunity to offer these services to existing customers and acquire new customers.
See Note P - Segment Reporting in the Notes to the Consolidated Financial Statements for a summary of our sales by each major category.
3
Our "Make More Happen" brand campaign utilizes a variety of marketing vehicles to drive brand awareness and sales of products and services to new and existing customers. These vehicles include television, radio, newspaper circulars and internet advertising, including mobile applications and social media. Increasing our presence in social media is important as this is a new and growing way for Staples to interact with and serve our customers. We also utilize e-mail marketing, loyalty programs and sophisticated direct and digital marketing capabilities. In addition, we market to larger customers through a field sales force. We change the level of marketing spend, as well as the mix of media employed, depending upon market, customer value, seasonal focus, and cost factors. This flexible approach helps us to optimize the effectiveness and efficiency of our marketing expenditures. We continue to improve our systems and capabilities to track our customers' multi-channel purchasing behaviors, execute more effective personalized and dynamic offers, and promote enhanced direct marketing and customer loyalty programs to drive higher sales across all our channels.
Supply Chain
We operate two networks to fulfill the majority of our replenishment and delivery needs in North America. Our network of 61 delivery fulfillment centers supports our North American Commercial and Staples.com operations. We currently fulfill the majority of customers’ orders through this distribution network. As we expand our assortment, we are increasingly relying on third parties to fulfill orders and deliver products directly to our customers. We operate a separate network of four large distribution centers to support our U.S. retail store operations. Our retail distribution centers provide us with significant labor and merchandise cost savings by centralizing receiving and handling functions, and by enabling us to purchase in full truckloads and other economically efficient quantities from suppliers. Our centralized purchasing and distribution systems enable our store associates to spend more time on customer service and store presentation. Since our distribution centers maintain backup inventory, our in-store inventory requirements are reduced, allowing us to more efficiently operate our retail stores.
In Europe, we are in the process of reducing the complexity and redundancy of our distribution network. We are standardizing all of our supply chain processes and systems architecture, and continuing to consolidate facilities. These efforts are expected to improve customer service and quality, drive cost savings and increase overall operating efficiency.
Competition
We compete with a variety of online and traditional retailers, dealers and distributors. As we rapidly expand our assortment of products and services, we compete directly with an increasing number of competitors including online retailers such as Amazon.com, mass merchants such as Walmart, Target and Tesco, warehouse clubs such as Costco, computer and electronics retail stores such as Best Buy, specialty technology stores such as Apple, copy and print businesses such as FedEx Office, and a wide range of other retailers, including grocery stores, drug stores and discount retailers. In addition, our retail stores continue to compete against traditional office supplies retail stores. Our commercial business competes against a growing and diverse set of competitors, including other office supplies distributors, wholesalers, networks of regional suppliers, managed print service companies, contract stationers, electronic commerce distributors, regional and local dealers, direct manufacturers of the products we distribute, and companies focused on adjacent categories such as maintenance, repair and operation providers. Many of our competitors have increased their presence in our core product areas in recent years, and we expect this trend to continue going forward.
We believe we are able to compete favorably against our competitors because of the following factors: our focus on business customers; our management team's ability to respond to the dynamic markets in which we operate and the changing needs of our customers; courteous, helpful and knowledgeable associates focused on making shopping easy for customers; a wide assortment of products and services, in stores and on our websites; fast checkout; easy to use websites and mobile platforms; reliability and speed of order shipment; convenient store locations; hassle-free returns and competitive prices.
Trademarks, Patents, Copyrights and Domain Names
We own or have applied to register numerous trademarks and service marks in the United States and throughout the world in connection with our businesses. Some of our principal global and regional marks include Staples, the Staples red brick logo, "Make More Happen", Staples the Office Superstore, the Easy Button logo, ''that was easy," Quill.com, Corporate Express and many other marks incorporating ''Staples" or another primary mark, which in the aggregate we consider to be of material importance to our business. While the duration of trademark registrations varies from country to country, trademarks are generally valid and may be renewed indefinitely so long as they are in use and their registrations are properly maintained.
We own and maintain a number of products, systems, business processes and designs, many of which have been patented. We also own copyrights for works such as packaging, training materials, promotional materials, computer software, in-store graphics, website content and multi-media. In addition, we have registered and maintain numerous internet domain names, including many that incorporate "Staples."
4
Available Information
We maintain a web site with the address www.staples.com. We are not including the information contained on our web site as a part of, or incorporating it by reference into, this Annual Report on Form 10-K. We make available free of charge through our web site our Annual Reports on Form 10-K, Quarterly Reports on Form 10-Q and Current Reports on Form 8-K and amendments to these reports, as soon as reasonably practicable after we electronically file such material with, or furnish such material to, the Securities and Exchange Commission ("SEC").
We were organized in 1985 and are incorporated in Delaware. As of January 30, 2016, Staples employed 42,554 full-time and 32,817 part-time associates.
EXECUTIVE OFFICERS OF THE REGISTRANT
Our executive officers, their respective ages and positions as of March 4, 2016 and a description of their business experience are set forth below. There are no family relationships among any of our executive officers and directors.
Mark Conte, age 50
Mr. Conte has served as Staples’ Senior Vice President and Corporate Controller since June 15, 2015. Prior to joining Staples, Mr. Conte served as Chief Financial Officer of Hanson Building Products Limited, a multinational manufacturer of concrete pipe, pressure pipe and light building products, and also served as its Principal Accounting Officer. Mr. Conte served as Corporate Controller and Chief Accounting Officer of Lehigh Hanson North America - HeidelbergCement Group which had acquired Hanson. Mr. Conte joined Hanson North America - Hanson PLC in July 2000 as the Corporate Controller, and in 2007 he assumed responsibility of the Operations Controller for the Materials business. Prior to joining Hanson, he spent over eleven years in public accounting, including working for Ernst & Young LLP.
Joseph G. Doody, age 63
Mr. Doody has served as Vice Chairman since February 2014. Prior to that he served as President—North American Commercial from January 2013 to January 2014. Previously, Mr. Doody served as President—Staples North American Delivery since March 2002. Prior to that, he served as President—Staples Contract & Commercial from November 1998, when he first joined Staples.
Shira Goodman, age 54
Ms. Goodman has served as President, North American Operations since January 2016. Previously, she served as President, North American Commercial since February 2014, Executive Vice President of Global Growth since February 2012, Executive Vice President of Human Resources since March 2009, and Executive Vice President of Marketing since May 2001. Prior to that, she served in various capacities since joining Staples in 1992, including Senior Vice President of Staples Direct, Senior Vice President of Brand Marketing, and Vice President of Contract & Commercial.
Christine T. Komola, age 48
Ms. Komola has served as Executive Vice President and Chief Financial Officer since March 2013. Prior to that she served as Senior Vice President and Chief Financial Officer from February 2012 to March 2013. Prior to that, she served as the Senior Vice President and Corporate Controller from July 2004 to January 2012. She also served as the Senior Vice President, General Merchandise Manager for furniture from January 2002 to July 2004. She has also held other roles within Staples since joining in April 1997, including Assistant Controller, Vice President of Planning, Margin and Control and Chief Financial Officer of Staples.com.
Ronald L. Sargent, age 60
Mr. Sargent has served as Chairman since March 2005, as Chief Executive Officer since February 2002 and as a Director since 1999. Prior to that, he served in various capacities since joining Staples in March 1989, including President from November 1998 to January 2006, Chief Operating Officer from November 1998 to February 2002, President—North American Operations from October 1997 to November 1998, and President—Staples Contract & Commercial from June 1994 to October 1997.
Michael Williams, age 62
Mr. Williams has served as Executive Vice President, General Counsel and Secretary since December 2014 and previously as Senior Vice President, General Counsel and Secretary since November 2012. Prior to joining Staples, Mr. Williams served as Executive Vice President, General Counsel and Secretary of Sony Electronics, Inc., a consumer electronics company, from March
5
2004 to October 2012 with responsibility for legal operations of several professional and consumer electronics companies in the U.S., Central America and South America. Before joining Sony, Mr. Williams was a partner at the law firms of Heller Ehrmann LLP from April 1998 to March 2004 and Andrews Kurth LLP from February 1991 to April 1998. Mr. Williams also served as an infantry officer in the U.S. Marine Corps.
John Wilson, age 55
Mr. Wilson has served as President, International Operations and Head of Global Transformation since January 2016 and previously as President, Staples Europe since September 2012. Prior to joining Staples, Mr. Wilson served as President and General Partner of Hyannis Port Capital from 2001 to 2011. Before founding Hyannis Port Capital, he held several other executive positions, including Chief Operating Officer and Executive Vice President of Gap, Inc., Chief Financial Officer and Executive Vice President of Staples, Inc., Senior Vice President of Northwest Airlines, and Vice President/Partner at Bain & Company.
FORWARD-LOOKING STATEMENTS
This Annual Report on Form 10-K and, in particular, the description of our Business set forth in Item 1 and our Management's Discussion and Analysis of Financial Condition and Results of Operations set forth in Appendix B ("MD&A") contain or incorporate a number of forward-looking statements within the meaning of Section 27A of the Securities Act of 1933 and Section 21E of the Securities Exchange Act of 1934 ("the Exchange Act").
Any statements contained in or incorporated by reference into this report that are not statements of historical fact should be considered forward-looking statements. You can identify these forward-looking statements by use of the words like "believes," "expects," "anticipates," "plans," "may," "will," "would," "intends," "estimates" and other similar expressions, whether in the negative or affirmative. These forward-looking statements are based on current expectations, estimates, forecasts and projections about the industry and markets in which we operate and management's beliefs and assumptions and should be read in conjunction with our MD&A, our consolidated financial statements and notes to consolidated financial statements included in Appendix C. We cannot guarantee that we actually will achieve the plans, intentions or expectations disclosed in the forward-looking statements made. There are a number of important risks and uncertainties that could cause our actual results to differ materially from those indicated by such forward-looking statements. These risks and uncertainties include, without limitation, those set forth below under the heading "Risk Factors" as well as risks that emerge from time to time that are not possible for us to predict. Forward-looking statements, like all statements in this report, speak only as of the date of this report (unless another date is indicated). We disclaim any obligation to update publicly any forward-looking statements whether as a result of new information, future events or otherwise.
Item 1A. Risk Factors
Risks Related to the Acquisition of Office Depot
Completion of the merger is subject to conditions and if these conditions are not satisfied or waived, the merger will not be completed.
On February 4, 2015, we entered into a definitive agreement to acquire Office Depot, a global supplier of office products, services and solutions for the workplace. On December 7, 2015, the Federal Trade Commission and Canadian Commissioner of Competition each filed lawsuits against us and Office Depot, seeking to block the proposed merger. On February 2, 2016, each company agreed to waive, until May 16, 2016, its respective rights to terminate the merger agreement due to a failure to complete the merger by February 4, 2016 or a legal restraint under antitrust laws.
Our obligations to complete the merger are subject to the satisfaction or waiver of certain conditions, including without limitation the expiration or earlier termination of any waiting period (and any extension thereof), and receipt of any approvals, consents or clearances under the HSR Act and other specified antitrust laws. The failure to satisfy all of the required conditions, including as a result of the antitrust lawsuits, could delay the completion of the merger for a significant period of time or prevent it from occurring. Any delay in completing the merger could cause us to not realize some or all of the benefits that we expect to achieve if the merger is successfully completed within its expected timeframe.
If we are unable to complete the proposed acquisition, we will have incurred substantial expenses and diverted significant management time and resources from our ongoing business. In addition, we would be required to pay Office Depot a termination fee of $250 million under certain circumstances, including if the Merger Agreement is terminated as a result of the antitrust closing conditions (as set forth in the Merger Agreement) not being satisfied on or before May 16, 2016.
6
There can be no assurance that the conditions to the closing of the merger will be satisfied or waived or that the merger will be completed.
Combining the two companies may be more difficult, costly or time consuming than expected and the anticipated benefits and cost savings of the merger may not be realized.
We are operating and, until the completion of the merger, will continue to operate, independently of Office Depot. The success of the merger, including anticipated benefits and cost savings, will depend, in part, on our ability to successfully combine and integrate the businesses. It is possible that the pendency of the merger and/or the integration process could result in the loss of key employees, higher than expected costs, diversion of management attention, the disruption of our ongoing businesses or inconsistencies in standards, controls, procedures and policies that adversely affect the combined company’s ability to maintain relationships with customers, vendors and employees or to achieve the anticipated benefits and cost savings of the merger.
We will incur transaction fees, including legal, regulatory and other costs associated with closing the transaction, as well as expenses related to formulating and implementing integration plans, including facilities and systems consolidation costs and employment-related costs. We continue to assess the magnitude of these costs, and additional unanticipated costs may be incurred in the merger and the integration of the two companies’ businesses. Although we expect that the elimination of duplicative costs, as well as the realization of other efficiencies related to the integration of the businesses, should allow us to offset integration-related costs over time, this net benefit may not be achieved in the near term, or at all. If we experience difficulties with the integration process, the anticipated benefits of the merger may not be realized fully or at all, or may take longer to realize than expected. The actual cost savings of the merger could be less than anticipated.
As part of the integration process we may also attempt to divest certain assets of the combined company, which may not be possible on favorable terms, or at all, or if successful, may change the profile of the combined company. The European Commission approved the merger on the condition that Staples divest Office Depot’s European contract business and all of Office Depot’s operations in Sweden. Staples and Office Depot have announced that they will also divest Office Depot’s retail, online and catalog operations in Europe in connection with closing the transaction. In addition, Staples and Office Depot have announced an agreement to sell more than $550 million of office products revenue and related assets to Essendant in connection with closing the transaction. We may be subject to additional remedies, such as restrictions on our operations and the divestiture of additional assets, in connection with seeking antitrust clearance for the merger.
We will incur significant indebtedness in connection with the merger, which could reduce our flexibility to operate our business and increase our interest expense.
In connection with the planned acquisition, we have obtained financing commitments from Bank of America, N.A. and Merrill, Lynch, Pierce, Fenner & Smith Incorporated ("Bank of America Merrill Lynch") and Barclays Bank PLC ("Barclays") and other banks and investors for a 5-year $3 billion asset-based revolving credit facility (the “ABL Facility”) and for a 6-year $2.5 billion term loan (the “Term Loan”). In February 2016, we drew the proceeds of the Term Loan and placed them in escrow with JPMorgan Chase Bank, N.A. The proceeds of the Term Loan will be released from escrow to the Company if certain conditions are satisfied, including consummation of the merger, or repaid to the lenders together with accrued interest and fees if the conditions are not met by September 10, 2016 (subject to extension to November 10, 2016 under certain antitrust-related circumstances). We also extended the commitment period for the ABL Facility. Pursuant to the amended and restated debt commitment letter, the extended commitments will expire on May 10, 2016 unless, prior to 5:00 p.m. on such date, the Federal Trade Commission agrees, or a court of competent jurisdiction determines, that the merger is permitted to proceed in accordance with the merger agreement, in which case the commitments will be extended to September 10, 2016.
This indebtedness could have the effect, among other things, of reducing our flexibility to respond to changing business and economic conditions, and increasing interest expense. We will also incur various costs and expenses associated with our indebtedness. The amount of cash required to pay interest on our increased indebtedness levels following completion of the merger, and thus the demands on our cash resources, will be greater than the amount of cash flows required to service our indebtedness prior to the transaction. The increased levels of indebtedness following completion of the merger could also reduce funds available for working capital, capital expenditures, acquisitions and other general corporate purposes and may create competitive disadvantages relative to other companies with lower debt levels. If we do not achieve the expected benefits and cost savings from the merger, or if the financial performance of the combined company does not meet current expectations, then our ability to service our indebtedness may be adversely impacted.
In addition, our credit ratings affect the cost and availability of future borrowings and, accordingly, our cost of capital. Our ratings reflect each rating organization’s opinion of our financial strength, operating performance and ability to meet our debt obligations. In connection with the debt financing, we have sought ratings of our indebtedness from certain nationally recognized statistical rating organizations. On April 6, 2015, Standard & Poor’s Rating Services announced that it had assigned Staples a BBB
7
rating on the term facility with a recovery rating of 1, and that it expects to lower Staples’ corporate credit rating from BBB- to BB+ with a stable outlook upon closing of the merger. On April 14, 2015, Moody’s Investor Service announced that it had assigned a Baa2 rating to the term facility, and noted that all ratings of Staples remain on review for downgrade. There can be no assurance that we will receive or maintain a particular credit rating.
Moreover, we may be required to raise substantial additional financing to fund working capital, capital expenditures, acquisitions or other general corporate requirements. Our ability to arrange additional financing or refinancing will depend on, among other factors, our financial position and performance, as well as prevailing market conditions and other factors beyond our control. There can be no assurance that we will be able to obtain additional financing or refinancing on terms acceptable to us or at all.
The agreements that govern the indebtedness incurred in connection with the merger contain various covenants that impose restrictions that may affect our ability to operate our businesses.
The agreements that govern the Term Loan, and that will govern the ABL Facility if we enter into it in connection with the merger, contain (or, in the case of the ABL Facility, are expected to contain) various affirmative and negative covenants that, subject to certain significant exceptions, restrict our ability to, among other things, incur indebtedness or guarantees; incur liens; make investments, loans and acquisitions; consolidate or merge; sell assets, including capital stock of our subsidiaries; pay dividends on capital stock or redeem, repurchase or retire capital stock; change lines of business; amend, prepay, redeem or purchase certain debt; engage in transactions with affiliates; and enter into agreements containing negative pledge clauses or clauses that limit subsidiary dividends and distributions. In addition, these agreements contain (or are expected to contain, as applicable) financial covenants that will require us to maintain certain financial ratios. Our ability to comply with these provisions may be affected by events beyond our control. Failure to comply with these covenants could result in an event of default, which, if not cured or waived, could accelerate our repayment obligations. In addition, the terms of the definitive agreements that govern the Term Loan, and that will govern the ABL Facility if we enter into it, restrict us from paying dividends in certain circumstances and otherwise in an amount in excess of $0.15 per share per quarter, subject to certain exceptions.
Sales of shares of our common stock before and after the completion of the proposed Office Depot merger may cause the market price of our common stock to fall.
As of February 21, 2015, we estimated that we would issue up to approximately 128 million shares of our common stock in connection with the proposed Office Depot merger, subject to adjustment based on the number of outstanding shares and equity awards of Office Depot at the time the merger is completed. The anticipated dilutive effect of the issuance of these new shares could negatively impact the market price for our common stock.
In addition, Office Depot stockholders may decide not to hold the shares of our common stock they receive in the proposed merger. Other Office Depot stockholders, such as funds with limitations on the amount of stock they are permitted to hold in individual issuers, may be required to sell the shares of our common stock that they receive in the proposed merger. Such sales of our common stock could result in higher than average trading volume following the closing of the transaction and may cause the market price for our common stock to decline.
Risks Related to the Business
If we fail to meet the changing needs of our customers our business and financial performance could be adversely affected.
We are currently engaged in a multi-year effort to evolve our business to meet the changing needs of our customers. One of our top priorities is to significantly expand our product and service offerings beyond traditional core office supplies, a category that is declining. Over the past few years we have had success driving growth in adjacent product categories, such as facilities supplies and breakroom supplies and service offerings, such as our copy and print services. We are also increasing coordination between our online business and our retail stores. Our success is dependent on providing our customers the selection of products, as well as services, at competitive prices that meet customers' changing needs and purchasing habits. If we misjudge either the demand for products and services we sell or our customers' purchasing habits and tastes, we may be faced with excess inventories of some products or missed opportunities for products and services we do not offer. Failure to provide the products and services preferred by our customers could have a material adverse effect on our revenue, results of operations and ability to attract and retain customers.
8
We face uncertainties transforming our business, and our inability to successfully implement our strategies could adversely affect our business and financial performance.
As part of our continuing efforts to transform our business, in 2014 we announced a plan to reduce costs by $500 million on an annualized basis by the end of 2015. We also announced a plan to close at least 225 of our retail stores in North America by the end of 2015, under which we closed 242 stores through the end of 2015 and which we extended to encompass an additional 50 closures in 2016. As a result of these initiatives, we recorded pre-tax charges of $245 million in fiscal 2014 and $170 million in fiscal 2015, and we expect to incur charges of approximately $40 million - $85 million in 2016 related to the additional store closures. Additional charges may be required as a result of implementing our plans or if we adopt new strategies for the future. The success of our plans and strategies is subject to both the risks affecting our business generally and the inherent difficulty associated with implementing our new strategies, and is also dependent on the skills, experience, and efforts of our management and other associates and our success with third parties. To the extent we pursue acquisitions or other operational and strategic opportunities, our success will depend on selecting the appropriate targets or partners, completing integration efforts quickly and effectively and realizing any expected synergies and cost savings. There is no assurance that we will be able to successfully implement our strategic initiatives or that the implementation of changes will result in the benefits or costs savings at the levels that we anticipate or at all, which may result in an adverse impact on our business and results of operations.
In the past we have recognized significant goodwill impairment charges and may be required to recognize additional goodwill impairment charges in the future.
As a result of challenging industry and operating pressures, we recorded significant goodwill impairment charges in fiscal 2014 related to our Australia and China reporting units. At January 30, 2016, we had $2.7 billion of goodwill on our balance sheet. Certain factors, including consumer and business spending levels, industry and macroeconomic conditions, the price of our stock and the future profitability of our businesses might have a negative impact on the carrying value of our goodwill. The process of testing goodwill for impairment involves numerous judgments, assumptions and estimates made by management which inherently reflect a high degree of uncertainty. If the business climate deteriorates, if our plans change or if we fail to manage our restructuring activities successfully, then actual results may not be consistent with these judgments, assumptions and estimates, and additional goodwill impairment charges may be required in future periods. This could have an adverse impact on our financial position and results of operations.
We operate in a highly competitive market and we may not be able to continue to compete successfully.
We compete with a variety of online and traditional retailers, dealers and distributors. Intense competitive pressures from one or more of our competitors could affect prices or demand for our products and services. If we are unable to appropriately respond to these competitive pressures, or offer the appropriate mix of products and services at competitive prices, our financial performance and market share could be adversely affected. As we rapidly expand our assortment of products and services, we compete directly with an increasing number of competitors including mass merchants such as Walmart, Target and Tesco, warehouse clubs such as Costco, computer and electronics retail stores such as Best Buy, specialty technology stores such as Apple, copy and print businesses such as FedEx Office, online retailers such as Amazon.com, and a wide range of other retailers, including grocery stores, drug stores and discount retailers. In addition, our retail stores continue to compete against traditional office supplies retail stores. Our commercial business competes against a growing and diverse set of competitors, including other office supplies distributors, wholesalers, networks of regional suppliers, managed print service companies, contract stationers, electronic commerce distributors, regional and local dealers, direct manufacturers of the products we distribute, and companies focused on adjacent categories such as maintenance, repair and operation providers. Many of our competitors have increased their presence in our historic core product areas in recent years, for example by expanding their assortment of office products and services, opening new stores near our existing stores, and offering direct delivery of office products, and we expect this trend to continue going forward. Some of our current and potential competitors are larger than we are, may have more experience in selling certain products or delivering services or may have substantially greater financial resources.
Global economic conditions could adversely affect our business and financial performance.
9
As a world-class provider of products and services that serve the needs of business customers and consumers in 25 countries, our operating results and performance depend significantly on worldwide economic conditions and their impact on business and consumer spending. Increases in the levels of unemployment, particularly white collar unemployment, energy and commodity costs, health care costs, higher interest rates and taxes, tighter credit markets, reduced consumer credit availability, fluctuation in the financial markets, lower consumer confidence, lack of small business formation and other factors could result in a decline in business and consumer spending. Our business and financial performance may continue to be adversely affected, and our ability to generate cash flow may be negatively impacted, by current and future economic conditions if there is a renewed decline in business and consumer spending or if such spending remains stagnant.
Our international operations expose us to risks inherent in foreign operations.
We currently operate in 24 countries outside the United States. In certain international market segments, we may not benefit from any first-to-market advantages or otherwise succeed. Cultural differences abroad and local practices of conducting business may conflict with our own business practices and ethics standards. Ensuring compliance with foreign and U.S. laws and our own policies may require that we implement new operational systems and financial controls, conduct audits or internal investigations, train our associates and third parties on our existing compliance methods, and take other actions, all of which may be expensive, divert management's time and impact our operations. There are also different employee/employer relationships and in some cases the existence of workers' councils that may delay or impact the implementation of some of these operational systems. In addition, differences in business practices in our international markets may cause customers to be less receptive to our business model than we expect.
Risks inherent in international operations also include, among others, the costs and difficulties of managing international operations, adverse tax consequences and greater difficulty in enforcing intellectual property rights. Other factors that may also have an adverse impact on our international operations include limitations on the repatriation and investment of funds, foreign currency exchange restrictions, complex import and export schemes, increased local competition, our lack of familiarity with local customer preferences, unfavorable foreign trade policies, unstable political or economic conditions, and geopolitical events, including war and terrorism.
Compromises of our information systems or unauthorized access to confidential information or personal information may materially harm our business or damage our reputation.
Through our sales and marketing activities and our business operations, we collect and store confidential information and certain personal information from our customers, end users of our services, vendors, business partners and associates. For example, we handle, collect and store personal information in connection with our customers purchasing products or services, enrolling in our promotional or rewards programs, registering on our web site or otherwise communicating or interacting with us. We also accept payments using a variety of methods, including debit and credit cards, gift cards, electronic transfer of funds, and others. We rely on third parties to provide payment processing services or make certain payments on our behalf. In addition, in the normal course of business, we gather and retain personal information about our associates and generate and have access to confidential business information. We may share confidential and personal information with vendors or other third parties in connection with processing of transactions, operating certain aspects of our business or for marketing purposes. Although we have taken steps designed to safeguard such information, there can be no assurance that such information will be protected against loss or unauthorized access, acquisition, use or disclosure. For example, computer hackers may penetrate our or our vendors' network security and, if successful, misappropriate such information or interfere with our ability to access such information. A Staples associate, contractor or other third-party with whom we do business may misuse confidential or personal information to which they have access; attempt to circumvent our security measures; or inadvertently cause a breach involving such information. Additionally, methods to obtain unauthorized access to confidential information change frequently and may be difficult to detect, which can impact our ability to respond appropriately. We could be subject to liability for failure to comply with privacy and information security laws, for failing to protect personal information, for failing to respond appropriately, or for misusing personal information, such as use of such information for an unauthorized marketing purpose. Loss, interference with our ability to access, unauthorized access to, or misuse of confidential or personal information could disrupt our operations, damage our reputation, and expose us to claims from customers, financial institutions, regulators, payment card associations, employees and other persons, any of which could have an adverse effect on our business, financial condition and results of operations.
We have investigated, with the assistance of outside experts, a data security incident involving unauthorized access into the computer systems of PNI Digital Media Ltd ("PNI"), a subsidiary we acquired in July 2014. PNI, which is based in Vancouver, British Columbia, provides a software platform that enables retailers to sell personalized products such as photo prints, photo books, calendars, business cards, stationery and other similar products. PNI’s customers include a number of major third party retailers, as well as our affiliates. The investigation determined that an unauthorized party entered PNI’s systems and was able to deploy on some of PNI’s servers supporting its customers, malware designed to capture data that end users input on the photosites.
10
Some of PNI's affected customers have notified certain of their users of a potential compromise of the users' payment card information and/or other personal information. PNI took prompt steps to contain the incident, including disabling the retailer photosites, or online payment transactions, for a period while the incident was being investigated, and to further enhance the security of its retailer customers' data. To date the Company has incurred incremental expenses of $18 million related to the incident. Additional losses and expenses relating to the incident are probable; however, at this stage, we do not have sufficient information to reasonably estimate such losses and expenses. The types of losses and expenses that may result from the incident include, without limitation: claims by PNI’s retailer customers, including indemnification claims for losses and damages incurred by them; claims by end-users of PNI’s services, including class action lawsuits that have been filed, and further class action lawsuits that may be filed, in Canada and the United States; investigations and claims by various regulatory authorities in Canada and the United States; the costs of completing our investigation of the incident; remediation costs; and legal fees. We will continue to evaluate information as it becomes known and will record an estimate for losses or expenses at the time or times when it is both probable that any loss has been incurred and the amount of such loss is reasonably estimable. Such losses may be material to our results of operations and financial condition. We maintain network-security insurance coverage, which we expect would help mitigate the financial impact of the incident. The incident has resulted in a loss of business for PNI and may result in further reputational and other harm to us going forward.
On December 19, 2014, we announced that the investigation into our previously announced data security incident had determined that malware deployed by criminals to some point of sale systems at 115 of our more than 1,400 U.S. retail stores may have allowed access to transaction data at those affected stores. As a result, cardholder names, payment card numbers, expiration dates, and card verification codes for approximately 1.16 million payment cards may have been affected. Upon detection, we immediately took action to eradicate the malware and commenced an investigation into the incident, working closely with payment card companies and law enforcement and with the assistance of outside data security experts. We also have taken steps to further enhance the security of our point of sale systems, including the use of new encryption tools. We continue to evaluate cybersecurity policies and practices to mitigate the risk of future incidents. Expenses incurred to date related to this incident have not been material. It is reasonably possible that we may incur additional expenses or losses in connection with the incident; however, at this time we are unable to reasonably estimate any such additional expenses or losses. In addition, we maintain network-security insurance coverage, which we expect would help mitigate any material financial impact.
Our effective tax rate may fluctuate.
We are a multi-national, multi-channel provider of products and services. As a result, our effective tax rate is derived from a combination of applicable tax rates in the various countries, states and other jurisdictions in which we operate. Our effective tax rate may be lower or higher than our tax rates have been in the past due to numerous factors, including the sources of our income, any agreements we may have with taxing authorities in various jurisdictions, changes in the laws and the tax filing positions we take in various jurisdictions. In addition, our effective tax rate may fluctuate quarterly, and the resulting tax rate may be negative or unusually high as a result of significant charges in a quarter that are not tax deductible, such as goodwill and long-lived asset impairment. We base our estimate of our effective tax rate at any given point in time upon a calculated mix of the tax rates applicable to our company and to estimates of the amount of business likely to be done in any given jurisdiction. The loss of one or more agreements with taxing jurisdictions, a change in the mix of our business from year to year and from country to country, changes in rules related to accounting for income taxes, adverse outcomes from tax audits that we may be subject to in any of the jurisdictions in which we operate, or changes in tax laws in any of the multiple jurisdictions in which we operate could result in an unfavorable change in our effective tax rate which could have an adverse effect on our business and results of operations.
Fluctuations in foreign exchange rates could lead to lower earnings.
Sales from our delivery operations and stores outside the U.S. are denominated in the currency of the country in which these operations or stores are located and changes in foreign exchange rates affect the translation of the sales and earnings of these businesses into U.S. dollars for financial reporting purposes. Additionally, merchandising agreements may also be denominated in the currency of the country where the vendor resides. Although we attempt to mitigate such risks by sometimes entering into foreign exchange hedges or utilizing risk management strategies, such hedges and strategies themselves present some risk and thus may not be entirely successful in mitigating the risk.
We may be unable to attract, train, engage and retain qualified associates.
Our customers across all channels value courteous and knowledgeable associates. Accordingly, our performance depends on attracting, training, engaging and retaining a large number of qualified associates. We face intense competition for qualified associates, particularly in tight labor markets in emerging markets or in specialized areas of technical expertise. Many of our associates, particularly in retail stores, are in entry-level or part-time positions with historically high rates of turnover. Our ability to meet our labor needs while controlling our labor costs is subject to numerous external factors, including the availability of a
11
sufficient number of qualified persons in the workforce, unemployment levels, prevailing wage rates, changing demographics, health and other insurance costs and the cost of compliance with labor and wage laws and regulations. We have experienced reductions in force in connection with our restructuring activity, which may lead to lower associate morale, gaps in experience and knowledge, and a higher likelihood that remaining associates terminate their employment. If we are unable to attract, train, engage and retain a sufficient number of qualified associates, our business and financial performance may be adversely affected.
Our quarterly operating results are subject to significant fluctuation.
Our operating results have fluctuated from quarter to quarter in the past, and we expect that they will continue to do so in the future. Historically, sales and profitability are generally stronger in the second half of our fiscal year than the first half of our fiscal year due in part to back-to-school, holiday and back-to-business seasons. Factors that could also cause these quarterly fluctuations include: the mix of products sold; pricing actions of competitors; the level of advertising and promotional expenses; the expense and outcome of legal proceedings; severe weather; consumer confidence; and the other risk factors described in this section. Most of our operating expenses, such as occupancy costs and associate salaries, do not vary directly with the amount of sales and are difficult to adjust in the short term. As a result, if sales in a particular quarter are below expectations, we may not proportionately reduce operating expenses for that quarter, and therefore such a sales shortfall may have a disproportionate effect on our net income for the quarter.
Our indebtedness could adversely affect us by reducing our flexibility to respond to changing business and economic conditions.
As of January 30, 2016, our consolidated outstanding debt was $1.0 billion and we also had $1.1 billion of additional borrowing capacity under our commercial paper program, revolving credit facility and other lines of credit. On February 2, 2016, in connection with our pending acquisition of Office Depot, we entered into a term loan agreement for $2.5 billion, the proceeds of which are currently held in escrow pending the closing of the acquisition, and an extension to a financing commitment for a $3 billion asset-based revolving credit facility. Our acquisition-related financing, or other substantial indebtedness we may incur in the future could reduce our ability to obtain additional financing for working capital, capital expenditures, acquisitions, and other general corporate purposes and could make us more vulnerable to economic downturns and economic pressures. Our level of indebtedness may also place us at a competitive disadvantage against less leveraged competitors. If we default or breach our obligations, we could be required to pay a higher rate of interest or lenders could require us to accelerate our repayment obligations. If we were to experience a credit rating downgrade in future periods, we may incur higher interest costs on future financings and it may limit our ability to participate in the commercial paper market.
Our expanded offering of proprietary branded products may not improve our financial performance and may expose us to intellectual property liability, product liability, import/export liability, government investigations and claims, and other risks associated with global sourcing.
Our product offering includes Staples, Quill and other proprietary branded products and services, which represented approximately 28% of our sales in fiscal 2015 and which typically generate higher margins than national brand products and services. Our proprietary branded products compete with other manufacturers' branded items that we offer. An increase in our proprietary branded products and services also exposes us to added risks that could increase the cost of doing business, such as third party intellectual property infringement, false advertising, and product liability claims against us with respect to such products and services; and import and export compliance issues. Furthermore, although we have implemented policies and procedures designed to facilitate compliance with laws and regulations relating to importing and exporting merchandise, there can be no assurance that contractors, agents, vendors, manufacturers or other third parties with whom we do business will not violate such laws and regulations or our policies, which could subject us to liability and could adversely affect our operations or operating results. We also have greater exposure and responsibility to the consumer for replacements as a result of product defects. If any of our customers are harmed by our proprietary branded products or services, they may bring product liability and other claims against us or we may have to issue voluntary or mandatory recalls.
The more proprietary branded products and services we offer, the more these risks increase. A loss of consumer acceptance of these products could also adversely affect our sales and gross margin rates. Any of these circumstances could damage our reputation and have an adverse effect on our business and financial performance.
Problems in our information systems and technologies may disrupt our operations.
We rely heavily on various information systems and technology to sell and deliver our products and services and operate our business, including systems to track inventory, to process and record transactions, to generate financial reports and to communicate with our associates, vendors and customers. As we continue to accelerate our growth online, our ability to attract
12
and retain customers, compete and operate effectively is dependent on a consistent, secure and easy to use technology infrastructure with uninterrupted availability and reliable back-up systems. Any disruption to the internet or our technology infrastructure, including a disruption or incident affecting our web sites and information systems, including without limitation a denial of service attack, may cause a decline in our customer satisfaction, jeopardize accurate financial reporting, impact our sales volumes or result in increased costs. Hardware, software or applications we develop or procure from third parties may contain defects in design or manufacture or other problems that could unexpectedly disrupt our operations or compromise our information security. Although we continue to invest in our technology, if we are unable to continually add software and hardware, effectively manage or upgrade our systems and network infrastructure, and develop effective system availability, disaster recovery plans and protection solutions, our business could be disrupted thus subjecting us to liability and potentially harming our reputation.
In addition, we periodically make modifications and upgrades to our information systems and technology. Some of our information systems are outsourced to third parties. Modifications involve replacing legacy systems with successor systems, making changes to legacy systems or acquiring new systems with new functionality. Although we make a diligent effort to ensure that all providers of outsourced services observe proper internal control practices and procedures, we cannot assure that failures will not occur. We are aware of inherent risks associated with replacing our systems, including accurately capturing data, system disruptions and outsourcing to third parties. Information technology system disruptions, if not anticipated and appropriately mitigated, could have a material adverse effect on our operations.
Our business may be adversely affected by the actions of and risks associated with third-parties.
The products we sell are sourced from a wide variety of third-party vendors and as we expand our assortment we rely on third parties to fulfill our customer orders and deliver products directly to our customers. In general, we do not have long-term contracts with our vendors or third parties committing them to provide products to us on acceptable terms. For example, we derive benefits from vendor allowances and promotional incentives which may not be offered in the future. We also cannot control the supply, design, function or cost of many of the products that we offer for sale. Some of the products we offer are supplied to us on an exclusive basis and may be difficult to replace in a timely manner. Additionally, third parties may not live up to the delivery promises they have made to our customers. Disruptions in the availability of products or services purchased through third parties, or quality issues that cause us to initiate voluntary or mandatory recalls for products we sell on an exclusive basis, may result in customer dissatisfaction, damage our reputation and adversely affect our sales.
Global sourcing of many of the products we sell is an important factor in our financial performance. Our ability to find qualified vendors and access products in a timely and efficient manner is a significant challenge, especially with respect to goods sourced outside the United States. Political instability, the financial instability of suppliers, trade restrictions, tariffs, foreign currency exchange rates, transport capacity and costs, inflation and other factors relating to foreign trade are beyond our control. We also rely upon many independent service providers for services that are important to many aspects of our business. If our service providers fail or are unable to perform as expected and we are unable to replace them quickly, our business could be harmed at least temporarily until we are able to do so and potentially, in some cases, permanently. These and other issues could adversely affect our reputation, business and financial performance.
Various legal proceedings may adversely affect our business and financial performance.
We are involved in various private legal proceedings, which include consumer, employment, intellectual property, commercial, tort and other litigation. We are subject to potentially increasing challenges by private litigants regarding compliance with local, state and national labor regulations, whether meritorious or not. In addition, companies have increasingly been subject to employment related class action litigation, and we have experienced “wage and hour” class action lawsuits. We expect that these trends will continue to affect us. We are also subject to claims that the technology we use or the products we sell infringe intellectual property rights of third parties. Such claims, whether meritorious or not, involve significant managerial resources and can become costly. Generally, we have indemnification protections in our agreements which our vendors or licensors often have honored; however, there are no assurances that such vendors or licensors will continue to do so in the future. We estimate exposure and establish reserves for our estimated significant liabilities, however, litigation is inherently unpredictable and the outcome of legal proceedings and other contingencies could be unexpected. Some verdicts or decisions may not be reasonable or based on law or prior precedent, in which case we will vigorously contest and appeal such decisions. Other outcomes may require us to pay substantial amounts of money or take actions that adversely affect our operations. In addition, defending against these claims may involve significant time and expense. Given the large size of our operations and workforce, the visibility of our brand and our position as an industry leader, we may regularly be involved in legal proceedings that could adversely affect our business and financial performance.
Failure to comply with laws, rules and regulations could negatively affect our business operations and financial performance.
13
Our business is subject to federal, state, local and international laws, rules and regulations, such as state and local wage and hour laws, the U.S. Foreign Corrupt Practices Act, the False Claims Act, the Employee Retirement Income Security Act (“ERISA”), securities laws, import and export laws (including customs regulations), privacy and information security regulations, unclaimed property laws, and many others. The complexity of the regulatory environment in which we operate and the related cost of compliance are both increasing due to legal and regulatory requirements, increased enforcement and our ongoing expansion into new markets and new channels. In addition, as a result of operating in multiple countries, we must comply with multiple foreign laws and regulations that may differ substantially from country to country and may conflict with corresponding U.S. laws and regulations. We may also be subject to investigations or audits by governmental authorities and regulatory agencies, which can occur in the ordinary course of business or which can result from increased scrutiny from a particular agency towards an industry, country or practice. If we fail to comply with laws, rules and regulations or the manner in which they are interpreted or applied, we may be subject to government enforcement action, class action litigation or other litigation, damage to our reputation, civil and criminal liability, damages, fines and penalties, and increased cost of regulatory compliance, any of which could adversely affect our results of operations and financial performance.
Item 1B. Unresolved Staff Comments
None.
Item 2. Properties
As of January 30, 2016, we operated a total of 1,907 retail stores in 46 states and the District of Columbia in the United States, 10 provinces and 2 territories in Canada, and in Finland, Germany, the Netherlands, Norway, Portugal, Sweden, the United Kingdom, Argentina, Australia and Brazil. As of that same date, we also operated 104 distribution and fulfillment centers in 28 states in the United States, 7 provinces in Canada, and in Denmark, Finland, France, Germany, Italy, the Netherlands, Norway, Poland, Portugal, Spain, Sweden, the United Kingdom, China, Argentina, Brazil and Australia.
14
The following table sets forth the locations of our facilities as of January 30, 2016:
RETAIL STORES
Country/State/Province/Region/Territory | Number of Stores | Country/State/Province/Region/Territory | Number of Stores | Country/State/Province/Region/Territory | Number of Stores | ||||||||
United States | New Jersey | 71 | Canada | ||||||||||
Alabama | 12 | New Mexico | 10 | Alberta | 39 | ||||||||
Arizona | 27 | New York | 115 | British Columbia | 41 | ||||||||
Arkansas | 8 | North Carolina | 46 | Manitoba | 10 | ||||||||
California | 179 | North Dakota | 2 | New Brunswick | 8 | ||||||||
Colorado | 17 | Ohio | 51 | Newfoundland | 4 | ||||||||
Connecticut | 33 | Oklahoma | 17 | Nova Scotia | 12 | ||||||||
Delaware | 7 | Oregon | 20 | Northwest Territories | 1 | ||||||||
District of Columbia | 2 | Pennsylvania | 87 | Ontario | 112 | ||||||||
Florida | 77 | Rhode Island | 8 | Prince Edward Island | 2 | ||||||||
Georgia | 29 | South Carolina | 20 | Quebec | 64 | ||||||||
Idaho | 8 | South Dakota | 1 | Saskatchewan | 11 | ||||||||
Illinois | 36 | Tennessee | 19 | Yukon | 1 | ||||||||
Indiana | 20 | Texas | 49 | Total Canada | 305 | ||||||||
Iowa | 13 | Utah | 11 | ||||||||||
Kansas | 5 | Vermont | 6 | ||||||||||
Kentucky | 14 | Virginia | 40 | Finland | 7 | ||||||||
Maine | 10 | Washington | 26 | Germany | 58 | ||||||||
Maryland | 39 | West Virginia | 5 | The Netherlands | 41 | ||||||||
Massachusetts | 62 | Wisconsin | 9 | Norway | 19 | ||||||||
Michigan | 36 | Wyoming | 3 | Portugal | 34 | ||||||||
Minnesota | 5 | Total United States | 1,302 | Sweden | 12 | ||||||||
Missouri | 10 | United Kingdom | 107 | ||||||||||
Montana | 7 | Argentina | 11 | ||||||||||
Nebraska | 4 | Australia | 10 | ||||||||||
Nevada | 6 | Brazil | 1 | ||||||||||
New Hampshire | 20 | 1,907 | |||||||||||
15
DISTRIBUTION AND FULFILLMENT CENTERS
Country/State/Province/Region/Territory | Number of Centers | Country/State/Province/Region/Territory | Number of Centers | |||||
United States | Canada | |||||||
Arizona | 1 | Alberta | 4 | |||||
Alaska | 1 | British Columbia | 2 | |||||
California | 5 | Manitoba | 1 | |||||
Colorado | 1 | New Foundland | 1 | |||||
Connecticut | 2 | Nova Scotia | 2 | |||||
Delaware | 1 | Ontario | 4 | |||||
Florida | 1 | Quebec | 2 | |||||
Georgia | 2 | Total Canada | 16 | |||||
Idaho | 1 | |||||||
Illinois | 2 | Denmark | 1 | |||||
Indiana | 1 | Finland | 1 | |||||
Iowa | 2 | France | 2 | |||||
Kansas | 2 | Germany | 1 | |||||
Maryland | 2 | Italy | 1 | |||||
Massachusetts | 1 | The Netherlands | 2 | |||||
Minnesota | 2 | Norway | 2 | |||||
Nebraska | 1 | Poland | 1 | |||||
New Jersey | 1 | Portugal | 1 | |||||
New York | 2 | Spain | 1 | |||||
North Carolina | 2 | Sweden | 1 | |||||
Ohio | 2 | United Kingdom | 5 | |||||
Oregon | 3 | China | 3 | |||||
Pennsylvania | 1 | Argentina | 1 | |||||
Tennessee | 1 | Brazil | 1 | |||||
Texas | 6 | Australia | 15 | |||||
Virginia | 1 | 104 | ||||||
Washington | 1 | |||||||
Wisconsin | 1 | |||||||
Total United States | 49 | |||||||
Most of the existing facilities are leased by us with initial lease terms expiring between 2016 and 2030. In most instances, we have renewal options at increased rents. Leases for 134 of the existing stores provide for contingent rent based upon sales.
We own our Framingham, Massachusetts corporate office, which consists of approximately 650,000 square feet.
Item 3. Legal Proceedings
We are subject to ordinary routine litigation incidental to our business. We do not believe the results of such litigation will have a material adverse effect on our business. See Note I - Commitments and Contingencies of the Notes to our Consolidated Financial Statements.
Item 4. Mine Safety Disclosures
Not applicable.
16
PART II
Item 5. Market for the Registrant's Common Equity, Related Stockholder Matters and Issuer Purchases of Equity Securities
NASDAQ
Our common stock is traded on the NASDAQ Global Select Market under the symbol "SPLS". The following table sets forth for the periods indicated the high and low sales prices per share of our common stock on the NASDAQ Global Select Market, as reported by NASDAQ.
High | Low | |||||||
52 Weeks Ended January 30, 2016 | ||||||||
First Quarter | $ | 19.40 | $ | 15.72 | ||||
Second Quarter | 16.84 | 13.74 | ||||||
Third Quarter | 14.71 | 11.61 | ||||||
Fourth Quarter | 13.50 | 8.29 | ||||||
52 Weeks Ended January 31, 2015 | ||||||||
First Quarter | $ | 13.78 | $ | 11.04 | ||||
Second Quarter | 13.50 | 10.70 | ||||||
Third Quarter | 13.28 | 10.82 | ||||||
Fourth Quarter | 18.33 | 12.55 | ||||||
Cash Dividend
Since 2004, we have returned cash to our stockholders through cash dividends. We paid quarterly dividends for fiscal year 2015 of $0.12 per share on April 16, 2015, July 16, 2015, October 15, 2015 and January 14, 2016 resulting in a total dividend payment of $308 million or $0.48 per share. We paid quarterly dividends for fiscal year 2014 of $0.12 per share on April 17, 2014, July 17, 2014, October 16, 2014 and January 15, 2015, resulting in a total dividend payment of $307 million or $0.48 per share. We paid quarterly dividends for fiscal year 2013 of $0.12 per share on April 18, 2013, July 18, 2013, October 17, 2013 and January 16, 2014 resulting in a total dividend payment of $313 million or $0.48 per share.
While it is our intention to continue to pay quarterly cash dividends in 2016 and beyond, any decision to pay future cash dividends will be made by our Board of Directors and will depend upon our earnings, financial condition and other factors. Our payment of dividends is permitted under our existing public notes and other financing agreements, although our revolving credit agreement restricts the payment of dividends in the event we are in default under such agreement or such payout would cause a default under such agreement. In connection with our proposed acquisition of Office Depot, the agreements governing the term loan we entered into, and that will govern the asset-based revolving credit facility if we enter into it, contain (or, in the case of the asset-based revolving credit facility, are expected to contain) provisions that restrict us from paying dividends in certain circumstances, and otherwise restrict us from paying dividends in excess of $0.15 per share, per quarter (see Note R - Proposed Acquisition of Office Depot in the Notes to the Consolidated Financial Statements for additional information).
On March 1, 2016, our Board of Directors approved the payment of a cash dividend of $0.12 per share to be paid on April 14, 2016 for stockholders of record on March 25, 2016.
17
Stock Performance Graph
The following graph compares the cumulative total stockholder return on Staples' common stock, the Standard & Poor's 500 Index and the Standard & Poor's Retail Index during our 2011 through 2015 fiscal years, assuming the investment of $100.00 on January 29, 2011 with dividends being reinvested.
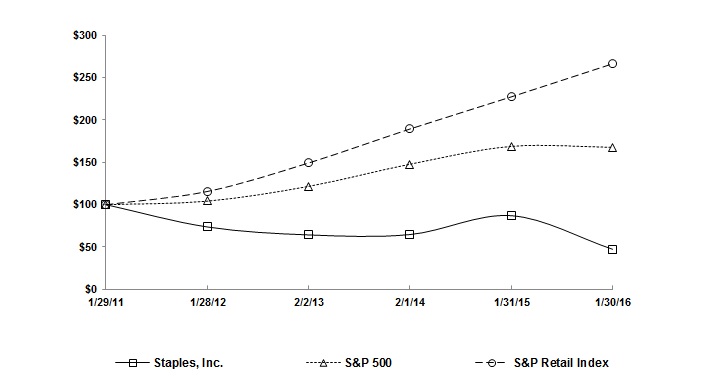
TOTAL RETURN TO STOCKHOLDERS
29-Jan-11 | 28-Jan-12 | 2-Feb-13 | 1-Feb-14 | 31-Jan-15 | 30-Jan-16 | |||||||||||||||||||
Staples, Inc. | $ | 100.00 | $ | 73.62 | $ | 64.27 | $ | 64.65 | $ | 86.97 | $ | 47.22 | ||||||||||||
S&P 500 Index | $ | 100.00 | $ | 104.22 | $ | 121.71 | $ | 147.89 | $ | 168.93 | $ | 167.81 | ||||||||||||
S&P Retail Index | $ | 100.00 | $ | 115.66 | $ | 149.35 | $ | 189.57 | $ | 227.53 | $ | 266.59 | ||||||||||||
Issuer Purchases of Equity Securities
As a result of our proposed acquisition of Office Depot, we have temporarily suspended our share repurchase program to focus on building up cash reserves ahead of the acquisition. Therefore, we did not repurchase any of our common stock under our share repurchase program during 2015. A total of 22,777 shares of our common stock with a weighted average per share price of $12.36 were withheld during the fourth quarter of fiscal 2015 to satisfy minimum statutory withholding obligations in connection with the vesting of restricted stock awards granted pursuant to our equity incentive plans.
Other Information
For information regarding securities authorized for issuance under our equity compensation plans, please see Note K - Equity Based Employee Benefit Plans in the Notes to the Consolidated Financial Statements contained in this Annual Report on Form 10-K.
At March 2, 2016, we had 4,384 holders of record of our common stock.
Item 6. Selected Financial Data
The information required by this Item is attached as Appendix A.
Item 7. Management's Discussion and Analysis of Financial Condition and Results of Operations
The information required by this Item is attached as part of Appendix B.
18
Item 7A. Quantitative and Qualitative Disclosures about Market Risk
The information required by this Item is attached as part of Appendix B under the caption "Quantitative and Qualitative Disclosures about Market Risks."
Item 8. Financial Statements and Supplementary Data
The information required by this Item is attached as Appendix C.
Item 9. Changes in and Disagreements with Accountants on Accounting and Financial Disclosure
None.
Item 9A. Controls and Procedures
1. Disclosure Controls and Procedures
The Company's management, with the participation of the Company's chief executive officer and chief financial officer, evaluated, as of January 30, 2016, the effectiveness of the Company's disclosure controls and procedures, which were designed to be effective at the reasonable assurance level. The term "disclosure controls and procedures," as defined in Rules 13a-15(e) and 15d-15(e) under the Exchange Act, means controls and other procedures of a company that are designed to ensure that information required to be disclosed by a company in the reports that it files or submits under the Exchange Act is recorded, processed, summarized and reported, within the time periods specified in the SEC's rules and forms. Disclosure controls and procedures include, without limitation, controls and procedures designed to ensure that information required to be disclosed by a company in the reports that it files or submits under the Exchange Act is accumulated and communicated to the company's management, including its principal executive and principal financial officers, as appropriate to allow timely decisions regarding required disclosure. Management recognizes that any controls and procedures, no matter how well designed and operated, can provide only reasonable assurance of achieving their objectives and management necessarily applies its judgment in evaluating the cost-benefit relationship of possible controls and procedures. Based on the evaluation of the Company's disclosure controls and procedures as of January 30, 2016, management, the chief executive officer and the chief financial officer concluded that the Company's disclosure controls and procedures were effective at the reasonable assurance level at that date.
2. Internal Control over Financial Reporting
(a) Management's Annual Report on Internal Control over Financial Reporting
Our management is responsible for establishing and maintaining adequate internal control over financial reporting for the Company. Internal control over financial reporting is defined in Rule 13a-15(f) or 15d-15(f) promulgated under the Exchange Act as a process designed by, or under the supervision of, the company's principal executive and principal financial officers and effected by the company's board of directors, management and other personnel, to provide reasonable assurance regarding the reliability of financial reporting and the preparation of financial statements for external purposes in accordance with generally accepted accounting principles and includes those policies and procedures that:
• | Pertain to the maintenance of records that in reasonable detail accurately and fairly reflect the transactions and dispositions of the assets of the company; |
• | Provide reasonable assurance that transactions are recorded as necessary to permit preparation of financial statements in accordance with generally accepted accounting principles, and that receipts and expenditures of the company are being made only in accordance with authorizations of management and directors of the company; and |
• | Provide reasonable assurance regarding prevention or timely detection of unauthorized acquisition, access to, use or disposition of the company's assets that could have a material effect on the financial statements. |
Staples' internal control system is designed to provide reasonable assurance to the Company's management and Board regarding the preparation and fair presentation of published financial statements. All internal control systems, no matter how well designed, have inherent limitations which may not prevent or detect misstatements. Therefore, even those systems determined to be effective can provide only reasonable assurance with respect to financial statement preparation and presentation. Projections of any evaluation of effectiveness to future periods are subject to the risk that controls may become inadequate because of changes in conditions, or that the degree of compliance with the policies or procedures may deteriorate.
Our management assessed the effectiveness of Staples' internal controls over financial reporting as of January 30, 2016. In making this assessment, it used the criteria set forth in Internal Control-Integrated Framework issued by the Committee of
19
Sponsoring Organizations of the Treadway Commission (2013 Framework) ("COSO") . Based on our assessment, we conclude that, as of January 30, 2016, the Company has maintained effective internal control over financial reporting based on those criteria.
The independent registered public accounting firm, Ernst & Young LLP, has audited the Consolidated Financial Statements and has issued an attestation report on Staples Inc.'s internal control over financial reporting as of January 30, 2016 as stated in its reports which are included herein.
20
(b) Attestation Report of the Independent Registered Public Accounting Firm
Report of Independent Registered Public Accounting Firm
The Board of Directors and Shareholders of
Staples, Inc.
We have audited Staples, Inc.’s internal control over financial reporting as of January 30, 2016, based on criteria established in Internal Control-Integrated Framework issued by the Committee of Sponsoring Organizations of the Treadway Commission (2013 framework) (the COSO criteria). Staples, Inc.’s management is responsible for maintaining effective internal control over financial reporting, and for its assessment of the effectiveness of internal control over financial reporting included in Management’s Annual Report on Internal Control over Financial Reporting. Our responsibility is to express an opinion on the company’s internal control over financial reporting based on our audit.
We conducted our audit in accordance with the standards of the Public Company Accounting Oversight Board (United States). Those standards require that we plan and perform the audit to obtain reasonable assurance about whether effective internal control over financial reporting was maintained in all material respects. Our audit included obtaining an understanding of internal control over financial reporting, assessing the risk that a material weakness exists, testing and evaluating the design and operating effectiveness of internal control based on the assessed risk, and performing such other procedures as we considered necessary in the circumstances. We believe that our audit provides a reasonable basis for our opinion.
A company’s internal control over financial reporting is a process designed to provide reasonable assurance regarding the reliability of financial reporting and the preparation of financial statements for external purposes in accordance with generally accepted accounting principles. A company’s internal control over financial reporting includes those policies and procedures that (1) pertain to the maintenance of records that, in reasonable detail, accurately and fairly reflect the transactions and dispositions of the assets of the company; (2) provide reasonable assurance that transactions are recorded as necessary to permit preparation of financial statements in accordance with generally accepted accounting principles, and that receipts and expenditures of the company are being made only in accordance with authorizations of management and directors of the company; and (3) provide reasonable assurance regarding prevention or timely detection of unauthorized acquisition, use, or disposition of the company’s assets that could have a material effect on the financial statements.
Because of its inherent limitations, internal control over financial reporting may not prevent or detect misstatements. Also, projections of any evaluation of effectiveness to future periods are subject to the risk that controls may become inadequate because of changes in conditions, or that the degree of compliance with the policies or procedures may deteriorate.
In our opinion, Staples, Inc. maintained, in all material respects, effective internal control over financial reporting as of January 30, 2016, based on the COSO criteria.
We also have audited, in accordance with the standards of the Public Company Accounting Oversight Board (United States), the consolidated balance sheets of Staples, Inc. and subsidiaries as of January 30, 2016 and January 31, 2015, and the related consolidated statements of income, comprehensive income, shareholders’ equity and cash flows for each of the three years in the period ended January 30, 2016 of Staples, Inc. and subsidiaries and our report dated March 4, 2016 expressed an unqualified opinion thereon.
/s/ Ernst & Young LLP | ||
Boston, Massachusetts | ||
March 4, 2016 | ||
21
(c) Changes in Internal Control over Financial Reporting
No change in the Company's internal control over financial reporting (as defined in Rules 13a-15(f) and 15d-15(f) under the Exchange Act) occurred during the fiscal quarter ended January 30, 2016 that has materially affected, or is reasonably likely to materially affect, the Company's internal control over financial reporting.
Item 9B. Other Information
None.
22
PART III
Certain information required by Part III is omitted from this Annual Report on Form 10-K and incorporated herein by reference to the definitive proxy statement with respect to our 2016 Annual Meeting of Stockholders (the "Proxy Statement"), which we will file with the Securities and Exchange Commission not later than 120 days after the end of the fiscal year covered by this Report.
Item 10. Directors, Executive Officers and Corporate Governance
Certain information required by this Item is contained under the heading "Executive Officers of the Registrant" in Part I of this Annual Report on Form 10-K. Other information required by this Item will appear under the headings "Election of Directors (Item 2 on the Proxy Card)" and "Corporate Governance" in our Proxy Statement, which sections are incorporated herein by reference.
The information required by this Item pursuant to Item 405 of Regulation S-K will appear under the heading "Section 16(a) Beneficial Ownership Reporting Compliance" in our Proxy Statement, which section is incorporated herein by reference.
We have adopted a written code of ethics that applies to our principal executive officer, principal financial officer, and principal accounting officer or controller, or persons performing similar functions. Our code of ethics, which also applies to our directors and all of our officers and associates, can be found on our web site, which is located at www.staples.com, and is also an exhibit to this report. We intend to make all required disclosures concerning any amendments to or waivers from our code of ethics by filing a Form 8-K disclosing such waiver, or to the extent permitted by applicable NASDAQ regulations, by posting such information in the Investor Information section of our web site.
Item 11. Executive Compensation
The information required by this Item will appear under the headings "Corporate Governance", "Director Compensation", and "Executive Compensation and Compensation Discussion and Analysis" including "Compensation Committee Interlocks and Insider Participation" and "Compensation Committee Report" in our Proxy Statement, which sections are incorporated herein by reference.
Item 12. Security Ownership of Certain Beneficial Owners and Management and Related Stockholder Matters
The information required by this Item will appear under the headings "Beneficial Ownership of Common Stock" and "Equity Compensation Plan Information at 2015 Fiscal Year End" in our Proxy Statement, which sections are incorporated herein by reference.
Item 13. Certain Relationships and Related Transactions, and Director Independence
The information required by this Item will appear under the headings "Certain Relationships and Related Party Transactions" and "Director Independence" in our Proxy Statement, which sections are incorporated herein by reference.
Item 14. Principal Accountant Fees and Services
The information required by this Item will appear under the heading "Independent Registered Public Accounting Firm's Fees" in our Proxy Statement, which section is incorporated herein by reference.
23
Item 15. Exhibits and Financial Statement Schedules
(a) | Index to Consolidated Financial Statements: The following financial statements and schedules of Staples, Inc. are included as Appendix C of this Report: |
1. Financial Statements.
• | Consolidated Balance Sheets - January 30, 2016 and January 31, 2015; |
• | Consolidated Statements of Income - Fiscal years ended January 30, 2016, January 31, 2015 and February 1, 2014; |
• | Consolidated Statements of Comprehensive Income - Fiscal years ended January 30, 2016, January 31, 2015 and February 1, 2014; |
• | Consolidated Statements of Stockholders' Equity - Fiscal years ended January 30, 2016, January 31, 2015 and February 1, 2014; |
• | Consolidated Statements of Cash Flows - Fiscal years ended January 30, 2016, January 31, 2015 and February 1, 2014; and |
• | Notes to Consolidated Financial Statements. |
2. Financial Statement Schedules.
• | Schedule II—Valuation and Qualifying Accounts. |
All schedules for which provision is made in the applicable accounting regulations of the Securities and Exchange Commission other than the one listed above are not required under the related instructions or are not applicable and, therefore, have been omitted.
3. Exhibits. The exhibits which are filed or furnished with this report or which are incorporated herein by reference are set forth in the Exhibit Index beginning on page D-1, which is incorporated herein by reference.
24
Signatures
Pursuant to the requirements of Section 13 or 15(d) of the Securities Exchange Act of 1934, the registrant has duly caused this report to be signed on its behalf by the undersigned, thereunto duly authorized, on March 4, 2016.
STAPLES, INC. | ||
By: | /s/ RONALD L. SARGENT | |
Ronald L. Sargent, | ||
Chairman of the Board and Chief Executive Officer (Principal Executive Officer) | ||
Pursuant to the requirements of the Securities Exchange Act of 1934, this report has been signed below by the following persons on behalf of the registrant and in the capacities and on the dates indicated.
Signature | Capacity | Date | ||
/s/ RONALD L. SARGENT | Chairman of the Board and Chief Executive Officer (Principal Executive Officer) | March 4, 2016 | ||
Ronald L. Sargent | ||||
/s/ BASIL L. ANDERSON | Director | March 4, 2016 | ||
Basil L. Anderson | ||||
/s/ DREW G. FAUST | Director | March 4, 2016 | ||
Drew G. Faust | ||||
/s/ PAUL-HENRI FERRAND | Director | March 4, 2016 | ||
Paul-Henri Ferrand | ||||
/s/ KUNAL S. KAMLANI | Director | March 4, 2016 | ||
Kunal S. Kamlani | ||||
/s/ CAROL MEYROWITZ | Director | March 4, 2016 | ||
Carol Meyrowitz | ||||
/s/ ROWLAND T. MORIARTY | Director | March 4, 2016 | ||
Rowland T. Moriarty | ||||
/s/ ROBERT E. SULENTIC | Director | March 4, 2016 | ||
Robert E. Sulentic | ||||
/s/ RAUL VAZQUEZ | Director | March 4, 2016 | ||
Raul Vazquez | ||||
/s/ VIJAY VISHWANATH | Director | March 4, 2016 | ||
Vijay Vishwanath | ||||
/s/ PAUL F. WALSH | Director | March 4, 2016 | ||
Paul F. Walsh | ||||
/s/ CHRISTINE T. KOMOLA | Executive Vice President and Chief Financial Officer (Principal Financial Officer) | March 4, 2016 | ||
Christine T. Komola | ||||
/s/ MARK CONTE | Senior Vice President and Corporate Controller (Principal Accounting Officer) | March 4, 2016 | ||
Mark Conte | ||||
25
APPENDIX A
STAPLES, INC. AND SUBSIDIARIES
SELECTED FINANCIAL DATA
(Dollar Amounts in Millions, Except Store and Per Share Data)
Fiscal Year Ended | ||||||||||||||||||||
January 30, 2016 (1) (52 Weeks) | January 31, 2015 (2) (52 Weeks) | February 1, 2014 (3) (52 Weeks) | February 2, 2013 (4) (53 Weeks) | January 28, 2012 (5) (52 Weeks) | ||||||||||||||||
Statement of Income Data: | ||||||||||||||||||||
Sales | $ | 21,059 | $ | 22,492 | $ | 23,114 | $ | 24,381 | $ | 24,665 | ||||||||||
Gross profit | 5,514 | 5,801 | 6,032 | 6,491 | 6,690 | |||||||||||||||
Income (loss) from continuing operations, including the portion attributable to the noncontrolling interest | $ | 379 | $ | 135 | $ | 707 | $ | (161 | ) | $ | 987 | |||||||||
Amounts attributable to Staples, Inc. | ||||||||||||||||||||
Income (loss) from continuing operations | $ | 379 | $ | 135 | $ | 707 | $ | (161 | ) | $ | 988 | |||||||||
Loss from discontinued operations | — | — | (87 | ) | (50 | ) | (3 | ) | ||||||||||||
Net income | $ | 379 | $ | 135 | $ | 620 | $ | (211 | ) | $ | 985 | |||||||||
Basic earnings per common share: | ||||||||||||||||||||
Continuing operations | $ | 0.59 | $ | 0.21 | $ | 1.08 | $ | (0.24 | ) | $ | 1.42 | |||||||||
Discontinued operations | — | — | (0.13 | ) | (0.07 | ) | — | |||||||||||||
Net income | $ | 0.59 | $ | 0.21 | $ | 0.95 | $ | (0.31 | ) | $ | 1.42 | |||||||||
Diluted earnings per common share: | ||||||||||||||||||||
Continuing operations | $ | 0.59 | $ | 0.21 | $ | 1.07 | $ | (0.24 | ) | $ | 1.40 | |||||||||
Discontinued operations | — | — | (0.13 | ) | (0.07 | ) | — | |||||||||||||
Net income | $ | 0.59 | $ | 0.21 | $ | 0.94 | $ | (0.31 | ) | $ | 1.40 | |||||||||
Dividends declared per common share | $ | 0.48 | $ | 0.48 | $ | 0.48 | $ | 0.44 | $ | 0.40 | ||||||||||
Statistical Data: | ||||||||||||||||||||
Stores open at end of period | 1,907 | 1,983 | 2,169 | 2,215 | 2,295 | |||||||||||||||
Balance Sheet Data: | ||||||||||||||||||||
Working capital (6), (7),(8) | $ | 1,848 | $ | 1,662 | $ | 1,694 | $ | 1,525 | $ | 1,914 | ||||||||||
Total assets (6) | 10,172 | 10,308 | 11,175 | 12,280 | 13,430 | |||||||||||||||
Long-term debt, net of current maturities (6) | 1,018 | 1,018 | 1,000 | 1,002 | 1,599 | |||||||||||||||
Noncontrolling interests | 8 | 8 | 9 | 8 | 7 | |||||||||||||||
Total stockholders’ equity | $ | 5,384 | $ | 5,313 | $ | 6,141 | $ | 6,136 | $ | 7,022 | ||||||||||
The Company's fiscal year is the 52 or 53 weeks ending the Saturday closest to January 31. Results of operations include the results of acquired businesses since the relevant acquisition date.
(1) | Income from continuing operations for this period reflects $151 million of restructuring charges, $147 million of costs related to our proposed acquisition of Office Depot, $50 million of long-lived asset impairment charges, $18 million of costs related to the previously announced PNI data security incident, $5 million for accelerated depreciation, $1 million in inventory write-downs associated with our restructuring initiatives, and a net loss of $5 million related to the sale of businesses and assets. |
A-1
(2) | Income from continuing operations for this period reflects $171 million of restructuring charges, a charge of $470 million for impairment of goodwill and long-lived assets, $9 million of accelerated depreciation, $26 million of inventory write-downs, and a net gain of $27 million related to the sale of businesses. |
(3) | Income from continuing operations for this period reflects charges of $64 million for restructuring activities aimed at further streamlining the Company's operations and general and administration functions. Loss from discontinued operations for this period reflects an $81 million preliminary loss on disposal related to the sale of the Company's European Printing Systems Division business ("PSD"). |
(4) | Income from continuing operations for this period reflects pre-tax charges of $811 million for impairment of goodwill and long-lived assets, $207 million for restructuring activities related to a strategic plan announced in September 2012 aimed at accelerating growth, $57 million for a loss on early extinguishment of debt, $26 million related to the termination of the Company's joint venture agreement in India, and $20 million for accelerated tradename amortization related to rebranding the Company's business in Australia. |
(5) | Income from continuing operations for this period reflects the receipt of a $21 million tax benefit related to a refund due to Corporate Express N.V. ("Corporate Express") from the Italian government that was previously deemed uncollectible. |
(6) | Working capital, total assets and long term debt, net of current maturities as of January 31, 2015, as shown above and as reflected on our Consolidated Balance Sheets, reflect the impact of a restatement to reclassify unamortized debt issuance costs of $1 million from Prepaid and other current assets and $4 million from Other assets to Long-term debt, net of current maturities, as a result of adopting Accounting Standards Update 2015-03, "Interest- Imputation of Interest (Subtopic 835-30): Simplifying the Presentation of Debt Issuance Cost. The amounts shown above related to 2011 to 2013 have not been restated since the impact of the adoption of this pronouncement was not material. |
(7) | Working capital in 2012 excludes the current assets and current liabilities of discontinued operations. |
(8) | As noted in Note A in the Notes to the Consolidated Financial Statements, in 2015 we adopted a new accounting pronouncement which stipulates that all deferred tax assets and liabilities are to be presented in the balance sheet as non-current items. As a result, the working capital figures for 2011 to 2014 shown above have been restated to reflect the reclassification of deferred tax assets and liabilities from current to non-current. |
A-2
STAPLES, INC. AND SUBSIDIARIES
Management's Discussion and Analysis of Financial Condition and
Results of Operations
General
Our fiscal year is the 52 or 53 weeks ending on the Saturday closest to January 31. Fiscal year 2015 ("2015") consisted of the 52 weeks ended January 30, 2016, fiscal year 2014 ("2014") consisted of the 52 weeks ended January 31, 2015 and fiscal year 2013 ("2013") consisted of the 52 weeks ended February 1, 2014.
Results of Operations
Major contributors to our 2015 results, as compared to the results for 2014, are reviewed in detail in the Consolidated Performance and Segment Performance discussions and are summarized below:
• | We generated $21.1 billion in sales, a decrease of 6.4%; |
• | North American Stores & Online sales decreased 8.7% and business unit income rate was flat at 4.5%; |
• | North American Commercial sales increased 1.1% and business unit income rate increased to 7.2% from 6.9%; |
• | International Operations sales decreased 16.3%, driven by the negative impact of foreign exchange rates, while business unit loss rate increased to 1.3% from 0.6%; |
• | Net income for 2015 was $379 million compared with $135 million in 2014; |
• | Net Income for 2015 includes after-tax charges of $199 million for restructuring-related costs, long-lived asset impairment charges, merger-related costs, costs associated with the previously announced PNI data security incident, and a net loss on the sale of businesses and assets, |
• | Non-GAAP net income was $578 million in 2015 compared with $623 million in 2014; and |
• | Earnings per diluted share from continuing operations was $0.59 in 2015 compared to $0.21 in 2014. Non-GAAP earnings per diluted share from continuing operations was $0.89 in 2015 compared with $0.96 in 2014. |
See the non-GAAP reconciliations in the "Non-GAAP Measures" section further below.
Outlook
For the first quarter of 2016, we expect sales to decrease versus the first quarter of 2015. We expect to achieve fully diluted non-GAAP earnings per share in the range of $0.16 to $0.18 for the first quarter of 2016, which excludes the impact of costs associated with our proposed acquisition of Office Depot and charges associated with the planned closure of North American retail stores. Our guidance reflects the unfavorable impact of the stronger U.S. dollar on sales and earnings. For the full year 2016, we expect to generate approximately $600 million of free cash flow excluding the impact of payments associated with financing for the acquisition of Office Depot.
2014 Restructuring Plan
In 2014, we announced our plan to close at least 225 retail stores in North America by the end of fiscal year 2015. We have extended this plan and expect to close approximately 50 additional stores during 2016. In addition, as part of our continuing efforts to transform our business, we announced a cost savings plan to generate annualized pre-tax savings of approximately $500 million by the end of fiscal 2015. The cost savings plan was substantially complete as of the end of 2015, and we do not expect to incur material costs in the future related to this plan. In 2015 and 2014 we incurred charges related to these plans of $170 million and $245 million, respectively. See Note B - Restructuring Charges in the Notes to the Consolidated Financial Statements for additional information.
Proposed Acquisition of Office Depot
On February 4, 2015, we announced that Staples had signed a definitive agreement to acquire Office Depot, a global supplier of office products, services and solutions for the workplace. Under the terms of the agreement, Office Depot shareholders will receive, for each Office Depot share, $7.25 in cash and 0.2188 of a share in Staples stock at the closing. We expect to generate at least $1 billion of annualized cost synergies by the third full fiscal year post-closing, and estimate that we would incur one-time costs of approximately $1 billion to achieve the synergy target.
B-1
STAPLES, INC. AND SUBSIDIARIES
Management's Discussion and Analysis of Financial Condition and
Results of Operations (continued)
On December 7, 2015, the U.S. Federal Trade Commission ("FTC") and Canadian Commissioner of Competition each filed lawsuits against us and Office Depot, seeking to block the proposed merger and prevent the acquisition from closing. We intend to vigorously defend against the lawsuits, and a decision in the U.S. federal court case is expected by May 10, 2016. On February 2, 2016, both we and Office Depot agreed to waive, until May 16, 2016, our rights to terminate the definitive agreement due to a failure to complete the merger by February 4, 2016 or a legal restraint under antitrust laws. We would be required to pay Office Depot a termination fee of $250 million under certain circumstances, including if the definitive agreement is terminated as a result of the antitrust closing conditions not being satisfied on or before May 16, 2016.
See Note R - Proposed Acquisition of Office Depot in the Notes to the Consolidated Financial Statements for additional information related to the proposed merger, including information related to sources of financing we have secured.
Non-GAAP Measures
In our analysis of the results of operations and in our outlook, we have referred to certain non-GAAP financial measures for gross profit rate, net income, earnings per share, effective tax rate, and free cash flow (which we define as net cash provided by operating activities less capital expenditures and, in the case of our guidance, payments associated with financing for our proposed acquisition of Office Depot). The presentation of these results should be considered in addition to, and should not be considered superior to, or as a substitute for, the presentation of results determined in accordance with GAAP. We believe that these non-GAAP financial measures help management and investors to understand and analyze our performance by providing meaningful information that facilitates the comparability of underlying business results from period to period. We use these non-GAAP financial measures to evaluate the operating results of our business against prior year results and our operating plan, and to forecast and analyze future periods. We recognize there are limitations associated with the use of non-GAAP financial measures as they may reduce comparability with other companies that use different methods to calculate similar non-GAAP measures. We generally compensate for these limitations by considering GAAP as well as non-GAAP results. In addition, management provides a reconciliation to the most comparable GAAP financial measure. With respect to our earnings per share and free cash flow guidance, we have not provided guidance on a GAAP basis given that our current estimates for charges to be incurred related to our planned acquisition of Office Depot and the closure of North American retail stores, and the potential related impact on cash flow, cannot be reasonably estimated.
B-2
STAPLES, INC. AND SUBSIDIARIES
Management's Discussion and Analysis of Financial Condition and
Results of Operations (continued)
For the non-GAAP measures related to results of operations, reconciliations to the most directly comparable GAAP measures are shown below (amounts in millions, except per share data):
52 Weeks Ended | ||||||||||||||||||||||||||||||||
January 30, 2016 | ||||||||||||||||||||||||||||||||
GAAP | Inventory write-downs related to restructuring activities | Restructuring charges | Impairment of long-lived assets & accelerated depreciation | Loss on sale of businesses and assets, net | Merger-related costs | PNI data security incident costs | Non-GAAP | |||||||||||||||||||||||||
Gross profit | $ | 5,514 | $ | 1 | $ | — | $ | — | $ | — | $ | — | $ | — | $ | 5,515 | ||||||||||||||||
Gross profit rate | 26.2 | % | 26.2 | % | ||||||||||||||||||||||||||||
Operating income | 641 | 1 | 151 | 55 | 5 | 53 | 18 | 924 | ||||||||||||||||||||||||
Interest and other expense, net | 149 | 94 | 55 | |||||||||||||||||||||||||||||
Income before income taxes | 492 | 869 | ||||||||||||||||||||||||||||||
Income tax expense | 113 | 113 | ||||||||||||||||||||||||||||||
Adjustments | — | 178 | ||||||||||||||||||||||||||||||
Adjusted income tax expense | 113 | 291 | ||||||||||||||||||||||||||||||
Net income | $ | 379 | $ | 578 | ||||||||||||||||||||||||||||
Effective tax rate | 23.0 | % | 33.5 | % | ||||||||||||||||||||||||||||
Diluted earnings per common share | $ | 0.59 | $ | 0.89 | ||||||||||||||||||||||||||||
B-3
STAPLES, INC. AND SUBSIDIARIES
Management's Discussion and Analysis of Financial Condition and
Results of Operations (continued)
52 Weeks Ended | ||||||||||||||||||||||||||||
January 31, 2015 | ||||||||||||||||||||||||||||
GAAP | Inventory write-downs | Restructuring charges | Accelerated depreciation | Impairment of goodwill & long-lived assets | Gain on sale of businesses, net | Non-GAAP | ||||||||||||||||||||||
Gross profit | $ | 5,801 | $ | 26 | $ | — | $ | — | $ | — | $ | — | $ | 5,827 | ||||||||||||||
Gross profit rate | 25.8 | % | 25.9 | % | ||||||||||||||||||||||||
Operating income | 310 | 26 | 171 | 9 | 470 | (27 | ) | 958 | ||||||||||||||||||||
Interest and other expense, net | 42 | 42 | ||||||||||||||||||||||||||
Income from continuing operations before income taxes | 268 | 916 | ||||||||||||||||||||||||||
Income taxes | 133 | 133 | ||||||||||||||||||||||||||
Adjustments | — | 160 | ||||||||||||||||||||||||||
Adjusted income taxes | 133 | 293 | ||||||||||||||||||||||||||
Income from continuing operations | $ | 135 | $ | 623 | ||||||||||||||||||||||||
Effective tax rate | 49.8 | % | 32.0 | % | ||||||||||||||||||||||||
Diluted earnings per common share | $ | 0.21 | $ | 0.96 | ||||||||||||||||||||||||
52 Weeks Ended | ||||||||||||
February 1, 2014 | ||||||||||||
GAAP | Restructuring charges | Non-GAAP | ||||||||||
Operating income | $ | 1,177 | $ | 64 | $ | 1,241 | ||||||
Interest and other expense, net | (114 | ) | — | (114 | ) | |||||||
Income from continuing operations before income taxes | 1,063 | 64 | 1,127 | |||||||||
Income tax expense | 356 | 10 | 366 | |||||||||
Income from continuing operations | $ | 707 | $ | 54 | $ | 761 | ||||||
Effective tax rate | 33.5 | % | 32.5 | % | ||||||||
Diluted earnings per common share from continuing operations | $ | 1.07 | $ | 1.16 | ||||||||
Consolidated Performance
2015 Compared with 2014
Sales: Sales for 2015 were $21.1 billion, a decrease of 6.4% from 2014. The sales decline was primarily driven by a 4% unfavorable impact from changes in foreign exchange rates and approximately a 2% negative impact associated with store closures. Comparable sales in North America Stores & Online declined 3% while sales in North American Commercial increased 1%
B-4
STAPLES, INC. AND SUBSIDIARIES
Management's Discussion and Analysis of Financial Condition and
Results of Operations (continued)
(increase of 2% in local currency). Declines in computers and mobility, business machines and technology accessories, and ink and toner were partly offset by growth in facilities supplies, copy and print, breakroom supplies and furniture.
Gross Profit: Gross profit as a percentage of sales was 26.2% for 2015 compared to 25.8% for 2014. The increase was primarily driven by improved product margin rates in North American Stores & Online. The increase also reflects the impact of $26 million of inventory write-downs in 2014 related to the rationalization of our SKU assortment and the closure of North American retail stores, which compares with a $1 million write-down in 2015. The favorable impact of these factors was partially offset by the impact of increased logistics expenses for North America Stores & Online.
Selling, General and Administrative Expenses: Selling, general and administrative expenses in 2015 decreased by $216 million or 4.5% from 2014. The decrease was driven by the favorable impact from changes in foreign exchange rates as well as a reduction in compensation, largely due to headcount reductions associated with stores closures as well as reduced incentive compensation.
Selling, general and administrative expenses in 2015 includes $53 million in legal and professional services costs associated with our planned acquisition of Office Depot and $18 million of costs associated with the previously announced PNI data security incident (see Note I - Commitments and Contingencies in the Notes to the Consolidated Financial Statements for additional information). Selling, general and administrative expenses also reflects accelerated depreciation of $5 million in 2015 and $9 million in 2014 primarily related to our initiatives to improve efficiencies in our North American delivery fulfillment operations. As a percentage of sales, selling, general and administrative expenses were 21.8% in 2015 compared to 21.4% for 2014.
Impairment of Goodwill and Long-Lived Assets: See Note C - Goodwill and Long-Lived Assets in the Notes to the Consolidated Financial Statements for information related to the impairment charges in 2015 and 2014.
Restructuring Charges: See Note B - Restructuring Charges in the Notes to the Consolidated Financial Statements for information related to the restructuring charges in 2015 and 2014.
(Loss) Gain on Sale of Businesses and Assets, net: See Note D - Sale of Businesses and Assets in the Notes to the Consolidated Financial Statements for information related to gains and losses related to the sale of businesses and other assets in 2015 and 2014.
Interest Expense: Interest expense increased to $139 million for 2015 from $49 million for 2014. The increase was driven by $94 million of fees related to term loan financing for our planned acquisition of Office Depot. See Note R - Proposed Acquisition of Office Depot in the Notes to the Consolidated Financial Statements for additional information.
Other Income (Expense), Net: Other income (expense), net was an expense of $13 million for 2015 compared to income of $4 million for 2014. The expense in 2015 reflects investment losses associated with our supplemental executive retirement plan, while 2014 reflects investment income. The expense in 2015 also reflects the impact of foreign exchange losses.
Income Taxes: Our effective tax rate was 23.0% in 2015 compared to 49.8% for 2014. The tax rate for 2015 reflects the impact of:
• | A $60 million reduction in our liability for unrecognized tax benefits primarily due to the expiration of statutes of limitations; and |
• | Restructuring-related charges and costs related to our planned acquisition of Office Depot, as shown in the table in the Non-GAAP Measures section above. The majority of these charges and costs were incurred in the U.S., a jurisdiction in which the tax rate is higher than our overall effective tax rate. |
Excluding the impact of these items, our effective tax rate in 2015 was 33.5%.
Our tax rate for 2014 reflects the following:
• | Non-deductible goodwill impairment charges of $410 million; |
• | A $69 million reduction in our liability for unrecognized tax benefits primarily due to the resolution of certain federal and foreign audits pertaining to prior fiscal years; |
• | The impact of material restructuring-related charges recognized in our U.S. and Canadian entities in 2014; |
• | $11 million of incremental tax expense stemming from taxable income generated in the U.S. as a result of the repatriation of $127 million of cash from a foreign subsidiary; |
• | The impact of permanent differences between income tax expense for book and tax purposes related to the sale of three businesses; and |
• | A $4 million credit for a discrete item that is unrelated to current operations. |
B-5
STAPLES, INC. AND SUBSIDIARIES
Management's Discussion and Analysis of Financial Condition and
Results of Operations (continued)
Excluding the impact of these items, our effective tax rate in 2014 was 32.0%.
See Note J - Income Taxes in the Notes to the Consolidated Financial Statements for a reconciliation of the federal statutory tax rate to our effective tax rates in 2015 and 2014 and for information relating to the undistributed earnings of our foreign subsidiaries.
Our effective tax rate in any year is impacted by the geographic mix of earnings. Additionally, certain foreign operations are subject to both U.S. and foreign income tax regulations, and as a result, income before tax by location and the components of income tax expense by taxing jurisdiction are not directly related. The earnings generated primarily by our entities in Canada, Hong Kong and the Netherlands contribute to the foreign tax rate differential impacting the effective tax rate in 2015 and 2014.
2014 Compared with 2013
Sales: Sales for 2014 were $22.5 billion, a decrease of 2.7% from 2013. The decrease reflects a 4% decline in comparable store sales in North America, a $310 million unfavorable impact from changes in foreign exchange rates, an approximate 1% negative impact from store closures in North America, and to a lesser extent, ongoing weakness in our European businesses. These declines were partly offset by a 2.8% sales increase in North American Commercial and a 7% increase in Staples.com (increases of 3.3% and 8% in local currency, respectively). Declines in business machines and technology accessories, ink and toner, computers and core office supplies were partly offset by growth in facilities supplies and breakroom supplies, furniture and copy and print services.
Gross Profit: Gross profit as a percentage of sales was 25.8% for 2014 compared to 26.1% for 2013. The decrease in gross profit rate was driven by pricing investments in Staples.com and Quill, and increased delivery expense in North America primarily resulting from growth in delivery sales. These factors were partly offset by improved product margins in Europe resulting from our ongoing assortment and pricing optimization initiatives. Our gross profit rate in 2014 also reflects $26 million of inventory write-downs related to our initiatives to improve efficiencies in our North American delivery fulfillment operations and the closure of North American retail stores.
Selling, General and Administrative Expenses: Selling, general and administrative expenses in 2014 increased by $81 million or 1.7% from 2013. The increase was driven by increased incentive compensation expense, investments to drive growth online in both North America and Europe, and investments to support our strategic reinvention. These costs were partly offset by lower labor costs due to headcount reductions. Selling, general and administrative expenses in 2014 also reflects $9 million of accelerated depreciation primarily related to our initiatives to improve efficiencies in our North American delivery fulfillment operations As a percentage of sales, selling, general and administrative expenses increased to 21.4% in 2014 compared to 20.5% for 2013, reflecting the negative impact of lower sales.
Restructuring Charges: See Note B - Restructuring Charges in the Notes to the Consolidated Financial Statements for information relating to restructuring charges recorded in 2014 and 2013.
Amortization of Intangibles: Amortization of intangibles was $62 million for 2014 compared to $55 million for 2013 due to the acquisition of two businesses in 2014 and bringing on the related Intangibles.
Interest Expense: Interest expense decreased to $49 million for 2014 from $119 million for 2013. The decrease in interest expense was primarily the result of the repayment of the remaining $867 million principal balance of our 9.75% notes upon their maturity in January 2014.
Other Income (Expense), Net: Other income (expense), net was $4 million for 2014 compared to an insignificant amount for 2013. The $4 million of income in 2014 reflects investment income associated with our supplemental executive retirement plan. In 2013, investment income was offset by foreign exchange losses.
Income Taxes: Our tax rate related to continuing operations was 49.8% in 2014 compared to 33.5% for 2013. See the Consolidated Performance - 2015 Compared with 2014 section above for a discussion related to certain items that impacted our tax rate in 2014. Excluding the impact of these items, our effective tax rate in 2014 was 32.0%.
Our tax rate for 2013 reflects the impact of $64 million of net restructuring charges incurred in 2013, certain portions of which did not result in a tax benefit. Excluding the impact of these charges, our effective tax rate in 2013 was 32.5%.
See Note J - Income Taxes in the Notes to the Consolidated Financial Statements for a reconciliation of the federal statutory tax rate to our effective tax rates in 2014 and 2013 and for information relating to the undistributed earnings of our foreign subsidiaries.
B-6
STAPLES, INC. AND SUBSIDIARIES
Management's Discussion and Analysis of Financial Condition and
Results of Operations (continued)
Discontinued Operations: On October 5, 2013, we completed the sale of our European Printing Systems Division business ("PSD"), a former component of our International Operations segment. Loss from discontinued operations, net of tax, was $87 million during 2013 through the date of disposal, which included a preliminary loss on disposal of $81 million that was subject to a working capital adjustment to the purchase price. The amount of the working capital adjustment is in dispute between the parties in the transaction. See Note I - Commitments and Contingencies in the Notes to the Consolidated Financial Statements for an update on the status of the dispute.
Segment Performance
As noted in Note P - Segment Reporting in the Notes to the Consolidated Financial Statements, we have three reportable segments: North American Stores & Online, North American Commercial and International Operations. See additional geographic information and a reconciliation of total business unit income to income before income taxes in Note P in the Notes to the Consolidated Financial Statements.
The following tables provide a summary of our sales and business unit income by reportable segment:
2015 Increase (Decrease) From Prior Year | 2014 Increase (Decrease) From Prior Year | |||||||||||||||||
(Amounts in millions) | ||||||||||||||||||
Sales: | 2015 | 2014 | 2013 | |||||||||||||||
North American Stores & Online | $ | 9,538 | $ | 10,449 | $ | 11,103 | (8.7 | )% | (5.9 | )% | ||||||||
North American Commercial | 8,361 | 8,270 | 8,042 | 1.1 | % | 2.8 | % | |||||||||||
International Operations | 3,160 | 3,773 | 3,969 | (16.3 | )% | (4.9 | )% | |||||||||||
Total segment sales | $ | 21,059 | $ | 22,492 | $ | 23,114 | (6.4 | )% | (2.7 | )% | ||||||||
(Amounts in millions) | 2015 % of Sales | 2014 % of Sales | 2013 % of Sales | ||||||||||||||||||
Business Unit Income: | 2015 | 2014 | 2013 | ||||||||||||||||||
North American Stores & Online | $ | 429 | $ | 473 | $ | 733 | 4.5 | % | 4.5 | % | 6.6 | % | |||||||||
North American Commercial | 599 | 571 | 604 | 7.2 | % | 6.9 | % | 7.5 | % | ||||||||||||
International Operations | (41 | ) | (21 | ) | (15 | ) | (1.3 | )% | (0.6 | )% | (0.4 | )% | |||||||||
Business unit income | $ | 987 | $ | 1,023 | $ | 1,322 | 4.7 | % | 4.5 | % | 5.7 | % | |||||||||
Store Activity | Stores Open at Beginning of Period | Stores Opened | Stores Closed | Stores Open at End of Period | ||||||||||
2014 | North American Stores & Online | 1,846 | 2 | 169 | 1,679 | |||||||||
2014 | International Operations | 323 | 9 | 28 | 304 | |||||||||
2014 | Total | 2,169 | 11 | 197 | 1,983 | |||||||||
2015 | North American Stores & Online | 1,679 | 1 | 73 | 1,607 | |||||||||
2015 | International Operations | 304 | 4 | 8 | 300 | |||||||||
2015 | Total | 1,983 | 5 | 81 | 1,907 | |||||||||
North American Stores & Online
2015 Compared with 2014
Sales decreased by $911 million or 8.7% for 2015 compared to 2014. The decrease was driven by approximately a 3% unfavorable impact from store closures, a 3% negative impact from changes in foreign exchange rates and a 4% decline in comparable store sales resulting from a lower average order size and lower customer traffic. Comparable sales, which include comparable store sales and growth in Staples.com as defined further below, declined 3%. Declines in computers and mobility, and business machines and technology accessories were partially offset by increased sales of copy and print, and facilities supplies.
Business unit income as a percentage of sales was 4.5% for both 2015 and 2014. A favorable impact from increased product margin rates, reduced labor and rent expense in retail stores primarily as a result of store closures and lower incentive compensation expense was offset by the negative impact of lower sales on fixed expenses.
B-7
STAPLES, INC. AND SUBSIDIARIES
Management's Discussion and Analysis of Financial Condition and
Results of Operations (continued)
2014 Compared with 2013
Sales decreased 5.9% for 2014 compared to 2013. This decrease was driven by a 4% decline in comparable store sales primarily due to lower traffic, an approximate negative 2% impact from store closures, and a $159 million negative impact from changes in foreign exchange rates. Sales declines were partially offset by an 8% increase in Staples.com (in local currency) driven by increased business customer acquisition, improved customer conversion and an expanded assortment beyond office supplies. Comparable sales declined 2%. Declines in business machines and technology accessories, computers, and ink and toner were partially offset by growth in facilities supplies and breakroom supplies, copy and print, and mobile phones and accessories.
Business unit income as a percentage of sales decreased to 4.5% for 2014 from 6.6% for 2013. The decrease was primarily driven by investments to accelerate growth in Staples.com, increased incentive compensation, and increased marketing expense to drive awareness of our expanded product offerings. These expenses were partially offset by reduced retail labor costs and increased gross margin rates in retail stores.
North American Commercial
2015 Compared with 2014
Sales increased by $91 million or 1.1% for 2015 compared to 2014 (2.0% increase in local currency). The increase was primarily due to increased sales of facilities supplies, breakroom supplies, and furniture, partially offset by decreased sales of ink and toner and a decline in paper sales.
Business unit income as a percentage of sales was 7.2% in 2015 compared to 6.9% for 2014. The increase was primarily driven by increased gross margin rates, reduced incentive compensation expense and lower marketing expense in Quill, partially offset by continued investments in sales force to drive growth in categories beyond office supplies.
2014 Compared with 2013
Sales increased 2.8% for 2014 compared to 2013. The increase was primarily due to increased sales of facilities and breakroom supplies, furniture, business machines and technology accessories, and promotional and print solutions. This was partially offset by decreased sales of ink and toner and a $35 million unfavorable impact from foreign exchange rates.
Business unit income as a percentage of sales decreased to 6.9% for 2014 from 7.5% for 2013, primarily driven by increased incentive compensation, pricing investments in Quill, and investments in sales force. These declines were partially offset by reduced marketing expense and leverage of fixed expenses on increased sales.
International Operations
2015 Compared with 2014
Sales decreased by $613 million or 16.3% for 2015 compared to 2014. The decrease was primarily driven by a $544 million negative impact from foreign exchange rates. The remaining decrease was due to an 8% decline in comparable store sales in Europe, mainly driven by a decline in customer traffic, as well as declines in our European delivery businesses. These declines were partially offset by strong growth in China.
Business unit loss as a percentage of sales was 1.3% for 2015 compared to 0.6% for 2014. This increased loss was primarily driven by the impact of lower sales on fixed expenses in Europe and lower product margin rates in our European contract business, partially offset by improved profitability in Australia and China.
2014 Compared with 2013
Sales decreased 4.9% for 2014 compared to 2013. This decrease was primarily driven by a $116 million unfavorable impact from foreign exchange rates and weakness in our European delivery businesses.
Business unit loss as a percentage of sales was 0.6% for 2014 compared to 0.4% for 2013. The business unit loss rate for 2014 reflects a 30 basis point unfavorable impact from foreign exchange rates; results for 2014 in local currency were largely comparable to the prior year. In 2014 there was slight improvement in our Australian business, with lower salary and professional service costs more than offsetting the impact of lower product margins. There was also improvement in Europe driven by improved product margins as we continue to benefit from pan-European assortment and pricing optimization, partially offset by increased costs in Europe as we transition to a more centralized pan-European business model.
B-8
STAPLES, INC. AND SUBSIDIARIES
Management's Discussion and Analysis of Financial Condition and
Results of Operations (continued)
Critical Accounting Policies and Significant Estimates
Our financial statements have been prepared in accordance with U.S. GAAP and are based on the application of significant accounting policies (see Note A - Summary of Significant Accounting Policies in the Notes to the Consolidated Financial Statements). Preparation of these statements requires management to make significant judgments and estimates. We believe that the following are some of the more critical judgment areas in the application of our accounting policies that currently affect our financial condition and results of operations.
Inventory: We record inventory at the lower of weighted-average cost or market value. We reserve for obsolete, overstocked and inactive inventory based on the difference between the weighted-average cost of the inventory and the estimated market value using assumptions of future demand and market conditions. To estimate the required reserve, we consider factors such as age of the inventory, the nature of the products, the quantity of items on-hand relative to sales trends, current market prices and trends in pricing, our ability to use excess supply in another channel, historical write-offs, expected residual values or other recoveries, contractual terms related to and historical experience with returns to vendors, and new product introductions and other developments in industry. If actual demand or market conditions are less favorable than those projected by management, additional reserves may be required. However, past experience has shown little variability in reserve estimates, and we do not believe that deviations from our current estimates and assumptions will have a material impact upon our financial statements in the future.
When developing estimates for reserves required for inventory at stores that are closing, the key factors considered by management include the extent to which inventory on-hand will be discounted, transferred to other stores or distribution channels, returned to vendors, or liquidated. These estimates require judgment. However, we have a significant amount of experience with managing inventory upon the closure or consolidation of facilities, as well as in the context of making significant changes to the merchandise assortment. Therefore, we do not believe our estimates will yield material differences in the future.
Purchase and Advertising Rebates: We earn rebates from our vendors, which are based on various quantitative contract terms that can be complex and subject to interpretation. Amounts expected to be received from vendors that relate to the purchase of merchandise inventories are recognized as a reduction of inventory cost and realized as part of cost of goods sold as the merchandise is sold. Amounts that represent reimbursement for specific, incremental costs we incur related to selling a vendor's products, such as advertising, are recorded as an offset to those costs when they are recognized in our consolidated statement of income. Several controls are in place, including direct confirmation with vendors, which we believe allows us to ensure that these amounts are recorded in accordance with the terms of the contracts.
Past experience has shown little variability in purchase and advertising rebate estimates, no collectibility issues and no significant write-off history. Given the historical accuracy of our estimates, we believe that a significant change in our estimates is not likely.
Impairment of Goodwill: See our accounting policy related to testing goodwill for impairment in Note A - Summary of Significant Accounting Policies in the Notes to the Consolidated Financial Statements.
For the annual test in 2015, we performed an optional qualitative assessment for our North American reporting units (combined goodwill of $1.9 billion at the time of the impairment test) to determine whether it was more likely than not that their fair values were less than their carrying amounts. The assessment requires management to identify the key drivers of fair value for the reporting units, to consider all significant events and circumstances that are relevant to their fair values, and then to weigh the positive and negative evidence. Examples of factors considered include trends and conditions in the macro economy, industry, and financial markets, as well as Staples-specific factors that would likely be considered by market participants, such as recent financial results and our latest forecasts, our current strategic plans, and our stock price. This process requires management to exercise a great deal of judgment. Based on our assessment, we concluded that it was more likely than not that the reporting units’ fair values continued to exceed their carrying values by significant margins, and accordingly that it was not necessary to perform the quantitative impairment test for these reporting units.
For our international reporting units (combined goodwill of $728 million at the time of the impairment test), we proceeded directly to the quantitative impairment test. In step one, we determined fair value using discounted cash flow ("DCF") analysis, which requires management to make assumptions and develop estimates regarding industry and economic factors and the future profitability of our businesses. The key assumptions and estimates used in the discounted cash flow approach include:
• | The reporting unit's projections of financial results over periods that range from six to fifteen years, depending on the maturity of the underlying business. Our reporting units' fair values are most sensitive to our sales growth and operating profit rate assumptions, which represent estimates based on our current and projected sales mix, profit improvement opportunities and market conditions. |
B-9
STAPLES, INC. AND SUBSIDIARIES
Management's Discussion and Analysis of Financial Condition and
Results of Operations (continued)
• | The discount rate, which is used to measure the present value of the reporting unit’s projected future cash flows, including those relating to the reporting unit's terminal value. The discount rate is based on a weighted-average cost of capital ("WACC") that reflects market and industry data as well as our specific risk factors that are likely to be considered by a market participant. The WACC is our estimate of the overall after-tax rate of return required by equity and debt holders of a business enterprise. |
• | The reporting unit's perpetual growth rate, which is based on projections for long-term GDP growth in the reporting unit’s local economy and a consideration of trends that indicate its long-term market opportunity. While we believe our growth assumptions are reasonable, actual growth rates may be lower due to a variety of potential causes, such as a secular decline in demand for our products and services, unforeseen competition, long-term GDP growth rates in established economies being lower than projected growth rates, or a long-term deceleration in the growth rates of emerging markets. |
The fair values of our reporting units are based on underlying assumptions that represent our best estimates. Many of the factors used in assessing fair value are outside of the control of management and if actual results are not consistent with our assumptions and judgments, we could experience future impairment charges. To validate the reasonableness of our reporting units' estimated fair values, we reconcile the aggregate fair values of our reporting units to our total market capitalization. This exercise required judgment for our 2015 impairment test, given that it incorporated high-level estimates of the fair values of the reporting units for which we relied on the optional qualitative screen.
Based on the results of our testing in 2015, we determined that no impairment charges were required. See Note C - Goodwill and Long-Lived Assets in the Notes to the Consolidated Financial Statements for information related to the impairment charges recorded in 2014.
Following are key factors that could potentially result in future impairment charges:
• | Deterioration in macroeconomic or industry conditions, or a failure to manage our businesses successfully, could result in our reporting units’ actual future financial results to be lower than management’s projections; |
• | Adverse changes in market and economic conditions could increase the reporting units’ WACC’s; and, |
• | A sustained and significant decline in our stock price could result in a decline in the value of some or all of our reporting units. |
As of January 30, 2016, our Europe Online, China, and Australia reporting units continue to be at an increased risk for future impairment charges. These reporting units have associated goodwill balances as of that date of $266 million, $76 million, and $49 million, respectively. Our Europe Online reporting unit has experienced ongoing challenges transitioning from its legacy catalog business model to an online model. In 2014 we recorded goodwill impairment charges related to our China and Australia reporting units of $280 million and $116 million, respectively. While our China and Australia reporting units experienced improved sales and profitability in 2015, the valuations for these reporting units are predicated on continued improvement in the future.
Impairment of Long-Lived Assets: We evaluate long-lived assets for impairment whenever events and circumstances indicate that the carrying value of an asset may not be recoverable. Our policy is to evaluate long-lived assets for impairment at the lowest level for which there are clearly identifiable cash flows that are largely independent of the cash flows of other assets and liabilities. Recoverability is measured based upon the estimated undiscounted cash flows expected to be generated from the use of an asset plus any net proceeds expected to be realized upon its eventual disposition. Our cash flow projections are based on historical cash flows and our latest forecasts and projections. An impairment loss is recognized if an asset's carrying value is not recoverable and if it exceeds its fair value.
We estimate the undiscounted cash flows that will be generated over the asset's remaining useful life, or, in the case of an asset group, over the remaining useful life of the primary asset from which the group derives its cash flow generating capacity. Upon the occurrence of indicators of impairment, we reassess the remaining useful life of the asset or primary asset in the case of an asset group. The projections, estimates and assumptions reflected in our long-lived asset impairment testing require a significant degree of judgment on the part of management.
In 2015 we recorded total impairment charges of $50 million. Of this amount, $22 million relates to fixed assets, primarily at certain North American and European retail stores (locations not yet identified for closure) that we determined were not recoverable from future cash flows, primarily due to declining sales. The charges also include $6 million primarily related to fixed assets at North American retail stores that are closing pursuant to our plan to close at least 225 North American stores by the end of 2015, and $22 million related to certain software assets in our North American Stores & Online segment which were disposed of in 2015 and for which we concluded the fair value was not material.
B-10
STAPLES, INC. AND SUBSIDIARIES
Management's Discussion and Analysis of Financial Condition and
Results of Operations (continued)
For retail store impairment testing, in general we consider the individual store to be the lowest level at which to test store assets for impairment. For stores that have been approved for closure, we estimate future cash flows to be generated by the stores through their planned closure dates. For other stores, we estimate future cash flows over the stores' remaining lease terms, or if the store is owned, over the remaining depreciable life of the building. Forecasting future sales and profitability for an individual store, in some cases over long periods, requires a significant amount of judgment. If actual results are less favorable than management's projections, estimates and assumptions, additional write-offs in the future may be necessary.
For stores or other assets that failed the recoverability test, we measured the fair value of the impaired assets using the income approach, specifically the discounted cash flow method, which incorporated Level 3 inputs as defined in Accounting Standards Codification ("ASC") Topic 820 Fair Value Measurement ("ASC Topic 820"). We considered the expected net cash flows to be generated by the use of the assets over the remaining useful life of the primary asset, as well as the expected cash proceeds from the disposition of the assets, if any.
Pension Benefits: Our pension costs and obligations are dependent on various assumptions. Our major assumptions primarily relate to expected long-term rates of return on plan assets, discount rates and inflation. In estimating the expected return on plan assets, we take into account the historical performance for the major asset classes held, or anticipated to be held, by the applicable pension funds and current forecasts of future rates of return for those asset classes. We base the discount rate on the interest rate on high quality (AA rated) corporate bonds that have a maturity approximating the term of the related obligations. We also make assumptions regarding employee demographic factors such as retirement patterns, mortality, turnover and the rate of compensation increases.
Based on our analysis of the financial impact of pension obligation assumptions and estimates, we do not believe these assumptions and estimates will have a material impact on our financial statements. The effect on pension obligations at January 30, 2016 of a change in discount rate and other assumptions is included in Note L - Pension and Other Post-Retirement Benefit Plans in the Notes to the Consolidated Financial Statements.
Income Taxes: The amount of income taxes we pay is subject to ongoing audits by federal, state and foreign tax authorities, which may result in proposed assessments. Our estimate for the potential outcome for any uncertain tax issue is highly judgmental. We assess our income tax positions and record tax benefits for all years subject to examination based upon our evaluation of the facts, circumstances and information available at the reporting date. For those tax positions for which it is more likely than not that a tax benefit will be sustained, we record the largest amount of tax benefit likely of being realized upon settlement with a taxing authority that has full knowledge of all relevant information. Interest is accrued, where applicable. We recognize net tax-related interest and penalties in income tax expense. If we do not believe that it is more likely than not that a tax benefit will be sustained, no tax benefit is recognized. However, our future results may include favorable or unfavorable adjustments to our estimated tax liabilities due to closure of income tax examinations, new regulatory or judicial pronouncements, the expiration of statutes of limitations, or other relevant events. As a result, our effective tax rate may fluctuate significantly on a quarterly and annual basis.
We record deferred income tax assets for timing differences related to tax payments. We record a valuation allowance to reduce our deferred income tax assets to the amount that is more likely than not to be realized. We have considered estimated future taxable income and ongoing tax planning strategies in assessing the amount needed for the valuation allowance. If actual results differ unfavorably from those estimates used, we may not be able to realize all or part of our net deferred tax assets and additional valuation allowances may be required.
Definition of comparable sales
We refer to comparable sales in our analysis of the results of operations of our North American Stores & Online segment. Comparable sales reflect comparable store sales (as defined below) for our North American retail stores, plus growth in Staples.com excluding the impact of foreign currency translation.
Definition of comparable store sales
Comparable store sales represents a comparison of sales for a particular store in the current period with sales for that same store in the corresponding period in the prior year. Stores become comparable as of the beginning of the 13th full fiscal month in which they are open. For stores that we close, the stores remain comparable through their last full fiscal monthly period of sales. For relocations, if the new store location opens within four days of the closure of the old location, and within a five mile radius of the old location, then the sales for the new location are compared with the sales for the old location; otherwise, the old location is treated as a closure and the new location is treated as an opening of a new store. For foreign locations, comparable stores sales exclude the impact of foreign currency translation. Comparable store sales figures exclude online sales. Transactions at in-store kiosks are included in comparable store sales if payment is made through the Company's point-of-sale systems.
B-11
STAPLES, INC. AND SUBSIDIARIES
Management's Discussion and Analysis of Financial Condition and
Results of Operations (continued)
Recently Adopted Accounting Pronouncements
See Note A in the Notes to the Consolidated Financial Statements for a summary of recently adopted accounting pronouncements.
Liquidity and Capital Resources
Cash Flows
2015 Compared to 2014
Cash provided by operations was $978 million for 2015 compared to $1.0 billion for 2014, a decrease of $65 million. The decrease was driven by lower net income adjusted for non-cash expenses, partly offset by favorable changes in operating assets and liabilities.
Cash used in investing activities was $374 million for 2015 compared to $375 million for 2014, a decrease of $1 million. Capital spending increased by $20 million year-over-year, primarily due to investments in our online businesses and investments aimed at improving the productivity of existing stores. In 2015, we spent a net $22 million to acquire three small businesses, which compares with $78 million spent in 2014 for the acquisition of two small businesses. In 2015 and 2014 we received net proceeds of $29 million and $64 million, respectively, related to the sale of businesses and other assets.
Cash used in financing activities was $378 million for 2015 compared to $493 million for 2014, a decrease of $115 million. As a result of cash planning related to our proposed acquisition of Office Depot, we did not repurchase any shares under our share repurchase plan in 2015, whereas in 2014 we spent $189 million to repurchase 15.3 million shares. We paid quarterly cash dividends of $0.12 per share in both 2015 and 2014 for an aggregate payment of $308 million in 2015 compared with $307 million in 2014.
2014 Compared to 2013
Cash provided by operations was $1.0 billion for 2014 compared to $1.1 billion for 2013. The $65 million decrease in operating cash flow from 2013 to 2014 was primarily due to a decline in net income adjusted for non-cash expenses compared with 2013.
Cash used in investing activities was $375 million for 2014 compared to $479 million for 2013, a decrease of $104 million. The decline was primarily driven by the fact that in 2014 we sold three small business units for $59 million in net cash, whereas in 2013 our disposal of PSD and the termination of our joint venture in India yielded a combined $47 million net cash outflow.
Cash used in financing activities was $493 million for 2014 compared to $1.4 billion for 2013, a decrease of $949 million. The decline was primarily attributable to the repayment of the $867 million remaining principal balance of our 9.75% notes upon their maturity in January 2014, and a $132 million reduction in cash used to repurchase shares compared with fiscal 2013.
B-12
STAPLES, INC. AND SUBSIDIARIES
Management's Discussion and Analysis of Financial Condition and
Results of Operations (continued)
Contractual Obligations and Commercial Commitments
A summary, as of January 30, 2016, of our contractual obligations and balances available under credit agreements is presented below (amounts in millions):
Payments Due By Period | ||||||||||||||||||||||||
Contractual Obligations and Commercial Commitments (1)(2)(6) | Available Credit | Total Outstanding Obligations | Less than 1 Year | 1-3 Years | 3-5 Years | More than 5 Years | ||||||||||||||||||
January 2018 Notes (5) | $ | — | $ | 500 | $ | — | $ | 500 | $ | — | $ | — | ||||||||||||
January 2023 Notes (5) | — | 500 | — | — | — | 500 | ||||||||||||||||||
May 2018 Revolving Credit Facility | 1,000 | — | — | — | — | — | ||||||||||||||||||
Other lines of credit | 88 | 2 | 2 | — | — | — | ||||||||||||||||||
Other notes and capital leases | — | 39 | 15 | 21 | 3 | — | ||||||||||||||||||
Total (5) | $ | 1,088 | $ | 1,041 | $ | 17 | $ | 521 | $ | 3 | $ | 500 | ||||||||||||
Interest payments | — | $ | 181 | $ | 36 | $ | 57 | $ | 44 | $ | 44 | |||||||||||||
Commitment fees (7) | — | $ | 92 | $ | 92 | $ | — | $ | — | $ | — | |||||||||||||
Operating leases (3) | — | $ | 2,662 | $ | 685 | $ | 987 | $ | 547 | $ | 443 | |||||||||||||
Purchase obligations (4) | — | $ | 614 | $ | 460 | $ | 105 | $ | 47 | $ | 2 | |||||||||||||
(1) | See Note J - Income Taxes in the Notes to the Consolidated Financial Statements for information related to our unrecognized tax benefits. |
(2) | The above table excludes expected future contributions to our pension and post-retirement benefit plans. See Note L - Pension and Other Post-Retirement Benefit Plans in the Notes to the Consolidated Financial Statements for details about these future contributions. |
(3) | The operating lease payments reported above do not include common area maintenance or real estate taxes, which are expected to approximate 28% to 31% of the related operating lease payments. Utility costs related to leased facilities have also been excluded from this table because the payments do not represent contractual obligations until the services have been provided. Future annual minimum payments include restructuring-related obligations as of January 30, 2016. |
(4) | Many of our purchase commitments may be canceled by us without advance notice or payment, and we have excluded such commitments, along with intercompany commitments. Contracts that may be terminated by us without cause or penalty but require advance notice for termination are valued on the basis of an estimate of what we would owe under the contract upon providing notice of termination. |
(5) | See Note F in the Notes to the Consolidated Financial Statements for information related to our $500 million 2.75% senior notes due January 2018 ("January 2018 Notes") and $500 million 4.375% senior notes due January 2023 ("January 2023 Notes"). The amounts shown in the table above represent the par value of the debt obligations. The funds provided by these issuances were used for general corporate purposes. |
(6) | As of January 30, 2016, Staples had open standby letters of credit totaling $99 million. |
(7) | Represents fees incurred during 2015 related to commitments for term loan financing for our proposed acquisition of Office Depot. See Note R - Proposed Acquisition of Office Depot in the Notes to the Consolidated Financial Statements for additional information. |
There were no instances of default during 2015 under any of our debt agreements.
Off-Balance Sheet Financing Arrangements
We do not have any off-balance sheet financing arrangements as of January 30, 2016, nor did we utilize any during 2015.
Sources of Liquidity
To cover seasonal fluctuations in cash flows and to support our various initiatives, we use cash generated from operations and borrowings available under various credit facilities and a commercial paper program. As of January 30, 2016, we had $1.9 billion in total cash and funds available through credit agreements, which consisted of $1.1 billion of available credit and $825 million of cash and cash equivalents.
Of the $825 million in cash and cash equivalents, approximately $339 million is held at entities located in jurisdictions outside the United States and for which there could be tax consequences if such amounts were moved out of these jurisdictions or repatriated to the United States. We currently intend to use most of the cash and cash equivalents held outside of the United States
B-13
STAPLES, INC. AND SUBSIDIARIES
Management's Discussion and Analysis of Financial Condition and
Results of Operations (continued)
to finance the obligations and current operations of our foreign businesses. The determination of the amount of the unrecognized deferred tax liability related to the undistributed earnings is not practicable because of the complexities associated with its hypothetical calculation.
Our $1.1 billion of available credit includes $1.0 billion of maximum borrowing capacity available under our revolving credit facility with Bank of America and other lending institutions. We also have a commercial paper program that allows us to issue up to $1.0 billion of unsecured commercial paper notes from time to time, and for which our $1.0 billion revolving credit facility serves as a back-up. We did not borrow under our credit facility or commercial paper program during 2015. See Note F - Debt and Credit Agreements in the Notes to the Consolidated Financial Statements for additional information related to our credit facility and commercial paper program.
We also have various other lines of credit under which we may currently borrow a maximum of $88 million. At January 30, 2016, we had outstanding borrowings and letters of credit of $2 million, leaving $86 million of available credit at that date. During 2015 and 2014 we entered into new capital lease obligations of $12 million and $40 million, respectively. In 2015 we also assumed equipment financing obligations of $4 million in conjunction with our acquisition of a small business in Europe.
In connection with our proposed acquisition of Office Depot, during 2015 we obtained commitments for a 5-year $3 billion asset-based revolving credit facility and a 6-year $2.75 billion term loan. On February 2, 2016, we entered into an agreement under which the commitments for the asset-based revolving credit facility were extended until May 10, 2016 (which may be further extended until September 10, 2016 if the FTC agrees, or a court of competent jurisdiction determines, that the merger is permitted to proceed). The asset-based revolving credit facility will replace the Company's existing $1.0 billion revolving credit facility if the acquisition is completed, and the existing credit facility will remain in place if the transaction is not completed. Also on February 2, 2016, we entered into a definitive term loan agreement with certain lenders under which we borrowed $2.5 billion, the proceeds for which were placed into an escrow account. If we successfully complete the acquisition of Office Depot, the proceeds will be released to Staples and used to help fund the acquisition. Otherwise, the proceeds would be repaid to the lenders together with accrued interest and fees. See Note R - Proposed Acquisition of Office Depot in the Notes to the Consolidated Financial Statements for additional information related to these sources of financing.
Taking into consideration the amount of cash expected to be required for our planned acquisition of Office Depot as well as the acquisition financing discussed above, we expect that our cash generated from operations, together with our current cash, funds available under our existing credit agreements and other alternative sources of financing, will be sufficient to fund our planned capital expenditures, obligations associated with our restructuring and transformation initiatives, and other operating cash needs for at least the next twelve months.
Uses of Capital
As a result of our planned acquisition of Office Depot, we have temporarily suspended our share repurchase program to focus on building up cash reserves ahead of the acquisition. While we did not repurchase any shares in 2015, over the long-term we expect to continue buying back stock. The remaining repurchase authorization under our current repurchase plan, which has no expiration date, is $373 million.
We may use capital to engage in strategic acquisitions such as the proposed acquisition of Office Depot. We consider many types of acquisitions for their strategic and other benefits.
We are committed to maintaining our current quarterly dividend of $0.12 per share. We paid quarterly dividends of $0.12 per share during 2015, 2014 and 2013. While it is our intention to continue to pay quarterly cash dividends for 2016 and beyond, any decision to pay future cash dividends will be made by our Board of Directors and will depend upon our earnings, financial condition and other factors.
Excluding any impact from our proposed acquisition of Office Depot, we expect a moderate decrease in capital spending in 2016 compared with 2015, as we focus spending on strategic priorities. We expect the source of funds for our capital expenditures to come primarily from operating cash flows.
Inflation and Seasonality
While neither inflation nor deflation has had, nor do we expect them to have, a material impact upon our consolidated operating results, we may see price increases in certain categories from time to time. Our business is somewhat seasonal, with sales and profitability historically higher during the second half of our fiscal year due to the back-to-school, holiday and January back-to-business seasons.
B-14
STAPLES, INC. AND SUBSIDIARIES
Management's Discussion and Analysis of Financial Condition and
Results of Operations (continued)
Quantitative and Qualitative Disclosures about Market Risks
We are exposed to market risk from changes in interest rates and foreign exchange rates. We have a risk management control process to monitor our interest rate and foreign exchange risks. The risk management process uses analytical techniques, including market value, sensitivity analysis and value at risk estimates.
Interest Rate Risk
At January 30, 2016, we did not have any material variable rate debt obligations. As discussed in Note R - Proposed Acquisition of Office Depot in the Notes to the Consolidated Financial Statements, on February 2, 2016 we borrowed $2.5 billion under a variable rate term loan agreement in connection with our planned acquisition of Office Depot, with the proceeds deposited into escrow accounts pending the closing of the acquisition. See Note R for additional information related to this loan.
In certain instances we may use interest rate swap agreements to modify fixed rate obligations to variable rate obligations, thereby adjusting the interest rates to current market rates and ensuring that the debt instruments are always reflected at fair value. We had no interest rate swap agreements outstanding as of January 30, 2016 and January 31, 2015.
Foreign Currency Risk
We are exposed to foreign exchange risks through our business operations and investments in subsidiaries in Canada, Europe, Australia, South America and Asia. The currencies for which we have the most significant exposure to exchange rate fluctuations include the Canadian Dollar, the Euro, the Norwegian Krone, the British Pound Sterling, the Australian Dollar and the Chinese Renminbi.
Revenue and expense transactions in our foreign subsidiaries are primarily denominated in the respective local currencies. The income statements of our international operations are translated into U.S. dollars at the average exchange rates in each applicable period. To the extent the U.S. dollar weakens against foreign currencies, the translation of these foreign currency-denominated transactions results in increased revenues and operating expenses for our international operations. Conversely, our revenues and operating expenses will decrease for our international operations when the U.S. dollar strengthens against foreign currencies. While the matching of local currency revenues and local currency expenses provides in effect a natural hedge, such matching does not completely reduce the foreign currency exchange rate exposure. Revenues from our foreign operations accounted for approximately 26% and 29% of consolidated revenues in 2015 and 2014, respectively.
The conversion of our foreign subsidiaries' financial statements into U.S. dollars will lead to a translation gain or loss which is recorded as a component of Other comprehensive income (loss) in stockholders' equity. In 2015 and 2014, we recorded consolidated foreign currency translation losses of approximately $132 million and $403 million, respectively. In addition, certain of our foreign subsidiaries have assets and liabilities that are denominated in currencies other than the relevant entity's functional currency. Changes in the functional currency value of these assets and liabilities will result in a transaction gain or loss. In 2015 we recorded foreign currency transaction net losses of $4 million, which are recorded in Other income (expense), net in our consolidated statement of income. In 2014, our foreign currency transaction net gain was de minimis.
Our international business is subject to risks, including, but not limited to differing economic conditions, changes in political climate, differing tax structures, and other regulations and restrictions, all of which may influence foreign currency exchange rate volatility. Accordingly, our future results could be materially adversely impacted by changes in these or other factors. As exchange rates vary, our international financial results may vary from expectations and adversely impact our overall operating results.
In accordance with our risk management policies, we use derivative instruments on a limited basis to hedge our foreign currency exposures (see Note H - Derivative Instruments and Hedging Activities in the Notes to the Consolidated Financial Statements). As of January 30, 2016 and January 31, 2015, we had no outstanding foreign currency derivative agreements designated as hedges.
B-15
Item 8 | APPENDIX C | |
INDEX TO CONSOLIDATED FINANCIAL STATEMENTS
Page | ||
Consolidated Balance Sheets - January 30, 2016 and January 31, 2015 | ||
Consolidated Statements of Income - Fiscal years ended January 30, 2016, January 31, 2015 and February 1, 2014 | ||
Consolidated Statements of Comprehensive Income - Fiscal years ended January 30, 2016, January 31, 2015 and February 1, 2014 | ||
Consolidated Statements of Stockholders' Equity - Fiscal years ended January 30, 2016, January 31, 2015 and February 1, 2014 | ||
Consolidated Statements of Cash Flows - Fiscal years ended January 30, 2016, January 31, 2015 and February 1, 2014 | ||
C-1
Report of Independent Registered Public Accounting Firm
The Board of Directors and Shareholders of
Staples, Inc.
We have audited the accompanying consolidated balance sheets of Staples, Inc. and subsidiaries as of January 30, 2016 and January 31, 2015, and the related consolidated statements of income, comprehensive income, shareholders' equity and cash flows for each of the three years in the period ended January 30, 2016. Our audits also included the financial statement schedule listed in the Index at Item 15(a)2. These financial statements and schedule are the responsibility of the Company's management. Our responsibility is to express an opinion on these financial statements and schedule based on our audits.
We conducted our audits in accordance with the standards of the Public Company Accounting Oversight Board (United States). Those standards require that we plan and perform the audit to obtain reasonable assurance about whether the financial statements are free of material misstatement. An audit includes examining, on a test basis, evidence supporting the amounts and disclosures in the financial statements. An audit also includes assessing the accounting principles used and significant estimates made by management, as well as evaluating the overall financial statement presentation. We believe that our audits provide a reasonable basis for our opinion.
In our opinion, the financial statements referred to above present fairly, in all material respects, the consolidated financial position of Staples, Inc. and subsidiaries at January 30, 2016 and January 31, 2015, and the consolidated results of their operations and their cash flows for each of the three years in the period ended January 30, 2016, in conformity with U.S. generally accepted accounting principles. Also, in our opinion, the related financial statement schedule, when considered in relation to the basic financial statements taken as a whole, present fairly in all material respects the information set forth therein.
We also have audited, in accordance with the standards of the Public Company Accounting Oversight Board (United States), Staples, Inc.’s internal control over financial reporting as of January 30, 2016, based on criteria established in Internal Control-Integrated Framework issued by the Committee of Sponsoring Organizations of the Treadway Commission (2013 framework), and our report dated March 4, 2016 expressed an unqualified opinion thereon.
As discussed in Note A to the consolidated financial statements, in 2015 the Company changed the manner in which it accounts for the classification of deferred taxes in the consolidated balance sheets due to the adoption of ASU 2015-17, Balance Sheet Classification of Deferred Taxes.
/s/ Ernst & Young LLP | |
Boston, Massachusetts | |
March 4, 2016 | |
C-2
STAPLES, INC. AND SUBSIDIARIES
Consolidated Balance Sheets
(Dollar Amounts in Millions, Except Share Data)
See notes to consolidated financial statements.
January 30, 2016 | January 31, 2015 | |||||||
ASSETS | ||||||||
Current assets: | ||||||||
Cash and cash equivalents | $ | 825 | $ | 627 | ||||
Receivables, net | 1,899 | 1,928 | ||||||
Merchandise inventories, net | 2,078 | 2,144 | ||||||
Prepaid expenses and other current assets | 310 | 252 | ||||||
Total current assets | 5,112 | 4,951 | ||||||
Property and equipment: | ||||||||
Land and buildings | 908 | 948 | ||||||
Leasehold improvements | 1,184 | 1,231 | ||||||
Equipment | 2,902 | 2,825 | ||||||
Furniture and fixtures | 967 | 1,016 | ||||||
Total property and equipment | 5,961 | 6,020 | ||||||
Less: Accumulated depreciation | 4,375 | 4,314 | ||||||
Net property and equipment | 1,586 | 1,706 | ||||||
Intangible assets, net of accumulated amortization | 274 | 335 | ||||||
Goodwill | 2,653 | 2,680 | ||||||
Other assets | 547 | 636 | ||||||
Total assets | $ | 10,172 | $ | 10,308 | ||||
LIABILITIES AND STOCKHOLDERS’ EQUITY | ||||||||
Current liabilities: | ||||||||
Accounts payable | $ | 1,894 | $ | 1,867 | ||||
Accrued expenses and other current liabilities | 1,353 | 1,330 | ||||||
Debt maturing within one year | 17 | 92 | ||||||
Total current liabilities | 3,264 | 3,289 | ||||||
Long-term debt, net of current maturities | 1,018 | 1,018 | ||||||
Other long-term obligations | 506 | 688 | ||||||
Stockholders’ equity: | ||||||||
Preferred stock, $.01 par value, 5,000,000 shares authorized; no shares issued | — | — | ||||||
Common stock, $.0006 par value, 2,100,000,000 shares authorized; issued and outstanding 946,964,792 and 645,723,603 shares at January 30, 2016 and 941,561,541 shares and 640,320,352 shares at January 31, 2015, respectively | 1 | 1 | ||||||
Additional paid-in capital | 5,010 | 4,935 | ||||||
Accumulated other comprehensive loss | (1,116 | ) | (1,041 | ) | ||||
Retained earnings | 6,900 | 6,829 | ||||||
Less: Treasury stock at cost, 301,241,189 shares at January 30, 2016 and January 31, 2015 | (5,419 | ) | (5,419 | ) | ||||
Total Staples, Inc. stockholders’ equity | 5,376 | 5,305 | ||||||
Noncontrolling interests | 8 | 8 | ||||||
Total stockholders’ equity | 5,384 | 5,313 | ||||||
Total liabilities and stockholders’ equity | $ | 10,172 | $ | 10,308 | ||||
C-3
STAPLES, INC. AND SUBSIDIARIES
Consolidated Statements of Income
(Dollar Amounts in Millions, Except Share Data)
Fiscal Year Ended | ||||||||||||
January 30, 2016 | January 31, 2015 | February 1, 2014 | ||||||||||
Sales | $ | 21,059 | $ | 22,492 | $ | 23,114 | ||||||
Cost of goods sold and occupancy costs | 15,545 | 16,691 | 17,082 | |||||||||
Gross profit | 5,514 | 5,801 | 6,032 | |||||||||
Operating expenses: | ||||||||||||
Selling, general and administrative | 4,600 | 4,816 | 4,735 | |||||||||
Impairment of goodwill and long-lived assets | 50 | 470 | — | |||||||||
Restructuring charges | 151 | 171 | 64 | |||||||||
Amortization of intangibles | 67 | 62 | 55 | |||||||||
Total operating expenses | 4,868 | 5,518 | 4,855 | |||||||||
(Loss) gain on sale of businesses and assets, net | (5 | ) | 27 | — | ||||||||
Operating income | 641 | 310 | 1,177 | |||||||||
Other income (expense): | ||||||||||||
Interest income | 3 | 3 | 5 | |||||||||
Interest expense | (139 | ) | (49 | ) | (119 | ) | ||||||
Other income (expense), net | (13 | ) | 4 | — | ||||||||
Income from continuing operations before income taxes | 492 | 268 | 1,063 | |||||||||
Income tax expense | 113 | 133 | 356 | |||||||||
Income from continuing operations | 379 | 135 | 707 | |||||||||
Discontinued operations: | ||||||||||||
Loss from discontinued operations, net of income taxes | — | — | (87 | ) | ||||||||
Net income | $ | 379 | $ | 135 | $ | 620 | ||||||
Basic Earnings Per Common Share: | ||||||||||||
Continuing operations | $ | 0.59 | $ | 0.21 | $ | 1.08 | ||||||
Discontinued operations | — | — | (0.13 | ) | ||||||||
Net income | $ | 0.59 | $ | 0.21 | $ | 0.95 | ||||||
Diluted Earnings per Common Share: | ||||||||||||
Continuing operations | $ | 0.59 | $ | 0.21 | $ | 1.07 | ||||||
Discontinued operations | — | — | (0.13 | ) | ||||||||
Net income | $ | 0.59 | $ | 0.21 | $ | 0.94 | ||||||
Dividends declared per common share | $ | 0.48 | $ | 0.48 | $ | 0.48 | ||||||
C-4
STAPLES, INC. AND SUBSIDIARIES
Consolidated Statements of Comprehensive Income
(Dollar Amounts in Millions)
Fiscal Year Ended | ||||||||||||
January 30, 2016 | January 31, 2015 | February 1, 2014 | ||||||||||
Consolidated net income | $ | 379 | $ | 135 | $ | 620 | ||||||
Other comprehensive income (loss), net of tax: | ||||||||||||
Foreign currency translation adjustments | (132 | ) | (403 | ) | (127 | ) | ||||||
Disposal of foreign business, net | — | (1 | ) | 8 | ||||||||
Deferred pension and other post-retirement benefit costs, net | 57 | (130 | ) | 1 | ||||||||
Other comprehensive loss, net of tax | (75 | ) | (534 | ) | (118 | ) | ||||||
Consolidated comprehensive income (loss) | $ | 304 | $ | (399 | ) | $ | 502 | |||||
C-5
STAPLES, INC. AND SUBSIDIARIES
Consolidated Statements of Stockholders' Equity
(Dollar and Share Amounts in Millions)
Equity Attributed to Staples, Inc. | ||||||||||||||||||||||||||||||||
Outstanding Common Stock | Common Stock | Additional Paid-In Capital | Accumulated Other Comprehensive Loss | Retained Earnings | Treasury Stock | Non- controlling Interests | Total Stockholders Equity | |||||||||||||||||||||||||
Balances at February 2, 2013 | 669 | $ | 1 | $ | 4,711 | $ | (389 | ) | $ | 6,694 | $ | (4,889 | ) | $ | 8 | $ | 6,136 | |||||||||||||||
Issuance of common stock for stock options exercised | 3 | — | 38 | — | — | — | — | 38 | ||||||||||||||||||||||||
Net tax expense related to shortfall on exercise of stock options | — | — | (6 | ) | — | — | — | — | (6 | ) | ||||||||||||||||||||||
Stock-based compensation | — | — | 81 | — | — | — | — | 81 | ||||||||||||||||||||||||
Sale of common stock under employee stock purchase plan | 4 | — | 43 | — | — | — | — | 43 | ||||||||||||||||||||||||
Net income for the year | — | — | — | — | 620 | — | — | 620 | ||||||||||||||||||||||||
Common stock dividend | — | — | — | — | (313 | ) | — | — | (313 | ) | ||||||||||||||||||||||
Other comprehensive loss | — | — | — | (118 | ) | — | — | — | (118 | ) | ||||||||||||||||||||||
Repurchase of common stock | (23 | ) | — | — | — | — | (340 | ) | — | (340 | ) | |||||||||||||||||||||
Balances at February 1, 2014 | $ | 653 | $ | 1 | $ | 4,866 | $ | (507 | ) | $ | 7,001 | $ | (5,229 | ) | $ | 8 | $ | 6,141 | ||||||||||||||
C-6
Equity Attributed to Staples, Inc. | |||||||||||||||||||||||||||||||
Outstanding Common Stock | Common Stock | Additional Paid-In Capital | Accumulated Other Comprehensive Loss | Retained Earnings | Treasury Stock | Non- controlling Interests | Total Stockholders Equity | ||||||||||||||||||||||||
Issuance of common stock for stock options exercised | 1 | $ | — | $ | 11 | $ | — | $ | — | $ | — | $ | — | $ | 11 | ||||||||||||||||
Net tax expense related to shortfall on exercise of stock options | — | — | (27 | ) | — | — | — | — | (27 | ) | |||||||||||||||||||||
Stock-based compensation | — | — | 64 | — | — | — | — | 64 | |||||||||||||||||||||||
Sale of common stock under employee stock purchase plan | 3 | — | 38 | — | — | — | — | 38 | |||||||||||||||||||||||
Net income for the year | — | — | — | — | 135 | — | — | 135 | |||||||||||||||||||||||
Common stock dividend | — | — | — | — | (307 | ) | — | — | (307 | ) | |||||||||||||||||||||
Other comprehensive loss | — | — | — | (534 | ) | — | — | — | (534 | ) | |||||||||||||||||||||
Repurchase of common stock | (17 | ) | — | (18 | ) | — | — | (190 | ) | — | (208 | ) | |||||||||||||||||||
Other | — | — | 1 | — | — | — | — | 1 | |||||||||||||||||||||||
Balances at January 31, 2015 | 640 | $ | 1 | $ | 4,935 | $ | (1,041 | ) | $ | 6,829 | $ | (5,419 | ) | $ | 8 | $ | 5,313 | ||||||||||||||
Issuance of common stock for stock options exercised | 1 | — | 7 | — | — | — | — | 7 | |||||||||||||||||||||||
Shares issued upon grant of Restricted Stock Awards and vesting of Restricted Stock Units, net of forfeitures | 3 | — | — | — | — | — | — | — | |||||||||||||||||||||||
Net tax expense related to shortfall on exercise of stock options | — | — | (6 | ) | — | — | — | — | (6 | ) | |||||||||||||||||||||
Stock-based compensation | — | — | 63 | — | — | — | — | 63 | |||||||||||||||||||||||
Sale of common stock under employee stock purchase plan | 3 | — | 34 | — | — | — | — | 34 | |||||||||||||||||||||||
Net income for the year | — | — | — | — | 379 | — | — | 379 | |||||||||||||||||||||||
Common stock dividend | — | — | — | — | (308 | ) | — | — | (308 | ) | |||||||||||||||||||||
Other comprehensive loss | — | — | — | (75 | ) | — | — | — | (75 | ) | |||||||||||||||||||||
Repurchase of common stock | (1 | ) | — | (24 | ) | — | — | — | — | (24 | ) | ||||||||||||||||||||
Other | — | — | 1 | — | — | — | — | 1 | |||||||||||||||||||||||
Balances at January 30, 2016 | 646 | $ | 1 | $ | 5,010 | $ | (1,116 | ) | $ | 6,900 | $ | (5,419 | ) | $ | 8 | $ | 5,384 | ||||||||||||||
See notes to consolidated financial statements.
C-7
STAPLES, INC. AND SUBSIDIARIES
Consolidated Statements of Cash Flows
(Dollar Amounts in Millions)
Fiscal Year Ended | |||||||||||
January 30, 2016 | January 31, 2015 | February 1, 2014 | |||||||||
Operating Activities: | |||||||||||
Net income | $ | 379 | $ | 135 | $ | 620 | |||||
Adjustments to reconcile net income to net cash provided by operating activities: | |||||||||||
Depreciation | 388 | 405 | 403 | ||||||||
Amortization of intangibles | 67 | 62 | 55 | ||||||||
Loss (gain) on sale of businesses and assets, net | 5 | (27 | ) | 81 | |||||||
Impairment of goodwill and long-lived assets | 50 | 470 | — | ||||||||
Inventory write-downs related to restructuring activities | 1 | 26 | — | ||||||||
Stock-based compensation | 63 | 64 | 81 | ||||||||
Excess tax benefits from stock-based compensation arrangements | (5 | ) | (1 | ) | (2 | ) | |||||
Deferred income tax expense (benefit) | 28 | (49 | ) | 105 | |||||||
Other | 11 | 12 | (5 | ) | |||||||
Changes in assets and liabilities: | |||||||||||
Increase in receivables | (19 | ) | (184 | ) | (54 | ) | |||||
Decrease (increase) in merchandise inventories | 18 | 62 | (81 | ) | |||||||
(Increase) decrease in prepaid expenses and other assets | (41 | ) | 138 | (39 | ) | ||||||
Increase (decrease) in accounts payable | 63 | (59 | ) | 108 | |||||||
Increase (decrease) in accrued expenses and other liabilities | 110 | (24 | ) | (90 | ) | ||||||
(Decrease) increase in other long-term obligations | (140 | ) | 13 | (74 | ) | ||||||
Net cash provided by operating activities | 978 | 1,043 | 1,108 | ||||||||
Investing Activities: | |||||||||||
Acquisition of property and equipment | (381 | ) | (361 | ) | (371 | ) | |||||
Cash paid for termination of joint venture | — | — | (34 | ) | |||||||
Proceeds from the sale of property and equipment | 27 | 5 | 13 | ||||||||
Sale of businesses, net | 2 | 59 | (13 | ) | |||||||
Acquisition of businesses, net of cash acquired | (22 | ) | (78 | ) | (75 | ) | |||||
Net cash used in investing activities | (374 | ) | (375 | ) | (479 | ) | |||||
Financing Activities: | |||||||||||
Proceeds from the exercise of stock options and sale of stock under employee stock purchase plans | 41 | 49 | 81 | ||||||||
Proceeds from borrowings | 7 | 23 | 38 | ||||||||
Payments on borrowings, including payment of deferred financing fees and capital lease obligations | (99 | ) | (50 | ) | (910 | ) | |||||
Cash dividends paid | (308 | ) | (307 | ) | (313 | ) | |||||
Excess tax benefits from stock-based compensation arrangements | 5 | 1 | 2 | ||||||||
Repurchase of common stock | (24 | ) | (208 | ) | (340 | ) | |||||
Net cash used in financing activities | (378 | ) | (493 | ) | (1,442 | ) | |||||
Effect of exchange rate changes on cash and cash equivalents | (28 | ) | (48 | ) | (20 | ) | |||||
Net increase (decrease) in cash and cash equivalents | 198 | 127 | (833 | ) | |||||||
Cash and cash equivalents at beginning of period | 627 | 492 | 1,334 | ||||||||
Cash and cash equivalents at end of period | 825 | 619 | 501 | ||||||||
Less: Change in cash and cash equivalents attributed to discontinued operations | — | — | (1 | ) | |||||||
Add: Cash and cash equivalents attributed to disposal group held for sale at February 1, 2014 | — | 8 | (8 | ) | |||||||
Cash and cash equivalents at the end of the period | $ | 825 | $ | 627 | $ | 492 | |||||
C-8
STAPLES, INC. AND SUBSIDIARIES
Notes to Consolidated Financial Statements
Note A - Summary of Significant Accounting Policies
Nature of Operations: Staples, Inc. and subsidiaries ("Staples" or "the Company") is a world-class provider of products and services that serve the needs of business customers and consumers. Through its retail, online and delivery capabilities, Staples lets customers shop however and whenever they want, whether it’s in-store, online or on mobile devices. The Company has three reportable segments: North American Stores & Online, North American Commercial, and International Operations. The North American Stores & Online segment consists of the U.S. and Canadian businesses that sell products and services through retail stores and Staples.com. The North American Commercial segment consists of the U.S. and Canadian businesses that sell and deliver products and services directly to businesses and includes Staples Advantage and Quill.com. The International Operations segment consists of business units that sell and deliver products and services directly to customers in 23 countries in Europe, Australia, South America and Asia.
Basis of Presentation: The consolidated financial statements include the accounts of Staples, Inc. and its wholly and majority owned subsidiaries. All material intercompany accounts and transactions are eliminated in consolidation. The Company accounts for investments in businesses in which it owns between 20% and 50% of the voting interest using the equity method, if the Company has the ability to exercise significant influence over the investee company.
Beginning in 2015, the Company presents dollar amounts included in its financial statements and related notes rounded to the nearest million rather than thousand. Certain numbers may not sum due to rounding.
The Company's former European Printing Systems Division business (“PSD”) is presented as a discontinued operation in the consolidated statement of income in 2013. The Company completed the sale of PSD on October 5, 2013. Unless otherwise stated, any reference to the consolidated statement of income items in the notes to the consolidated financial statements refers to results from continuing operations.
Fiscal Year: Staples' fiscal year is the 52 or 53 weeks ending on the Saturday closest to January 31. Fiscal year 2015 ("2015") consisted of the 52 weeks ended January 30, 2016, fiscal year 2014 ("2014") consisted of the 52 weeks ended January 31, 2015 and fiscal year 2013 ("2013") consisted of the 52 weeks ended February 1, 2014.
Use of Estimates: The preparation of financial statements in conformity with accounting principles generally accepted in the United States of America ("U.S. GAAP") requires management of Staples to make estimates and assumptions that affect the amounts reported in the financial statements and accompanying notes. Actual results could differ from those estimates.
Cash Equivalents: Staples considers all highly liquid investments with an original maturity of three months or less to be cash equivalents. Cash equivalents also include amounts due from third-party financial institutions for credit and debit card transactions. These receivables are typically settled in less than 3 days.
Receivables: Receivables include trade receivables financed under regular commercial credit terms and other non-trade receivables. Gross trade receivables were $1.4 billion at January 30, 2016 and $1.5 billion at January 31, 2015. Concentrations of credit risk with respect to trade receivables are limited due to Staples' large number of customers and their dispersion across many industries and geographic regions.
An allowance for doubtful accounts has been recorded to reduce trade receivables to an amount expected to be collectible from customers based on specific evidence as well as historic trends. The allowance recorded at January 30, 2016 and January 31, 2015 was $32 million and $38 million, respectively.
Other non-trade receivables were $491 million at January 30, 2016 and $508 million at January 31, 2015 and consisted primarily of purchase and advertising rebates due from vendors under various incentive and promotional programs. Amounts expected to be received from vendors relating to the purchase of merchandise inventories are recognized as a reduction of inventory cost and realized as part of cost of goods sold as the merchandise is sold. Amounts expected to be received from vendors that represent reimbursement for specific, incremental costs incurred by the Company related to selling a vendor's products, such as advertising, are recorded as an offset to those costs when they are recognized in the consolidated statement of income.
Inventory: Inventory is valued at the lower of weighted-average cost or market value. The Company reserves for obsolete, overstocked and inactive inventory based on the difference between the weighted-average cost of the inventory and its estimated market value using assumptions of future demand and market conditions.
Accounts Payable: The Company has agreements with third parties to provide accounts payable tracking and payment services which facilitate participating suppliers' ability to finance payment obligations from the Company with designated third-party financial institutions. Participating suppliers may, at their sole discretion, make offers to finance one or more payment obligations of the Company prior to their scheduled due dates at a discounted price to participating financial institutions. The
C-9
STAPLES, INC. AND SUBSIDIARIES
Notes to Consolidated Financial Statements (continued)
Company has no economic interest in the sale of these receivables. The Company's obligations to its suppliers, including amounts due and scheduled payment dates, are not impacted by suppliers' decisions to finance amounts under these arrangements. The Company presents these obligations as trade accounts payable.
Property and Equipment: Property and equipment are recorded at cost. Expenditures for normal maintenance and repairs are charged to expense as incurred. Depreciation and amortization, which includes the amortization of assets recorded under capital obligations, are provided using the straight-line method over the following useful lives: 40 years for buildings; 3-10 years for furniture and fixtures; and 3-10 years for equipment, which includes computer equipment and software with estimated useful lives of 3-7 years. Leasehold improvements are amortized over the shorter of the terms of the underlying leases or the estimated economic lives of the improvements. Asset retirement obligations are recognized when incurred and the related cost is amortized over the remaining useful life of the related asset.
Lease Acquisition Costs: Lease acquisition costs, which are included in other assets, are recorded at cost and amortized using the straight-line method over the respective lease terms, including option renewal periods if renewal of the lease is reasonably assured, which range from 1 to 46 years. Lease acquisition costs, net of accumulated amortization, at January 30, 2016 and January 31, 2015 were $8 million and $11 million, respectively.
Fair Value of Financial Instruments: The Company measures the fair value of financial instruments pursuant to the guidelines of Accounting Standards Codification ("ASC") Topic 820 Fair Value Measurement ("ASC Topic 820"), which establishes a fair value hierarchy that prioritizes the inputs used to measure fair value. The hierarchy gives the highest priority to quoted prices in active markets for identical assets or liabilities (Level 1 measurement), then priority to quoted prices for similar instruments in active markets, quoted prices for identical or similar instruments in markets that are not active and model-based valuation techniques for which all significant assumptions are observable in the market (Level 2 measurement), then the lowest priority to unobservable inputs (Level 3 measurement).
Impairment of Goodwill: The Company reviews goodwill for impairment annually, in the fourth quarter, and whenever events or changes in circumstances indicate that the carrying value of a reporting unit might exceed its current fair value. For the annual test, the Company may perform an initial qualitative assessment for certain reporting units to determine whether it is more likely than not that the fair value of the reporting unit is less than its carrying amount. This assessment is used as a basis for determining whether it is necessary to perform the two step goodwill impairment test. For those reporting units for which the Company performs the two step impairment test, the Company determines fair value using discounted cash flow analysis, which requires management to make assumptions and estimates regarding industry economic factors and the future profitability of the Company's businesses. The Company does not rely on a market approach given that it believes there are an insufficient number of relevant guideline companies and comparable transactions. It is the Company's policy to allocate goodwill and conduct impairment testing at a reporting unit level based on its most current business plans, which reflect changes the Company anticipates in the economy and the industry. The Company established, and continues to evaluate, its reporting units based on its internal reporting structure and defines such reporting units at the operating segment level or one level below.
Impairment of Long-Lived Assets: The Company evaluates long-lived assets for impairment whenever events and circumstances indicate that the carrying value of an asset may not be recoverable. Recoverability is measured based upon the estimated undiscounted cash flows expected to be generated from the use of an asset plus any net proceeds expected to be realized upon its eventual disposition. An impairment loss is recognized if an asset's carrying value is not recoverable and if it exceeds its fair value. Staples' policy is to evaluate long-lived assets for impairment at the lowest level for which there are identifiable cash flows that are largely independent of the cash flows or other assets and liabilities.
Exit and Disposal Activities: The Company's policy is to recognize costs associated with exit and disposal activities, including restructurings, when a liability has been incurred. Employee termination costs associated with ongoing benefit arrangements are accrued when the obligations are considered probable and can be reasonably estimated, while costs associated with one-time benefit arrangements generally are accrued when the key terms of the arrangement have been communicated to the affected employees. Costs related to ongoing lease obligations for vacant facilities are recognized once the Company has ceased using the facility, and the related liability is recorded net of estimated future sublease income. Payments made to terminate a lease agreement prior to the end of its term are accrued when the termination agreement is signed, or when notification is given to the landlord if a lease agreement has a pre-existing termination clause. For property and equipment that the Company expects to retire at the time of a facility closing, the Company first reassesses the assets' estimated remaining useful lives and evaluates whether the assets are impaired on a held for use basis, and then accelerates depreciation as warranted.
Revenue Recognition: The Company recognizes revenue from the sale of products and services when the following four criteria are met: persuasive evidence of an arrangement exists, delivery has occurred or services have been rendered, the selling price is fixed or determinable, and collectibility is reasonably assured. Revenue is recognized for product sales at the point of sale for the Company's retail operations and at the time of shipment for its delivery sales. The Company offers its customers various coupons, discounts and rebates, which are treated as a reduction of revenue.
C-10
STAPLES, INC. AND SUBSIDIARIES
Notes to Consolidated Financial Statements (continued)
The Company evaluates whether it is appropriate to record the gross amount of product and service sales and related costs or the net amount earned as a commission. In making this determination, the Company considers several factors, including which party in the transaction is the primary obligor, the degree of inventory risk, which party establishes pricing, the Company's ability to select vendors, and whether it earns a fixed amount per transaction. Generally, when the Company is the party in the transaction with the primary obligation to the customer or is subject to inventory risk, revenue is recorded at the gross sale price, assuming other factors corroborate that the Company is the principal party in the transaction. If the Company is not primarily obligated and does not have inventory risk, it generally records the net amount as a commission earned.
Revenue arrangements with multiple deliverables that have value on a standalone basis are divided into separate units of accounting. Revenue is allocated to each deliverable using estimated selling prices if the Company does not have vendor-specific objective evidence or third-party evidence of the selling prices of the deliverables. The Company recognizes revenue for each unit of accounting based on the nature of the deliverable and the revenue recognition guidance applicable to each unit.
Revenue is recorded net of taxes collected from customers that are remitted to governmental authorities, with the collected taxes recorded as current liabilities until remitted to the relevant government authority.
Cost of Goods Sold and Occupancy Costs: Cost of goods sold and occupancy costs includes the costs of merchandise sold, inbound and outbound freight, receiving and distribution, and store and distribution center occupancy (including real estate taxes and common area maintenance).
Shipping and Handling Costs: All shipping and handling costs are included as a component of cost of goods sold and occupancy costs.
Selling, General and Administrative Expenses: Selling, general and administrative expenses include payroll, advertising and other operating expenses for the Company's stores and delivery operations not included in cost of goods sold and occupancy costs.
Advertising: Staples expenses the costs of producing an advertisement the first time the advertising takes place, except for the cost of direct response advertising, primarily catalog production costs, which are capitalized and amortized over their expected period of future benefits (i.e., the life of the catalog). Direct catalog production costs included in prepaid and other assets totaled $9 million and $10 million at January 30, 2016 and January 31, 2015, respectively. The cost of communicating an advertisement is expensed when the communication occurs. Total advertising and marketing expense was $478 million, $496 million and $499 million for 2015, 2014 and 2013, respectively.
Stock-Based Compensation: The Company accounts for stock-based compensation in accordance with ASC Topics 505 Equity and 718 Stock Compensation. Stock-based compensation for restricted stock and restricted stock units is measured based on the closing market price of the Company's common stock price on the date of grant, less the present value of dividends expected to be paid on the underlying shares but foregone during the vesting period. Stock-based compensation for stock options is measured based on the estimated fair value of each award on the date of grant using a binomial valuation model. For awards with service conditions only, the Company recognizes stock-based compensation costs as expense on a straight-line basis over the requisite service period. For awards that include performance conditions, the Company recognizes compensation expense during the performance period to the extent achievement of the performance condition is deemed probable relative to targeted performance. A change in the Company's estimate of the probable outcome of a performance condition is accounted for in the period of the change by recording a cumulative catch-up adjustment.
Pension and Other Post-Retirement Benefits: The Company maintains pension and post-retirement life insurance plans for certain employees globally. These plans include significant obligations, which are calculated based on actuarial valuations. Key assumptions used in determining these obligations and related expenses include expected long-term rates of return on plan assets, discount rates and inflation. The Company also makes assumptions regarding employee demographic factors such as retirement patterns, mortality, turnover and the rate of compensation increases. These assumptions are evaluated annually. Expected return on plan assets is determined using fair market value. The Company calculates amortization of actuarial gains and losses using the corridor approach and the estimated remaining service of plan participants.
Foreign Currency: The assets and liabilities of Staples' foreign subsidiaries are translated into U.S. dollars at current exchange rates as of the balance sheet date, and revenues and expenses are translated at average monthly exchange rates. The resulting translation adjustments are recorded as a separate component of stockholders' equity. Foreign currency transaction gains and losses relate to the settlement of assets or liabilities in a currency other than the functional currency. Foreign currency transaction losses were $4 million and $7 million for 2015 and 2013, respectively. Foreign currency transaction gains for 2014 were de minimis. These amounts are included in Other income (expense), net.
C-11
STAPLES, INC. AND SUBSIDIARIES
Notes to Consolidated Financial Statements (continued)
Derivative Instruments and Hedging Activities: The Company recognizes all derivative financial instruments in the consolidated financial statements at fair value. Changes in the fair value of derivative financial instruments that qualify for hedge accounting are recorded in stockholders' equity as a component of accumulated other comprehensive income or as an adjustment to the carrying value of the hedged item. Changes in fair values of derivatives not qualifying for hedge accounting are reported in earnings.
Accounting for Income Taxes: Deferred income tax assets and liabilities are determined based on the differences between financial reporting and tax bases of assets and liabilities and are measured using the enacted income tax rates and laws that are expected to be in effect when the temporary differences are expected to reverse. All deferred income tax assets and liabilities are classified as non-current in the consolidated balance sheets.
The Company accounts for uncertain tax provisions in accordance with ASC Topic 740 Income Taxes. These provisions require companies to determine whether it is "more likely than not" that a tax position will be sustained upon examination by the appropriate taxing authorities before any benefit can be recorded in the financial statements. An uncertain income tax position will not be recognized if it has less than a 50% likelihood of being sustained.
Recent Accounting Pronouncements:
In May 2014, a pronouncement was issued that creates common revenue recognition guidance for U.S. GAAP and International Financial Reporting Standards. The new guidance supersedes most preexisting revenue recognition guidance. The core principle of the guidance is that an entity should recognize revenue to depict the transfer of promised goods or services to customers in an amount that reflects the consideration to which the entity expects to be entitled in exchange for those goods or services. The new standard is effective for annual reporting periods beginning after December 15, 2017, including interim periods within that reporting period, with an option to adopt the standard one year earlier. Staples intends to adopt the new guidance in the first quarter of fiscal 2018. The new standard is to be applied either retrospectively to each period presented or as a cumulative-effect adjustment as of the date of adoption. The Company is currently evaluating the impact of the new pronouncement on its financial statements.
In April 2015, a pronouncement was issued that requires debt issuance costs related to a recognized debt liability be presented in the balance sheet as a direct deduction from the carrying amount of that debt liability, consistent with debt discounts. The guidance is effective for fiscal years, and interim periods within those fiscal years, beginning after December 15, 2015. Early adoption is permitted and retrospective application is required. The Company adopted this standard in the first quarter of fiscal 2015. The condensed consolidated balance sheet as of January 31, 2015 included in these interim financial statements reflects a restatement to reclassify unamortized debt issuance costs of $1 million from Prepaid and other current assets and $4 million from Other assets to Long-term debt, net of current maturities. For debt issuance costs paid to secure revolving credit facilities, the Company presents such costs as assets on the balance sheet and amortizes them ratably over the term of the credit agreement, regardless of whether any borrowings are outstanding.
In September 2015, a pronouncement was issued that eliminates the requirement to restate prior period financial statements for measurement period adjustments following a business combination. The guidance requires that the cumulative impact of a measurement period adjustment be recognized in the reporting period in which the adjustment is identified. The portion of the adjustment which relates to a prior period should either be presented separately on the face of the income statement or disclosed in the notes. The guidance is effective for fiscal years, and interim periods within those fiscal years, beginning after December 15, 2015, with early adoption permitted. The guidance is to be applied prospectively to adjustments to provisional amounts that occur after the effective date. The Company adopted this standard in the third quarter of 2015. The Company did not have any material measurement period adjustments in 2015.
In November 2015, a pronouncement was issued that stipulates all deferred tax assets and liabilities are to be classified and presented in the balance sheet as non-current items. The guidance is effective for interim and annual periods beginning after December 15, 2016 with early adoption permitted, and may be applied either prospectively to all deferred tax liabilities and assets or retrospectively to all periods presented. The Company elected to adopt this guidance effective January 30, 2016, and has applied the guidance retrospectively. The Company restated its consolidated balance sheet as of January 31, 2015 to reflect the reclassification of $224 million of deferred tax assets and $2 million of deferred tax liabilities from current to non-current.
In February 2016, a pronouncement was issued that creates new accounting and reporting guidelines for leasing arrangements. The new guidance requires organizations that lease assets to recognize assets and liabilities on the balance sheet related to the rights and obligations created by those leases, regardless of whether they are classified as finance or operating leases. Consistent with current guidance, the recognition, measurement, and presentation of expenses and cash flows arising from a lease primarily will depend on its classification as a finance or operating lease. The guidance also requires new disclosures to help financial statement users better understand the amount, timing, and uncertainty of cash flows arising from leases. The new standard
C-12
STAPLES, INC. AND SUBSIDIARIES
Notes to Consolidated Financial Statements (continued)
is effective for annual reporting periods beginning after December 15, 2018, including interim periods within that reporting period, with early application permitted. The new standard is to be applied using a modified retrospective approach. The Company is currently evaluating the impact of the new pronouncement on its financial statements.
Note B — Restructuring Charges
2014 Restructuring Plan
In 2014 the Company announced a plan to close at least 225 retail stores in North America by the end of fiscal year 2015 (the “Store Closure Plan”). Pursuant to this plan the Company closed 169 stores in 2014 and 73 stores during 2015. The Store Closure Plan has been extended and the Company expects to close approximately 50 additional stores during 2016. In connection with these closures, in 2016 the Company expects to incur charges of approximately $30 million to $60 million for contractual lease obligations, up to $5 million for impairment and accelerated depreciation of store assets, less than $5 million for severance and $10 million to $15 million in other associated costs. These estimates could change as the Company's plans evolve and become finalized. These charges relate to the Company's North American Stores & Online segment. The Company does not expect material costs to be incurred after 2016 related to the Store Closure Plan.
In addition, in 2014 the Company initiated a cost savings plan to generate annualized pre-tax savings of approximately $500 million by the end of fiscal 2015. The Company plans to reinvest some of the savings in its strategic initiatives. During 2015, the Company incurred liabilities for severance and contractual obligations related to the restructuring of certain administrative and operational functions across the Company. The Company does not expect to incur material costs in future periods related to this cost savings plan.
The actions taken related to the $500 million cost savings plan, together with the actions taken related to the Store Closure Plan, are herein referred to as the "2014 Plan".
As a result of actions taken under the 2014 Plan, the Company recorded pre-tax charges of $170 million in 2015 and $245 million in 2014. The table below provides a summary of the charges recorded during 2015 and 2014 for each major type of cost associated with the 2014 Plan. The table also summarizes the costs incurred by reportable segment (in millions).
Charges incurred | ||||||||
2015 | 2014 | |||||||
Employee related costs | $ | 83 | $ | 45 | ||||
Contractual obligations | 63 | 109 | ||||||
Other associated costs | 12 | 17 | ||||||
Total restructuring charges | 158 | 171 | ||||||
Impairment of long-lived assets and accelerated depreciation | 11 | 46 | ||||||
Inventory write-downs | 1 | 26 | ||||||
Total pre-tax charges | $ | 170 | $ | 245 | ||||
— | ||||||||
North American Stores & Online | $ | 79 | $ | 178 | ||||
North American Commercial | 29 | 50 | ||||||
International Operations | 62 | 17 | ||||||
Total pre-tax charges | $ | 170 | $ | 245 | ||||
In connection with the 2014 Plan, the Company recorded fixed asset impairment charges of $6 million and $37 million during 2015 and 2014, respectively, primarily related to the Store Closure Plan. See Note C - Goodwill and Long-Lived Assets for additional information. Also related to the 2014 Plan, the Company recorded accelerated depreciation of $5 million and $9 million in 2015 and 2014, respectively, primarily in connection with the closure of facilities supporting the Company's North American delivery operations.
In addition, the Company recorded inventory write-downs of $1 million and $26 million in 2015 and 2014, respectively, related to the rationalization of SKU's pursuant to the Company's efforts to improve efficiencies in its delivery fulfillment operations as well as the retail store closures. The inventory write-downs were included in Cost of goods sold and occupancy costs in the consolidated statements of income.
C-13
STAPLES, INC. AND SUBSIDIARIES
Notes to Consolidated Financial Statements (continued)
The table below shows a reconciliation of the beginning and ending liability balances for each major type of cost associated with the 2014 Plan (in millions):
2014 Plan | ||||||||||||||||
Employee Related | Contractual Obligations | Other | Total | |||||||||||||
Accrued restructuring balance as of February 1, 2014 | $ | — | $ | — | $ | — | $ | — | ||||||||
Charges | 45 | 109 | 17 | 171 | ||||||||||||
Cash payments | (13 | ) | (24 | ) | (15 | ) | (52 | ) | ||||||||
Foreign currency translations | (1 | ) | (2 | ) | — | (3 | ) | |||||||||
Accrued restructuring balance as of January 31, 2015 | $ | 31 | $ | 83 | $ | 2 | $ | 116 | ||||||||
Charges | 83 | 63 | 12 | 158 | ||||||||||||
Cash payments | (40 | ) | (62 | ) | (13 | ) | (115 | ) | ||||||||
Foreign currency translations | — | (1 | ) | — | (1 | ) | ||||||||||
Accrued restructuring balance as of January 30, 2016 | $ | 74 | $ | 83 | $ | 1 | $ | 158 | ||||||||
In addition to the contractual obligations shown in the tables above, the Company also had related liabilities of $8 million and $4 million recorded on the consolidated balance sheet as of January 30, 2016 and January 31, 2015, respectively, which primarily represent amounts previously accrued to reflect rent expense on a straight-line basis for leased properties which the Company has now ceased using.
For the restructuring liabilities associated with the 2014 Plan, $53 million of contractual obligations costs are included within Other long-term obligations and the remaining balances are included within Accrued expenses and other current liabilities in the Company's consolidated balance sheet as of January 30, 2016. The Company expects that payments related to employee related liabilities associated with the 2014 Plan will be substantially completed by the end of fiscal year 2016. The Company anticipates that payments related to facility lease obligations will be completed by the end of fiscal year 2025.
The restructuring charges related to the 2014 Plan are presented within Restructuring charges in the Company's consolidated statement of income. The table below shows how the restructuring charges would have been allocated if the Company had recorded the expenses within the functional departments of the restructured activities (in millions):
Fiscal Year Ended | ||||||||
January 30, 2016 | January 31, 2015 | |||||||
Cost of goods sold and occupancy costs | $ | 70 | $ | 123 | ||||
Selling, general and administrative | 88 | 48 | ||||||
Total | $ | 158 | $ | 171 | ||||
2013 Restructuring Plan
In 2013 the Company initiated a restructuring plan to streamline its operations and general and administrative functions (the "2013 Plan”). Pursuant to the 2013 Plan, certain distributed general and administrative functions are being centralized and certain operational resources are being consolidated. As a result of this plan, the Company recorded pre-tax restructuring charges of $78 million in 2013, including $75 million for employee severance costs and $3 million for other associated costs. Of these amounts, $63 million related to the Company's International Operations segment and $15 million related to the Company’s corporate headquarters and North American operations. The Company expects to substantially complete the actions required under the 2013 Plan by the first half of fiscal 2016.
During 2015 the Company recorded an adjustment to reduce the restructuring liability associated with the 2013 Plan by $8 million. The adjustment primarily stems from certain changes made to the scope of the plan in 2015, as well as changes in estimates related to certain benefits. The Company does not expect to incur material costs in future periods related to the 2013 Plan.
C-14
STAPLES, INC. AND SUBSIDIARIES
Notes to Consolidated Financial Statements (continued)
The table below shows a reconciliation of the beginning and ending liability balances associated with the 2013 Plan (in millions):
2013 Plan | ||||||||||||
Employee Related | Other | Total | ||||||||||
Accrued restructuring balance as of February 1, 2014 | $ | 63 | $ | 2 | $ | 65 | ||||||
Cash payments | (24 | ) | (1 | ) | (25 | ) | ||||||
Adjustments | 5 | (1 | ) | 4 | ||||||||
Foreign currency translations | (8 | ) | — | (8 | ) | |||||||
Accrued restructuring balance as of January 31, 2015 | $ | 36 | $ | — | $ | 36 | ||||||
Cash payments | (16 | ) | — | (16 | ) | |||||||
Adjustments | (8 | ) | — | (8 | ) | |||||||
Foreign currency translations | (1 | ) | — | (1 | ) | |||||||
Accrued restructuring balance as of January 30, 2016 | $ | 11 | $ | — | $ | 11 | ||||||
Of the restructuring liabilities associated with the 2013 Plan, $8 million is included within Accrued expenses and other current liabilities and $3 million is included within Other long-term obligations in the consolidated balance sheet as of January 30, 2016. The Company expects that the payments related to these liabilities will be substantially completed by the end of fiscal year 2016.
The restructuring charges related to the 2013 Plan are presented within Restructuring charges in the Company's consolidated statements of income. The table below shows how the $78 million of restructuring charges would have been allocated if the Company had recorded the expenses within the functional departments of the restructured activities (in millions):
Fiscal Year Ended | ||||
February 1, 2014 | ||||
Cost of goods sold and occupancy costs | $ | 7 | ||
Selling, general and administrative | 71 | |||
Total | $ | 78 | ||
Note C — Goodwill and Long-Lived Assets
Goodwill
As described in Note A - Summary of Significant Accounting Policies, the Company reviews goodwill for impairment annually during its fourth fiscal quarter and whenever events or changes in circumstances indicate the carrying value of goodwill may not be recoverable. During the fourth quarter of 2015, the Company performed its annual goodwill impairment testing, and determined that no impairment charges were required.
As of January 30, 2016, the Company's Europe Online, China, and Australia reporting units continue to be at an increased risk for future impairment charges. These reporting units have associated goodwill balances as of that date of $266 million, $76 million, and $49 million, respectively. Europe Online has experienced ongoing challenges transitioning from its legacy catalog business model to an online model. As noted below, in 2014 the Company recorded goodwill impairment charges related to China and Australia. While China and Australia experienced improved sales and profitability in 2015, the valuations for these reporting units are predicated on continued improvement in the future.
In 2014 the Company recorded goodwill impairment charges of $410 million, including $280 million related to Australia, $116 million related to China, and $13 million related to South America. These reporting units are components of the Company's International Operations segment. The factors underlying the impairment charges included:
• | Australia experienced unusually high customer attrition in 2011 and 2012, and operating challenges continued in 2013 and 2014. |
C-15
STAPLES, INC. AND SUBSIDIARIES
Notes to Consolidated Financial Statements (continued)
• | China experienced weaker than expected sales growth in 2013. In 2014, sales declined as the business decided to exit certain unprofitable arrangements, and growth in ecommerce sales was not sufficient to offset the loss of these arrangements. |
• | South America also experienced weaker than expected growth. |
In the first step of the impairment test, the Company measured the fair value of these reporting units using the income approach, specifically the discounted cash flow ("DCF") method. In conjunction with the Company’s annual cycle for planning and budgeting, in the fourth quarter of 2014 the Company updated its fiscal 2015 and long-term financial projections for its reporting units. Based on these updates, the Company reflected lower long-term sales growth and profit rate projections in the DCF valuations for these reporting units. As a result, these three reporting units failed step one of the impairment test.
In the second step of the impairment test, the Company assigned the reporting units’ fair values to their individual assets and liabilities, including any unrecognized assets or liabilities, in a hypothetical analysis that calculates the implied fair value of goodwill in the same manner as if the reporting unit was being acquired in a business combination. If the implied fair value of the reporting unit's goodwill is less than the carrying value, the difference is recorded as an impairment charge. The fair value estimates incorporated in step two were primarily based on the income approach, specifically the multi-period excess earnings method.
The valuation methodologies used to measure the impairment charges incorporated unobservable inputs reflecting significant estimates and assumptions made by management. Accordingly, the Company classified these measurements as Level 3 within the fair value hierarchy. Key inputs included expected sales growth rates, customer attrition rates, operating income margins, market-based royalty rates, and discount rates.
The changes in the carrying amounts of goodwill during fiscal 2014 and 2015 are as follows (in millions):
Goodwill at February 1, 2014 | 2014 Additions | 2014 Impairments | 2014 Disposals | Foreign Exchange Fluctuations | Goodwill at January 31, 2015 | |||||||||||||||||||
North American Commercial | $ | 1,247 | $ | 2 | $ | — | $ | (2 | ) | $ | — | $ | 1,247 | |||||||||||
North American Stores & Online | 638 | 34 | — | — | (10 | ) | 662 | |||||||||||||||||
International Operations | 1,349 | — | (410 | ) | (2 | ) | (166 | ) | 771 | |||||||||||||||
Consolidated | $ | 3,234 | $ | 36 | $ | (410 | ) | $ | (4 | ) | $ | (176 | ) | $ | 2,680 | |||||||||
Goodwill at January 31, 2015 | 2015 Additions | 2015 Impairments | 2015 Disposals | Foreign Exchange Fluctuations | Goodwill at January 30, 2016 | |||||||||||||||||||
North American Commercial | $ | 1,247 | $ | 3 | $ | — | $ | — | $ | — | $ | 1,250 | ||||||||||||
North American Stores & Online | 662 | 1 | — | — | (6 | ) | 657 | |||||||||||||||||
International Operations | 771 | 3 | — | — | (28 | ) | 746 | |||||||||||||||||
Consolidated | $ | 2,680 | $ | 7 | $ | — | $ | — | $ | (34 | ) | $ | 2,653 | |||||||||||
The Company's International Operations segment had $1.18 billion of accumulated goodwill impairment charges as of January 30, 2016 and January 31, 2015.
Long-Lived Assets
The Company recorded total long-lived asset impairment charges of $50 million and $60 million in 2015 and 2014, respectively. The components of these charges are shown below:
For 2015 and 2014, impairment included $6 million and $37 million, respectively, related to leasehold improvements, fixtures, equipment and other fixed assets impacted by the Company's plans to close at least 225 retail stores in North America and to generate annualized pre-tax savings of approximately $500 million by the end of 2015 (see Note B). All of these charges
C-16
STAPLES, INC. AND SUBSIDIARIES
Notes to Consolidated Financial Statements (continued)
in 2015 relate to the Company's North American Stores & Online segment; for 2014, $36 million related to the Company's North American Stores & Online segment and $1 million related to the International Operations segment.
In addition to impairment related to closures, the Company determined that leasehold improvements, land and buildings, fixtures, equipment and other assets, primarily at certain North American and European retail stores, (locations not identified for closure) were not recoverable from future cash flows, primarily due to declining sales. As a result, the Company recorded impairment charges of $22 million in 2015 and $23 million in 2014. Of the charges recorded in 2015, $7 million relates to the North American Stores & Online segment and $15 million relates to the International Operations segment. Of the charges recorded in 2014, $22 million relates to the North American Stores & Online segment and $1 million relates to the International Operations segment.
These charges were based on measurements of the fair value of the impaired assets derived using the income approach, specifically the DCF method, which incorporated Level 3 inputs as defined in ASC 820. The Company considered the expected net cash flows to be generated by the use of the assets through the store closure dates, as well as the expected cash proceeds from the disposition of the assets, if any.
In addition to the charges discussed above, based on a strategic review the Company performed in 2015 the Company made a decision to dispose of certain information technology assets, incurring an impairment charge of $22 million. The assets were comprised of software for which the Company concluded the fair value was not material. This charge relates to the North American Stores & Online segment.
Intangible Assets
The Company's intangible assets are amortized on a straight-line basis over their estimated useful lives and are summarized below (in millions):
January 30, 2016 | January 31, 2015 | |||||||||||||||||||||||
Gross Carrying Amount | Accumulated Amortization | Net | Gross Carrying Amount | Accumulated Amortization | Net | |||||||||||||||||||
Customer relationships | $ | 628 | $ | (411 | ) | $ | 217 | $ | 628 | $ | (364 | ) | $ | 264 | ||||||||||
Technology | 72 | (20 | ) | 52 | 72 | (6 | ) | 66 | ||||||||||||||||
Tradenames | 9 | (4 | ) | 5 | 9 | (4 | ) | 5 | ||||||||||||||||
Total | $ | 709 | $ | (435 | ) | $ | 274 | $ | 709 | $ | (374 | ) | $ | 335 | ||||||||||
Estimated future amortization expense associated with the intangible assets at January 30, 2016 is as follows (in millions):
Fiscal Year | Total | |||
2016 | $ | 66 | ||
2017 | 66 | |||
2018 | 62 | |||
2019 | 39 | |||
2020 | 23 | |||
Thereafter | 18 | |||
$ | 274 | |||
Note D — Sale of Businesses and Assets
During 2015, the Company sold certain real estate properties and other property and equipment, as well as a small business unit in Australia. The company recognized a net loss of $5 million in 2015 related to these sales.
During the first quarter of 2014, the Company completed the sale of its Smilemakers, Inc. business unit, recognizing a gain of $23 million. Smilemakers, Inc. was a component of the Company's North American Commercial segment. The Company also completed the sale of a small business in Europe in the first quarter of 2014 and the sale of a small U.S. business that was a component of the Company's North American Commercial segment in the third quarter of 2014, recognizing a $2 million loss and a $6 million gain on the sales, respectively.
C-17
STAPLES, INC. AND SUBSIDIARIES
Notes to Consolidated Financial Statements (continued)
On October 5, 2013, the Company completed the sale of PSD, recognizing a preliminary loss on disposal of $81 million in 2013 that was subject to the impact of a working capital adjustment to the purchase price. The amount of the working capital adjustment is in dispute between the parties in the transaction. See Note I - Commitments and Contingencies for an update on the status of this dispute.
The loss on disposal was included in Loss from discontinued operations, net of income taxes in the consolidated statements of income. The following table details PSD's results of operations for 2013, which has been reported in discontinued operations (in millions):
35 Weeks Ended | ||||
October 5, 2013 | ||||
Sales | $ | 199 | ||
Loss from discontinued operations, before income taxes (including loss on disposal of $81 million in 2013) | (88 | ) | ||
Income tax benefit | (1 | ) | ||
Loss from discontinued operations, net of income taxes | $ | (87 | ) | |
Note E — Accrued Expenses and Other Current Liabilities
The major components of Accrued expenses and other current liabilities are as follows (in millions):
January 30, 2016 | January 31, 2015 | |||||||
Taxes | $ | 201 | $ | 235 | ||||
Employee related | 357 | 416 | ||||||
Acquisition and restructuring reserves | 131 | 123 | ||||||
Advertising and marketing | 70 | 96 | ||||||
Other | 594 | 460 | ||||||
Total | $ | 1,353 | $ | 1,330 | ||||
C-18
STAPLES, INC. AND SUBSIDIARIES
Notes to Consolidated Financial Statements (continued)
Note F — Debt and Credit Agreements
The major components of the Company's outstanding debt are as follows (in millions):
January 30, 2016 | January 31, 2015 | |||||||
January 2018 Notes | $ | 498 | $ | 497 | ||||
January 2023 Notes | 496 | 496 | ||||||
Other lines of credit | 2 | 77 | ||||||
Capital lease obligations and other notes payable | 39 | 40 | ||||||
1,035 | 1,110 | |||||||
Less: current portion | (17 | ) | (92 | ) | ||||
Net long-term debt | $ | 1,018 | $ | 1,018 | ||||
Aggregate annual maturities of long-term debt and capital lease obligations are as follows (in millions):
Fiscal Year: | Total | ||
2016 | $ | 17 | |
2017 | 514 | ||
2018 | 7 | ||
2019 | 2 | ||
2020 | 1 | ||
Thereafter | 500 | ||
$ | 1,041 | ||
Unamortized discounts and debt issuance costs | (6 | ) | |
$ | 1,035 | ||
Future minimum lease payments under capital leases of $35 million are included in aggregate annual maturities shown above. Staples entered into $12 million and $40 million of new capital lease obligations in 2015 and 2014, respectively. In 2015 we also assumed equipment financing obligations of $4 million in conjunction with our acquisition of a small business in Europe.
Interest paid by Staples totaled $49 million, $51 million and $128 million for 2015, 2014 and 2013, respectively. There was no interest capitalized in 2015, 2014 or 2013.
January 2018 Notes and January 2023 Notes: In January 2013, the Company issued $500 million aggregate principal amount of 2.75% senior notes due January 2018 (the "January 2018 Notes") and $500 million aggregate principal amount of 4.375% senior notes due January 2023 (the "January 2023 Notes", or collectively “the Notes”), for total net proceeds after the original issue discount and the underwriters' fees of $991 million. The Notes were issued with original discounts at 99.727% and 99.808%, respectively. The Notes rank equally with all of the Company's other unsecured and unsubordinated indebtedness. The indenture governing the notes contains covenants that will limit the Company's ability to create certain liens and engage in certain sale and leaseback transactions. The indenture does not limit the amount of debt that the Company or any of the Company's subsidiaries may incur. Interest on these Notes is payable in cash on a semi-annual basis on January 12 and July 12 of each year. The interest rate payable on the Notes will be subject to adjustments from time to time if Moody's Investors Service, Inc. or Standard & Poor's Ratings Services downgrades (or downgrades and subsequently upgrades) the rating assigned to the Notes. The Company may redeem the Notes at any time at certain redemption prices specified in the indenture governing the Notes. Upon the occurrence of both (a) a change of control of Staples, Inc., as defined in the indenture, and (b) a downgrade of the Notes below an investment grade rating by both of Moody's Investors Service, Inc. and Standard & Poor's Ratings Services within a specified period, the Company will be required to make an offer to purchase the Notes at a price equal to 101% of their principal amount, plus accrued and unpaid interest to the date of repurchase. The Notes are not guaranteed by any of the Company's subsidiaries.
January 2014 Notes: The Company repaid the $867 million remaining principal amount of its $1.5 billion, 9.75% notes due January 2014 (the "January 2014 Notes") on their maturity date of January 15, 2014. In January and February 2013, the Company repurchased $633 million of the unhedged portion of the January 2014 Notes pursuant to a cash tender offer.
Revolving Credit Facility: On May 31, 2013, the Company entered into a new credit agreement (the "May 2018 Revolving Credit Facility") with Bank of America, N.A., as Administrative Agent and other lending institutions named therein. The May 2018 Revolving Credit Facility provides for a maximum borrowing of $1.0 billion, which pursuant to an accordion feature may
C-19
STAPLES, INC. AND SUBSIDIARIES
Notes to Consolidated Financial Statements (continued)
be increased to $1.5 billion upon our request and the agreement of the lenders participating in the increase. Borrowings may be syndicated loans, swing line loans, multicurrency loans, or letters of credit, the combined sum of which may not exceed the maximum borrowing amount. Amounts borrowed may be repaid and reborrowed from time to time until May 31, 2018. Borrowings will bear interest at various interest rates depending on the type of borrowing, and will reflect a percentage spread based on our credit rating and fixed charge coverage ratio. The Company will pay a facility fee at rates that range from 0.08% to 0.225% per annum depending on its credit rating and fixed charge coverage ratio. The May 2018 Revolving Credit Facility is unsecured and ranks pari passu with the Company's public notes and other indebtedness and contains customary affirmative and negative covenants for credit facilities of this type. The May 2018 Revolving Credit Facility also contains financial covenants that require the Company to maintain a minimum fixed charge coverage ratio and a maximum adjusted funded debt to total capitalization ratio. The Company did not borrow under the May 2018 Revolving Credit Facility during 2015, and no amounts were outstanding related to this facility at January 30, 2016. On February 2, 2016, the Company amended the May 2018 Revolving Credit Facility to permit certain actions in connection with the term loan agreement and escrow of term loan proceeds related to the Company's proposed acquisition of Office Depot (see Note R — Proposed Acquisition of Office Depot).
Commercial Paper Program: The Company has a commercial paper program ("Commercial Paper Program") that allows it to issue up to $1.0 billion of unsecured commercial paper notes ("Commercial Paper Notes") from time to time. The May 2018 Revolving Credit Facility serves as a back-up to the Commercial Paper Program. The Company typically uses proceeds from the Commercial Paper Notes for general purposes, including working capital, capital expenditures, acquisitions and share repurchases. Maturities of the Commercial Paper Notes vary, but may not exceed 397 days from the date of issue. The Company did not borrow under the Commercial Paper Program during 2015, and as of January 30, 2016 no Commercial Paper Notes were outstanding.
Other Lines of Credit: The Company has various other lines of credit under which it may borrow a maximum of $88 million. At January 30, 2016, the Company had outstanding borrowings of $2 million, leaving $86 million of available credit at that date.
There were no instances of default during 2015 under any of the Company's debt agreements.
See Note R for information related to sources of financing for the Company's proposed acquisition of Office Depot.
Deferred Financing Fees
In connection with the issuance of certain debt instruments, the Company incurred financing fees which are being amortized over the terms of the related debt instruments. Amortization of the financing fees is classified as interest expense. Deferred financing fees amortized to interest expense were $2 million, $2 million and $3 million for 2015, 2014 and 2013, respectively.
Note G — Fair Value Measurements
ASC Topic 820 establishes a fair value hierarchy that prioritizes the inputs used to measure fair value. The hierarchy gives the highest priority to quoted prices in active markets for identical assets or liabilities (Level 1 measurement), then priority to quoted prices for similar instruments in active markets, quoted prices for identical or similar instruments in markets that are not active and model-based valuation techniques for which all significant assumptions are observable in the market (Level 2 measurement), then the lowest priority to unobservable inputs (Level 3 measurement).
The fair values of cash and cash equivalents, receivables, accounts payable, accrued expenses, other current liabilities, and short-term debt approximate their carrying values because of their short-term nature. The carrying value of the Company's capital lease obligations approximates fair value.
The following table shows the difference between the financial statement carrying value and fair value of the Company's debt obligations (see Note F - Debt and Credit Agreements) as of January 30, 2016 and January 31, 2015 (in millions). The fair values of these notes were determined based on quoted market prices and are classified as Level 1 measurements.
January 30, 2016 | January 31, 2015 | ||||||||||||||
Carrying Value | Fair Value | Carrying Value | Fair Value | ||||||||||||
January 2018 Notes | $ | 498 | $ | 496 | $ | 497 | $ | 507 | |||||||
January 2023 Notes | 496 | 488 | 496 | 511 | |||||||||||
From time to time the Company has investments in money market funds that are measured and recorded in the financial statements at fair value on a recurring basis. The fair values are based on quotes received from third-party banks and are classified as Level 1 measurements. There were no material money market investments as of January 30, 2016. As of January 31, 2015,
C-20
STAPLES, INC. AND SUBSIDIARIES
Notes to Consolidated Financial Statements (continued)
the fair value of these investments, which are classified in Cash and cash equivalents in the consolidated balance sheet, was $14 million.
The fair values of the assets in the Company's pension plans are described in detail in Note L - Pension and Other Post-Retirement Benefit Plans. There are no other material assets or liabilities measured at fair value.
Note H — Derivative Instruments and Hedging Activities
From time to time, Staples uses interest rate swap agreements, foreign currency swap and foreign currency forward agreements to offset certain operational and balance sheet exposures related to changes in interest or foreign exchange rates. These agreements are entered into to support transactions made in the normal course of business and accordingly are not speculative in nature. The derivatives qualify for hedge accounting treatment if the derivatives have been highly effective in offsetting the underlying exposures related to the hedge.
All derivatives are recorded at fair value and the changes in fair value are immediately included in earnings if the derivatives do not qualify as effective hedges. If a derivative is designated as a fair value hedge, then changes in the fair value of the derivative are offset against the changes in the fair value of the underlying hedged item in earnings. If a derivative is designated as a cash flow hedge, then the effective portion of the changes in the fair value of the derivative is recognized as a component of accumulated other comprehensive income (loss) until the underlying hedged item is recognized in earnings or the forecasted transaction is no longer probable of occurring. If a derivative or a nonderivative financial instrument is designated as a hedge of the Company's net investment in a foreign subsidiary, then changes in the fair value of the financial instrument are recognized as a component of accumulated other comprehensive income (loss) to offset a portion of the change in the translated value of the net investment being hedged, until the investment is sold or liquidated. The Company formally documents all hedging relationships for all derivatives, nonderivative hedges and the underlying hedged items, as well as its risk management objectives and strategies for undertaking the hedge transactions. There are no amounts excluded from the assessment of hedge effectiveness.
The Company classifies the fair value of all derivative contracts and the fair value of its hedged firm commitments as either current or long-term depending on whether the maturity date of the derivative contract is within or beyond one year from the balance sheet date. The cash flows from derivatives are classified in the Company's consolidated statement of cash flows in the same category as the item being hedged.
Foreign Currency Swaps and Forwards:
In December 2011, the Company entered into a foreign currency forward designed to convert a series of intercompany loans denominated in Canadian dollars into a fixed U.S. dollar amount. The loans totaled 750 million Canadian dollars in the aggregate and matured at various dates between October 2012 and October 2013. Staples, upon full maturity of the agreements in October 2013, had collected $720 million and paid 750 million Canadian dollars per the terms of the contracts. The forward agreements were accounted for as a fair value hedge. In 2012, the Company settled 500 million Canadian dollars of the notional amount relating to this forward, realizing a loss of $24 million which was recorded within Other income (expense), net. In 2013, the Company settled the remaining 250 million Canadian dollars of notional amount relating to this forward, realizing a loss of $4 million, which was recorded within Other income (expense), net. During 2013 unrealized gains of $6 million were recognized in Other income (expense), net related to the outstanding portion of this fair value hedge. No amounts were included in the consolidated statements of income related to ineffectiveness associated with this fair value hedge.
Note I — Commitments and Contingencies
Commitments
Staples leases certain retail and support facilities under long-term non-cancelable lease agreements. Most lease agreements contain renewal options and rent escalation clauses and, in some cases, allow termination within a certain number of years with notice and a fixed payment. Certain agreements provide for contingent rental payments based on sales.
C-21
STAPLES, INC. AND SUBSIDIARIES
Notes to Consolidated Financial Statements (continued)
Other long-term obligations at January 30, 2016 include $63 million relating to future rent escalation clauses and lease incentives under certain existing operating lease arrangements. These rent obligations are recognized on a straight-line basis over the respective terms of the leases. Future minimum lease commitments due for retail, distribution, fulfillment and support facilities (including restructured facilities) and equipment leases under non-cancelable operating leases are as follows (in millions):
Fiscal Year: | Total | ||
2016 | $ | 685 | |
2017 | 563 | ||
2018 | 424 | ||
2019 | 317 | ||
2020 | 230 | ||
Thereafter | 443 | ||
$ | 2,662 | ||
Future minimum lease commitments exclude the impact of $36 million of minimum rentals due under non-cancelable subleases. Rent expense was $691 million, $767 million and $801 million for 2015, 2014 and 2013, respectively.
As of January 30, 2016, Staples had contractual purchase obligations that are not reflected in the Company's consolidated balance sheets totaling $614 million. Many of the Company's purchase commitments may be canceled by the Company without advance notice or payment and, accordingly, the Company has excluded such commitments from the following schedule. Contracts that may be terminated by the Company without cause or penalty, but that require advance notice for termination, are valued on the basis of an estimate of what the Company would owe under the contract upon providing notice of termination. Expected payments related to such purchase obligations are as follows (in millions):
Fiscal Year: | Total | ||
2016 | $ | 460 | |
2017 | 74 | ||
2018 | 31 | ||
2019 | 43 | ||
2020 | 4 | ||
Thereafter | 2 | ||
$ | 614 | ||
Letters of credit are issued by Staples during the ordinary course of business through major financial institutions as required by certain vendor contracts. As of January 30, 2016, Staples had open standby letters of credit totaling $99 million.
Contingencies
The Company has investigated, with the assistance of outside experts, a data security incident involving unauthorized access into the computer systems of PNI Digital Media Ltd ("PNI"), a subsidiary of the Company, which the Company acquired in July 2014. PNI, which is based in Vancouver, British Columbia, provides a software platform that enables retailers to sell personalized products such as photo prints, photo books, calendars, business cards, stationery and other similar products. PNI’s customers include a number of major third party retailers, as well as affiliates of the Company. The investigation determined that an unauthorized party entered PNI’s systems and was able to deploy malware on some of PNI’s servers supporting its clients. The malware was designed to capture data that end users input on the photosites. Some of PNI's affected customers have notified certain of their users of a potential compromise of the users' payment card information and/or other personal information. PNI took prompt steps to contain the incident, including disabling the retailer photosites or online payment transactions for a period while the incident was being investigated, and to further enhance the security of its retailer customers' data. To date the Company has incurred incremental expenses of $18 million related to the incident. The expenses reflect professional service fees incurred by the Company, as well as claims by PNI's retailer customers. Additional losses and expenses relating to the incident are probable; however, at this stage, we do not have sufficient information to reasonably estimate such losses and expenses. The types of losses and expenses that may result from the incident include, without limitation: claims by PNI’s retailer customers, including indemnification claims for losses and damages incurred by them; claims by end-users of PNI’s services, including class action lawsuits that have been filed, and further class action lawsuits that may be filed, in Canada and the United States; investigations and claims by various regulatory authorities in Canada and the United States; investigation costs; remediation costs; and legal fees. We will continue to evaluate information as it becomes known and will record an estimate for additional losses or expenses at the time or times when it is both probable that any loss has been incurred and the amount of such loss is reasonably estimable.
C-22
STAPLES, INC. AND SUBSIDIARIES
Notes to Consolidated Financial Statements (continued)
Such losses may be material to our results of operations and financial condition. The Company maintains network security insurance coverage, which the Company expects would help mitigate the financial impact of the incident.
In December 2014, the Company announced that the investigation into its previously announced data security incident had determined that malware deployed by criminals to some point of sale systems at 115 of the Company’s more than 1,400 U.S. retail stores may have allowed access to transaction data at those affected stores. As a result, cardholder names, payment card numbers, expiration dates, and card verification codes for approximately 1.16 million payment cards may have been affected. Upon detection, the Company immediately took action to eradicate the malware and commenced an investigation into the incident, working closely with payment card companies and law enforcement and with the assistance of outside data security experts. The Company also has taken steps to further enhance the security of its point of sale systems, including the use of new encryption tools. The Company continues to evaluate cybersecurity policies and practices to mitigate the risk of future incidents. Expenses incurred to date related to this incident have not been material. It is reasonably possible that the Company may incur additional expenses or losses in connection with the incident; however, at this time the Company is unable to reasonably estimate any such additional expenses or losses. In addition, the Company maintains network security insurance coverage, which it expects would help mitigate any material financial impact.
In 2013 the Company completed the sale of PSD, recognizing a preliminary loss on disposal of $81 million that was subject to the impact of a working capital adjustment to the purchase price. On April 22, 2015, the purchaser commenced litigation in Amsterdam District Court claiming that it was entitled to a purchase price adjustment of approximately €60 million. On April 22, 2015, the Company made a payment to the purchaser of approximately €4 million (the amount of the purchase price adjustment it believed was appropriate) and the purchaser reduced its claim accordingly. The purchaser further reduced its claim to €52 million in response to expert reports submitted by the Company in the court case. The court held a hearing on December 1, 2015, and on January 13, 2016 it issued a judgment rejecting the purchaser’s claims in their entirety and awarding costs to the Company. The purchaser filed a notice of appeal on February 15, 2016, which the Company intends to vigorously defend. If the purchaser prevails on appeal, it could result in an adjustment, which may be material, to the loss we recorded for the transaction.
From time to time, the Company is involved in litigation arising from the operation of its business that is considered routine and incidental to its business. The Company estimates exposures and establishes reserves for amounts that are probable and can be reasonably estimated. However, litigation is inherently unpredictable and the outcome of legal proceedings and other contingencies could be unexpected or differ from the Company’s reserves. The Company does not believe it is reasonably possible that a loss in excess of the amounts recognized in the consolidated financial statements as of January 30, 2016 would have a material adverse effect on its business, results of operations or financial condition.
C-23
STAPLES, INC. AND SUBSIDIARIES
Notes to Consolidated Financial Statements (continued)
Note J — Income Taxes
Deferred income taxes reflect the net tax effects of temporary differences between the carrying amount of assets and liabilities for financial reporting purposes and the amounts used for income tax purposes. The approximate tax effect of the significant components of Staples' deferred tax assets and liabilities are as follows (in millions):
January 30, 2016 | January 31, 2015 | |||||||
Deferred income tax assets: | ||||||||
Deferred rent | $ | 22 | $ | 28 | ||||
Foreign tax credit carryforwards | — | 3 | ||||||
Net operating loss carryforwards | 270 | 288 | ||||||
Capital loss carryforwards | 24 | 27 | ||||||
Employee benefits | 106 | 159 | ||||||
Bad debts | 18 | 20 | ||||||
Inventory | 15 | 25 | ||||||
Insurance | 34 | 37 | ||||||
Deferred revenue | 11 | 14 | ||||||
Depreciation | 7 | 50 | ||||||
Financing | 57 | 26 | ||||||
Accrued expenses | 19 | 15 | ||||||
Store closures | 35 | 35 | ||||||
Acquisition Costs | 20 | — | ||||||
Other—net | 12 | 14 | ||||||
Total deferred income tax assets | 650 | 741 | ||||||
Total valuation allowance | (333 | ) | (350 | ) | ||||
Net deferred income tax assets | $ | 317 | $ | 391 | ||||
Deferred income tax liabilities: | ||||||||
Intangibles | $ | (124 | ) | $ | (142 | ) | ||
Other—net | (5 | ) | (3 | ) | ||||
Total deferred income tax liabilities | (129 | ) | (145 | ) | ||||
Net deferred income tax assets | $ | 188 | $ | 246 | ||||
The deferred tax asset from tax loss carryforwards of $270 million represents approximately $1.0 billion of net operating loss carryforwards, $421 million of which are subject to expiration beginning in 2016. The remainder has an indefinite carryforward period. The valuation allowance decreased by $17 million during 2015, primarily due to the expiration of net operating loss carryforwards against which a valuation allowance had been maintained, as well as the impact of currency translation adjustments, partially offset by the establishment of valuation allowances in certain foreign jurisdictions on current year operating losses that the Company has determined are not more-likely-than-not realizable.
For financial reporting purposes, income from continuing operations before income taxes includes the following components (in millions):
2015 | 2014 | 2013 | ||||||||||
Pretax income (loss): | ||||||||||||
United States | $ | 463 | $ | 545 | $ | 881 | ||||||
Foreign | 29 | (277 | ) | 182 | ||||||||
Income from continuing operations before income taxes | $ | 492 | $ | 268 | $ | 1,063 | ||||||
C-24
STAPLES, INC. AND SUBSIDIARIES
Notes to Consolidated Financial Statements (continued)
The provision (benefit) for income taxes related to continuing operations consists of the following (in millions):
2015 | 2014 | 2013 | ||||||||||
Current tax expense: | ||||||||||||
Federal | $ | 54 | $ | 117 | $ | 193 | ||||||
State | 3 | 36 | 37 | |||||||||
Foreign | 28 | 29 | 21 | |||||||||
Deferred tax expense (benefit): | ||||||||||||
Federal | 17 | (52 | ) | 73 | ||||||||
State | 1 | (9 | ) | 6 | ||||||||
Foreign | 10 | 12 | 26 | |||||||||
Total income tax expense | $ | 113 | $ | 133 | $ | 356 | ||||||
See Note D - Sale of Businesses and Assets for the losses from discontinued operations before income taxes and related income taxes reported in 2013. All pre-tax income presented in discontinued operations is related to foreign operations.
A reconciliation of the federal statutory tax rate to Staples' effective tax rate on income from continuing operations is as follows:
2015 | 2014 | 2013 | |||||||
Federal statutory rate | 35.0 | % | 35.0 | % | 35.0 | % | |||
State effective rate, net of federal benefit | 2.9 | (1.6 | ) | 2.3 | |||||
Effect of foreign taxes | (12.9 | ) | (22.3 | ) | (9.9 | ) | |||
Tax credits | (0.8 | ) | (1.5 | ) | (0.4 | ) | |||
Changes in uncertain tax positions | (9.0 | ) | (13.7 | ) | 2.4 | ||||
Goodwill impairment | — | 44.1 | — | ||||||
Change in valuation allowance | 6.4 | 12.5 | 3.8 | ||||||
Other | 1.4 | (2.7 | ) | 0.3 | |||||
Effective tax rate | 23.0 | % | 49.8 | % | 33.5 | % | |||
The effective tax rate in any year is impacted by the geographic mix of earnings. Additionally, certain foreign operations are subject to both U.S. and foreign income tax regulations, and as a result, income before tax by location and the components of income tax expense by taxing jurisdiction are not directly related. The 2014 effective tax rate was unfavorably impacted by the goodwill impairment charges recorded in 2014 (see Note C - Goodwill and Long-Lived Assets). The 2015 and 2014 effective tax rates were favorably impacted by changes in uncertain tax positions.
The Company operates in multiple jurisdictions and could be subject to audit in these jurisdictions. These audits can involve complex issues that may require an extended period of time to resolve and may cover multiple years. In the Company's opinion, an adequate provision for income taxes has been made for all years subject to audit.
Income tax payments were $205 million, $204 million and $266 million during 2015, 2014 and 2013, respectively.
During 2014, the Company repatriated $127 million of cash held by a foreign subsidiary, and as a result recorded income tax expense of $11 million in 2014 related to the net tax cost in the U.S. stemming from the repatriation. As of January 30, 2016, the Company had $837 million of undistributed earnings. It is the Company’s intention to indefinitely reinvest the majority of the undistributed earnings outside of the U.S., and for jurisdictions not deemed indefinitely reinvested there would be no incremental tax due upon remittance. Accordingly, deferred income taxes have not been provided for these funds. The determination of the amount of the unrecognized deferred tax liability related to the undistributed earnings is not practicable because of the complexities associated with its hypothetical calculation.
Uncertain Tax Positions
At January 30, 2016, the Company had $136 million of gross unrecognized tax benefits, of which $127 million, if recognized, would affect the Company's tax rate. At January 31, 2015, the Company had $216 million of gross unrecognized tax benefits, of which $208 million, if recognized, would affect the Company's tax rate. The Company does not reasonably expect any material changes to the estimated amount of liability associated with its uncertain tax positions through fiscal 2016.
C-25
STAPLES, INC. AND SUBSIDIARIES
Notes to Consolidated Financial Statements (continued)
The following summarizes the activity related to the Company's unrecognized tax benefits, including those related to discontinued operations (in millions):
2015 | 2014 | 2013 | ||||||||||
Balance at beginning of fiscal year | $ | 216 | $ | 281 | $ | 255 | ||||||
Additions for tax positions related to current year | 19 | 22 | 28 | |||||||||
Additions for tax positions of prior years | 5 | 36 | 4 | |||||||||
Reductions for tax positions of prior years | (5 | ) | (88 | ) | — | |||||||
Reduction for statute of limitations expiration | (69 | ) | (17 | ) | (6 | ) | ||||||
Settlements | (30 | ) | (18 | ) | — | |||||||
Balance at end of fiscal year | $ | 136 | $ | 216 | $ | 281 | ||||||
The decline in the liability for unrecognized tax benefits during 2015 was primarily driven by statute of limitations expirations.
Staples is subject to U.S. federal income tax, as well as income tax of multiple state and foreign jurisdictions. The Company has substantially concluded all U.S. federal income tax matters for years through 2011. All material state, local and foreign income tax matters for years through 2002 have been substantially concluded.
The Company recognized interest (benefits) expense and penalties related to income tax matters of $(6) million, $2 million, $9 million in 2015, 2014 and 2013, respectively, which was classified in income tax expense. The Company had $28 million and $49 million accrued for gross interest and penalties as of January 30, 2016 and January 31, 2015, respectively.
Note K — Equity Based Employee Benefit Plans
Staples offers its associates share ownership through certain equity-based employee compensation and benefit plans. In connection with these plans, Staples recognized $63 million, $64 million and $81 million of compensation expense for 2015, 2014 and 2013, respectively. The total income tax benefit related to stock-based compensation was $20 million, $18 million, $23 million for 2015, 2014 and 2013, respectively. As of January 30, 2016, Staples had $71 million of unamortized stock compensation expense associated with its equity-based plans, which will be expensed over a weighted-average period of 1.5 years.
Stock Award Plan
Under the 2014 Stock Incentive Plan, the Company may grant restricted stock and restricted stock units (collectively, “Restricted Shares”) and non-qualified stock options to associates. Prior to June 2014, Restricted Shares and non-qualified stock options were granted under the Company's Amended and Restated 2004 Stock Incentive Plan. Shares issued pursuant to restricted stock awards are restricted in that they are not transferable until they vest. Shares underlying awards of restricted stock units are not issued until the units vest. Non-qualified stock options cannot be exercised until they vest. For stock awards with service conditions only, vesting occurs over different periods, depending on the terms of the individual award, but expenses relating to these awards are recognized on a straight line basis over the applicable vesting period. For awards that include performance conditions, the Company recognizes compensation expense during the performance period to the extent achievement of the performance condition is deemed probable relative to targeted performance. A change in the Company's estimate of the probable outcome of a performance condition is accounted for in the period of the change by recording a cumulative catch-up adjustment.
Performance Shares
In April 2013, March 2014 and March 2015, the Company entered into long-term performance share agreements with certain executives. Vesting is 50% based on satisfaction of certain sales growth metrics and 50% based on achievement of certain return on net assets percentage targets. Payout under these arrangements may range from 25% to 200% of target for each metric, depending on actual performance. Each award covers a three year period. Vesting is based on performance in each fiscal year, with metrics established at the beginning of each year. Any award earned based on performance may be increased or decreased by 25% if the Company's cumulative total shareholder return ("TSR") over the three year performance period is in the top or bottom one-third of the S&P 500 TSR, respectively. Shares earned, if any, will be issued on a fully-vested basis at the conclusion of the three-year performance period only if the grantee is still actively employed by or serving as a consultant to the Company at that time, with certain exceptions for retirement, death, disability, and termination without cause.
For each performance period completed, the table below shows the target number of shares, the aggregate grant-date fair value, and the percentage of target shares earned based on the extent to which the performance targets were achieved, subject to adjustment based on TSR at the end of the three year performance period.
C-26
STAPLES, INC. AND SUBSIDIARIES
Notes to Consolidated Financial Statements (continued)
Performance period | Award date | Target number of shares (millions) | Grant date fair value (millions) | % of target shares earned | ||||
2015 | March 2015 | 0.5 | $7 | 78.4% | ||||
March 2014 | 0.5 | $9 | ||||||
April 2013 | 0.5 | $8 | ||||||
2014 | March 2014 | 0.6 | $7 | 87.3% | ||||
April 2013 | 0.5 | $6 | ||||||
2013 | April 2013 | 0.5 | $7 | 49.7% | ||||
Restricted Shares
The following table summarizes the Company's grants of Restricted Shares in 2015:
Restricted Shares (1) | |||||||
Number of Shares (in millions) | Weighted-Average Grant Date Fair Value Per Share | ||||||
January 31, 2015 | 9 | $ | 13.14 | ||||
Granted | 4 | 14.68 | |||||
Vested | (5 | ) | 13.16 | ||||
Canceled | (1 | ) | 13.35 | ||||
January 30, 2016 | 7 | $ | 13.84 | ||||
(1) | Excludes shares issuable under outstanding performance awards |
The weighted-average grant date fair values per share of Restricted Shares granted during 2015, 2014 and 2013 were $14.68, $11.73 and $15.60, respectively. The total market value of Restricted Shares vested during 2015, 2014 and 2013 was $74 million, $54 million and $96 million, respectively.
Stock Options
The Company did not grant any stock options during 2013, 2014 or 2015. Information with respect to stock options granted in 2012 and prior is as follows (shares in millions):
Number of Shares | Weighted-Average Exercise Price Per Share | Weighted-Average Remaining Contractual Term in Years | Aggregate Intrinsic Value (1) (in millions) | ||||||||
Outstanding at January 31, 2015 | 27 | $ | 20.51 | ||||||||
Granted | — | — | |||||||||
Exercised | (1 | ) | 15.54 | ||||||||
Canceled | — | — | |||||||||
Expired | (6 | ) | 21.51 | ||||||||
Outstanding at January 30, 2016 | 20 | $ | 20.36 | 3.39 | $0 | ||||||
Exercisable at January 30, 2016 | 20 | $ | 20.58 | 3.31 | $0 | ||||||
Vested or expected to vest at January 30, 2016 | 20 | $ | 20.39 | 3.38 | $0 | ||||||
(1) | The intrinsic value of the non-qualified stock options is the amount by which the market value of the underlying stock exceeds the exercise price of an option. |
The total intrinsic value of options exercised during 2015, 2014 and 2013 was $1 million, $1 million and $6 million, respectively.
Employee Stock Purchase Plan
Staples offers its associates the opportunity for share ownership pursuant to the Amended and Restated Employee Stock Purchase Plan. U.S. and International associates are able to purchase shares of Staples common stock at 85% of the market price
C-27
STAPLES, INC. AND SUBSIDIARIES
Notes to Consolidated Financial Statements (continued)
of the common stock at the end of the offering period through payroll deductions in an amount not to exceed 10% of an employee’s annual base compensation. During 2015 and 2014, the Company issued 3 million shares each year pursuant to this plan.
Shares Available for Issuance
At January 30, 2016, 70 million shares of common stock were reserved for issuance under Staples' 2014 Plan, 2004 Plan, 401(k) Plan and employee stock purchase plans.
Note L — Pension and Other Post-Retirement Benefit Plans
The company sponsors pension plans that cover certain employees in Europe and the U.S. The benefits due to U.S. plan participants are frozen. A number of the defined benefit plans outside the U.S. are funded with plan assets that have been segregated in trusts. Contributions are made to these trusts, as necessary, to meet legal and other requirements. The Company also sponsors an unfunded post-retirement life insurance benefit plan, which provides benefits to eligible U.S. executives based on earnings, years of service and age at termination of employment.
In the third quarter of 2013, the Company completed the sale of PSD, pursuant to which certain defined benefit pension plan obligations were transferred to the buyer. In addition, until December 31, 2014 certain employees of PSD participated as current employees in a pension plan in the Netherlands along with participants from other business units of Staples, and as a result of the transaction their benefits have been curtailed. The curtailment and settlement gains and losses related to these plan obligations were insignificant. See Note D - Sale of businesses and assets for additional information regarding PSD.
Unless otherwise noted, the information contained in this note includes both continuing and discontinued operations. The following table presents a summary of the total projected benefit obligation for the pension plans, the fair value of plan assets and the associated funded status recorded in the consolidated balance sheet at January 30, 2016 and January 31, 2015 (in millions):
January 30, 2016 | January 31, 2015 | |||||||||||||||||||||||
Projected Benefit Obligations | Fair Value of Plan Assets | Funded Status | Projected Benefit Obligations | Fair Value of Plan Assets | Funded Status | |||||||||||||||||||
Overfunded Plans: | ||||||||||||||||||||||||
International Plans | $ | (924 | ) | $ | 969 | $ | 45 | $ | — | $ | — | $ | — | |||||||||||
Underfunded Plans: | ||||||||||||||||||||||||
U.S. Plans | $ | (37 | ) | $ | 27 | $ | (10 | ) | $ | (41 | ) | $ | 31 | $ | (10 | ) | ||||||||
International Plans | (65 | ) | 37 | (28 | ) | (1,169 | ) | 1,106 | (63 | ) | ||||||||||||||
Total Underfunded Plans | $ | (102 | ) | $ | 64 | $ | (38 | ) | $ | (1,210 | ) | $ | 1,137 | $ | (73 | ) | ||||||||
C-28
STAPLES, INC. AND SUBSIDIARIES
Notes to Consolidated Financial Statements (continued)
The following tables present a summary of the total net periodic cost recorded in the Consolidated Statement of Comprehensive Income for 2015, 2014 and 2013 related to the plans (in millions):
2015 | ||||||||||||||||
Pension Plans | Post-retirement Benefit Plan | |||||||||||||||
U.S. Plans | International Plans | Total | Total | |||||||||||||
Service cost | $ | — | $ | 19 | $ | 19 | $ | 2 | ||||||||
Interest cost | 2 | 15 | 17 | 3 | ||||||||||||
Expected return on plan assets | (2 | ) | (50 | ) | (52 | ) | — | |||||||||
Amortization of unrecognized losses and prior service costs | 1 | 13 | 14 | 3 | ||||||||||||
Total cost (benefit) | $ | 1 | $ | (3 | ) | $ | (2 | ) | $ | 8 | ||||||
2014 | ||||||||||||||||
Pension Plans | Post-retirement Benefit Plan | |||||||||||||||
U.S. Plans | International Plans | Total | Total | |||||||||||||
Service cost | $ | — | $ | 10 | $ | 10 | $ | 1 | ||||||||
Interest cost | 2 | 29 | 31 | 2 | ||||||||||||
Expected return on plan assets | (2 | ) | (51 | ) | (53 | ) | — | |||||||||
Amortization of unrecognized losses and prior service costs | — | 10 | 10 | 2 | ||||||||||||
Settlement loss | 1 | — | 1 | — | ||||||||||||
Total cost (benefit) | $ | 1 | $ | (2 | ) | $ | (1 | ) | $ | 5 | ||||||
2013 | ||||||||||||||||
Pension Plans | Post-retirement Benefit Plan | |||||||||||||||
U.S. Plans | International Plans | Total | Total | |||||||||||||
Service cost | $ | — | $ | 16 | $ | 16 | $ | 2 | ||||||||
Interest cost | 2 | 33 | 35 | 2 | ||||||||||||
Expected return on plan assets | (2 | ) | (61 | ) | (63 | ) | — | |||||||||
Amortization of unrecognized losses and prior service costs | — | 12 | 12 | 2 | ||||||||||||
Total cost | $ | — | $ | — | $ | — | $ | 6 | ||||||||
The total net cost (benefit) disclosed above for 2015, 2014 and 2013 associated with the pension plans reflects the total for both continuing and discontinued operations. The following table presents the net periodic cost recorded in the consolidated statement of comprehensive income for 2013 related to discontinued operations pension plans only (in millions):
Discontinued Operations | ||||
Pension Plans | ||||
35 Weeks Ended October 5, 2013 | ||||
Service cost | $ | 4 | ||
Interest cost | 2 | |||
Expected return on plan assets | (2 | ) | ||
Total cost | $ | 4 | ||
C-29
STAPLES, INC. AND SUBSIDIARIES
Notes to Consolidated Financial Statements (continued)
The following table presents the changes in benefit obligations during 2014 and 2015 (in millions):
Pension Plans | Post-retirement Benefit Plans | |||||||||||||||
U.S. Plans | International Plans | Total | Total | |||||||||||||
Projected benefit obligation at February 1, 2014 | $ | 38 | $ | 1,076 | $ | 1,114 | $ | 39 | ||||||||
Service cost | — | 10 | 10 | 1 | ||||||||||||
Interest cost | 2 | 29 | 31 | 2 | ||||||||||||
Plan participants' contributions | — | 3 | 3 | — | ||||||||||||
Actuarial losses | 7 | 316 | 323 | 17 | ||||||||||||
Benefits paid | (6 | ) | (51 | ) | (57 | ) | — | |||||||||
Divestiture | — | (1 | ) | (1 | ) | — | ||||||||||
Currency translation adjustments | — | (214 | ) | (214 | ) | — | ||||||||||
Projected benefit obligation at January 31, 2015 | $ | 41 | $ | 1,169 | $ | 1,210 | $ | 59 | ||||||||
Service cost | — | 19 | 19 | 2 | ||||||||||||
Interest cost | 2 | 15 | 17 | 3 | ||||||||||||
Plan participants' contributions | — | 1 | 1 | — | ||||||||||||
Actuarial gains | (4 | ) | (129 | ) | (133 | ) | (3 | ) | ||||||||
Benefits paid | (2 | ) | (44 | ) | (46 | ) | — | |||||||||
Other | — | (1 | ) | (1 | ) | — | ||||||||||
Currency translation adjustments | — | (41 | ) | (41 | ) | — | ||||||||||
Projected benefit obligation at January 30, 2016 | $ | 37 | $ | 989 | $ | 1,026 | $ | 61 | ||||||||
The accumulated benefit obligation for the U.S. Plans and International Plans at January 30, 2016 was $37 million and $970 million, respectively. The accumulated benefit obligation for the U.S. Plans and International Plans at January 31, 2015 was $41 million and $1.1 billion, respectively. The accumulated benefit obligation for the post-retirement benefit obligation was $61 million and $59 million at January 30, 2016 and January 31, 2015, respectively.
The following table presents the changes in pension plan assets for each of the defined benefit pension plans during 2014 and 2015 (in millions):
U.S. Plans | International Plans | Total | ||||||||||
Fair value of plan assets at February 1, 2014 | $ | 33 | $ | 1,141 | $ | 1,175 | ||||||
Actual return on plan assets | 3 | 207 | 210 | |||||||||
Employer's contributions | 1 | 11 | 12 | |||||||||
Plan participants' contributions | — | 3 | 3 | |||||||||
Benefits paid | (6 | ) | (51 | ) | (57 | ) | ||||||
Currency translation adjustments | — | (206 | ) | (206 | ) | |||||||
Fair value of plan assets at January 31, 2015 | $ | 31 | $ | 1,106 | $ | 1,137 | ||||||
Actual return on plan assets | (2 | ) | (28 | ) | (30 | ) | ||||||
Employer's contributions | — | 10 | 10 | |||||||||
Plan participants' contributions | — | 1 | 1 | |||||||||
Benefits paid | (2 | ) | (44 | ) | (46 | ) | ||||||
Currency translation adjustments | — | (39 | ) | (39 | ) | |||||||
Fair value of plan assets at January 30, 2016 | $ | 27 | $ | 1,006 | $ | 1,033 | ||||||
Amounts recognized in the consolidated balance sheet consist of the following (in millions):
C-30
STAPLES, INC. AND SUBSIDIARIES
Notes to Consolidated Financial Statements (continued)
January 30, 2016 | ||||||||||||||||
Pension Plans | Post-retirement Benefit Plans | |||||||||||||||
U.S. Plans | International Plans | Total | Total | |||||||||||||
Prepaid benefit cost (included in other assets) | $ | — | $ | 45 | $ | 45 | $ | — | ||||||||
Accrued benefit liability (included in other long-term obligations) | (10 | ) | (28 | ) | (38 | ) | (61 | ) | ||||||||
Accumulated other comprehensive loss | 10 | 283 | 293 | 31 | ||||||||||||
Net amount recognized | $ | — | $ | 300 | $ | 300 | $ | (30 | ) | |||||||
January 31, 2015 | ||||||||||||||||
Pension Plans | Post-retirement Benefit Plans | |||||||||||||||
U.S. Plans | International Plans | Total | Total | |||||||||||||
Accrued benefit liability (included in other long-term obligations) | $ | (10 | ) | $ | (63 | ) | $ | (73 | ) | $ | (59 | ) | ||||
Accumulated other comprehensive loss | 10 | 335 | 345 | 36 | ||||||||||||
Net amount recognized | $ | — | $ | 272 | $ | 272 | $ | (23 | ) | |||||||
Amounts recognized in accumulated other comprehensive loss that have not yet been recognized as components of net periodic pension and post-retirement benefit costs at January 30, 2016 and January 31, 2015 are comprised of actuarial losses and prior service costs. The amount of accumulated other comprehensive loss expected to be recognized as components of net periodic pension and post-retirement benefit costs during 2016 is approximately $14 million and $3 million, respectively.
There were no significant amendments to any of the Company's defined benefit pension plans or the post-retirement life insurance benefit plan in 2015 or 2014 that would have had a material effect on the consolidated statement of income in these periods.
C-31
STAPLES, INC. AND SUBSIDIARIES
Notes to Consolidated Financial Statements (continued)
Assumptions Used to Determine Plan Financial Information
The valuation of benefit obligations and net periodic pension and post-retirement benefit cost uses participant-specific information such as salary, age and years of service, as well as certain assumptions, the most significant of which include estimates of discount rates, expected return on plan assets, rate of compensation increases, interest rates and mortality rates.
The following table presents the assumptions used to measure the net periodic cost and the year-end benefit obligations for the defined benefit pension and post-retirement benefit plans for 2015, 2014 and 2013:
2015 | |||||||||
Pension Plans | Post-retirement Benefit Plan | ||||||||
U.S. Plans | International Plans | ||||||||
Weighted-average assumptions used to measure net periodic pension cost: | |||||||||
Discount rate | 3.8 | % | 1.2 | % | 4.6 | % | |||
Expected return on plan assets | 6.0 | % | 4.4 | % | — | % | |||
Rate of compensation increase | — | % | 1.8 | % | 3.5 | % | |||
Weighted-average assumptions used to measure benefit obligations at year-end: | |||||||||
Discount rate | 4.5 | % | 1.8 | % | 4.6 | % | |||
Rate of compensation increase | — | % | 1.8 | % | 3.5 | % | |||
Rate of pension increase | — | % | 1.0 | % | — | % | |||
2014 | |||||||||
Pension Plans | Post-retirement Benefit Plan | ||||||||
U.S. Plans | International Plans | ||||||||
Weighted-average assumptions used to measure net periodic pension cost: | |||||||||
Discount rate | 4.8 | % | 3.0 | % | 4.1 | % | |||
Expected return on plan assets | 6.0 | % | 4.7 | % | — | % | |||
Rate of compensation increase | — | % | 1.1 | % | 2.5 | % | |||
Weighted-average assumptions used to measure benefit obligations at year-end: | |||||||||
Discount rate | 3.8 | % | 1.3 | % | 4.1 | % | |||
Rate of compensation increase | — | % | 2.0 | % | 2.5 | % | |||
Rate of pension increase | — | % | 1.1 | % | — | % | |||
2013 | |||||||||
Pension Plans | Post-retirement Benefit Plan | ||||||||
U.S. Plans | International Plans | ||||||||
Weighted-average assumptions used to measure net periodic pension cost: | |||||||||
Discount rate | 4.3 | % | 3.0 | % | 5.4 | % | |||
Expected return on plan assets | 6.0 | % | 5.4 | % | — | % | |||
Rate of compensation increase | — | % | 2.1 | % | 2.0 | % | |||
Weighted-average assumptions used to measure benefit obligations at year-end: | |||||||||
Discount rate | 4.8 | % | 2.9 | % | 5.4 | % | |||
Rate of compensation increase | — | % | 2.0 | % | 2.0 | % | |||
Rate of pension increase | — | % | 1.1 | % | — | % | |||
C-32
STAPLES, INC. AND SUBSIDIARIES
Notes to Consolidated Financial Statements (continued)
The following table shows the effect on pension obligations at January 30, 2016 of a change in discount rate and other assumptions (in millions):
Change in Discount Rate | ||||||||||||
(0.25)% | No change | 0.25% | ||||||||||
Change in rate of compensation increase: | ||||||||||||
(0.25)% | $ | 38 | $ | (1 | ) | $ | (37 | ) | ||||
No change | 39 | — | (36 | ) | ||||||||
0.25% | 40 | 1 | (35 | ) | ||||||||
Change in rate of pension increase: | ||||||||||||
(0.25)% | $ | 5 | $ | (32 | ) | $ | (66 | ) | ||||
No change | 39 | — | (36 | ) | ||||||||
0.25% | 75 | 34 | (5 | ) | ||||||||
The discount rate used is the interest rate on high quality (AA rated) corporate bonds that have a maturity approximating the term of the related obligations. In estimating the expected return on plan assets, appropriate consideration is taken into account of the historical performance for the major asset classes held, or anticipated to be held, by the applicable pension funds and of current forecasts of future rates of return for those asset classes.
Staples' investment strategy for worldwide pension plan assets is to seek a competitive rate of return relative to an appropriate level of risk depending on the funded status of each plan. The majority of the plans' investment managers employ active investment management strategies with the goal of outperforming the broad markets in which they invest. Risk management practices include diversification across asset classes and investment styles and periodic rebalancing toward asset allocation targets. A portion of the currency risk related to investments in equity securities, real estate and debt securities is hedged.
The target allocation reflects a risk/return profile Staples feels is appropriate relative to each plan's liability structure and return goals. Staples conducts periodic asset-liability studies for the plan assets in order to model various potential asset allocations in comparison to each plan's forecasted liabilities and liquidity needs.
Outside the United States, asset allocation decisions are typically made by an independent board of trustees. As in the U.S., investment objectives are designed to generate returns that will enable the plan to meet its future obligations. In some countries local regulations require adjustments in asset allocation, typically leading to a higher percentage in fixed income than would otherwise be deployed. Staples acts in a consulting and governance role via its board representatives in reviewing investment strategy, with final decisions on asset allocation and investment managers made by local trustees.
The Company's pension plans' actual and target asset allocations at January 30, 2016 and January 31, 2015 are as follows:
January 30, 2016 | ||||||||||||||||||
Actual | Target | |||||||||||||||||
U.S. Plans | International Plans | Total | U.S. Plans | International Plans | Total | |||||||||||||
Asset allocation: | ||||||||||||||||||
Equity securities | 48 | % | 26 | % | 27 | % | 50 | % | 26 | % | 26 | % | ||||||
Debt securities | 49 | % | 62 | % | 62 | % | 50 | % | 62 | % | 62 | % | ||||||
Real estate | 3 | % | 8 | % | 7 | % | — | % | 8 | % | 8 | % | ||||||
Cash | — | % | 2 | % | 2 | % | — | % | — | % | — | % | ||||||
Other | — | % | 2 | % | 2 | % | — | % | 4 | % | 4 | % | ||||||
Total | 100 | % | 100 | % | 100 | % | 100 | % | 100 | % | 100 | % | ||||||
C-33
STAPLES, INC. AND SUBSIDIARIES
Notes to Consolidated Financial Statements (continued)
January 31, 2015 | ||||||||||||||||||
Actual | Target | |||||||||||||||||
U.S. Plans | International Plans | Total | U.S. Plans | International Plans | Total | |||||||||||||
Asset allocation: | ||||||||||||||||||
Equity securities | 43 | % | 26 | % | 26 | % | 40 | % | 26 | % | 26 | % | ||||||
Debt securities | 54 | % | 60 | % | 60 | % | 60 | % | 61 | % | 61 | % | ||||||
Real estate | 3 | % | 8 | % | 8 | % | — | % | 7 | % | 7 | % | ||||||
Cash | — | % | 5 | % | 5 | % | — | % | — | % | — | % | ||||||
Other | — | % | 1 | % | 1 | % | — | % | 6 | % | 6 | % | ||||||
Total | 100 | % | 100 | % | 100 | % | 100 | % | 100 | % | 100 | % | ||||||
No pension plan assets are expected to be returned to the Company during 2016.
Information on Fair Value of Plan Assets
The fair values of the Company's pension plan assets at January 30, 2016 and January 31, 2015 by asset category are as follows (in millions):
January 30, 2016 | ||||||||||||||||||||||||||||||||
U.S. Pension Plans | International Plans | |||||||||||||||||||||||||||||||
Quoted Prices in Active Markets for Identical Assets | Significant Other Observable Inputs | Unobservable Inputs | Quoted Prices in Active Markets for Identical Assets | Significant Other Observable Inputs | Unobservable Inputs | |||||||||||||||||||||||||||
Asset Category: | Fair Market Value | Level 1 | Level 2 | Level 3 | Fair Market Value | Level 1 | Level 2 | Level 3 | ||||||||||||||||||||||||
Equity securities (1) | $ | 13 | $ | 13 | $ | — | $ | — | $ | 264 | $ | 209 | $ | 37 | $ | 18 | ||||||||||||||||
Debt securities (2) | 13 | 5 | — | 8 | 627 | 412 | 211 | 4 | ||||||||||||||||||||||||
Real estate (3) | 1 | 1 | — | — | 74 | 72 | 2 | — | ||||||||||||||||||||||||
Cash | — | — | — | — | 25 | 13 | 12 | — | ||||||||||||||||||||||||
Other | — | — | — | — | 16 | — | — | 16 | ||||||||||||||||||||||||
Total | $ | 27 | $ | 19 | $ | — | $ | 8 | $ | 1,006 | $ | 706 | $ | 262 | $ | 38 | ||||||||||||||||
January 31, 2015 | ||||||||||||||||||||||||||||||||
U.S. Pension Plans | International Plans | |||||||||||||||||||||||||||||||
Quoted Prices in Active Markets for Identical Assets | Significant Other Observable Inputs | Unobservable Inputs | Quoted Prices in Active Markets for Identical Assets | Significant Other Observable Inputs | Unobservable Inputs | |||||||||||||||||||||||||||
Asset Category: | Fair Market Value | Level 1 | Level 2 | Level 3 | Fair Market Value | Level 1 | Level 2 | Level 3 | ||||||||||||||||||||||||
Equity securities (1) | $ | 13 | $ | 13 | $ | — | $ | — | $ | 286 | $ | 224 | $ | 40 | $ | 22 | ||||||||||||||||
Debt securities (2) | 17 | 8 | — | 9 | 665 | 438 | 222 | 5 | ||||||||||||||||||||||||
Real estate (3) | 1 | 1 | — | — | 92 | 90 | 2 | — | ||||||||||||||||||||||||
Cash | — | — | — | — | 50 | 35 | 15 | — | ||||||||||||||||||||||||
Other (4) | — | — | — | — | 13 | 1 | (5 | ) | 17 | |||||||||||||||||||||||
Total | $ | 31 | $ | 22 | $ | — | $ | 9 | $ | 1,106 | $ | 788 | $ | 274 | $ | 44 | ||||||||||||||||
(1) | This category includes investments in equity securities of large, small and medium sized companies in the U.S. and in foreign companies, including those in developing countries. The funds are valued using the net asset value method in |
C-34
STAPLES, INC. AND SUBSIDIARIES
Notes to Consolidated Financial Statements (continued)
which an average of the market prices for the underlying investments is used to value the fund. For securities with unobservable inputs, the value is based on audited statements for the underlying fund.
(2) | This category includes investments in investment grade fixed income instrument, U.S. dollar denominated debt securities of emerging market issuers and high yield fixed-income securities that are rated below investment grade. The funds are valued using the net asset value method in which an average of the market prices for the underlying investments is used to value the fund. For securities with unobservable inputs, the value is based on discounted future cash flows. |
(3) | This category includes investments in mortgage-backed and asset-backed securities. The funds are valued using the net asset value method in which an average of the market prices for the underlying investments is used to value the fund. |
(4) | This category includes commodities of approximately $(5) million and non-separated investments with insurance companies of approximately $2 million for the year ended January 31, 2015. Commodities are valued using the net asset value method in which an average of the market prices for the underlying investments is used; the insurance contracts are based on discounted future cash flows. |
The change in the fair value for the pension assets valued using significant unobservable inputs (Level 3) was due to the following (in millions):
U.S. Plans | International Plans | ||||||
Balance at January 31, 2015 | $ | 9 | $ | 44 | |||
Actual return on plan assets still held at the reporting date | (1 | ) | (4 | ) | |||
Translation adjustments | — | (2 | ) | ||||
Balance at January 30, 2016 | $ | 8 | $ | 38 | |||
Expected Benefit Payments and Contributions
The following table presents the expected benefit payments to pension plan participants for the next five years, and the aggregate for the following five years (in millions):
Pension Plans | ||||||||||||
U.S. Plans | International Plans | Total | ||||||||||
2016 | $ | 2 | $ | 41 | $ | 43 | ||||||
2017 | 2 | 42 | 44 | |||||||||
2018 | 2 | 42 | 44 | |||||||||
2019 | 2 | 41 | 43 | |||||||||
2020 | 2 | 41 | 43 | |||||||||
2021-2025 | 12 | 200 | 212 | |||||||||
These payments have been estimated based on the same assumptions used to measure the plans' projected benefit obligation at January 30, 2016 and include benefits attributable to estimated future compensation increases for the pension plans.
The 2016 expected benefit payments to plan participants not covered by the respective plan assets (that is, underfunded plans) represent a component of other long-term obligations in the consolidated balance sheet.
Based on current assumptions, the Company expects to contribute $10 million to its international plan during fiscal 2016.
There are no expected benefit payments and contributions associated with the other post-retirement benefit plans.
Employees' 401(k) Savings Plan and Other Defined Contribution Plans
Staples' Employees' 401(k) Savings Plan (the "401(k) Plan") is available to all United States based employees of Staples who meet minimum age and length of service requirements. Contributions by the Company to the 401(k) Plan are made in cash and vest ratably over a five year period.
The Company's Supplemental Executive Retirement Plan (the "SERP Plan"), which is similar in many respects to the 401(k) Plan, is available to certain Company executives and other highly compensated employees, whose contributions to the 401(k) Plan are limited, and allows such individuals to supplement their contributions to the 401(k) Plan by making pre-tax contributions to the SERP Plan. Company contributions to the SERP Plan are based on a matching formula and vesting period similar to the 401(k) Plan. Other income (expense) in the consolidated statement of income includes a loss of $9 million in 2015 and a gain of $4 million in 2014 related to investments associated with the SERP.
C-35
STAPLES, INC. AND SUBSIDIARIES
Notes to Consolidated Financial Statements (continued)
The expense associated with the Company's match for the Staples 401(k) Savings Plan and for contributions related to certain foreign defined contribution plans for 2015, 2014 and 2013 was $37 million, $40 million and $41 million, respectively.
Note M - Accumulated Other Comprehensive Loss
The following table details the changes in accumulated other comprehensive loss ("AOCL") for 2015, 2014 and 2013 (in millions):
Foreign Currency Translation Adjustment | Deferred Benefit Costs | Accumulated Other Comprehensive Loss | ||||||||||
Balance at February 2, 2013 | $ | (125 | ) | $ | (264 | ) | $ | (389 | ) | |||
Foreign currency translation adjustment | (127 | ) | — | (127 | ) | |||||||
Curtailment of pension plans (net of taxes of $4 million) | — | 11 | 11 | |||||||||
Deferred pension and other post-retirement benefit costs (net of taxes of $4 million) | — | (9 | ) | (9 | ) | |||||||
Reclassification adjustments: | ||||||||||||
Release of cumulative translation adjustments ("CTA") to earnings upon disposal of foreign businesses (net of taxes of $0) | (3 | ) | — | (3 | ) | |||||||
Amortization of deferred benefit costs (net of taxes of $5 million) | — | 10 | 10 | |||||||||
Balance at February 1, 2014 | $ | (255 | ) | $ | (252 | ) | $ | (507 | ) | |||
Foreign currency translation adjustment | (403 | ) | — | (403 | ) | |||||||
Deferred pension and other post-retirement benefit costs (net of taxes of $18 million) | — | (138 | ) | (138 | ) | |||||||
Reclassification adjustments: | ||||||||||||
Release of cumulative translation adjustments to earnings upon disposal of foreign businesses (net of taxes of $0) | (2 | ) | — | (2 | ) | |||||||
Amortization of deferred benefit costs (net of taxes of $0) | — | 9 | 9 | |||||||||
Balance at January 31, 2015 | $ | (660 | ) | $ | (381 | ) | $ | (1,041 | ) | |||
Foreign currency translation adjustment | (132 | ) | — | (132 | ) | |||||||
Deferred pension and other post-retirement benefit costs (net of taxes of $11 million) | — | 40 | 40 | |||||||||
Reclassification adjustments: | ||||||||||||
Amortization of deferred benefit costs (net of taxes of $0) | — | 17 | 17 | |||||||||
Balance at January 30, 2016 | $ | (792 | ) | $ | (324 | ) | $ | (1,116 | ) | |||
The following table details the line items in the consolidated statements of income affected by the reclassification adjustments during 2015, 2014 and 2013 (in millions):
Amount reclassified from AOCL | ||||||||||||
2015 | 2014 | 2013 | ||||||||||
Selling, general and administrative | $ | 17 | $ | 12 | $ | 14 | ||||||
Gain on sale of businesses, net | — | (2 | ) | — | ||||||||
Income before tax | (17 | ) | (10 | ) | (14 | ) | ||||||
Income tax expense | — | (3 | ) | (4 | ) | |||||||
Income (loss) from continuing operations | (17 | ) | (7 | ) | (10 | ) | ||||||
Loss from discontinued operations | — | — | 3 | |||||||||
Net income | $ | (17 | ) | $ | (7 | ) | $ | (7 | ) | |||
C-36
Note N — Share Repurchase Plan
On September 13, 2011, the Company announced a repurchase program had been approved by the Board of Directors (the "2011 Repurchase Plan"). Under this plan, the Company is authorized to repurchase up to $1.5 billion of common stock in both open market and privately negotiated transactions. The 2011 Repurchase Plan has no expiration date and may be suspended or discontinued at any time.
As a result of the Company's proposed acquisition of Office Depot (see Note R - Proposed Acquisition of Office Depot), in the fourth quarter of 2014 the Company temporarily suspended the 2011 Repurchase Plan to focus on building up cash reserves ahead of the acquisition. The Company did not repurchase any shares in 2015. Prior to the plan being suspended, a total of $1.13 billion had been spent to repurchase 83 million shares, and therefore the remaining repurchase authorization as of January 30, 2016 was $373 million.
Note O — Computation of Earnings per Common Share
The computation of basic and diluted earnings per share for 2015, 2014 and 2013 is as follows (in millions, except per share data):
Fiscal Year Ended | |||||||||||
January 30, 2016 | January 31, 2015 | February 1, 2014 | |||||||||
Numerator: | |||||||||||
Income from continuing operations | $ | 379 | $ | 135 | $ | 707 | |||||
Loss from discontinued operations | — | — | (87 | ) | |||||||
Net income | $ | 379 | $ | 135 | $ | 620 | |||||
Denominator: | |||||||||||
Weighted-average common shares outstanding | 642 | 641 | 652 | ||||||||
Effect of dilutive securities: | |||||||||||
Employee stock options and restricted shares (including performance-based awards) | 5 | 5 | 6 | ||||||||
Weighted-average common shares outstanding assuming dilution | 647 | 646 | 658 | ||||||||
Basic Earnings Per Common Share: | |||||||||||
Continuing operations | $ | 0.59 | $ | 0.21 | $ | 1.08 | |||||
Discontinued operations | — | — | (0.13 | ) | |||||||
Net income | $ | 0.59 | $ | 0.21 | $ | 0.95 | |||||
Diluted Earnings Per Common Share: | |||||||||||
Continuing operations | $ | 0.59 | $ | 0.21 | $ | 1.07 | |||||
Discontinued operations | — | — | (0.13 | ) | |||||||
Net income | $ | 0.59 | $ | 0.21 | $ | 0.94 | |||||
For 2015, 2014 and 2013, approximately 20 million, 30 million and 36 million equity instruments, respectively, were excluded from the calculation of diluted earnings per share as their inclusion would have been anti-dilutive.
Note P — Segment Reporting
Staples has three reportable segments: North American Stores & Online, North American Commercial and International Operations. North American Stores & Online sells products and services to customers in the United States and Canada. North American Commercial consists of the U.S. and Canadian businesses that sell and deliver products and services directly to businesses and includes Staples Advantage and Quill.com. The International Operations segment consists of businesses that sell and deliver products and services directly to consumers and businesses in 23 countries in Europe, Australia, South America and Asia.
C-37
STAPLES, INC. AND SUBSIDIARIES
Notes to Consolidated Financial Statements (continued)
Staples' North American Stores & Online and North American Commercial segments are managed separately because the way they sell and market products is different and the classes of customers they service are different. International Operations is considered a separate reportable segment because of the significant differences in the operating environment from the North American operations.
Staples evaluates performance and allocates resources based on profit or loss from operations before goodwill and long-lived asset impairment charges, restructuring charges, accelerated depreciation and amortization and inventory write-downs associated with exit or disposal activities, merger-related costs, stock-based compensation, interest and other expense, costs related to the previously announced PNI data security incident and non-recurring items ("business unit income"). Intersegment sales and transfers are recorded at Staples' cost; therefore, there is no intercompany profit or loss recognized on these transactions.
Asset information by reportable segment has not been presented, since this information is not regularly reviewed by the Company's chief operating decision maker.
The following is a summary of sales, business unit income, and depreciation and amortization expense by reportable segment (in millions):
2015 | 2014 | 2013 | ||||||||||
Sales: | ||||||||||||
North American Stores & Online | $ | 9,538 | $ | 10,449 | $ | 11,103 | ||||||
North American Commercial | 8,361 | 8,270 | 8,042 | |||||||||
International Operations | 3,160 | 3,773 | 3,969 | |||||||||
Total segment sales | $ | 21,059 | $ | 22,492 | $ | 23,114 | ||||||
Business Unit Income (Loss): | ||||||||||||
North American Stores & Online | $ | 429 | $ | 473 | $ | 733 | ||||||
North American Commercial | 599 | 571 | 604 | |||||||||
International Operations | (41 | ) | (21 | ) | (15 | ) | ||||||
Total business unit income | $ | 987 | $ | 1,023 | $ | 1,322 | ||||||
Depreciation & Amortization: | ||||||||||||
North American Stores & Online | $ | 222 | $ | 225 | $ | 225 | ||||||
North American Commercial | 147 | 140 | 124 | |||||||||
International Operations | 81 | 93 | 109 | |||||||||
Total segment depreciation & amortization | $ | 450 | $ | 458 | $ | 458 | ||||||
Accelerated depreciation related to restructuring activities | 5 | 9 | — | |||||||||
Consolidated depreciation & amortization | $ | 455 | $ | 467 | $ | 458 | ||||||
The following is a reconciliation of total business unit income to consolidated income before income taxes (in millions):
2015 | 2014 | 2013 | ||||||||||
Total business unit income | $ | 987 | $ | 1,023 | $ | 1,322 | ||||||
Stock-based compensation | (63 | ) | (64 | ) | (81 | ) | ||||||
Impairment of goodwill and long-lived assets | (50 | ) | (470 | ) | — | |||||||
(Loss) gain on sale of businesses and assets, net | (5 | ) | 27 | — | ||||||||
Restructuring charges | (151 | ) | (171 | ) | (64 | ) | ||||||
Inventory write-downs related to restructuring activities | (1 | ) | (26 | ) | — | |||||||
Accelerated depreciation related to restructuring activities | (5 | ) | (9 | ) | — | |||||||
Interest and other expense, net | (149 | ) | (42 | ) | (114 | ) | ||||||
Merger-related costs | (53 | ) | — | — | ||||||||
PNI data security incident costs | (18 | ) | — | — | ||||||||
Income from continuing operations before income taxes | $ | 492 | $ | 268 | $ | 1,063 | ||||||
C-38
STAPLES, INC. AND SUBSIDIARIES
Notes to Consolidated Financial Statements (continued)
The following table shows the Company's sales by each major category as a percentage of total sales for the periods indicated:
Fiscal Year Ended | |||||||||
January 30, 2016 | January 31, 2015 | February 1, 2014 | |||||||
Core office supplies | 25.3 | % | 25.6 | % | 27.5 | % | |||
Ink and toner | 19.9 | % | 20.0 | % | 20.2 | % | |||
Business technology | 13.4 | % | 14.3 | % | 15.2 | % | |||
Paper | 9.2 | % | 9.2 | % | 9.0 | % | |||
Facilities and breakroom | 11.0 | % | 10.0 | % | 8.7 | % | |||
Computers and mobility | 5.5 | % | 6.3 | % | 6.9 | % | |||
Services | 9.5 | % | 8.6 | % | 6.9 | % | |||
Office furniture and chairs | 6.2 | % | 6.0 | % | 5.6 | % | |||
100.0 | % | 100.0 | % | 100.0 | % | ||||
Geographic Information:
2015 | 2014 | 2013 | ||||||||||
Sales: | ||||||||||||
United States | $ | 15,567 | $ | 16,022 | $ | 16,212 | ||||||
Canada | 2,332 | 2,697 | 2,933 | |||||||||
International | 3,160 | 3,773 | 3,969 | |||||||||
Total consolidated sales | $ | 21,059 | $ | 22,492 | $ | 23,114 | ||||||
January 30, 2016 | January 31, 2015 | February 1, 2014 | ||||||||||
Long-lived Assets: | ||||||||||||
United States | $ | 1,109 | $ | 1,172 | $ | 1,237 | ||||||
Canada | 144 | 167 | 193 | |||||||||
International | 333 | 367 | 441 | |||||||||
Total consolidated long-lived assets | $ | 1,586 | $ | 1,706 | $ | 1,871 | ||||||
Note Q — Quarterly Summary (Unaudited)
The following table summarizes quarterly information for 2015 and 2014:
(In millions, except per share amounts) (9) | ||||||||||||||||
First Quarter (1) | Second Quarter (2) | Third Quarter (3) | Fourth Quarter (4) | |||||||||||||
Fiscal Year Ended January 30, 2016 | ||||||||||||||||
Sales | $ | 5,262 | $ | 4,937 | $ | 5,593 | $ | 5,268 | ||||||||
Gross profit | 1,347 | 1,264 | 1,522 | 1,381 | ||||||||||||
Consolidated net income | 59 | 36 | 198 | 86 | ||||||||||||
Basic and diluted earnings per common share: | $ | 0.09 | $ | 0.06 | $ | 0.31 | $ | 0.13 | ||||||||
C-39
STAPLES, INC. AND SUBSIDIARIES
Notes to Consolidated Financial Statements (continued)
First Quarter (5) | Second Quarter (6) | Third Quarter (7) | Fourth Quarter (8) | |||||||||||||
Fiscal Year Ended January 31, 2015 | ||||||||||||||||
Sales | $ | 5,654 | $ | 5,220 | $ | 5,962 | $ | 5,656 | ||||||||
Gross profit | 1,410 | 1,308 | 1,596 | 1,486 | ||||||||||||
Consolidated net income (loss) | 96 | 82 | 217 | (260 | ) | |||||||||||
Basic and diluted earnings per common share: | $ | 0.15 | $ | 0.13 | $ | 0.34 | $ | (0.41 | ) | |||||||
(1) | Net income for this period includes a $22 million charge for impairment of long-lived assets (see Note C - Goodwill and Long-Lived Assets), $41 million of restructuring charges (see Note B - Restructuring Charges), a $3 million net gain on the disposal of certain property and equipment (see Note D - Sale of Businesses and Assets), $4 million of accelerated depreciation related to restructuring activities (see Note B - Restructuring Charges) and $15 million of costs associated with the proposed acquisition of Office Depot (see Note R - Proposed Acquisition of Office Depot). |
(2) | Net income for this period includes a $1 million charge for impairment of long-lived assets (see Note C - Goodwill and Long-Lived Assets), $23 million of restructuring charges (see Note B - Restructuring Charges), $1 million of accelerated depreciation related to restructuring activities (see Note B - Restructuring Charges) and $34 million of costs associated with the proposed acquisition of Office Depot (see Note R - Proposed Acquisition of Office Depot). |
(3) | Net income for this period includes a $2 million charge for impairment of long-lived assets (see Note C - Goodwill and Long-Lived Assets), $22 million of restructuring charges (see Note B - Restructuring Charges), $1 million of inventory write downs related to restructuring activities (see Note B - Restructuring Charges), $40 million of costs associated with the proposed acquisition of Office Depot (see Note R - Proposed Acquisition of Office Depot) and $3 million of costs related to the previously announced PNI Digital Media Ltd. ("PNI") data security incident (see Note I - Commitments and Contingencies). |
(4) | Net income for this period includes a $25 million charge for impairment of long-lived assets (see Note C - Goodwill and Long-Lived Assets), $66 million of restructuring charges (see Note B - Restructuring Charges), $58 million of costs associated with the proposed acquisition of Office Depot (see Note R - Proposed Acquisition of Office Depot), $16 million of costs related to the previously announced PNI data security incident (see Note I - Commitments and Contingencies) and a $7 million loss on sale of businesses and assets (see Note D - Sale of Businesses and Assets). |
(5) | Net income for this period includes a $22 million charge for impairment of long-lived assets (see Note C - Goodwill and Long-Lived Assets), $13 million of restructuring charges (see Note B - Restructuring Charges), a $22 million net gain on disposal of businesses (see Note D - Sale of Businesses and Assets) and $11 million of inventory write downs related to restructuring activities (see Note B - Restructuring Charges). |
(6) | Net income for this period includes a $5 million charge for impairment of long-lived assets (see Note C - Goodwill and Long-Lived Assets), $88 million of restructuring charges (see Note B - Restructuring Charges), an inventory write down of $5 million related to restructuring activities (see Note B - Restructuring Charges) and $2 million of accelerated depreciation related to restructuring activities (see Note B - Restructuring Charges). |
(7) | Net income for this period includes a $9 million charge for impairment of long-lived assets (see Note C - Goodwill and Long-Lived Assets), $25 million of restructuring charges (see Note B - Restructuring Charges), a $6 million net gain on disposal of a business (see Note D - Sale of Businesses and Assets), $11 million of inventory write downs (see Note B - Restructuring Charges) and $2 million of accelerated depreciation related to restructuring activities (see Note B - Restructuring Charges). |
(8) | Net loss for this period includes a $434 million charge for impairment of goodwill and long-lived assets (see Note C - Goodwill and Long-Lived Assets), $44 million of restructuring charges (see Note B - Restructuring Charges) and $5 million of accelerated depreciation related to restructuring activities (see Note B - Restructuring Charges). |
(9) | The sum of the quarterly amounts may not tie to the full year amounts due to rounding. |
C-40
STAPLES, INC. AND SUBSIDIARIES
Notes to Consolidated Financial Statements (continued)
Note R — Proposed Acquisition of Office Depot
On February 4, 2015, Staples announced that it had signed a definitive agreement to acquire Office Depot, a global supplier of office products, services and solutions for the workplace. Under the terms of the agreement, Office Depot shareholders will receive, for each Office Depot share, $7.25 in cash and 0.2188 of a share in Staples stock at the closing.
On December 7, 2015, the U.S. Federal Trade Commission and Canadian Commissioner of Competition each filed lawsuits against the Company and Office Depot, seeking to block the proposed merger and prevent the acquisition from closing. The Company intends to vigorously defend against the lawsuits, and a decision in the U.S. federal court case is expected by May 10, 2016. On February 2, 2016, each of the Company and Office Depot agreed to waive, until May 16, 2016, its respective rights to terminate the definitive agreement due to a failure to complete the merger by February 4, 2016 or a legal restraint under antitrust laws. The Company would be required to pay Office Depot a termination fee of $250 million under certain circumstances, including if the definitive agreement is terminated as a result of the antitrust closing conditions not being satisfied on or before May 16, 2016.
On February 10, 2016, the Company announced that it had received approval from European Union regulatory authorities to acquire Office Depot, on the condition that Staples divest Office Depot’s European contract business and all of Office Depot’s operations in Sweden. The Company intends to meet these conditions, and to also divest of Office Depot’s retail, catalog and online operations in Europe. The divestitures are subject to the closing of the acquisition. The Company has also received regulatory clearances in Australia, New Zealand and China.
On February 16, 2016, Staples and Office Depot announced they had entered into an agreement to sell customer contracts representing more than $550 million of revenue and related assets to Essendant Inc., for a purchase price of approximately $22.5 million. The revenue related to the divested contracts comes primarily from large corporate customers. The divestiture is subject to the closing of the Office Depot acquisition, as well as other customary closing conditions.
In 2015 the Company incurred expenses of $53 million in connection with the planned transaction, primarily related to professional services associated with obtaining regulatory clearances. These amounts are included in Selling, general and administrative expense in the consolidated statements of income. The Company also incurred fees related to commitments for financing for the transaction, as discussed below.
Transaction Financing
In connection with the proposed acquisition, on February 4, 2015 the Company announced it had obtained financing commitments from Bank of America Merrill Lynch and Barclays Bank, PLC ("Barclays") for a 5-year $3 billion asset-based revolving credit facility and a 6-year $2.75 billion term loan. The original commitments were scheduled to expire on February 4, 2016. During 2015 the Company incurred commitment and other related fees of $94 million related to the term loan, which have been classified as interest expense in the consolidated statements of income. Of this amount, $2 million was paid in 2015, $68 million was paid on February 2, 2016, and $24 million is payable upon closing or termination of the proposed acquisition.
On February 2, 2016, the Company entered into (i) the definitive term loan agreement with the syndicate of lenders, and Barclays as administrative agent and collateral agent, for a principal amount of $2.5 billion, and (ii) an agreement pursuant to which Bank of America Merrill Lynch and Barclays agreed to extend their existing financing commitments for the 5-year $3 billion asset-based revolving credit facility.
The net proceeds from the $2.5 billion term loan were deposited into escrow accounts. The term loan was issued with an original issue discount equal to 1.0% of the par value of the loan. The loan proceeds will be released from escrow to the Company if certain conditions are satisfied, including consummation of the merger, by September 10, 2016 (which may be extended to November 10, 2016 under certain antitrust-related circumstances). If the proceeds are released from escrow, the term loan will mature on the earlier of (1) February 2, 2022, and (2) the date that is 91 days prior to the final maturity date then in effect for Staples’ currently-outstanding 2.75% senior notes due January 2018 if, at such time, the principal amount of outstanding senior notes is $300 million or greater. If the merger is not consummated or if the conditions are not otherwise met, the par value of the term loan and all accrued interest will become immediately due and payable.
Borrowings under the term loan bear interest at a rate per annum equal to, at the Company's option, either (1) an adjusted London interbank offered ("LIBO") rate with a floor of 0.75% (the "Adjusted LIBO Rate"), plus an applicable margin equal to 4.00%, or (2) a base rate determined by reference to the highest of (a) the U.S. federal funds rate plus 0.50%, (b) the “prime rate” last quoted in The Wall Street Journal, (c) the Adjusted LIBO Rate for an interest period of one month, plus 1.00% and (d) 1.75%, in each case plus an applicable margin equal to 3.00%. As of February 2, 2016, the outstanding loan balance under the term loan
C-41
STAPLES, INC. AND SUBSIDIARIES
Notes to Consolidated Financial Statements (continued)
agreement bore an initial interest rate of 4.75% per year, which is subject to adjustment from time to time as provided for in the term loan agreement. If the proceeds are released from escrow, the term loan will be secured by a first priority security interest in substantially all of the assets of the Company, other than the ABL Collateral (defined below), and a second priority security interest in the ABL Collateral.
The commitments for the asset-based revolving credit facility will now expire on May 10, 2016 unless prior to that date the FTC agrees, or a court determines, that the planned merger is permitted to proceed, in which case the commitments would be extended to September 10, 2016. The asset-based revolving credit facility would replace the Company's existing $1.0 billion revolving credit facility (see Note F - Debt and Credit Agreements). The Company's existing $1.0 billion revolving credit facility will remain in place if the transaction is not completed. Amounts outstanding under the asset-based revolving credit facility will bear interest equal to the one month London Interbank Offered Rate ("LIBOR") plus 1.75% for the first three months, and then ranging from LIBOR plus 1.25% to 1.75% thereafter depending on the amount of available borrowing capacity and the amount of outstanding borrowings and letters of credit. The Company will also pay fees ranging from 0.25% to 0.375% on the undrawn portion of the credit facility. Amounts outstanding will be secured by a first-priority security interest in the Company’s receivables, inventory and certain other general intangibles and investment property (the “ABL Collateral”) and a second-priority interest in substantially all the remaining assets of the Company. Availability under the asset-based revolving credit facility will be subject to a borrowing base derived from the ABL Collateral.
The agreements that govern the term loan and that will govern the asset-based revolving credit facility contain (or are expected to contain, as applicable) various affirmative and negative covenants that will, subject to certain significant exceptions, restrict the Company’s ability to take certain actions, and will require the Company to maintain certain financial ratios. The terms of these agreements will limit dividends to $0.15 per share per quarter, subject to certain exceptions.
The Company expects that the proceeds from the term loan, borrowings available under the asset-based revolving credit facility, and cash on hand will be sufficient to finance the acquisition of Office Depot.
Staples, Inc.
SCHEDULE II—VALUATION AND QUALIFYING ACCOUNTS
Valuation and qualifying account information related to operations is as follows (in millions):
Accounts Receivable Allowance for Doubtful Accounts
Balance at Beginning of Period | Additions Charged to Expense | Deductions— Write-offs, Payments and Other Adjustments | Balance at End of Period | |||||||||
Fiscal year ended: | ||||||||||||
February 1, 2014 | 34 | 23 | 26 | 31 | ||||||||
January 31, 2015 | 31 | 36 | 29 | 38 | ||||||||
January 30, 2016 | 38 | 27 | 33 | 32 | ||||||||
C-42
EXHIBIT INDEX
Exhibit No. | Description | |
2.1^ | Agreement and Plan of Merger by and among Office Depot, Inc., the Company, and Staples AMS, Inc., dated as of February 4, 2015. Filed as Exhibit 2.1 to the Company's Form 8-K filed on February 4, 2015. | |
2.2^ | Letter Agreement, dated as of February 2, 2016, by and between the Company and Office Depot, Inc. Filed as Exhibit 10.1 to the Company's Form 8-K filed on February 2, 2016. | |
3.1^ | Restated Certificate of Incorporation, dated as of September 29, 2008. Filed as Exhibit 3.1 to the Company's Form 10-Q for the quarter ended November 1, 2008. | |
3.2^ | Amendment to Restated Certificate of Incorporation, dated June 4, 2012. Filed as Exhibit 3.1 to the Company's Form 8-K filed on June 8, 2012. | |
3.3^ | Amended and Restated By-laws of the Company, dated December 1, 2015. Filed as Exhibit 3.2 to the Company's Form 8-K filed on December 1, 2015. | |
4.1^ | Indenture, dated January 15, 2009, by and among the Company and HSBC Bank USA, National Association. Filed as Exhibit 4.1 to the Company's Form 8-K filed on January 21, 2009. | |
4.2^ | Form of 2.750% Senior Note due 2018. Filed as Exhibit 4.1 to the Company's Form 8-K filed on January 13, 2013. | |
4.3^ | Form of 4.375% Senior Note due 2023. Filed as Exhibit 4.2 to the Company's Form 8-K filed on January 13, 2013. | |
10.1^ | Credit Agreement, dated May 31, 2013, by and among the Company, Bank of America, N.A., and the other lenders named therein, Bank of America, N.A., as administrative agent for the lenders, as the lender of Swing Line Loans, and as an Issuing Bank, Barclays Bank PLC and HSBC Bank USA, National Association, as co-syndication agents for the Lenders and as Issuing Banks, and Wells Fargo Bank, National Association and JPMorgan Chase Bank, N.A., as co-documentation agents for the lenders. (Including schedules and exhibits). Filed as Exhibit 10.1 to the Company's Form 8-K filed June 4, 2013. | |
10.2^ | Amendment No. 2 to Credit Agreement, dated as of February 2, 2016, by and among the Company, Bank of America, N.A. and certain lenders named therein. Filed as Exhibit 10.4 to the Company's Form 8-K filed on February 2, 2016. | |
10.3^ | Amended and Restated Commercial Paper Dealer Agreement, dated as of August 6, 2008, among the Company, Banc of America Securities LLC and the other parties thereto. Filed as Exhibit 10.4 to the Company's Form 10-Q for the quarter ended August 2, 2008. | |
10.4^ | Amended and Restated Commercial Paper Dealer Agreement, dated as of August 6, 2008, among the Company, Lehman Brothers Inc. and the other parties thereto. Filed as Exhibit 10.5 to the Company's Form 10-Q for the quarter ended August 2, 2008. | |
10.5^ | Letter, dated as of September 29, 2008, assigning Lehman Brothers Inc. interests to Barclays Capital Inc., for the Amended and Restated Commercial Paper Dealer Agreement, dated as of August 6, 2008, among the Company, Lehman Brothers Inc. and the other parties thereto. Filed as Exhibit 10.5 to the Company's Form 10-Q for the quarter ended November 1, 2008. | |
10.6^ | Commercial Paper Dealer Agreement, dated as of September 19, 2008, among the Company, JP Morgan Securities Inc. and the other parties thereto. Filed as Exhibit 10.6 to the Company's Form 10-Q for the quarter ended November 1, 2008. | |
10.7^ | Term Loan Credit Agreement, dated as of February 2, 2016, by and among Staples Escrow, LLC, the Company, Barclays Bank PLC and certain lenders party thereto. Filed as Exhibit 10.2 to the Company's Form 8-K filed on February 2, 2016. | |
10.8^ | Escrow Agreement, dated as of February 2, 2016, by and among Staples Escrow, LLC, JPMorgan Chase Bank, N.A. and Barclays Bank PLC. Filed as Exhibit 10.3 to the Company's Form 8-K filed on February 2, 2016. | |
10.9^ | Second Amended and Restated Commitment Letter, dated as of February 2, 2016, by and among the Company, Bank of America, N.A., Merrill Lynch, Pierce, Fenner & Smith Incorporated and Barclays Bank PLC. Filed as Exhibit 10.5 to the Company's Form 8-K filed on February 2, 2016. | |
10.10*^ | Amended and Restated 2004 Stock Incentive Plan, as amended. Filed as Exhibit 10.2 to the Company's Form 10-Q for the quarter ended October 30, 2010. | |
10.11*^ | Form of Non-Employee Director Restricted Stock Award Agreement under the Amended and Restated 2004 Stock Incentive Plan. Filed as Exhibit 10.3 to the Company's Form 10-Q for the quarter ended April 30, 2011. | |
10.12*^ | Form of Restricted Stock Unit Award Agreement under the Amended and Restated 2004 Stock Incentive Plan. Filed as Exhibit 10.9 to the Company's Form 10-K for the fiscal year ended February 1, 2014. | |
10.13*^ | Form of Performance Share Award Agreement under the Amended and Restated 2004 Stock Incentive Plan. Filed as Exhibit 10.2 to the Company's Form 10-Q for the quarter ended August 3, 2013. | |
D-1
Exhibit No. | Description | |
10.14*^ | Form of Non-Employee Director Stock Option Agreement under the Amended and Restated 2004 Stock Incentive Plan. Filed as Exhibit 10.3 to the Company's Form 10-Q for the quarter ended April 30, 2011. | |
10.15*^ | Form of Non-Qualified Stock Option Agreement under the Amended and Restated 2004 Stock Incentive Plan. Filed as Exhibit 10.3 to the Company's Form 10-Q for the quarter ended May 1, 2010. | |
10.16*^ | 2014 Stock Incentive Plan. Filed as Exhibit 10.1 to the Company's 8-K filed on June 2, 2014. | |
10.17*^ | Form of Non-Employee Director Restricted Stock Unit Award Agreement (Annual Grant) under the 2014 Stock Incentive Plan. Filed as Exhibit 10.4 to the Company's Form 10-Q for the quarter ended August 2, 2014. | |
10.18*^ | Form of Non-Employee Director Restricted Stock Unit Award Agreement (Lead Director and Committee Chairs) under the 2014 Stock Incentive Plan. Filed as Exhibit 10.5 to the Company's Form 10-Q for the quarter ended August 2, 2014. | |
10.19*^ | Form of Restricted Stock Unit Award Agreement under the 2014 Stock Incentive Plan. Filed as Exhibit 10.2 to the Company's Form 10-Q for the quarter ended August 2, 2014. | |
10.20*^ | Form of Performance Share Award Agreement under the 2014 Stock Incentive Plan. Filed as Exhibit 10.3 to the Company's Form 10-Q for the quarter ended August 2, 2014. | |
10.21*^ | Amended and Restated Employee Stock Purchase Plan. Filed as Exhibit 10.6 to the Company's Form 10-Q for the quarter ended August 2, 2014. | |
10.22*^ | Amendment to 2012 Employee Stock Purchase Plan. Filed as Exhibit 10.1 to the Company's Form 8-K filed on June 2, 2015. | |
10.23*^ | Non-Management Director Compensation Summary. Filed as Exhibit 10.7 to the Company's Form 10-Q for the quarter ended August 2, 2014. | |
10.24*^ | Form of Severance Benefits Agreement signed by executive officers of the Company. Filed as Exhibit 10.23 to the Company's Form 10-K for the fiscal year ended February 2, 2013. | |
10.25*^ | Second Amended and Restated Long Term Cash Incentive Plan. Filed as Exhibit 10.1 to the Company's Form 10-Q for the quarter ended May 4, 2013. | |
10.26*^ | Amended and Restated Executive Officer Incentive Plan. Filed as Exhibit 10.2 to the Company's Form 8-K filed on June 8, 2012. | |
10.27*^ | Form of Proprietary Interest Protection Agreement. Filed as Exhibit 10.1 to the Company Form 10-Q for the quarter ended November 2, 2013. | |
10.28*^ | Form of Non-Compete and Non-Solicitation Agreement. Filed as Exhibit 10.27 to the Company's Form 10-K for the fiscal year ended February 2, 2013. | |
10.29*^ | Form of Proprietary and Confidential Information Agreement. Filed as Exhibit 10.28 to the Company's Form 10-K for the fiscal year ended February 2, 2013. | |
10.30*^ | Form of Indemnification Agreement signed by executive officers and directors of the Company. Filed as Exhibit 10.34 to the Company's Form 10-K for the fiscal year ended January 31, 2009. | |
10.31*^ | Form of Outside Directorship Agreement. Filed as Exhibit 10.32 to the Company's Form 10-K for the fiscal year ended January 28, 2012. | |
10.32*^ | Second Amended and Restated Severance Benefits Agreement, dated March 10, 2006, by and between the Company and Ronald L. Sargent. Filed as Exhibit 10.1 to the Company's Form 10-Q for the quarter ended April 29, 2006. | |
10.33*^ | Amendment, dated December 22, 2008, to Second Amended and Restated Severance Benefits Agreement, dated March 13, 2006, by and between the Company and Ronald L. Sargent. Filed as Exhibit 10.37 to the Company's Form 10-K for the fiscal year ended January 31, 2009. | |
10.34*^ | Second Amendment, dated January 13, 2015, to Second Amended and Restated Severance Benefits Agreement, dated March 13, 2006, by and between the Company and Ronald L. Sargent. Filed as Exhibit 10.31 to the Company's Form 10-K for the fiscal year ended January 31, 2015. | |
10.35*+ | Amendment C, dated October 12, 2015, to Second Amended and Restated Severance Benefits Agreement, dated March 13, 2006, by and between the Company and Ronald L. Sargent. | |
10.36*^ | Long Term Care Insurance Plan Summary. Filed as Exhibit 10.39 to the Company's Form 10-K for the fiscal year ended January 29, 2011. | |
10.37*^ | Survivor Benefit Plan. Filed as Exhibit 10.24 to the Company's Form 10-K for the fiscal year ended on January 29, 2005. | |
10.38*^ | Executive Life Insurance Plans Summary of Provisions. Filed as Exhibit 10.34 to the Company's Form 10-K for the fiscal year ended January 31, 2015. | |
D-2
Exhibit No. | Description | |
10.39*^ | Amended and Restated Supplemental Executive Retirement Plan. Filed as Exhibit 10.2 to the Company's Form 8-K filed on June 11, 2010. | |
10.40*^ | Policy on Personal Use of Corporate Aircraft. Filed as Exhibit 10.28 to the Company's Form 10-K for the fiscal year ended January 29, 2005. | |
10.41*^ | Senior Executive Long Term Disability Supplemental Coverage Reimbursement Policy. Filed as Exhibit 10.37 to the Company's Form 10-K for the fiscal year ended January 31, 2015. | |
10.42*^ | Tax Services Reimbursement. Filed as Exhibit 10.45 to the Company's Form 10-K for the fiscal year ended January 29, 2011. | |
10.43^ | Agreement, dated April 10, 2015, by and among Staples, Inc. and the entities and natural persons listed on Exhibit A to the Agreement, including Starboard Value and Opportunity Master Fund Ltd. Filed as Exhibit 10.1 to the Company's Form 8-K on April 10, 2015. | |
14.1^ | Code of Ethics. Filed as Exhibit 14.1 to the Company's 10-Q for the quarter ended on May 4, 2013. | |
21.1+ | Subsidiaries of the Company. | |
23.1+ | Consent of Ernst & Young LLP, Independent Registered Public Accounting Firm. | |
31.1+ | Principal Executive Officer-Certification pursuant to Section 302 of the Sarbanes-Oxley Act of 2002. | |
31.2+ | Principal Financial Officer-Certification pursuant to Section 302 of the Sarbanes-Oxley Act of 2002. | |
32.1++ | Principal Executive Officer-Certification pursuant to Section 906 of the Sarbanes-Oxley Act of 2002. | |
32.2++ | Principal Financial Officer-Certification pursuant to Section 906 of the Sarbanes-Oxley Act of 2002. | |
101.INS+ | XBRL Instance Document. | |
101.SCH+ | XBRL Taxonomy Extension Schema Document. | |
101.CAL+ | XBRL Taxonomy Calculation Linkbase Document | |
101.DEF+ | XBRL Taxonomy Definition Linkbase Document. | |
101.LAB+ | XBRL Taxonomy Label Linkbase Document. | |
101.PRE+ | XBRL Taxonomy Presentation Linkbase Document. | |
* A management contract or compensatory plan or arrangement required to be filed as an exhibit to this annual report pursuant to Item 15(b) of Form 10-K.
** Portions of the exhibit have been omitted pursuant to a grant of confidential treatment.
^ An exhibit previously filed with the Securities and Exchange Commission and incorporated herein by reference. Unless otherwise indicated, such exhibit was filed under Commission File Number 0-17586.
+ Filed herewith.
++ Furnished herewith.
D-3