Attached files
| file | filename |
|---|---|
| 8-K - FORM 8-K - BANC OF CALIFORNIA, INC. | d153327d8k.htm |
 March 4, 2016
Investor Presentation
Exhibit 99.1 |
| 1 1 Forward-looking Statements When used in this presentation and in documents filed with or furnished to the Securities and Exchange Commission (the “SEC”),
or other public shareholder communications,
or in oral statements made with the approval of an authorized executive officer, the words or phrases “believe,” “will,” “should,” “will likely result,” “are expected to,” “will continue,” “is anticipated,” “estimate,” “project,”
“plans,” or similar expressions are intended to identify “forward-looking statements” within the meaning of the Private Securities Litigation Reform Act of 1995. You are cautioned not to place undue reliance on any
forward-looking statements, which speak only as of the date
made. These statements may relate to future financial performance, strategic plans or objectives, revenue, expense or earnings projections, or other financial items of Banc of California Inc. and its affiliates (“BANC,” the “Company,” “we,”
“us” or “our”). By their nature, these statements are subject to numerous uncertainties that could cause actual results to differ materially from those anticipated in the statements.
Factors that could cause actual results to differ materially from the results
anticipated or projected include, but are not limited to, the following: (i) risks that the Company’s recently completed acquisitions, including the acquisitions of branches from Banco Popular, The Private Bank of
California, CS Financial, Inc., and The Palisades
Group, may disrupt current plans and operations, the potential difficulties in customer and employee retention as a result of those transactions and the amount of the costs, fees, expenses and charges related to those transactions; (ii) the credit risks of lending activities, which may be
affected by further deterioration in real estate markets and the
financial condition of borrowers, may lead to increased loan and lease delinquencies, losses and nonperforming assets in our loan portfolio, and may result in our allowance for loan and lease losses not being adequate to cover actual losses and require us to materially increase our loan and lease loss reserves; (iii) the quality and composition of our securities and loan portfolios; (iv) changes in general economic conditions,
either nationally or in our market areas; (v) continuation of the
historically low short-term interest rate environment, changes in the levels of general interest rates, and the relative differences between short- and long-term interest rates, deposit interest rates, our net interest margin and funding sources; (vi) fluctuations in the demand
for loans and leases, the number of unsold homes and other
properties and fluctuations in commercial and residential real estate values in our market area; (vii) results of examinations of us by regulatory authorities and the possibility that any such regulatory authority may, among other things, require us to increase our
allowance for loan and lease losses, write-down asset values,
increase our capital levels, or affect our ability to borrow funds or maintain or increase deposits, which could adversely affect our liquidity and earnings; (viii) legislative or regulatory changes that adversely affect our business, including changes in regulatory capital or other rules; (ix) our ability to control operating costs and expenses; (x) staffing fluctuations in response to product demand or the implementation of corporate
strategies that affect our work force and potential associated
charges; (xi) errors in our estimates in determining fair value of certain of our assets, which may result in significant declines in valuation; (xii) the network and computer systems on which we depend could fail or experience a security breach; (xiii) our ability to attract and retain
key members of our senior management team; (xiv) costs and
effects of litigation, including settlements and judgments; (xv) increased competitive pressures among financial services companies; (xvi) changes in consumer spending, borrowing and saving habits; (xvii) adverse changes in the securities markets; (xviii)
earthquake, fire or other natural disasters affecting the
condition of real estate collateral; (xix) the availability of resources to address changes in laws, rules or regulations or to respond to regulatory actions; (xx) inability of key third-party providers to perform their obligations to us; (xxi) changes in accounting policies and
practices, as may be adopted by the financial
institution regulatory agencies or the Financial Accounting Standards Board or their application to our business or final audit adjustments, including additional guidance and interpretation on accounting issues and details of the implementation of new accounting methods; (xxii) war or
terrorist activities; and (xxiii) other
economic, competitive, governmental, regulatory, and technological factors affecting our operations, pricing, products and services and the other risks described in this report and from time to time in other documents that we file with or furnish to the SEC. You should not place undue
reliance on forward-looking statements,
and we undertake no obligation to update any such statements to reflect circumstances or events that occur after the date on which the forward-looking statement is made. |
 2 2 We Are California’s Bank Empowering California’s Diverse Private Businesses, Entrepreneurs and Communities |
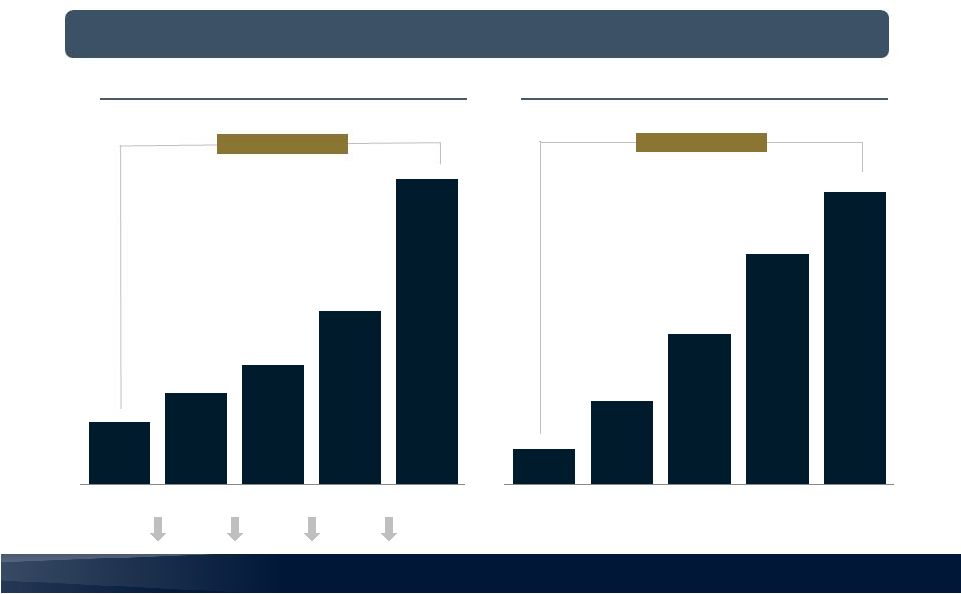
 3 3 $6.5 $7.9 $26.5 $104.3 FY 2012 FY 2013 FY 2014 FY 2015 $1.7 $3.6 $6.0 $8.2 YE 2012 YE 2013 YE 2014 YE 2015 $8.2 billion in Assets $100+ million in Pretax Income 90 California Banking Locations +70% CAGR +153% CAGR 32.3% Total Shareholder Return FY 2015 16.6% Return on Tangible Common Equity 4Q15 1.0% Return on Assets 4Q15 Total Assets Pretax Income Banc of California Franchise Value Accelerating Banc of California named to Forbes Magazine’s 2016 list of America’s 100 Top Banks
1 Source: Bloomberg Total Return Analysis; Total Shareholder Return assumes reinvested dividends (1-1-2015 to
12-31-2015) 2 Dollars in
billions 3 Dollars in millions Loan
Offices Branches
1 2 3 |
 4 4 $1.2 $2.4 $3.9 $5.2 YE 2012 YE 2013 YE 2014 YE 2015 Total Loans ($ in billions) Lending Platform We Empower California’s Businesses and Entrepreneurs 2015 Loan Originations Over $7 billion 1 Gross loan balances, held for investment Commercial Commercial Real Estate Multi-Family Residential SBA Equipment Finance Asset Backed Lines of Credit Warehouse Construction and Rehabilitation Entertainment and Private 1 |
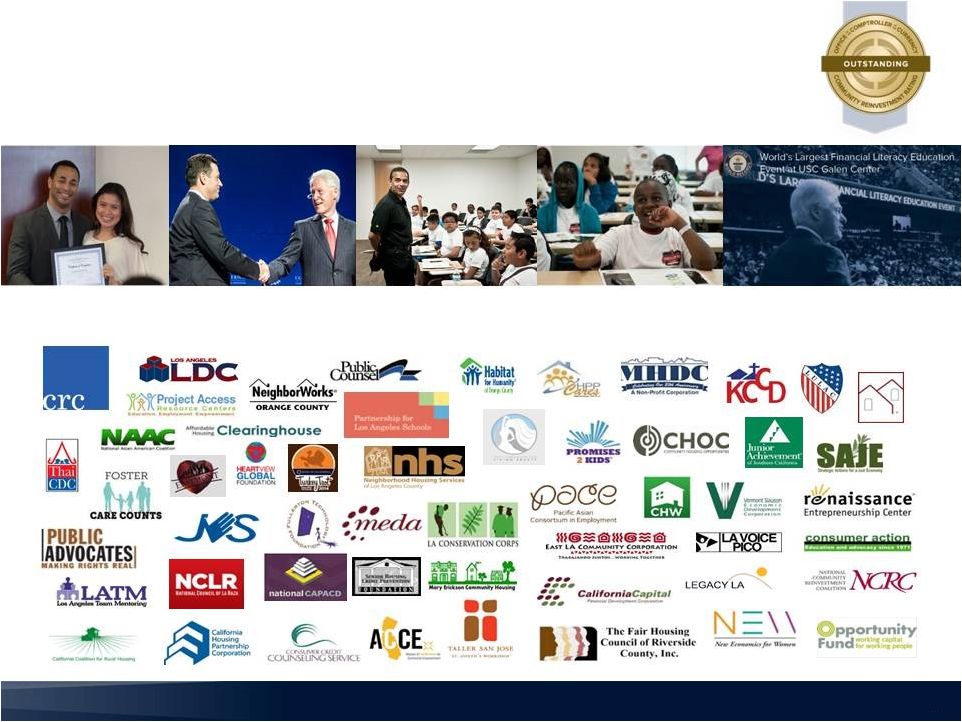 5 5 Clinton Global Initiative, America Community Commitment SDSU Athletics Financial Literacy Partnership Pepperdine Micro-Enterprise Program USC Athletics Financial Literacy Partnership We Empower California’s Diverse Communities Largest Independent Bank in California with an Outstanding CRA Rating World’s Largest Financial Literacy Education Event |
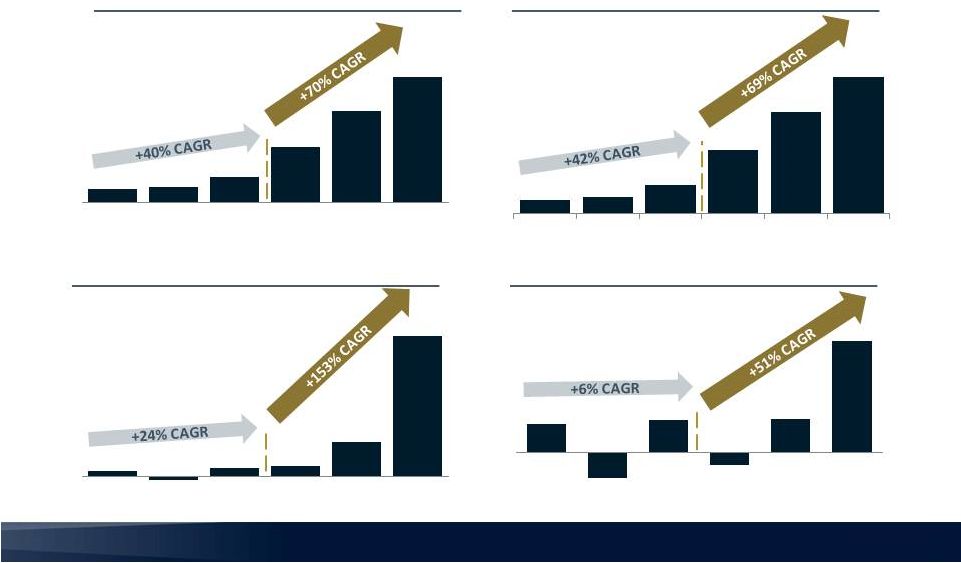
 6 6 $7.9 $26.5 $104.3 FY 2013 FY 2014 FY 2015 $(0.15) $0.41 $1.34 $1.60 FY 2013 FY 2014 FY 2015 FY 2016 Target 2015 Results Reflect Accelerating Profitability Growth Continues to Be Accretive to Tax-Adjusted Earnings, EPS, ROA and ROTCE 0.00% 0.37% 0.94% 1.00% FY 2013 FY 2014 FY 2015 FY 2016 Target 0.1% 5.2% 14.2% 15.0% FY 2013 FY 2014 FY 2015 FY 2016 Target Pretax Income Earnings per Share Return on Tangible Common Equity Return on Assets 4 4 4 5 Proven ability to generate robust organic growth with compelling marginal economics
1 Return on Assets and Return on Tangible Common Equity based on average assets and average tangible common equity, respectively, over
stated time periods 2
Diluted 3
Dollars in millions 4 Normalized to assume full 40% tax
rate 5 Excluding expenses related to capital transactions 2 3 1 |
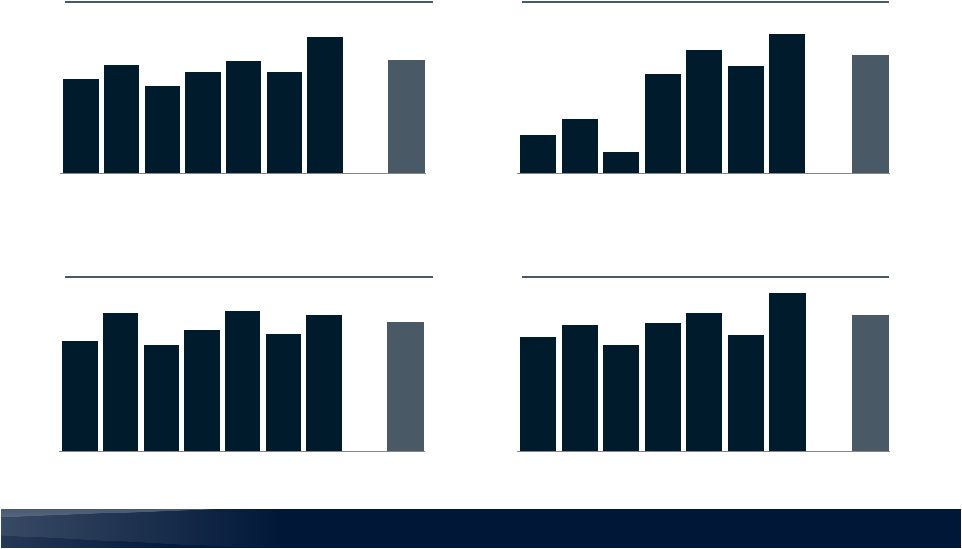 7 7 $0.27 $0.31 $0.25 $0.29 $0.32 $0.29 $0.39 $0.32 2Q14 3Q14 4Q14 1Q15 2Q15 3Q15 4Q15 Avg. FY15 $8.5 $12.2 $4.8 $22.1 $27.4 $23.8 $31.0 $26.1 2Q14 3Q14 4Q14 1Q15 2Q15 3Q15 4Q15 Avg. FY15 Consistent Progress Toward Long-Term Franchise Value Seven Straight Quarters Above Consensus EPS Estimates 0.8% 1.0% 0.8% 0.9% 1.0% 0.9% 1.0% 0.9% 2Q14 3Q14 4Q14 1Q15 2Q15 3Q15 4Q15 Avg. FY15 12% 13% 11% 13% 15% 12% 17% 14% 2Q14 3Q14 4Q14 1Q15 2Q15 3Q15 4Q15 Avg. FY15 1 Dollars in millions 2 Return on Assets and Return on Tangible Common Equity based on average assets and average tangible common equity, respectively, over
stated time periods Earnings per Share
Pretax Income Return on Assets Return on Tangible Common Equity 2 2 1 |
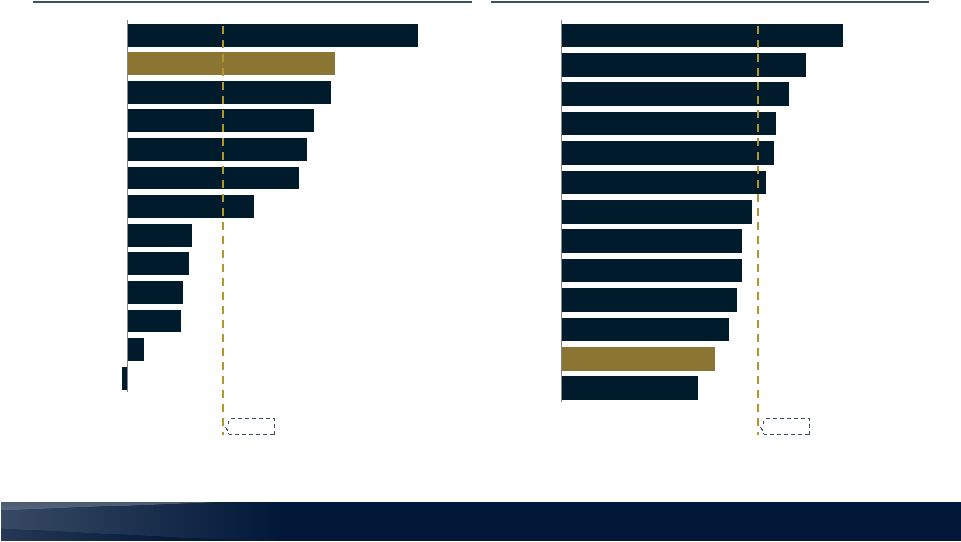
 8 8 8% 1% 4% 5% 5% 6% 6% 7% 8% 9% 9% 14% 14% 16% 17% 17% 24% 12% 13% 26% BANC WABC TCBI BKU COLB EWBC WAFD FRC CBF SBNY PACW WAL BANR CVBF SIVB BPFH OPB BOFI EVER HMST FBC 78% Median 8.6% Median 19.6% Commercial Banks Mortgage-focused banks 33% 17% 0% 0% 0% 0% 0% 17% 0% 17% 0% 17% 0% 33% 33% 0% 0% 0% 0% 17% 17% 1 Standard deviation as % of average; 2014Q2 – 2015Q3 Source: SNL Financial; FactSet Note: OPB not available for 2012Q4-2014Q1; CBF estimates not available for 2012Q2; BANR estimates not available for 2013Q4 and
2014Q4 Realized
Earnings Volatility 1 % of quarters missing median I/B/E/S EPS estimates by more than 5% Earnings Continue to Exhibit Low Volatility Reduced Contribution of Mortgage Banking Earnings has Driven Lower Earnings Volatility |
 9 9 2016 growth to be focused on Commercial Banking segment and net interest income. Additional capital will enable the Company to retain additional originations, favoring net interest income over gain on sale. FY 2015 Pretax Income by Business Segment 1 Business Segment Total; excludes unallocated Corporate / Other segment expense
Commercial Banking Segment Drives Earnings Strength
Commercial Banking Expected to Produce over 80% of Segment Fully-Allocated
Profits in 2016 Quality earnings has resulted in low earnings
volatility with attractive rate of growth Commercial
Banking 84% Mortgage Banking 11% Financial Advisory 5% 1 |
 10 10 $530 $495 $629 $729 $914 4Q14 1Q15 2Q15 3Q15 4Q15 Commercial Banking segment yield of 4.3% on new loans in 4Q15 Mortgage Banking Segment production of $951 million in 4Q Management guidance for 2016 loan production of over $8 billion Commercial Banking Segment Loan Production ($ in millions) Accelerating Commercial Banking Loan Production Achieved 2015 Target of Total Annual Loan Production of over $7 billion |
 11 11 Cost of Deposits: $4.7 $4.9 $5.1 $5.4 $6.3 4Q14 1Q15 2Q15 3Q15 4Q15 $662 $749 $868 $1,011 $1,121 4Q14 1Q15 2Q15 3Q15 4Q15 0.60% 0.54% 0.50% 0.49% 0.48% +35% +69% 0.00% 0.00% 0.00% 0.00% 0.00% Noninterest-bearing Deposits Total Deposits ($ in millions) ($ in billions) 1 Core deposits exclude treasury and brokered deposits Increasingly Valuable Deposit Franchise Rapid Growth In Noninterest-Bearing Deposits Driving Reduced Cost of Deposits
Record $540 million of growth in core deposit balances during the fourth quarter of 2015 1 |
 12 12 Expanded Product / Service Business Unit Partners Client Needs Met KPIs Trust Services – Private Bank – Retail Bank – Financial Institutions Bank – Traditional trust services for high net worth clients as well as securities safekeeping – Noninterest Income – Deposit Balances Foreign Exchange (F/X) – Private Bank – Business Bank – Retail Bank – Foreign currency support for international business without balance sheet risk – Noninterest Income Interest Rate Swaps – Commercial Real Estate – Private Bank – Business Bank – Financial Institutions Bank – Interest rate risk management primarily for real estate secured lending without balance sheet risk – Noninterest Income – Lower Interest Rate Risk Merchant Processing – Private Bank – Business Bank – Retail Bank – Financial Institutions Bank – Debit and credit card processing for business clients – Noninterest Income Debit Card (MasterCard Principal Issuer) – Retail Bank – Private Bank – Business Bank – Financial Institution Bank – Debit card principal issuer to increase profitability of debit card business and leverage expanded client base – Noninterest Income Expanding Product Offerings to Support Client Needs New Products to Provide Incremental Fee-based Revenue in 2016 |
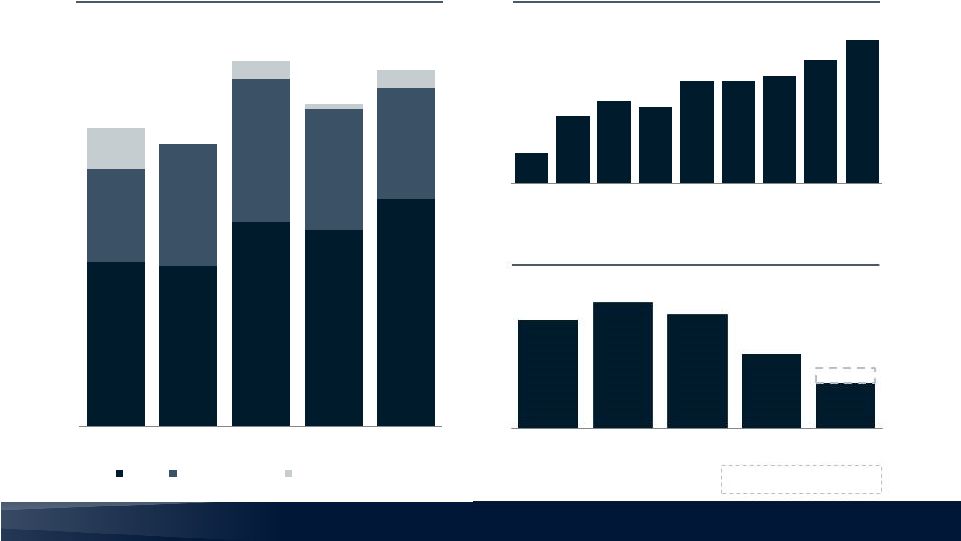 13 13 Noninterest Expense and Productivity Investments in Scalable Platform Yielding Positive Results 1 Includes Mortgage Banking-related commissions, bonus and loan-related expenses
$58.8 $58.3 $64.7 $63.4 $67.9 $13.5 $17.6 $20.6 $17.5 $16.1 $5.9 $2.6 $0.8 $2.7 $78.2 $75.9 $87.9 $81.7 $86.7 4Q14 1Q15 2Q15 3Q15 4Q15 Base Volume-Related Acquisition/Non-core 1 $2.6 $3.3 $3.6 $3.5 $4.0 $4.0 $4.1 $4.4 $4.8 4Q13 1Q14 2Q14 3Q14 4Q14 1Q15 2Q15 3Q15 4Q15 Management Guidance Assets / FTE Noninterest Expense Efficiency Ratio ($ in millions) ($ in millions) FY 2012 FY 2013 FY 2014 FY 2015 FY 2016 86% 92% 88% 75% 65-70% |
 14 14 Asset Quality Remains Strong and Stable Strengthening Credit Metrics Resulting in Increased ALLL / NPL Coverage Ratio
4Q 2014 1Q 2015 2Q 2015 3Q 2015 4Q 2015 % Change YoY NPAs / Assets 0.65% 0.71% 0.66% 0.62% 0.56% (14%) NPAs / Equity 7.7% 8.4% 6.7% 7.0% 7.1% (8%) ALLL / NPLs 77% 69% 81% 77% 79% 3% ALLL / Total Loans 0.75% 0.75% 0.78% 0.74% 0.69% (8%) ALLL and Discount / Total Loans 3.37% 3.27% 2.94% 2.65% 2.66% (21%) |
 15 15 We Believe in California. Large and Attractive Demographic Base • 39.1 million population in CA • Population growth of 4.2% well above national average of 3.3% • CA household income of $61,094 is 15% higher than the national average of $53,046 Solid and Improving Employment Trends • 5.8% CA unemployment rate 4 ; the lowest since November 2007 4.0% Orange County unemployment rate 4 • 13.4 million CA private nonfarm employment (>11% of total national employment) • 874,000 private businesses in California 1 Census.gov (2015 est.); 2 Census.gov (April 1, 2010 to July 1, 2014 ); 3 Census.gov (2009-2013); 4 BLS.gov (December 2015); 5
Census.gov (2013); 6 IMF World Economic Outlook (July 2015) and
BEA Global Insight; 7 LAEDC Economic Forecast (Sept. 2015); 8 Cal Facts, Legislative Analyst’s Office (Dec 2014) Robust and Growing Economy • CA is the 8 largest world economy with GDP of $2.3 trillion 6 • CA accounts for >13% of total U.S. GDP the largest of any state 7 • CA GDP grew by 2.8% in 2014; outpacing national GDP growth of 2.4% 7 Attractive Investment Opportunity • CA is a national leader in the technology, aerospace and life sciences industries as well as
entertainment, tourism and agriculture
• CA firms have attracted venture capital funding in recent years that has equaled or exceeded
the amount received by firms in the other 49 states combined 8 • California banks have historically traded at a premium to national average given attractive
market demographics
1 2 3 th 5 5 |
 16 16 Banc of California has successfully attracted key employees and teams from
New York and Canadian-based competitors
L.A.’s ‘bank to the stars,’ City National Bank, now under Canadian ownership CIT to buy OneWest Bank for more reliable
funding source
S.F. loses another HQ as
Union Bank’s parent moves to New York 1 Dollars in thousands CA-based Banks Total Assets (YE 2005) Status Union Bank $ 48,678,662 Acquired IndyMac Bank 20,329,938 Failed Downey Savings & Loan 17,094,008 Failed Wachovia Bank 15,878,043 Acquired City National Bank 14,398,110 Acquired Fremont Investment & Loan 11,315,543 Acquired First Federal Bank of CA 10,455,725 Failed United Commercial Bank 7,953,849 Failed Santa Barbara Bank & Trust 6,871,479 Acquired Greater Bay Bank 6,670,862 Acquired California National Bank 5,511,818 Failed Commercial Capital Bank 5,397,227 Acquired California’s Changing Bank Landscape Since 2005 California Banking Landscape Increasingly Attractive California Clients and Employees Expressing Preference for California Banks
1 |
 17 17 1 Dollars in billions 2 Dollars in millions 3 Diluted 4
Normalized to assume full 40% tax rate
Deposits Earnings per Share Pretax Income Assets 4 Accelerating Results Under Current Leadership Platform and Infrastructure Investments Leading to Increased Long-term Value Creation
$0.9 $1.0 $1.7 $3.6 $6.0 $8.2 2010 2011 2012 2013 2014 2015 $0.6 $0.8 $1.3 $2.9 $4.7 $6.3 2010 2011 2012 2013 2014 2015 $(0.31) $(0.15) $0.35 $0.39 $0.41 $1.34 2010 2011 2012 2013 2014 2015 ($3) $4 $6 $8 $26 $104 2010 2011 2012 2013 2014 2015 3 1 1 2 |
 18 18 7.5% 8.2% 9.1% 9.2% 9.2% 9.2% 7.3% 9.3% 10.9% 11.2% 11.4% 11.6% SIVB EWBC BKU FRC BOFI WAL BANC OPB FCB CVBF PACW WAFD Tangible Equity / Tangible Assets (TE/TA) Peer Median 1 Source: SNL Financial, data as of 12-31-2015 2 9.3% is pro forma for $125 million preferred stock offering completed in February and $70 million in estimated gross proceeds from common
stock offering applied to BANC balance sheet as of
12-31-2015 2
New Capital Expected to Facilitate Bank’s Growth to over $10 Billion in
Assets; Accelerating EPS growth 9.3%
Strong Equity Position to Support Growth
$200 Million+ of Equity Raised in First Quarter of 2016
Pro-forma for Q1
preferred and
common stock
offerings 9.2% 1 |
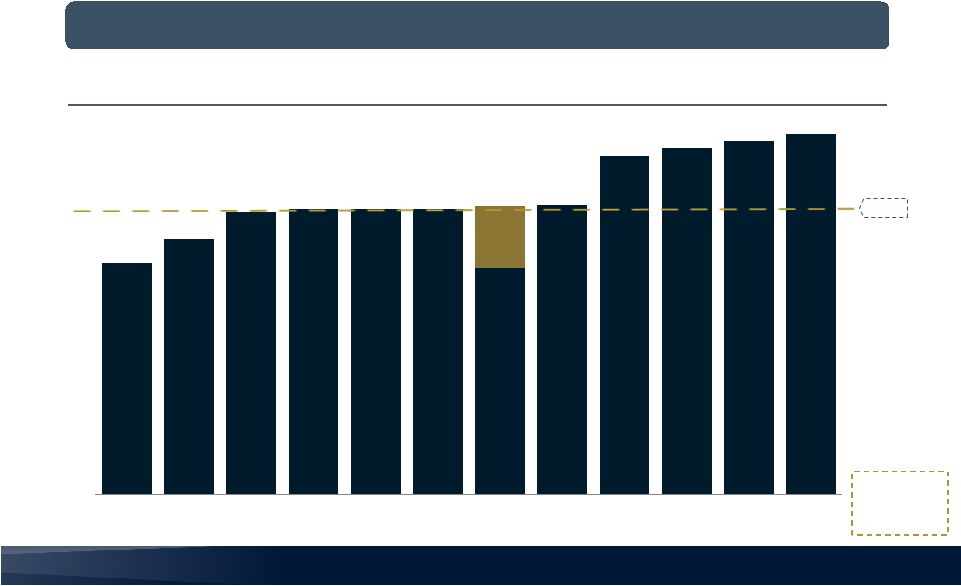
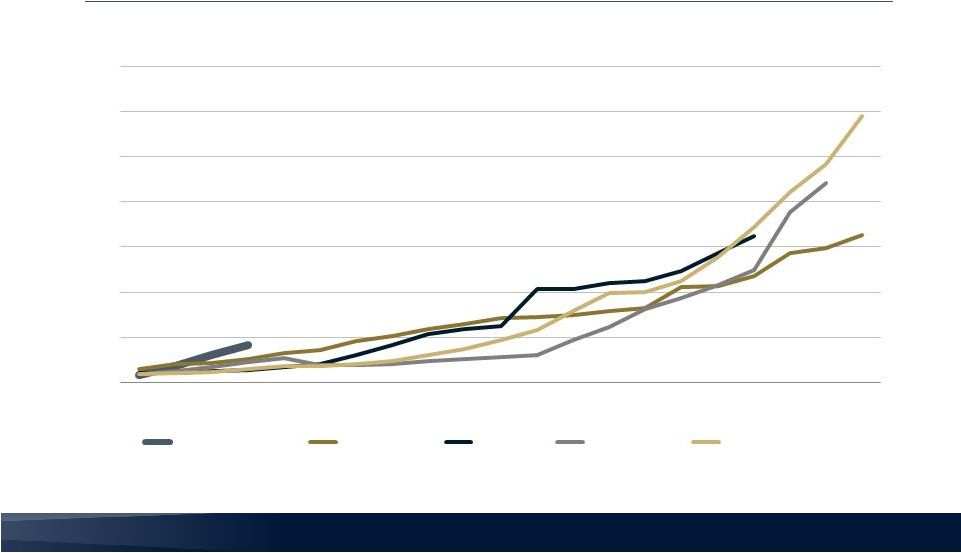 19 19 1 Time series starts with bank crossing of $2 billion in total assets Unbounded Opportunity for California Bank Franchises California Is Ground Zero for Emerging National Bank Franchises Asset Growth For Premier California Bank Franchises Year 0 = $2 billion in Total Assets; $ in billions 1 $0 $10 $20 $30 $40 $50 $60 $70 YR0 YR1 YR2 YR3 YR4 YR5 YR6 YR7 YR8 YR9 YR10 YR11 YR12 YR13 YR14 YR15 YR16 YR17 YR18 YR19 YR20 Banc of California City National EastWest Silicon Valley First Republic |
 20 20 Affirming and Increasing FY 2016 Guidance New Capital will Support Stronger Growth and EPS Metric FY 2016 FY 2016 (Q4 2015 Earnings Call) (Post Capital Offerings) ROATCE 15% 15% ROAA 1%+ 1%+ Efficiency Ratio 65% - 70% 65% - 70% Total Assets $9.5 billion+ $10 – $11 billion Earnings Per Share $1.55+ $1.60+ 1 Excluding expenses related to capital transactions Management expects total assets to exceed $10 billion during 2H 2016 based on current
market conditions.
Management expects to be subject to DFAST requirements beginning in
2018. Increasing 2016 guidance with additional capital to support
accelerated growth 1 |
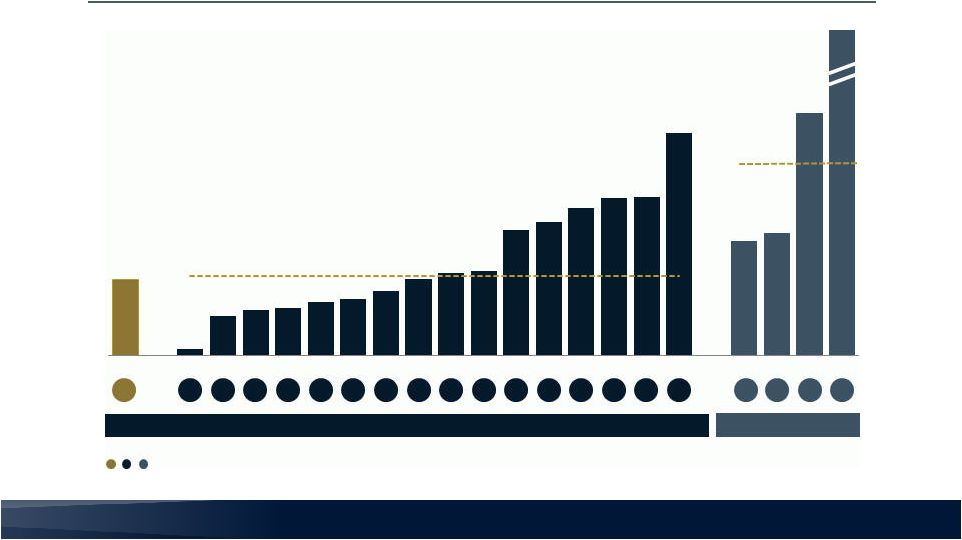
 21 21 -0.9% 2.4% 8.2% 8.6% 9.5% 10.1% 19.7% 26.8% 28.0% 29.0% 31.6% 32.3% 45.3% PACW SIVB BOFI CVBF EWBC WAFD CBF BKU FRC WAL OPB BANC FCB Total Shareholder Return (FY 2015) 1 Source: Bloomberg Total Return Analysis; Total Shareholder Return assumes reinvested dividends (1-1-2015 to 12-31-2015)
2
Source: SNL Financial; as of March 3, 2016
14.9% Peer Median Price / Tangible Book (%) 125% 140% 153% 160% 165% 165% 174% 186% 194% 196% 208% 224% 257% WAFD BANC CBF SIVB BKU FCB EWBC OPB BOFI PACW CVBF FRC WAL 180% Peer Median Strong Shareholder Returns Closing the Valuation Gap Valuation Provides Compelling Opportunity 1 2 |
 We Are California’s Bank.
V I S I O N |
 M I S S I O N Empowering California’s Diverse Private Businesses, Entrepreneurs and Communities |
 W E B E L I E V E
We Believe In Empowering Dreams.
We Believe In Strong Partnerships.
We Believe In California. |
 |