Attached files
| file | filename |
|---|---|
| 8-K - FORM 8-K - Endo International plc | d153068d8k.htm |
| EX-99.1 - EX-99.1 - Endo International plc | d153068dex991.htm |
Exhibit 99.2
| Frequently Asked |

| |
| Questions & Answers |
| March 2, 2016 | ||

| 2016: Positioned for Continued Growth | ||||
| What are your growth expectations across your business for 2016? Why? |
We believe Endo is strongly positioned for growth and profitability in 2016. We expect:
• Solid adjusted diluted EPS growth for the Endo total enterprise driven by underlying revenue growth in the low double digits | |||
| • U.S. Branded Pharmaceuticals: low single-digit underlying growth | ||||
| • U.S. Generic Pharmaceuticals: mid- to high-teens underlying growth | ||||
| • International Pharmaceuticals: mid- to high-single digit underlying growth rate overall; double-digit underlying growth rate projected for emerging markets | ||||
| • Note that Endo expects a decline in reported revenues in 2016 versus 2015 for this segment due to a stronger U.S. dollar and recent product divestitures | ||||
| • An adjusted margin profile of 63% to 65%, which is in line with 2015 despite a higher mix of Generics revenue in 2016 | ||||
| • Driven by the growth of priority Branded products and a continued shift toward high value products in our Generics business | ||||
| • An adjusted tax rate of 9% to 11%, driven by continued execution of our tax planning strategy and build out of our Irish infrastructure | ||||
| • Strong underlying cash flow conversion to approximate adjusted net income | ||||
| Importantly, the fundamental profile that we’ve demonstrated in 2015 and anticipate in 2016 is also expected to continue in 2017. Endo’s long-term goals and earnings profile, including for 2017, has not changed from the Company’s previously stated expectations. | ||||
|
| ||||
| What do you expect for your revenue cadence during 2016?
|
Endo expects that results will be lumpy through 2016 driven by a number of factors including:
• Historical first quarter trends, including cyclical seasonality and normal fluctuations in stocking levels | |||
|
• Expected first quarter impacts to the U.S. Branded business, including: | ||||
|
• Expected seasonality | ||||
| • Early investment and the early ramp of BELBUCA™ | ||||
| • Early investment in XIAFLEX® marketing and Direct-to-Consumer campaigns | ||||
| • Lower overall LIDODERM® revenues due to a one-time benefit in the fourth quarter 2015 related to returns reserves in tandem with a shift in Part D from branded to generics | ||||
1
| • Timing of potential market entrants around key products in the U.S. Branded and U.S. Generics portfolios
| ||||
| • Our anticipated launches of the generic versions of Seroquel® XR and Zetia® in the fourth quarter 2016 | ||||
|
Using the mid-point of our 2016 revenue and EPS guidance ranges, Endo expects:
| ||||
| • ~54% of revenues and ~57% of adjusted diluted EPS to be in 2H 2016
| ||||
| • ~22% of revenues and ~18% of adjusted diluted EPS to be in Q1 2016 | ||||
|
Strong Branded Performance in Fourth Quarter 2015
| ||||
| What drove the strong performance for the U.S. Branded segment in the fourth quarter?
|
U.S. Branded revenues in the fourth quarter 2015 exceeded consensus, as a result of strong results from select products including:
| |||
| • XIAFLEX® – 10% year-over-year revenue growth driven by the launch of key patient awareness and engagement programs and multi-pronged marketing campaigns; first >$50 million revenue quarter since launch helped product exceed 2015 consensus estimates
| ||||
| • Voltaren® Gel – 24% year-over-year revenue growth supported by increased sales and marketing efforts around the product and favorable price; first >$200 million revenue year helped product exceed 2015 consensus estimates
| ||||
| • Par Branded Products – Nascobal®, Cortisporin® and Megace® contributed $19 million (*as a note: Vasostrict® is NOT included in U.S. Branded revenues)
| ||||
| • LIDODERM® – $15 million favorable impact from changes in estimates related to certain gross-to-net reserves as well as Part D favorability
| ||||
| • Long-acting Testosterone Replacement Therapy (TRT) Franchise – 28% year-over-year revenue growth due to strong performance by AVEED®
| ||||
| Can you provide more information on XIAFLEX® performance in the fourth quarter of 2015 and your growth expectations for 2016?
|
XIAFLEX® continued to grow in the fourth quarter 2015 in line with Endo’s internal expectations:
| |||
| • U.S. net revenues of $50.2 million are a 10% increase over the $45.8 million in U.S. revenues in the fourth quarter 2014
| ||||
| • Ex-U.S. net revenues of $4.0 million are stable compared to the $4.0 million of worldwide revenues in the fourth quarter 2014
| ||||
| • Overall demand vials of approximately 54,000 in 2015 are a 37% increase over 2014
| ||||
| • Peyronie’s disease demand vials were approximately 7,570 in the fourth quarter 2015; approximately 2,500 physicians were certified under the required risk evaluation and mitigation strategy (REMS) as of December 31, 2015 and 13,135 cumulative patients have been treated
| ||||
| • Dupuytren’s contracture demand vials of approximately 7,400 in fourth quarter 2015, demonstrating continued steady growth five years after the product’s launch | ||||
2
| Endo expects that the strong double-digit growth rate for XIAFLEX® will continue in 2016.
| ||
| What should we expect for BELBUCA™ sales and revenue recognition in 2016?
|
BELBUCA™ revenues will be recognized on demand utilization until the pattern of shipments versus demand trends normalize, which we expect to be around mid-year 2016. So, we project the vast majority of sales for the product will be recognized in the second half of the year. This method of revenue recognition is standard practice and how Endo has accounted for launch product revenues in the past.
| |
| U.S. Generics Driving Double-Digit Growth in 2016
| ||
| How much did Par Pharmaceutical contribute to the fourth quarter 2015 results in your Generics business?
|
Endo realized strong performance from the legacy Par portfolio in fourth quarter 2015. The legacy Par base business and new launch products outperformed the Company’s internal expectations driven by better base business performance, new product launches and growth in sterile injectables . As a result, legacy Par generics revenue in the fourth quarter 2015 totaled approximately $359 million. This did not include revenue from branded products we added through the Par acquisition: Megace®, Nascobal® and Cortisporin®. These products were reported in our U.S. Branded Business. Year over year, Par generics revenue in fourth quarter 2015 decreased 3% and was impacted by Par’s 2014 launch of generic EXFORGE®.
| |
| As a note, Endo does not expect to break out revenues for legacy Qualitest or legacy Par businesses in 2016 as those buisinesses strategically managed as a combined U.S. Generics portfolio.
| ||
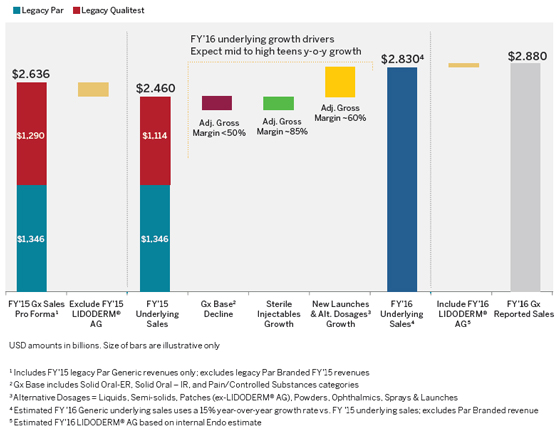
| What are the drivers for the projected double- digit underlying growth in your U.S. Generics business in 2016?
|
|
3
| What are the drivers for the projected double- digit underlying growth in your U.S. Generics business in 2016?
(Cont’d)
|
| |
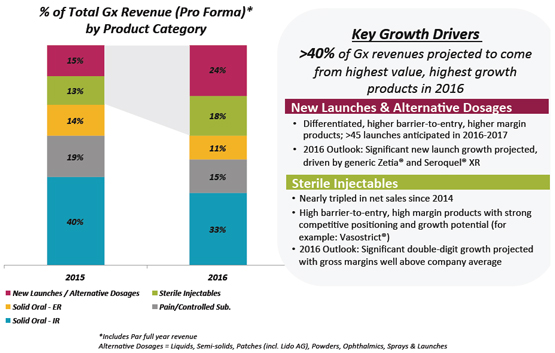
| More than 40% of U.S. Generics revenues in 2016 are projected to come from the | ||
| portfolio’s highest value, highest growth products and segments: | ||
| • New Launches & Alternative Dosages – driven by the anticipated launches of generic Seroquel® XR and generic Zetia® in the fourth quarter of 2016. Both products have sole 180-day exclusivity with no Authorized Generic challenge during that 180 days. | ||
| • Sterile Injectables – driven by continued significant double-digit growth and gross margins well above the Company average. | ||
| The U.S. Generics Base business is expected to decline in the mid to high single digit percentages in 2016 due to expected erosion driven by increased pricing and competitive pressure on commoditized generic products. This erosion is fully factored into our mid- to high-teens double digit underlying growth expectation for the full year. | ||
4
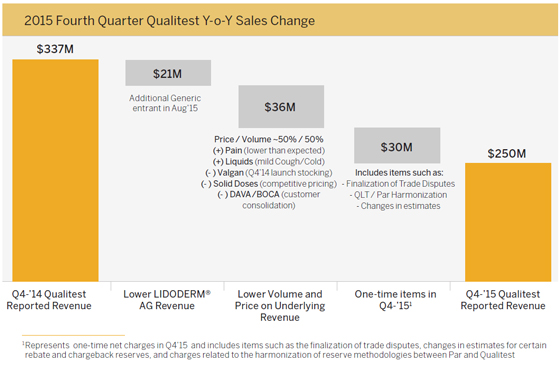
| What were the drivers of the Qualitest legacy portfolio revenue decline in the fourth quarter 2015?
|
| |
| Endo’s Qualitest base business or legacy portfolio is diversified and, as a result, was historically less impacted by the challenging pricing environment across the broader generic drug market. Endo did, however, see a decline in performance from its Qualitest legacy portfolio in fourth quarter 2015 compared to fourth quarter 2014, driven by: | ||
| • Lower LIDODERM® Authorized Generic Revenue | ||
| • Due to a new generic entrant in August 2015 | ||
| • Lower Volume and Price on Underlying Revenue | ||
| • Higher than expected rebates and chargebacks in pain and commoditized products related to fourth quarter 2015 sales as part of normal quarter-end accounting close processes which are expected to recur and have been factored into our 2016 guidance | ||
| • Increased product competition that resulted in some volume loss and pricing pressure | ||
| • Mild cold and flu season | ||
| • One-Time Items in Q4 2015 | ||
| • Non-recurring net charges of approximately $30 million made up of charges including the finalization of trade disputes, incremental net charges in certain estimated rebates and reserves and the harmonization of reserve methodologies between Par and Qualitest | ||
| As a reminder, the fourth quarter 2014 was positively impacted by the November 2014 launch and corresponding stocking of Valganciclovir . | ||
5
| Balance Sheet Updates | ||||
| What were the drivers of your decision around ASTORA Women’s Health?
|
Endo successfully divested AMS Men’s Health business in 2015. At the same time, the Company launched a strategic process for AMS Women’s Health — now ASTORA Women’s Health. While that process did result in formal bids for ASTORA, Endo has now determined that it will wind down business operations for ASTORA in 2016. | |||
|
Key factors that drove this decision include the evolving broader product liability landscape around vaginal mesh and the ability to reduce the potential for product liability related to future mesh implants. Importantly, we believe that the reduction in product liability associated with the winding down of ASTORA would not have been possible through a sale of that business. | ||||
| Endo is supporting physician transition plans to alternative products and expects to cease manufacturing and commercial operations for ASTORA by March 31, 2016.
| ||||
| Can you provide more detail about the vaginal mesh product liability accrual in the fourth quarter? Should we expect additional accruals in the future?
|
During the fourth quarter 2015, Endo recorded an $834 million aggregate pre-tax charge to increase its estimated product liability accrual for vaginal mesh cases. During the fourth quarter 2015, Endo also recorded a $997 million tax benefit directly attributable to mesh product liability including the worthless stock deduction recognized in fourth quarter. The Company anticipates that it will receive a federal income tax refund in 2016 from carrying back losses incurred in 2015 and expects additional benefits from reduced federal income taxes in 2016 and future years. Below is a roll-forward of our mesh product liability from the third quarter 2015 and analysis of future cash outlays. | |||
| Mesh Liability Cash Call (Pre-Tax, $M) |
||||||
| Product Liability Accrual (9/30/15) |
$ | 1,403 | Initial Master Settlement Agreements (MSAs) resolving ~46,600 claims | |||
| Q4 2015 Payments from QSF |
($ | 151 | ) | |||
| Additional Product Liability Accrual (Q4 2015) |
$ | 834 | $834 accrual consists of two segments: | |||
| • $401: elimination of kick-out factor | ||||||
| • $433: new additional settlements, claims | ||||||
| Total Product Liability Accrual as of 12/31/15 |
$ | 2,086 | ||||
| Amount Funded in QSF as of 12/31/15 |
($ | 579 | ) | |||
| Total Remaining Mesh Liability Accrual PRE-TAX Cash Call in 2016 and 2017 |
$ | 1,507 | Current MSA total: ~49,000 claims | |||
| 2016: | 2017: | |||||
| Pre-Tax Mesh Cash Call: | ~$850m - $950m | Pre-Tax Mesh Cash wCall : | ~$550m - $650m | |||
| Tax Refund / Tax Shield: | ~($700m) | Tax Refund / Tax Shield: | ~($225m) | |||
| Post-Tax Mesh Cash Call: | ~$150m - $250m | Post-Tax Mesh Cash Call: | ~$325m - $425m | |||
| * | Amounts are directional and are estimates |
6
| An important note regarding the additional ~2,500 claims that have been settled in 2016: Endo strategically settled these higher value claims, which we believe do not represent the average settlement value as these inventories contain a higher percentage of more complicated surgeries than previously settled inventories. | ||
| Endo is currently aware of approximately 8,000 purported claims that have not been accrued for because the company has determined that these claims are not probable of a loss, largely due to a lack of relevant of information, such as medical records, evidence of an AMS implant and / or basic demographic information. As a result, we and outside legal counsel believe this portfolio could be of lower value and lower quality. Endo also recently became aware of what it believes may be fraudulent or other wrongful activities relating to the generation of certain mesh claims. The Company plans to fully investigate the scope of such activities and, if appropriate, will vigorously pursue all available remedies against each responsible party, including through civil litigation, and cooperate with law enforcement authorities, other mesh manufacturers and the federal court in the ongoing mesh multidistrict litigation.
| ||
| What is your expected adjusted tax rate in 2016? 2017?
|
Endo is projecting an adjusted effective tax rate between 9% and 11% in 2016. The increase versus 2015 is driven by the addition of Par’s significant U.S. EBITDA base. Endo has made significant progress in integrating Par and now expects its adjusted tax rate for 2016 to be better than anticipated at the closing of the Par acquisition. We expect that rate to be in the low-double digits to low teens in 2017 and beyond given continued growth in our U.S. EBITDA base.
| |
| Can you provide more information regarding cash flow from operations?
|
During the full year 2015, net cash provided by operating activities was approximately $62 million. This reported cash flow from operations was impacted by a number of non-core or non-recurring pre-tax cash outlays and cash receipts that are not necessarily indicative of Endo’s core operations. | |
| The table below highlights certain significant pre-tax cash outlays and cash receipts during that period: | ||
| ($M) |
Q1 | Q2 | Q3 | Q4 | 2015 | |||||||||||||||
| Reported Cash Flow from Operations | ($ | 90 | ) | $ | 13 | ($ | 100 | ) | $ | 239 | $ | 62 | ||||||||
| Non-Core Cash Outlays: | ||||||||||||||||||||
| Mesh Liability & Other Litigation* | $ | 131 | $ | 265 | $ | 130 | $ | 173 | $ | 699 | ||||||||||
| M&A & Financing Related Costs* | $ | 56 | $ | 36 | $ | 156 | $ | 54 | $ | 302 | ||||||||||
| Restructuring & Integration Costs* | $ | 12 | $ | 20 | $ | 28 | $ | 13 | $ | 73 | ||||||||||
| Federal Tax Refunds Received | — | — | ($ | 84 | ) | ($ | 72 | ) | ($ | 156 | ) | |||||||||
|
|
|
|
|
|
|
|
|
|
|
|||||||||||
| Total: | $ | 199 | $ | 321 | $ | 230 | $ | 168 | $ | 918 | ||||||||||
| Adjusted Net Income | $ | 228 | $ | 226 | $ | 215 | $ | 306 | $ | 975 | ||||||||||
| * | Not all inclusive; pre-tax totals; for more information and full details, please see Endo’s Form 10-K |
7
| If you neutralize these non-core and non-recurring items, cash from operations shows a high correlation to adjusted net income. Endo views this as a quality measure of its overall results and its ability to deliver long-term shareholder value. The Company expects this underlying cash flow profile to remain consistent for 2016. | ||||
| For 2016, we project: | ||||
| • | Adjusted EBITDA of ~$2 billion | |||
| • | Underlying cash from operations* of greater than $800 million | |||
| * Excluding cash flows related to mesh payments and litigation costs and one-time tax refund related to fourth quarter 2015 worthless stock deduction | ||||
|
| ||||
| For more information please refer to Endo’s 2015 Form 10-K that has been filed with the SEC on February 29, 2016. | ||||
| FORWARD LOOKING STATEMENTS | ||||
| Statements contained in this communication referring to future events or other non-historical facts are forward looking statements reflecting Endo’s current perspective of existing trends and information. If underlying assumptions prove inaccurate or unknown, or unknown risks or uncertainties materialize, actual results could vary materially from Endo’s expectations and projections. Risks and uncertainties include, among other things, the risks and uncertainties described in Endo’s periodic reports filed with the SEC and Canadian securities regulators, including current reports on Form 8-K, quarterly reports on Form 10-Q and annual reports on Form 10-K. Given these uncertainties, you should not place undue reliance on these forward-looking statements, which apply only as of the date of this communication. Endo expressly disclaims any intent or obligation to update these forward-looking statements except as required by law. Additional information about Endo is available at www.endo.com or you can contact the Endo Investor Relations Department by calling 484-216-0000. | ||||
8