Attached files
| file | filename |
|---|---|
| 8-K - 8-K - WideOpenWest Finance, LLC | a16-5541_18k.htm |
Exhibit 99.1
J.P. Morgan 2016 Global High Yield & Leveraged Finance Conference February 2016

Legal disclaimer Forward-Looking Statements Certain statements in this presentation and in any accompanying oral remarks made in connection with this presentation are “forward-looking statements” within the meaning of securities laws. You should not place undue reliance on these statements. Forward-looking statements include information concerning our liquidity and our possible or assumed future results of operations, including descriptions of our business strategies, as well as cost savings and other benefits we expect to achieve (and the timing thereof) as discussed herein. These statements often include words such as “believe,” “expect,” “anticipate,” “intend,” “plan,” “estimate,” “seek,” “will,” “may” or similar expressions. These statements are based on certain assumptions that we have made in light of our experience in the industry as well as our perceptions of historical trends, current conditions, expected future developments and other factors we believe are appropriate in these circumstances. You should understand that these statements are not guarantees of performance or results. They involve risks, uncertainties and assumptions which are discussed in detail in the Company’s most recent Form 10-K Annual Report for the year ended December 31, 2014 filed with the SEC on March 27, 2015 and our Form 10-Q Quarterly Reports subsequently filed with the SEC which should be read in conjunction with this presentation. Furthermore, we have not yet filed the Company’s Form 10-K Annual Report for the year ended December 31, 2015 with the SEC. When the Company ultimately files its Form 10-K Annual Report with the SEC, actual results and financial information related to the fiscal year ended December 31, 2015 could differ materially from those reflected in the forward-looking statements contained herein as a result of a variety of factors, many of which are beyond the Company’s control. The Company assumes no responsibility to update or revise any forward-looking statements as a result of new information or future developments. Third Party Information This presentation has been prepared by the Company and includes information from other sources believed by management to be reliable. No representation or warranty, express or implied, is made as to the accuracy or completeness of any of the information set forth herein. This presentation may contain summaries of the terms of certain documents and agreements, but reference is made to the actual documents and agreements for the complete information contained therein. The information contained herein is as of the date hereof and is subject to change, completion or amendment without notice. Non-GAAP Financial Measures & Pro Forma Financial Information We have included certain non-GAAP financial measures in this presentation, including Pro Forma Total Revenue, Adjusted EBITDA, Pro Forma Adjusted EBITDA and Pro Forma Capital Expenditures. We believe such measures are commonly used by investors to evaluate our performance and that of our competitors. These measures are not presentations made in accordance with GAAP and our use of such terms varies from others in our industry. These measures should not be considered as alternatives to total revenue, net income (loss), operating income, total capital expenditures or any other performance measures derived in accordance with GAAP as measures of operating performance or operating cash flows or as measures of liquidity. These non-GAAP financial measures have important limitations as analytical tools and you should not consider them in isolation or as substitutes for analysis of our results as reported under GAAP. For definitions of these non-GAAP financial measures, a discussion regarding the limitations of their use and a reconciliation of these measures to the most directly comparable GAAP financial measures, see “Non-GAAP Financial Measures”, “Unaudited Pro Forma Financial Information” and “Unaudited Reconciliation of GAAP to Non-GAAP Financial Measures” in the Appendix to this presentation.

Company Overview

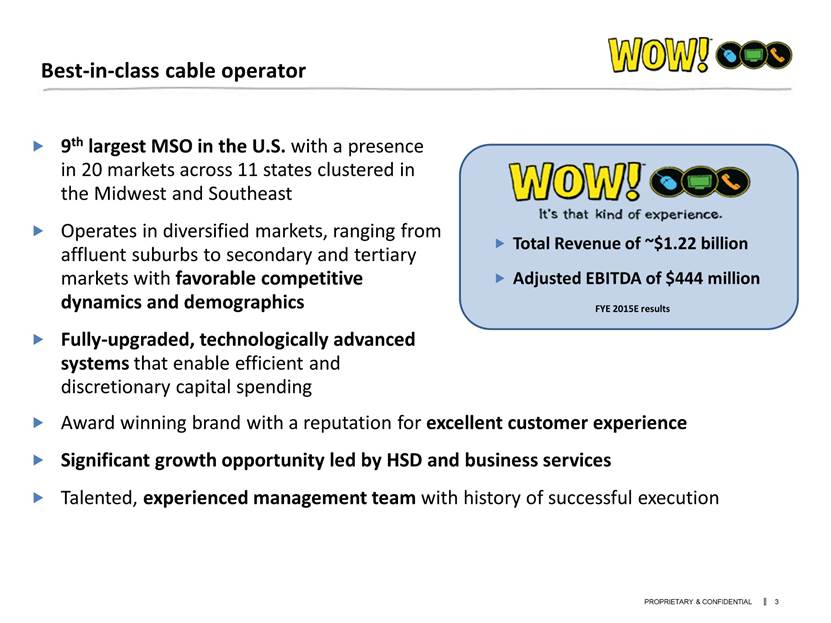
9th largest MSO in the U.S. with a presence in 20 markets across 11 states clustered in the Midwest and Southeast Operates in diversified markets, ranging from affluent suburbs to secondary and tertiary markets with favorable competitive dynamics and demographics Fully-upgraded, technologically advanced systems that enable efficient and discretionary capital spending Best-in-class cable operator Total Revenue of ~$1.22 billion Adjusted EBITDA of $444 million FYE 2015E results Award winning brand with a reputation for excellent customer experience Significant growth opportunity led by HSD and business services Talented, experienced management team with history of successful execution
WOW! overview 9th Largest MSO in the United States with ~1.6 million RGUs 19 J.D. Power awards in the past 9 years WOW! #1 Internet provider – 2009, 2010, 2011, 2012, 2013, 2014 WOW! #1 Cable provider – 2007, 2008, 2010, 2011, 2012 WOW! #1 Bundled provider – 2010, 2012, 2013, 2014, 2015 WOW! #1 Phone provider – 2010 Award winning performance Subscriber information as of 12/31/15. Homes Passed 3,003,100 Total Customers 777,800 HSD subscribers 712,500 Video subscribers 547,500 Telephony subscribers 296,800 Total RGUs 1,556,800

Detroit, MI Mid-Michigan Evansville, IN Lawrence, KS No FiOS competition in Area 1 Limited U-verse competition Time Warner is not on an all digital network in Evansville Business services leader in Evansville Chicago, IL Columbus, OH Cleveland, OH No FiOS competition in Area 2 Time Warner is not on an all digital network in Columbus or Cleveland Market West Point, GA Columbus, GA Montgomery, AL Huntsville, AL Knoxville, TN Anne Arundel, MD Competes with a less robust AT&T DSL offering in multiple markets in Area 3 Verizon FiOS is limited to one market in Area 3 Area 1 Area 2 Area 3 Key competitors Comcast, U-verse DISH, DIRECTV Time Warner Cable U-Verse Comcast, U-verse Time Warner Cable, U-verse Time Warner Cable, U-verse Charter Charter, Mediacom Charter Comcast, Charter, Mediacom Comcast Comcast, FiOS Area Key observations Area 4 Panama City, FL Dothan, AL Augusta, GA Charleston, SC Pinellas, FL Comcast Charter, Time Warner Cable Comcast Comcast, Time Warner Cable Bright House, FiOS Competes with a less robust AT&T DSL offering in multiple markets Verizon FiOS competition is restricted to portions of Pinellas and will transition to Frontier in early 2016 WOW!’s key markets and competitors Attractive competitive dynamics with modest U-verse and FiOS competition 40% upon deal close

Technically advanced network & service offerings Multi-use service provider backbone (10G/100G) enabling centrally sourced voice, video and data services for residential and business services Fully upgraded systems with DOCSIS 3.0 capabilities in all markets providing 750+ MHz capacity in 100% of the combined markets (Lansing, MI is currently in process of being upgraded) 86% of network footprint is on an all-digital platform; 100% will be all-digital by the end of 2016 300Mbps data offering available in ~ 75% of footprint 600Mbps introduction in certain markets and 1Gig trials in two markets Ultra TV deployed to 69% of network footprint with penetration rate of 28% of eligible video customers Robust business services network enabling advanced commercial class data and voice services within and between all markets - Ethernet over fiber and HFC - Hosted VoIP solutions - Disaster Recovery & Cloud back-up - SIP & PRI trunk services Will be able to continue to provide advanced services and capabilities, launch new services quickly & efficiently and maintain the networks relatively inexpensively Managed wi-fi Layer 3 VPN

Crestview transaction WOW Operating entities (LLC’s) Kite Parent Corp. WideOpenWest Finance, LLC Racecar Acquisition, LLC Knology Inc. SEC registrant High Yield Notes WideOpenWest Kite Inc. WOW SIGECOM Inc. WideOpenWest Cleveland Inc. WideOpenWest Ohio Inc. WideOpenWest Illinois Inc. Tax vehicles Crestview $125 million in new primary equity Primary Transaction Secondary Transaction Operating Entities PROPRIETARY & CONFIDENTIAL | 7 Racecar Holdings, LLC Avista Allows WOW! to aggressively pursue growth opportunities: Residential HSD Commercial Services Edge-Out network expansion Accretive/de-leveraging M&A opportunities
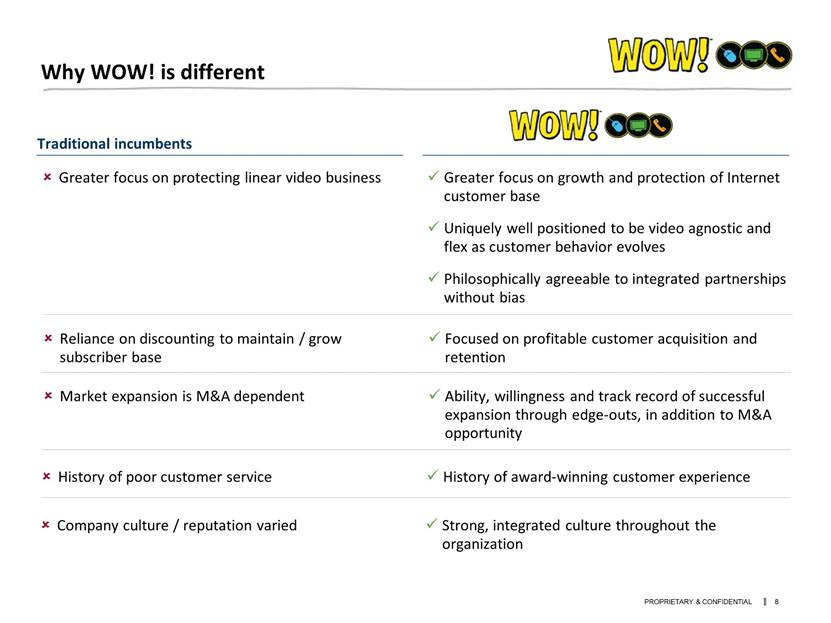
Greater focus on growth and protection of Internet customer base Uniquely well positioned to be video agnostic and flex as customer behavior evolves Philosophically agreeable to integrated partnerships without bias Greater focus on protecting linear video business Traditional incumbents Why WOW! is different Reliance on discounting to maintain / grow subscriber base Market expansion is M&A dependent History of poor customer service Focused on profitable customer acquisition and retention History of award-winning customer experience Ability, willingness and track record of successful expansion through edge-outs, in addition to M&A opportunity Company culture / reputation varied Strong, integrated culture throughout the organization
Residential: Edge-Out growth opportunity WOW! has historically invested success-based, discretionary capital to selectively expand the Company's network with excellent success Between 2008 – 2012, the Company invested over $100+ million in edge-out projects Typically achieved customer penetration rates of more than ~ 20% of new homes passed within 12 months following completion of construction On average, edge-out projects have achieved cash/cash IRRs of ~ 25% (before application of a terminal value to incremental Adjusted EBITDA) Elevated levels of capital expenditures, however, following the Knology acquisition in 2012 to integrate the Knology network & back-office infrastructure (i.e. all-digital upgrades, etc.) have prevented investment in edge-out growth opportunities since 2012 New primary equity investment from Crestview, however, will enable WOW! to pursue these opportunities going-forward In excess of $200 million of such edge-out opportunities have been identified with similarly favorable return characteristics providing a relatively low-risk growth opportunity

Commercial Services: Strategy Focused customer acquisition and support model with enhanced tools and resources addressing the demands by market segment Introducing advanced product offerings (e.g. metro Ethernet, SIP trunks, hosted VOIP, etc.) in legacy WOW! markets Higher ARPU Better IRR economics Increasing size of addressable market Leverage and scale existing IP, fiber and transport infrastructure Recently signed significant contract to provide back-haul services to over 1,100 towers/small cell sites in our Chicago market: When fully deployed, annualized total MRR will be ~ $11 million Expanding our sales channels to capture opportunity from a variety of distribution: Restructured Field Sales to align with specific customer segmentation Continue to expand our Wholesale relationships Continued growth and development of our Indirect Channel Launched new Agent Portal
Lawrence Evansville Knoxville Huntsville Augusta Charleston Columbus Atlanta Tampa/St. Petersburg Pinellas Panama City Montgomery Dothan Auburn West Point Chicago Mid Michigan Detroit Cleveland Columbus Ashburn Philadelphia New York Worcester Boston Commercial Services: growth opportunity Network routes Metro fiber assets Data centers Peering point Point of presence Legend Substantial opportunity for WOW! to increase business services offerings within its existing footprint Span of network across entire footprint, concentrated in areas with significant growth opportunities Identified approximately 210K businesses and 35K cell towers within 250 feet of footprint or producing >30% IRR opportunity off existing fiber infrastructure Represents significant opportunity for WOW! WOW! markets strategically segmented as Emerging and Mature, focused respectively on market share growth and maintenance.

Financial Results

FYE 2015 summary subscriber and financial results Performance in 2015 represented a significant year/year improvement in the Company’s FCF over 2014 pro forma actual results 2015 subscriber trends & total revenues have been a challenge due primarily to lower connect levels: Our revised focus on acquiring and retaining profitable customers and the prioritization of ARPU over reporting absolute customer metrics Extremely active competitive environment over last two years due to M&A that has amplified consumer promotional pricing expectations Proliferation of OTT options creating further choice for video choices 13 Nonetheless, HSD subscriber trends have stabilized, operating margins are improved and WOW!’s been able to deliver a year/year improvement in FCF of ~$106 million The Company has not yet filed it’s Form 10-K Annual Report for the year ended December 31, 2015 with the SEC. Actual results and financial information related to the fiscal year ended December 31, 2015 could differ materially from those reflected herein as a result of a variety of factors, many of which are beyond the Company’s control. The Company assumes no responsibility to update or revise any forward-looking statements as a result of new information or future developments. 2015 Integration expense excludes ~ $13.7 million of transaction fees and expenses associated with the December 2015 Crestview transaction. (1) (2) 2013 PF 2014 PF 2015 HSD RGUs 708,200 727,800 712,500 Video RGUs 674,400 634,700 547,500 Telephony RGUs 396,400 359,400 296,800 Total RGUs 1,779,000 1,721,900 1,556,800 ( $ in millions) Total Revenue $ 1,146.0 $ 1,208.8 $ 1,217.1 Adjusted EBITDA $ 409.0 $ 412.3 $ 443.9 Capex, excluding W/Cap ($ 237.2) ($ 257.9) ($ 216.2) UnLevered FCF, excluding W/Cap $ 171.8 $ 154.4 $ 227.7 Y/Year increase ($ 17.4) $ 73.3 Integration Expense ($ 36.5) ($ 46.6) ($ 16.0) Cash Interest ($ 212.7) ($ 217.1) ($ 214.8) Free Cash Flow ($ 77.4) ($ 109.3) ($ 3.1) Y/Year increase ($ 31.9) $ 106.2
Year/Year RGU net additions (2) 4Q 2015 update (1) The Company has not yet filed it’s Form 10-K Annual Report for the year ended December 31, 2015 with the SEC. Actual results and financial information related to the fiscal year ended December 31, 2015 could differ materially from those reflected herein as a result of a variety of factors, many of which are beyond the Company’s control. The Company assumes no responsibility to update or revise any forward-looking statements as a result of new information or future developments. RGU data includes pro forma adjustments to (i) eliminate RGUs attributable to the South Dakota systems which were divested on September 30, 2014, and (ii) include RGUs attributable to Anne Arundel Broadband which was acquired in May 2014. Quarterly churn trends (2) Subscriber trends have stabilized as connects remain strong and churn averaged 2.6% for 4Q-15 HSD RGUs grew during the 4th qtr. on a sequential basis, reversing a trend from the 3rd qtr. of 2015 January and February 2016 activity continues the strong positive trends: Net YTD HSD additions through Feb. 27, 2016 totals 6,899, a year/year increase of 12,226 Total RGU net additions YTD are ~ 33,500 better than prior year Feb-16 includes customer activity only thru 2/27/16
Quarterly Pro Forma Total Revenue (2) 4Q 2015 update (1) The Company has not yet filed it’s Form 10-K Annual Report for the year ended December 31, 2015 with the SEC. Actual results and financial information related to the fiscal year ended December 31, 2015 could differ materially from those reflected herein as a result of a variety of factors, many of which are beyond the Company’s control. The Company assumes no responsibility to update or revise any forward-looking statements as a result of new information or future developments. Pro Forma financial information includes pro forma adjustments to (i) include the unaudited financial results for Bluemile and Anne Arundel Broadband prior to their acquisition by WOW, and (ii) exclude the financial results related to the South Dakota systems which were divested on September 30, 2014. 4Q 2015 Operating Trends ARPU trends (2) 4Q-15 Total Revenue equals $301.3 million up sequentially due to the annual rate increase; down on a year/year basis due to decline in average total customers/RGUs Total Revenue for 2015 totals $1.217 billion and represents an increase of ~ 1% on a year/year basis Video and Customer ARPU increased sequentially as a result of the annual rate increase implemented during the 4th quarter of 2015 ARPU CAGRs since the 4th Qtr. of 2013: Video – 12.7% HSD – 4.7% Telephony – 1.5% ($ in millions) Annual Pro Forma Total Revenue (2) ($ in millions)
4Q 2015 update (1) The Company has not yet filed it’s Form 10-K Annual Report for the year ended December 31, 2015 with the SEC. Actual results and financial information related to the fiscal year ended December 31, 2015 could differ materially from those reflected herein as a result of a variety of factors, many of which are beyond the Company’s control. The Company assumes no responsibility to update or revise any forward-looking statements as a result of new information or future developments. Pro Forma financial information includes pro forma adjustments to (i) include the unaudited financial results for Bluemile and Anne Arundel Broadband prior to their acquisition by WOW, and (ii) exclude the financial results related to the South Dakota systems which were divested on September 30, 2014. 4Q 2015 Operating Trends ($ in millions) LTM Pro Forma Adjusted EBITDA (2) Quarterly Pro Forma Adjusted EBITDA (2) ($ in millions) Decisions to manage for profitability during 2015 have resulted in improving margin trends and growth in Adjusted EBITDA 4Q-15 Adjusted EBITDA totals ~ $112 million, a year/ year increase of 3.9%, and Adjusted EBITDA % is 37.1%, a year/year increase of ~ 2.5% Pro Forma Adjusted EBITDA as of 12/31/15 totals ~ $444 million, representing year/year growth of 7.7% 7.7% y/year growth Adjusted EBITDA %
Capital structure overview $150 million of cash utilized to pay down TLB/TLB-1 in 2nd Qtr. of 2015 Crestview investment of $125 million in new primary equity in Racecar Holdings, LLC (the ultimate parent entity of WOW!) closed in December 2015 Year/year reduction in net debt of ~ $83 million & ~ $32 million improvement in Adjusted EBITDA has resulted in deleveraging of 0.7x The Company has not yet filed it’s Form 10-K Annual Report for the year ended December 31, 2015 with the SEC. Actual results and financial information related to the fiscal year ended December 31, 2015 could differ materially from those reflected herein as a result of a variety of factors, many of which are beyond the Company’s control. The Company assumes no responsibility to update or revise any forward-looking statements as a result of new information or future developments. Cash balance at 12/31/15 includes cash held at Racecar Holdings, LLC (the ultimate parent entity of WideOpenWest Finance, LLC) related to the $125 million issuance of new primary equity in Racecar Holdings, LLC to Crestview in December 2015. (1) (2) ($ in millions) Maturity Pricing/LIBOR Floor Amount Leverage Amount Leverage Amount Leverage Cash 263.9 $ 175.9 $ (88.00) $ Revolving Credit Facility ($200M) Jul-19 L + 350 - $ - $ Term Loan B-1 Jul-17 L + 300; 0.75% 419.7 $ 383.4 $ Term Loan B Mar-19 L + 375; 1.00% 1,533.1 $ 1,400.8 $ Total Secured Debt 1,952.8 $ 4.1x 1,784.3 $ 3.6x (168.51) $ 0.5x Sr. Unsecured Notes Jul-19 10.250% 825.0 $ 825.0 $ Sr. Subordinated Notes Jul-19 13.375% 295.0 $ 295.0 $ Capitalized Leases & Other 10.2 $ 7.4 $ Total Debt 3,083.0 $ 2,911.7 $ (171.31) $ Net Debt 2,819.1 $ 6.8x 2,735.8 $ 6.2x (83.3) $ 0.7x LTM Pro Forma Adjusted EBITDA 412.3 $ 443.9 $ 31.6 $ 12/31/2014 +/- 12/31/2015
FYE 2016 – Guidance The Company has not yet filed it’s Form 10-K Annual Report for the year ended December 31, 2015 with the SEC. Actual results and financial information related to the fiscal year ended December 31, 2015 could differ materially from those reflected herein as a result of a variety of factors, many of which are beyond the Company’s control. The Company assumes no responsibility to update or revise any forward-looking statements as a result of new information or future developments. Integration expense for 2015 excludes ~ $13.7 million of transaction fees and expenses related to the $125 million issuance of new primary equity in Racecar Holdings, LLC to Crestview in December 2015. (1) 2016 Capex includes ~ $70 million to $85 million related to growth opportunities (i.e. edge-out & wireless tower back-haul) (2) 2013 PF 2014 PF 2015 HSD RGUs 708,200 727,800 712,500 762,500 777,500 7.0% 9.1% Video RGUs 674,400 634,700 547,500 512,500 527,500 -6.4% -3.7% Telephony RGUs 396,400 359,400 296,800 246,800 261,800 -16.8% -11.8% Total RGUs 1,779,000 1,721,900 1,556,800 1,521,800 1,566,800 -2.2% 0.6% ( $ in millions) Revenue $ 1,146.0 $ 1,208.8 $ 1,217.1 $ 1,220.0 $ 1,240.0 0.2% 1.9% Adj. EBITDA $ 409.0 $ 412.3 $ 443.9 $ 455.0 $ 465.0 2.5% 4.8% Capex, before w/cap $ 237.2 $ 257.9 $ 216.2 $ 270.0 $ 295.0 24.9% 36.5% Integration Exp ($ 36.5) ($ 46.6) ($ 16.0) ($ 5.0) ($ 7.5) -68.7% -53.0% Cash Interest ($ 212.7) ($ 217.1) ($ 214.8) ($ 209.6) ($ 209.6) -2.4% -2.4% 2016 Guidance Range/Growth %
FYE 2016 Guidance – Free Cash Flow Adjusted EBITDA $ 455.0 $ 465.0 Capex, "Baseline" ($ 200.0) ($ 210.0) UnLevered FCF, excluding W/Cap $ 255.0 $ 255.0 Integration Expense ($ 5.0) ($ 7.5) Cash Interest ($ 210.0) ($ 210.0) Free Cash Flow $ 40.0 $ 37.5 Less: Growth Investment Capex (Edge-Out & Wireless Backhaul) ($ 70.0) ($ 85.0) Free Cash Flow, after Growth Investment ($ 30.0) ($ 47.5) 2016 Guidance Range
Appendix

Non-GAAP Financial Measures We have included certain non-GAAP financial measures in this presentation including Pro Forma Total Revenue, Adjusted EBITDA, Pro Forma Adjusted EBITDA and Pro Forma Capital Expenditures. We believe that these non-GAAP measures enhance an investor’s understanding of our financial performance. We believe that these non-GAAP measures are useful financial metrics to assess our operating performance from period to period by excluding certain items that we believe are not representative of our core business. We believe that these non-GAAP measures provide investors with useful information for assessing the comparability between periods of our ability to generate cash from operations sufficient to pay taxes, to service debt and to undertake capital expenditures. We use these non-GAAP measures for business planning purposes and in measuring our performance relative to that of our competitors. We believe these non-GAAP measures are measures commonly used by Investors to evaluate our performance and that of our competitors. Adjusted EBITDA is defined by WOW! as net income (loss) before net interest expense, income taxes, depreciation and amortization (including impairments), gains (losses) realized and unrealized on derivative instruments, management fees to related party, the write-up or off of any asset, debt modification expenses, loss on extinguishment of debt, integration and restructuring expenses and all non-cash charges and expenses (including equity based compensation expense) and certain other income and expenses, as further defined in our credit facilities. Adjusted EBITDA is not a presentation made in accordance with generally accepted accounting principles in the United States (“GAAP”) and our use of the term Adjusted EBITDA varies from others in our industry. Adjusted EBITDA should not be considered as an alternative to net income (loss), operating income or any other performance measures derived in accordance with GAAP as measures of operating performance or operating cash flows or as measures of liquidity. Adjusted EBITDA has important limitations as an analytical tool and you should not consider it in isolation or as a substitute for analysis of our results as reported under GAAP. For example, Adjusted EBITDA: excludes certain tax payments that may represent a reduction in cash available to us; does not reflect any cash capital expenditure requirements for the assets being depreciated and amortized that may have to be replaced in the future; does not reflect changes in, or cash requirements for, our working capital needs; and does not reflect the significant interest expense, or the cash requirements necessary to service interest or principal payments, on our debt. Furthermore, Total Revenue, Adjusted EBITDA and Capital Expenditures in this presentation are (i) presented on a Pro Forma basis, giving effect to our merger with Knology, Inc. (“Knology”) and related July 17, 2012 financing, our acquisition of certain operating assets of Bluemile, Inc. (“Bluemile”) on September 27, 2013, our increased investment in Anne Arundel Broadband (“AAB”) on May 1, 2014, our divestiture of the South Dakota systems on September 30, 2014 and other WOW! and Knology transactions as if they had been completed at the beginning of each period presented (see “Unaudited Pro Forma Financial Information” on the following pages for complete discussion), and (ii) sometimes further adjusted to include the estimated run-rate cost savings in connection with our Knology merger and transitioning our billing system from one provider to another (collectively, “Unrealized Synergies”) which is calculated in accordance with the definitions of our senior secured credit facilities. See “Unaudited Reconciliation of GAAP to Non-GAAP Financial Measures” on the following pages and the accompanying tables for reconciliations of these non-GAAP financial measures to their most directly comparable GAAP financial measure.
Unaudited Pro Forma Financial Information This presentation contains unaudited pro forma financial information which has been developed by applying pro forma adjustments to the individual historical unaudited condensed consolidated financial statements of WOW! and Knology and unaudited financial information of Bluemile and AAB. The unaudited pro forma financial information has been prepared giving effect to our merger with Knology and related July 17, 2012 financing, the acquisition of certain operating assets of Bluemile on September 27, 2013, our increased investment in AAB on May 1, 2014 and our divestiture of the Company’s South Dakota systems on September 30, 2014 as if they had been completed at the beginning of each period presented. The unaudited pro forma financial information is for informational purposes only and does not purport to represent what our results of operations or financial information would have been if such transactions had occurred at any date, nor does such information purport to project the results of operations for any future period. The unaudited pro forma condensed combined financial information was prepared based on WOW!’s and Knology’s historical unaudited financial statements and Bluemile’s and AAB’s unaudited financial information for the respective periods presented. The historical consolidated financial information has been adjusted to give effect to pro forma events that are directly attributable to such transactions, factually supportable and expected to have a continuing impact on the combined results. The unaudited pro forma financial information does not reflect non-recurring charges that have been incurred in connection with the transactions and related financings, including legal fees, broker fees and accounting fees. The unaudited pro forma financial information should be read in conjunction with the information contained in “Management’s Discussion and Analysis of Financial Condition and Results of Operations,” the consolidated financial statements and the accompanying notes appearing in our Registration Statement and our most recently filed Form 10-K for the year ended December 31, 2014 as filed with the SEC on March 27, 2015 and our Form 10-Q Quarterly Reports subsequently filed with the SEC which should be read in conjunction with this presentation. Furthermore, we have not yet filed the Company’s Form 10-K Annual Report for the year ended December 31, 2015 with the SEC. When the Company ultimately files its Form 10-K Annual Report with the SEC, actual results and financial information related to the fiscal year ended December 31, 2015 could differ materially from those reflected in the forward-looking statements contained herein as a result of a variety of factors, many of which are beyond the Company’s control. The Company assumes no responsibility to update or revise any forward-looking statements as a result of new information or future developments.
Unaudited Reconciliation of GAAP to Non-GAAP Financial Measures The following table provides an unaudited reconciliation of our Total Revenue, net income (loss) and Capex to Pro Forma Total Revenue, Pro Forma Adjusted EBITDA and Pro Forma Total Capex for the respective periods presented: See accompanying notes on page 25 3/31/2014 6/30/2014 9/30/2014 12/31/2014 3/31/2015 6/30/2015 9/30/2015 12/31/2015 Total Revenue $ 312.1 $ 319.8 $ 323.2 $ 309.2 $ 312.3 $ 305.8 $ 297.7 $ 301.3 Pro Forma Adjustments: Revenue related to AAB (2) 5.3 1.8 - - - - - - Revenue related to the South Dakota systems (3) (21.3) (20.0) (21.2) - - - - - Pro Forma Total Revenue $ 296.1 $ 301.6 $ 302.0 $ 309.2 $ 312.3 $ 305.8 $ 297.7 $ 301.3 Net loss $ (20.3) ($7.8) $31.7 $ (26.8) $ (6.6) $ (27.5) $ (7.1) $ (15.2) Depreciation and amortization 66.0 64.1 64.0 57.2 54.8 55.5 55.9 54.9 Management fee to related party 0.4 0.5 0.4 0.4 0.4 0.6 0.5 0.4 Interest expense 57.8 59.4 60.0 59.8 58.9 57.1 55.3 54.7 Loss on extinguishment of debt - - - - - 22.9 - - Unrealized gain on derivative instruments, net (1.0) (0.8) (1.3) (1.0) (2.0) (1.1) (1.2) (1.3) (Gain) Loss on sale of assets - - (52.6) (0.3) - - - - Non-recurring prof. fees, M&A integration and restr. exp. 4.9 13.0 8.9 19.8 3.5 4.2 4.8 17.2 Other expense (income), net 0.1 (0.2) (2.4) (0.9) (0.2) - 0.6 - Income tax (benefit) expense 1.1 (16.7) 1.2 (0.5) 0.9 1.0 0.8 1.2 Adjusted EBITDA $ 109.0 $ 111.5 $ 109.9 $ 107.7 $ 109.7 $ 112.7 $ 109.6 $ 111.9 Pro Forma Adjustments: Adjusted EBITDA related to AAB (2) 0.8 0.2 - - - - - - Adjusted EBITDA related to the South Dakota systems (3) (9.4) (8.0) (9.4) - - - - - Pro Forma Adjusted EBITDA $ 100.4 $ 103.7 $ 100.5 $ 107.7 $ 109.7 $ 112.7 $ 109.6 $ 111.9 Total Capex $ 52.9 $ 66.0 $ 66.3 $ 66.7 $ 55.6 $ 54.7 $ 64.5 $ 57.1 Pro Forma Adjustments: Capex related to AAB (2) 0.9 0.3 - - - - - - Capex related to the South Dakota systems (3) (1.9) (3.0) (3.1) - - - - - Pro Forma Total Capex $ 51.9 $ 63.3 $ 63.2 $ 66.7 $ 55.6 $ 54.7 $ 64.5 $ 57.1 Three Months Ended
Unaudited Reconciliation of GAAP to Non-GAAP Financial Measures (cont’d) The following table provides an unaudited reconciliation of our Total Revenue, net income (loss) and Capex to Pro Forma Total Revenue, Pro Forma Adjusted EBITDA and Pro Forma Total Capex for the respective periods presented: See accompanying notes on page 25 12/31/2012 12/31/2013 12/31/2014 12/31/2015 Total Revenue $ 1,197.8 $ 1,199.7 $ 1,264.3 $ 1,217.1 Pro Forma Adjustments: Revenue related to Bluemile, Inc. (1) 7.4 6.6 - - Revenue related to AAB (2) 20.4 20.8 7.1 - Revenue related to the South Dakota systems (3) (88.2) (81.1) (62.5) - Pro Forma Total Revenue $ 1,137.4 $ 1,146.0 $ 1,208.9 $ 1,217.1 Net loss $ (156.0) $ (161.2) $ (23.2) $ (56.4) Depreciation and amortization 278.7 256.4 251.3 $ 221.1 Management fee to related party 1.4 1.7 1.7 $ 1.9 Interest expense 264.4 242.0 237.0 $ 226.0 Loss on extinguishment of debt - 58.1 - $ 22.9 Unrealized gain on derivative instruments, net 15.6 (3.4) (4.1) $ (5.6) (Gain) Loss on sale of assets - - (52.9) - Non-recurring prof. fees, M&A integration and restr. exp. 13.5 36.5 46.6 29.7 Other expense (income), net 3.1 0.2 (3.4) 0.4 Income tax (benefit) expense (0.7) 6.2 (14.9) 3.9 Adjusted EBITDA $ 420.0 $ 436.5 $ 438.1 $ 443.9 Pro Forma Adjustments: Adjusted EBITDA related to Bluemile, Inc. (1) 1.9 2.1 - - Adjusted EBITDA related to AAB (2) 3.0 2.7 1.0 - Adjusted EBITDA related to the South Dakota systems (3) (30.6) (32.3) (26.8) - Pro Forma Adjusted EBITDA $ 394.3 $ 409.0 $ 412.3 $ 443.9 Total Capex 214.9 $ 221.9 $ 251.9 $ 231.9 $ Pro Forma Adjustments: Capex related to Bluemile, Inc. (1) 1.2 0.9 - - Capex related to AAB (2) 3.4 3.7 1.2 - Capex related to the South Dakota systems (3) (15.1) (8.3) (8.0) - Pro Forma Total Capex $ 204.4 $ 218.2 $ 245.1 $ 231.9 Twelve Months Ended
Notes to Unaudited Reconciliation of GAAP to Non-GAAP Financial Measures Represents our management’s estimate of pre-acquisition Total Revenue, Adjusted EBITDA and Capital Expenditures related to the assets acquired from Bluemile, Inc. (“Bluemile”) for the periods preceding our acquisition of Bluemile on September 26, 2013 based on the books and records of Bluemile, as adjusted by our management to reflect the assets actually acquired. We believe that, based on operating data, including operating data for the period that we owned and operated the acquired Bluemile assets (from September 27, 2013 through December 31, 2014), the pro forma amounts represent a reasonable estimate of Total Revenue, Adjusted EBITDA and Capital Expenditures related to Bluemile’s asset operations. However, there can be no assurances that such results accurately reflect the actual results of the acquired assets of Bluemile for the periods preceding September 26, 2013. Such amounts are presented solely for the purposes of presenting the calculation of Pro Forma Total Revenue, Pro Forma Adjusted EBITDA and Pro Forma Capital Expenditures based on information set forth in the books and records of Bluemile as provided to us by Bluemile at the time of the acquisition. Such amounts are unaudited and have not been verified by our management. Represents our management’s estimate of pre-acquisition Total Revenue, Adjusted EBITDA and Capital Expenditures of Anne Arundel Broadband (“AAB”) for the periods preceding our increased investment in AAB on April 30, 2014 based on the books and records of AAB, as adjusted by our management to reflect the assets actually acquired. We believe that, based on operating data, including operating data for the period following our increased investment in AAB (from May 1, 2014 through December 31, 2014), the pro forma amounts represent a reasonable estimate of Total Revenue, Adjusted EBITDA and Capital Expenditures from AAB’s operations. However, there can be no assurances that such results accurately reflect the actual results of the acquired assets of AAB for the periods preceding April 30, 2014. Such amounts are presented solely for the purposes of presenting the calculation of Pro Forma Total Revenue, Pro Forma Adjusted EBITDA and Pro Forma Capital Expenditures based on information set forth in the books and records of AAB as provided to us by AAB at the time of the acquisition. Such amounts are unaudited and have not been verified by our management. Represents the Total Revenue, Adjusted EBITDA and Capital Expenditures of the South Dakota systems for the periods preceding our divestiture of such assets on September 30, 2014 based on the individual books and records of the South Dakota systems. Such amounts have been extracted from the consolidated financial statements for the Company which has been audited. We believe that such pro forma amounts represent a reasonable estimate of Total Revenue, Adjusted EBITDA and Capital Expenditures for the South Dakota systems for the periods proceeding our divestiture, however, the individual books and records of the South Dakota systems have not been unaudited. There can be no assurances that such results accurately reflect the actual results of the South Dakota systems for the periods preceding September 30, 2014. Such amounts are presented solely for the purposes of presenting the calculation of Pro Forma Total Revenue, Pro Forma Adjusted EBITDA and Pro Forma Capital Expenditures based on information set forth in the Company’s books and records at the time of the divestiture.
Reconciliation of Reported Subscriber Information to Pro Forma Subscriber Information The following table provides reconciliation of our reported Subscriber Information to Pro Forma Subscriber information for the respective periods presented: 4Q-12 1Q-13 2Q-13 3Q-13 4Q-13 1Q-14 2Q-14 3Q-14 4Q-14 1Q-15 2Q-15 3Q-15 4Q-15 Reported Homes Passed 2,962,000 2,968,000 2,981,000 2,987,000 2,995,000 2,997,000 3,114,000 2,978,000 2,985,000 2,988,600 2,993,100 2,997,200 3,003,100 Pro Forma Adjustments: AAB 112,000 112,000 112,000 112,000 112,000 112,000 - - - - - - - South Dakota systems (142,000) (142,000) (142,000) (142,000) (142,000) (142,000) (142,000) - - - - - - Pro Forma Homes Passed 2,932,000 2,938,000 2,951,000 2,957,000 2,965,000 2,967,000 2,972,000 2,978,000 2,985,000 2,988,600 2,993,100 2,997,200 3,003,100 Reported Total Customers 825,700 817,100 814,500 831,200 841,100 852,900 867,800 816,000 809,100 799,200 787,100 781,700 777,800 Pro Forma Adjustments: AAB 16,500 16,400 16,500 16,400 16,400 16,600 - - - - - - - South Dakota systems (53,000) (52,300) (51,500) (52,000) (52,300) (52,700) (52,300) - - - - - - Pro Forma Total Customers 789,200 781,200 779,500 795,600 805,200 816,800 815,500 816,000 809,100 799,200 787,100 781,700 777,800 Reported HSD Subscribers 708,700 706,800 709,100 725,400 740,000 756,700 769,600 729,700 727,800 722,000 713,100 712,300 712,500 Pro Forma Adjustments: AAB 11,000 11,100 11,300 11,500 11,700 11,800 - - - - - - - South Dakota systems (42,800) (42,600) (42,200) (42,900) (43,500) (44,200) (44,100) - - - - - - Pro Forma HSD Subscribers 676,900 675,300 678,200 694,000 708,200 724,300 725,500 729,700 727,800 722,000 713,100 712,300 712,500 Reported Video Subscribers 704,600 690,500 682,300 690,700 694,400 694,300 699,000 653,800 634,700 606,500 582,700 564,500 547,500 Pro Forma Adjustments: AAB 15,500 15,300 15,100 14,800 14,400 14,600 - - - - - - - South Dakota systems (36,500) (35,300) (34,200) (34,200) (34,400) (34,200) (33,700) - - - - - - Pro Forma Video Subscribers 683,600 670,500 663,200 671,300 674,400 674,700 665,300 653,800 634,700 606,500 582,700 564,500 547,500 Reported Telephony Subscribers 442,800 432,600 429,500 426,700 423,800 418,800 416,200 373,900 359,400 339,600 324,500 310,600 296,800 Pro Forma Adjustments: AAB 5,200 5,200 5,300 5,400 5,500 5,400 - - - - - - - South Dakota systems (37,000) (35,600) (34,700) (33,600) (32,900) (32,200) (31,500) - - - - - - Pro Forma Telephony Subscribers 411,000 402,200 400,100 398,500 396,400 392,000 384,700 373,900 359,400 339,600 324,500 310,600 296,800 Reported Total RGUs 1,856,100 1,829,900 1,820,900 1,842,800 1,858,100 1,869,800 1,884,800 1,757,500 1,721,900 1,668,100 1,620,300 1,587,400 1,556,800 Pro Forma Adjustments: AAB 31,800 31,600 31,700 31,600 31,600 31,800 - - - - - - - South Dakota systems (116,300) (113,500) (111,100) (110,700) (110,800) (110,600) (109,300) - - - - - - Pro Forma Total RGUs 1,771,600 1,748,000 1,741,500 1,763,700 1,778,900 1,791,000 1,775,500 1,757,500 1,721,900 1,668,100 1,620,300 1,587,400 1,556,800