Attached files
| file | filename |
|---|---|
| 8-K - 8-K - TIVO INC | fy2016-q48xk.htm |
| EX-99.3 - FY 16 Q4 KEY FINANCIAL METRIC TREND SHEETS - TIVO INC | exhibit-webtrendsjanuary31.htm |
| EX-99.1 - PRESS RELEASE DATE MARCH 1, 2016 - TIVO INC | a99-01xpressreleasedatedma.htm |

Fourth Quarter Fiscal Year 2016 Earnings Presentation March 1, 2016 Exhibit 99.2
Disclaimer Caution Regarding Forward Looking Statements. This presentation contains forward looking statements, within the meaning of the Private Securities Litigation Reform Act of 1995, which are based on current expectations and assumptions that are subject to risks and uncertainties and actual results could materially differ. These statements relate to, among other things, TiVo's future business and growth strategies, including future distribution agreements and revenue and subscription growth from MSO customers (both domestically and internationally), future growth in TiVo’s overall subscription base, future service, technology and audience research revenues, future growth in TiVo’s Adjusted EBITDA, future products and features, future value in TiVo’s intellectual property portfolio, and future changes in TiVo’s operating expenses. Forward-looking statements generally can be identified by the use of forward-looking terminology such as, "believe," "expect," "may," "will," "intend," "estimate," "continue" or similar expressions or the negative of those terms or expressions. Such statements involve risks and uncertainties, which could cause actual results to vary materially from those expressed in or indicated by the forward-looking statements. Factors that may cause actual results to differ materially include delays in development, the growth of competing service offerings and lack of market acceptance, as well as the other potential factors described under "Risk Factors“ in TiVo’s public reports filed with the Securities and Exchange Commission, including TiVo’s Annual Report on Form 10-K for the fiscal year ended January 31, 2015; Quarterly Reports on Form 10-Q for the quarterly periods ended April 30, 2015, July 31, 2015, and October 31, 2015 and Current Reports on Form 8-K. TiVo cautions you not to place undue reliance on forward-looking statements, which reflect an analysis only and speak only as of the date hereof. TiVo disclaims any obligation to update these forward-looking statements. Non-GAAP Measures. This presentation also references non-GAAP financial measures. Additional information on these non-GAAP financial measures can be accessed through TiVo’s Investor Relations website at www.tivo.com/ir. For a reconciliation of these non-GAAP financial measures to the most comparable GAAP equivalent, please see TiVo’s FY16 Q4 Key Financial Metric Trend Sheets which accompany this presentation and can also be accessed through TiVo’s Investor Relations website at www.tivo.com/ir. Industry Information. Information regarding market and industry statistics contained in this presentation is based on information available to us that we believe is accurate. It is generally based on publications that are not produced for purposes of economic analysis.
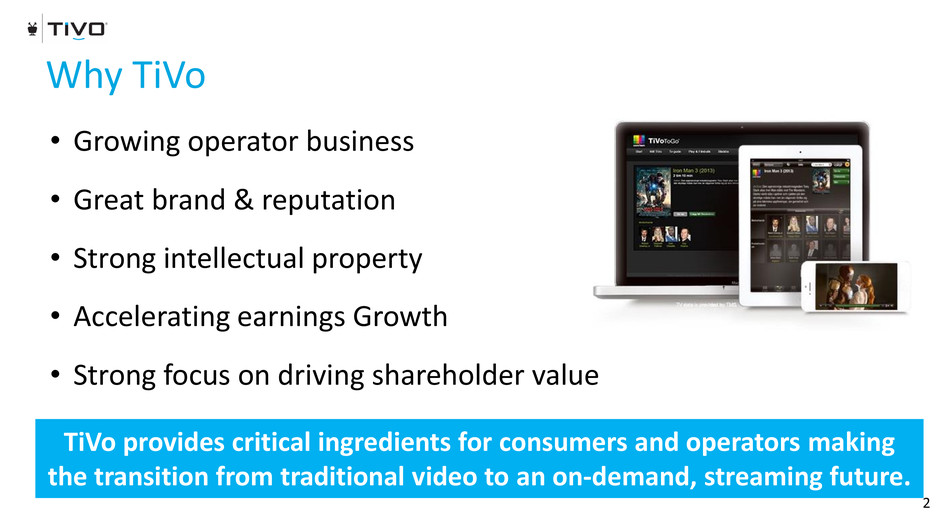
Why TiVo 2 • Growing operator business • Great brand & reputation • Strong intellectual property • Accelerating earnings Growth • Strong focus on driving shareholder value TiVo provides critical ingredients for consumers and operators making the transition from traditional video to an on-demand, streaming future.
Fiscal Year 2016 Highlights 3 • Operator-related service & software revenue (1) grew 59% over Fiscal Year 2015. – New distribution with Millicom, Frontier, WOW!, NCTC, Supercanal, Global Satellite, and several others – Extended Virgin Media relationship – Acquired Cubiware to accelerate international expansion – 1.3M traditional TiVo MSO subscriptions added – Strong Digitalsmiths deployments at Charter, DISH, and TWC • Continued innovation – TiVo BOLT – Significantly improved mobile experiences – SkipMode and QuickMode for faster viewing • Instituted patent enforcement against Samsung on ‘389 patent and several others with expirations up to 2023 (1) Includes TiVo traditional MSO business, Digitalsmiths, and Cubiware
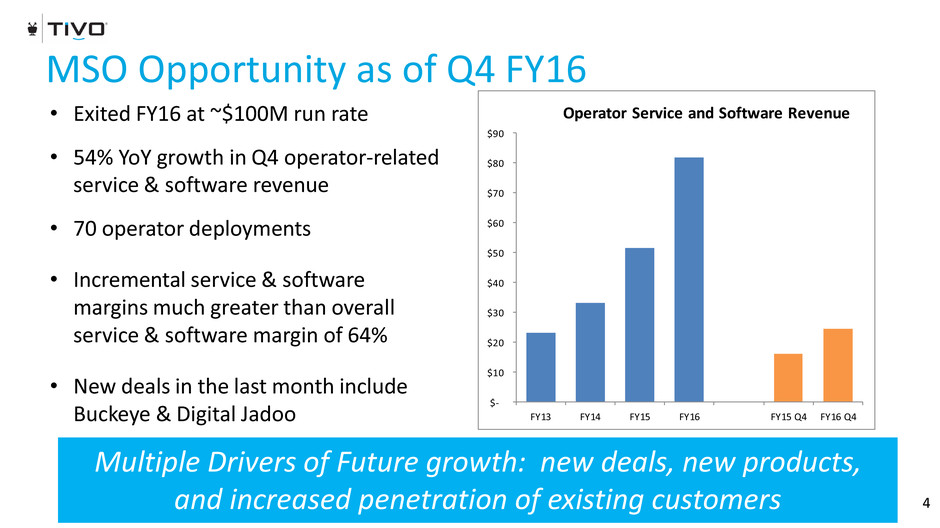
$- $10 $20 $30 $40 $50 $60 $70 $80 $90 FY13 FY14 FY15 FY16 FY15 Q4 FY16 Q4 Operator Service and Software Revenue MSO Opportunity as of Q4 FY16 4 • Exited FY16 at ~$100M run rate • 54% YoY growth in Q4 operator-related service & software revenue • 70 operator deployments • Incremental service & software margins much greater than overall service & software margin of 64% • New deals in the last month include Buckeye & Digital Jadoo Multiple Drivers of Future growth: new deals, new products, and increased penetration of existing customers
TiVo’s Service Provider Clients 6 “TiVo is the best connected TV certainly in the U.K. and I would argue in the world. It is produced by connected TV experts. It's all they do, that's why we've partnered with them.” — Neil Berkett, Former CEO, Virgin Media 5
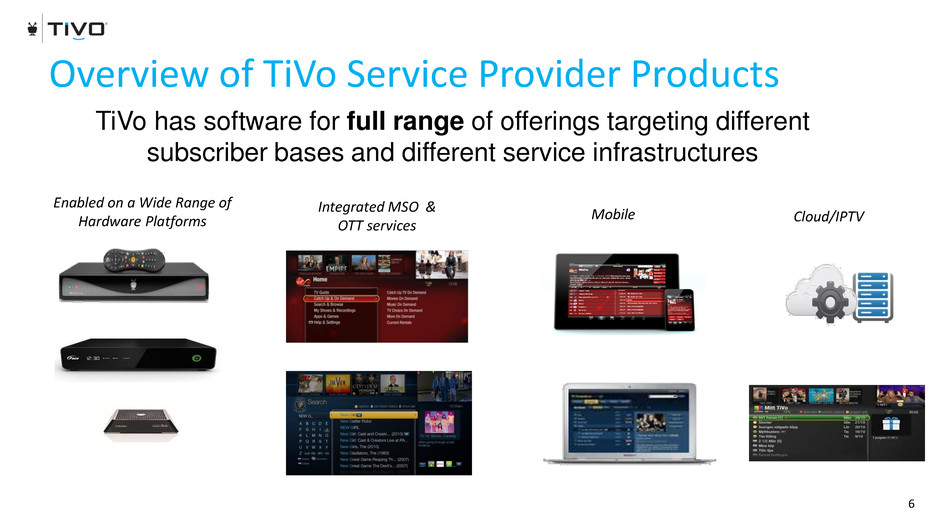
Overview of TiVo Service Provider Products 7 TiVo has software for full range of offerings targeting different subscriber bases and different service infrastructures Enabled on a Wide Range of Hardware Platforms Integrated MSO & OTT services Mobile 6 Cloud/IPTV
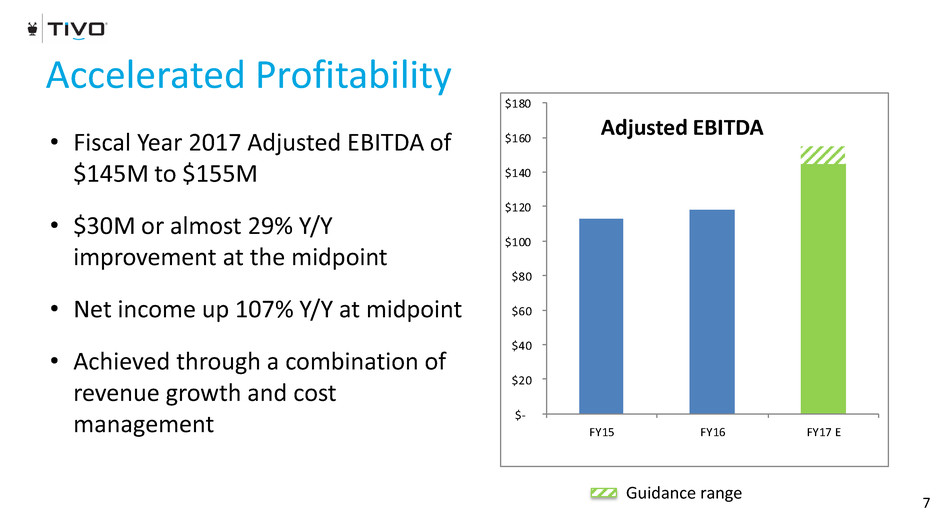
$- $20 $40 $60 $80 $100 $120 $140 $160 $180 FY15 FY16 FY17 E Accelerated Profitability 7 • Fiscal Year 2017 Adjusted EBITDA of $145M to $155M • $30M or almost 29% Y/Y improvement at the midpoint • Net income up 107% Y/Y at midpoint • Achieved through a combination of revenue growth and cost management Adjusted EBITDA Guidance range
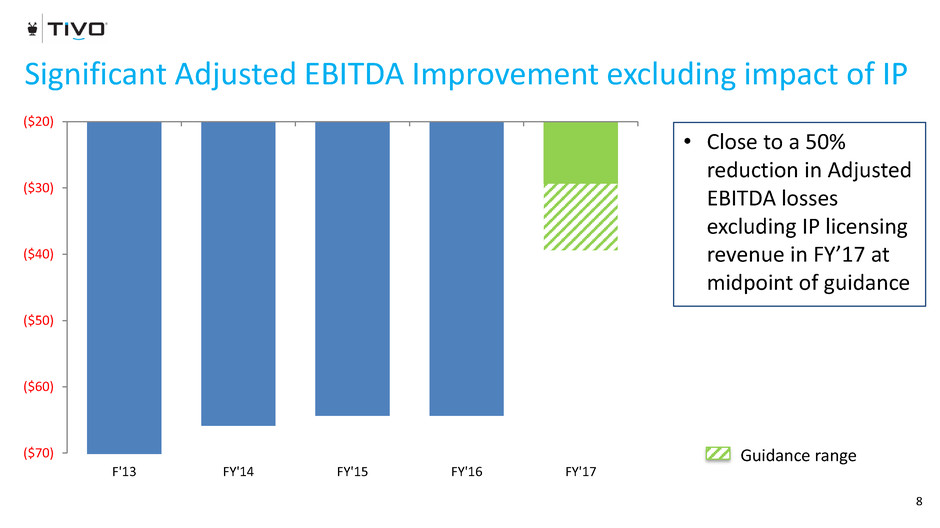
Significant Adjusted EBITDA Improvement excluding impact of IP 8 • Close to a 50% reduction in Adjusted EBITDA losses excluding IP licensing revenue in FY’17 at midpoint of guidance ($70) ($60) ($50) ($40) ($30) ($20) F'13 FY'14 FY'15 FY'16 FY'17 Guidance range
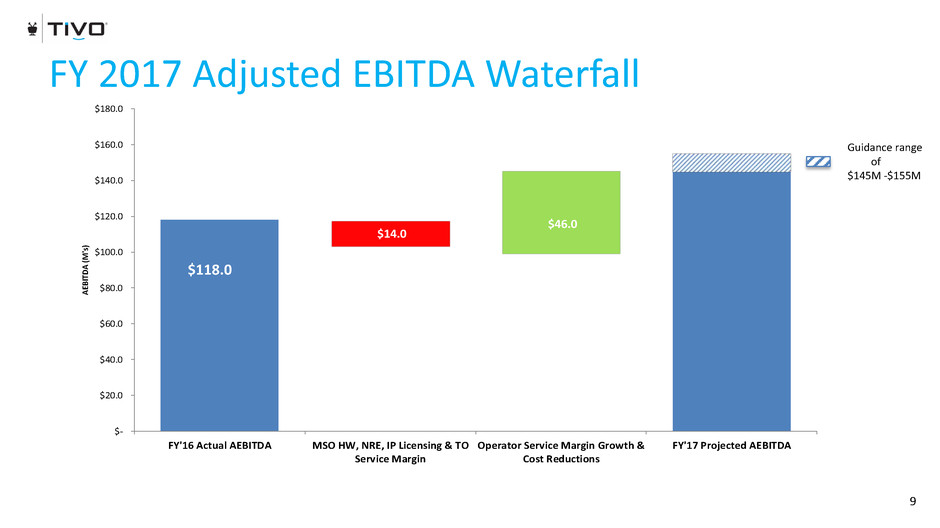
$14.0 $46.0 $- $20.0 $40.0 $60.0 $80.0 $100.0 $120.0 $140.0 $160.0 $180.0 FY'16 Actual AEBITDA MSO HW, NRE, IP Licensing & TO Service Margin Operator Service Margin Growth & Cost Reductions FY'17 Projected AEBITDA AE BIT DA (M 's) FY 2017 Adjusted EBITDA Waterfall 9 $118.0 Guidance range of $145M -$155M
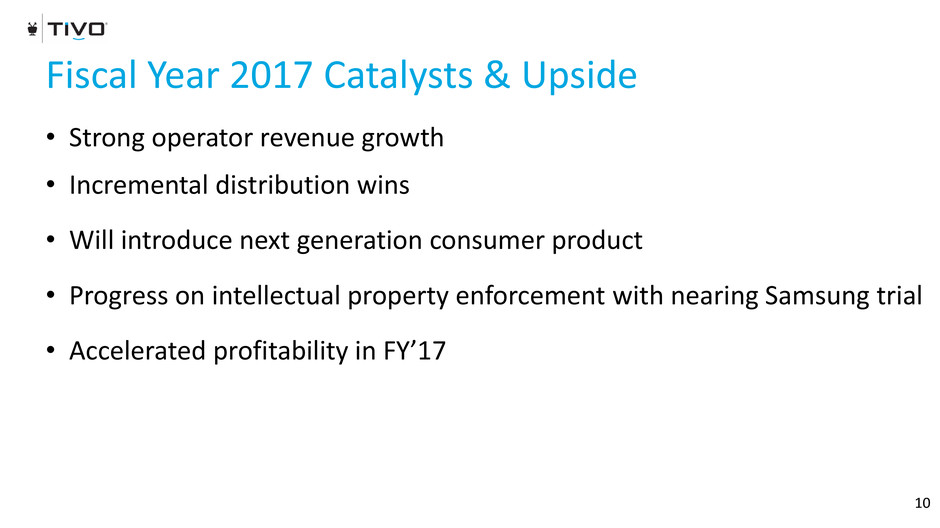
Fiscal Year 2017 Catalysts & Upside 10 • Strong operator revenue growth • Incremental distribution wins • Will introduce next generation consumer product • Progress on intellectual property enforcement with nearing Samsung trial • Accelerated profitability in FY’17
