Attached files
| file | filename |
|---|---|
| EX-21.1 - EXHIBIT 21.1 - ETSY INC | ex21112312015.htm |
| EX-10.7.2 - EXHIBIT 10.7.2 - ETSY INC | ex107212312015.htm |
| EX-31.2 - EXHIBIT 31.2 - ETSY INC | ex31212312015.htm |
| EX-32.2 - EXHIBIT 32.2 - ETSY INC | ex32212312015.htm |
| EX-31.1 - EXHIBIT 31.1 - ETSY INC | ex31112312015.htm |
| EX-32.1 - EXHIBIT 32.1 - ETSY INC | ex32112312015.htm |
| EX-23.1 - EXHIBIT 23.1 - ETSY INC | ex23112312015.htm |
UNITED STATES
SECURITIES AND EXCHANGE COMMISSION
Washington, D.C. 20549
_________________________
FORM 10-K
_________________________
x | Annual Report Pursuant to Section 13 or 15(d) of the Securities Exchange Act of 1934 For the fiscal year ended December 31, 2015 |
OR | |
¨ | Transition Report Pursuant to Section 13 or 15(d) of the Securities Exchange Act of 1934 For the transition period from to |
Commission File Number 001-36911
_________________________
ETSY, INC.
(Exact name of registrant as specified in its charter)
_________________________
Delaware | 20-4898921 | |
(State or other jurisdiction of incorporation or organization) | (I.R.S. Employer Identification No.) | |
55 Washington Street, Suite 512, Brooklyn, NY | 11201 | |
(Address of principal executive offices) | (Zip code) | |
(718) 855-7955
(Registrant's telephone number, including area code)
Securities registered pursuant to Section 12(b) of the Act:
Title of each class | Name of each exchange on which registered | |
Common Stock, par value $0.001 per share | The NASDAQ Stock Market LLC (NASDAQ Global Select Market) | |
Securities registered pursuant to Section 12(g) of the Act: None
Indicate by check mark whether the registrant is a well-known seasoned issuer, as defined in Rule 405 of the Securities Act. Yes ¨ No x
Indicate by check mark if the registrant is a not required to file reports pursuant to Section 13 or Section 15(d) of the Act. Yes ¨ No x
Indicate by check mark whether the registrant (1) has filed all reports required to be filed by Section 13 or 15(d) of the Securities Exchange Act of 1934 during the preceding 12 months (or for such shorter period that the registrant was required to file such reports), and (2) has been subject to such filing requirements for the past 90 days. Yes x No ¨
Indicate by check mark whether the registrant has submitted electronically and posted on its corporate Web site, if any, every Interactive Data File required to be submitted and posted pursuant to Rule 405 of Regulation S-T (§232.405 of this chapter) during the preceding 12 months (or for such shorter period that the registrant was required to submit and post such files). Yes x No ¨
Indicate by check mark if disclosure of delinquent filers pursuant to Item 405 of Regulation S-K (§229.405 of this chapter) is not contained herein, and will not be contained, to the best of registrant’s knowledge, in definitive proxy or information statements incorporated by reference in Part III of this Form 10-K or any amendment to this Form 10-K. x
Indicate by check mark whether the registrant is a large accelerated filer, an accelerated filer, a non-accelerated filer, or a smaller reporting company. See the definitions of "large accelerated filer," "accelerated filer" and "smaller reporting company" in Rule 12b-2 of the Exchange Act.
Large accelerated filer ¨ Accelerated filer ¨
Non-accelerated filer x (Do not check if a smaller reporting company) Smaller reporting company ¨
Indicate by check mark whether the registrant is a shell company (as defined in Rule 12b-2 of the Exchange Act). Yes ¨ No x
The aggregate market value of the voting and non-voting common equity held by non-affiliates of the registrant as of June 30, 2015 (the last business day of the registrant’s most recently completed second fiscal quarter), was $1,018,474,398.
The number of shares of common stock outstanding as of February 26, 2016 was 112,699,756.
Documents Incorporated By Reference
Portions of the registrant’s Proxy Statement for its 2016 Annual Meeting of Stockholders, to be filed with the Securities and Exchange Commission no later than 120 days after December 31, 2015, are incorporated by reference in Part III of this Annual Report on Form 10-K.
Etsy, Inc.
Table of Contents
Note Regarding Forward-Looking Statements
Page | ||
Part I | ||
Item 1. | Business | |
Item 1A. | Risk Factors | |
Item 1B. | Unresolved Staff Comments | |
Item 2. | Properties | |
Item 3. | Legal Proceedings | |
Item 4. | Mine Safety Disclosures | |
Part II | ||
Item 5. | Market for Registrant's Common Equity, Related Stockholder Matters and Issuer Purchases of Equity Securities | |
Item 6. | Selected Consolidated Financial and Other Data | |
Item 7. | Management's Discussion and Analysis of Financial Condition and Results of Operations | |
Item 7A. | Quantitative and Qualitative Disclosures About Market Risk | |
Item 8. | Financial Statements and Supplementary Data | |
Report of Independent Registered Public Accounting Firm | ||
Consolidated Balance Sheets | ||
Consolidated Statements of Operations | ||
Consolidated Statements of Comprehensive Loss | ||
Consolidated Statements of Changes in Convertible Preferred Stock and Stockholders' Equity | ||
Consolidated Statements of Cash Flows | ||
Notes to Consolidated Financial Statements | ||
Item 9. | Changes in and Disagreements with Accountants on Accounting and Financial Disclosure | |
Item 9A. | Controls and Procedures | |
Item 9B. | Other Information | |
Part III | ||
Item 10. | Directors, Executive Officers and Corporate Governance | |
Item 11. | Executive Compensation | |
Item 12. | Security Ownership of Certain Beneficial Owners and Management and Related Stockholder Matters | |
Item 13. | Certain Relationships and Related Transactions, and Director Independence | |
Item 14. | Principal Accounting Fees and Services | |
Part IV | ||
Item 15. | Exhibits, Financial Statement Schedules | |
Signatures | ||
Exhibit Index | ||
Unless the context otherwise requires, we use the terms “Etsy,” the “company,” “we,” “us” and “our” in this Annual Report on Form 10-K, or Annual Report, to refer to Etsy, Inc. and, where appropriate, our consolidated subsidiaries.
See "Management’s Discussion and Analysis of Financial Condition and Results of Operations—Key Operating and Financial Metrics" for the definitions of the following terms used in this Annual Report: "active buyer," "active seller," "GMS," "International GMS," "mobile visit," and "mobile GMS."
NOTE REGARDING FORWARD-LOOKING STATEMENTS
This Annual Report on Form 10-K contains forward-looking statements within the meaning of the federal securities laws. Forward-looking statements include information related to our possible or assumed future results of operations and expenses, our outlook, our mission, business strategies and plans, business environment and future growth. Forward-looking statements include all statements that are not historical facts. In some cases, forward-looking statements can be identified by words such as “anticipates,” “believes,” “could,” “estimates,” “expects,” “intends,” “may,” “plans,” “potential,” “predicts,” “projects,” “seeks,” “should,” “will,” “would” or similar expressions and the negatives of those terms.
Forward-looking statements are not guarantees of performance and involve known and unknown risks, uncertainties and other factors that may cause our actual results, performance or achievements to be materially different from any future results, performance or achievements expressed or implied by the forward-looking statements. Those risks include those described in “Risk Factors,” "Management’s Discussion and Analysis of Financial Condition and Results of Operations—Key Factors Affecting Our Performance" and elsewhere in this report. Given these uncertainties, you should read this report in its entirety and not place undue reliance on any forward-looking statements in this Annual Report on Form 10-K.
Moreover, we operate in a competitive and rapidly changing environment. New risks and uncertainties emerge from time to time and it is not possible for us to predict all risks and uncertainties that could have an impact on the forward-looking statements made in this Annual Report on Form 10-K. In light of these risks, uncertainties and assumptions, the future events and trends discussed in this Annual Report on Form 10- K may not occur and actual results could differ materially and adversely from those anticipated or implied in the forward-looking statements.
Forward-looking statements represent our beliefs and assumptions only as of the date of this report. We disclaim any obligation to update forward-looking statements.
PART I.
Item 1. Business.
Overview
Our mission is to reimagine commerce in ways that build a more fulfilling and lasting world. We are building a human and community-centric global and local marketplace. We are committed to using the power of business to create a better world through our platform.
We operate a marketplace where people around the world connect, both online and offline, to make, sell and buy unique goods. As of December 31, 2015, through our innovative, technology-based platform, we connected a community of 1.6 million active Etsy sellers and 24.0 million active Etsy buyers, in nearly every country in the world.
Our community is the heart and soul of Etsy and is made up of creative entrepreneurs who sell on our platform, thoughtful consumers looking to buy unique goods in our marketplace and the Etsy employees who maintain our platform and nurture our ecosystem. Our community also includes the retailers who participate in our Wholesale offering and the manufacturers who form responsible partnerships with Etsy sellers. We are focused on bringing new participants into our community and expanding the impact of our platform and what we call the "Etsy Economy." The Etsy Economy values and honors the people who design and make goods, is transparent about the way they are made and connects the people who make, sell and buy them. It is an economy in which creative entrepreneurs find meaningful work and both global and local markets for their goods.
Our business model is based on shared success: we make money when Etsy sellers make money. In 2015, Etsy sellers generated Gross Merchandise Sales ("GMS") of $2.4 billion, of which approximately 43% came from purchases made on mobile devices. We are a global company and 29.8% of our 2015 GMS came from an Etsy seller or an Etsy buyer outside of the United States.
Our revenue is diversified, generated from a mix of marketplace activities and the services we provide to Etsy sellers to help them create and grow their businesses. Marketplace revenue is made up of two components: the $0.20 listing fee that an Etsy seller pays for each item she lists and the 3.5% transaction fee she pays for each completed transaction. Seller Services revenue includes the fees our sellers pay Etsy for services, which include Promoted Listings, our ad service for prominent placement in on-site search results, Direct Checkout, our payment processing service, and Shipping Labels, which allows sellers to purchase shipping labels through our platform. Other revenue includes the fees we receive from a third-party payment processor.
We operate at the center of several converging macroeconomic trends in online and mobile commerce, employment, consumption and manufacturing. We believe that in combination these trends will benefit Etsy sellers engaging in their creative passion, working for themselves and defining success on their own terms; Etsy buyers accessing a diverse, global marketplace of goods that have historically been found in highly fragmented markets; and, increasingly, values-aligned manufacturers using modern tools to craft goods in responsible partnership with Etsy sellers.
We are focused on four key strategies that we believe will allow us to sustain and grow the Etsy community:
• | Make Etsy an Everyday Experience |
• | Build Local Marketplaces, Globally |
• | Build High-Impact Seller Services |
• | Expand the Etsy Economy |
Etsy was founded in June 2005 in Brooklyn, New York. On April 21, 2015, we completed our initial public offering (the "IPO") and our common stock is listed on the Nasdaq Global Select Market under the symbol "ETSY."
1
Our Values
Our values are integral to everything we do.
We are a mindful, transparent and humane business. We believe that business interests and social and environmental responsibility are interwoven and aligned and that the power of business should be used to strengthen communities and empower people. To demonstrate our commitment, we monitor our efforts to minimize the harm and maximize the benefit that we have on people and the planet and then publish an annual Progress Report to publicly report our results. B Lab, an independent nonprofit organization, has certified us as a B Corporation for our adherence to certain social and environmental standards. In addition, Fortune has recognized us as a great place to work in 2013, 2014 and 2015.
We plan and build for the long term. We want to build a company that lasts, and we plan to measure our success in years and decades. Etsy sellers in particular depend on us and on our platform to grow their businesses, so we will strive to make decisions that are best for the long-term health of our ecosystem. Our ecosystem consists of Etsy and the people and communities around the world who benefit from our platform.
We value craftsmanship in all we make. Craftsmanship is the marriage of skill and passion. We believe every job at our company should demonstrate our commitment to craft. We are an engineering-driven company, and we think of our code as craft: we are makers of the products and services that members of our community use, and we approach the work we do with the same care and inspiration as do Etsy sellers.
We believe fun should be part of everything we do. Our mission includes fostering a world in which personal fulfillment is a key element of success. We believe that this way of working is connected and joyful. We strive to do excellent work and bring a sense of humor and playfulness to it.
We keep it real, always. We have the courage and the will to do business in ways that are unconventional and impactful. We strive to stay genuine, maintaining integrity, humility and sincerity in everything we do. When we feel that we are not being true to our values or our mission, we are not afraid to stop and change course.
Our Community
Our community includes Etsy sellers, Etsy buyers, wholesale partners, manufacturers and Etsy employees.
Etsy Sellers: Creative Entrepreneurs
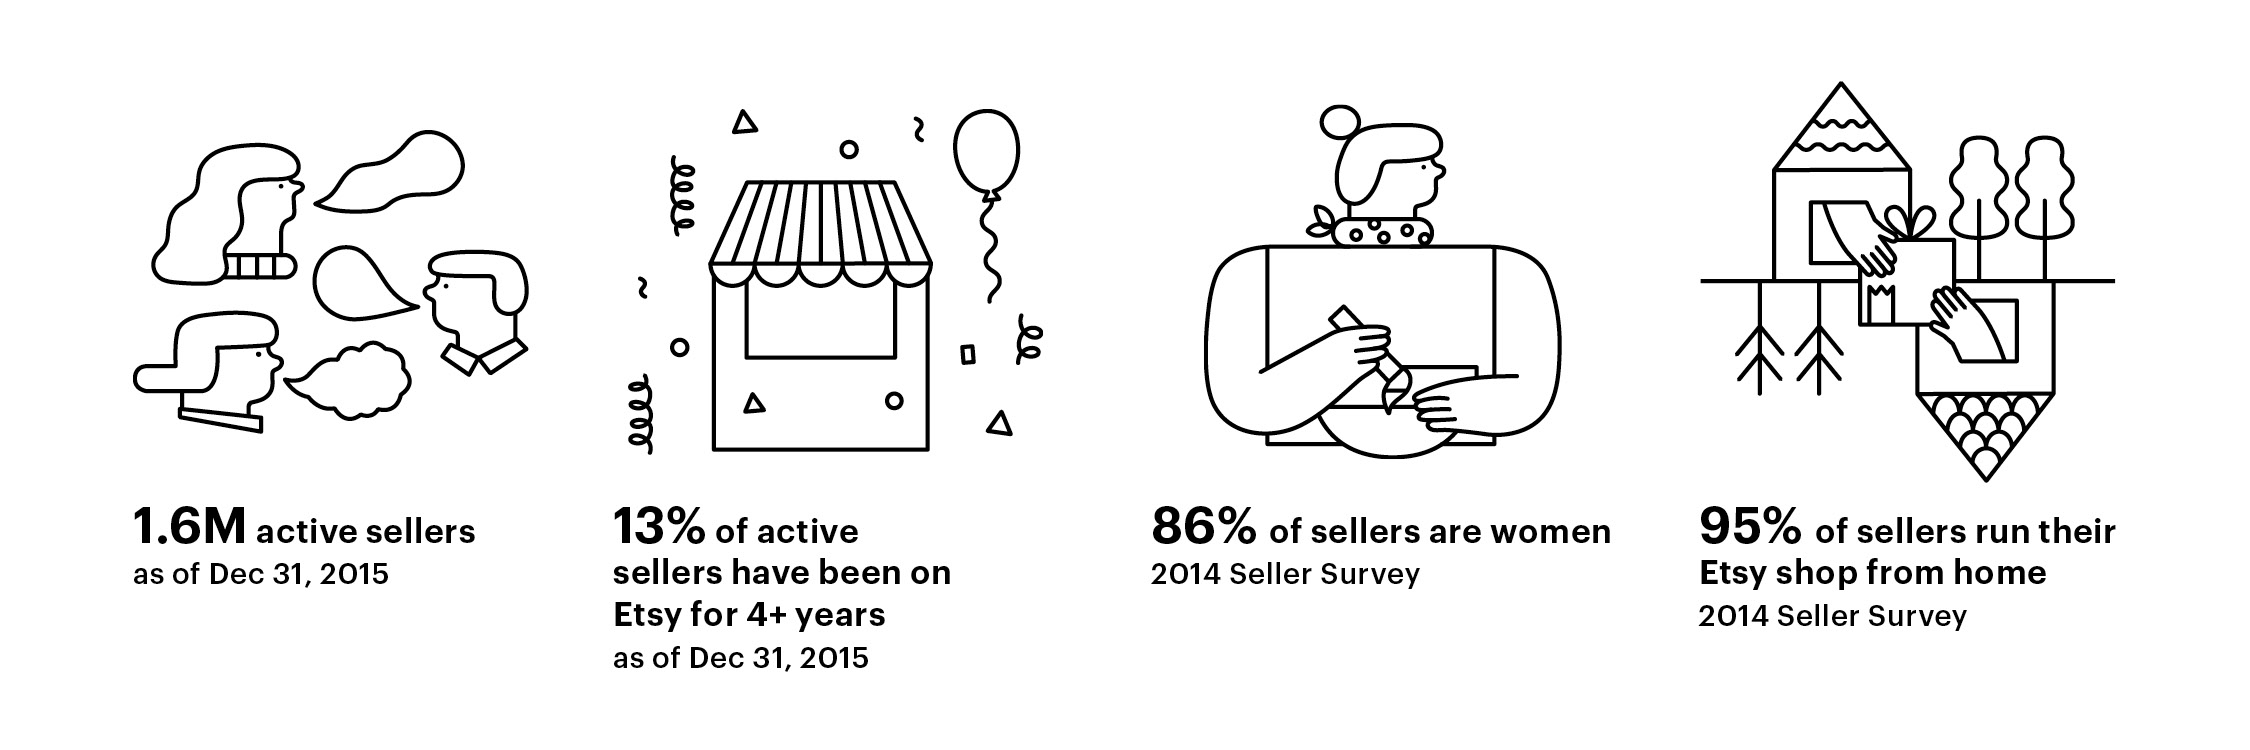
Etsy sellers join our community to be part of a vibrant global-local marketplace that allows them to express their creativity and turn their passion into a business while connecting to thoughtful consumers locally and around the world. As of December 31, 2015, there were 1.6 million active sellers on our platform and more than 13% of active sellers as of that date had been selling on Etsy for more than four years.
Etsy Sellers | ||||
2
We support a diverse group of artists, makers, designers and collectors from around the world—from the solo artisan to the full-time jewelry maker with staff; from the antique furniture collector to the textile graphic designer partnering with a small-batch manufacturer.
Etsy sellers range from hobbyists to professional merchants, and have a broad range of personal and professional goals. We survey our sellers every two years and in November 2014, we conducted a survey of U.S. Etsy sellers who made a sale in the preceding 12 months. The 2014 Seller Survey, which included responses from 4,000 sellers, reveals a unique population of Internet-enabled creative entrepreneurs who are building businesses on their own terms—prioritizing flexibility, independence and creativity. Some Etsy sellers are looking for extra pocket money, while others depend on their shops to support themselves and their families. According to our 2014 Seller Survey, among U.S. Etsy sellers:
• | 86% are women; |
• | 95% run their shops from their homes; |
• | 90% aspire to grow their sales in the future; |
• | 79% started their Etsy shop as an outlet for creativity; |
• | 65% started their Etsy shop as a way to supplement income; and |
• | 76% consider their Etsy shop to be a business. |
Etsy Buyers: Thoughtful Consumers
Etsy buyers visit our marketplace to discover a broad selection of unique goods in dozens of retail categories that are hard to find elsewhere, ranging from a $5 ornament to a $50 hand-knit sweater to a $2,000 custom-made coffee table. In a 2015 survey of Etsy buyers, 92% agreed that Etsy offers products they cannot find elsewhere. We believe many Etsy buyers are motivated by more than simply price and convenience; we believe they also value craftsmanship, artistry, uniqueness, authenticity and sustainability. We find that Etsy buyers want to know how items were made, where they were made and who made them. In our marketplace, Etsy buyers can enjoy a personalized shopping experience and build relationships through direct interactions with Etsy sellers. Etsy buyers can also purchase customized items or other bespoke goods from Etsy sellers. By buying in our marketplace, Etsy buyers are supporting creative entrepreneurs in their local communities and around the world. As of December 31, 2015, there were 24.0 million active buyers on our platform.
Marketplace Activity | ||||
Wholesale Partners
Retailers who have joined our Wholesale offering, which we launched in August 2014, are also part of our community. From local boutiques to national chains such as Land of Nod, Lou & Grey, Macy's and Whole Foods, retailers use our platform to connect directly with Etsy sellers and to add unique and distinctive items to their store offerings. In 2015, we introduced our Wholesale Retailer Commitments, which are a set of guidelines that our large retail partners have agreed to follow when
3
working with Etsy sellers. The Commitments, which include terms such as quick and fair payment, are intended to foster relationships that lead to mutual success.
Manufacturing Partners
Etsy's mission to reimagine commerce includes our efforts to reimagine manufacturing. We are committed to helping Etsy sellers who share our values of authorship, responsibility and transparency and who want to grow their businesses by forming responsible partnerships with manufacturers. For example, an Etsy seller might work with a cut-and-sew shop to make clothes she has designed, a casting house that casts wax models for her jewelry designs or a digital printing house that prints her photographs on household items.
In addition to finding manufacturers on their own, Etsy sellers can find manufacturers through our new Etsy Manufacturing marketplace that we launched in September 2015. We launched Etsy Manufacturing to help Etsy sellers connect directly with manufacturers who commit to certain practices and value transparent connections. We hope to foster responsible and creative partnerships between the designers and manufacturers of goods, to prioritize transparency and to help our community learn about the unique stories and people behind each item. Manufacturers who apply to join Etsy Manufacturing must commit to certain ethical expectations and to operating a safe and just workplace, with transparency and reliable customer service. As of the end of 2015, only manufacturers in the United States or Canada may participate in Etsy Manufacturing and there is no fee for participation.
An Etsy seller who would like to work with a manufacturer, whether found through the Etsy Manufacturing marketplace or on her own, must apply. Our Responsible Seller Growth team reviews every application. We do not review or approve the manufacturer; instead, we look to the Etsy seller to provide evidence of authorship, responsibility and transparency. We also ask Etsy sellers to work with manufacturers who adhere to our ethical expectations: humane working conditions, non-discrimination policies, sustainability practices and no child, youth or involuntary labor. To encourage transparency, Etsy sellers are required to disclose their use of manufacturers in their Etsy shop.
Etsy Employees
We too are members of our community. Whether crafting our policies, talking with Etsy sellers and Etsy buyers in our online forums or building the tools and services underlying our marketplace, our employees create genuine and lasting connections in our community. Etsy employees emphasize building personal relationships with Etsy sellers, visiting their shops, inviting them to our offices for lunch or celebrating with them at in-person events. In addition, each of our employees, including management, is expected to perform support rotations to help foster connections with Etsy sellers and Etsy buyers and to help us better understand their needs.
We pride ourselves on our values-based work culture. We emphasize respect, direct communication and fun. We focus on maximizing our employees’ professional and personal well-being. We evaluate performance on traditional business metrics and on adherence to our mission and values.
We believe employee happiness comes from engaging and fulfilling work and from ample personal and professional growth opportunities. We invest heavily in employee development by offering coaching, skills workshops and training. We actively encourage personal education through arts and crafts workshops and employee-taught classes called “Etsy School,” covering subjects ranging from screen printing to Python programming.
Etsy engineering is widely known for its thought-leading approaches to software development as well as its unique engineering culture. Our engineering team coined the phrase “Code as Craft” to describe our love for building software and our melding of engineering discipline and individual craftsmanship. We believe our engineers have the skills, practices and experience needed to embrace the change the future inevitably brings.
As of December 31, 2015, we had 819 employees worldwide, with 496 in our offices in Brooklyn, New York. Of those employees, we had 257 in engineering, 84 in product, 221 in member operations, 196 in corporate and 61 in marketing.
We proactively work and recruit to improve the gender balance at all levels of our company. As of December 31, 2015, 54% of employees identified as female. As of December 31, 2015, 50% of managers and 32% of product, engineering and technical operations employees identified as female.
4
Etsy.org
In January 2015, we formed Etsy.org, a Delaware non-profit organization, to build innovative business education programs that emphasize personal growth and offer the skills and connections that entrepreneurs need to build and run businesses that regenerate communities and the planet. In January 2015, we issued 188,235 shares of our common stock to Etsy.org, and we used $300,000 of the proceeds of our initial public offering to partially fund Etsy.org.
Our Platform
Our platform is a vehicle for person-to-person commerce, both globally and locally. Our platform includes our marketplace, our Seller Services, our technology and our community, both online and offline. The core of our platform is our marketplace, which connects people around the world to make, sell and buy unique goods.
The Etsy Seller Experience
Our platform makes it easy for an Etsy seller to open an Etsy shop and operate her business. We help the Etsy seller in the following ways:
• | Seller Services. We offer a variety of services to help Etsy sellers build their personal brands, engage potential customers and complete transactions. We currently have three seller services: |
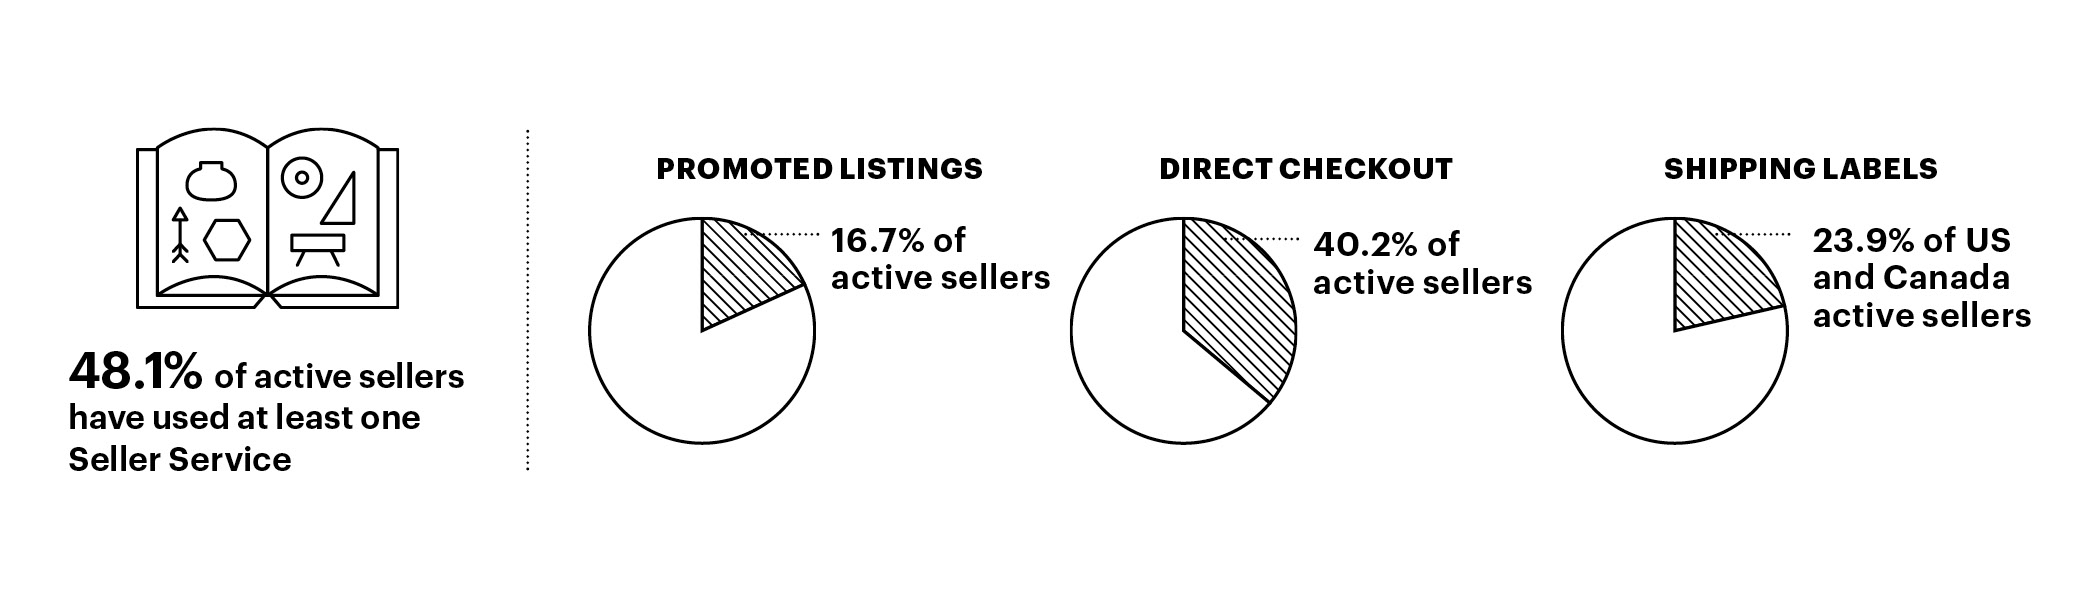
• | Promoted Listings. Our Promoted Listings offering enables an Etsy seller to pay a cost-per-click based fee to feature and promote her goods in search results generated by Etsy buyers on our platform. This service allows an Etsy seller to target Etsy buyers who are specifically searching for goods similar to those she offers for sale. |
• | Direct Checkout. Our Direct Checkout offering allows Etsy sellers to accept various forms of payment such as credit cards, debit cards, PayPal and Etsy gift cards. As of December 31, 2015, Direct Checkout was available in 22 countries and 10 currencies. In January 2016, Direct Checkout was expanded and is currently available in 34 countries in total. Once an Etsy buyer makes payment, the Etsy seller receives the funds in her own bank account and in her local currency. |
• | Shipping Labels. Etsy sellers can purchase United States Postal Service and Canada Post shipping labels through our platform with the appropriate amount of postage. The ability to print shipping labels at home reduces the cost and time it takes Etsy sellers to ship goods to Etsy buyers globally. |
Use of Seller Services in 2015 | ||||
• | Mobile. We developed our “Sell on Etsy” mobile app to help Etsy sellers operate their shops and manage orders. Etsy sellers can also access communication, shop management tools and help resources through the Sell on Etsy mobile app. During 2015, 43.2% of our 2015 active sellers used our Sell on Etsy app. |
• | Seller Dashboard. Etsy sellers can analyze visits to their shop and listings, estimate the effectiveness of their spending on Promoted Listings, monitor orders and track sales using our online seller dashboard. Etsy sellers can access analytics on the dashboard on our website or on our Sell on Etsy mobile app. |
5
• | Education. We provide extensive educational resources to teach Etsy sellers how to build and grow their businesses on our platform, including blog posts, video tutorials, the Etsy Seller Handbook (available on our website), access to our online forums and insights from our support teams. In addition to our own educational resources, Etsy sellers connect through Etsy Teams to build personal relationships, collaborate and educate and support each other. |
The Etsy Buyer Experience
To help Etsy buyers discover and purchase items that they love, we provide a number of tools, including:
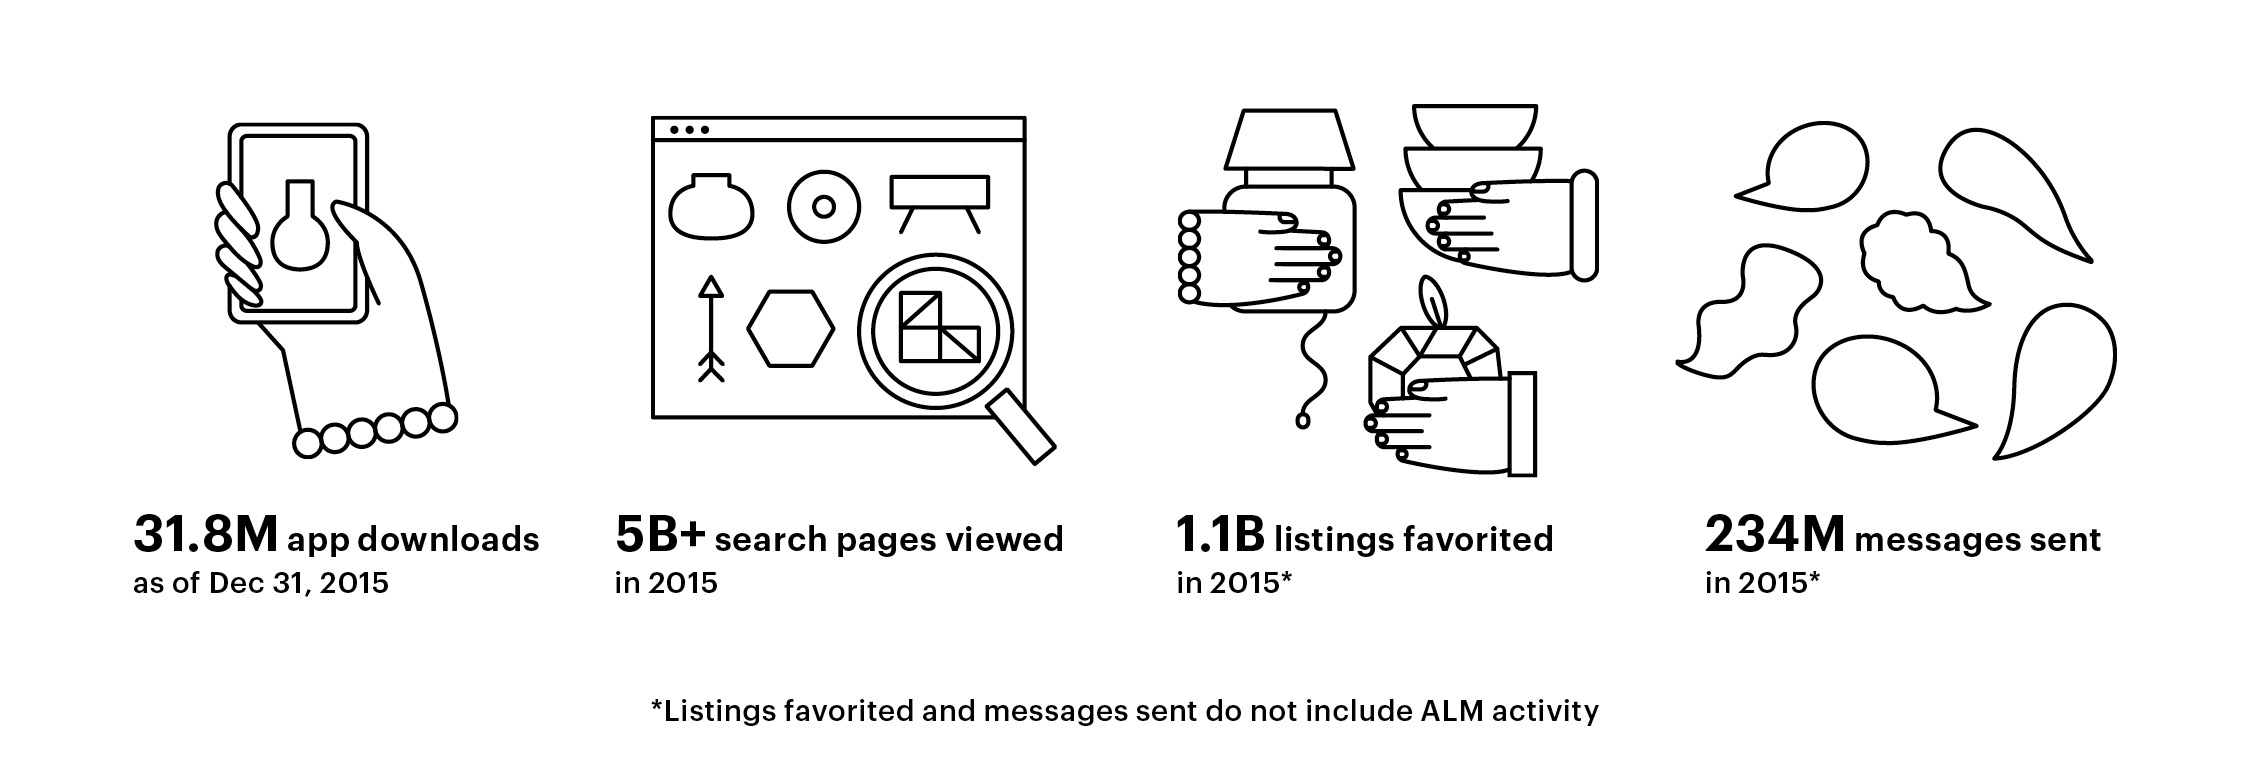
• | Communication. We believe human connection is central to Etsy buyers’ engagement. Etsy buyers and Etsy sellers use the Conversations tool on our platform to communicate, person to person, about their orders, to request custom goods or personalization of goods or simply to have a conversation about the product or the process. In 2015, Etsy sellers and Etsy buyers sent 234 million messages on our platform. In addition to our Conversations tool, we encourage engagement between Etsy buyers and Etsy sellers in a variety of ways. For example, in 2015, we introduced a mobile app feature that enables Etsy buyers to share a photo when they post a five-star review of an item and to more easily share reviews on social media. We also launched Etsy Local on our mobile apps so that Etsy buyers can more easily find Etsy sellers and their goods offline at nearby events such as craft fairs, flea markets or local shops. |
• | Search and discovery. Our platform is engineered to provide a personalized experience to each Etsy buyer, adjusting in real time based on her interactions with our marketplace. An Etsy buyer may search for an item using our search tool bar and filter the results by color, price, location or other characteristics. She may browse through items, creating an activity feed by “favoriting” items that catch her eye and by following shops and tastemakers. In 2015, Etsy sellers and Etsy buyers tagged 1.1 billion favorites on our platform. We glean insights from Etsy buyers’ purchases and other interactions on our marketplace through our machine-learning algorithms and through traditional information retrieval techniques, such as cookies. We use these insights to personalize the activity feed an Etsy buyer sees when she comes to Etsy, with suggestions of shops or tastemakers to follow and items to buy or favorite. We use the data we collect and the insights we gain to match Etsy sellers’ goods with Etsy buyers’ tastes and interests. In 2015, we updated the search function in our marketplace to better showcase the breadth of the items available and to help Etsy buyers more easily browse, filter and buy goods, even when they may not have something specific in mind. Our large and engaged community accessed more than 5 billion search page views in 2015, including searches using our mobile apps. |
• | Mobile. We strive to keep Etsy buyers engaged wherever they are, by providing the functionality of our website in iOS and Android mobile apps, specifically crafted for Etsy buyers. Our mobile apps for Etsy buyers include search and discovery, curation, personalization and social shopping features similar to those that Etsy buyers enjoy on our desktop site. In order to provide an enjoyable shopping experience for Etsy buyers through our mobile apps, we use deep linking to automatically transition Etsy buyers from a mobile web experience to the mobile app when they encounter a link to an Etsy shop or item. In addition, we want to make it even easier for Etsy buyers to sign up, sign in and check out when using their mobile devices. In 2015, we added social sign-up and sign-in through Facebook and Google and expanded mobile payment and digital wallet options for Apple Pay, Google Wallet and others. Our mobile apps have been downloaded 31.8 million times as of December 31, 2015. |
Our Policies
Members of our community rely on us to be a trusted marketplace. Our policies are designed to encourage transparency and clearly outline the rights and responsibilities of Etsy sellers, Etsy buyers, wholesale partners and manufacturing partners participating on our platform.
Most fundamentally, we require that goods listed in our marketplace be handmade, vintage or craft supplies. Handmade items begin with the imagination and creativity of the Etsy seller. To conform to our vision of handmade, we ask that the Etsy seller follow these three principles:
• | Authorship: The Etsy seller should have a meaningful design and creative role in the items she is selling. |
• | Responsibility: The Etsy seller should know how her goods are made and by whom. |
• | Transparency: The Etsy seller should be open and honest about how her goods are made and by whom. |
We strive to give the Etsy buyer comfort that she is purchasing unique goods from a shop that adheres to certain principles. Etsy buyers have a high degree of insight into Etsy sellers’ business practices. Our policies ask Etsy sellers to be transparent
6
about themselves, their businesses and the goods they sell. We also have dedicated teams and sophisticated tools to help enforce our policies. For example, our Integrity team uses a combination of machine learning, automated systems and community-generated flags to review items and shops that may violate our policies. Our Trust and Safety team helps to prevent and detect fraud through human review and automated tools and algorithms.
We also recognize that sometimes transactions don’t always go as planned. When that happens, our online Case System provides a way for Etsy sellers and Etsy buyers to communicate with each other to resolve disputes.
Our Opportunities and Strengths
Our Opportunities
We operate at the center of several converging macroeconomic trends in online and mobile commerce, employment, consumption and manufacturing. We believe that in combination these trends will benefit Etsy sellers engaging in their creative passion, working for themselves and defining success on their own terms; Etsy buyers accessing a diverse, global marketplace of goods that have historically been found in highly fragmented markets; and, increasingly, values-aligned manufacturers using modern tools to craft goods in responsible partnership with Etsy sellers. We also believe that these trends create a strong, long-term market opportunity for Etsy that will allow us to continue to expand our marketplace globally, attract buyers who want something different than a conventional, mass-produced retail shopping experience, deepen the connections within our community and introduce new Seller Services and tools.
Most large retailers today follow a different formula from Etsy, emphasizing efficiency and scale and pressuring their suppliers to reduce their costs in order to serve mass-produced goods at the lowest-possible prices. We believe, however, that many consumers want to purchase goods that are unique and that reflect their personality and style, not simply mass-produced, generic goods. Finding these goods can be difficult, as markets for such goods have historically been highly fragmented across boutiques, consignment stores and other venues and marketplaces.
Etsy sellers offer goods in dozens of online retail categories, including jewelry, stationery, clothing, home goods, craft supplies and vintage items. Euromonitor, a consumer market research company, estimated that the global online retail market was $991 billion in 2015, up from $483 billion in 2011, representing a compound annual growth rate, or CAGR, of 19.7%. This growth is expected to continue, with the global online retail market becoming a significantly larger portion of the total retail market, reaching $1.8 trillion by 2019, implying a 15.5% CAGR from 2015. (Source: Euromonitor - 2016 Passport Retailing.)
Our Strengths
We believe we can benefit from these positive trends by continuing to leverage and expand our platform. Our platform is one of the largest online marketplaces in the world and we have achieved our scale because of the following key strengths:
Our Trusted Marketplace. We have built a trusted marketplace that embodies our values-based culture, emphasizing respect, direct communication and fun. Our reputation depends upon our Etsy sellers, their unique offerings and their adherence to our policies. We establish trust in our marketplace in a variety of ways. For example, our policies are designed to encourage transparency and clearly outline the rights and responsibilities of Etsy sellers, Etsy buyers, wholesale partners and manufacturing partners participating on our platform.
Transparency is one of our core values and Etsy's transparency with our community helps to support the trustworthiness of our marketplace. For example, we publish an annual Progress Report that details our progress toward our ideals and shares our hopes for the years to come. In 2015, we also released a Transparency Report, which, among other things, describes the steps we take when items that do not meet our guidelines are listed on our platform, or when listed items are alleged to infringe third party rights.
We also establish trust by emphasizing the person behind every transaction. We deepen connections between Etsy sellers and Etsy buyers through our direct communication tools, seller stories on our website and apps and in-person events, highlighting personal relationships as a key part of the Etsy experience. For example, Etsy sellers are encouraged to share their stories and use new tools, such as shop videos, to reach Etsy buyers on our platform and on social media. The trustworthiness of our marketplace and the connections among people in our community are the cornerstones of our business.
7
Our Passionate, Engaged and Loyal Etsy Sellers and Etsy Buyers. Etsy sellers and Etsy buyers are passionate, engaged and loyal—not only to us, but to each other—building a strong community.
• | Our active sellers and active buyers remain so for multiple years. For example, 32.3% of active sellers and 44.7% of active buyers as of December 31, 2011 continued to be active sellers and active buyers through their fourth year on the platform, and 32.3% of active sellers and 42.5% of active buyers as of December 31, 2012 continued to be active sellers and active buyers through their fourth year on the platform. In addition, as of December 31, 2015, 13% of active sellers have been selling on Etsy for more than four years. Likewise, as of December 31, 2015, 15% of active buyers have been Etsy buyers for more than four years. |
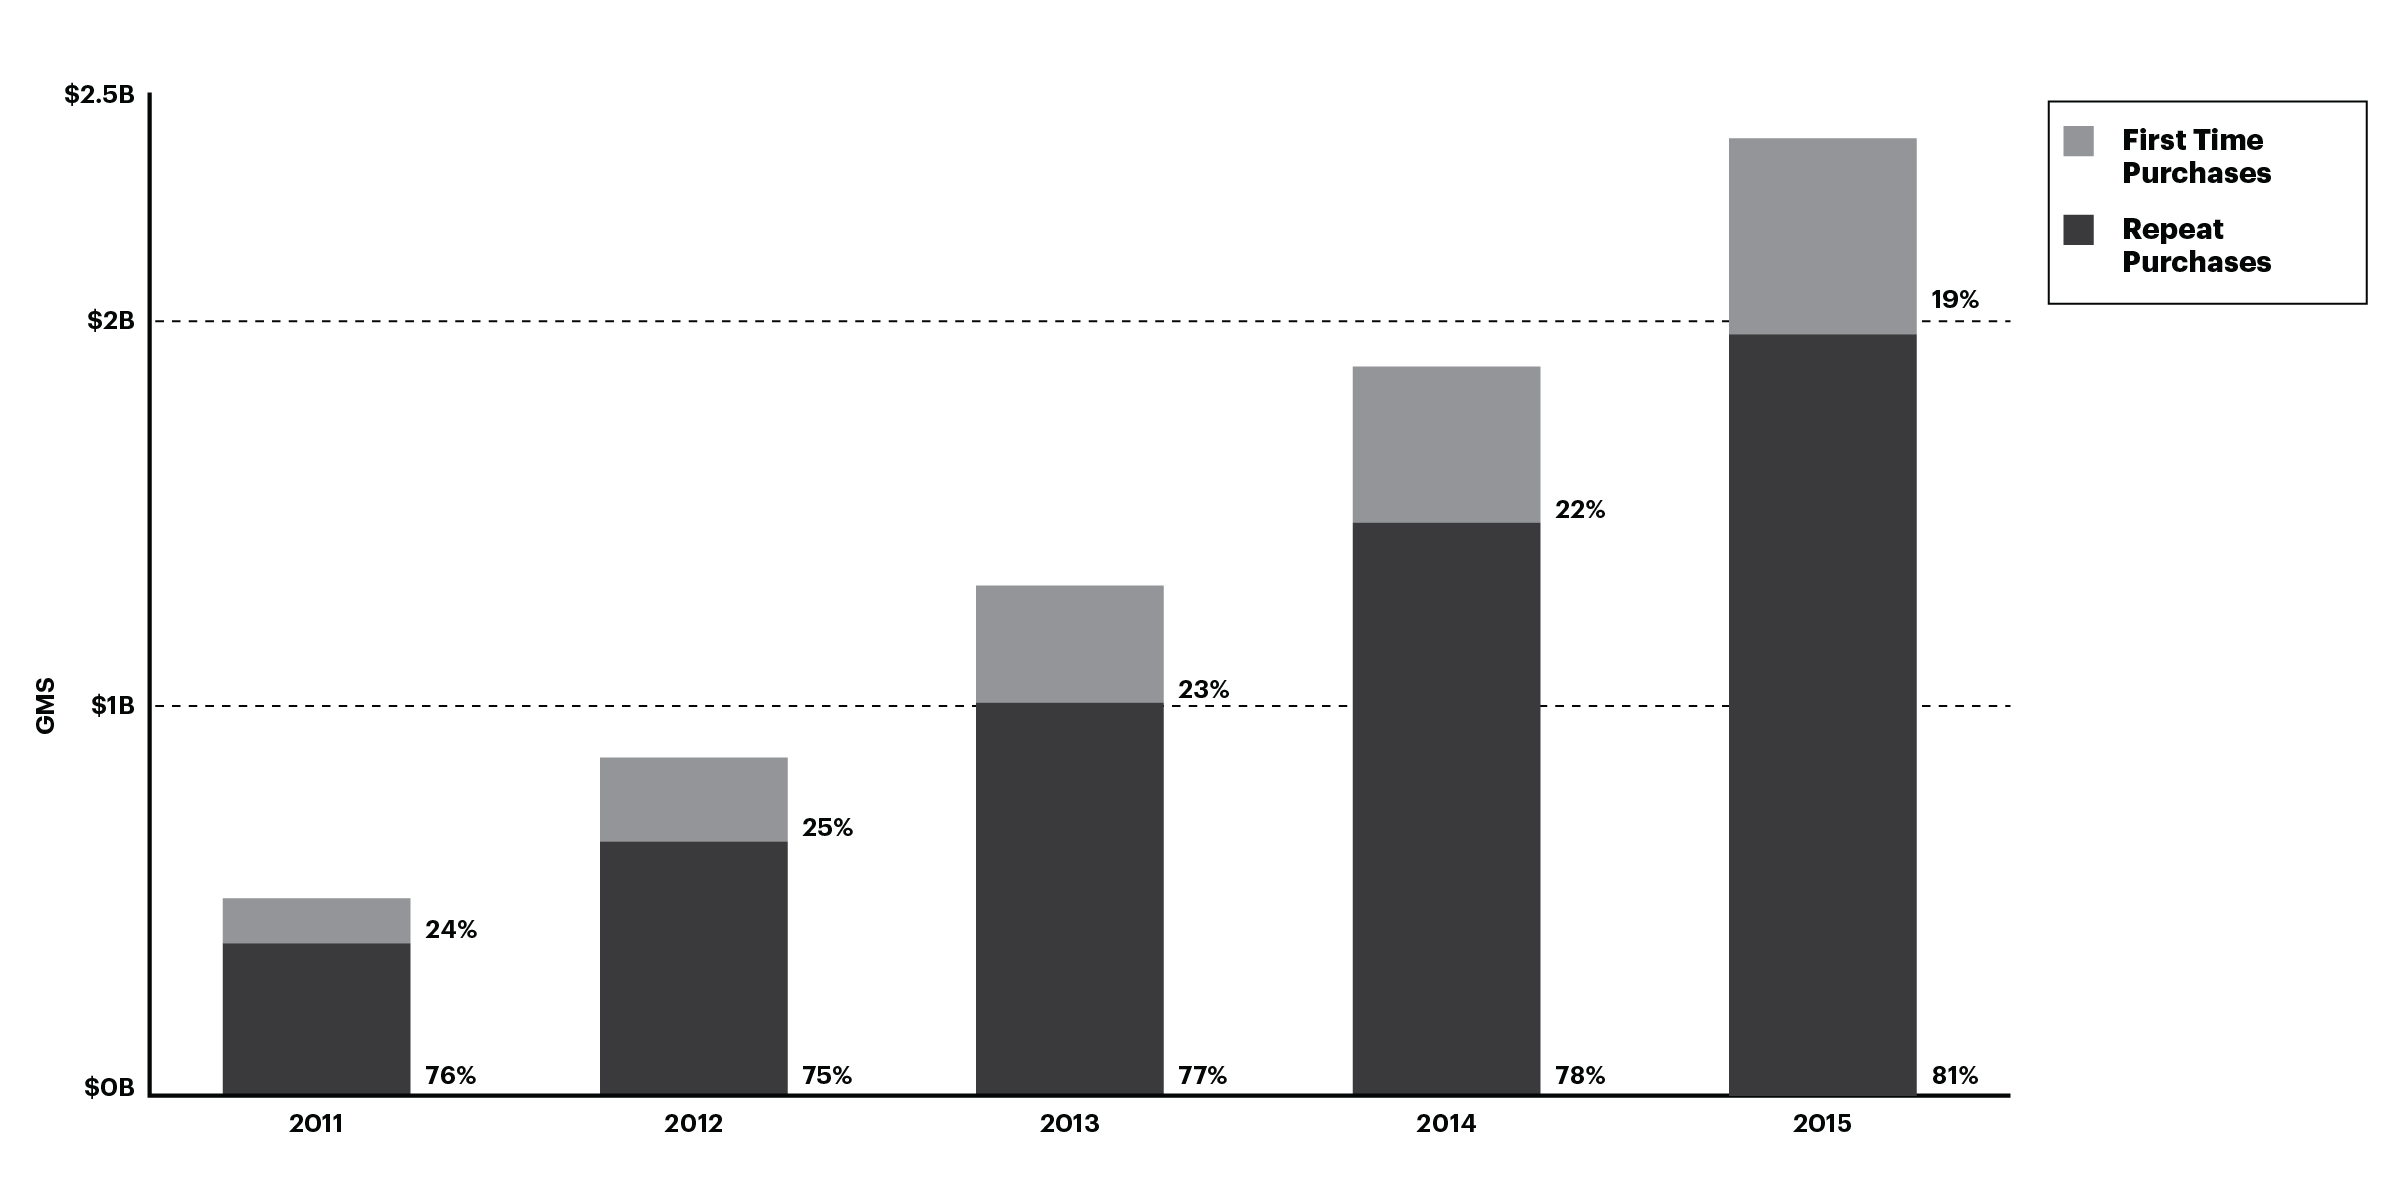
• | Repeat purchases demonstrate the loyalty of Etsy buyers. In 2015, 81% of our GMS came from repeat purchases. This was up from 78% in 2014. Also in 2015, approximately 47% of our active buyers made 2 or more purchases in the previous 12 months, up slightly from 2014. |
• | Unlike many other online commerce companies, the vast majority of visits come to Etsy from organic or direct sources. In 2015, 91% of visits came to Etsy.com from direct, organic or email sources. A visit represents activity from a unique browser or mobile app. A visit ends after 30 minutes of inactivity. |
• | Etsy sellers and Etsy buyers also spend time with each other. For example, they sent 234 million messages on our platform in 2015 using our Conversations tool. As of December 31, 2015, approximately 21% of active sellers belong to a self-organized Etsy Team, developing supportive personal relationships with other Etsy sellers as they build their independent creative businesses. Currently, over 12,000 Etsy Teams have formed around the world. |
The passion and loyalty demonstrated by Etsy sellers and Etsy buyers underlies the growth and scale of our platform. See “Management’s Discussion and Analysis of Financial Condition and Results of Operations—Key Factors Affecting Our Performance—Growth and Retention of Active Sellers and Active Buyers” for more information.
GMS Contribution by Purchase Type | ||||
8
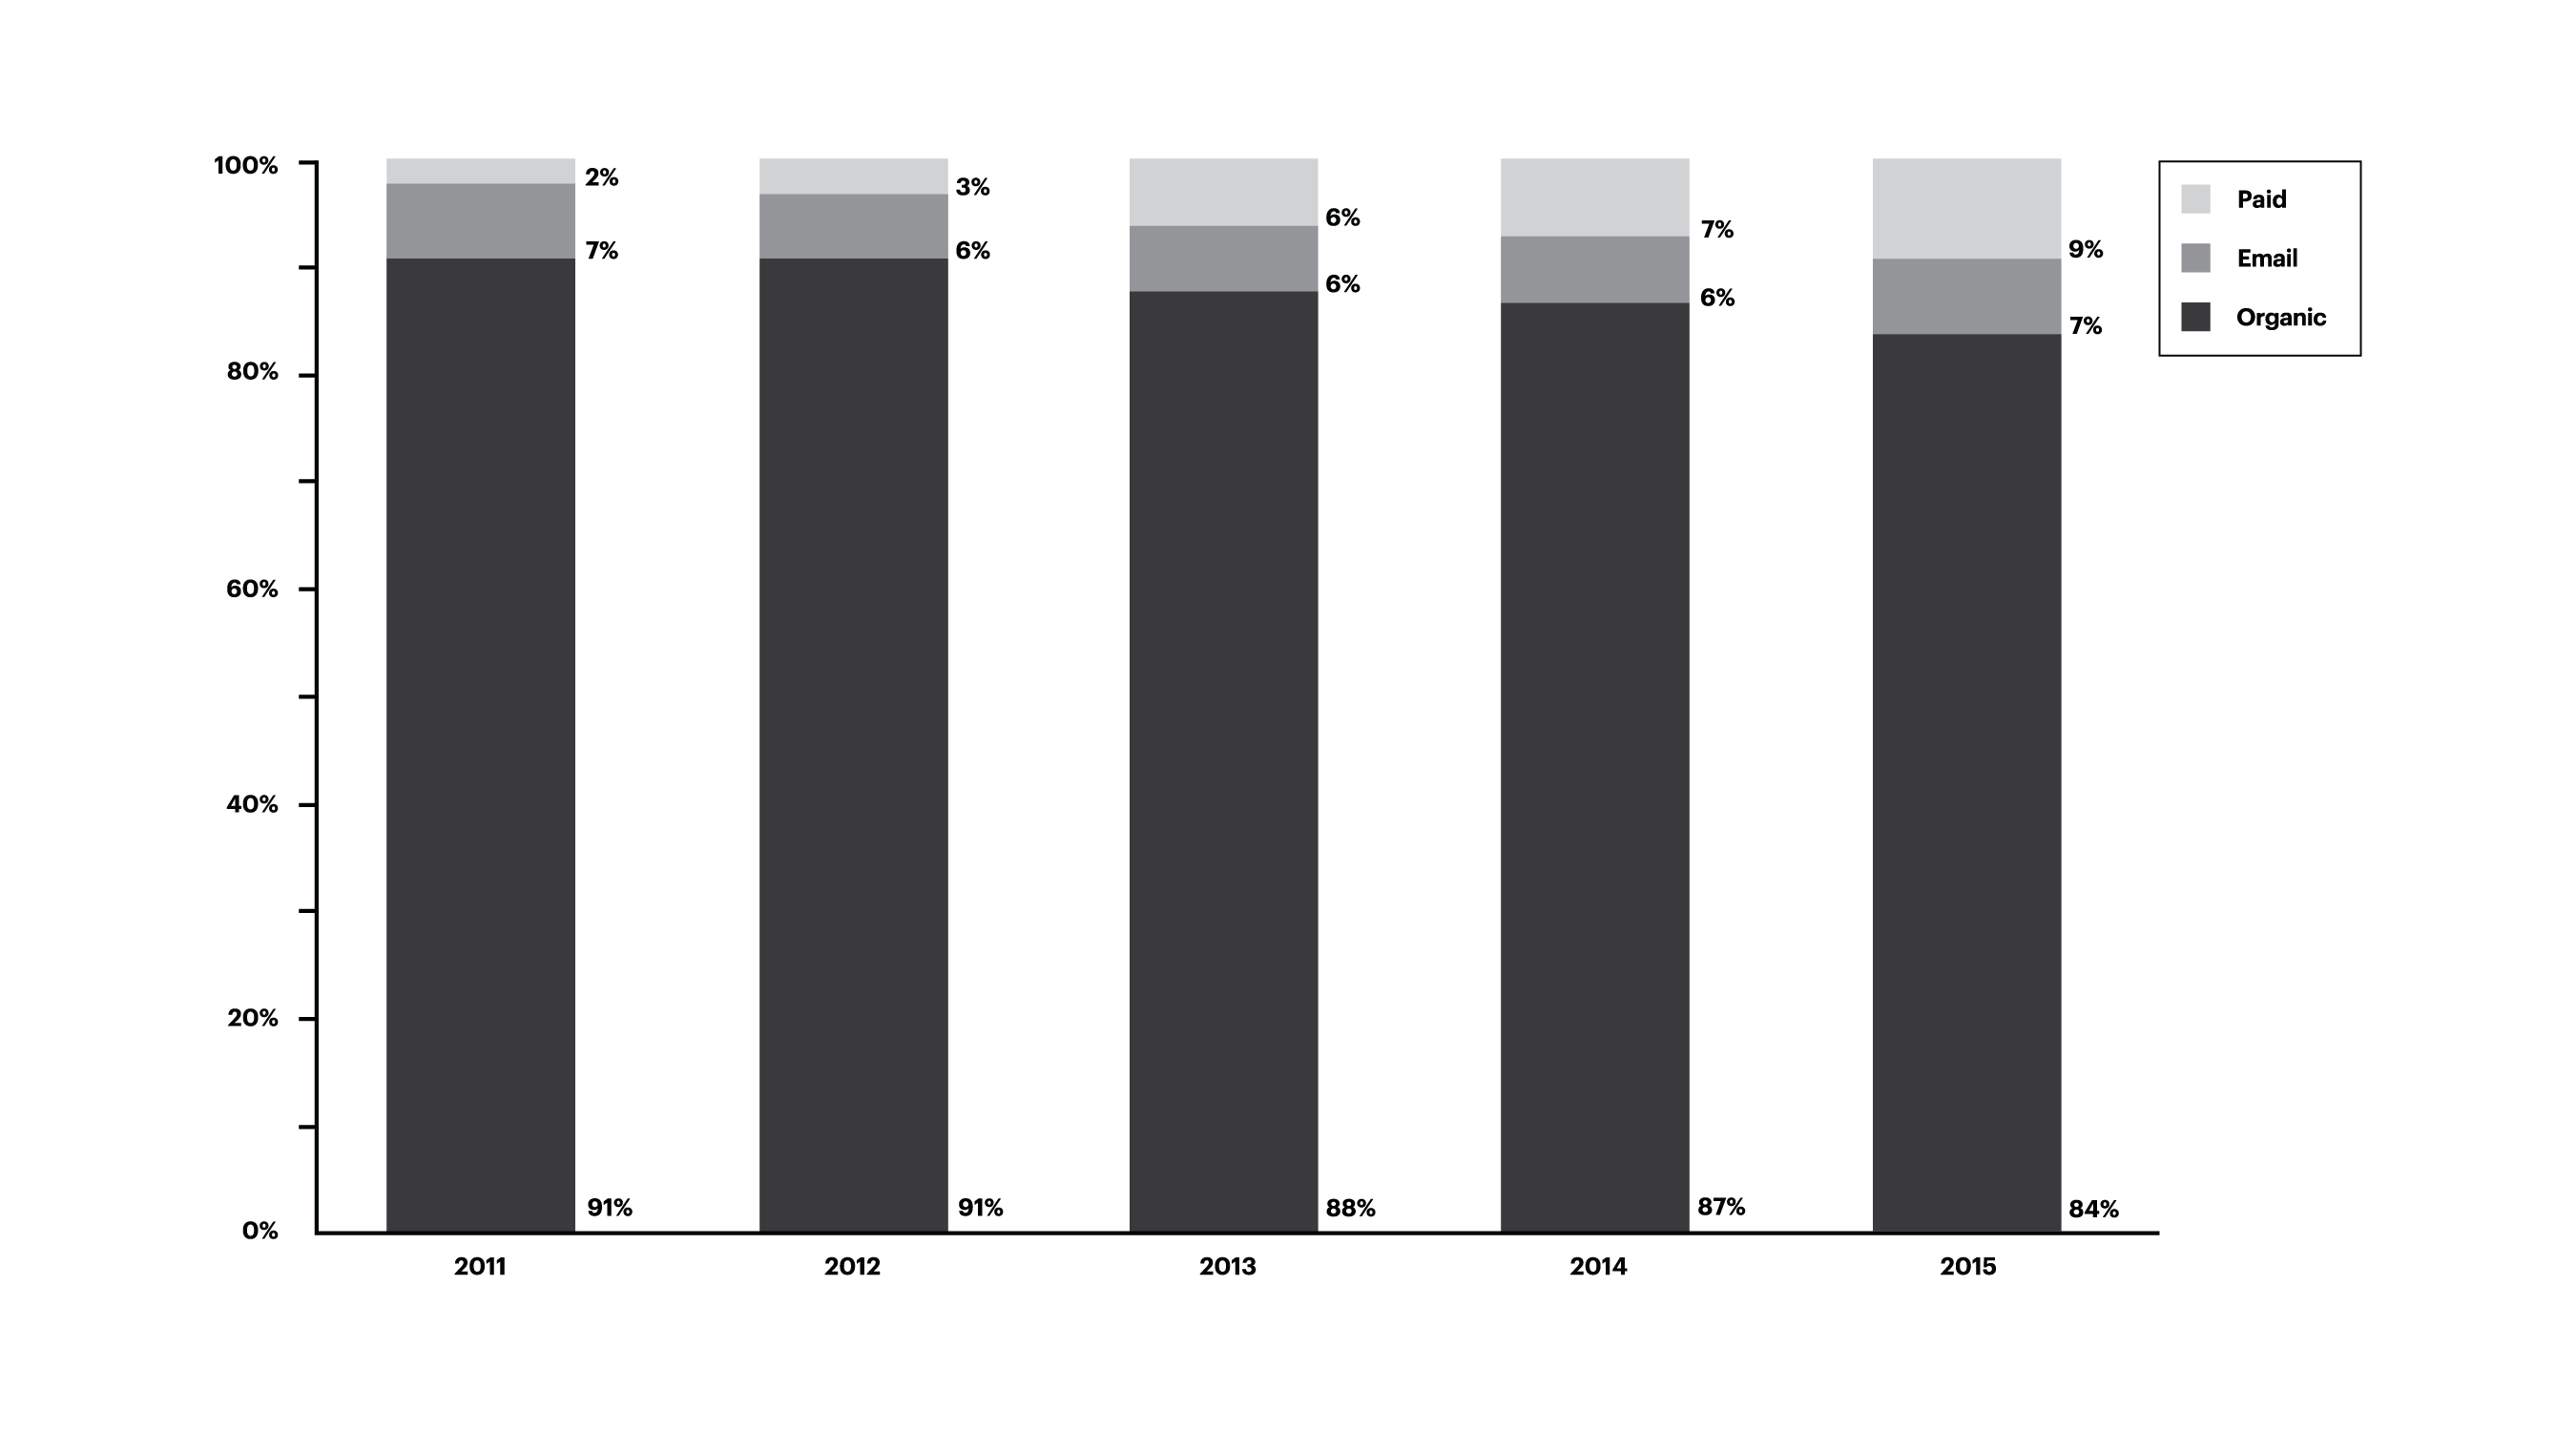
Visits Contribution by Source Type | ||||
Our Innovative Technology. Our widely-respected engineering team has built a sophisticated platform that enables millions of Etsy sellers and Etsy buyers to smoothly transact across borders, languages and devices. Our team is at the forefront of the software engineering practice of continuous deployment. We update our code as often as every 20 minutes, and as many as 70 times per day, with more than 12,000 deploys during the year ended December 31, 2015. To enhance the performance of our platform, we collect and analyze a large volume of data. For example, we currently collect more than two million discrete metrics, which we expect will increase as we grow. Further, in the field of search relevance and purchase recommendations, we currently collect and analyze more than 1,200 terabytes of data to calculate search and personalization relevance signals in real time to recommend goods to each prospective Etsy buyer from a broad inventory of unique goods.
Mobile commerce is increasingly important in online retail. For example, comScore has estimated that since the first quarter of 2013, consumers visiting online commerce sites spent more than half of their browsing time on mobile devices. However, spending via mobile devices represented only 16% of total online commerce dollars in the third quarter of 2015. We are a mobile-first company and have focused on expanding our mobile capabilities in recent years. We developed our “Sell on Etsy” mobile app to help the Etsy seller operate her shop and manage orders. Our mobile website and our “Buy on Etsy” mobile app for Etsy buyers, which we developed to keep Etsy buyers engaged wherever they are, includes search, discovery, curation, personalization and social shopping features, optimized for the mobile experience. During 2015, we continued to enhance our mobile app for Etsy buyers in many ways including adding new deep linking functionality, integrating social sign-up and sign-in, expanding our mobile payment and digital wallet options with Apple Pay, Google Wallet and others.
For the year ended December 31, 2015, approximately 60% of our visits and approximately 43% of our GMS were generated on a mobile device. This is a strong improvement compared with 2014, during which 54% of our visits and 37% of our GMS were generated on a mobile device. In addition, we are focused on continuing to narrow the gap between mobile visits and mobile GMS and we saw this metric improve in 2015.
Our Scaled, Global-Local Marketplace. Our marketplace is global-local, meaning that we focus on building local Etsy communities around the world. Etsy sellers and Etsy buyers in these local communities, in turn, have global reach and access through our platform. In particular, we seek to develop local markets in key countries outside the United States where we see both local buyer and seller activity. Currently, Etsy sellers and Etsy buyers are based in nearly every country in the world and our marketplace is available in 10 languages. In 2015, 29.8% of our GMS involved an Etsy seller or Etsy buyer outside of the United States. We believe our global-local marketplace creates strong competitive advantages outside the United States because our success is not dependent on scale in any given country; instead, the diverse location of Etsy sellers and Etsy buyers creates the scale, and a concentration of Etsy sellers and Etsy buyers in any given region can give rise to a vibrant local Etsy marketplace. During 2015, we launched several new features to support our global-local marketplace, including curated “Editor’s Picks” shopping pages and direct Etsy emails to buyers that are locally relevant to a specific region. To help Etsy
9
buyers who prefer to buy locally in Australia and the United Kingdom, we made it easier to find items from their home countries on our marketplace. We’re also focused on providing additional local payment options.
Our Seller-Aligned Business Model. Etsy sellers are drawn to our platform because we empower them to succeed, and as Etsy sellers succeed, so do we. Our seller-aligned business model creates network effects. The more we invest in our platform, the more we enable Etsy sellers to pursue their craft and grow their businesses and the easier we make it for Etsy buyers to find unique goods. We call this Etsy’s Empowerment Loop. Some 76% of Etsy sellers consider their Etsy shops to be businesses and 90% want to grow their businesses, as indicated by our 2014 Seller Survey. We focus on offering Seller Services that help an Etsy seller spend more of her time on her creative passion and less of her time on the administrative aspects of running a business. During the year ended December 31, 2015, 48.1% of Etsy sellers used at least one of our Seller Services. Similarly, our manufacturing and Wholesale programs enable an Etsy seller to grow her business on our platform.
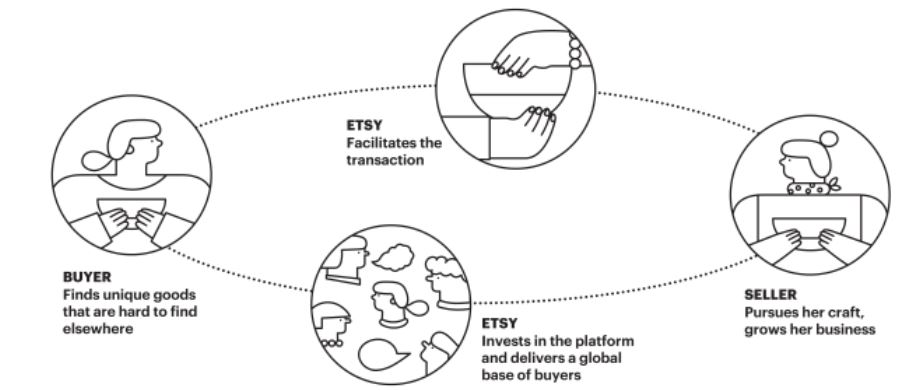
Etsy Empowerment Loop | ||||
Our Strategy: The Path Ahead
We have four key strategic priorities:
Make Etsy an Everyday Experience. The power of human connection is central to the Etsy experience. We emphasize relationships, connecting creative entrepreneurs to thoughtful consumers around the world and we continually strive to make those connections a daily habit for Etsy sellers and Etsy buyers.
The everyday experience starts with mobile. In 2015, approximately 60% of our visits and approximately 43% of our GMS were generated on a mobile device.
• | We strive to help the Etsy seller manage her shop, connect with Etsy buyers and sell her goods on our platform, all on her mobile device. We plan to bring the Etsy experience to local communities, using mobile technology to highlight Etsy sellers’ goods in nearby brick-and-mortar stores and crafts fairs. |
• | We strive to make it easy and fun for Etsy buyers to connect with Etsy sellers and to discover and purchase Etsy sellers’ unique goods, particularly though mobile devices. We plan to continue to improve Etsy buyers’ engagement with our community through enhanced content, search and discovery. We believe that improvements like these will be an important foundation for our future mobile development and enable us to continue to drive mobile app usage and narrow the gap between mobile visits and mobile GMS. |
Build Local Marketplaces, Globally. Our vision is global and local. In 2015, 31.3% of Etsy sellers were located outside the United States, and 29.8% of our GMS involved an Etsy seller or Etsy buyer outside of the United States. Although we promote cross-border transactions, our strategy is to build and deepen local Etsy communities around the world, each with its own ecosystem of Etsy sellers and Etsy buyers. For example, although GMS generated between a non-U.S. buyer and a non-U.S. seller both in the same country is a small percentage of our total GMS, excluding our French marketplace ALM, this GMS grew approximately 50% in 2015 compared with 2014. We plan to continue to invest in local marketing and content and other
10
locally-relevant tools and enhancements around the world to encourage these connections. We believe our locally-focused work will broaden the reach of our global platform.
Offer High-Impact Seller Services. Seller Services, such as Promoted Listings, Direct Checkout and Shipping Labels, help an Etsy seller spend more time on the pleasures of her craft and less time on the administrative aspects of her business. We launched our first seller service in late 2011 and in 2015 Seller Services represented $136.6 million, 49.9% of our revenue, a 65.6% increase over 2014, and $82.5 million, or 42.2% of total revenue in 2014, a 92.7% increase over 2013. According to our 2014 Seller Survey, for every hour that an Etsy seller spends making her products, she spends another hour doing business-related tasks, including inventory management, shipping, customer service, marketing and accounting. We intend to enhance existing Seller Services, extend their geographic reach and introduce new ones to increase the amount of time an Etsy seller can devote to her craft.
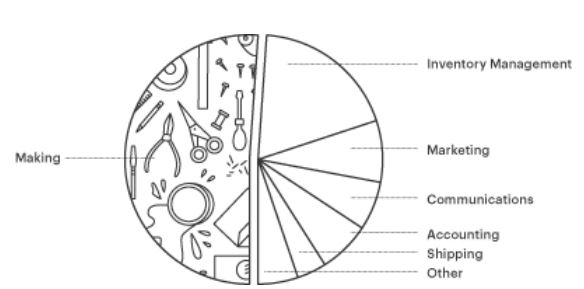
How an Etsy Seller Spends Her Time | ||||
Expand the Etsy Economy. We intend to fulfill our mission to reimagine commerce by expanding the impact of our platform. By further developing our manufacturing program, we believe we are helping Etsy sellers who want to grow their businesses connect with skilled partners, while helping to revitalize manufacturing in local communities. We will also continue to focus on our Wholesale offering, which we launched in August 2014, so that Etsy sellers can sell their products to select retail partners such as Land of Nod, Lou & Grey, Macy's and Whole Foods.
We plan to focus on strategic partnerships, technological advances and public-private endeavors such as our Craft Entrepreneurship program, which we believe will bring the benefit of the Etsy Economy to more people and more communities. Craft Entrepreneurship is an educational program intended to empower creative people in underserved communities with the resources to start and run an online business with Etsy and/or elsewhere. As of December 31, 2015, we’ve partnered with local organizations in 23 cities in Australia, Canada, the United States and the United Kingdom to provide Craft Entrepreneurship classes. We've committed to expand Craft Entrepreneurship to a total of 30 cities by June 2016.
Competition
We compete with retailers for the Etsy seller. An Etsy seller can list her goods for sale with online retailers or sell her goods through local consignment and vintage stores and other venues and marketplaces. She may also sell wholesale directly to traditional retailers, including large national retailers, who discover her goods in our marketplace or otherwise. We also compete with companies that sell software and services to small businesses, enabling an Etsy seller to sell from her own website or otherwise run her business independently of our platform. We are able to compete for Etsy sellers based on our brand awareness, the global scale of our marketplace and the breadth of our online presence, the number and engagement of Etsy buyers, our Seller Services, our seller education resources and tools, our policies and fees, our mobile apps, the strength of our community and our values.
We also compete with retailers for the attention of the Etsy buyer. An Etsy buyer has the choice of shopping with any online or offline retailer, whether large marketplaces or national retail chains or local consignment and vintage stores or other venues or marketplaces. We are able to compete for Etsy buyers based on the unique goods that Etsy sellers list in our marketplace, our brand awareness, the person-to-person commerce experience, our reputation as a trusted marketplace, our mobile apps, ease of payment and the availability and reliability of our platform.
11
Intellectual Property
Protection of our technology and intellectual property is an important component of our success. We rely on intellectual property laws, primarily including trade secret, copyright and trademark laws in the United States and abroad, and we use confidentiality procedures, non-disclosure agreements, invention assignment agreements and other contractual rights to protect our intellectual property.
While we have obtained or applied for patent protection for some of our intellectual property, we generally do not rely on patents as a principal means of protecting intellectual property. We register domain names, trademarks and service marks in the United States and abroad. We also rely upon common law protection for certain trademarks.
Circumstances beyond our control could pose a threat to our intellectual property rights. Effective intellectual property protection may not be available in the United States or other countries in which we operate. In addition, the efforts we have taken to protect our intellectual property rights may not be sufficient or effective. Any impairment of our intellectual property rights could harm our business, our ability to compete and our operating results.
Government Regulation
As with any company operating on the Internet, we grapple with a growing number of local, national and international laws and regulations. These laws are often complex, sometimes contradict other laws, and are frequently still evolving. Laws may be interpreted and enforced in different ways in various locations around the world, posing a significant challenge to our global business. For example, U.S. federal and state laws, EU directives, and other national laws govern the processing of payments, consumer protection and the privacy of consumer information; other laws define and regulate unfair and deceptive trade practices. Still other laws dictate when and how sales or other taxes must be collected. Laws of defamation apply online and vary by country. The growing regulation of e-commerce worldwide could impose additional compliance burdens and costs on us or on Etsy sellers, and could subject us to significant liability for any failure to comply. Additionally, because we operate internationally, we need to comply with various laws associated with doing business outside of the United States, including anti-money laundering, anti-corruption and export control laws.
Emerging Growth Company Status
We are an “emerging growth company,” as defined in the Jumpstart Our Business Startups Act of 2012, or the “JOBS Act.” We will remain an emerging growth company until the earlier of (1) the last day of the fiscal year (a) in 2020, which will follow the fifth anniversary of the completion of our initial public offering, (b) in which we have total annual gross revenue of at least $1.0 billion or (c) in which we become a large accelerated filer, which means that we have been public for at least 12 months, have filed at least one annual report and the market value of our common stock that is held by non-affiliates exceeds $700 million as of the last day of our then most recently completed second fiscal quarter, and (2) the date on which we have issued more than $1.0 billion in non-convertible debt during the prior three-year period.
The JOBS Act provides that an emerging growth company can delay adopting new or revised accounting standards until such time as those standards apply to private companies. We have irrevocably elected not to avail ourselves of this exemption and, therefore, we are subject to the same new or revised accounting standards as other public companies that are not emerging growth companies.
12
Available Information
We are subject to the informational requirements of the Securities Exchange Act of 1934, as amended, and file or furnish reports, proxy statements and other information with the Securities and Exchange Commission, or the “SEC”. Our Annual Report on Form 10-K, Quarterly Reports on Form 10-Q, Current Reports on Form 8-K, and amendments to these reports are available free of charge on our website at investors.etsy.com as soon as reasonably practicable after we have filed or furnished them to the SEC. The information on our website is not incorporated into this Annual Report on Form 10-K and investors should not rely on such information in deciding whether to invest in our common stock. Copies of our SEC reports and other documents are also available, without charge, by sending a letter to Investor Relations, Etsy, Inc., 55 Washington Street, Suite 512, Brooklyn, NY 11201, by sending an email to ir@etsy.com or by calling (347) 382-7582.
Additionally, our SEC reports may be read and copied at the SEC Public Reference Room at 100 F Street, NE, Washington, DC 20549. Information on the operation of the Public Reference Room may be obtained by calling (800) SEC-0330. Our SEC reports are also available on the SEC’s website at www.sec.gov free of charge as soon as reasonably practicable after we have filed or furnished them to the SEC.
For a summary of our financial information by geographic location, see "Note 13—Segment and Geographic Information" in the Notes to Consolidated Financial Statements. For information regarding our product development expenditures in the last three fiscal years, see “Management’s Discussion and Analysis of Financial Condition and Results of Operations—Results of Operations.”
13
Item 1A. Risk Factors.
Investing in our common stock involves a high degree of risk. You should consider carefully the risks and uncertainties described below, our consolidated financial statements and related notes, "Management’s Discussion and Analysis of Financial Condition and Results of Operations—Key Factors Affecting Our Performance" and the other information in this Annual Report on Form 10-K. If any of these risks actually occur, our business, financial condition, results of operations and prospects could be adversely affected. As a result, the price of our common stock could decline and you could lose part or all of your investment.
Risks Related to Our Business and Industry
We have a history of operating losses and we may not achieve or maintain profitability in the future.
We incurred net losses of $54.1 million, $15.2 million, and $0.8 million for the years ended December 31, 2015, 2014 and 2013, respectively. As of December 31, 2015, we had an accumulated deficit of $86.4 million. We may not achieve or maintain profitability in the future. We expect that our operating expenses will increase substantially as we hire additional employees, increase our marketing efforts, expand our operations and continue to invest in the development of our platform, including new services and features for our community. These efforts may be more costly than we expect and our revenue may not increase sufficiently to offset these additional expenses. In addition, our revenue may decline for a number of reasons, including those described in these Risk Factors.
Further, our revenue growth rate, particularly our marketplace revenue, may continue to decelerate in the future for a number of reasons, including the gradual deceleration of our GMS growth rate. For further information about the rate of revenue and GMS growth, see “Management’s Discussion and Analysis of Financial Condition and Results of Operations—Results of Operations—Revenue." You should not rely on growth rates of prior quarterly or annual periods as an indication of our future performance.
Our quarterly operating results may fluctuate, which could cause our stock price to decline.
Our quarterly operating results, as well as our key metrics, may fluctuate for a variety of reasons, many of which are beyond our control. These reasons include those described in these Risk Factors as well as the following:
• | fluctuations in revenue generated from Etsy sellers on our platform, including as a result of the seasonality of marketplace transactions and Etsy sellers’ use of Seller Services; |
• | our success in attracting and retaining Etsy sellers and Etsy buyers; |
• | the amount and timing of our operating expenses; |
• | the timing and success of new services and features we introduce; |
• | our success in executing on our four key strategies; |
• | the impact of competitive developments and our response to those developments; |
• | our ability to manage our existing business and future growth; |
• | disruptions or defects in our marketplace, such as privacy or data security breaches; |
• | the impact of our revised global corporate structure that was implemented on January 1, 2015; and |
• | economic and market conditions, such as currency fluctuations. |
Fluctuations in our quarterly operating results and key metrics may cause those results to fall below our own financial projections or the expectations of analysts or investors, which could cause the price of our common stock to decline. Fluctuations in our results could also cause a number of other problems. For example, analysts or investors might change their models for valuing our common stock, we could experience short-term liquidity issues, our ability to retain or attract key personnel may diminish and other unanticipated issues may arise.
14
In addition, we believe that our quarterly operating results and key metrics may vary in the future and that period-to-period comparisons of our operating results may not be meaningful. For example, our overall historical growth rate may have overshadowed the effect of seasonal variations on our historical operating results. These seasonal effects may become more pronounced over time, which could also cause our operating results and key metrics to fluctuate. You should not rely on the results of one quarter as an indication of future performance.
Our growth depends on our ability to attract and retain an active and engaged community of Etsy sellers and Etsy buyers.
Our financial performance has been and will continue to be significantly determined by our success in attracting and retaining active sellers and active buyers. For example, our revenue is driven by the number of active sellers, seller engagement, the number of active buyers, buyer engagement and our ability to maintain a trusted marketplace. We must continue to encourage Etsy sellers to list items for sale and use our Seller Services and encourage Etsy buyers to purchase items in our marketplace.
We believe that many new Etsy sellers and Etsy buyers find Etsy by word of mouth and other non-paid referrals from existing Etsy sellers and Etsy buyers. If existing Etsy sellers are dissatisfied with their experience on our platform, they may stop listing items in our marketplace and may stop referring others to us. Likewise, if existing Etsy buyers do not find our platform appealing, whether because of a negative experience, lack of buyer-friendly features, declining interest in the nature of the goods offered by Etsy sellers or other factors, they may make fewer purchases and they may stop referring others to us. Under these circumstances, we may have difficulty attracting new Etsy sellers and Etsy buyers without incurring additional marketing expense.
Even if we are able to attract new Etsy sellers and Etsy buyers to replace the ones that we lose, they may not maintain the same level of activity, and the revenue generated from new Etsy sellers and Etsy buyers may not be as high as the revenue generated from the ones who leave our marketplace. If we are unable to retain existing Etsy sellers and Etsy buyers and attract new Etsy sellers and Etsy buyers who contribute to an active community, our growth prospects could be harmed and our business could be adversely affected.
The trustworthiness of our marketplace and the connections within our community are important to our success. If we are unable to maintain them, our ability to attract and retain Etsy sellers and Etsy buyers could suffer.
We have built a trusted marketplace that embodies our values-based culture, emphasizing respect, direct communication and fun. Our reputation depends upon our Etsy sellers, their unique offerings and their adherence to our policies. We establish trust in our marketplace in a variety of ways. For example, our policies are designed to encourage transparency and clearly outline the rights and responsibilities of Etsy sellers, Etsy buyers, wholesale partners and manufacturing partners participating on our platform. We strive to give the Etsy buyer comfort that she is purchasing unique goods from a small business that adheres to certain principles. Our Integrity team uses a combination of machine learning, automated systems and community-generated flags to review items and shops that may violate our policies. We also have sophisticated tools to detect fraud and we strive to prohibit bad actors from using our platform. We ask our large wholesale retail partners to agree to the Etsy Wholesale Retailer Commitments, which are a set of guidelines to follow when working with Etsy sellers and are intended to foster relationships that lead to mutual success. In addition, manufacturers who apply to join Etsy Manufacturing must commit to ethical expectations and to operating a safe and just workplace, with transparency and reliable customer service.
Transparency is one of our core values and Etsy's transparency with our community helps to support the trustworthiness of our marketplace. For example, we publish an annual Progress Report that details our progress toward our ideals and shares our hopes for the years to come. In 2015, we also released a Transparency Report, which, among other things, describes the steps we take when items that do not meet our guidelines are listed on our platform, or when listed items are alleged to infringe third party rights.
We also establish trust by emphasizing the person behind every transaction. We deepen connections among members of our community through our direct communication tools, seller stories on our website and our in-person events, which highlight personal relationships as a key part of the Etsy experience. For example, Etsy sellers are encouraged to share their stories and use new tools, such as shop videos, to reach Etsy buyers on our platform and on social media. We also recognize that sometimes transactions don’t always go as planned. When that happens, our Case System provides a way for Etsy sellers and Etsy buyers to communicate with each other to resolve disputes.
We also encourage our employees to build meaningful connections with other members of our community. For example, each of our employees, including management, is expected to perform support rotations to help foster connections with Etsy sellers and Etsy buyers and to help us better understand their needs.
15
The trustworthiness of our marketplace and the connections among the members of our community are the cornerstones of our business. Many things could undermine these cornerstones, such as:
• | complaints or negative publicity about us, our platform, or our policies and guidelines, even if factually incorrect or based on isolated incidents; |
• | an inability to gain the trust of prospective buyers; |
• | lack of awareness of our policies; |
• | changes to our policies that members of our community perceive as inconsistent with our values or that are not clearly articulated; |
• | a failure to enforce our policies effectively, fairly and transparently, including, for example, by allowing the widespread listing of prohibited items in our marketplace; |
• | a failure to respond to feedback from our community; or |
• | a failure to operate our business in a way that is consistent with our values. |
If we are unable to maintain a trustworthy marketplace and encourage connections among members of our community, then our ability to attract and retain Etsy sellers and Etsy buyers could be impaired and our reputation and business could be adversely affected.
Adherence to our values and our focus on long-term sustainability may negatively influence our short- or medium-term financial performance.
Our values are integral to everything we do. Accordingly, we intend to focus on the long-term sustainability of our business,our ecosystem, and expanding the Etsy Economy, which is one of our key strategies. We may take actions that we believe will benefit our business and our ecosystem and, therefore, our stockholders over a longer period of time, even if those actions do not maximize short- or medium-term financial results. However, these longer-term benefits may not materialize within the timeframe we expect or at all. For example:
• | we may choose to prohibit the sale of items in our marketplace that we believe are inconsistent with our values even though we could benefit financially from the sale of those items; |
• | we may choose to revise our policies in ways that we believe will be beneficial to our community and our ecosystem in the long term even though the changes may be perceived unfavorably; or |
• | we may take actions, such as investing in alternative forms of shipping or locating our servers in low-impact data centers, that reduce our environmental footprint even though these actions may be more costly than other alternatives. |
We are a Certified B Corporation. The term “Certified B Corporation” does not refer to a particular form of legal entity, but instead refers to companies that are certified by B Lab, an independent nonprofit organization, as meeting rigorous standards of social and environmental performance, accountability and transparency. B Lab sets the standards for Certified B Corporation certification and may change those standards over time. These standards may not be appropriately tailored to the legal requirements of publicly-traded companies or to the operational requirements of larger companies. Our reputation could be harmed if we lose our status as a Certified B Corporation, whether by our choice or by our failure to meet B Lab’s certification requirements, if that change in status were to create a perception that we are more focused on financial performance and are no longer as committed to the values shared by Certified B Corporations. Likewise, our reputation could be harmed if our publicly reported B Corporation score declines and that created a perception that we have slipped in our satisfaction of the Certified B Corporation standards. Similarly, our reputation could be harmed if we take actions that are perceived to be misaligned with our values.
16
Expanding our community into markets outside of the United States is an important part of our strategy and the growth of our business could be harmed if our expansion efforts do not succeed.
Our vision is global and local and building local marketplaces globally is one of our key strategies. Although we have a significant number of Etsy sellers and Etsy buyers outside of the United States, we have limited experience in developing local markets outside the United States and may not execute our strategy successfully. Operating in markets outside of the United States also requires significant management attention, including managing and staffing operations over a broad geographic area with varying cultural norms and customs, and adapting our platform to local markets.
Despite our execution efforts, the nature of the goods that Etsy sellers list in our marketplace may not appeal to non-U.S. consumers in the same way as they do to consumers in the United States. In addition, non-U.S. buyers are not as familiar with our marketplace and brand as buyers in the United States and may not perceive us as relevant or trustworthy. Also, visits to our marketplace from Etsy buyers outside the United States may not convert into sales as often as visits from within the United States, including due to the impact of the strong U.S. dollar relative to other currencies and the fact that a majority of the goods listed on our marketplace are denominated in U.S. dollars. Our success in markets outside the United States will be linked to our ability to attract local Etsy sellers and Etsy buyers to our platform. If we are not able to expand into markets outside of the United States successfully, our growth prospects could be harmed.
Competition is also likely to intensify in the international markets where we operate and plan to expand our operations. Local companies based in markets outside the United States may have a substantial competitive advantage because of their greater understanding of, and focus on, those local markets. Some of our competitors may also be able to develop and grow in international markets more quickly than we will.
Continued expansion in markets outside of the United States may also require significant financial investment. These investments include marketing to attract and retain new Etsy sellers and Etsy buyers, developing localized services and payment processing functions, forming relationships with third-party service providers, supporting operations in multiple countries and potentially acquiring companies based outside the United States and integrating those companies with our operations. Our investment in markets outside of the United States may be more costly than we expect and our revenue may not increase sufficiently to offset these additional expenses.
Further expansion into markets outside of the United States will subject us to risks associated with operations abroad.
Doing business in markets outside of the United States subjects us to increased risks and burdens such as:
• | complying with different regulatory standards (particularly including those related to the use of personal information, payment processing, intellectual property, consumer protection and taxation of goods and services); |
• | fluctuations of foreign exchange rates; |
• | potentially heightened risk of fraudulent transactions; |
• | limitations on the repatriation of funds; |
• | exposure to liabilities under anti-corruption, anti-money laundering and export control laws, including the U.S. Foreign Corrupt Practices Act of 1977, as amended, the UK Bribery Act of 2010, trade controls and sanctions administered by the U.S. Office of Foreign Assets Control, and similar laws and regulations in other jurisdictions; |
• | varying levels of Internet, e-commerce and mobile technology adoption and infrastructure; |
• | our ability to enforce contracts and intellectual property rights in jurisdictions outside the United States; and |
• | barriers to international trade, such as tariffs or other taxes. |
Etsy sellers face similar risks in conducting their businesses across borders. Even if we are successful in managing the risks of conducting our business across borders, if Etsy sellers are not, our business could be adversely affected.
If we invest substantial time and resources to expand our operations outside of the United States and cannot manage these risks effectively, the costs of doing business in those markets may be prohibitive or our expenses may increase disproportionately to the revenue generated in those markets.
17
We expect to continue to increase our marketing efforts to help grow our business, but those efforts may not be effective at attracting new Etsy sellers and Etsy buyers and retaining existing Etsy sellers and Etsy buyers.
Maintaining and promoting awareness of our marketplace and broader platform is important to our ability to attract and retain Etsy sellers and Etsy buyers. We believe that much of the historical growth in the number of Etsy sellers and Etsy buyers has originated from word-of-mouth referrals and other organic means, as our historical marketing efforts and expenditures have been relatively limited. We intend to continue to invest significant resources in marketing, with a particular focus on bringing more Etsy buyers to our platform. We anticipate that our marketing initiatives may become increasingly expensive as competition increases, and generating a meaningful return on those initiatives may be difficult. Even if we successfully increase revenue as a result of these efforts, that additional revenue may not offset the expenses we incur.
The marketing efforts we implement may not succeed for a variety of reasons, including our inability to execute and implement our plans. External factors beyond our control may also impact the success of our marketing initiatives. Our marketing efforts currently include search engine marketing, affiliate marketing, and display advertising, as well as search engine optimization, social media usage, mobile “push” notifications and email. We obtain a significant number of visits via search engines such as Google, Bing and Yahoo!. Search engines frequently change the algorithms that determine the ranking and display of results of a user’s search and may make other changes to the way results are displayed, which can negatively affect the placement of links to our marketplace and, therefore, reduce the number of visits to our marketplace. The growing use of online ad-blocking software, including on mobile devices, may also impact the success of our marketing efforts because we may reach a smaller audience and fail to bring more Etsy buyers to our platform. We also obtain a significant number of visits through email advertising. If we are unable to successfully deliver emails to Etsy sellers and Etsy buyers, or if Etsy sellers and Etsy buyers do not open our emails, whether by choice, because those emails are marked as low priority or spam, or for other reasons, our business could be adversely affected. Social networking websites, such as Facebook and Pinterest, are another important source of visits to our marketplace. As online commerce and social networking continue to evolve, we must maintain a presence within these networks. We may be unable to develop or maintain such a presence.
Our payments system depends on third-party providers and is subject to evolving laws and regulations.
Etsy buyers primarily pay for purchases using Direct Checkout or PayPal. In the United States and other countries where Direct Checkout is available, Etsy buyers can use Direct Checkout on our platform to pay with credit cards, debit cards, bank transfers, PayPal, Apple Pay, Google Wallet and Etsy gift cards, rather than being directed to a third-party payment platform. A significant portion of our GMS is processed through Direct Checkout, and a portion of our revenue is derived from Direct Checkout.
We have engaged third-party service providers to perform underlying compliance, card processing, currency exchange, identity verification and fraud analysis services. If these service providers do not perform adequately or if our relationships with these service providers were to terminate, Etsy sellers’ ability to receive orders or payment could be adversely affected and our business would be harmed. In addition, if these providers increase the fees they charge us, our operating expenses could increase. Alternatively, if we respond by increasing the fees we charge to Etsy sellers, some Etsy sellers may stop using Direct Checkout, stop listing new items for sale or even close their accounts altogether.
The laws and regulations related to payments are complex and subject to change, and vary across different jurisdictions in the United States and globally. As a result, we are required to spend significant time and effort to comply with those laws and regulations. Any failure or claim of our failure to comply, or any failure by our third-party service providers to comply, could cost us substantial resources, could result in liabilities, or could force us to stop offering Direct Checkout. As we expand the availability of Direct Checkout or offer new payment methods to Etsy sellers and Etsy buyers in the future, we may become subject to additional regulations and compliance requirements.
Further, through our agreement with our third-party credit card processor, we are indirectly subject to payment card association operating rules and certification requirements, including the Payment Card Industry Data Security Standard, which are subject to change. We are also subject to rules governing electronic funds transfers. Any change in these rules and requirements could make it difficult or impossible for us to comply.
Our ability to expand our ecosystem is important to the growth of our business.
We spend substantial time and resources creating new offerings in order to add new members to our community, grow our ecosystem and open new sales channels for Etsy sellers. For example, in October 2013, we expanded our ecosystem by allowing Etsy sellers to apply to work with values-aligned manufacturers and in September 2015 we announced the preliminary
18
launch of Etsy Manufacturing, a marketplace to help Etsy sellers find and connect directly with manufacturers to form responsible partnerships.
Additionally, in August 2014, we added traditional retailers to our ecosystem with the launch of our Wholesale offering, which allows Etsy sellers to sell their products to retailers on our platform.
Our efforts to expand our ecosystem could fail for many reasons, including lack of acceptance of our offerings by existing or new members of our community, our failure to market our offerings effectively, defects or errors in our new offerings or negative publicity about us or our new offerings.
Diversifying our offerings, expanding our ecosystem and growing the Etsy Economy involve significant risk. For example, our initiatives may not drive increases in revenue, may require substantial investment and planning, and may bring us more directly into competition with companies that are better established or have greater resources than we do. We may be required to invest additional time and resources in the development and training of our existing community, particularly our employees who will help implement our expansion efforts. If we are unable to cost-effectively expand our ecosystem, then our growth prospects and competitive position may be harmed.
We must enhance our current offerings and develop new offerings to respond to the changing needs of Etsy sellers and Etsy buyers.
Our industry is characterized by rapidly changing technology, new service and product introductions and changing customer demands. We spend substantial time and resources understanding the needs of Etsy sellers and Etsy buyers and responding to them. For example, we enhance our Seller Services, search and discovery functionality and the member experience on a regular basis. We also focus on providing additional Seller Services and tools to help Etsy sellers manage and scale their businesses. For example, in 2015, we introduced calculated shipping, which helps automate the most time-consuming aspects of determining shipping costs for Etsy sellers. In addition, we enhanced Direct Checkout by integrating PayPal payments, which enables Etsy sellers to accept PayPal on our platform and reach more Etsy buyers. Offering high-impact Seller Services is one of our key strategies.
Etsy sellers and Etsy buyers may not be satisfied with our enhancements or new offerings or may perceive that these offerings do not respond to their needs. In addition, developing new services and features is complex, and the timetable for commercial release is difficult to predict and may vary from our historical experience. As a result, the introduction of new offerings may occur after anticipated release dates or they may be introduced as pilot programs, which may not be continued for various reasons. Our new offerings also may bring us more directly into competition with companies that are better established or have greater resources than we do.
If we do not continue to cost-effectively develop new offerings that satisfy Etsy sellers and Etsy buyers, then our competitive position and growth prospects may be harmed. In addition, new offerings may have lower margins than existing offerings and our revenue from the new offerings may not be enough to offset the cost of developing them.
If the mobile solutions available to Etsy sellers and Etsy buyers are not effective, the use of our platform could decline.
Making Etsy an everyday experience is one of our key strategies and starts with mobile. Visits and purchases made on mobile devices by consumers, including Etsy buyers, have increased significantly in recent years. The smaller screen size and reduced functionality associated with some mobile devices may make the use of our platform more difficult or less appealing. Visits to our marketplace on mobile devices may not convert into purchases as often as visits made through personal computers, which could result in less revenue for us. Etsy sellers are also increasingly using mobile devices to operate their businesses on our platform. If we are not able to deliver a rewarding experience on mobile devices, Etsy sellers’ ability to manage and grow their businesses may be harmed and, consequently, our business may suffer. Further, although we strive to provide engaging mobile experiences for both Etsy sellers and Etsy buyers who visit our mobile website using a browser on their mobile device, we depend on Etsy sellers and Etsy buyers downloading our mobile apps to provide them the optimal mobile experience.
As new mobile devices and mobile platforms are released, we may encounter problems in developing or supporting apps for them. In addition, supporting new devices and mobile device operating systems may require substantial time and resources.
The success of our mobile apps could also be harmed by factors outside our control, such as:
• | actions taken by providers of mobile operating systems or mobile app download stores; |
19
• | unfavorable treatment received by our mobile apps, especially as compared to competing apps, such as the placement of our mobile apps in a mobile app download store; |
• | increased costs to distribute or use our mobile apps; or |
• | changes in mobile operating systems, such as iOS and Android, that degrade the functionality of our mobile website or mobile apps or that give preferential treatment to competitive products. |
If Etsy sellers and Etsy buyers encounter difficulty accessing or using our platform on their mobile devices, or if they choose not to use our platform on their mobile devices, our growth prospects and our business may be adversely affected.
We rely on consumer discretionary spending and may be adversely affected by economic downturns and other macroeconomic conditions or trends.
Macroeconomic conditions may adversely affect our business. If general economic conditions deteriorate in the United States or other markets where we operate, consumer discretionary spending may decline and demand for the goods available in our marketplace may be reduced. This would cause sales in our marketplace to decline and adversely impact our business. Conversely, if recent trends supporting self-employment and the desire for supplemental income were to reverse, the number of Etsy sellers offering their goods in our marketplace could decline and the number of goods listed in our marketplace could decline. In addition, we believe that currency exchange rates impact our GMS, with a strong U.S. dollar dampening demand for goods denominated in U.S. dollars from buyers outside the United States. In 2015, approximately 90% of our GMS was denominated in U.S. dollars.
Even without changes in economic conditions, the demand for the goods listed in our marketplace is dependent on consumer preferences. Consumer preferences can change quickly and may differ across generations and cultures.
If demand for the goods that Etsy sellers offer in our marketplace declines, our business would be harmed. Trends in socially-conscious consumerism and buying locally could also shift or slow to the detriment of our business. Our growth prospects would also be hampered if the shift to online and mobile commerce does not continue.
We face intense competition and may not be able to compete effectively.
Our industry is highly competitive and we expect competition to increase in the future. To be successful, we need to attract and retain both Etsy sellers and Etsy buyers. As a result, we face competition from a wide range of online and offline competitors.
We compete with retailers for Etsy sellers. In addition to listing her goods for sale on Etsy, an Etsy seller can list her goods with other online retailers, such as Amazon, eBay or Alibaba, or sell her goods through local consignment and vintage stores and other venues or marketplaces. She may also sell wholesale directly to traditional retailers, including large national retailers, who discover her goods in our marketplace or otherwise. We also compete with companies that sell software and services to small businesses, enabling an Etsy seller to sell from her own website or otherwise run her business independently of our platform, such as Square, Intuit and Shopify.
We compete to attract, engage and retain Etsy sellers based on many factors, including:
• | our brand awareness; |
• | the global scale of our marketplace and the breadth of our online presence; |
• | the number and engagement of Etsy buyers; |
• | the extent to which our Seller Services can ease the administrative tasks that an Etsy seller might encounter in running her business, including through mobile apps; |
• | our seller education resources and tools; |
• | our policies and fees; |
• | the ability to scale her business through our manufacturing program; |
20
• | our mobile apps; |
• | the strength of our community; and |
• | our values. |
In addition, we compete with retailers for the attention of the Etsy buyer. An Etsy buyer has the choice of shopping with any online or offline retailer, whether large marketplaces, such as Amazon, eBay or Alibaba, or national retail chains, such as Pottery Barn or Target, or local consignment and vintage stores or other venues or marketplaces. Many of these competitors offer low-cost or free shipping, fast shipping times, favorable return policies and other features that may be difficult or impossible for Etsy sellers to match.
We compete to attract, engage and retain Etsy buyers based on many factors, including:
• | the unique goods that Etsy sellers list in our marketplace; |
• | our brand awareness; |
• | the person-to-person commerce experience; |
• | our reputation for trustworthiness; |
• | our mobile apps; |
• | ease of payment; and |
• | the availability and reliability of our platform. |
Many of our competitors and potential competitors have longer operating histories, greater resources, better name recognition or more customers than we do.
They may invest more to develop and promote their services than we do, and they may offer lower fees to sellers than we do. Further, our competitors could obtain preferential rates or shipping services, causing Etsy sellers and Etsy buyers to pay higher shipping costs or find alternative delivery services. Additionally, we believe that it is relatively easy for new businesses to create online commerce offerings or tools or services that enable entrepreneurship.
Local companies or more established companies based in markets where we operate outside of the United States may also have a better understanding of local customs, providing them a competitive advantage. For example, in certain markets outside the United States, we compete with smaller, but similar, local online marketplaces with a focus on unique goods that are attempting to attract sellers and buyers in those markets.
If we are unable to compete successfully, or if competing successfully requires us to expend significant resources in response to our competitors’ actions, our business could be adversely affected.
We rely on Etsy sellers to provide a fulfilling experience to Etsy buyers.
A small portion of Etsy buyers complain to us about their experience with our platform. For example, Etsy buyers may report that they have not received the items that they purchased, that the items received were not as represented by an Etsy seller or that an Etsy seller has not been responsive to their questions.
Although our Case System provides a way for Etsy sellers and Etsy buyers to communicate with each other to resolve disputes, negative publicity and sentiment generated as a result of these types of complaints could reduce our ability to attract and retain Etsy sellers and Etsy buyers or damage our reputation. A perception that our levels of responsiveness and support for Etsy sellers and Etsy buyers are inadequate could have similar results. In some situations, we may choose to reimburse Etsy buyers for their purchases to help avoid harm to our reputation, but we may not be able to recover the funds we expend for those reimbursements.
Anything that prevents the timely processing of orders or delivery of goods to Etsy buyers could harm Etsy sellers. Service interruptions and delivery delays may be caused by events that are beyond the control of Etsy sellers, such as interruptions in order or payment processing, transportation disruptions, natural disasters, inclement weather, terrorism, public health crises or
21
political unrest. Disruptions in the operations of a substantial number of Etsy sellers could also result in negative experiences for a substantial number of Etsy buyers, which could harm our reputation and adversely affect our business.
Our reputation may be harmed if members of our community use unethical business practices.
Our emphasis on our values makes our reputation particularly sensitive to allegations of unethical business practices by Etsy sellers or other members of our community. Our policies promote legal and ethical business practices, such as encouraging Etsy sellers to work only with manufacturers who do not use child or involuntary labor, who do not discriminate and who promote sustainability and humane working conditions. However, we do not control Etsy sellers or other members of our community or their business practices and cannot ensure that they comply with our policies. If members of our community engage in illegal or unethical business practices or are perceived to do so, we may receive negative publicity and our reputation may be harmed.
Failure to deal effectively with fraud could harm our business.
Although we have measures in place to detect and reduce the occurrence of fraudulent activity in our marketplace, those measures may not always be effective.
For example, Etsy sellers occasionally receive orders placed with fraudulent or stolen credit card data. Under current credit card practices, we could be held liable for orders placed through Direct Checkout with fraudulent credit card data even if the associated financial institution approved the credit card transaction. Although we attempt to detect or challenge fraudulent transactions, we may not be able to do so effectively. As a result, our business could be adversely affected. We could also incur significant fines or lose our ability to give the option of paying with credit cards if we fail to follow payment card industry data security standards or fail to limit fraudulent transactions conducted in our marketplace.
Negative publicity and sentiment resulting from fraudulent or deceptive conduct by members of our community or the perception that our levels of responsiveness and support for Etsy sellers and Etsy buyers are inadequate could reduce our ability to attract and retain Etsy sellers and Etsy buyers and damage our reputation.
If sensitive information about members of our community is misused or disclosed, or if we or our third-party providers are subject to cyber attacks, members of our community may curtail use of our platform, we may be exposed to liability and our reputation could suffer.
We collect, transmit and store personal and financial information provided by members of our community, such as names, email addresses, the details of transactions and credit card and other financial information. Some of our third-party service providers, such as identity verification and payment processing providers, also regularly have access to some confidential and sensitive data. In an effort to protect sensitive information, we rely on a variety of security measures, including encryption and authentication technology licensed from third parties. However, advances in computer capabilities, increasingly sophisticated tools and methods used by hackers and cyber terrorists, new discoveries in the field of cryptography or other developments may result in our failure or inability to adequately protect sensitive information. The preventive measures we take to address these risks are costly and may become more costly in the future.
Like all online services, our platform is vulnerable to power outages, telecommunications failures and catastrophic events, as well as computer viruses, break-ins, phishing attacks, denial-of-service attacks and other cyber attacks. Any of these incidents could lead to interruptions or shutdowns of our platform, loss of data or unauthorized disclosure of personally identifiable or other sensitive information. Cyber attacks could also result in the theft of our intellectual property. As we gain greater public visibility, we may face a higher risk of being targeted by cyber attacks. Advances in computer capabilities, new technological discoveries or other developments may result in cyber attacks becoming more sophisticated and more difficult to detect. We and our third-party service providers may not have the resources or technical sophistication to anticipate or prevent all such cyber attacks. Moreover, techniques used to obtain unauthorized access to systems change frequently and may not be known until launched against us or our third-party service providers. Security breaches can also occur as a result of non-technical issues, including intentional or inadvertent breaches by our employees or employees of our third-party service providers.
We and our third-party service providers regularly experience cyber attacks aimed at disrupting our and our third-party service providers’ services. If we or our third-party service providers experience security breaches that result in marketplace performance or availability problems or the loss or unauthorized disclosure of sensitive information, people may become unwilling to provide us the information necessary to set up an account with us. Existing Etsy sellers and Etsy buyers may stop listing new items for sale, decrease their purchases or close their accounts altogether. We could also face potential liability, costly remediation efforts and litigation, which may not be adequately covered by insurance. Any of these results could harm our growth prospects, our business and our reputation.
22
Our business depends on network and mobile infrastructure provided by third parties and on our ability to maintain and scale the technology underlying our platform.
The reliability of our platform is important to our reputation and our ability to attract and retain Etsy sellers and Etsy buyers. As the number of Etsy sellers and Etsy buyers, volume of traffic, number of transactions and the amount of information shared on our platform grow, our need for additional network capacity and computing power will also grow. The operation of the technology underlying our platform is expensive and complex, and we could experience operational failures. If we fail to accurately predict the rate or timing of the growth of our platform, we may be required to incur significant additional costs to maintain reliability.
We also depend on the development and maintenance of the Internet and mobile infrastructure. This includes maintenance of reliable Internet and mobile networks with the necessary speed, data capacity and security, as well as timely development of complementary products.
Third-party providers host much of our technology infrastructure. Any disruption in their services, or any failure of our providers to handle the demands of our marketplace could significantly harm our business. We exercise little control over these providers, which increases our vulnerability to their financial conditions and to problems with the services they provide. If we experience failures in our technology infrastructure or do not expand our technology infrastructure successfully, then our ability to attract and retain Etsy sellers and Etsy buyers could be adversely affected, which could harm our growth prospects and our business.
Our ability to recruit and retain employees is important to our success.
We strive to attract, retain and motivate employees, from our office administrators to our management team, who share our dedication to our community and our mission. As we continue to grow, we cannot guarantee we will continue to attract the employees we need to maintain our competitive position.
Some of the challenges we face in attracting and retaining employees include:
• | preserving our company culture as we grow; |
• | continuing to attract and retain employees who share our values; |
• | promoting existing employees into leadership positions to help sustain and grow our culture; |
• | hiring employees in multiple locations globally; |
• | responding to competitive pressures and changing business conditions in ways that do not divert us from our values; and |
• | integrating new personnel and businesses from acquisitions. |
Our ability to attract, retain and motivate employees, including our management team, is important to our success. In general, our employees, including our management team, work for us on an at-will basis. The unexpected loss of or failure to retain one or more of our key employees, such as our CEO or CFO, could adversely affect our business. Other companies, including our competitors, may be successful in recruiting and hiring our employees, and it may be difficult for us to find suitable replacements on a timely basis or on competitive terms.
Filling engineering, product management and other technical positions in the New York City area is particularly challenging, especially in light of our distinctive technology philosophy and engineering culture. Qualified individuals are limited and in high demand, and we may incur significant costs to attract, develop and motivate them. Even if we were to offer higher compensation and other benefits, people with suitable technical skills may choose not to join us or to continue to work for us. In addition, job candidates and existing employees often consider the value of the stock awards they receive in connection with their employment. If the perceived value of our stock awards declines, it may adversely affect our ability to recruit and retain highly skilled employees. If we are not able to maintain our engineering culture and broader company culture, then our ability to recruit and retain employees could suffer and our business would be harmed.
The growth of our business may strain our management team and our operational and financial infrastructure.
We have experienced rapid growth in our business, such as in headcount, the number of Etsy sellers and the number of countries in which we have Etsy sellers and Etsy buyers and we plan to continue to grow in the future, both in the United States
23
and abroad. For example, our headcount has grown from 251 employees on December 31, 2011 to 819 employees on December 31, 2015. The growth of our business places significant demands on our management team and pressure to expand our operational and financial infrastructure. As we continue to grow, our operating expenses will increase. If we do not manage our growth effectively, the increases in our operating expenses could outpace any increases in our revenue and our business could be harmed.
Continued growth could also pose other challenges, such as the need to develop and improve our operational, financial and management controls and to enhance our reporting systems and procedures. For example, over the past several years we have been implementing and refining an enterprise resource planning, or ERP, system to enhance a variety of important functions such as invoicing, accounts receivable, accounts payable, foreign currency translation, financial consolidation and internal and external financial and management reporting matters. ERP system implementations are complex, long-term projects that involve substantial expenditures. To fully realize the benefits of our ERP system we have made and may continue to make changes to our business and financial processes. Our business may be harmed if our ERP system does not function as expected or does not result in the expected benefits.
We may expand our business through acquisitions of other businesses, which may divert management’s attention and/or prove to be unsuccessful.
We have acquired a number of other businesses in the past and may acquire additional businesses or technologies in the future. For example, in April 2014 we acquired Jarvis Labs, Inc. (d/b/a Grand St.) and in June 2014 we acquired Incubart SAS (d/b/a A Little Market). Acquisitions may divert management’s time and focus from operating our business. Acquisitions also may require us to spend a substantial portion of our available cash, incur debt or other liabilities, amortize expenses related to intangible assets or incur write-offs of goodwill or other assets. In addition, integrating an acquired business or technology is risky. Completed and future acquisitions may result in unforeseen operational difficulties and expenditures associated with:
• | incorporating new businesses and technologies into our infrastructure; |
• | consolidating operational and administrative functions; |
• | coordinating outreach to our community; |
• | maintaining morale and culture and retaining and integrating key employees; |
• | maintaining or developing controls, procedures and policies (including effective internal control over financial reporting and disclosure controls and procedures); and |
• | assuming liabilities related to the activities of the acquired business before the acquisition, including liabilities for violations of laws and regulations, commercial disputes, taxes and other matters. |
Moreover, we may not benefit from our acquisitions as we expect, or in the time frame we expect. We also may issue additional equity securities in connection with an acquisition, which could cause dilution to our stockholders. Finally, acquisitions could be viewed negatively by analysts, investors or the members of our community.
Our business depends on continued and unimpeded access to the Internet and mobile networks.
Etsy sellers and Etsy buyers rely on access to the Internet or mobile networks to access our marketplace. Internet service providers may choose to disrupt or degrade access to our platform or increase the cost of such access. Mobile network operators or operating system providers could block or place onerous restrictions on the ability to download and use our mobile apps.
Internet service providers or mobile network operators could also attempt to charge us for providing access to our platform. In 2015, rules approved by the Federal Communications Commission went into effect that prohibit Internet service providers from charging content providers higher rates in order to deliver their content over certain “fast traffic” lanes; however, the rules are subject to pending legal challenges and if they are overturned, our business could be adversely impacted. Outside of the United States, government regulation of the Internet, including the idea of network neutrality, may be developing or non-existent. As a result, we could face discriminatory or anti-competitive practices that could impede both our and Etsy sellers’ growth prospects, increase our costs and harm our business.
24
Our business is subject to a large number of U.S. and non-U.S. laws, many of which are evolving.
We are subject to a variety of laws and regulations in the United States and around the world, including those relating to traditional businesses, such as employment laws and taxation, and newer laws and regulations focused on the Internet and online commerce, such as payment systems, privacy, anti-spam, data protection, electronic contracts, intellectual property and consumer protection. These laws and regulations are continuously evolving, and compliance is costly and can require changes to our business practices and significant management time and effort. Additionally, it is not always clear how existing laws apply to the Internet as many of these laws do not address the unique issues raised by the Internet or online commerce.
For example, laws relating to online privacy are evolving differently in different jurisdictions. Federal, state and non-U.S. governmental authorities, as well as courts interpreting the laws, continue to evaluate the privacy implications of the use of third-party “cookies,” “web beacons” and other methods of online tracking. The United States, the European Union and other governments have enacted or are considering legislation that could significantly restrict the ability of companies and individuals to collect and store user information, such as by regulating the level of consumer notice and consent required before a company can employ cookies or other electronic tracking tools.
Some providers of consumer devices and web browsers have implemented, or have announced plans to implement, ways to block tracking technologies which, if widely adopted, could also result in online tracking methods becoming significantly less effective. Any reduction in our ability to make effective use of such technologies could harm our ability to personalize the experience of Etsy buyers, increase our costs and limit our ability to attract and retain Etsy sellers and Etsy buyers on cost-effective terms. As a result, our business could be adversely affected.
In some cases, non-U.S. privacy, data protection, consumer protection, e-commerce and other laws and regulations are more restrictive than those in the United States and are enforced aggressively.
For example, the European Union traditionally has imposed stricter obligations and provided for more onerous penalties under such laws than the United States. Consequently, the expansion of our operations internationally may require changes to the ways we display, collect and use consumer information.
Existing and future laws and regulations enacted by federal, state or non-U.S. governments could impede the growth or use of the Internet or online commerce. It is also possible that governments of one or more countries may seek to censor content available on our platform or may even attempt to block access to our platform. If we are restricted from operating in one or more countries, our ability to attract and retain Etsy sellers and Etsy buyers may be adversely affected and we may not be able to grow our business as we anticipate.
We strive to comply with all applicable laws, but they may conflict with each other, and by complying with the laws or regulations of one jurisdiction, we may find that we are violating the laws or regulations of another jurisdiction. Despite our efforts, we may not have fully complied in the past and may not in the future. If we become liable under laws or regulations applicable to us, we could be required to pay significant fines and penalties, and we may be forced to change the way we operate. That could require us to incur significant expenses or to discontinue certain services, which could negatively affect our business.
Additionally, if third parties with whom we work violate applicable laws or our policies, those violations could result in other liabilities for us and could harm our business.
We may be subject to claims that items listed in our marketplace are counterfeit, infringing or illegal.
Although we do not create or take possession of the items listed in our marketplace by Etsy sellers, we frequently receive communications alleging that items listed in our marketplace infringe third-party copyrights, trademarks, patents or other intellectual property rights. We have intellectual property complaint and take-down procedures in place to address these communications, and we believe such procedures are important to promote confidence in our marketplace. We follow these procedures to review complaints and relevant facts to determine the appropriate action, which may include removal of the item from our marketplace and, in certain cases, closing the shops of Etsy sellers who repeatedly violate our policies.
Our procedures may not effectively reduce or eliminate our liability. In particular, we may be subject to civil or criminal liability for activities carried out by Etsy sellers on our platform, especially outside the United States where we may be less protected under local laws than we are in the United States. Under current U.S. copyright law and the Communications Decency Act, we may benefit from statutory safe harbor provisions that protect us from liability for content posted on our platform by Etsy sellers and Etsy buyers. However, trademark and patent laws do not include similar statutory provisions, and liability for these forms of intellectual property is often determined by court decisions. These safe harbors and court rulings
25
may change unfavorably. In that event, we may be held secondarily liable for the intellectual property infringement of Etsy sellers.
Regardless of the validity of any claims made against us, we may incur significant costs and efforts to defend against or settle them. If a governmental authority determines that we have aided and abetted the infringement or sale of counterfeit goods or if legal changes result in us potentially being liable for actions by Etsy sellers on our platform, we could face regulatory, civil or criminal penalties. Successful claims by third-party rights owners could require us to pay substantial damages or refrain from permitting any further listing of the relevant items. These types of claims could force us to modify our business practices, which could lower our revenue, increase our costs or make our platform less user-friendly. Moreover, public perception that counterfeit or other unauthorized items are common in our marketplace, even if factually incorrect, could result in negative publicity and damage to our reputation.
We may be subject to intellectual property claims, which are extremely costly to defend, could require us to pay significant damages and could limit our ability to use certain technologies in the future.
Companies in the Internet and technology industries are frequently subject to litigation based on allegations of infringement or other violations of intellectual property rights. We periodically receive communications that claim we have infringed, misappropriated or misused others’ intellectual property rights. To the extent we gain greater public recognition, we may face a higher risk of being the subject of intellectual property claims. Third-parties may have intellectual property rights that cover significant aspects of our technologies or business methods and prevent us from expanding our offerings. Any intellectual property claim against us, with or without merit, could be time consuming and expensive to settle or litigate and could divert the attention of our management. Litigation regarding intellectual property rights is inherently uncertain due to the complex issues involved, and we may not be successful in defending ourselves in such matters.
In addition, some of our competitors have extensive portfolios of issued patents. Many potential litigants, including some of our competitors and patent holding companies, have the ability to dedicate substantial resources to enforcing their intellectual property rights. Any claims successfully brought against us could subject us to significant liability for damages and we may be required to stop using technology or other intellectual property alleged to be in violation of a third party’s rights. We also might be required to seek a license for third-party intellectual property. Even if a license is available, we could be required to pay significant royalties or submit to unreasonable terms, which would increase our operating expenses. We may also be required to develop alternative non-infringing technology, which could require significant time and expense. If we cannot license or develop technology for any allegedly infringing aspect of our business, we would be forced to limit our service and may be unable to compete effectively. Any of these results could harm our business.
We may be involved in litigation matters that are expensive and time consuming.
In addition to intellectual property claims, we may become involved in other litigation matters, including class action lawsuits. For example, as described further in "Note 14—Commitments and Contingencies—Legal Proceedings" in the Notes to Consolidated Financial Statements, three purported securities class action lawsuits have been filed naming Etsy and certain of our officers and/or directors as defendants. Under certain circumstances, we have contractual and other legal obligations to indemnify and to incur legal expenses on behalf of current and former directors, officers, and underwriters, in connection with the litigation described in this Annual Report on Form 10-K and in connection with any future lawsuits. Any lawsuit to which we are a party, with or without merit, may result in an unfavorable judgment. We also may decide to settle lawsuits on unfavorable terms. Any such negative outcome could result in payments of substantial damages or fines, damage to our reputation or adverse changes to our offerings or business practices. Any of these results could adversely affect our business. In addition, defending claims is costly and can impose a significant burden on our management.
We may be unable to protect our intellectual property adequately.
Our intellectual property is an essential asset of our business. To establish and protect our intellectual property rights, we rely on a combination of trade secret, copyright, trademark and, to a lesser extent, patent laws, as well as confidentiality procedures and contractual provisions. The efforts we have taken to protect our intellectual property may not be sufficient or effective. We generally do not elect to register our copyrights or the majority of our trademarks, relying instead on the laws protecting unregistered intellectual property, which may not be sufficient. In addition, our copyrights and trademarks, whether or not registered, and patents may be held invalid or unenforceable if challenged. While we have obtained or applied for patent protection with respect to some of our intellectual property, we generally do not rely on patents as a principal means of protecting intellectual property. To the extent we do seek patent protection, any U.S. or other patents issued to us may not be sufficiently broad to protect our proprietary technologies.
26
In addition, we may not be effective in policing unauthorized use of our intellectual property. Even if we do detect violations, we may need to engage in litigation to enforce our intellectual property rights. Any enforcement efforts we undertake, including litigation, could be time-consuming and expensive and could divert our management’s attention. In addition, our efforts may be met with defenses and counterclaims challenging the validity and enforceability of our intellectual property rights or may result in a court determining that our intellectual property rights are unenforceable. If we are unable to cost-effectively protect our intellectual property rights, then our business could be harmed.
Our software is highly complex and may contain undetected errors.
The software underlying our platform is highly complex and may contain undetected errors or vulnerabilities, some of which may only be discovered after the code has been released. We rely heavily on a software engineering practice known as “continuous deployment,” meaning that we typically release software code many times per day. This practice may result in the more frequent introduction of errors or vulnerabilities into the software underlying our platform. Any errors or vulnerabilities discovered in our code after release could result in damage to our reputation, loss of our community members, loss of revenue or liability for damages, any of which could adversely affect our growth prospects and our business.
We are subject to the terms of open source licenses because our platform incorporates open source software.
The software powering our marketplace incorporates software covered by open source licenses. In addition, we regularly contribute source code to open source software projects and release internal software projects under open source licenses, and we anticipate doing so in the future. The terms of many open source licenses have not been interpreted by U.S. courts and there is a risk that the licenses could be construed in a manner that imposes unanticipated conditions or restrictions on our ability to operate our marketplace. Under certain open source licenses, we could be required to publicly release the source code of our software or to make our software available under open source licenses. To avoid the public release of the affected portions of our source code, we could be required to expend substantial time and resources to re-engineer some or all of our software. In addition, use of open source software can lead to greater risks than use of third-party commercial software because open source licensors generally do not provide warranties or controls on the origin of the software. Use of open source software may also present additional security risks because the public availability of such software may make it easier for hackers and other third parties to determine how to compromise our platform. Additionally, because any software source code we contribute to open source projects is publicly available, our ability to protect our intellectual property rights in such software source code may be limited or lost entirely, and we will be unable to prevent our competitors or others from using such contributed software source code. Any of these risks could be difficult to eliminate or manage and, if not addressed, could adversely affect our business, financial condition and results of operations.
Our business and our Etsy sellers and Etsy buyers may be subject to sales and other taxes.
The application of indirect taxes, such as sales and use tax, value-added tax, or VAT, provincial taxes, goods and services tax, business tax and gross receipt tax, to businesses like ours and to Etsy sellers and Etsy buyers is a complex and evolving issue. For example, as of January 1, 2015, the European Union imposed an obligation on us to collect and remit VAT on sales of automatically-downloaded digital items, and we have implemented such collection and remittance procedures. Significant judgment is required to evaluate applicable tax obligations and as a result amounts recorded are estimates and could change. In many cases, the ultimate tax determination is uncertain because it is not clear how existing statutes apply to our business or to Etsy sellers’ businesses. One or more states, the federal government or other countries may seek to impose additional reporting, record-keeping or indirect tax collection obligations on businesses like ours that facilitate online commerce. For example, the U.S. Congress is currently considering legislation, which would grant states the authority to require online merchants to collect sales tax on online sales at the time a transaction is completed. New taxes could also require us or Etsy sellers to incur substantial costs to capture data and collect and remit taxes. If such obligations were imposed, the additional costs associated with tax collection, remittance and audit requirements could make selling in our marketplace less attractive and more costly for Etsy sellers, which could adversely affect our business.
We may experience fluctuations in our tax obligations and effective tax rate.
We are subject to taxation in the United States and in numerous other jurisdictions. We record tax expense based on current tax payments and our estimates of future tax payments, which may include reserves for estimates of probable settlements of tax audits. At any one time, multiple tax years could be subject to audit by various taxing jurisdictions. As a result, we expect that throughout the year there could be ongoing variability in our quarterly tax rates as taxable events occur and exposures are re-evaluated. Further, our effective tax rate in a given financial statement period may be adversely impacted by changes in tax
27
laws, changes in the mix of revenue among different jurisdictions, changes to accounting rules and changes to our ownership or capital structure. Fluctuations in our tax obligations and effective tax rate could adversely affect our business.
In January 2015, we implemented a revised corporate structure to more closely align our structure with our global operations and future expansion plans outside of the United States. Our new corporate structure changed how we use our intellectual property and implemented certain intercompany arrangements. We believe this may result in a reduction in our overall effective tax rate over the long term and other operational efficiencies; however, the tax laws of the jurisdictions in which we operate are subject to interpretation, and their application may depend on our ability to operate our business in a manner consistent with our corporate structure. Moreover, these tax laws are subject to change. Tax authorities may disagree with our position as to the tax treatment of our transfer of intangible assets or determine that the manner in which we operate our business does not achieve the intended tax consequences. If our new corporate structure does not achieve our expectations for any of these or other reasons, we may be subject to a higher overall effective tax rate and our business may be adversely affected.
The terms of our debt instruments may restrict our ability to pursue our business strategies.
We do not currently have any obligations outstanding under our credit facility. However, our credit facility requires us to comply with various covenants that limit our ability to take actions such as:
• | disposing of assets; |
• | completing mergers or acquisitions; |
• | incurring additional indebtedness; |
• | encumbering our properties or assets; |
• | paying dividends or making other distributions; |
• | making specified investments; and |
• | engaging in transactions with our affiliates. |
These restrictions could limit our ability to pursue our business strategies. If we default under our credit facility and if the default is not cured or waived, the lenders could terminate their commitments to lend to us and cause any amounts outstanding to be payable immediately. Such a default could also result in cross defaults under other debt instruments. Moreover, any such default would limit our ability to obtain additional financing, which may have an adverse effect on our cash flow and liquidity.
We may need additional capital, which may not be available to us on acceptable terms or at all.
We believe that our existing cash and cash equivalents and short-term investments, together with cash generated from operations and available borrowing capacity under our credit facility, will be enough to meet our anticipated cash needs for at least the next 12 months. However, we may require additional cash resources due to changed business conditions or other developments, such as acquisitions or investments we may decide to pursue. We may seek to borrow funds under our credit facility or sell additional equity or debt securities. The sale of additional equity securities could result in dilution to our existing stockholders. Borrowing funds would result in increased debt service obligations and could result in additional operating and financial covenants that would limit our operations. It is also possible that financing may not be available to us in amounts or on terms acceptable to us, if at all.
If our insurance coverage is insufficient or our insurers are unable to meet their obligations, our insurance may not mitigate the risks facing our business.
Our insurance policies cover a number of risks and potential liabilities, such as general liability, property coverage, errors and omissions liability, employment liability, business interruptions, data breaches, crime, product liability and directors’ and officers’ liability. For certain types of business risk, we may not be able to, or may choose not to, acquire insurance. In addition, we may not obtain enough insurance to adequately mitigate the risks we face or we may have to pay high premiums and/or deductibles for the coverage we do obtain. Additionally, if any of our insurers becomes insolvent, it would be unable to pay any claims that we make.
28
We are an emerging growth company and the reduced disclosure requirements applicable to emerging growth companies may make our common stock less attractive to investors.
We are an emerging growth company as defined in the JOBS Act. For as long as we continue to be an emerging growth company, we intend to take advantage of some of the exemptions from the reporting requirements applicable to other public companies. For example, we intend to take advantage of the exemption from the auditor attestation requirements of Section 404 of the Sarbanes-Oxley Act of 2002, or the Sarbanes-Oxley Act, the reduced disclosure obligations regarding executive compensation in our periodic reports and proxy statements, and the exemptions from the requirements of holding a nonbinding advisory vote on executive compensation and stockholder approval of any golden parachute payments. It is possible that investors will find our common stock less attractive as a result of our reliance on these exemptions. If so, there may be a less active trading market for our common stock and our stock price may be more volatile.
We will remain an emerging growth company until the earlier of (1) the last day of the fiscal year (a) in 2020, which will follow the fifth anniversary of the completion of our initial public offering, (b) in which we have total annual gross revenue of at least $1.0 billion or (c) in which we become a large accelerated filer, which means that we have been a public company for at least 12 months, have filed at least one annual report and the market value of our common stock that is held by non-affiliates exceeds $700 million as of the last business day of our then most recently completed second fiscal quarter, and (2) the date on which we have issued more than $1.0 billion in non-convertible debt during the prior three-year period.
Operating as a public company requires us to incur substantial costs and requires substantial management attention. In addition, our management team has limited experience managing a public company.
As a public company, we incur substantial legal, accounting and other expenses that we did not incur as a private company. For example, we are subject to the reporting requirements of the Securities Exchange Act of 1934, as amended, or the Exchange Act, the applicable requirements of the Sarbanes-Oxley Act and the Dodd-Frank Wall Street Reform and Consumer Protection Act and the rules and regulations of the Securities and Exchange Commission, or the SEC. The rules and regulations of Nasdaq also apply to us. As part of these requirements, we have established and maintained effective disclosure and financial controls and made changes to our corporate governance practices. We expect that continued compliance with these requirements will increase our legal and financial compliance costs and will make some activities more time-consuming.
Most of our management and other personnel have little experience managing a public company and preparing public filings. In addition, our management and other personnel divert attention from other business matters to devote substantial time to the reporting and other requirements of being a public company. In particular, we expect to incur significant expense and devote substantial management effort to complying with the requirements of Section 404 of the Sarbanes-Oxley Act. We will need to continue to hire additional accounting and financial staff with appropriate public company experience and technical accounting knowledge.
Our management will not be required to evaluate the effectiveness of our internal control over financial reporting until December 31, 2016. If we are unable to maintain effective internal control over financial reporting, investors may lose confidence in the accuracy of our financial reports.
As a public company, we are required to maintain internal control over financial reporting and to report any material weaknesses in such internal controls. Section 404 of the Sarbanes-Oxley Act requires that we evaluate and determine the effectiveness of our internal control over financial reporting. Beginning with our annual report for the year ended December 31, 2016, we will be required to provide a management report on internal control over financial reporting. In preparation of being able to provide such a report, we continue to make progress in documenting, assessing and testing our internal control over financial reporting. When we are no longer an emerging growth company, our management report on internal control over financial reporting will need to be attested to by our independent registered public accounting firm. We do not expect to have our independent registered public accounting firm attest to our management report on internal control over financial reporting while we are an emerging growth company.
As described in Part II, Item 9A. "Controls and Procedures," we previously identified two material weaknesses in our internal control over financial reporting, which we remediated as of December 31, 2015.
If we have a material weakness in our internal control over financial reporting, in the future, we may not detect errors on a timely basis. In addition, material weaknesses could harm our operating results, cause us to fail to meet our SEC reporting obligations or Nasdaq listing requirements on a timely basis, adversely affect our reputation, cause our stock price to decline or result in inaccurate financial reporting or material misstatements in our annual or interim financial statements. Further, if there are material weaknesses or failures in our ability to meet any of the requirements related to the maintenance and reporting of
29
our internal controls, investors may lose confidence in the accuracy and completeness of our financial reports and that could cause the price of our common stock to decline. We could become subject to investigations by Nasdaq, the SEC or other regulatory authorities, which could require additional management attention and which could adversely affect our business.
In addition, our internal control over financial reporting will not prevent or detect all errors and fraud. Because of the inherent limitations in all control systems, no evaluation of controls can provide absolute assurance that misstatements due to error or fraud will not occur or that all control issues and instances of fraud will be detected.
Our business could be adversely affected by natural disasters, public health crises, political crises or other unexpected events.
Natural disasters and other adverse weather and climate conditions, public health crises, political crises, such as terrorist attacks, war and other political instability, or other unexpected events, could disrupt our operations, Internet or mobile networks, or the operations of one or more of our service providers. For example, when Hurricane Sandy struck New York in October 2012, although our data centers were unaffected, our headquarters in Brooklyn was closed for five days, and we experienced a heavy volume of support requests from Etsy sellers and Etsy buyers, which required us to devote additional resources to handle those requests. Events of this type could also impact Etsy sellers’ ability to continue producing goods for sale in our marketplace. In addition, such events could negatively impact consumer spending in the affected regions. If any of these events occurs, our business could be adversely affected.
Risks Related to Ownership of Our Common Stock
The price of our common stock has been and will likely continue to be volatile and declines in the price of common stock could subject us to litigation.
The price of our common stock has been and is likely to continue to be volatile. For example, since shares of our common stock were sold in our IPO in April 2015, our common stock's daily closing price on Nasdaq has ranged from a low of $6.36 to a high of $30.00 through February 26, 2016. The price of our common stock may fluctuate significantly for numerous reasons, many of which are beyond our control, such as:
• | variations in our operating results and other financial and operational metrics, including the key financial and operating metrics disclosed in this Annual Report, as well as how those results and metrics compare to analyst and investor expectations; |
• | forward-looking statements related to our financial projections, our failure to meet or exceed our financial projections, or changes in our financial projections; |
• | failure of analysts to initiate or maintain coverage of our company, changes in their estimates of our operating results or changes in recommendations by analysts that follow our common stock or a negative view of our financial projections; |
• | announcements of new services or enhancements, strategic alliances or significant agreements or other developments by us or our competitors; |
• | announcements by us or our competitors of mergers or acquisitions or rumors of such transactions involving us or our competitors; |
• | changes in our board of directors, management or other key personnel; |
• | disruptions in our marketplace due to hardware, software or network problems, security breaches or other issues; |
• | the strength of the global economy or the economy in the jurisdictions in which we operate, currency fluctuations, and market conditions in our industry and those affecting members of our community; |
• | trading activity by our principal stockholders, including upon the expiration of contractual lock-up agreements, and sales of large blocks of our common stock; |
• | the number of shares of our common stock that are available for public trading; |
30
• | litigation or other claims against us; |
• | the performance of the equity markets in general and in our industry; |
• | the operating performance of other similar companies; |
• | changes in legal requirements relating to our business; and |
• | any other factors discussed in this report. |
In addition, if the market for technology stocks or the stock market in general experiences a loss of investor confidence, the price of our common stock could decline for reasons unrelated to our business, results of operations or financial condition. Stock prices of many technology companies have historically been highly volatile. Some companies that have experienced volatility in the trading price of their stock have been the subject of securities class action litigation. For example, as described further in "Note 14—Commitments and Contingencies—Legal Proceedings" in the Notes to Consolidated Financial Statements, three purported securities class action lawsuits have been filed naming Etsy and certain of our officers and/or directors as defendants. We may experience more such litigation following future periods of volatility or declines in our stock price. Any securities litigation, could result in substantial costs and divert our management’s attention and resources, which could adversely affect our business.
If analysts do not publish research about our business, or if they publish inaccurate or unfavorable research, our stock price and trading volume could decline.
The trading market for our common stock depends in part on the research and reports that analysts publish about our business. We do not have any control over these analysts. If one or more of the analysts who cover us downgrade our common stock or publish inaccurate or unfavorable research about our business, the price of our common stock would likely decline. If few analysts cover us, demand for our common stock could decrease and our common stock price and trading volume may decline. Similar results may occur if one or more of these analysts stop covering us in the future or fail to publish reports on us regularly.
We do not intend to pay dividends on our capital stock, so any returns will be limited to increases in the value of our common stock.
We have never declared or paid any cash dividends on our capital stock. We currently anticipate that we will retain future earnings for the operation and expansion of our business and do not anticipate declaring any dividends in the foreseeable future. In addition, our ability to pay cash dividends on our capital stock is restricted by the terms of our credit facility. As a result, stockholders will not receive dividends or other distributions and may only receive a return on their investment if the trading price of our common stock increases.
Sales of a substantial number of shares of our common stock in the public market by our existing stockholders could cause the price of our common stock to decline.
Sales of a substantial number of shares of our common stock in the public market, or the perception that these sales might occur, could depress the price of our common stock and could impair our ability to raise capital through the sale of additional equity securities. We cannot predict the effect that sales may have on the prevailing price of our common stock.
All of our executive officers and directors and certain major holders of our capital stock entered into lock-up agreements with the underwriters of our initial public offering that restrict these stockholders’ ability to transfer a portion of their shares of our common stock for a period of 360 days following our initial public offering. Approximately 21.9 million shares are still subject to lock-up agreements and will become eligible for sale on April 10, 2016.
These shares will be able to be freely sold in the public market upon issuance to the extent permitted by any applicable vesting requirements and the lock-up agreements described above. Sales of stock by these stockholders could adversely affect the trading price of our common stock.
Additionally, certain holders of shares of our common stock have registration rights. Registration of these shares under the Securities Act would result in the shares becoming freely tradable without restriction under the Securities Act, except for shares
31
held by our affiliates as defined in Rule 144 under the Securities Act. Sales of securities by any of these stockholders could adversely affect the trading price of our common stock.
Future sales and issuances of our common stock or rights to purchase common stock could result in additional dilution to our stockholders and could cause the price of our common stock to decline.
We may issue additional common stock, convertible securities or other equity in the future. We also issue common stock to our employees, directors and other service providers pursuant to our equity incentive plans. Such issuances could be dilutive to investors and could cause the price of our common stock to decline. New investors in such issuances could also receive rights senior to those of current stockholders.
We have broad discretion in the use of our cash resources and may not use them effectively.
We currently intend to use our cash resources for working capital and general corporate purposes, including continued investments in the growth of our business. Our management has broad discretion in the allocation and use of our cash resources. The failure by our management to allocate or use these funds effectively could harm our business. Pending their use, we may invest these funds in a manner that does not produce income or that loses value. Our ultimate use of the net proceeds from our initial public offering may vary substantially from their original intended use.
Anti-takeover provisions in our charter documents and under Delaware law could make an acquisition of our company more difficult, could limit attempts to make changes in our management and could depress the price of our common stock.
Provisions in our certificate of incorporation and bylaws may have the effect of delaying or preventing a change in control of our company or limiting changes in our management. Among other things, these provisions:
• | provide for a classified board of directors so that not all members of our board of directors are elected at one time; |
• | permit our board of directors to establish the number of directors and fill any vacancies and newly created directorships; |
• | provide that directors may only be removed for cause; |
• | require super-majority voting to amend some provisions in our certificate of incorporation and bylaws; |
• | authorize the issuance of “blank check” preferred stock that our board of directors could use to implement a stockholder rights plan; |
• | eliminate the ability of our stockholders to call special meetings of stockholders; |
• | prohibit stockholder action by written consent, which means all stockholder actions must be taken at a meeting of our stockholders; |
• | provide that our board of directors is expressly authorized to amend or repeal any provision of our bylaws; |
• | restrict the forum for certain litigation against us to Delaware; and |
• | require advance notice for nominations for election to our board of directors or for proposing matters that can be acted upon by stockholders at annual stockholder meetings. |
These provisions may delay or prevent attempts by our stockholders to replace members of our management by making it more difficult for stockholders to replace members of our board of directors, which is responsible for appointing the members of our management. In addition, Section 203 of the Delaware General Corporation Law may delay or prevent a change in control of our company. Section 203 imposes certain restrictions on mergers, business combinations and other transactions between us and holders of 15% or more of our common stock. Anti-takeover provisions could depress the price of our common stock by acting to delay or prevent a change in control of our company.
32
Our certificate of incorporation provides that the Court of Chancery of the State of Delaware is the exclusive forum for substantially all disputes between us and our stockholders, which could limit our stockholders’ ability to obtain a favorable judicial forum for disputes with us or our directors, officers or employees.
Our certificate of incorporation provides that the Court of Chancery of the State of Delaware is the exclusive forum for any derivative action or proceeding brought on our behalf, any action asserting a breach of fiduciary duty, any action asserting a claim against us arising pursuant to the Delaware General Corporation Law, our certificate of incorporation or our bylaws or any action asserting a claim against us that is governed by the internal affairs doctrine. This choice of forum provision may limit a stockholder’s ability to bring a claim in a judicial forum that it finds favorable for disputes with us or our directors, officers or other employees and may discourage these types of lawsuits. Alternatively, if a court were to find the choice of forum provision contained in our certificate of incorporation to be inapplicable or unenforceable in an action, we may incur additional costs associated with resolving such action in other jurisdictions.
Item 1B. Unresolved Staff Comments.
None.
Item 2. Properties.
Our headquarters are located in Brooklyn, New York where we occupy approximately 104,493 square feet under a lease that expires in 2016. We use these facilities for our principal administration, technology and development and engineering activities. Our European headquarters are located in Dublin, Ireland.
In May 2014, we signed a lease for new corporate headquarters in Brooklyn, which we expect to occupy in 2016. The lease covers two buildings totaling approximately 198,635 square feet and will expire approximately ten years from the later to occur of the two buildings’ lease commencement dates. We expect that our new space will allow us to grow our local staff, will be LEED-certified and will support our efforts to reduce our environmental footprint.
We also have offices in San Francisco, Hudson (New York), London, Dublin, Paris, Berlin, Melbourne, Toronto and Tokyo.
We believe that our current facilities are suitable and adequate to meet our ongoing needs and that, if we require additional space, we will be able to obtain additional facilities.
Item 3. Legal Proceedings.
See "Note 14—Commitments and Contingencies—Legal Proceedings" in the Notes to Consolidated Financial Statements.
Item 4. Mine Safety Disclosures.
Not applicable.
33
PART II.
Item 5. Market for Registrant’s Common Equity, Related Stockholder Matters and Issuer Purchases of Equity Securities.
Market for Etsy's Common Stock
Our common stock has been listed on the Nasdaq Global Select Market under the symbol "ETSY" since April 16, 2015. Prior to that date, there was no public trading market for our common stock. The following table sets forth the high and low intra-day sales price per share of our common stock as reported by Nasdaq:
2015 | |||||||
High | Low | ||||||
Second Quarter (beginning April 16, 2015) | $ | 35.74 | $ | 13.78 | |||
Third Quarter | 23.44 | 11.85 | |||||
Fourth Quarter | 15.11 | 7.91 | |||||
Holders of Record
As of the close of business on February 26, 2016, there were approximately 352 stockholders of record of our common stock. The number of stockholders of record is based upon the actual number of holders registered on this date and does not include holders of common stock in “street name” by brokers or other entities on behalf of stockholders.
Dividend Policy
We have never declared or paid cash dividends on our capital stock. We intend to retain all available funds and any future earnings and do not anticipate paying any cash dividends in the foreseeable future. Any future decision to declare cash dividends will be made at the discretion of our board of directors, subject to applicable laws, and will depend on a number of factors, including our financial condition, results of operations, capital requirements, contractual restrictions, general business conditions and other factors that our board of directors thinks are relevant. In addition, our ability to pay cash dividends is limited by the terms of our Credit Agreement. See “Management’s Discussion and Analysis of Financial Condition and Results of Operations—Liquidity and Capital Resources—Sources of Liquidity” for additional information about our Credit Agreement.
Unregistered Sales of Equity Securities
In the three months ended December 31, 2015, we issued and sold an aggregate of 96,869 shares of our common stock upon the net exercise of warrants to purchase 105,099 shares of our common stock. The shares of common stock were issued pursuant to Section 3(a)(9) of the Securities Act.
Use of Proceeds
On April 21, 2015, we closed the initial public offering of our common stock at a price to the public of $16.00 per share. The offer and sale of all of the shares in our initial public offering were registered under the Securities Act pursuant to a registration statement on Form S-1 (File No. 333-202497), which was declared effective by the U.S. Securities and Exchange Commission, or "SEC," on April 15, 2015.
The remainder of the information required by this item regarding the use of our initial public offering proceeds has been omitted pursuant to SEC rules because such information has not changed since our last periodic report was filed.
34
Performance Graph
The following graph shows a comparison from April 16, 2015 (the date our common stock commenced trading on Nasdaq), through December 31, 2015, of the cumulative total returns for our common stock, the Nasdaq Composite Index and the Russell 2000 Index. The graph assumes $100 was invested at the market close on April 16, 2015 in the common stock of Etsy, Inc. Such returns are based on historical results and are not intended to suggest future performance. The Nasdaq Composite Index and Russell 2000 Index assume reinvestment of any dividends.
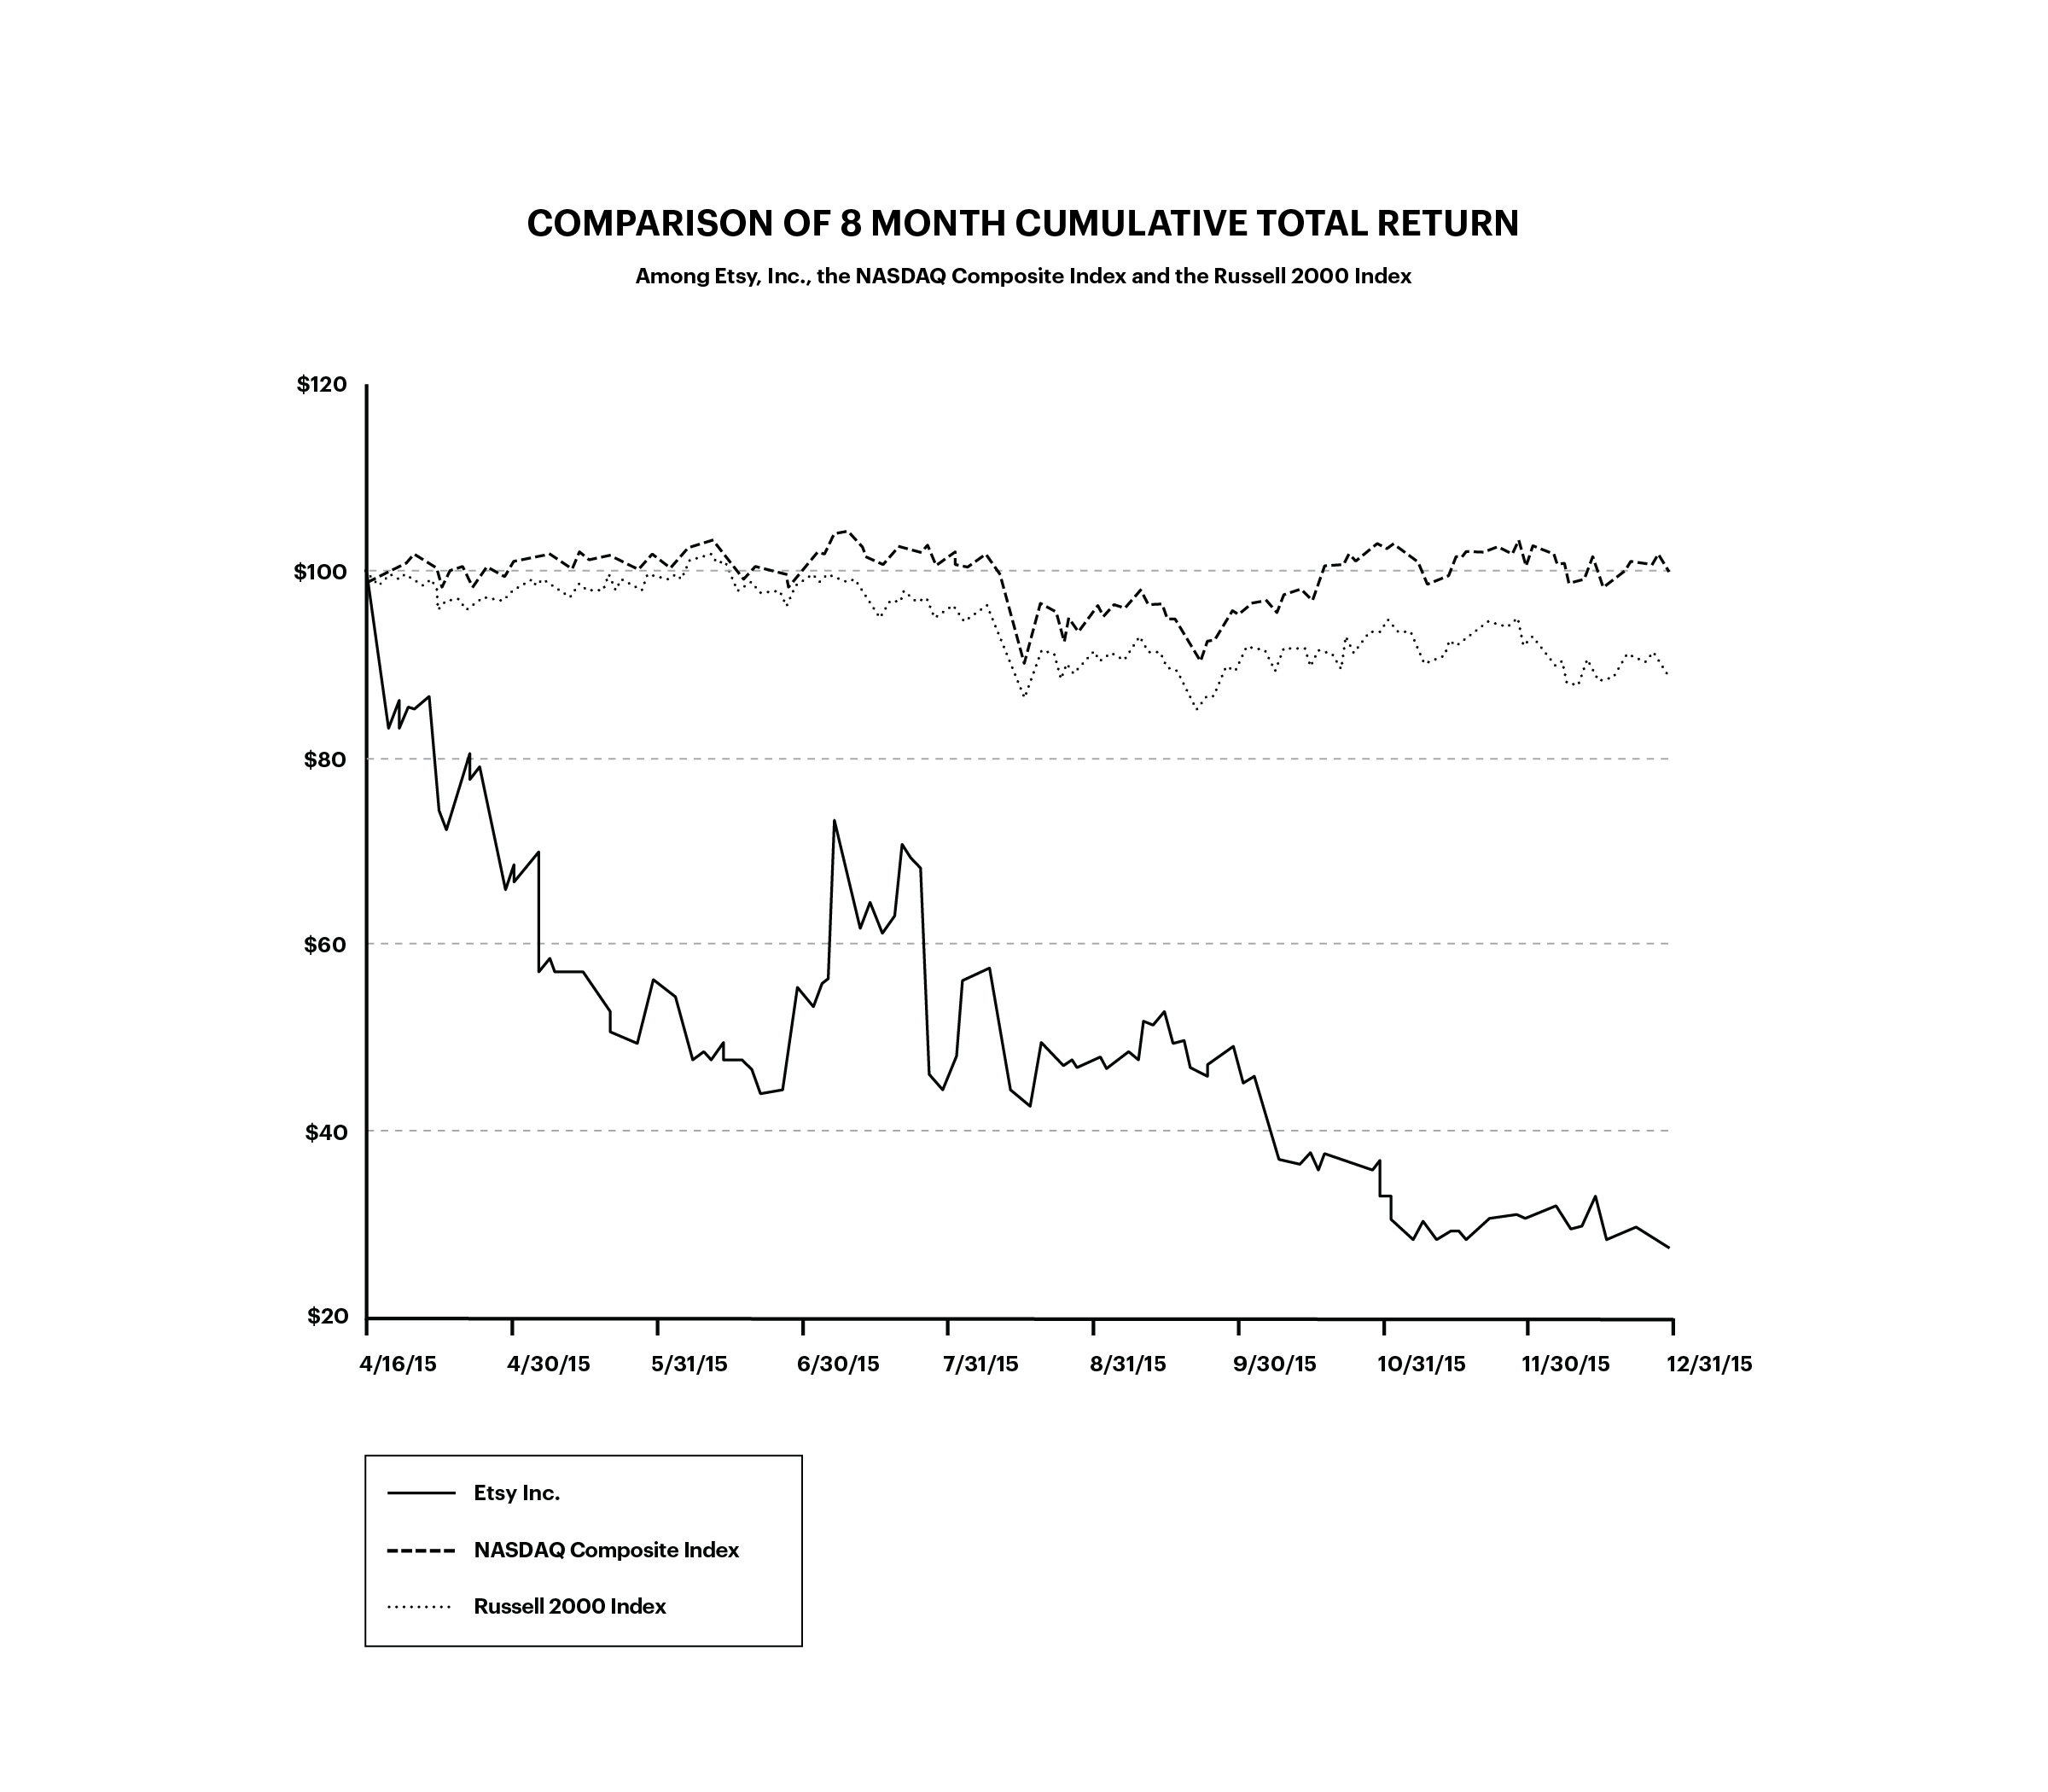
This performance graph shall not be deemed "filed” with the SEC for purposes of Section 18 of the Exchange Act, or incorporated by reference into any of our other filings under the Securities Act or the Exchange Act.
35
Item 6. Selected Consolidated Financial and Other Data.
The following tables show selected consolidated financial data. The selected consolidated statements of operations data for the years ended December 31, 2013, 2014 and 2015, and the selected consolidated balance sheet data as of December 31, 2014 and 2015, are derived from our audited consolidated financial statements and related notes included elsewhere in this Annual Report on Form 10-K. The selected consolidated statement of operations data for the year ended December 31, 2012, and the selected consolidated balance sheet data as of December 31, 2013 is derived from our audited consolidated financial statements and related notes not included in this Annual Report on Form 10-K.
The following tables also show certain operational and non-GAAP financial measures. See the accompanying footnotes and “Management’s Discussion and Analysis of Financial Condition and Results of Operations—Non-GAAP Financial Measures” below for more information. Our historical results and key metrics are not necessarily indicative of future results, and results for any interim period presented below are not necessarily indicative of the results to be expected for any annual period.
The following selected consolidated financial data and key metrics should be read together with “Management’s Discussion and Analysis of Financial Condition and Results of Operations” and our consolidated financial statements and related notes included elsewhere in this Annual Report on Form 10-K.
Year Ended December 31, | ||||||||||||||||
2012 | 2013 | 2014 | 2015 | |||||||||||||
(in thousands, except share and per share data) | ||||||||||||||||
Consolidated Statements of Operations Data: | ||||||||||||||||
Revenue: | ||||||||||||||||
Marketplace | $ | 55,330 | $ | 78,544 | $ | 108,732 | $ | 132,648 | ||||||||
Seller Services | 15,863 | 42,817 | 82,502 | 136,608 | ||||||||||||
Other | 3,409 | 3,661 | 4,357 | 4,243 | ||||||||||||
Total revenue | 74,602 | 125,022 | 195,591 | 273,499 | ||||||||||||
Cost of revenue(1) | 24,493 | 47,779 | 73,633 | 96,979 | ||||||||||||
Gross profit | 50,109 | 77,243 | 121,958 | 176,520 | ||||||||||||
Operating expenses: | ||||||||||||||||
Marketing(1) | 10,902 | 17,850 | 39,655 | 66,771 | ||||||||||||
Product development(1) | 18,653 | 27,548 | 36,634 | 42,694 | ||||||||||||
General and administrative(1) | 21,909 | 31,112 | 51,920 | 68,939 | ||||||||||||
Total operating expenses | 51,464 | 76,510 | 128,209 | 178,404 | ||||||||||||
(Loss) income from operations | (1,355 | ) | 733 | (6,251 | ) | (1,884 | ) | |||||||||
Total other expense | (1,175 | ) | (675 | ) | (4,009 | ) | (26,110 | ) | ||||||||
(Loss) income before income taxes | (2,530 | ) | 58 | (10,260 | ) | (27,994 | ) | |||||||||
Benefit (provision) for income taxes | 145 | (854 | ) | (4,983 | ) | (26,069 | ) | |||||||||
Net loss | $ | (2,385 | ) | $ | (796 | ) | $ | (15,243 | ) | $ | (54,063 | ) | ||||
Net loss per share of common stock—basic and diluted | $ | (0.09 | ) | $ | (0.02 | ) | $ | (0.38 | ) | $ | (0.59 | ) | ||||
Weighted average shares of common stock used in computing net loss per share—basic and diluted | 30,281,842 | 32,667,242 | 40,246,663 | 91,122,291 | ||||||||||||
(1) | Includes total stock-based compensation expense as follows: |
Year Ended December 31, | ||||||||||||||||
2012 | 2013 | 2014 | 2015 | |||||||||||||
(in thousands) | ||||||||||||||||
Cost of revenue | $ | 166 | $ | 200 | $ | 1,113 | $ | 871 | ||||||||
Marketing | 57 | 79 | 216 | 560 | ||||||||||||
Product development | 436 | 785 | 1,461 | 2,860 | ||||||||||||
General and administrative | 3,435 | 2,770 | 7,260 | 6,550 | ||||||||||||
Total stock-based compensation expense | $ | 4,094 | $ | 3,834 | $ | 10,050 | $ | 10,841 | ||||||||
36
Year Ended December 31, | ||||||||||||||||
2012 | 2013 | 2014 | 2015 | |||||||||||||
(in thousands, except percentages) | ||||||||||||||||
Other Operational and Financial Data(2): | ||||||||||||||||
GMS | $ | 895,152 | $ | 1,347,833 | $ | 1,931,981 | $ | 2,388,387 | ||||||||
Adjusted EBITDA | $ | 10,669 | $ | 16,947 | $ | 23,081 | $ | 31,007 | ||||||||
Active sellers | 830 | 1,074 | 1,353 | 1,563 | ||||||||||||
Active buyers | 9,317 | 14,032 | 19,810 | 24,046 | ||||||||||||
Percent mobile visits | N/A | 41 | % | 54.0 | % | 60.0 | % | |||||||||
Percent mobile GMS | N/A | 30 | % | 37.0 | % | 43.0 | % | |||||||||
Percent international GMS | 28.4 | % | 28.4 | % | 30.9 | % | 29.8 | % | ||||||||
(2) See “Management’s Discussion and Analysis of Financial Condition and Results of Operations—Key Operating and Financial Metrics for the definitions of the following terms: “active buyer,” “active seller,” “GMS” and “mobile visit.” See “Management’s Discussion and Analysis of Financial Condition and Results of Operations—Non-GAAP Financial Measures” for the definition of Adjusted EBITDA and for a reconciliation of Adjusted EBITDA to net loss, the most directly comparable financial measure calculated in accordance with GAAP.
As of December 31, | ||||||||||||
2013 | 2014 | 2015 | ||||||||||
(in thousands) | ||||||||||||
Consolidated Balance Sheet Data: | ||||||||||||
Cash and cash equivalents and short-term investments | $ | 54,870 | $ | 88,843 | $ | 292,864 | ||||||
Working capital | 55,764 | 85,608 | 278,932 | |||||||||
Total assets | 104,900 | 246,203 | 553,061 | |||||||||
Deferred revenue | 2,760 | 3,452 | 4,712 | |||||||||
Long-term liabilities | 1,466 | 57,450 | 142,441 | |||||||||
Convertible preferred stock | 80,212 | 80,212 | — | |||||||||
Total stockholders’ equity | 4,003 | 67,088 | 330,498 | |||||||||
37
Item 7. Management’s Discussion and Analysis of Financial Condition and Results of Operations.
You should read the following discussion and analysis of our financial condition and results of operations together with our consolidated financial statements and related notes and other financial information included elsewhere in this Annual Report on Form 10-K. This discussion, particularly information with respect to our outlook, our plans and strategy for our business and our performance and future success, includes forward-looking statements that involve risks and uncertainties. Our actual results could differ materially from those discussed below. Factors that could cause or contribute to these differences include those discussed below and elsewhere in this Annual Report on Form 10-K, particularly in the “Risk Factors” section.
Overview
We operate a marketplace where people around the world connect, both online and offline, to make, sell and buy unique goods. As of December 31, 2015, through our innovative, technology-based platform, we connected a community of 1.6 million active Etsy sellers and 24.0 million active Etsy buyers, in nearly every country in the world.
Our business model is based on shared success: we make money when Etsy sellers make money. Our revenue is diversified, generated from a mix of marketplace activities and the services we provide Etsy sellers to help them create and grow their businesses. In 2015, Etsy sellers generated GMS of $2.4 billion, of which approximately 43% came from purchases made on mobile devices. We are a global company and 29.8% of our 2015 GMS came from an Etsy seller or an Etsy buyer outside of the United States.
Our business has grown in significant ways:
• | Our GMS was $2.4 billion in 2015, up 23.6% over 2014, and was $1.9 billion in 2014, up 43.3% over 2013. |
• | Our revenue was $273.5 million in 2015, up 39.8% over 2014. In 2015, our Marketplace revenue was $132.6 million, up 22.0% over 2014, and our Seller Services revenue was $136.6 million, up 65.6% over 2014. Our revenue was $195.6 million in 2014, up 56.4% over 2013. In 2014, our Marketplace revenue was $108.7 million, up 38.4% over 2013, and our Seller Services revenue was $82.5 million, up 92.7% over 2013. |
• | As of December 31, 2015, our number of active sellers was 1.6 million, up 15.5% since December 31, 2014, and our number of active buyers was 24.0 million, up 21.4% since December 31, 2014. As of December 31, 2014, our number of active sellers was 1.4 million, up 26.0% since December 31, 2013, and our number of active buyers was 19.8 million, up 41.2% since December 31, 2013. |
• | Etsy sellers and Etsy buyers have transacted across borders since our first year of business, and our international community continues to grow. International GMS was 29.8% as a percentage of total GMS in 2015, compared to 30.9% of GMS in 2014 and 28.4% of GMS in 2013. In 2015, excluding our French marketplace ALM, GMS generated between a non-U.S. buyer and a non-U.S. seller both located in the same country increased approximately 50% from 2014. Currently, Etsy sellers and Etsy buyers are based in nearly every country in the world and our marketplace is available in 10 languages. |
• | We launched our "Buy on Etsy" mobile app in 2011, followed by the launch of our "Sell on Etsy" mobile app in 2014. During 2015, we continued to enhance our mobile offerings. Mobile visits represented approximately 60% of visits in 2015, 54% of visits in 2014 and 41% of visits in 2013. Mobile GMS represented approximately 43% of GMS in 2015, increasing from approximately 37% of GMS in 2014 and approximately 30% of total GMS in 2013. As of December 31, 2015, our mobile apps have been downloaded 31.8 million times. |
• | We have continued to enhance our Seller Services. We launched Promoted Listings in 2011, followed by Direct Checkout in 2012, and Shipping Labels in 2013. Seller Services has increased as a percentage of total revenue in the past five years from less than 3% in 2011 to approximately 50% in 2015. |
• | We have continued to expand the Etsy Economy by focusing on our manufacturing and Wholesale programs. For example, in September 2015, we launched our new Etsy Manufacturing marketplace to help Etsy sellers connect directly with manufacturers who commit to certain practices and value transparent connections. |
In 2015, Etsy sellers generated GMS of $2.4 billion, up 23.6% over 2014, and in 2014, Etsy sellers generated GMS of $1.9 billion, up 43.3% over 2013. In 2015, we generated revenue of $273.5 million, up 39.8% over 2014, and in 2014, we generated
38
revenue of $195.6 million, up 56.4% over 2013. In 2015, we generated a net loss of $54.1 million and Adjusted EBITDA of $31.0 million compared to a net loss of $15.2 million and Adjusted EBITDA of $23.1 million in 2014. In 2014, we generated a net loss of $15.2 million and Adjusted EBITDA of $23.1 million compared to a net loss of $0.8 million and Adjusted EBITDA of $16.9 million in 2013. See “—Non-GAAP Financial Measures” for more information and for a reconciliation of Adjusted EBITDA to net loss, the most directly comparable financial measure calculated in accordance with GAAP.
Key Operating and Financial Metrics
We collect and analyze operating and financial data to evaluate the health of our ecosystem, allocate our resources (such as capital, time and technology investments) and assess the performance of our business. In addition to revenue, net (loss) income and other results under GAAP, the key operating and financial metrics we use are:
Year Ended December 31, | ||||||||||||
2013 | 2014 | 2015 | ||||||||||
(in thousands, except percentages) | ||||||||||||
GMS | $ | 1,347,833 | $ | 1,931,981 | $ | 2,388,387 | ||||||
Adjusted EBITDA | $ | 16,947 | $ | 23,081 | $ | 31,007 | ||||||
Active sellers | 1,074 | 1,353 | 1,563 | |||||||||
Active buyers | 14,032 | 19,810 | 24,046 | |||||||||
Percent mobile visits | 41 | % | 54 | % | 60 | % | ||||||
Percent mobile GMS | 30 | % | 37 | % | 43 | % | ||||||
Percent international GMS | 28.4 | % | 30.9 | % | 29.8 | % | ||||||
GMS
Gross merchandise sales, or GMS, is the dollar value of items sold in our marketplace within the applicable period, excluding shipping fees and net of refunds associated with cancelled transactions. GMS does not represent revenue earned by us. GMS relates only to Marketplace activity and does not reflect Seller Services activity. However, because our revenue and cost of revenue depend significantly on the dollar value of items sold in our marketplace, we believe that GMS is an indicator of the success of Etsy sellers, the satisfaction of Etsy buyers, the health of our ecosystem and the scale and growth of our business.
Adjusted EBITDA
Adjusted EBITDA represents our net loss before interest expense, net, (benefit) provision for income taxes and depreciation and amortization, adjusted to eliminate stock-based compensation expense, net unrealized loss (gain) on warrant and other liabilities, foreign exchange loss (gain), other non-operating expense, net, acquisition-related expenses and our contributions to Etsy.org. We have included Adjusted EBITDA because it is a key measure used by our management and board of directors to understand and evaluate our operating performance and trends, allocate internal resources, prepare and approve our annual budget, develop short- and long-term operating plans and assess the health of our ecosystem. As our Adjusted EBITDA increases, we are able to invest more resources in our community. We also believe that Adjusted EBITDA provides a useful measure for period-to-period comparisons of our business as it removes the impact of non-cash items and certain variable charges. See “—Non-GAAP Financial Measures” below for information regarding the limitations of using Adjusted EBITDA as a financial measure and for a reconciliation of Adjusted EBITDA to net loss, the most directly comparable financial measure calculated in accordance with GAAP.
Active Sellers
An active seller is an Etsy seller who has incurred at least one charge from us in the last 12 months. Charges include transaction fees, listing fees and fees for Direct Checkout, Promoted Listings, Shipping Labels and Wholesale enrollment. An Etsy seller is someone who has created an account and has listed an item in our marketplace. An Etsy seller is identified by a unique e-mail address; a single person can have multiple Etsy seller accounts. We succeed when Etsy sellers succeed, so we view the number of active sellers as a key indicator of the awareness of our brand, the reach of our platform, the potential for growth in GMS and revenue and the health of our ecosystem.
39
Active Buyers
An active buyer is an Etsy buyer who has made at least one purchase in the last 12 months. An Etsy buyer is someone who has created an account in our marketplace. An Etsy buyer is identified by a unique e-mail address; a single person can have multiple Etsy buyer accounts. We succeed when Etsy buyers order items from Etsy sellers, so we view the number of active buyers as a key indicator of our potential for growth in GMS and revenue, the reach of our platform, awareness of our brand, the engagement and loyalty of Etsy buyers and the health of our ecosystem.
Mobile Visits
A visit represents activity from a unique browser or mobile app. A visit ends after 30 minutes of activity. A mobile visit is a visit that occurs on a mobile device, such as a tablet or a smartphone. Etsy sellers are increasingly using mobile devices to manage their listings and track their business performance on our platform. In addition, Etsy buyers increasingly use mobile devices to search, browse and purchase items on our platform. We view percent mobile visits as a key indicator of the level of engagement of Etsy sellers and Etsy buyers on our mobile website and mobile apps and of our ability to sustain GMS and revenue.
Mobile GMS
Mobile GMS is GMS that occurs on a mobile device, such as a tablet or a smartphone. Mobile GMS excludes orders initiated on mobile devices but ultimately completed on a desktop. We believe that mobile GMS indicates our success in converting mobile activity into mobile purchases and demonstrates our ability to grow GMS and revenue.
International GMS
International GMS is GMS from transactions where either the billing address for the Etsy seller or the shipping address for the Etsy buyer at the time of sale is outside of the United States. We believe that international GMS shows the level of engagement of our community outside the United States and demonstrates our ability to grow GMS and revenue.
Non-GAAP Financial Measures
Adjusted EBITDA
In this Annual Report on Form 10-K, we provide Adjusted EBITDA, a non-GAAP financial measure that represents our net loss before interest expense, net, (benefit) provision for income taxes and depreciation and amortization, adjusted to eliminate stock-based compensation expense, net unrealized loss (gain) on warrant and other liabilities, foreign exchange loss (gain), other non-operating expense, net, contributions to Etsy.org and acquisition-related expenses. Below is a reconciliation of Adjusted EBITDA to net loss, the most directly comparable GAAP financial measure.
We have included Adjusted EBITDA because it is a key measure used by our management and board of directors to evaluate our operating performance and trends, allocate internal resources, prepare and approve our annual budget, develop short- and long-term operating plans and assess the health of our business. As our Adjusted EBITDA increases, we are able to invest more in our platform.
We believe that Adjusted EBITDA can provide a useful measure for period-to-period comparisons of our business as it removes the impact of certain non-cash items and certain variable charges. You should consider Adjusted EBITDA alongside other financial performance measures, including net loss and our other GAAP results.
Adjusted EBITDA has limitations as an analytical tool, and you should not consider it in isolation or as a substitute for analysis of our results as reported under GAAP. Some of these limitations are:
• | although depreciation and amortization are non-cash charges, the assets being depreciated and amortized may have to be replaced in the future, and Adjusted EBITDA does not reflect cash capital expenditure requirements for such replacements or for new capital expenditure requirements; |
• | Adjusted EBITDA does not consider the impact of stock-based compensation expense or changes in the fair value of warrants; |
40
• | Adjusted EBITDA does not reflect tax payments that may represent a reduction in cash available to us; |
• | Adjusted EBITDA does not reflect acquisition-related expenses; |
• | Adjusted EBITDA does not consider the impact of foreign exchange loss (gain); |
• | Adjusted EBITDA does not reflect other non-operating expenses, net of other non-operating income, including net interest expense (income); |
• | Adjusted EBITDA does not reflect the impact of our contributions to Etsy.org; and |
• | other companies, including companies in our industry, may calculate Adjusted EBITDA differently, which reduces its usefulness as a comparative measure. |
Because of these limitations, you should consider Adjusted EBITDA alongside other financial performance measures, including net loss and our other GAAP results.
The following table reflects the reconciliation of net loss to Adjusted EBITDA for each of the periods indicated:
Year Ended December 31, | ||||||||||||
2013 | 2014 | 2015 | ||||||||||
(in thousands) | ||||||||||||
Net loss | $ | (796 | ) | $ | (15,243 | ) | $ | (54,063 | ) | |||
Excluding: | ||||||||||||
Interest and other non-operating expense, net | 256 | 549 | 1,202 | |||||||||
Provision for income taxes | 854 | 4,983 | 26,069 | |||||||||
Depreciation and amortization | 12,380 | 17,223 | 18,550 | |||||||||
Stock-based compensation expense | 3,834 | 5,920 | 8,981 | |||||||||
Stock-based compensation expense—acquisitions | — | 4,130 | 1,860 | |||||||||
Net unrealized loss on warrant and other liabilities | 419 | 411 | 3,133 | |||||||||
Foreign exchange loss | — | 3,049 | 21,775 | |||||||||
Acquisition-related expenses | — | 2,059 | — | |||||||||
Contribution to Etsy.org | — | — | 3,500 | |||||||||
Adjusted EBITDA | $ | 16,947 | $ | 23,081 | $ | 31,007 | ||||||
41
Key Factors Affecting Our Performance
We believe that our performance and future success depend on a number of factors that present significant opportunities for us but also pose risks and challenges, including those discussed below and in the section titled “Risk Factors.”
Growth and Retention of Active Sellers and Active Buyers
Our success depends in part on the growth and retention of our active sellers and active buyers. Our revenue is driven by the number of active sellers, seller engagement, the number of active buyers, buyer engagement and our ability to maintain a trusted marketplace. As of December 31, 2015, our marketplace had grown to 1.6 million active sellers and 24.0 million active buyers, up from 1.4 million active sellers and 19.8 million active buyers as of December 31, 2014. Failure to effectively attract and retain new active sellers and active buyers, to re-engage inactive sellers and inactive buyers and to engage active sellers and active buyers on a cost-effective basis would adversely affect our revenue growth, operating results and the overall health of our ecosystem.
To analyze our retention rates, we measure repeat activity by Etsy sellers and Etsy buyers.
Cohort of 2011 and 2012 Active Sellers
We refer to active sellers as of December 31, 2011 as “2011 Active Sellers.” Thirty-two percent of 2011 Active Sellers remained active sellers through their fourth year on the platform, as of December 31, 2014. The average annual GMS per 2011 Active Seller in 2014 was over five times higher than in 2011.
We refer to active sellers as of December 31, 2012 as “2012 Active Sellers.” Thirty-two percent of 2012 Active Sellers remained active sellers through their fourth year on the platform, as of December 31, 2015. The average annual GMS per 2012 Active Seller in 2015 was over four times higher than in 2012.
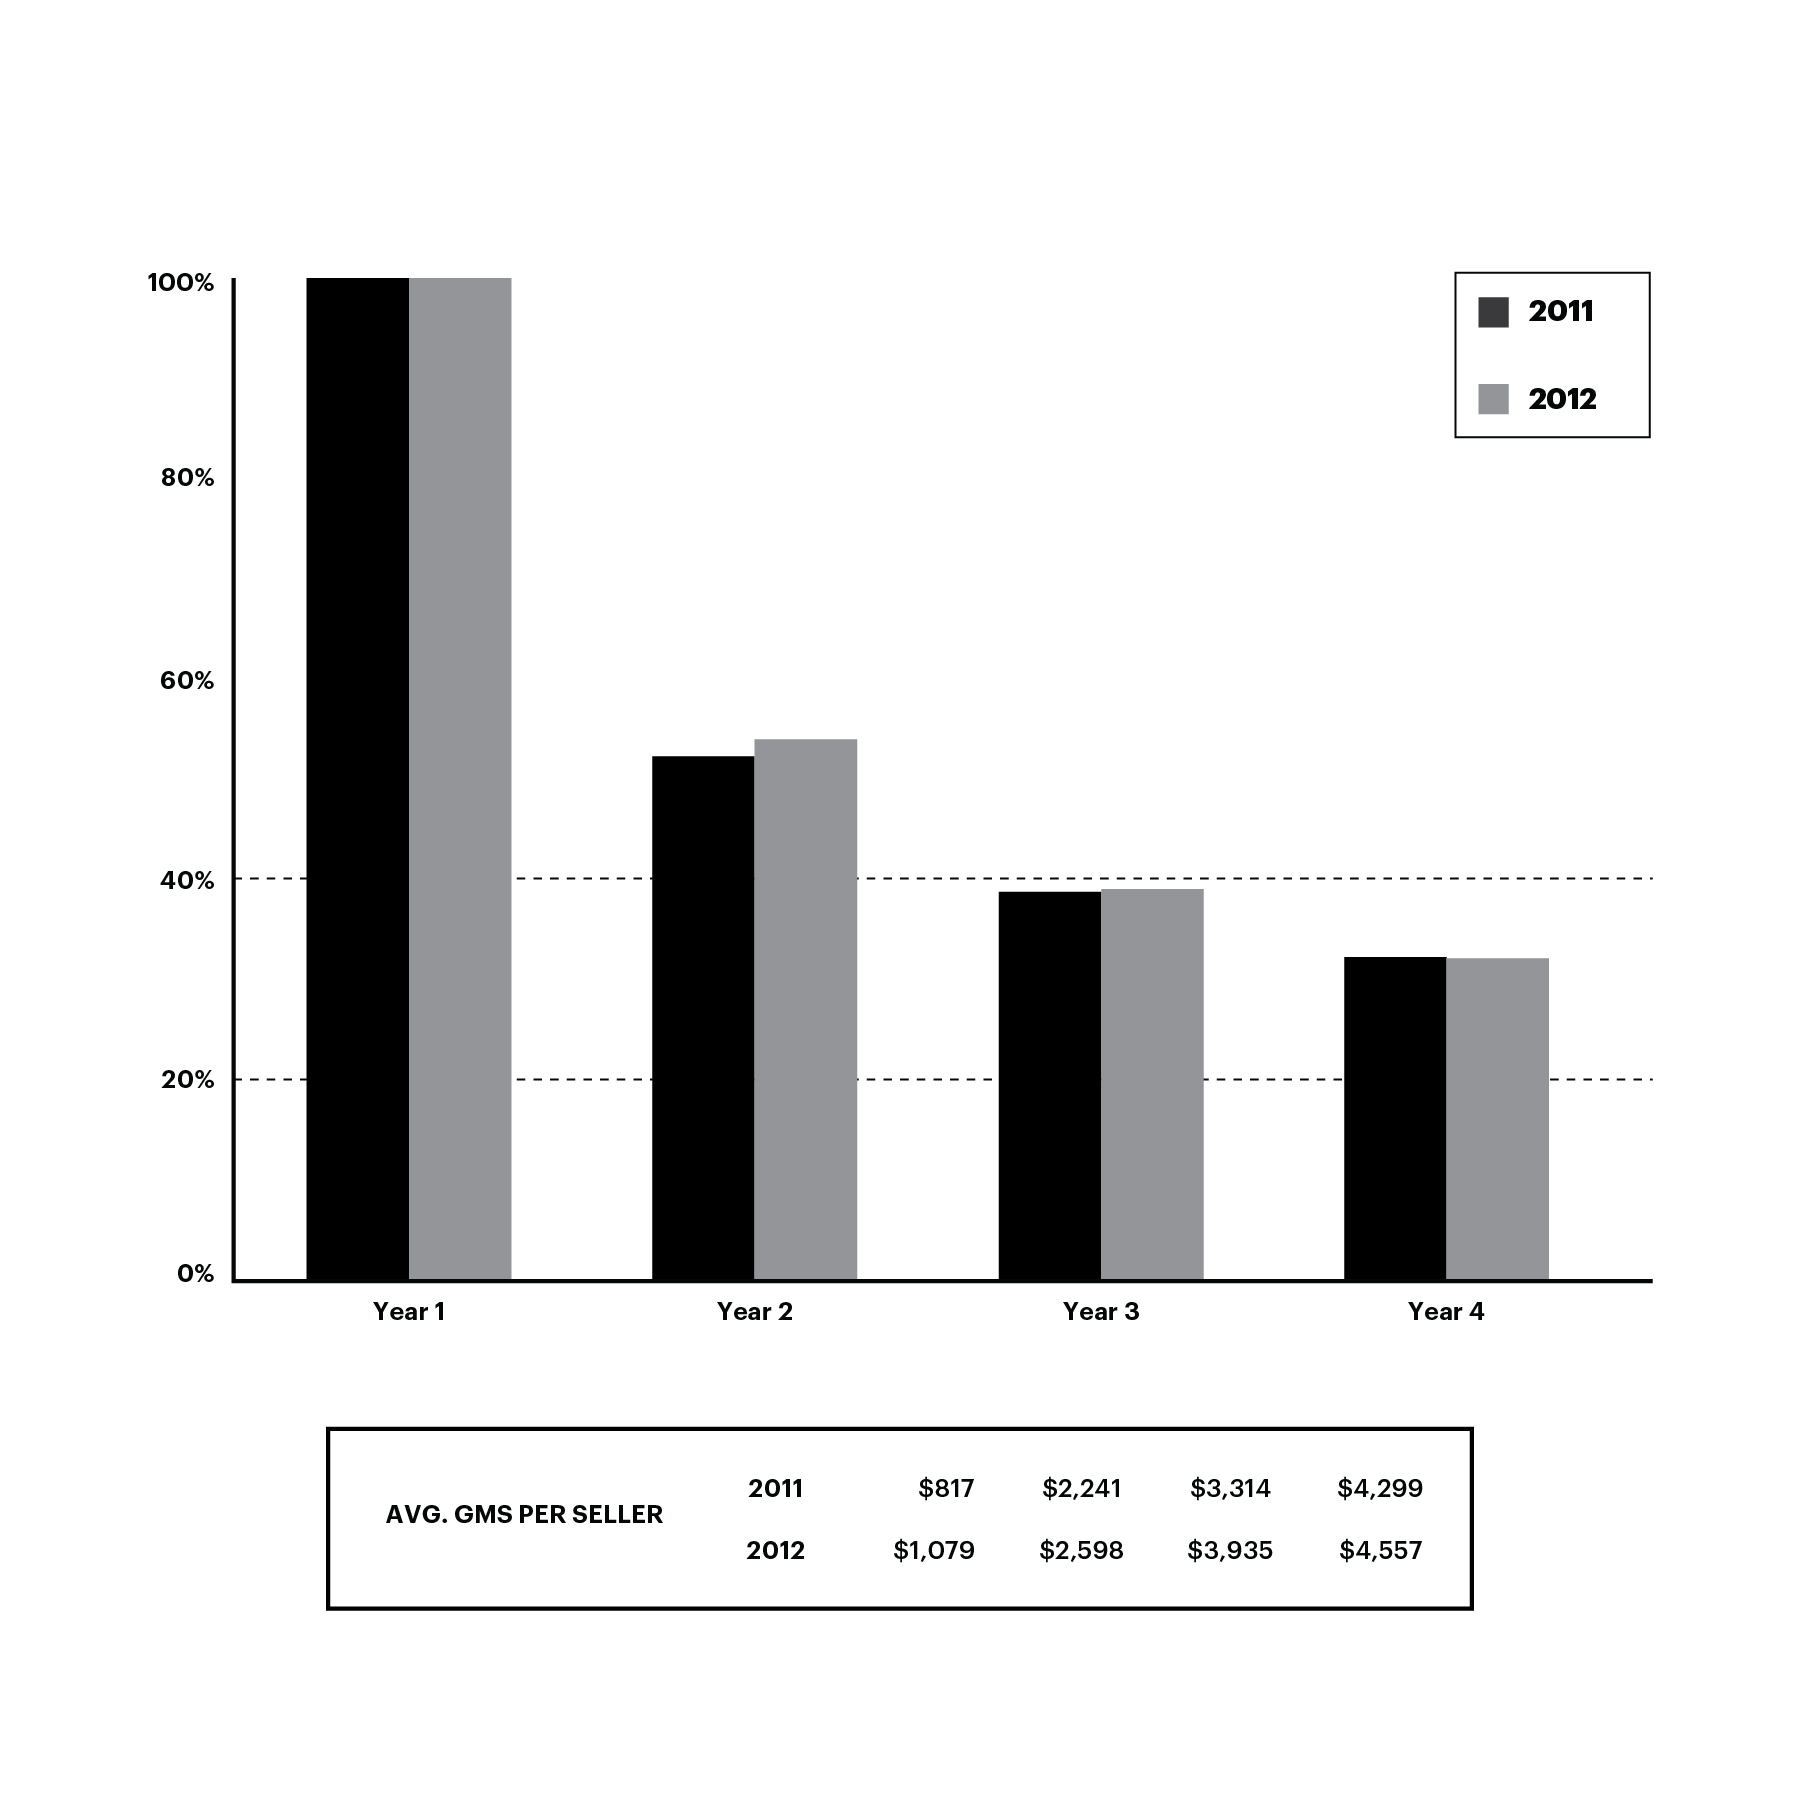
42
Cohort of 2011 and 2012 Active Buyers
We refer to active buyers as of December 31, 2011 as “2011 Active Buyers.” Forty-five percent of 2011 Active Buyers remained active buyers through their fourth year on the platform, as of December 31, 2014. The average annual GMS per 2011 Active Buyer in 2014 was 89% higher than in 2011.
We refer to active buyers as of December 31, 2012 as “2012 Active Buyers.” Forty-three percent of 2012 Active Buyers remained active buyers through their fourth year on the platform, as of December 31, 2015. The average annual GMS per 2012 Active Buyer in 2015 was 89% higher than in 2012.
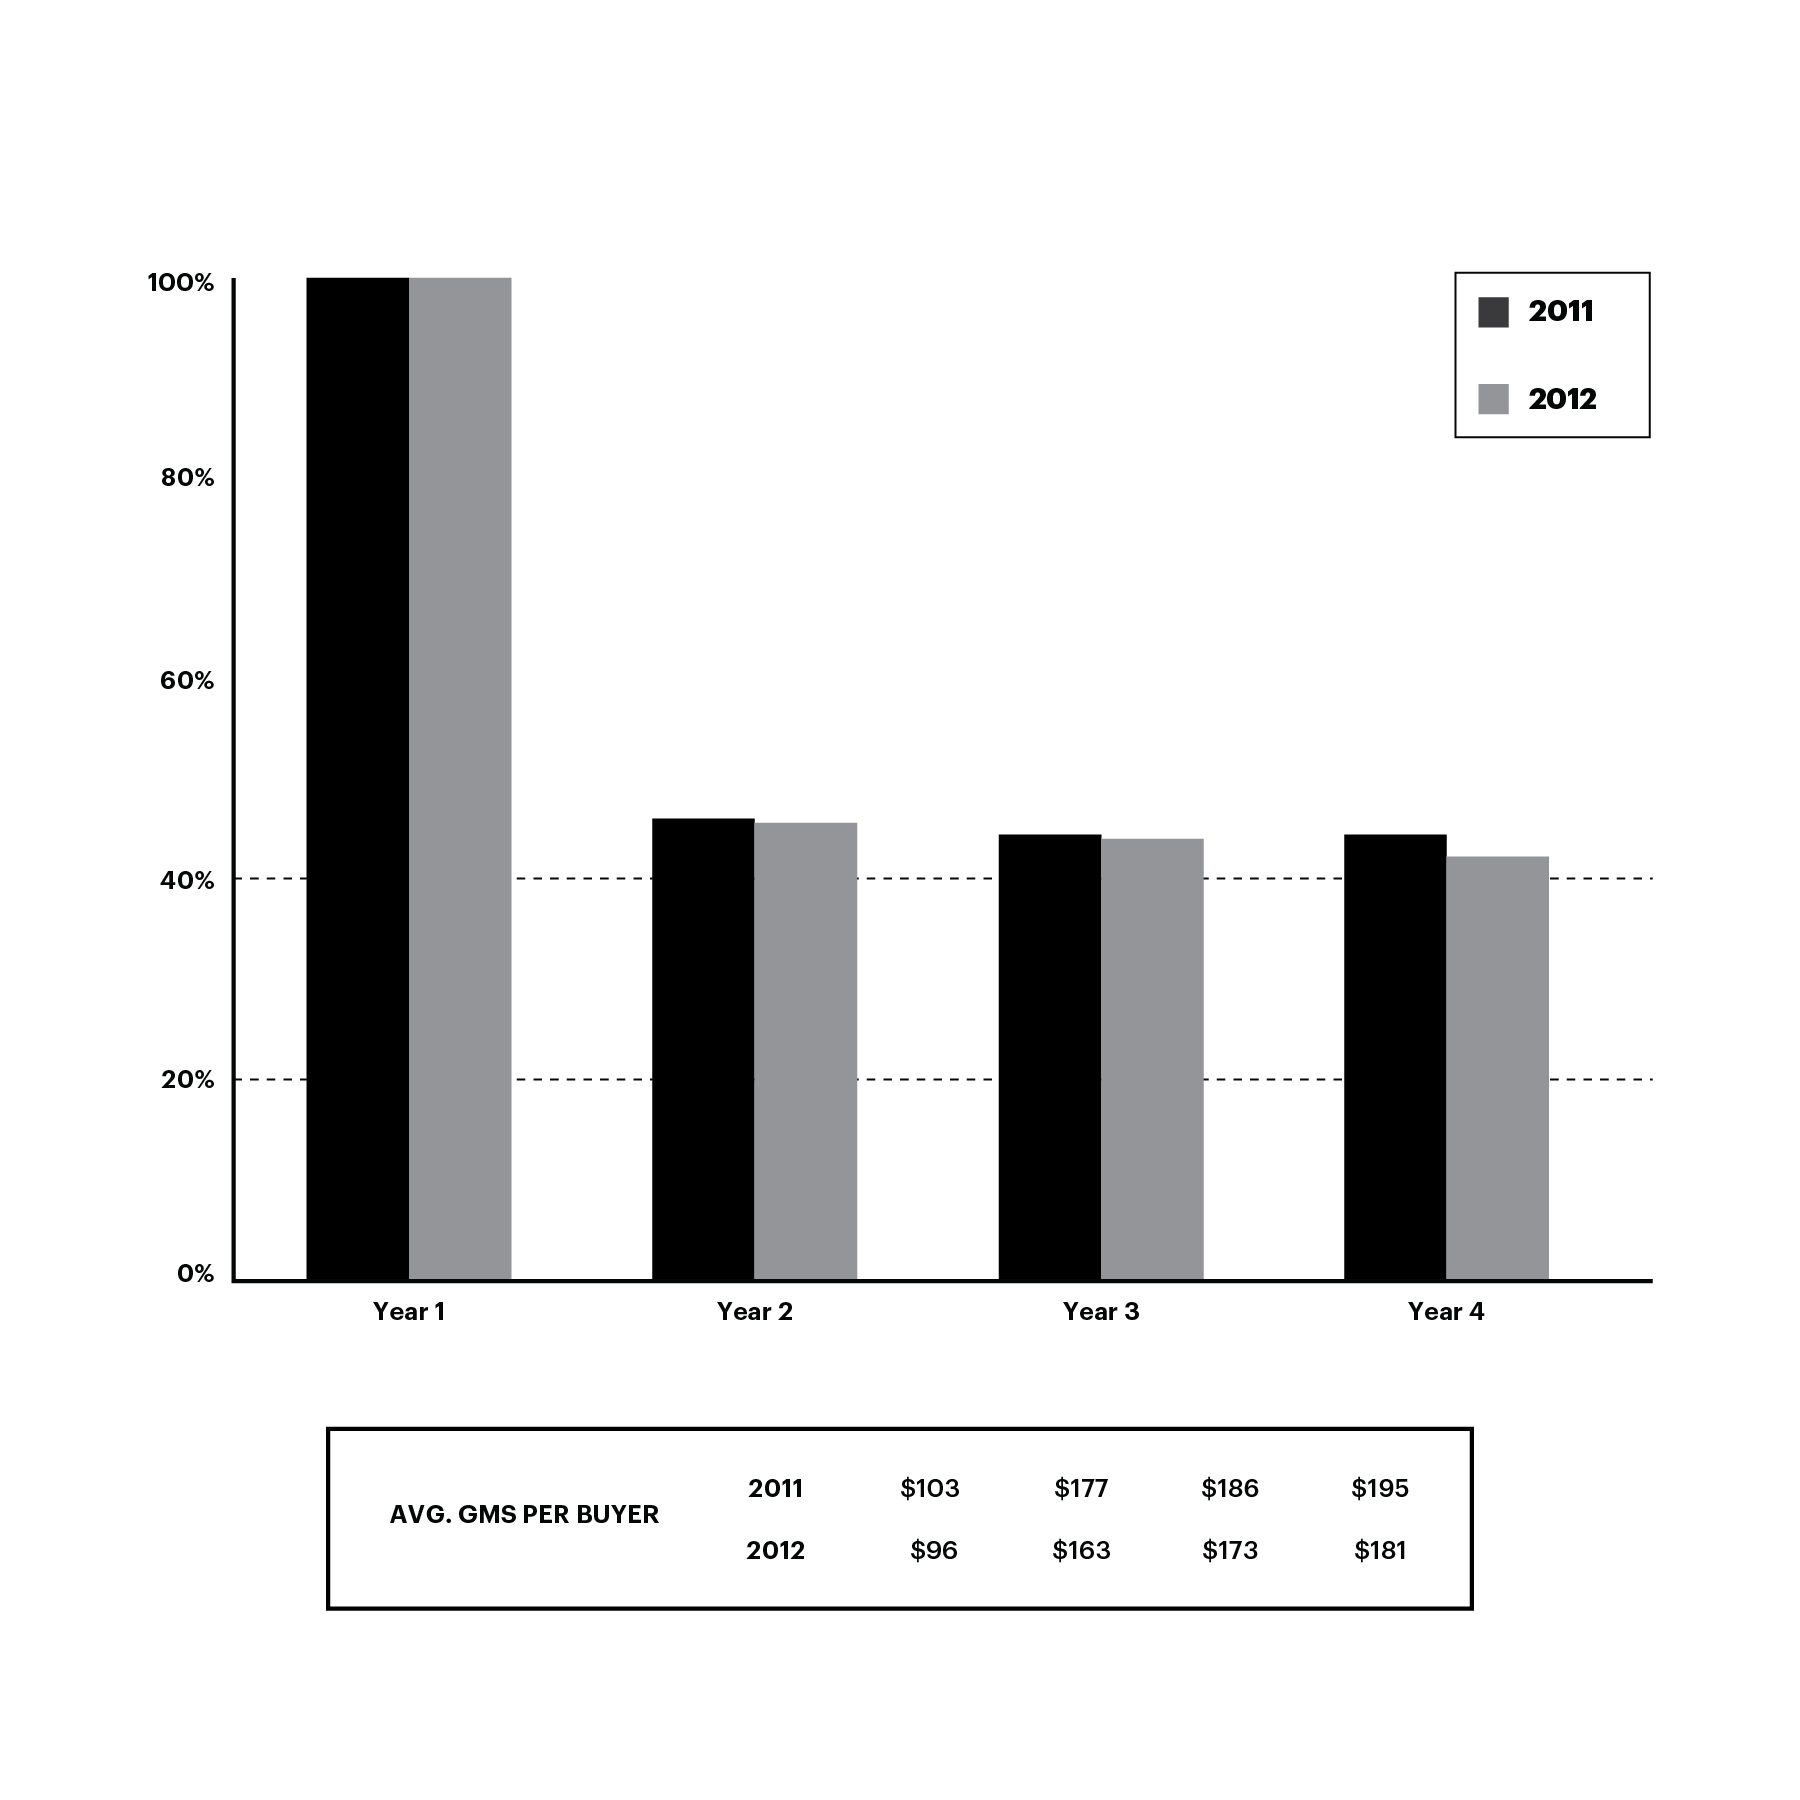
High-Impact Seller Services Growth
Our business model is based on shared success: we make money when Etsy sellers make money. For that reason, we provide services to an Etsy seller to help her start and grow her shop. As of December 31, 2015, 48.1% of active sellers used one or more of our Seller Services compared to 46.1% of active sellers as of December 31, 2014. For December 31, 2015, this included 16.7% of active sellers using Promoted Listings, 40.2% of active sellers using Direct Checkout and 23.9% of active sellers in the United States and Canada using Shipping Labels. We expect seller services revenue related our existing offerings to continue to grow in 2016, driven by increased adoption and product enhancements. Additionally, we expect to see moderate contributions to revenue related to new product launches and types of seller services. Our effectiveness in increasing the uptake of our Seller Services, enhancing existing Seller Services and extending their geographic reach and introducing new Seller Services will directly impact the success of Etsy sellers, our revenue growth and our operating results.
International Growth
Our growth will depend in part on international Etsy sellers and international Etsy buyers constituting an increasing portion of our community. International GMS was 29.8% of GMS in 2015 compared to 30.9% in 2014. We expect our percent international GMS to remain stable in 2016, assuming that currency remains stable compared to average levels in December 2015. We continue to believe that we can grow international GMS, over time, to represent 50% of our total GMS. Etsy sellers and Etsy buyers are based in nearly every country in the world, and our marketplace is available in 10 languages. Although we promote cross-border transactions, our strategy is to build and deepen local Etsy communities around the world, each with its own ecosystem of Etsy sellers and Etsy buyers. For example, although GMS generated between a non-U.S. buyer and a non-U.S. seller both in the same country is a small percentage of our total GMS, excluding our French marketplace ALM, this GMS grew approximately 50% in 2015 compared with 2014. To meet our goals, we plan to invest in local marketing and other locally-relevant tools and enhancements around the world to encourage these connections. An inability to develop these Etsy
43
communities or to otherwise grow our business outside the United States on a cost-effective basis could adversely affect our GMS, revenue and our operating results.
Mobile Growth
We believe continued enhancement of the mobile features of our platform will be critical to attracting and retaining Etsy sellers and Etsy buyers and maintaining the vibrancy of our marketplace. The success of this effort will be increasingly important as shopping on mobile devices displaces shopping on desktops and as Etsy sellers increasingly seek to run their shops via mobile devices.
We launched our "Buy on Etsy" mobile app in 2011 and since then have expanded our mobile offerings for both Etsy sellers and Etsy buyers. Our “Sell on Etsy” mobile app, which we launched in April 2014, is designed to help an Etsy seller operate her shop, manage orders and access resources. Our Etsy buyer apps and mobile web experience include features designed to keep Etsy buyers engaged and offer an improved shopping experience. As of December 31, 2015, our mobile apps have been downloaded 31.8 million times compared to 21.8 million times as of December 31, 2014, and mobile visits represented 60% of total visits in 2015 compared to 54% of total visits in 2014. In addition, in the same period, mobile GMS was 43% of total GMS. We believe that we will continue to see the gap between mobile visits and mobile GMS narrow in 2016. If we are unable to continue to engage Etsy sellers and Etsy buyers through our mobile offerings, then our GMS and revenue growth and our operating results could be adversely affected.
Investment in Marketing
To date, we have grown largely due to strong brand awareness and word-of-mouth referrals, with the vast majority of our visits coming from direct and organic channels. Toward the end of 2014, we began increasing our brand and digital marketing efforts, which involved business changes and reorganizations that moved certain teams previously focused on product-related projects into marketing. In 2014, we spent $39.7 million on marketing expenses, or 20.3% of revenue, up 122.2% over 2013. In 2015, we spent $66.8 million on marketing expenses, or 24.4% of revenue, up 68.4% over 2014. In the upcoming year, we expect marketing expenses to decrease as a percentage of total revenue. Our growth will depend in part on our continued ability to launch marketing campaigns that resonate with new and existing Etsy sellers and Etsy buyers and appropriately balance our level of marketing spending with the benefits that may be realized through revenue growth.
We have a measured and balanced marketing strategy. Our marketing investments are guided by our 2-year lifetime value model, in which we make conservative assumptions about how paid traffic will perform compared with organic traffic. Since 2014 we have achieved a payback period of five quarters and we remain committed to achieving positive return on investment (ROI) at the aggregate company level on our marketing spend.
Investment in Growth
We have made, and will continue to make, significant investments in our platform to attract members to our community and enhance their experience. In 2014, we spent $36.6 million on product development expenses, or 18.7% of revenue, up 33.0% over 2013 and in 2015, we spent $42.7 million on product development expenses, or 15.6% of revenue, up 16.5% over 2014. In addition, we capitalized website development and internal-use software, including stock-based compensation, of $8.5 million and $10.2 million in 2014 and 2015, respectively. We have invested significant resources in our technology platform and infrastructure to date and plan to continue to invest in innovation to address the needs of our community. We also plan to hire additional personnel to address their needs. As part of this growth in headcount, we signed a lease in May 2014 for a new headquarters facility in Brooklyn, New York to accommodate our anticipated growth in personnel. Considering the investment in the new corporate headquarters, we expect our overall operating expenses to increase a percentage of total revenue in the upcoming year. The investments we make in our platform are all designed to grow our ecosystem and revenue and to improve our operating results in the long term, but these investments could also delay our ability to achieve profitability or reduce our profitability in the near term.
44
Components of Our Results of Operations
Revenue
Our revenue consists of Marketplace revenue, Seller Services revenue and Other revenue.
Marketplace revenue. Marketplace revenue consists of the 3.5% fee that an Etsy seller pays for each completed transaction on our platform, exclusive of shipping fees charged. Marketplace revenue also consists of a listing fee of $0.20 per item that she lists (for up to four months) in our marketplace. Revenue from completed Wholesale transactions is also included in Marketplace revenue.
Seller Services revenue. Seller Services revenue consists of fees an Etsy seller pays us for the Seller Services she uses, including Promoted Listings, Direct Checkout and Shipping Labels.
• | Revenue from Promoted Listings consists of cost-per-click fees an Etsy seller pays us for prominent placement of her listings in search results generated by Etsy buyers in our marketplace. |
• | Revenue from Direct Checkout consists of fees an Etsy seller pays us to process credit, debit and Etsy Gift Card payments. Direct Checkout fees vary between 3–4% of the item’s total sale price plus a flat fee per order, depending on the country in which her bank account is located. Direct Checkout fees are taken from the item’s total sale price, including shipping. |
• | Revenue from Shipping Labels consists of fees an Etsy seller pays us when she purchases shipping labels through our platform, net of the cost we incur in purchasing those shipping labels. We are able to provide our sellers shipping labels from the United States Postal Service and Canada Post at discounted pricing due to the volume of purchases through our platform. |
Other revenue. Other revenue includes the fees we receive from a third-party payment processor.
Our revenue recognition policies are discussed under “—Critical Accounting Policies and Significant Judgments and Estimates.”
Cost of Revenue
Cost of revenue consists primarily of expenses associated with the operation and maintenance of our platform and data centers, including depreciation and amortization, employee-related costs, including stock-based compensation expense, and hosting and bandwidth costs. Cost of revenue also includes the cost of interchange and other fees for credit card processing services, credit card verification service fees and credit card chargebacks to support Direct Checkout revenue and costs of refunds made to Etsy buyers that we are not able to collect from Etsy sellers. Our cost of revenue as a percentage of revenue may change over time as our revenue mix changes; for example, to the extent that Direct Checkout revenue increases as a percentage of revenue, there may be a dampening effect on our gross margin.
Operating Expenses
Operating expenses consist of marketing, product development and general and administrative expenses. Direct and indirect employee-related costs, including stock-based compensation expense, are the most significant component of the product development and general and administrative expense categories, and we expect these costs to increase as we continue to hire new employees in order to support our anticipated growth. We include stock-based compensation expense in connection with the grant of stock options in the applicable operating expense category based on the respective equity award recipient’s function.
Marketing. Marketing expenses consist primarily of targeted online marketing costs, such as product listing ads, search engine marketing, affiliate marketing and, to a much lesser extent, offline marketing expenses. Marketing expenses also include employee-related costs, including stock-based compensation expense, for our employees involved in digital marketing, seller development and growth, public relations and communications, brand marketing and design, product marketing and marketing research activities. Marketing expenses are primarily driven by investments to grow and retain members on our platform.
Product development. Product development expenses consist primarily of employee-related costs, including stock-based compensation expense, for our employees involved in product development activities. Additional expenses include consulting costs related to the development, quality assurance and testing of new technology and enhancement of our existing technology.
45
General and administrative. General and administrative expenses consist primarily of costs associated with the use of facilities and equipment, including depreciation and amortization, rent, and certain professional services expenses. General and administrative expenses also include employee-related costs, including stock-based compensation expense, for our employees involved in general corporate functions and currency gains or losses. General and administrative expenses are primarily driven by increases in headcount required to support business growth.
Other Expense, net
Other expense, net consists of interest expense, interest and other income, foreign exchange loss and net unrealized loss (gain) on warrant and other liabilities.
46
Results of Operations
The following tables show our results of operations for the periods presented and express the relationship of certain line items as a percentage of revenue for those periods. The period-to-period comparison of financial results is not necessarily indicative of future results.
Year Ended December 31, | |||||||||||
2013 | 2014 | 2015 | |||||||||
(in thousands) | |||||||||||
Revenue: | |||||||||||
Marketplace | $ | 78,544 | $ | 108,732 | $ | 132,648 | |||||
Seller Services | 42,817 | 82,502 | 136,608 | ||||||||
Other | 3,661 | 4,357 | 4,243 | ||||||||
Total revenue | 125,022 | 195,591 | 273,499 | ||||||||
Cost of revenue | 47,779 | 73,633 | 96,979 | ||||||||
Gross profit | 77,243 | 121,958 | 176,520 | ||||||||
Operating expenses: | |||||||||||
Marketing | 17,850 | 39,655 | 66,771 | ||||||||
Product development | 27,548 | 36,634 | 42,694 | ||||||||
General and administrative | 31,112 | 51,920 | 68,939 | ||||||||
Total operating expenses | 76,510 | 128,209 | 178,404 | ||||||||
Income (loss) from operations | 733 | (6,251 | ) | (1,884 | ) | ||||||
Other expense, net | (675 | ) | (4,009 | ) | (26,110 | ) | |||||
Income (loss) before income taxes | 58 | (10,260 | ) | (27,994 | ) | ||||||
Provision for income taxes | (854 | ) | (4,983 | ) | (26,069 | ) | |||||
Net loss | $ | (796 | ) | $ | (15,243 | ) | $ | (54,063 | ) | ||
Year Ended December 31, | |||||||||||
2013 | 2014 | 2015 | |||||||||
Revenue: | |||||||||||
Marketplace | 62.8 | % | 55.6 | % | 48.5 | % | |||||
Seller Services | 34.2 | 42.2 | 49.9 | ||||||||
Other | 2.9 | 2.2 | 1.6 | ||||||||
Total revenue | 100.0 | 100.0 | 100.0 | ||||||||
Cost of revenue | 38.2 | 37.6 | 35.5 | ||||||||
Gross profit | 61.8 | 62.4 | 64.5 | ||||||||
Operating expenses: | |||||||||||
Marketing | 14.3 | 20.3 | 24.4 | ||||||||
Product development | 22.0 | 18.7 | 15.6 | ||||||||
General and administrative | 24.9 | 26.5 | 25.2 | ||||||||
Total operating expenses | 61.2 | 65.5 | 65.2 | ||||||||
Income (loss) from operations | 0.6 | (3.2 | ) | (0.7 | ) | ||||||
Other expense, net | (0.5 | ) | (2.0 | ) | (9.5 | ) | |||||
Income (loss) before income taxes | — | (5.2 | ) | (10.2 | ) | ||||||
Provision for income taxes | (0.7 | ) | (2.5 | ) | (9.5 | ) | |||||
Net loss | (0.6 | ) | (7.8 | ) | (19.8 | ) | |||||
47
Comparison of Years Ended December 31, 2014 and 2015
Revenue
Year Ended December 31, | Change | ||||||||||||||
2014 | 2015 | $ | % | ||||||||||||
(in thousands, except percentages) | |||||||||||||||
Revenue: | |||||||||||||||
Marketplace | $ | 108,732 | $ | 132,648 | $ | 23,916 | 22.0 | % | |||||||
Percentage of total revenue | 55.6 | % | 48.5 | % | |||||||||||
Seller Services | $ | 82,502 | $ | 136,608 | $ | 54,106 | 65.6 | % | |||||||
Percentage of total revenue | 42.2 | % | 49.9 | % | |||||||||||
Other | $ | 4,357 | $ | 4,243 | $ | (114 | ) | (2.6 | )% | ||||||
Percentage of total revenue | 2.2 | % | 1.6 | % | |||||||||||
Total revenue | $ | 195,591 | $ | 273,499 | $ | 77,908 | 39.8 | % | |||||||
GMS increased $456.4 million, or 23.6%, to $2.4 billion in the year ended December 31, 2015 compared to the year ended December 31, 2014.
During the year ended December 31, 2015, mobile GMS increased as a percentage of total GMS to approximately 43%, up from 37% for the year ended December 31, 2014, as a result of increased mobile traffic and, to a lesser extent, improvements in our mobile offerings for Etsy buyers.
For the year ended December 31, 2015, international GMS decreased as a percentage of total GMS to 29.8%, from 30.9% for the year ended December 31, 2014. We believe that the impact of currency exchange rates contributed to the year-over-year decline in percent international GMS for the reasons described below.
In the year ended December 31, 2015, approximately 10% of GMS was from goods that were not listed in U.S. dollars and, as a result, was impacted by currency exchange fluctuations. On a currency-neutral basis, GMS growth for the year ended December 31, 2015 would have been 25.2%, or approximately 1.6 percentage points higher than the reported 23.6% growth. In addition, we believe weaker local currencies in key international markets continued to dampen the demand for U.S. dollar-denominated goods during the year ended December 31, 2015, impacting both GMS growth and percent international GMS. In light of these factors, we estimate that the impact of currency translation on goods not listed in U.S. dollars and the impact of currency exchange rates on international buyer behavior reduced our year-over-year GMS growth rate by approximately two to four percentage points for the year ended December 31, 2015.
Revenue increased $77.9 million, or 39.8%, to $273.5 million in the year ended December 31, 2015 compared to the year ended December 31, 2014, of which 49.9% consisted of Seller Services revenue and 48.5% consisted of Marketplace revenue.
Marketplace revenue increased $23.9 million, or 22.0%, to $132.6 million in the year ended December 31, 2015 compared to the year ended December 31, 2014. This growth corresponded with a 23.6% increase in GMS to a total of $2.4 billion for the year ended December 31, 2015. As our GMS increased, our Marketplace revenue increased, primarily due to growth in transaction fee revenue and, to a lesser extent, an increase in listing fee revenue. Active sellers increased 15.5% to 1.6 million and active buyers increased 21.4% to 24.0 million for the year ended December 31, 2015 compared to the year ended December 31, 2014.
Seller Services revenue increased $54.1 million, or 65.6%, to $136.6 million in the year ended December 31, 2015 compared to the year ended December 31, 2014. The growth in Seller Services revenue was primarily driven by an increase in revenue from Promoted Listings, as well as increases in Direct Checkout and Shipping Labels revenue. The increase in Promoted Listings revenue was due to the re-launch of the product at the end of the third quarter of 2014. The fourth quarter of 2015 was the first full quarter following the anniversary of the re-launch of Promoted Listings. The increase in Direct Checkout revenue reflects an increase in the number of Etsy sellers using the service and the increase in overall GMS. Additionally, Direct Checkout revenue benefited from our recent integration of PayPal during the fourth quarter of 2015. The increase in Shipping Label revenue reflects a combination of an increase in the number of Etsy sellers using the service and enhancements to the product. As of December 31, 2015, 48.1% of active sellers use one or more of our Seller Services compared to 46.1% of active sellers as of December 31, 2014. For December 31, 2015, this included 16.7% of active sellers used Promoted Listings, 40.2% of active sellers used Direct Checkout and 23.9% of active sellers in the United States and Canada used Shipping Labels.
48
Other revenue decreased $0.1 million, or 2.6%, to $4.2 million in the year ended December 31, 2015 compared to the year ended December 31, 2014, mainly the result of a decrease in fees received from a third-party service provider due to the integration of PayPal into Direct Checkout late in the fourth quarter of 2015.
Cost of Revenue
Year Ended December 31, | Change | ||||||||||||||
2014 | 2015 | $ | % | ||||||||||||
(in thousands, except percentages) | |||||||||||||||
Cost of revenue | $ | 73,633 | $ | 96,979 | $ | 23,346 | 31.7 | % | |||||||
Percentage of total revenue | 37.6 | % | 35.5 | % | |||||||||||
Cost of revenue increased $23.3 million, or 31.7%, to $97.0 million in the year ended December 31, 2015 compared to the year ended December 31, 2014, primarily as a result of additional costs to support the increase in Direct Checkout revenue. To a lesser extent, the increase was due to an increase in depreciation and amortization, an increase in employee-related costs and an increase in hosting and bandwidth costs associated with ongoing maintenance of our technology infrastructure. Cost of revenue decreased as a percentage of revenue due to moderate growth in employee-related costs and costs related to our technology infrastructure as compared to the growth in higher-margin revenue streams such as Promoted Listings.
Operating Expenses
There were 819 total employees on December 31, 2015, compared with 685 on December 31, 2014.
Marketing
Year Ended December 31, | Change | ||||||||||||||
2014 | 2015 | $ | % | ||||||||||||
(in thousands, except percentages) | |||||||||||||||
Marketing | $ | 39,655 | $ | 66,771 | $ | 27,116 | 68.4 | % | |||||||
Percentage of total revenue | 20.3 | % | 24.4 | % | |||||||||||
Marketing expenses increased $27.1 million, or 68.4%, to $66.8 million in the year ended December 31, 2015 compared to the year ended December 31, 2014, primarily as a result of an increase in spending on product listing ads and employee-related expenses in our marketing team, which includes our public relations, communications and seller development teams. The increase in marketing expenses was also impacted by business changes and reorganizations that occurred at the end of the third quarter in 2014, moving certain teams that were previously focused on product-related projects into marketing. Excluding the impact of these changes, comparable marketing expenses in the year ended December 31, 2015 grew 57.4% compared to the year ended December 31, 2014.
Product development
Year Ended December 31, | Change | ||||||||||||||
2014 | 2015 | $ | % | ||||||||||||
(in thousands, except percentages) | |||||||||||||||
Product development | $ | 36,634 | $ | 42,694 | $ | 6,060 | 16.5 | % | |||||||
Percentage of total revenue | 18.7 | % | 15.6 | % | |||||||||||
Product development expenses increased $6.1 million, or 16.5%, to $42.7 million in the year ended December 31, 2015 compared to the year ended December 31, 2014, primarily as a result of an increase in employee-related expenses in our product and engineering teams. The increase in product development expenses was also impacted by business changes and reorganizations that occurred at the end of the third quarter in 2014, moving certain teams to marketing that were previously focused on product-related projects. Excluding the impact of these changes, comparable product development expenses in the year ended December 31, 2015 grew 22.5% compared to the year ended December 31, 2014.
49
General and administrative
Year Ended December 31, | Change | ||||||||||||||
2014 | 2015 | $ | % | ||||||||||||
(in thousands, except percentages) | |||||||||||||||
General and administrative | $ | 51,920 | $ | 68,939 | $ | 17,019 | 32.8 | % | |||||||
Percentage of total revenue | 26.5 | % | 25.2 | % | |||||||||||
General and administrative expenses increased $17.0 million, or 32.8%, to $68.9 million in the year ended December 31, 2015 compared to the year ended December 31, 2014, primarily driven by an increase in employee-related expenses, the $3.5 million expense related to the one-time contribution of cash and shares of our common stock to Etsy.org, and an increase in general office expense and maintenance and increased professional services.
Other Expense, net
Year Ended December 31, | Change | |||||||||||||
2014 | 2015 | $ | % | |||||||||||
(in thousands, except percentages) | ||||||||||||||
Other expense, net | $ | (4,009 | ) | $ | (26,110 | ) | $ | (22,101 | ) | NM | ||||
Percentage of total revenue | (2.0 | )% | (9.5 | )% | ||||||||||
Other expense, net increased $22.1 million to $26.1 million in the year ended December 31, 2015 compared to the year ended December 31, 2014, primarily as a result of a non-cash currency exchange loss of $21.8 million largely due to intercompany debt incurred between Etsy, Inc. and Etsy Ireland in connection with our updated global corporate structure implemented on January 1, 2015. This intercompany debt is subject to continued future currency exchange risk. The increase in other expense also reflects the mark-to-market loss related to convertible warrants of $3.1 million. As a result of the IPO, the convertible warrants are now classified as equity instruments and do not require additional mark-to-market adjustments in future periods.
Provision for Income Taxes
Year Ended December 31, | Change | |||||||||||||
2014 | 2015 | $ | % | |||||||||||
(in thousands, except percentages) | ||||||||||||||
Provision for income taxes | $ | (4,983 | ) | $ | (26,069 | ) | $ | (21,086 | ) | NM | ||||
Percentage of total revenue | (2.5 | )% | (9.5 | )% | ||||||||||
Our income tax provision for the year ended December 31, 2015 was $26.1 million. The primary driver of the income tax provision was the $17.1 million impact of our updated global corporate structure. The structure was implemented on January 1, 2015 to more closely align with our global operations and future expansion plans outside of the United States and resulted in (1) the setup of a $66.0 million deferred tax liability on the taxable gain created in the transaction and (2) a $19.7 million increase in the reserve for unrecognized tax benefits. During the year ended December 31, 2015, $13.2 million and $3.9 million were recorded to income tax expense associated with the recognition of the gain and the unrecognized tax benefits, respectively. Additional drivers of the income tax provision include $7.7 million of tax benefit for our R&D tax credit, the disallowance of the benefit of losses in certain foreign jurisdictions, the mix of income and losses in jurisdictions with a wide range of tax rates, the amount of non-deductible stock-based compensation expense, non-deductible charitable contributions, and unrealized loss on our warrant liability.
Our income tax provision for the year ended December 31, 2014 was $5.0 million. During the year ended December 31, 2014, we determined that the existence of a three-year cumulative loss in a foreign jurisdiction was sufficient negative evidence to warrant the establishment of a valuation allowance against deferred tax assets in that jurisdiction. As a result, we recorded a valuation allowance against certain of our deferred tax assets $2.1 million as of December 31, 2014. In addition, the provision
50
for income taxes was impacted by the mix of income and losses in jurisdictions with a wide range of tax rates, the amount of non-deductible stock-based compensation expense and the unrealized loss on our warrant liability.
Comparison of Years Ended December 31, 2013 and 2014
Revenue
Year Ended December 31, | Change | ||||||||||||||
2013 | 2014 | $ | % | ||||||||||||
(in thousands, except percentages) | |||||||||||||||
Revenue: | |||||||||||||||
Marketplace | $ | 78,544 | $ | 108,732 | $ | 30,188 | 38.4 | % | |||||||
Percentage of total revenue | 62.8 | % | 55.6 | % | |||||||||||
Seller Services | $ | 42,817 | $ | 82,502 | $ | 39,685 | 92.7 | % | |||||||
Percentage of total revenue | 34.2 | % | 42.2 | % | |||||||||||
Other | $ | 3,661 | $ | 4,357 | $ | 696 | 19.0 | % | |||||||
Percentage of total revenue | 2.9 | % | 2.2 | % | |||||||||||
Total revenue | $ | 125,022 | $ | 195,591 | $ | 70,569 | 56.4 | % | |||||||
GMS increased $584.1 million, or 43.3%, to $1.9 billion in the year ended December 31, 2014 compared to the year ended December 31, 2013.
During the year ended December 31, 2014, mobile GMS increased as a percentage of total GMS to approximately 37%, up from 30% for the year ended December 31, 2013 as a result of increased mobile traffic and, to a lesser extent, improvements in our mobile offerings for Etsy buyers.
For the year ended December 31, 2014, international GMS increased as a percentage of total GMS to 30.9%, from 28.4% for the year ended December 31, 2013.
Revenue increased $70.6 million, or 56.4%, to $195.6 million in the year ended December 31, 2014 compared to the year ended December 31, 2013, of which 55.6% consisted of Marketplace revenue and 42.2% consisted of Seller Services revenue.
Marketplace revenue increased $30.2 million, or 38.4%, to $108.7 million in the year ended December 31, 2014 compared to the year ended December 31, 2013. This growth corresponded with a 43.3% increase in GMS to a total of $1.9 billion for the year ended December 31, 2014. As our GMS increased, our Marketplace revenue increased, primarily due to growth in transaction fee revenue and, to a lesser extent, an increase in listing fee revenue. Active sellers increased 26.0% to 1.4 million and active buyers increased 41.2% to 19.8 million for the year ended December 31, 2014 compared to the year ended December 31, 2013.
Seller Services revenue increased $39.7 million, or 92.7%, to $82.5 million in the year ended December 31, 2014 compared to the year ended December 31, 2013. The increase in Direct Checkout services revenue reflects continued increases in U.S. Direct Checkout revenue, as well as growth in international Direct Checkout services as those services were initiated in the second quarter of 2013 and expanded throughout 2014. As of December 31, 2014, we offered Direct Checkout in 10 currencies, including the U.S. dollar. The increase in Promoted Listings revenue reflects increased adoption during the year in addition to the re-launch of an updated Promoted Listings product in the third quarter of 2014. The increase in Shipping Label revenue reflects an increase in the number of Etsy sellers using the service and, to a lesser extent, the introduction of Shipping Labels in Canada in the third quarter of 2014. As of December 31, 2014, 46.1% of active sellers use one or more of our Seller Services, 18.2% of active sellers used Promoted Listings, 36.1% of active sellers used Direct Checkout and 21.4% of active sellers in the United States and Canada used Shipping Labels.
Other revenue increased $0.7 million, or 19.0%, to $4.4 million in the year ended December 31, 2014 compared to the year ended December 31, 2013. Other revenue decreased as a percentage of total revenue, however, as Etsy buyers opted to use Direct Checkout for their purchases rather than a third-party payment processor.
51
Cost of Revenue
Year Ended December 31, | Change | ||||||||||||||
2013 | 2014 | $ | % | ||||||||||||
(in thousands, except percentages) | |||||||||||||||
Cost of revenue | $ | 47,779 | $ | 73,633 | $ | 25,854 | 54.1 | % | |||||||
Percentage of total revenue | 38.2 | % | 37.6 | % | |||||||||||
Cost of revenue increased $25.9 million, or 54.1%, to $73.6 million in the year ended December 31, 2014 compared to the year ended December 31, 2013, primarily as a result of an increase in the cost of supporting Direct Checkout revenue due to the introduction of international Direct Checkout as well as growth in the U.S. Direct Checkout revenue. To a lesser extent, the increase was due to an increase in depreciation and amortization for ongoing maintenance of our technology infrastructure and an increase in employee-related costs resulting from increased headcount in our member support and technical operations teams. Cost of revenue decreased as a percentage of revenue due to moderate growth in employee-related costs as compared to the growth in higher-margin revenue streams such as Promoted Listings.
Operating Expenses
There were 685 total employees on December 31, 2014, compared with 473 on December 31, 2013.
Marketing
Year Ended December 31, | Change | ||||||||||||||
2013 | 2014 | $ | % | ||||||||||||
(in thousands, except percentages) | |||||||||||||||
Marketing | $ | 17,850 | $ | 39,655 | $ | 21,805 | 122.2 | % | |||||||
Percentage of total revenue | 14.3 | % | 20.3 | % | |||||||||||
Marketing expenses increased $21.8 million, or 122.2%, to $39.7 million in the year ended December 31, 2014 compared to the year ended December 31, 2013, primarily as a result of an increase in spending on product listing ads and, to a lesser extent, from an increase in employee-related costs resulting from increased headcount in our marketing team, which includes our public relations and communications teams. The increase in marketing expenses was also impacted by business changes and reorganizations that occurred at the end of the third quarter in 2014, moving certain teams that were previously focused on product-related projects into marketing. Excluding the impact of these changes, comparable marketing expenses in the year ended December 31, 2014 grew 108.1% compared to the year ended December 31, 2013.
Product development
Year Ended December 31, | Change | ||||||||||||||
2013 | 2014 | $ | % | ||||||||||||
(in thousands, except percentages) | |||||||||||||||
Product development | $ | 27,548 | $ | 36,634 | $ | 9,086 | 33.0 | % | |||||||
Percentage of total revenue | 22.0 | % | 18.7 | % | |||||||||||
Product development expenses increased $9.1 million, or 33.0%, to $36.6 million in the year ended December 31, 2014 compared to the year ended December 31, 2013, primarily as a result of an increase in employee-related costs resulting from increased headcount in our product and engineering teams. The increase in product development expenses was also impacted by business changes and reorganizations that occurred at the end of the third quarter in 2014, moving certain teams to marketing that were previously focused on product-related projects. Excluding the impact of these changes, comparable product development expenses in the year ended December 31, 2014 grew 40.4% compared to the year ended December 31, 2013.
52
General and administrative
Year Ended December 31, | Change | ||||||||||||||
2013 | 2014 | $ | % | ||||||||||||
(in thousands, except percentages) | |||||||||||||||
General and administrative | $ | 31,112 | $ | 51,920 | $ | 20,808 | 66.9 | % | |||||||
Percentage of total revenue | 24.9 | % | 26.5 | % | |||||||||||
General and administrative expenses increased $20.8 million, or 66.9%, to $51.9 million in the year ended December 31, 2014 compared to the year ended December 31, 2013, primarily as a result of an increase in employee-related costs from headcount growth in general corporate functions and from building out the executive management team and, to a lesser extent, due to increased legal and accounting fees.
Other Expense, net
Year Ended December 31, | Change | |||||||||||||
2013 | 2014 | $ | % | |||||||||||
(in thousands, except percentages) | ||||||||||||||
Other expense, net | $ | (675 | ) | $ | (4,009 | ) | $ | (3,334 | ) | NM | ||||
Percentage of total revenue | (0.5 | )% | (2.0 | )% | ||||||||||
Other expense, net increased $3.3 million to $4.0 million in the year ended December 31, 2014 compared to the year ended December 31, 2013, primarily as a result of as a result of a non-cash currency exchange loss of $3.0 million due to changes in foreign exchange rates in the second half of 2014.
Provision for Income Taxes
Year Ended December 31, | Change | |||||||||||||
2013 | 2014 | $ | % | |||||||||||
(in thousands, except percentages) | ||||||||||||||
Provision for income taxes | $ | (854 | ) | $ | (4,983 | ) | $ | (4,129 | ) | NM | ||||
Percentage of total revenue | (0.7 | )% | (2.5 | )% | ||||||||||
The provision for income taxes increased $4.1 million to $5.0 million in the year ended December 31, 2014 compared to the year ended December 31, 2013.
Our income tax provision for the year ended December 31, 2014 was $5.0 million. During the year ended December 31, 2014, we determined that the existence of a three-year cumulative loss in a foreign jurisdiction was sufficient negative evidence to warrant the establishment of a valuation allowance against deferred tax assets in that jurisdiction. As a result, we recorded a valuation allowance against certain of our deferred tax assets $2.1 million as of December 31, 2014. In addition, the variance in the provision for income taxes compared to December 31, 2013 is driven by the mix of income and losses in jurisdictions with a wide range of tax rates, the amount of non-deductible stock-based compensation expense and the unrealized loss on our warrant liability.
53
Quarterly Results of Operations
The following tables show selected unaudited quarterly results of operations and other operational and non-GAAP financial data for the eight quarters ended December 31, 2015, as well as the percentage that each line item in the following results of operations data represents of revenue. The results of operations data for each of these quarters have been prepared on the same basis as the audited annual financial statements included elsewhere in this Annual Report on Form 10-K and includes all adjustments, which include only normal recurring adjustments, necessary for the fair statement of our results of operations for these periods. This data should be read in conjunction with our consolidated financial statements and related notes included elsewhere in this Annual Report on Form 10-K. Our quarterly results of operations and operational and non-GAAP financial data will vary in the future. These quarterly operating results are not necessarily indicative of our operating results for any future quarter or year.
Three Months Ended | ||||||||||||||||||||||||
Mar. 31, 2014 | June 30, 2014 | Sept. 30, 2014 | Dec. 31, 2014 | Mar. 31, 2015 | June 30, 2015 | Sept. 30, 2015 | Dec. 31, 2015 | |||||||||||||||||
(in thousands except share and per share data) | ||||||||||||||||||||||||
Revenue: | ||||||||||||||||||||||||
Marketplace | $ | 23,727 | $ | 24,777 | $ | 26,917 | $ | 33,311 | $ | 30,151 | $ | 30,469 | $ | 32,232 | $ | 39,796 | ||||||||
Seller Services | 15,833 | 16,587 | 19,392 | 30,690 | 27,279 | 29,770 | 32,329 | 47,230 | ||||||||||||||||
Other | 976 | 1,145 | 1,325 | 911 | 1,113 | 1,126 | 1,135 | 869 | ||||||||||||||||
Total revenue | 40,536 | 42,509 | 47,634 | 64,912 | 58,543 | 61,365 | 65,696 | 87,895 | ||||||||||||||||
Cost of revenue | 15,394 | 17,345 | 18,115 | 22,779 | 20,709 | 21,909 | 24,165 | 30,196 | ||||||||||||||||
Gross profit | 25,142 | 25,164 | 29,519 | 42,133 | 37,834 | 39,456 | 41,531 | 57,699 | ||||||||||||||||
Operating expenses: | ||||||||||||||||||||||||
Marketing | 7,468 | 8,766 | 8,808 | 14,613 | 12,210 | 15,543 | 16,542 | 22,476 | ||||||||||||||||
Product development | 8,042 | 8,792 | 10,077 | 9,723 | 10,009 | 10,072 | 11,406 | 11,207 | ||||||||||||||||
General and administrative | 9,213 | 11,400 | 13,686 | 17,621 | 20,457 | 17,632 | 15,250 | 15,600 | ||||||||||||||||
Total operating expenses | 24,723 | 28,958 | 32,571 | 41,957 | 42,676 | 43,247 | 43,198 | 49,283 | ||||||||||||||||
Income (loss) from operations | 419 | (3,794 | ) | (3,052 | ) | 176 | (4,842 | ) | (3,791 | ) | (1,667 | ) | 8,416 | |||||||||||
Total other (expense) income, net | (669 | ) | 235 | (1,144 | ) | (2,431 | ) | (21,019 | ) | 2,346 | (1,129 | ) | (6,308 | ) | ||||||||||
(Loss) income before income taxes | (250 | ) | (3,559 | ) | (4,196 | ) | (2,255 | ) | (25,861 | ) | (1,445 | ) | (2,796 | ) | 2,108 | |||||||||
(Provision) benefit for income taxes | (213 | ) | 408 | (2,075 | ) | (3,103 | ) | (10,725 | ) | (4,909 | ) | (4,095 | ) | (6,340 | ) | |||||||||
Net loss | $ | (463 | ) | $ | (3,151 | ) | $ | (6,271 | ) | $ | (5,358 | ) | $ | (36,586 | ) | $ | (6,354 | ) | $ | (6,891 | ) | $ | (4,232 | ) |
Net loss per share - basic and diluted | $ | (0.01 | ) | $ | (0.08 | ) | $ | (0.15 | ) | $ | (0.12 | ) | $ | (0.84 | ) | $ | (0.07 | ) | $ | (0.06 | ) | $ | (0.04 | ) |
Weighted average shares outstanding - basic and diluted | 34,512,839 | 40,155,210 | 43,015,151 | 43,177,805 | 43,703,508 | 96,503,149 | 111,329,917 | 111,677,599 | ||||||||||||||||
54
Three Months Ended | ||||||||||||||||
Mar. 31, 2014 | June 30, 2014 | Sept. 30, 2014 | Dec. 31, 2014 | Mar. 31, 2015 | June 30, 2015 | Sept. 30, 2015 | Dec. 31, 2015 | |||||||||
Revenue: | ||||||||||||||||
Marketplace | 58.5 | % | 58.3 | % | 56.5 | % | 51.3 | % | 51.5 | % | 49.7 | % | 49.1 | % | 45.3 | % |
Seller Services | 39.1 | 39.0 | 40.7 | 47.3 | 46.6 | 48.5 | 49.2 | 53.7 | ||||||||
Other | 2.4 | 2.7 | 2.8 | 1.4 | 1.9 | 1.8 | 1.7 | 1.0 | ||||||||
Total revenue | 100.0 | 100.0 | 100.0 | 100.0 | 100.0 | 100.0 | 100.0 | 100.0 | ||||||||
Cost of revenue | 38.0 | 40.8 | 38.0 | 35.1 | 35.4 | 35.7 | 36.8 | 34.4 | ||||||||
Gross profit | 62.0 | 59.2 | 62.0 | 64.9 | 64.6 | 64.3 | 63.2 | 65.6 | ||||||||
Operating expenses: | ||||||||||||||||
Marketing | 18.4 | 20.6 | 18.5 | 22.5 | 20.9 | 25.3 | 25.2 | 25.6 | ||||||||
Product development | 19.8 | 20.7 | 21.2 | 15.0 | 17.1 | 16.4 | 17.4 | 12.8 | ||||||||
General and administrative | 22.7 | 26.8 | 28.7 | 27.1 | 34.9 | 28.7 | 23.2 | 17.7 | ||||||||
Total operating expenses | 61.0 | 68.1 | 68.4 | 64.6 | 72.9 | 70.5 | 65.8 | 56.1 | ||||||||
Income (loss) from operations | 1.0 | (8.9 | ) | (6.4 | ) | 0.3 | (8.3 | ) | (6.2 | ) | (2.5 | ) | 9.6 | |||
Total other (expense) income, net | (1.7 | ) | 0.6 | (2.4 | ) | (3.7 | ) | (35.9 | ) | 3.8 | (1.7 | ) | (7.2 | ) | ||
(Loss) income before income taxes | (0.6 | ) | (8.4 | ) | (8.8 | ) | (3.5 | ) | (44.2 | ) | (2.4 | ) | (4.3 | ) | 2.4 | |
(Provision) benefit for income taxes | (0.5 | ) | 1.0 | (4.4 | ) | (4.8 | ) | (18.3 | ) | (8.0 | ) | (6.2 | ) | (7.2 | ) | |
Net loss | (1.1 | ) | (7.4 | ) | (13.2 | ) | (8.3 | ) | (62.5 | ) | (10.4 | ) | (10.5 | ) | (4.8 | ) |
Three Months Ended | ||||||||||||||||||||||||
Mar. 31, 2014 | June 30, 2014 | Sept. 30, 2014 | Dec. 31, 2014 | Mar. 31, 2015 | June 30, 2015 | Sept. 30, 2015 | Dec. 31, 2015 | |||||||||||||||||
(in thousands, except percentages) | ||||||||||||||||||||||||
Other financial and operations data(1): | ||||||||||||||||||||||||
GMS | $ | 414,833 | $ | 438,472 | $ | 467,202 | $ | 611,474 | $ | 531,915 | $ | 546,197 | $ | 568,787 | $ | 741,488 | ||||||||
Adjusted EBITDA | $ | 6,103 | $ | 3,432 | $ | 4,248 | $ | 9,298 | $ | 6,673 | $ | 4,061 | $ | 6,224 | $ | 14,049 | ||||||||
Active sellers | 1,135 | 1,191 | 1,284 | 1,353 | 1,428 | 1,484 | 1,533 | 1,563 | ||||||||||||||||
Active buyers | 15,260 | 16,490 | 18,102 | 19,810 | 20,837 | 21,697 | 22,603 | 24,046 | ||||||||||||||||
Percent mobile visits | 50.2 | % | 53.0 | % | 55.0 | % | 56.0 | % | 57.7 | % | 60.0 | % | 60.0 | % | 61.0 | % | ||||||||
Percent mobile GMS | 35.2 | % | 36.0 | % | 38.0 | % | 38.0 | % | 41.4 | % | 43.0 | % | 44.0 | % | 44.0 | % | ||||||||
Percent international GMS | 30.6 | % | 30.9 | % | 31.6 | % | 30.6 | % | 30.5 | % | 30.2 | % | 29.3 | % | 29.2 | % | ||||||||
(1) | See “—Key Operating and Financial Metrics” for the definitions of the following terms: “active buyer,” “active seller,” “GMS” and “mobile visit.” See “—Non-GAAP Financial Measures” for the definition of Adjusted EBITDA. |
55
The following table reflects the reconciliation of net loss to Adjusted EBITDA for each of the periods indicated (in thousands):
Three Months Ended | ||||||||||||||||||||||||
Mar. 31, 2014 | June 30, 2014 | Sept. 30, 2014 | Dec. 31, 2014 | Mar. 31, 2015 | June 30, 2015 | Sept. 30, 2015 | Dec. 31, 2015 | |||||||||||||||||
Net loss | $ | (463 | ) | $ | (3,151 | ) | $ | (6,271 | ) | $ | (5,358 | ) | $ | (36,586 | ) | $ | (6,354 | ) | $ | (6,891 | ) | $ | (4,232 | ) |
Excluding: | ||||||||||||||||||||||||
Interest and other non-operating expense, net | 53 | 107 | 165 | 224 | 178 | 308 | 453 | 263 | ||||||||||||||||
Provision (benefit) for income taxes | 213 | (408 | ) | 2,075 | 3,103 | 10,725 | 4,909 | 4,095 | 6,340 | |||||||||||||||
Depreciation and amortization | 3,895 | 4,132 | 4,465 | 4,731 | 4,341 | 4,732 | 4,968 | 4,509 | ||||||||||||||||
Stock-based compensation expense | 1,176 | 1,737 | 1,299 | 1,708 | 2,133 | 2,222 | 2,204 | 2,422 | ||||||||||||||||
Stock-based compensation expense —acquisitions | — | 348 | 1,448 | 2,334 | 1,841 | 598 | 719 | (1,298 | ) | |||||||||||||||
Net unrealized loss (gain) on warrant and other liabilities | 616 | (342 | ) | (35 | ) | 172 | (12 | ) | 3,151 | (3 | ) | (3 | ) | |||||||||||
Foreign exchange loss (gain) | — | — | 1,014 | 2,035 | 20,853 | (5,805 | ) | 679 | 6,048 | |||||||||||||||
Acquisition-related expenses | 613 | 1,009 | 88 | 349 | — | — | — | — | ||||||||||||||||
Contribution to Etsy.org | — | — | — | — | 3,200 | 300 | — | — | ||||||||||||||||
Adjusted EBITDA | $ | 6,103 | $ | 3,432 | $ | 4,248 | $ | 9,298 | $ | 6,673 | $ | 4,061 | $ | 6,224 | $ | 14,049 | ||||||||
Seasonality
Etsy sellers experience increased sales and use more Seller Services during the fourth-quarter holiday shopping season. This has resulted in increased revenue for us during the fourth quarter of each fiscal year, which can compare to lower revenue in the first quarter of the following fiscal year. For example, revenue in the first quarter of 2015 decreased slightly when compared with revenue in the fourth quarter of 2014. We expect this seasonality to continue in future years. Our cost of revenue and marketing expenses also follow this trend, with the highest costs corresponding with the fourth quarter and lower costs in the first quarter of the following fiscal year. Our operating (loss) income has also been affected by these historical trends because many of our expenses are relatively fixed in the short term. As our growth rates begin to moderate, the impact of these seasonality trends on our results of operations may become more pronounced.
Our quarterly revenue increased sequentially quarter-to-quarter for all periods presented above, other than the first quarter of 2015, corresponding to our GMS performance in the same periods. We cannot assure you that this pattern of sequential revenue growth will continue. We believe that it is generally more meaningful to compare year-over-year results than sequential quarter-over-quarter results.
Our business is directly affected by the behavior of consumers. Economic conditions and competitive pressures can significantly impact, both positively and negatively, the level of demand by Etsy sellers and Etsy buyers on our platform. Consequently, the results of any prior quarterly or annual periods should not be relied upon as indications of our future operating performance.
56
Liquidity and Capital Resources
The following tables show our cash and cash equivalents, short-term investments, accounts receivable and working capital as of the dates indicated:
As of December 31, | ||||||||
2014 | 2015 | |||||||
(in thousands) | ||||||||
Cash and cash equivalents | $ | 69,659 | $ | 271,244 | ||||
Short-term investments | 19,184 | 21,620 | ||||||
Accounts receivable, net | 15,404 | 20,275 | ||||||
Working capital | 85,608 | 278,932 | ||||||
As of December 31, 2015, our cash and cash equivalents, a majority of which were held in cash deposits and money market funds, were held for working capital purposes and to invest in the build-out of our new Brooklyn, New York headquarters and other capital expenditures related to new office spaces globally to support the growth in our business and operations. Through December 31, 2015, we have invested approximately $11.0 million into the new Brooklyn, New York headquarters, and we intend to invest up to an additional $40.0 million through the middle of 2016.
We believe that our existing cash and cash equivalents and short-term investments, together with cash generated from operations and available borrowing capacity under our Credit Agreement, will be sufficient to meet our anticipated cash needs for at least the next 12 months. However, our liquidity assumptions may prove to be incorrect, and we could exhaust our available financial resources sooner than we currently expect. We may seek to borrow funds under our Credit Agreement or raise additional funds at any time through equity, equity-linked or debt financing arrangements. Our future capital requirements and the adequacy of available funds will depend on many factors, including those described in "—Key Factors Affecting Our Performance" above and the Risk Factors section of this Annual Report on Form 10-K. We may not be able to secure additional financing to meet our operating requirements on acceptable terms, or at all.
Sources of Liquidity
Prior to our initial public offering, or IPO, we financed our operations and capital expenditures primarily through cash flows generated by operations and through non-registered sales of preferred stock and common stock. Since inception and prior to the completion of our IPO, we have raised a total of $131.6 million from the sale of preferred stock and common stock (including proceeds from the exercise of stock options), net of costs and expenses associated with such financings.
On April 21, 2015, we closed our IPO, in which we issued and sold 13,333,333 shares of common stock at a public offering price of $16.00 per share. We received net proceeds of $194.4 million after deducting underwriting discounts of $13.9 million and other offering expenses of approximately $5.1 million. These expenses were recorded against the proceeds received from the IPO. In addition, we incurred approximately $300,000 in IPO-related expenses not deductible from IPO proceeds.
Credit Facility
In May 2014, we entered into a $35.0 million senior secured revolving credit facility pursuant to a Revolving Credit and Guaranty Agreement with several lenders, or the Credit Agreement. In March 2015, we amended the Credit Agreement to increase the credit facility to $50.0 million. In December 2015, we amended the Credit Agreement to clarify certain provisions relating to permitted investments and to make other immaterial updates. As amended, the Credit Agreement will mature in May 2019. The amended Credit Agreement includes a letter of credit sublimit of $10.0 million and a swingline loan sublimit of $15.0 million.
Borrowings under the amended Credit Agreement (other than swingline loans) bear interest, at our option, at (i) a base rate equal to the highest of (a) the prime rate, (b) the federal funds rate plus 0.50% and (c) an adjusted LIBOR rate for a one-month interest period plus 1.00%, in each case plus a margin ranging from 0.00% to 0.25% or (ii) an adjusted LIBOR rate plus a margin ranging from 1.00% to 1.25%. Swingline loans under the amended Credit Agreement bear interest at the same base rate (plus the margin applicable to borrowings bearing interest at the base rate). These margins are determined based on the total leverage ratio for the preceding four fiscal quarters. We are also obligated to pay other customary fees for a credit facility of this size and type, including an unused commitment fee and fees associated with letters of credit. As amended, the Credit Agreement also permits us, in certain circumstances, to request an increase in the facility by an additional amount of up to $50.0 million (and in minimum amounts of $10.0 million) at the same maturity, pricing and other terms.
57
The amended Credit Agreement contains customary representations and warranties applicable to us and our subsidiaries and customary affirmative and negative covenants applicable to us and our restricted subsidiaries. The negative covenants include restrictions on, among other things, indebtedness, liens, investments, mergers, dispositions, transactions with affiliates and dividends and other distributions. These restrictions do not prohibit any of our subsidiaries from making pro rata payments to us or any other person that owns an equity interest in any such subsidiary. The amended Credit Agreement contains a financial covenant that requires us and our subsidiaries to maintain a total leverage ratio (defined as net debt to adjusted EBITDA) not to exceed 3.50 to 1.00.
As amended, the Credit Agreement includes customary events of default, including a change in control and a cross-default on our material indebtedness. Our obligations under the amended Credit Agreement are secured by substantially all of our and our subsidiaries’ assets, and our obligations under the amended Credit Agreement are guaranteed by certain of our subsidiaries.
As of March 1, 2016, no amounts have been drawn under the credit facility.
Historical Cash Flows
Year Ended December 31, | ||||||||||||
2013 | 2014 | 2015 | ||||||||||
(in thousands) | ||||||||||||
Cash provided by (used in): | ||||||||||||
Operating activities | $ | 16,542 | $ | 12,087 | $ | 29,211 | ||||||
Investing activities | (15,025 | ) | (20,723 | ) | (23,283 | ) | ||||||
Financing activities | (103 | ) | 45,237 | 199,608 | ||||||||
Net Cash Provided by Operating Activities
Our cash flows from operations are largely dependent on the amount of revenue generated on our platform. Net cash provided by operating activities in each period presented has been influenced by changes in accounts receivable, funds receivable and customer accounts, prepaid expenses and other current assets, accounts payable and accrued liabilities and funds payable and amounts due to customers.
Net cash provided by operating activities was $29.2 million in the year ended December 31, 2015, as a result of the net loss of $54.1 million, depreciation and amortization expense, stock-based compensation expense, foreign exchange loss, amortization of deferred tax charges and other non-cash charges of $74.0 million and changes in our operating assets and liabilities that provided $9.3 million in cash.
Net cash provided by operating activities was $12.1 million in the year ended December 31, 2014, as a result of net loss of 15.2 million, depreciation and amortization expense, stock-based compensation expense and other non-cash charges of $27.9 million and changes in our operating assets and liabilities that used $0.6 million in cash.
Net cash provided by operating activities was $16.5 million in the year ended December 31, 2013, as a result of net loss of $0.8 million, depreciation and amortization expense, stock-based compensation expense and other non-cash charges of $18.3 million and changes in our operating assets and liabilities that used $1.0 million in cash.
Net Cash Used in Investing Activities
Our primary investing activities have consisted of capital expenditures, including investments in website development and internal-use software and purchases of property and equipment to support our overall business growth. Investments in website development and internal-use software and purchases of property and equipment may vary from period to period due to timing of the expansion of our operations. Additionally, we have invested some of our excess cash balances in U.S. Government and agency bills.
Net cash used in investing activities was $23.3 million in the year ended December 31, 2015. This was primarily attributable to $20.8 million in capital expenditures, including $11.1 million for purchases of property and equipment and $9.7 million for website development and internal-use software, and net purchases of marketable securities of $2.5 million.
Net cash used in investing activities was $20.7 million in the year ended December 31, 2014. This was primarily attributable to $5.3 million in restricted cash associated with the lease of our new Brooklyn, New York headquarters, $4.7 million in cash paid to acquire businesses, capital expenditures, including $8.3 million for website development and internal-use software and $1.3 million for purchases of property and equipment, and net purchases of marketable securities of $1.1 million.
58
Net cash used in investing activities was $15.0 million in the year ended December 31, 2013. This was primarily attributable to capital expenditures, including $9.3 million for website development and internal-use software and $7.8 million for purchases of property and equipment, offset by sales of marketable securities of $2.8 million.
Net Cash Provided by (Used in) Financing Activities
Net cash provided by financing activities was $199.6 million in the year ended December 31, 2015. This was primarily attributable to proceeds from our initial public offering of $199.5 million, the excess tax benefit from the exercise of stock options of $3.9 million and proceeds from the exercise of stock options of $3.6 million, offset by payments related to our public offering of $4.0 million and payments on capitalized lease obligations of $3.4 million.
Net cash provided by financing activities was $45.2 million in the year ended December 31, 2014. This was primarily attributable to net proceeds from a common stock financing of $35.0 million, proceeds from the exercise of stock options of $8.0 million and the excess tax benefit from the exercise of stock options of $4.9 million, offset by payments related to our public offering of $1.0 million and payments on capitalized lease obligations of $1.5 million.
Net cash used in financing activities was $0.1 million in the year ended December 31, 2013. This was primarily attributable to payments on capitalized lease obligations of $1.3 million, offset by proceeds from the exercise of stock options of $1.3 million.
Off-Balance Sheet Arrangements
We did not have any off-balance sheet arrangements, as defined in Item 303(a)(4)(ii) of Regulation S-K, in 2013, 2014 or 2015.
Contractual Obligations
The following table summarizes our future fixed contractual obligations as of December 31, 2015 (in thousands):
Total | Less than 1 Year | 1–3 Years | 3–5 Years | More than 5 Years | ||||||||||||||||
Capital lease obligations | $ | 13,181 | $ | 5,610 | $ | 7,571 | $ | — | $ | — | ||||||||||
Operating lease obligations | 31,885 | 3,716 | 6,813 | 7,555 | 13,801 | |||||||||||||||
Long-term debt | 489 | 114 | 250 | 125 | — | |||||||||||||||
Interest payments | 2,189 | 1,401 | 788 | — | — | |||||||||||||||
Facility financing obligations | 93,425 | — | 15,264 | 18,973 | 59,188 | |||||||||||||||
Purchase obligations | 35,276 | 32,115 | 3,161 | — | — | |||||||||||||||
Total contractual obligations | $ | 176,445 | $ | 42,956 | $ | 33,847 | $ | 26,653 | $ | 72,989 | ||||||||||
Capital lease obligations consist of obligations under capital leases for computer equipment.
Operating lease obligations consist of obligations under non-cancelable operating leases for our existing and new headquarters (both in Brooklyn, New York) and for our offices in San Francisco, Hudson (New York), London, Dublin, Paris and Berlin.
Long-term debt consists of obligations we assumed in connection with our acquisition of Incubart SAS.
Interest payments consist of interest due in connection with our capital leases.
Facility financing obligations consist of the portion of our obligations for our new headquarters in Brooklyn, New York that is accounted for as a build-to-suit lease.
Purchase obligations consist of commitments for our co-location and other support services. For those agreements with variable terms, we do not estimate what the total obligation may be beyond any minimum quantities and/or pricing.
In addition, we have uncertain tax positions of $22.2 million and non-income tax related contingency reserves of $2.6 million, which are not reflected in the table as the ultimate resolution and timing are uncertain.
59
Critical Accounting Policies and Significant Judgments and Estimates
Our management’s discussion and analysis of our financial condition and results of operations is based on our consolidated financial statements, which have been prepared in accordance with GAAP. The preparation of these consolidated financial statements requires us to make estimates and assumptions that affect the reported amounts of assets, liabilities, revenue, expenses and related disclosures. We evaluate our estimates and assumptions on an ongoing basis. Our estimates are based on historical experience and various other assumptions that we believe to be reasonable under the circumstances. Our actual results could differ from these estimates.
We believe that the assumptions and estimates associated with revenue recognition, income taxes, website development costs and internal-use software, purchase price allocations for business combinations, valuation of goodwill and intangible assets, leases and stock-based compensation have the greatest potential impact on our consolidated financial statements. Therefore, we consider these to be our critical accounting policies and estimates. For further information on all of our significant accounting policies, see "Note 1—Basis of Presentation and Summary of Significant Accounting Policies" in the Notes to Consolidated Financial Statements.
Revenue Recognition
We operate a platform for third-party sellers. Our business model is based on shared success: we make money when Etsy sellers make money, and we offer services to help Etsy sellers be more successful. We do not compete with Etsy sellers, hold inventory or sell goods. Our revenue is diversified, generated from a mix of marketplace activities and the services we provide Etsy sellers to help them create and grow their businesses. Our revenue consists of Marketplace revenue, Seller Services revenue and Other revenue. Our revenue is recorded net of actual and expected refunds. Marketplace revenue includes the fee an Etsy seller pays for each completed transaction and the listing fee an Etsy seller pays for each item she lists. Seller Services revenue includes fees an Etsy seller pays for services such as prominent placement in search results via Promoted Listings, payment processing via Direct Checkout and purchases of shipping labels through our platform via Shipping Labels. We deduct our cost of shipping labels and estimated refunds from gross shipping fees to determine net shipping fees. Other revenue includes the fees we receive from a third-party payment processor and derecognized funds we receive from a third-party for unused Etsy Gift Cards.
We recognize revenue when all of the following conditions are satisfied: (1) there is persuasive evidence of an arrangement; (2) the service has been provided to the Etsy seller; (3) the collection of fees is reasonably assured; and (4) the amount of fees to be paid by the Etsy seller is fixed or determinable. We evaluate whether it is appropriate to recognize revenue on a gross or net basis based upon our evaluation of whether we: are the primary obligor in a transaction, have inventory risk and have latitude in establishing pricing and selecting suppliers. Based on our evaluation of these factors, revenue is recorded net of merchandise values associated with the transaction.
Marketplace revenue. Marketplace revenue consists of the 3.5% fee that an Etsy seller pays for each completed transaction on our platform, exclusive of shipping fees charged. Marketplace revenue also consists of a listing fee of $0.20 per item that she lists in our marketplace. Revenue from completed Wholesale transactions is included in Marketplace revenue. Transaction fees are recognized when the corresponding transaction is made. Listing fees are recognized ratably over a four-month listing period, unless the item is sold or the seller relists it, at which time any remaining listing fee is recognized.
Seller Services revenue. Seller Services revenue consists of fees an Etsy seller pays us for the Seller Services she uses, including Promoted Listings, Direct Checkout and Shipping Labels.
• | Revenue from Promoted Listings consists of cost-per-click based fees an Etsy seller pays us for prominent placement of her listings in search results generated by Etsy buyers in our marketplace. Revenue is recognized when the Promoted Listing is clicked. |
• | Revenue from Direct Checkout consists of fees an Etsy seller pays us to process credit, debit and Etsy Gift Card payments. Direct Checkout fees vary between 3–4% of the item’s total sale price plus a flat fee per order, depending on the country in which her bank account is located. Direct Checkout fees are based on the item’s total sale price, including shipping. Revenue from Direct Checkout is recognized when the corresponding transaction is made. |
• | Revenue from Shipping Labels consists of fees an Etsy seller pays us when she purchases shipping labels through our platform, net of the cost we incur in purchasing those shipping labels. We are able to provide our sellers shipping labels from the United States Postal Service and Canada Post at a discounted price due to the volume of purchases through our |
60
platform. We recognize Shipping Label revenue when an Etsy seller purchases a shipping label. We recognize Shipping Label revenue on a net basis as we are not the primary obligor in the delivery of these services.
Other revenue. Other revenue includes the fees we receive from a third-party payment processor, which are recognized as the transactions are processed by the third-party payment processor, and derecognized funds we receive from a third party for unused Etsy Gift Cards, which are recognized when the third party approves the release of these funds.
Website Development and Internal-Use Software
We capitalize certain costs incurred in connection with software developed for our platform and software developed for internal use. In accordance with authoritative accounting guidance, we begin to capitalize our costs to develop software when preliminary development efforts are successfully completed, management has authorized and committed project funding and it is probable that the project will be completed and the software will be used as intended. We also capitalize costs related to upgrades and enhancements when it is probable the expenditures will result in additional functionality or will extend the useful life of existing functionality. These costs are amortized over the estimated useful life of the asset, typically three years.
We periodically review these assets to determine whether the projects will be completed, placed in service, removed from service or replaced by other internally-developed or third-party software; if an asset is not expected to provide any future benefit, the asset is retired and any unamortized cost is expensed.
Costs related to the design or maintenance of software developed for our platform and software developed for internal use are expensed as incurred.
Business Combinations, Goodwill and Intangible Assets
We have completed a number of acquisitions of other businesses in the past and may acquire additional businesses or technologies in the future. The results of businesses acquired in a business combination are included in our consolidated financial statements from the date of acquisition. We allocate the purchase price, which is the sum of the consideration provided and may consist of cash, equity or a combination of the two, in a business combination to the identifiable assets and liabilities of the acquired business at their acquisition date fair values. The excess of the purchase price over the amount allocated to the identifiable assets and liabilities, if any, is recorded as goodwill. Determining the fair value of assets acquired and liabilities assumed requires management to use significant judgment and estimates, including the selection of valuation methodologies, estimates of future revenues and cash flows, discount rates and selection of comparable companies.
When we issue stock-based or cash awards to an acquired company’s stockholders, we evaluate whether the awards are contingent consideration or compensation for post-acquisition services. The evaluation includes, among other things, whether the vesting of the awards is contingent on the continued employment of the acquired company’s stockholder beyond the acquisition date. If continued employment is required for vesting, the awards are treated as compensation for post-acquisition services and recognized as expense over the requisite service period.
We carry intangible assets at cost, and we amortize them on a straight-line basis, which approximates the pattern of the benefits derived, over their estimated useful lives, typically three to five years. When circumstances indicate that the carrying value of these assets may not be recoverable, we review our identifiable amortizable intangible assets for impairment.
Goodwill is not amortized but is tested for impairment annually in the fourth quarter, as well as when events indicate that the carrying amount of this asset may exceed its fair value. The assessment is performed at the reporting unit level using the two-step goodwill impairment test to identify potential goodwill impairment. The first step is to compare the fair value of the reporting unit to the book value including goodwill. If the fair value of the reporting unit exceeds the book value, goodwill is not impaired. If the book value exceeds the fair value, the second step of the process is performed to measure the amount of the impairment. The accounting guidance also allows for a simplified approach to testing for impairment, in
which a company can assess certain qualitative factors (referred to as “step zero”) to determine whether it is more likely than not that the fair value of the reporting unit is less than its carrying amount. If that is the case, the entity must perform the quantitative analysis.
No impairment of goodwill was recorded at December 31, 2014 or 2015.
61
Leases
We lease office space and certain computer equipment in multiple locations under non-cancelable lease agreements. The leases are reviewed for classification as operating or capital leases. For operating leases, rent is recognized on a straight-line basis over the lease period. For capital leases, we record the leased asset with a corresponding liability. Payments are recorded as reductions to the liability with an appropriate interest charge recorded based on their outstanding remaining liability.
We consider the nature of the renovations and our involvement during the construction period of newly-leased office space to determine if we are considered to be the owner of the construction project during the construction period. If we determine that we are the owner of the construction project, we are required to capitalize the fair value of the building as well as the construction costs incurred on our consolidated balance sheet along with a corresponding financing liability (“build-to-suit accounting”). Upon occupancy for build-to-suit leases, we assess whether the circumstances qualify for sales recognition under the sale-leaseback accounting guidance. If the lease meets the sale-leaseback criteria, we will remove the asset and related financial obligation from the balance sheet and treat the building lease as an operating lease. If upon completion of construction, the project does not meet the “sale-leaseback” criteria, the leased property will be treated as a capital lease for financial reporting purposes.
Income Taxes
We account for income tax benefit (provision) based on (loss) income before income taxes, and we use the asset and liability method. Deferred tax assets and liabilities are recognized for the future tax consequences attributable to differences between the financial statement carrying amounts of existing assets and liabilities and their respective tax bases, and operating loss and tax credit carryforwards. Deferred tax assets and liabilities are measured using enacted tax rates expected to apply to taxable income in the years in which those temporary differences are expected to be recovered or settled. The effect on deferred tax assets and liabilities of a change in tax rates is recognized as income or expense in the period that includes the enactment date. We assess the need for a valuation allowance on a quarterly basis to reduce deferred tax assets to the amounts we expect to be realized.
We account for uncertainty in income taxes using a recognition threshold and a measurement attribute for the financial statement recognition and measurement of tax positions taken or expected to be taken in a tax return. For benefits to be recognized, a tax position must be more likely than not to be sustained upon examination by the taxing authorities. The amount recognized is measured as the largest amount of benefit that has a greater than 50% likelihood of being realized upon ultimate audit settlement. We have an unrecognized tax benefit of $0.4 million and $22.2 million at December 31, 2014 and 2015, respectively.
We recognize interest and penalties, if any, associated with tax matters as part of the income tax provision and include accrued interest and penalties with the related tax liability in our consolidated balance sheet.
Stock-Based Compensation
Stock options and restricted stock units ("RSUs") are awarded to employees, members of our board of directors and non-employee third parties are measured at fair value at each grant date. Stock options generally vest over a four-year period with 25% of the shares underlying the options vesting on the date that is 12 months after the vesting commencement date and thereafter 1/48th of the shares vesting each month, subject to continued service with us through each vesting date. RSUs generally vest 25% after the first year following the vesting commencement date, which is the first day of the fiscal quarter closest to the date of grant, and then vest ratably each quarter over the remaining 12-quarter period contingent on continued employment with us on each vesting date.
Stock-based compensation cost is measured on the grant date, based on the estimated fair value of the award using a Black-Scholes pricing model and recognized as an expense over the employee’s or director’s requisite service period on a straight-line basis. The fair value of RSUs is determined based on the closing price of our common stock on Nasdaq on the grant date. We expect to continue to grant stock options and RSUs in the future, and, to the extent that we do, our stock-based compensation expense recognized in future periods will likely increase.
We account for stock-based compensation arrangements with non-employees using a fair value approach. The fair value of these options is measured using the Black-Scholes option-pricing model reflecting the same assumptions as applied to employee options in each of the reported periods, other than the expected life, which is assumed to be the contractual life of the option. The compensation costs of these arrangements are subject to remeasurement over the vesting terms as earned.
62
We account for stock-based compensation arrangements in restricted shares, subject to a put option that allows the holder of the shares to put the shares back to us for cash, as liability-classified stock awards. These awards are re-measured at each reporting period, with changes in fair value being charged to the statement of operations. Compensation expense is recognized using a graded vesting methodology for each separately vesting tranche of the award as though the award were, in substance, multiple awards. Unless the put option is exercised, the restricted shares will be reclassified from a liability to an equity classified award upon the termination of the put option.
Key Assumptions
Our Black-Scholes option-pricing model requires the input of highly subjective assumptions, including the fair value of the underlying common stock, the expected volatility of the price of our common stock, risk-free interest rates, the expected term of the option and the expected dividend yield of our common stock. These estimates involve inherent uncertainties and the application of management’s judgment. If factors change and different assumptions are used, our stock-based compensation expense could be materially different in the future.
• | Fair Value of Our Common Stock. Prior to our initial public offering in April 2015, our board of directors considered numerous objective and subjective factors to determine the fair value of our common stock at each meeting at which awards were approved. The factors included: contemporaneous third-party valuations of our common stock; the prices, rights, preferences and privileges of our preferred stock relative to those of our common stock; the prices of preferred stock sold by us to third-party investors in arms-length transactions; the prices of common stock sold to third-party investors by us and in secondary transactions or repurchased by us in arms-length transactions; the lack of marketability of our common stock; our operating and financial results; current business conditions and projections; and the likelihood of achieving a liquidity event, such as an initial public offering or sale of our company, given then prevailing market conditions. Since our initial public offering, we have used the market closing price for our common stock as reported on the Nasdaq to determine the fair value of our common stock. |
• | Expected Volatility. As we do not have a sufficient trading history for our common stock, the expected stock price volatility for our common stock is estimated by taking the average historical price volatility for industry peers based on daily price observations over a period equivalent to the expected term of the stock option grants. Industry peers, which we have selected, consist of several public companies in the industry similar in size, stage of life cycle and financial leverage. We intend to continue to consistently apply this process using the same or similar public companies until a sufficient amount of historical information regarding the volatility of our own common stock share price becomes available, or unless circumstances change such that the identified companies are no longer similar to us, in which case more suitable companies whose share prices are publicly available would be used in the calculation. |
• | Risk-free Interest Rate. The risk-free interest rate is based on the yields of U.S. Treasury securities with maturities similar to the expected term of the options for each option group. |
• | Expected Term. The expected term represents the period that our stock-based awards are expected to be outstanding. As we do not have sufficient historical experience for determining the expected term of the stock option awards granted, we base our expected term for awards issued to employees or members of our board of directors on the simplified method, which represents the average period from vesting to the expiration of the stock option. For grants to non-employees, the expected term is equal to the contractual term, which is generally ten years. |
• | Expected Dividend Yield. We have never declared or paid any cash dividends to common stockholders and do not presently plan to pay cash dividends in the foreseeable future. Consequently, we use an expected dividend yield of zero. |
In determining the fair value of stock options granted, the following weighted average assumptions were used in the Black-Scholes option-pricing model for awards granted in the periods indicated:
Year Ended December 31, | ||||||
2013 | 2014 | 2015 | ||||
Assumptions: | ||||||
Expected volatility | 45.7% - 50.3% | 43.0% - 49.0% | 40.4% - 45.0% | |||
Risk-free interest rate | 0.9% - 1.9% | 1.7% - 2.1% | 1.3% - 1.9% | |||
Expected term (in years) | 5.48 - 6.08 | 5.46 - 6.08 | 5.5 - 6.1 | |||
Dividend rate | —% | —% | —% | |||
63
Recent Accounting Pronouncements
Under the JOBS Act, we meet the definition of an emerging growth company. We have irrevocably elected to opt out of the extended transition period for complying with new or revised accounting standards pursuant to Section 107(b) of the JOBS Act.
In May 2014, the Financial Accounting Standards Board, or FASB issued an accounting standards update that replaces existing revenue recognition guidance. The new guidance is effective for annual and interim periods beginning after December 15, 2017. Among other things, the updated guidance requires companies to recognize revenue in a way that depicts the transfer of promised goods or services to customers in an amount that reflects the consideration to which the entity expects to be entitled in exchange for those goods or services. We are currently evaluating the effect the guidance will have on our consolidated financial statements.
In August 2014, the FASB issued an accounting standard update under which management will be required to assess an entity’s ability to continue as a going concern and provide related disclosures in certain circumstances. The new guidance is effective for annual and interim periods beginning after December 15, 2016. The adoption of this guidance is not expected to have an impact on our consolidated financial statements or disclosures.
In April 2015, the FASB issued an accounting standard under which customers will apply the same criteria as vendors to determine whether a cloud computing arrangement contains a software license or is solely a service contract. The new standard is effective for annual and interim periods beginning after December 15, 2015. We have evaluated the effect this guidance will have on our consolidated financial statements and do not believe the impact to be material.
In August 2015, the FASB issued an accounting standard update to address the presentation and subsequent measurement of debt issuance costs related to line-of-credit arrangements. The guidance affirms our treatment of such costs, which is to defer and present the debt issuance costs as an asset and subsequently amortize the costs over the term of the line-of-credit arrangement. The new standard is effective for annual and interim periods beginning after December 15, 2015. The adoption of this guidance is not expected to have an impact on our consolidated financial statements or disclosures.
In September 2015, the FASB issued an accounting standard update that eliminates the requirement that an acquirer in a business combination account for measurement-period adjustments retrospectively. Instead, an acquirer will recognize a measurement-period adjustment during the period in which it determines the amount of the adjustment. The new guidance is effective for annual and interim periods beginning after December 15, 2015. The adoption of this guidance is not expected to have an impact on our consolidated financial statements or disclosures.
In November 2015, the FASB issued an accounting standard update that requires a reporting entity to classify deferred tax assets and liabilities as noncurrent in a classified statement of financial position. Current guidance requiring the offsetting of deferred tax assets and liabilities of a tax-paying component of an entity and presentation as a single noncurrent amount is not affected. The new guidance is effective for annual and interim periods beginning after December 15, 2015, and early adoption is permitted for financial statements as of the beginning of an interim or annual reporting period. We made the decision to adopt this guidance early and have applied it retroactively in the current fiscal period. The adoption of this guidance has impacted the current and noncurrent deferred tax asset and liability balances for the current and prior fiscal years on the consolidated balance sheets. As a result of this retroactive application, $2.9 million previously included in deferred tax assets—current was reclassified to offset deferred tax liabilities on the consolidated balance sheets for 2014.
Item 7A. Quantitative and Qualitative Disclosures About Market Risk.
We have operations both within the United States and internationally and we are exposed to market risks in the ordinary course of our business, including the effects of interest rate changes and foreign currency fluctuations. Information relating to quantitative and qualitative disclosures about these market risks is described below.
Interest Rate Sensitivity
Cash and cash equivalents and short-term investments as of December 31, 2015 were held primarily in cash deposits and money market funds. The fair value of our cash, cash equivalents and short-term investments would not be significantly affected by either an increase or decrease in interest rates due mainly to the short-term nature of these instruments. As of December 31, 2015, no amounts were outstanding under our credit facility. Any future borrowings incurred under the credit facility would accrue interest at a floating rate based on a formula tied to certain market rates at the time of incurrence (as
64
described above). A 10% increase or decrease in our current interest rate would not have a significant impact on our interest expense.
Currency Risk
Approximately 90% of our GMS is denominated in U.S. dollars, and therefore, the resulting revenue is not subject to foreign currency risk. However, in the year ended December 31, 2015, approximately 10% of GMS was from goods that were not listed in U.S. dollars and, as a result, was impacted by currency exchange fluctuations. On a currency-neutral basis, GMS growth for the year ended December 31, 2015 would have been 25.2%, or approximately 1.6 percentage points higher than the reported 23.6% growth. In addition, we believe weaker local currencies in key international markets continued to dampen the demand for U.S. dollar-denominated goods during the year ended December 31, 2015, impacting both GMS growth and percent international GMS. In light of these factors, we estimate that the impact of currency translation on goods not listed in U.S. dollars and the impact of currency exchange rates on international buyer behavior reduced our year-over-year GMS growth rate by approximately two to four percentage points for the year ended December 31, 2015.
Our operating expenses are denominated in the currencies of the countries in which our operations are located, and may be subject to fluctuations due to changes in currency exchange rates, particularly changes in the Pound Sterling and Euro. Fluctuations in currency exchange rates may cause us to recognize transaction gains and losses in our statement of operations.
On January 1, 2015, we implemented a revised corporate structure to more closely align our structure with our global operations and future expansion plans outside of the United States, which resulted in a U.S. dollar-denominated intercompany debt on a Euro-denominated ledger that may be subject to continued currency exchange rate risk. A 10% increase or decrease in current exchange rates could result in an increase or decrease to currency exchange (loss) gain of $24.8 million.
65
Item 8. Financial Statements and Supplementary Data.
The supplementary financial information required by this item is included in “Management’s Discussion and Analysis of Financial Condition and Results of Operations.”
Etsy, Inc.
Index to the Consolidated Financial Statements
Report of Independent Registered Public Accounting Firm | |
Consolidated Balance Sheets | |
Consolidated Statements of Operations | |
Consolidated Statements of Comprehensive Loss | |
Consolidated Statements of Changes in Convertible Preferred Stock and Stockholders’ Equity | |
Consolidated Statements of Cash Flows | |
Notes to Consolidated Financial Statements | |
66

Report of Independent Registered Public Accounting Firm
To the Stockholders and Board of Directors of Etsy, Inc.:
In our opinion, the accompanying consolidated balance sheets and the related consolidated statements of operations, comprehensive loss, changes in convertible preferred stock and stockholders’ equity and cash flows present fairly, in all material respects, the financial position of Etsy, Inc. and its subsidiaries at December 31, 2015 and 2014, and the results of their operations and their cash flows for each of the three years in the period ended December 31, 2015 in conformity with accounting principles generally accepted in the United States of America. These financial statements are the responsibility of the Company’s management. Our responsibility is to express an opinion on these financial statements based on our audits. We conducted our audits of these statements in accordance with the standards of the Public Company Accounting Oversight Board (United States). Those standards require that we plan and perform the audit to obtain reasonable assurance about whether the financial statements are free of material misstatement. An audit includes examining, on a test basis, evidence supporting the amounts and disclosures in the financial statements, assessing the accounting principles used and significant estimates made by management, and evaluating the overall financial statement presentation. We believe that our audits provide a reasonable basis for our opinion.
/s/ PricewaterhouseCoopers LLP
New York, New York
March 1, 2016
67
Consolidated Balance Sheets
(In thousands except share and per share data)
As of December 31, | |||||||
2014 | 2015 | ||||||
ASSETS | |||||||
Current assets: | |||||||
Cash and cash equivalents | $ | 69,659 | $ | 271,244 | |||
Short-term investments | 19,184 | 21,620 | |||||
Accounts receivable, net of allowance for doubtful accounts of $1,841 and $2,071 as of December 31, 2014 and December 31, 2015, respectively | 15,404 | 20,275 | |||||
Prepaid and other current assets | 12,241 | 9,521 | |||||
Deferred tax charge—current | — | 17,132 | |||||
Funds receivable and seller accounts | 10,573 | 19,262 | |||||
Total current assets | 127,061 | 359,054 | |||||
Restricted cash | 5,341 | 5,341 | |||||
Property and equipment, net | 75,538 | 105,021 | |||||
Goodwill | 30,831 | 27,752 | |||||
Intangible assets, net | 5,410 | 2,871 | |||||
Deferred tax charge—net of current portion | — | 51,396 | |||||
Other assets | 2,022 | 1,626 | |||||
Total assets | $ | 246,203 | $ | 553,061 | |||
LIABILITIES, CONVERTIBLE PREFERRED STOCK AND STOCKHOLDERS’ EQUITY | |||||||
Current liabilities: | |||||||
Accounts payable | $ | 8,231 | $ | 14,382 | |||
Accrued expenses | 12,852 | 31,253 | |||||
Capital lease obligations—current | 1,755 | 5,610 | |||||
Funds payable and amounts due to sellers | 10,573 | 19,262 | |||||
Deferred revenue | 3,452 | 4,712 | |||||
Other current liabilities | 4,590 | 4,903 | |||||
Total current liabilities | 41,453 | 80,122 | |||||
Capital lease obligations—net of current portion | 3,148 | 7,571 | |||||
Warrant liability | 1,920 | — | |||||
Deferred tax liabilities | 149 | 61,420 | |||||
Facility financing obligation | 50,320 | 51,804 | |||||
Other liabilities | 1,913 | 21,646 | |||||
Total liabilities | 98,903 | 222,563 | |||||
68
Consolidated Balance Sheets
(In thousands except share and per share data)
As of December 31, | |||||||
2014 | 2015 | ||||||
Commitments and contingencies | |||||||
Convertible preferred stock: | |||||||
Series A and A-1 convertible preferred stock ($0.001 par value, 2,363,786 shares authorized as of December 31, 2014; 2,363,786 shares issued and outstanding as of December 31, 2014 and no shares issued and outstanding as of December 31, 2015; $808 aggregate liquidation preference as of December 31, 2014) | 808 | — | |||||
Series B convertible preferred stock ($0.001 par value, 1,128,431 shares authorized as of December 31, 2014; 1,128,425 shares issued and outstanding as of December 31, 2014 and no shares issued and outstanding as of December 31, 2015; $903 aggregate liquidation preference as of December 31, 2014) | 865 | — | |||||
Series C convertible preferred stock ($0.001 par value, 1,234,084 shares authorized as of December 31, 2014; 1,222,282 shares issued and outstanding as of December 31, 2014 and no shares issued and outstanding as of December 31, 2015; $3,263 aggregate liquidation preference as of December 31, 2014) | 3,361 | — | |||||
Series D and D-1 convertible preferred stock ($0.001 par value, 4,240,120 shares authorized as of December 31, 2014; 4,215,610 shares issued and outstanding as of December 31, 2014 and no shares issued and outstanding as of December 31, 2015; $27,949 aggregate liquidation preference as of December 31, 2014) | 27,870 | — | |||||
Series E convertible preferred stock ($0.001 par value, 401,450 shares authorized as of December 31, 2014; 396,727 shares issued and outstanding as of December 31, 2014 and no shares issued and outstanding as of December 31, 2015; $6,300 aggregate liquidation preference as of December 31, 2014) | 6,201 | — | |||||
Series 1 convertible preferred stock ($0.001 par value, 203,399 shares authorized as of December 31, 2014; 203,399 shares issued and outstanding as of December 31, 2014 and no shares issued and outstanding as of December 31, 2015; $1,312 aggregate liquidation preference as of December 31, 2014) | 1,322 | — | |||||
Series F convertible preferred stock ($0.001 par value, 11,594,203 shares authorized as of December 31, 2014; 11,594,203 shares issued and outstanding as of December 31, 2014 and no shares issued and outstanding as of December 31, 2015; $40,000 aggregate liquidation preference as of December 31, 2014) | 39,785 | — | |||||
Total convertible preferred stock | 80,212 | — | |||||
Stockholders’ equity: | |||||||
Common stock ($0.001 par value, 120,000,000 and 1,400,000,000 shares authorized as of December 31, 2014 and December 31, 2015; 44,180,939 and 112,563,354 shares issued and outstanding as of December 31, 2014, and December 31, 2015, respectively) | 44 | 113 | |||||
Preferred Stock ($0.001 par value, 25,000,000 shares authorized as of December 31, 2015) | — | — | |||||
Additional paid-in capital | 103,355 | 406,020 | |||||
Accumulated deficit | (32,377 | ) | (86,440 | ) | |||
Accumulated other comprehensive (loss) income | (3,934 | ) | 10,805 | ||||
Total stockholders’ equity | 67,088 | 330,498 | |||||
Total liabilities, convertible preferred stock and stockholders’ equity | $ | 246,203 | $ | 553,061 | |||
The accompanying notes are an integral part of these consolidated financial statements
69
Consolidated Statements of Operations
(In thousands except share and per share data)
Year Ended December 31, | |||||||||||
2013 | 2014 | 2015 | |||||||||
Revenue | $ | 125,022 | $ | 195,591 | $ | 273,499 | |||||
Cost of revenue | 47,779 | 73,633 | 96,979 | ||||||||
Gross profit | 77,243 | 121,958 | 176,520 | ||||||||
Operating expenses: | |||||||||||
Marketing | 17,850 | 39,655 | 66,771 | ||||||||
Product development | 27,548 | 36,634 | 42,694 | ||||||||
General and administrative | 31,112 | 51,920 | 68,939 | ||||||||
Total operating expenses | 76,510 | 128,209 | 178,404 | ||||||||
Income (loss) from operations | 733 | (6,251 | ) | (1,884 | ) | ||||||
Other income (expense): | |||||||||||
Interest expense and amortization of deferred financing costs | (302 | ) | (590 | ) | (1,526 | ) | |||||
Interest and other income | 46 | 41 | 324 | ||||||||
Net unrealized loss on warrant and other liabilities | (419 | ) | (411 | ) | (3,133 | ) | |||||
Foreign exchange loss | — | (3,049 | ) | (21,775 | ) | ||||||
Total other expense | (675 | ) | (4,009 | ) | (26,110 | ) | |||||
Income (loss) before income taxes | 58 | (10,260 | ) | (27,994 | ) | ||||||
Provision for income taxes | (854 | ) | (4,983 | ) | (26,069 | ) | |||||
Net loss | $ | (796 | ) | $ | (15,243 | ) | $ | (54,063 | ) | ||
Net loss per share attributable to common stockholders: | |||||||||||
Basic and diluted | $ | (0.02 | ) | $ | (0.38 | ) | $ | (0.59 | ) | ||
Weighted average common shares outstanding: | |||||||||||
Basic and diluted | 32,667,242 | 40,246,663 | 91,122,291 | ||||||||
The accompanying notes are an integral part of these consolidated financial statements
70
Consolidated Statements of Comprehensive Loss
(In thousands)
Year Ended December 31, | |||||||||||
2013 | 2014 | 2015 | |||||||||
Net loss | $ | (796 | ) | $ | (15,243 | ) | $ | (54,063 | ) | ||
Other comprehensive income (loss): | |||||||||||
Cumulative translation adjustment | 221 | (4,091 | ) | 14,746 | |||||||
Unrealized gains on marketable securities, net of tax | (9 | ) | (3 | ) | (7 | ) | |||||
Other comprehensive income (loss) | 212 | (4,094 | ) | 14,739 | |||||||
Comprehensive loss | $ | (584 | ) | $ | (19,337 | ) | $ | (39,324 | ) | ||
The accompanying notes are an integral part of these consolidated financial statements
71
Consolidated Statements of Changes in Convertible Preferred Stock and Stockholders’ Equity
(In thousands except share and per share data)
Series A and A-1 Convertible Preferred Stock | Series B Convertible Preferred Stock | Series C Convertible Preferred Stock | Series D and D-1 Convertible Preferred Stock | Series E Convertible Preferred Stock | Series 1 Convertible Preferred Stock | Series F Convertible Preferred Stock | Common Stock | Treasury Stock | Addi- tional Paid- in Capital | Accum- ulated Deficit | Accu- mulated Other Compre- hensive(Loss) Income | Total | |||||||||||||||||||||||||||||||||||||||||||||||||||||||||||||||||||
Shares | Amount | Shares | Amount | Shares | Amount | Shares | Amount | Shares | Amount | Shares | Amount | Shares | Amount | Shares | Amount | Shares | Amount | ||||||||||||||||||||||||||||||||||||||||||||||||||||||||||||||
Balance as of December 31, 2012 | 2,363,786 | $ | 808 | 1,128,425 | $ | 865 | 1,222,282 | $ | 3,361 | 4,215,610 | $ | 27,870 | 396,727 | $ | 6,201 | 203,399 | $ | 1,322 | 11,594,203 | $ | 39,785 | 32,730,683 | $ | 33 | (648,795 | ) | $ | (1 | ) | $ | 15,706 | $ | (16,338 | ) | $ | (52 | ) | $ | (652 | ) | |||||||||||||||||||||||||||||||||||||||
Stock-based compensation expense | — | — | — | — | — | — | — | — | — | — | — | — | — | — | — | — | — | — | 4,077 | — | — | 4,077 | |||||||||||||||||||||||||||||||||||||||||||||||||||||||||
Exercise of vested options | — | — | — | — | — | — | — | — | — | — | — | — | — | — | 1,024,560 | 1 | — | — | 1,327 | — | — | 1,328 | |||||||||||||||||||||||||||||||||||||||||||||||||||||||||
Repurchase of shares | — | — | — | — | — | — | — | — | — | — | — | — | — | — | — | — | (23,500 | ) | — | (188 | ) | — | — | (188 | ) | ||||||||||||||||||||||||||||||||||||||||||||||||||||||
Retirement of repurchased shares | — | — | — | — | — | — | — | — | — | — | — | — | — | — | (672,295 | ) | (1 | ) | 672,295 | 1 | — | — | — | — | |||||||||||||||||||||||||||||||||||||||||||||||||||||||
Excess tax benefit from the exercise of options | — | — | — | — | — | — | — | — | — | — | — | — | — | — | — | — | — | — | 22 | — | — | 22 | |||||||||||||||||||||||||||||||||||||||||||||||||||||||||
Other comprehensive income | — | — | — | — | — | — | — | — | — | — | — | — | — | — | — | — | — | — | — | — | 212 | 212 | |||||||||||||||||||||||||||||||||||||||||||||||||||||||||
Net loss | — | — | — | — | — | — | — | — | — | — | — | — | — | — | — | — | — | — | — | (796 | ) | — | (796 | ) | |||||||||||||||||||||||||||||||||||||||||||||||||||||||
Balance as of December 31, 2013 | 2,363,786 | 808 | 1,128,425 | 865 | 1,222,282 | 3,361 | 4,215,610 | 27,870 | 396,727 | 6,201 | 203,399 | 1,322 | 11,594,203 | 39,785 | 33,082,948 | 33 | — | — | 20,944 | (17,134 | ) | 160 | 4,003 | ||||||||||||||||||||||||||||||||||||||||||||||||||||||||
Stock-based compensation expense | — | — | — | — | — | — | — | — | — | — | — | — | — | — | — | — | — | — | 6,110 | — | — | 6,110 | |||||||||||||||||||||||||||||||||||||||||||||||||||||||||
Exercise of vested options | — | — | — | — | — | — | — | — | — | — | — | — | — | — | 4,215,628 | 4 | — | — | 7,952 | — | — | 7,956 | |||||||||||||||||||||||||||||||||||||||||||||||||||||||||
Issuance of common stock | — | — | — | — | — | — | — | — | — | — | — | — | — | — | 3,301,887 | 3 | — | — | 34,997 | — | — | 35,000 | |||||||||||||||||||||||||||||||||||||||||||||||||||||||||
Issuance of stock at acquisition date | — | — | — | — | — | — | — | — | — | — | — | — | — | — | 3,580,476 | 4 | — | — | 27,719 | — | — | 27,723 | |||||||||||||||||||||||||||||||||||||||||||||||||||||||||
Stock expense-acquisitions | — | — | — | — | — | — | — | — | — | — | — | — | — | — | — | — | — | — | 756 | — | — | 756 | |||||||||||||||||||||||||||||||||||||||||||||||||||||||||
Excess tax benefit from the exercise of options | — | — | — | — | — | — | — | — | — | — | — | — | — | — | — | — | — | — | 4,877 | — | — | 4,877 | |||||||||||||||||||||||||||||||||||||||||||||||||||||||||
Other comprehensive loss | — | — | — | — | — | — | — | — | — | — | — | — | — | — | — | — | — | — | — | — | (4,094 | ) | (4,094 | ) | |||||||||||||||||||||||||||||||||||||||||||||||||||||||
Net loss | — | — | — | — | — | — | — | — | — | — | — | — | — | — | — | — | — | — | — | (15,243 | ) | — | (15,243 | ) | |||||||||||||||||||||||||||||||||||||||||||||||||||||||
Balance as of December 31, 2014 | 2,363,786 | 808 | 1,128,425 | 865 | 1,222,282 | 3,361 | 4,215,610 | 27,870 | 396,727 | 6,201 | 203,399 | 1,322 | 11,594,203 | 39,785 | 44,180,939 | 44 | — | — | 103,355 | (32,377 | ) | (3,934 | ) | 67,088 | |||||||||||||||||||||||||||||||||||||||||||||||||||||||
Stock-based compensation expense | — | — | — | — | — | — | — | — | — | — | — | — | — | — | — | — | — | — | 9,444 | — | — | 9,444 | |||||||||||||||||||||||||||||||||||||||||||||||||||||||||
Exercise of vested options | — | — | — | — | — | — | — | — | — | — | — | — | — | — | 1,315,735 | 2 | — | — | 3,624 | — | — | 3,626 | |||||||||||||||||||||||||||||||||||||||||||||||||||||||||
Exercise of warrants | — | — | — | — | — | — | — | — | — | — | — | — | — | — | 105,099 | 1 | — | — | 109 | — | — | 110 | |||||||||||||||||||||||||||||||||||||||||||||||||||||||||
Shares withheld in net exercise of warrants | — | — | — | — | — | — | — | — | — | — | — | — | — | — | (8,230 | ) | (1 | ) | — | — | (109 | ) | — | — | (110 | ) | |||||||||||||||||||||||||||||||||||||||||||||||||||||
Common stock issued through public offering | — | — | — | — | — | — | — | — | — | — | — | — | — | — | 13,333,333 | 14 | — | — | 194,347 | — | — | 194,361 | |||||||||||||||||||||||||||||||||||||||||||||||||||||||||
Contribution to Etsy.org | — | — | — | — | — | — | — | — | — | — | — | — | — | — | 188,235 | — | — | — | 3,200 | — | — | 3,200 | |||||||||||||||||||||||||||||||||||||||||||||||||||||||||
Stock expense-acquisitions | — | — | — | — | — | — | — | — | — | — | — | — | — | — | — | — | — | — | 1,122 | — | — | 1,122 | |||||||||||||||||||||||||||||||||||||||||||||||||||||||||
Conversion of liability-classified vested restricted shares | — | — | — | — | — | — | — | — | — | — | — | — | — | — | — | — | — | — | 1,755 | — | — | 1,755 | |||||||||||||||||||||||||||||||||||||||||||||||||||||||||
Conversion of preferred stock upon public offering | (2,363,786 | ) | (808 | ) | (1,128,425 | ) | (865 | ) | (1,222,282 | ) | (3,361 | ) | (4,215,610 | ) | (27,870 | ) | (396,727 | ) | (6,201 | ) | (203,399 | ) | (1,322 | ) | (11,594,203 | ) | (39,785 | ) | 53,448,243 | 53 | — | — | 80,159 | — | — | 80,212 | |||||||||||||||||||||||||||||||||||||||||||
Conversion of liability-classified warrants upon public offering | — | — | — | — | — | — | — | — | — | — | — | — | — | — | — | — | — | — | 5,070 | — | — | 5,070 | |||||||||||||||||||||||||||||||||||||||||||||||||||||||||
Excess tax benefit from the exercise of stock options | — | — | — | — | — | — | — | — | — | — | — | — | — | — | — | — | — | — | 3,944 | — | — | 3,944 | |||||||||||||||||||||||||||||||||||||||||||||||||||||||||
Other comprehensive income | — | — | — | — | — | — | — | — | — | — | — | — | — | — | — | — | — | — | — | — | 14,739 | 14,739 | |||||||||||||||||||||||||||||||||||||||||||||||||||||||||
Net loss | — | — | — | — | — | — | — | — | — | — | — | — | — | — | — | — | — | — | — | (54,063 | ) | — | (54,063 | ) | |||||||||||||||||||||||||||||||||||||||||||||||||||||||
Balance as of December 31, 2015 | — | $ | — | — | $ | — | — | $ | — | — | $ | — | — | $ | — | — | $ | — | — | $ | — | 112,563,354 | $ | 113 | — | $ | — | $ | 406,020 | $ | (86,440 | ) | $ | 10,805 | $ | 330,498 | |||||||||||||||||||||||||||||||||||||||||||
— | — | ||||||||||||||||||||||||||||||||||||||||||||||||||||||||||||||||||||||||||||||
The accompanying notes are an integral part of these consolidated financial statements
72
Consolidated Statements of Cash Flows
(In thousands)
Year Ended December 31, | |||||||||||
2013 | 2014 | 2015 | |||||||||
Cash flows from operating activities | |||||||||||
Net loss | $ | (796 | ) | $ | (15,243 | ) | $ | (54,063 | ) | ||
Adjustments to reconcile net loss to net cash provided by operating activities: | |||||||||||
Stock-based compensation expense | 3,834 | 5,920 | 8,981 | ||||||||
Stock-based compensation expense-acquisitions | — | 4,130 | 1,860 | ||||||||
Contribution of stock to Etsy.org | — | — | 3,200 | ||||||||
Depreciation and amortization expense | 12,380 | 17,223 | 18,550 | ||||||||
Bad debt expense | 1,002 | 1,881 | 1,780 | ||||||||
Foreign exchange loss | — | 3,049 | 21,775 | ||||||||
Amortization of debt issuance costs | 8 | 68 | 167 | ||||||||
Net unrealized loss on warrant and other liabilities | 419 | 411 | 3,133 | ||||||||
Loss on disposal of assets | 677 | 79 | 1,319 | ||||||||
Amortization of deferred tax charges | — | — | 17,132 | ||||||||
Excess tax benefit from exercise of stock options | (22 | ) | (4,877 | ) | (3,944 | ) | |||||
Changes in operating assets and liabilities, net of acquisitions: | |||||||||||
Accounts receivable | (4,832 | ) | (6,197 | ) | (6,739 | ) | |||||
Funds receivable and seller accounts | (2,907 | ) | (3,975 | ) | (9,025 | ) | |||||
Prepaid expenses and other current assets | (1,667 | ) | (5,820 | ) | (266 | ) | |||||
Other assets | (295 | ) | (1,446 | ) | 225 | ||||||
Accounts payable | 1,712 | 1,046 | 6,728 | ||||||||
Accrued expenses | 1,960 | 11,463 | 12,395 | ||||||||
Funds payable and amounts due to sellers | 2,993 | 3,880 | 9,025 | ||||||||
Deferred revenue | 794 | 693 | 1,279 | ||||||||
Other liabilities | 1,282 | (198 | ) | (4,301 | ) | ||||||
Net cash provided by operating activities | 16,542 | 12,087 | 29,211 | ||||||||
Cash flows from investing activities | |||||||||||
Acquisition of businesses, net of cash acquired | (675 | ) | (4,688 | ) | — | ||||||
Purchases of property and equipment | (7,762 | ) | (1,304 | ) | (11,116 | ) | |||||
Development of internal-use software | (9,310 | ) | (8,280 | ) | (9,719 | ) | |||||
Purchase of U.S. Government and agency bills | (39 | ) | (21,698 | ) | (26,040 | ) | |||||
Sale of marketable securities | 2,761 | 20,588 | 23,592 | ||||||||
Net increase in restricted cash | — | (5,341 | ) | — | |||||||
Net cash used in investing activities | (15,025 | ) | (20,723 | ) | (23,283 | ) | |||||
Cash flows from financing activities | |||||||||||
Proceeds from public offering | — | — | 199,467 | ||||||||
Proceeds from the issuance of common stock | — | 35,000 | — | ||||||||
Repurchase of stock | (188 | ) | |||||||||
Proceeds from exercise of stock options | 1,328 | 7,956 | 3,626 | ||||||||
Excess tax benefit from the exercise of stock options | 22 | 4,877 | 3,944 | ||||||||
Payments on capitalized lease obligations | (1,265 | ) | (1,480 | ) | (3,377 | ) | |||||
Deferred payments on acquisition of business | — | (75 | ) | — | |||||||
Payments relating to public offering | — | (1,041 | ) | (4,052 | ) | ||||||
Net cash (used in) provided by financing activities | (103 | ) | 45,237 | 199,608 | |||||||
Effect of exchange rate changes on cash | 446 | (3,737 | ) | (3,951 | ) | ||||||
Net increase in cash and cash equivalents | 1,860 | 32,864 | 201,585 | ||||||||
Cash and cash equivalents at beginning of period | 34,935 | 36,795 | 69,659 | ||||||||
Cash and cash equivalents at end of period | $ | 36,795 | $ | 69,659 | $ | 271,244 | |||||
Supplemental cash flow disclosures: | |||||||||||
Cash paid for interest | $ | 233 | $ | 342 | $ | 1,346 | |||||
Cash paid for income taxes | $ | 206 | $ | 217 | $ | 7,604 | |||||
73
Consolidated Statements of Cash Flows
(In thousands)
Year Ended December 31, | |||||||||||
2013 | 2014 | 2015 | |||||||||
Supplemental non-cash disclosures | |||||||||||
Equipment acquired under capital lease obligations | $ | — | $ | 5,564 | $ | 11,657 | |||||
Stock-based compensation capitalized in development of capitalized software | $ | 243 | $ | 190 | $ | 463 | |||||
Non-cash additions to development of internal-use software and property and equipment | $ | 398 | $ | 2,510 | $ | 12,721 | |||||
Non-cash additions to facility financing obligation related to build-to-suit lease | $ | — | $ | 50,320 | $ | 1,484 | |||||
Non-cash addition to capitalized public offering costs | $ | — | $ | 1,413 | $ | 13 | |||||
Fair value of common stock issued in acquisition | $ | — | $ | 27,723 | $ | — | |||||
The accompanying notes are an integral part of these consolidated financial statements
74
Notes to Consolidated Financial Statements
Note 1—Basis of Presentation and Summary of Significant Accounting Policies
Description of Business
Etsy, Inc. (the “Company” or “Etsy”) was incorporated in Delaware in February 2006. Etsy operates a marketplace where people around the world connect, both online and offline, to make, sell and buy unique goods. The Company generates revenue primarily from transaction and listing fees, Promoted Listings, Direct Checkout fees, and Shipping Label sales.
Initial Public Offering
On April 21, 2015, the Company completed an initial public offering (the "IPO") in which it issued and sold 13,333,333 shares of common stock at a public offering price of $16.00 per share. The Company received net proceeds of $194.4 million after deducting underwriting discounts of $13.9 million and other offering expenses of approximately $5.1 million. These expenses were recorded against the proceeds received from the IPO.
Certain selling stockholders sold an additional 5,833,332 shares of common stock in the IPO. The Company did not receive any proceeds from the sale of shares sold by the selling stockholders.
Upon the closing of the IPO, all outstanding shares of preferred stock of the Company converted into 53,448,243 shares of common stock. In addition, all outstanding warrants for preferred stock converted into warrants for 203,030 shares of common stock.
The Company effected a 1-for-2 reverse split of its common stock on March 25, 2015. The reverse split combined each two shares of the Company’s issued and outstanding common stock into one share of common stock and correspondingly adjusted the conversion prices of its convertible preferred stock. No fractional shares were issued in connection with the reverse split, and any fractional shares resulting from the reverse split were rounded down to the nearest whole share. All share, per share and related information presented in the consolidated financial statements and accompanying notes have been retroactively adjusted, where applicable, to reflect the reverse stock split.
Basis of Consolidation
The consolidated financial statements include the accounts of Etsy and its wholly-owned subsidiaries. All intercompany balances and transactions have been eliminated in consolidation.
Reclassifications
Certain items in the prior years’ consolidated financial statements have been reclassified to conform to the current year presentation reflected in the financial statements. Specifically, the Company reclassified $4.6 million previously included in accrued expenses and other current liabilities to other current liabilities on the consolidated balance sheets for 2014, to conform to the current year presentation.
Use of Estimates
The preparation of the Company’s consolidated financial statements in conformity with accounting principles generally accepted in the United States of America (“GAAP”) requires management to make estimates and judgments that affect the reported amounts of assets and liabilities and disclosure of contingent assets and liabilities at the date of the financial statements and the reported amounts of revenues and expenses during the reporting period. The accounting estimates that require management’s most difficult and subjective judgments include revenue recognition, income taxes, website development costs and internal-use software, purchase price allocations for business combinations, valuation of goodwill and intangible assets, leases and stock-based compensation. The Company evaluates its estimates and judgments on an ongoing basis and revises them when necessary. Actual results may differ from the original or revised estimates.
75
Revenue Recognition
The Company operates a platform for third-party sellers. Its business model is based on shared success: the Company makes money when Etsy sellers make money, and the Company offers services to help Etsy sellers be more successful. The Company does not compete with Etsy sellers, hold inventory or sell goods. The Company’s revenue is diversified, generated from a mix of marketplace activities and the services the Company provides Etsy sellers to help them create and grow their businesses. The Company’s revenue consists of Marketplace revenue, Seller Services revenue and Other revenue. The Company’s revenue is recorded net of actual and expected refunds. Marketplace revenue includes the fee an Etsy seller pays for each completed transaction and the listing fee an Etsy seller pays for each item she lists. Seller Services revenue includes fees an Etsy seller pays for services such as prominent placement in search results via Promoted Listings, payment processing via Direct Checkout and purchases of shipping labels through the Company’s platform via Shipping Labels. The Company deducts its cost of shipping labels and estimated refunds from gross shipping fees to determine net shipping fees. Other revenue includes the fees the Company receives from a third-party payment processor and derecognized funds the Company receives from a third-party for unused Etsy Gift Cards.
The Company recognizes revenue when all of the following conditions are satisfied: (1) there is persuasive evidence of an arrangement; (2) the service has been provided to the Etsy seller; (3) the collection of fees is reasonably assured; and (4) the amount of fees to be paid by the Etsy seller is fixed or determinable. The Company evaluates whether it is appropriate to recognize revenue on a gross or net basis based upon its evaluation of whether it is the primary obligor in a transaction, has inventory risk and has latitude in establishing pricing and selecting suppliers. Based on its evaluation of these factors, revenue is recorded net of merchandise values associated with the transaction.
Marketplace revenue. Marketplace revenue consists of the 3.5% fee that an Etsy seller pays for each completed transaction on the Company’s platform, exclusive of shipping fees charged. Marketplace revenue also consists of a listing fee of $0.20 per item that she lists in its marketplace. Revenue from completed Wholesale transactions is also included in Marketplace revenue. Transaction fees are recognized when the corresponding transaction is made. Listing fees are recognized ratably over a four-month listing period, unless the item is sold or the seller relists it, at which time any remaining listing fee is recognized.
Seller Services revenue. Seller Services revenue consists of fees an Etsy seller pays the Company for the Seller Services she uses, including Promoted Listings, Direct Checkout and Shipping Labels.
• | Revenue from Promoted Listings consists of cost-per-click based fees an Etsy seller pays the Company for prominent placement of her listings in search results generated by Etsy buyers in its marketplace. Revenue is recognized when the Promoted Listing is clicked. |
• | Revenue from Direct Checkout consists of fees an Etsy seller pays the Company to process credit, debit and Etsy Gift Card payments. Direct Checkout fees vary between 3-4% of the item’s total sale price plus a flat fee per order, depending on the country in which her bank account is located. Direct Checkout fees are based on the item’s total sale price, including shipping. Revenue from Direct Checkout is recognized when the corresponding transaction is made. |
• | Revenue from Shipping Labels consists of fees an Etsy seller pays the Company when she purchases shipping labels directly through its platform, net of the cost it incurs in purchasing those shipping labels. The Company provides its sellers shipping labels from the United States Postal Service and Canada Post at a discounted price due to the volume of purchases through its platform. The Company recognizes Shipping Label revenue when an Etsy seller purchases a shipping label. The Company recognizes Shipping Label revenue on a net basis as it is not the primary obligor in the delivery of these services. |
Other revenue. Other revenue includes the fees the Company receives from a third-party payment processor, which is recognized as the transactions are processed by the third-party payment processor, and derecognized funds the Company receives from a third-party for unused Etsy Gift Cards, which are recognized when the third-party approves the release of these funds.
76
The following table summarizes revenue by type of service (in thousands):
Year Ended December 31, | |||||||||||
2013 | 2014 | 2015 | |||||||||
Marketplace | $ | 78,544 | $ | 108,732 | $ | 132,648 | |||||
Seller Services | 42,817 | 82,502 | 136,608 | ||||||||
Other | 3,661 | 4,357 | 4,243 | ||||||||
Revenue | $ | 125,022 | $ | 195,591 | $ | 273,499 | |||||
Cost of Revenue
Cost of revenue consists primarily of expenses associated with the operation and maintenance of the Company’s platform and data centers, including depreciation and amortization, employee-related costs, including stock-based compensation expense, and hosting and bandwidth costs. Cost of revenue also includes the cost of interchange and other fees for credit card processing services, credit card verification service fees and credit card chargebacks to support Direct Checkout revenue and costs of refunds made to Etsy buyers that the Company is not able to collect from Etsy sellers.
Accounts Receivable and Allowance for Doubtful Accounts
The Company’s trade accounts receivable are recorded at amounts billed to Etsy sellers and are presented on the consolidated balance sheet net of the allowance for doubtful accounts. The allowance is determined by a number of factors, including age of the receivable, current economic conditions, historical losses and management’s assessment of the financial condition of Etsy sellers. Receivables are written off once they are deemed uncollectible, which may arise when Etsy sellers file for bankruptcy or are otherwise deemed unable to repay the amounts owed to the Company. Estimates of uncollectible accounts receivable are recorded to general and administrative expense.
The following table summarizes the allowance activity during the periods indicated (in thousands):
Year Ended December 31, | |||||||||||
2013 | 2014 | 2015 | |||||||||
Balance as of the beginning of period | $ | 1,357 | $ | 1,279 | $ | 1,841 | |||||
Bad debt expense | 1,002 | 1,881 | 1,780 | ||||||||
Write-offs, net of recoveries and other adjustments | (1,080 | ) | (1,319 | ) | (1,550 | ) | |||||
Balance as of the end of period | $ | 1,279 | $ | 1,841 | $ | 2,071 | |||||
Funds Receivable and Seller Accounts and Funds Payable and Amounts due to Sellers
The Company records funds receivable and seller accounts and funds payable and amounts due to sellers as current assets and liabilities, respectively, on the consolidated balance sheet. Funds receivable and seller accounts represent amounts received or expected to be received from Etsy buyers via third-party credit card processors, which flow through an Etsy bank account for payment to Etsy sellers. This cash and related receivable represent the total amount due to sellers, and as such a liability for the same amount is recorded to funds payable and amounts due to Etsy sellers.
Property and Equipment
Property and equipment, consisting principally of construction in process, computer equipment and leasehold improvements, are recorded at cost. The Company capitalizes construction in progress for build-to-suit lease agreements where we are the owner, for accounting purposes only, during the construction period. Depreciation and amortization begin at the time the asset is placed into service and are recognized using the straight-line method in amounts sufficient to relate the cost of depreciable and amortizable assets to operations over their estimated useful lives. Repairs and maintenance are charged to operations as incurred. Upon sale or retirement of assets, the cost and related accumulated depreciation or amortization are removed from the balance sheet and the resulting gain or loss is reflected in operations.
77
When events or changes in circumstances require, the Company assesses the likelihood of recovering the cost of tangible long-lived assets based on its expectations of future profitability, undiscounted cash flows and management’s plans with respect to operations to determine if the asset is impaired and subject to write-off. Measurement of any impairment loss is based on the excess of the carrying value of the asset over the fair value.
Internal-use Software and Website Development Costs
Costs incurred to develop software for internal use and the Company’s website are capitalized and amortized over the estimated useful life of the software, generally three years. The Company also capitalizes costs related to upgrades and enhancements when it is probable the expenditures will result in additional functionality or will extend the useful life of existing functionality. Costs related to the design or maintenance of internal-use software and website development are expensed as incurred. The Company periodically reviews internal-use software and website development costs to determine whether the projects will be completed, placed in service, removed from service, or replaced by other internally developed or third-party software. If the asset is not expected to provide any future benefit, the asset is retired and any unamortized cost is expensed.
Leases
The Company leases office space and certain computer equipment in multiple locations under non-cancelable lease agreements. The leases are reviewed for classification as operating, capital or build-to-suit leases. For operating leases, rent is recognized on a straight-line basis over the lease period. For capital leases, the Company records the leased asset with a corresponding liability. Payments are recorded as reductions to the liability with an appropriate interest charge recorded based on the then-outstanding remaining liability.
The Company considers the nature of the renovations and the Company’s involvement during the construction period of newly leased office space to determine if it is considered, for accounting purposes only, to be the owner of the construction project during the construction period. If the Company determines that it is the owner of the construction project, it is required to capitalize the fair value of the building as well as the construction costs incurred on its consolidated balance sheet along with a corresponding financing liability (“build-to-suit accounting”). Upon occupancy for build-to-suit leases, the Company assesses whether the circumstances qualify for sales recognition under the sale-leaseback accounting guidance. If the lease meets the sale-leaseback criteria, the Company will remove the asset and related financial obligation from the balance sheet and treat the building lease as an operating lease. If upon completion of construction, the project does not meet the sale-leaseback criteria, the leased property will be treated as a capital lease for financial reporting purposes.
Income Taxes
Income tax benefit (provision) is based on (loss) income before income taxes and is accounted for under the asset and liability method. Deferred tax assets and liabilities are recognized for the future tax consequences attributable to differences between the financial statement carrying amounts of existing assets and liabilities and their respective tax bases, and operating loss and tax credit carryforwards. Deferred tax assets and liabilities are measured using enacted tax rates expected to apply to taxable income in the years in which those temporary differences are expected to be recovered or settled. The effect on deferred tax assets and liabilities of a change in tax rates is recognized as income or expense in the period that includes the enactment date. Management assesses the need for a valuation allowance on a quarterly basis to reduce deferred tax assets to the amounts expected to be realized.
The Company accounts for uncertainty in income taxes using a recognition threshold and a measurement attribute for the financial statement recognition and measurement of tax positions taken or expected to be taken in a tax return. For benefits to be recognized, a tax position must be more likely than not to be sustained upon examination by the taxing authorities. The amount recognized is measured as the largest amount of benefit that has a greater than 50% likelihood of being realized upon ultimate audit settlement. The Company has an unrecognized tax benefit of $0.4 million and $22.2 million at December 31, 2014 and 2015, respectively.
The Company recognizes interest and penalties, if any, associated with income tax matters as part of the income tax provision and includes accrued interest and penalties with the related income tax liability in the consolidated balance sheet.
78
Business Combinations
The Company has completed a number of acquisitions of other businesses in the past and may acquire additional businesses or technologies in the future. The results of businesses acquired in a business combination are included in the Company’s consolidated financial statements from the date of acquisition. The Company allocates the purchase price, which is the sum of the consideration provided and may consist of cash, equity or a combination of the two, in a business combination to the identifiable assets and liabilities of the acquired business at their acquisition date fair values. The excess of the purchase price over the amount allocated to the identifiable assets and liabilities, if any, is recorded as goodwill. Determining the fair value of assets acquired and liabilities assumed requires management to use significant judgment and estimates, including the selection of valuation methodologies, estimates of future revenue and cash flows, discount rates and selection of comparable companies.
When the Company issues stock-based or cash awards to an acquired company’s stockholders, the Company evaluates whether the awards are contingent consideration or compensation for post-acquisition services. The evaluation includes, among other things, whether the vesting of the awards is contingent on the continued employment of the acquired company’s stockholder beyond the acquisition date. If continued employment is required for vesting, the awards are treated as compensation for post-acquisition services and recognized as expense over the requisite service period.
The Company carries intangible assets at cost, and it amortizes them on a straight-line basis over their estimated useful lives, typically three years. When circumstances indicate that the carrying value of these assets may not be recoverable, the Company reviews its identifiable amortizable intangible assets for impairment.
To date, the assets acquired and liabilities assumed in the Company’s business combinations have primarily consisted of goodwill and finite-lived intangible assets, consisting primarily of developed technologies, customer relationships and trademarks. The estimated fair values and useful lives of identifiable intangible assets are based on many factors, including estimates and assumptions of future operating performance and cash flows of the acquired business, the nature of the business acquired, and the specific characteristics of the identified intangible assets. The estimates and assumptions used to determine the fair values and useful lives of identified intangible assets could change due to numerous factors, including market conditions, technological developments, economic conditions and competition. In connection with determination of fair values, the Company may engage independent appraisal firms to assist with the valuation of intangible and certain tangible assets acquired and certain assumed obligations.
Acquisition-related transaction costs incurred by the Company are not included as a component of consideration transferred, but are accounted for as an expense in the period in which the costs are incurred.
Goodwill
Goodwill represents the excess of the aggregate fair value of the consideration transferred in a business combination over the fair value of the assets acquired, net of liabilities assumed. Goodwill is not amortized, but is subject to an annual impairment test. Management has determined that the Company has a single reporting unit and performs its annual goodwill impairment test during the fourth quarter or more frequently if events or changes in circumstances indicate that the goodwill may be impaired.
Events or changes in circumstances which could trigger an impairment review include significant changes in the manner of the Company’s use of the acquired assets or the strategy for the Company’s overall business, significant negative industry or economic trends, significant underperformance relative to historical or projected future results of operations, a significant adverse change in the business climate, an adverse action or assessment by a regulator, unanticipated competition or a loss of key personnel.
The Company has the option to first assess qualitative factors to determine whether the existence of events or circumstances leads to a determination that it is more likely than not that the fair value of the reporting unit is less than its carrying amount. If, after assessing the totality of events or circumstances, an entity determines it is not more likely than not that the fair value of the reporting unit is less than its carrying amount, then additional impairment testing is not required. However, if an entity concludes otherwise, then it is required to perform the first of a two-step impairment test.
79
The first step involves comparing the estimated fair value of the reporting unit with its respective book value, including goodwill. If the estimated fair value exceeds book value, goodwill is considered not to be impaired and no additional steps are necessary. If, however, the fair value of the reporting unit is less than book value, then a second step is required that compares the carrying amount of the goodwill with its implied fair value. The estimate of implied fair value of goodwill may require valuations of certain internally-generated and unrecognized intangible and tangible net assets. If the carrying amount of goodwill exceeds the implied fair value of the goodwill, an impairment loss is recognized in an amount equal to the excess.
The Company completed a Step Zero analysis during the fourth quarter of 2015. No impairment of goodwill was recorded at December 31, 2014 or 2015.
Intangible Assets
Intangible assets are amortized over the estimated useful life of the acquired technology, customer relationships and trademarks, generally three years.
Stock-Based Compensation
For employee stock-based awards, the Company calculates the fair value of the award on the date of grant using the Black-Scholes option-pricing model and the expense is recognized over the service period for awards expected to vest. Prior to the IPO, the Company utilized equity valuations based on comparable publicly-traded companies, discounted free cash flows, an analysis of the Company's enterprise value and any other factors deemed relevant in estimating the fair value of its common stock. Subsequent to the IPO, the Company has used the closing price of its common stock on Nasdaq as the fair value of its common stock. The risk-free rate for periods within the contractual life of the option is based on the U.S. Treasury yield curve in effect at the time of grant. Expected volatilities are based on implied volatilities from market comparisons of certain publicly traded companies and other factors. The expected term of stock options granted has been determined using the simplified method, which uses the midpoint between the vesting date and the contractual term. The requisite service period is generally four years from the date of grant. The fair value of RSUs is determined based on the closing price of the Company's common stock on Nasdaq on the grant date.
We account for stock-based compensation arrangements in restricted shares, subject to a put option that allows the holder of the shares to put the shares back to the Company for cash, as liability-classified stock awards. These awards are re-measured at each reporting period, with changes in fair value being charged to the statement of operations. Compensation expense is recognized using a graded vesting methodology for each separately vesting tranche as though the award were, in substance, multiple awards. Unless the put option is exercised, the restricted shares will be reclassified from a liability to an equity classified award upon the termination of the put option at the vesting of each separate tranche.
For the years ended December 31, 2013, 2014 and 2015, the Company recognized expenses of approximately $3.6 million, $5.9 million and $8.9 million for employee stock options, respectively, and $0.2 million, $0.1 million and $0.1 million for non-employee stock options, respectively.
Additionally, the Company recorded $4.1 million and $1.86 million in acquisition-related stock-based compensation expense for the years ended December 31, 2014 and 2015, respectively, of which $3.4 million and $0.7 million relates to liability-classified awards, respectively.
Cash and Cash Equivalents
The Company considers all investments with an original maturity of three months or less at time of purchase to be cash equivalents.
Concentration of Credit Risk
Financial instruments that potentially subject the Company to concentrations of credit risk consist of cash and cash equivalents. The Company reduces credit risk by placing its cash and cash equivalents with major financial institutions with high credit ratings. At times, such amounts may exceed federally insured limits.
80
Fair Value of Financial Instruments
Management believes that the fair value of financial instruments, consisting of cash and cash equivalents, accounts receivable and accounts payable, approximates carrying value due to the immediate or short-term maturity associated with its cash and cash equivalents, accounts receivable and accounts payable.
Marketing
Marketing expenses consist primarily of targeted online marketing costs, such as product listing ads, search engine marketing, affiliate marketing and, to a much lesser extent, offline marketing expenses. Marketing expenses also include employee-related costs, including stock-based compensation expense, for our employees involved in digital marketing, seller development and growth, public relations and communications, brand marketing and design, product marketing and marketing research activities. Marketing expenses are primarily driven by investments to grow and retain members on our platform.
Net (Loss) Income Per Share
Prior to the IPO, the Company followed the two-class method when computing net (loss) income per share as the Company had issued shares that met the definition of participating securities. The two-class method determined net (loss) income per share for each class of common stock and participating securities according to dividends declared or accumulated and participation rights in undistributed earnings. The two-class method required income available to common stockholders for the period to be allocated between common stock and participating securities based upon their respective rights to receive dividends as if all income for the period had been distributed. The Company’s convertible preferred stock contractually entitled the holders of such shares to participate in dividends, but did not contractually require the holders of such shares to participate in losses of the Company. Accordingly, the two-class method did not apply for periods in which the Company reports a net loss or a net loss attributable to common stockholders resulting from dividends, accretion or modifications to its convertible preferred stock.
Upon the closing of the IPO on April 21, 2015, all outstanding shares of convertible preferred stock were converted into shares of common stock. For current and future periods, the two-class method is not applicable to the computation of net (loss) income per share until shares of authorized preferred stock become issued and outstanding.
Basic net (loss) income per share attributable to common stockholders is computed by dividing the net (loss) income attributable to common stockholders by the weighted average number of common shares outstanding for the period. Diluted net (loss) income attributable to common stockholders is computed by adjusting net (loss) income attributable to common stockholders to reallocate undistributed earnings based on the potential impact of dilutive securities, including outstanding common stock options, convertible preferred stock and warrants to purchase common stock and convertible preferred stock. For periods in which the Company has reported net losses, diluted net loss per share attributable to common stockholders is the same as basic net loss per share attributable to common stockholders, because dilutive common shares are not assumed to have been issued if their effect is anti-dilutive.
Segment Data
The Company identifies operating segments as components of an entity for which discrete financial information is available and is regularly reviewed by the chief operating decision maker, or decision-making group, in making decisions regarding resource allocation and performance assessment. The Company defines the term “chief operating decision maker” to be its chief executive officer. The Company has determined it operates in one operating segment and one reportable segment, as its chief operating decision maker reviews financial information presented on only a consolidated basis for purposes of allocating resources and evaluating financial performance.
Foreign Currency
The Company has determined that the functional currency for each of its foreign operations is the local currency in which the operation is located. All assets and liabilities are translated into U.S. dollars using exchange rates in effect at the balance sheet date. Revenue and expenses are translated using average exchange rates during the period. Foreign currency translation adjustments are reflected in stockholders’ equity as a component of other comprehensive (loss) income. Transaction gains and
81
losses including intercompany transactions denominated in a currency other than the functional currency of the entity involved are included in foreign exchange loss within other (expense) income in the statement of operations.
Excess Tax Benefits from Exercise of Stock Options
The Company uses the “with and without” approach in determining the order in which tax attributes are utilized. As a result, the Company recognizes a tax benefit from stock-based awards in additional paid-in capital only if an incremental tax benefit is realized after all other tax attributes currently available to the Company have been utilized. When tax deductions from stock-based awards are less than the cumulative book compensation expense, the tax effect of the resulting difference (“shortfall”) is charged first to additional paid-in capital, to the extent of the Company’s pool of windfall tax benefits, with any remainder recognized in income tax expense. The Company determined that it had a sufficient windfall pool available through December 31, 2015 to absorb any shortfalls.
Recent Accounting Pronouncements
In May 2014, the Financial Accounting Standards Board, or FASB, issued an accounting standards update that replaces existing revenue recognition guidance. The new guidance is effective for the annual and interim periods beginning after December 15, 2017. Among other things, the updated guidance requires companies to recognize revenue in a way that depicts the transfer of promised goods or services to customers in an amount that reflects the consideration to which the entity expects to be entitled in exchange for those goods or services. The Company is currently evaluating the effect the guidance will have on its consolidated financial statements.
In August 2014, the FASB issued an accounting standard update under which management will be required to assess an entity’s ability to continue as a going concern and provide related disclosures in certain circumstances. The new guidance is effective for annual and interim periods beginning after December 15, 2016. The adoption of this guidance is not expected to have an impact on the Company’s consolidated financial statements or disclosures.
In April 2015, the FASB issued an accounting standard under which customers will apply the same criteria as vendors to determine whether a cloud computing arrangement contains a software license or is solely a service contract. The new standard is effective for annual and interim periods beginning after December 15, 2015. The Company has evaluated the effect this guidance will have on the consolidated financial statements and do not believe the impact to be material.
In August 2015, the FASB issued an accounting standard update to address the presentation and subsequent measurement of debt issuance costs related to line-of-credit arrangements. The guidance affirms the Company's treatment of such costs, which is to defer and present the debt issuance costs as an asset and subsequently amortize the costs over the term of the line-of-credit arrangement. The new standard is effective for annual and interim periods beginning after December 15, 2015. The adoption of this guidance is not expected to have an impact on the Company’s consolidated financial statements or disclosures.
In September 2015, the FASB issued an accounting standard update that eliminates the requirement that an acquirer in a business combination account for measurement-period adjustments retrospectively. Instead, an acquirer will recognize a measurement-period adjustment during the period in which it determines the amount of the adjustment. The new guidance is effective for annual and interim periods beginning after December 15, 2015. The adoption of this guidance is not expected to have an impact on the Company’s consolidated financial statements or disclosures.
In November 2015, the FASB issued an accounting standard update that requires a reporting entity to classify deferred tax assets and liabilities as noncurrent in a classified statement of financial position. Current guidance requiring the offsetting of deferred tax assets and liabilities of a tax-paying component of an entity and presentation as a single noncurrent amount is not affected. The new guidance is effective for annual and interim periods beginning after December 15, 2015, and early adoption is permitted for financial statements as of the beginning of an interim or annual reporting period. The Company made the decision to adopt this guidance early and have applied it retroactively in the current fiscal period. The adoption of this guidance has impacted the current and noncurrent deferred tax asset and liability balances for the current and prior fiscal years on the consolidated balance sheets. As a result of this retroactive application, the Company reclassified $2.9 million previously included in deferred tax assets—current to offset deferred tax liabilities on the consolidated balance sheets for 2014.
82
Note 2—Business Combinations
In January 2013, the Company acquired the assets of The Lascaux Company, Inc., owners of the “Mixel” iOS mobile application, for a purchase price of $750,000, which consisted of $675,000 paid on the closing date and $75,000 due on the first anniversary of the closing date, subject to indemnification provisions. In connection with the acquisition, the Company granted options to purchase 181,160 shares of common stock to certain key employees of the acquired company. Acquired assets consisted of the Mixel iOS mobile application and related source code and domain name registration. The purchase price was allocated between acquired technology intangible assets and goodwill in the Company’s consolidated financial statements. This acquisition did not have any measureable impact on consolidated revenue or (loss) income from operations.
On April 29, 2014, the Company completed the acquisition of Jarvis Labs, Inc., owners of the “Grand St.” online technology marketplace. Total consideration for the acquisition was approximately $3.2 million, consisting of $1.0 million in cash and 212,552 shares of the Company’s common stock with a fair value of $2.2 million on the acquisition date. Additionally, the Company issued 328,580 shares of common stock, with a fair value of $3.4 million on the acquisition date, which are tied to continuous service with the Company as an employee or consultant and are being accounted for as post-acquisition stock-based compensation expense over the 3-year vesting period. Because the Company was not publicly traded at the time of the acquisition, the Company utilized equity valuations based on comparable publicly-traded companies, discounted cash flows, an analysis of the Company’s enterprise value and any other factors deemed relevant in estimating the fair value of its common stock for purposes of calculating the fair value of the purchase price.
The following table summarizes the components of the Grand St. purchase price and the allocation of the purchase price at fair value (in thousands):
Cash paid | $ | 1,040 | |
Common shares | 2,202 | ||
Total purchase consideration | $ | 3,242 | |
Working capital | $ | 85 | |
Developed technology | 2,000 | ||
Customer relationships | 600 | ||
Trademarks | 200 | ||
Goodwill | 991 | ||
Deferred tax liability | (634 | ) | |
Net assets acquired | $ | 3,242 | |
Included in working capital is approximately $0.1 million of cash acquired.
The amounts allocated to developed technology, customer relationships and trademark (the acquired intangible assets) total $2.8 million. The fair value assigned to developed technology was determined primarily using the cost approach, which estimates the cost to reproduce the asset, adjusted for loss due to functional and economic obsolescence. The fair value of the Company’s customer relationships was determined primarily using the income approach, which discounts expected future cash flows to present value using estimates and assumptions determined by management. The fair value assigned to trademark was determined using the relief from royalty method, where the owner of the asset realizes a benefit from owning the intangible asset rather than paying a rental or royalty rate for use of the asset. The acquired identifiable intangible assets are being amortized on a straight-line basis over three years, which approximates the pattern in which the assets are utilized. None of the goodwill recorded in the acquisition is deductible for tax purposes.
On June 18, 2014, the Company completed the acquisition of Incubart SAS, a societe par actions simplifiee organized under the laws of France, which operates the online marketplace A Little Market (“ALM”). Total consideration for the acquisition was $30.8 million, consisting of $5.3 million in cash, of which $4.2 million was paid on the closing date, $0.3 million was paid on March 31, 2015 and $0.8 million was paid on February 18, 2016, and 2,439,847 shares of the Company’s common stock with a fair value of $25.5 million on the acquisition date. Because the Company was not publicly traded at the time of the acquisition, the Company utilized equity valuations based on comparable publicly-traded companies, discounted cash flows, an analysis of the Company’s enterprise value and any other factors deemed relevant in estimating the fair value of its common stock for purposes of calculating the fair value of the purchase price. The terms of the purchase agreement provide for the sale of put options to certain of the former shareholders of ALM. The put options enable the holders of the options to sell up to all of their shares back to the Company, subject to certain vesting and restrictions, at fair value, but not to exceed $8.26 per share and not less than $4.00 per share. The put right terminates with respect to a share on the earlier of one year from when such share is vested or the liquidation date, as defined in the agreement containing the put option. The holders of the options paid an
83
aggregate of $0.1 million cash to the Company at the date of acquisition and the Company recorded a $0.1 million liability for the fair value of the put options at that time. Additionally, the Company issued 599,497 shares of common stock, with a fair value of $6.3 million on the acquisition date, which are tied to continuous service with the Company as an employee or consultant and are being accounted for as post-acquisition stock-based compensation expense over the three-year vesting period. Since the put options relate in part to these shares, these restricted shares will be recorded as liability-classified stock awards as earned.
The following table summarizes the components of the purchase price at fair value and the allocation of the purchase price at fair value (in thousands):
Cash paid | $ | 5,290 | |
Common shares | 25,521 | ||
Total purchase consideration | $ | 30,811 | |
Working capital | $ | 625 | |
Property and equipment and other assets | 95 | ||
Developed technology | 1,636 | ||
Customer relationships | 1,693 | ||
Trademarks | 775 | ||
Goodwill | 27,309 | ||
Deferred tax liability | (757 | ) | |
Other long-term liabilities | (565 | ) | |
Net assets acquired | $ | 30,811 | |
Included in working capital is approximately $0.5 million of cash and cash equivalents acquired.
The amount allocated to developed technology, customer relationships and trademark (the acquired intangible assets) totals $4.1 million. The fair value assigned to developed technology was determined primarily by using the cost approach, which estimates the cost to reproduce the asset, adjusted for loss due to functional and economic obsolescence. The fair value of the Company’s customer relationships was determined primarily by using the income approach, which discounts expected future cash flows to present value using estimates and assumptions determined by management. The fair value assigned to trademark was determined using the relief from royalty method, where the owner of the asset realizes a benefit from owning the intangible asset rather than paying a rental or royalty rate for use of the asset. The acquired identifiable intangible assets are being amortized on a straight-line basis over three years, which approximates the pattern in which the assets are utilized. Goodwill of $27.3 million, none of which is deductible for tax purposes, was recorded in connection with the ALM acquisition, which is primarily attributed to synergies arising from the acquisition and the value of the acquired workforce.
The Company incurred approximately $2.1 million in acquisition-related costs, included in general and administrative expenses. These acquisitions increased revenue by $1.8 million and contributed $5.7 million to the Company’s consolidated net loss in the year ended December 31, 2014. The impact to net loss was primarily due to amortization of intangibles and stock-based compensation associated with the acquisitions.
The following unaudited pro forma financial information presents the combined operating results of the Company, Grand St. and ALM as if each acquisition had occurred as of January 1, 2013. The unaudited pro forma financial information includes the accounting effects of the business combinations, including adjustments to the amortization of intangible assets and professional fees associated with the acquisition. The unaudited pro forma information does not necessarily reflect the actual results that would have been achieved, nor is it necessarily indicative of our future consolidated results.
The unaudited pro forma financial information is presented in the table below for the years ended December 31, 2013 and 2014 (in thousands except per share amounts):
Year Ended December 31, | |||||||
2013 | 2014 | ||||||
Revenue | $ | 127,838 | $ | 197,395 | |||
Net loss | (7,533 | ) | (15,403 | ) | |||
Basic net loss per share | (0.21 | ) | (0.37 | ) | |||
Diluted net loss per share | (0.21 | ) | (0.37 | ) | |||
84
During the second quarter of 2015, the Company recognized changes to assets and liabilities impacting the associated purchase price allocations of ALM and Grand St. at their respective dates of acquisition. These adjustments resulted in a decrease to the initial purchase price allocation of goodwill for ALM and Grand St. of $0.4 million and $0.2 million, respectively.
Note 3—Fair Value Measurements
The Company has characterized its investments in marketable securities, based on the priority of the inputs used to value the investments, into a three-level fair value hierarchy. The fair value hierarchy gives the highest priority to quoted prices in active markets for identical assets or liabilities (Level 1), and lowest priority to unobservable inputs (Level 3). If the inputs used to measure the investments fall within different levels of the hierarchy, the categorization is based on the lowest level input that is significant to the fair value measurement of the investment. Investments recorded in the accompanying consolidated balance sheet are categorized based on the inputs to valuation techniques as follows:
Level 1—These are investments where values are based on unadjusted quoted prices for identical assets in an active market that the Company has the ability to access.
Level 2—These are investments where values are based on quoted market prices in markets that are not active or model derived valuations in which all significant inputs are observable in active markets.
Level 3—These are liabilities where values are derived from techniques in which one or more significant inputs are unobservable.
The following are the major categories of assets and liabilities measured at fair value on a recurring basis as of December 31, 2014 and December 31, 2015 using quoted prices in active markets for identical assets (Level 1), significant other observable inputs (Level 2) and significant unobservable inputs (Level 3) (in thousands):
As of December 31, 2014 | |||||||||||||||
Level 1 | Level 2 | Level 3 | Total | ||||||||||||
Asset | |||||||||||||||
Cash equivalents: | |||||||||||||||
Money market funds | $ | 20,288 | $ | — | $ | — | $ | 20,288 | |||||||
U.S. Government bills | 2,426 | — | — | 2,426 | |||||||||||
22,714 | — | — | 22,714 | ||||||||||||
Short-term investments: | |||||||||||||||
U.S. Government and agency bills | 19,184 | — | — | 19,184 | |||||||||||
$ | 41,898 | $ | — | $ | — | $ | 41,898 | ||||||||
Liability | |||||||||||||||
Put option classified as liability | $ | — | $ | — | $ | 16 | $ | 16 | |||||||
Acquisition–related contingent consideration classified as liability | — | — | 3,374 | 3,374 | |||||||||||
Warrants classified as liability | — | — | 1,920 | 1,920 | |||||||||||
$ | — | $ | — | $ | 5,310 | $ | 5,310 | ||||||||
As of December 31, 2015 | |||||||||||||||
Level 1 | Level 2 | Level 3 | Total | ||||||||||||
Asset | |||||||||||||||
Cash equivalents: | |||||||||||||||
Money market funds | $ | 212,390 | $ | — | $ | — | $ | 212,390 | |||||||
U.S. Government bills | 3 | — | — | 3 | |||||||||||
212,393 | — | — | 212,393 | ||||||||||||
Short-term investments: | |||||||||||||||
U.S. Government and agency bills | 21,620 | — | — | 21,620 | |||||||||||
$ | 234,013 | $ | — | $ | — | $ | 234,013 | ||||||||
Liability | |||||||||||||||
Put option classified as liability | $ | — | $ | — | $ | — | $ | — | |||||||
Acquisition–related contingent consideration classified as liability | — | — | 2,357 | 2,357 | |||||||||||
$ | — | $ | — | $ | 2,357 | $ | 2,357 | ||||||||
85
Level 1 instruments include money market funds and Corporate Certificates of Deposit and AAA-rated U.S. Government and agency securities, which are valued based on inputs including quotes from broker-dealers or recently executed transactions in the same or similar securities. In April 2015, all IPO proceeds were invested into money market fund accounts.
Level 3 instruments include contingent consideration classified as liability in connection with the acquisition of ALM and convertible warrants classified as liability. The contingent consideration is classified as liability due to its affiliation with a related put option, and its fair value is determined based on the fair value of the Company's common stock at the period-end reporting date. The fair value of the warrants classified as liability is determined using the period-end fair value of the Company's common stock, the risk-free rate for periods within the contractual life of the warrant based on the U.S. Treasury yield curve in effect at the time of grant, implied volatilities from market comparisons of certain publicly traded companies and the contractual term. On the date of the IPO, the warrants converted from warrants for preferred stock to warrants for common stock and as a result are no longer classified as liability or subject to further fair value adjustments.
The table below provides a reconciliation of the beginning and ending balances for the liabilities measured at fair value using significant unobservable inputs (Level 3) (in thousands):
Year Ended December 31, | |||||||
2014 | 2015 | ||||||
Balance at beginning of period | $ | 1,428 | $ | 5,310 | |||
Acquired | 97 | — | |||||
Changes to liability-classified stock awards | 3,374 | 738 | |||||
Settled | — | — | |||||
Conversion of liability-classified instruments to equity | — | (6,824 | ) | ||||
Net increase in fair value | 411 | 3,133 | |||||
Balance at end of period | $ | 5,310 | $ | 2,357 | |||
Note 4—Marketable Securities
Short-term investments consist of marketable securities that are available-for-sale. The cost and fair value of available-for-sale securities were as follows as of the dates indicated (in thousands):
Cost | Gross Unrealized Holding Loss | Gross Unrealized Holding Gain | Fair Value | ||||||||||||
December 31, 2014 | |||||||||||||||
U.S. Government and agency bills | $ | 19,188 | $ | (5 | ) | $ | 1 | $ | 19,184 | ||||||
$ | 19,188 | $ | (5 | ) | $ | 1 | $ | 19,184 | |||||||
December 31, 2015 | |||||||||||||||
U.S. Government and agency bills | $ | 21,636 | $ | (16 | ) | $ | — | $ | 21,620 | ||||||
$ | 21,636 | $ | (16 | ) | $ | — | $ | 21,620 | |||||||
The Company’s investments in marketable securities consist primarily of investments in Corporate Certificates of Deposit and AAA-rated U.S. Government and agency bills. When evaluating investments for other-than-temporary impairment, the Company reviews factors such as length of time and extent to which fair value has been below cost basis, the financial condition of the issuer and the Company’s ability and intent to hold the investment for a period of time, which may be sufficient for anticipated recovery in market value. The Company evaluates fair values for each individual security in the investment portfolio.
86
Note 5—Property and Equipment
Property and equipment consisted of the following as of the dates indicated (in thousands):
As of December 31, | |||||||||
Estimated useful lives | 2014 | 2015 | |||||||
Computer equipment | 3 years | $ | 16,876 | $ | 27,054 | ||||
Furniture and equipment | 2 - 4 years | 1,987 | 1,959 | ||||||
Software | 1 - 3 years | 1,146 | 1,427 | ||||||
Leasehold improvements | Shorter of life of asset or lease term | 3,134 | 8,097 | ||||||
Construction in progress (1) | Not applicable | 51,796 | 71,106 | ||||||
Website development | 3 years | 31,156 | 33,469 | ||||||
106,095 | 143,112 | ||||||||
Less: Accumulated amortization and depreciation | 30,557 | 38,091 | |||||||
$ | 75,538 | $ | 105,021 | ||||||
(1) | The Company capitalizes construction in progress and records a corresponding long-term liability for build-to-suit lease arrangements where it is considered the owner, for accounting purposes, during the construction period. |
Depreciation and amortization expense on property and equipment was $12.1 million, $15.7 million and $16.3 million for the years ended December 31, 2013, 2014 and 2015, respectively, which includes amortization expense for equipment acquired under capital leases of $1.2 million, $1.5 million and $3.8 million for the years ended December 31, 2013, 2014 and 2015, respectively. The gross balance of leased equipment as of December 31, 2014 and 2015 was $6.0 million and $17.2 million, respectively. The related accumulated amortization of equipment under capital leases was $1.2 million and $4.6 million at December 31, 2014 and 2015, respectively.
The following table summarizes capitalized website development and internal-use software activities during the periods indicated (in thousands):
Year Ended December 31, | |||||||
2014 | 2015 | ||||||
Balance as of the beginning of the period | $ | 23,897 | $ | 31,156 | |||
Additions to website development, excluding stock-based compensation | 8,281 | 9,719 | |||||
Additions to website development—stock-based compensation | 190 | 463 | |||||
Less: Retirements | 1,212 | 7,869 | |||||
31,156 | 33,469 | ||||||
Less: Accumulated amortization | 18,968 | 19,676 | |||||
$ | 12,188 | $ | 13,793 | ||||
For the years ended December 31, 2013, 2014 and 2015, the Company recorded amortization expense relating to capitalized website development and internal-use software of $6.3 million, $8.1 million and $7.3 million, respectively. The loss on write-off for website development and internal-use software assets that were retired during the years ended December 31, 2013, 2014 and 2015 was $0.7 million, $0.1 million and $1.3 million, respectively.
87
Note 6—Goodwill and Intangible Assets
The following table summarizes the changes in the carrying amount of goodwill for the periods indicated (in thousands):
Year Ended December 31, | |||||||
2014 | 2015 | ||||||
Balance as of the beginning of the period | $ | 5,346 | $ | 30,831 | |||
Acquisitions | 28,300 | — | |||||
Other adjustments(1) | (2,815 | ) | (3,079 | ) | |||
Balance as of the end of the period | $ | 30,831 | $ | 27,752 | |||
(1) | Includes the effect of foreign currency translation and adjustment to purchase price allocation of $0.6 million in 2015. |
The Company did not recognize any goodwill impairments during the years ended December 31, 2013, 2014 and 2015.
At December 31, 2014 and 2015, the gross book value and accumulated amortization of intangible assets were as follows (in thousands):
As of December 31, 2014 | As of December 31, 2015 | ||||||||||||||||||||||
Gross book value | Accumulated amortization | Net book value | Gross book value | Accumulated amortization | Net book value | ||||||||||||||||||
Trademarks | $ | 892 | $ | (169 | ) | $ | 723 | $ | 822 | $ | (427 | ) | $ | 395 | |||||||||
Technology | 4,505 | (1,547 | ) | 2,958 | 3,882 | (2,341 | ) | 1,541 | |||||||||||||||
Customer relationships | 2,313 | (584 | ) | 1,729 | 1,959 | (1,024 | ) | 935 | |||||||||||||||
Intangible assets, net | $ | 7,710 | $ | (2,300 | ) | $ | 5,410 | $ | 6,663 | $ | (3,792 | ) | $ | 2,871 | |||||||||
Amortization expense for the years ended December 31, 2013, 2014 and 2015 was $0.3 million, $1.5 million and $2.2 million, respectively.
Based on amounts recorded at December 31, 2015, the Company will recognize intangible asset amortization expense in each of the years ending December 31 as follows (in thousands):
2016 | $ | 2,020 | |
2017 | 851 | ||
Thereafter | — | ||
Total amortization expense | $ | 2,871 | |
Note 7—Debt
Credit Agreement
In May 2014, the Company entered into a $35.0 million senior secured revolving credit facility pursuant to a Revolving Credit and Guaranty Agreement with several lenders (the “Credit Agreement”). In March 2015, the Company amended the Credit Agreement to increase the credit facility to $50.0 million. In December 2015, the Company amended the Credit Agreement to clarify certain provisions relating to permitted investments and to make other immaterial updates. As amended, the Credit Agreement will mature in May 2019. The amended Credit Agreement includes a letter of credit sublimit of $10.0 million and a swingline loan sublimit of $15.0 million.
Borrowings under the Credit Agreement (other than swingline loans) bear interest, at the Company’s option, at (i) a base rate equal to the highest of (a) the prime rate, (b) the federal funds rate plus 0.50% and (c) an adjusted LIBOR rate for a one-month interest period plus 1.00%, in each case plus a margin ranging from 0.00% to 0.25% or (ii) an adjusted LIBOR rate plus a margin ranging from 1.00% to 1.25%. Swingline loans under the Credit Agreement bear interest at the same base rate (plus the margin applicable to borrowings bearing interest at the base rate). These margins are determined based on the total leverage ratio for the preceding four fiscal quarters. The Company is also obligated to pay other customary fees for a credit facility of
88
this size and type, including an unused commitment fee and fees associated with letters of credit. As amended, the Credit Agreement also permits the Company, in certain circumstances, to request an increase in the facility by an amount of up to $50.0 million (and in minimum amounts of $10.0 million) at the same maturity, pricing and other terms.
The amended Credit Agreement contains customary representations and warranties applicable to the Company and its subsidiaries and customary affirmative and negative covenants applicable to the Company and its restricted subsidiaries. The negative covenants include restrictions on, among other things, indebtedness, liens, investments, mergers, dispositions, transactions with affiliates and dividends and other distributions. These restrictions do not prohibit any of the Company's subsidiaries from making pro rata payments to the Company or any other person that owns an equity interest in such subsidiary. The Credit Agreement contains a financial covenant that requires the Company and its subsidiaries to maintain a total leverage ratio (defined as net debt to adjusted EBITDA) not to exceed 3.50 to 1.00.
As amended, the Credit Agreement includes customary events of default, including a change in control and a cross-default on the Company’s material indebtedness. The Company’s obligations under the Credit Agreement are secured by substantially all of the Company and its subsidiaries’ assets, and its obligations under the Credit Agreement are guaranteed by certain of the Company’s subsidiaries.
At December 31, 2015, the Company did not have any borrowings under the Credit Agreement.
Note 8—Warrants
As of December 31, 2014, the Company had outstanding warrants to purchase 11,373 shares of its Series C Preferred stock with an exercise price of $2.67 per share, 24,510 shares of its Series D Preferred stock with an exercise price of $6.63 per share, and 4,723 shares of its Series E Preferred stock with an exercise price of $15.88 per share (see Note 9). All of these warrants were originally issued in connection with previous lines of credit and were fair valued on the date of issuance, with the fair value amount recognized as debt issuance costs and amortized to interest expense over the original life of the line of credit. As these warrants were exercisable into shares of Preferred stock, which included certain redemption rights that are outside of the control of the Company, in accordance with ASC Topic 480 Distinguishing Liabilities from Equity, the warrants were accounted for as liabilities and were revalued at each balance sheet date. The warrants were fully vested at issuance.
During 2015 upon the closing of the IPO, all outstanding warrants for Preferred stock were converted into warrants for 203,030 shares of common stock. The warrants were revalued at the opening stock price of $24.97 on April 21, 2015, the closing date of the IPO, and $5.1 million was reclassified from liabilities to equity on that date.
In October 2015, the Company issued 96,869 shares of common stock upon the net exercise of warrants to purchase 105,099 shares of common stock with a weighted-average exercise price of $1.03 per share and a weighted-average fair market value of common stock at the date of exercise of $12.90. The warrant holders exercised this warrant in a cashless transaction and 8,230 shares were forfeited to the Company as payment of the exercise price.
As of December 31, 2015, the Company had outstanding warrants to purchase 97,931 shares of common stock, at a weighted-average exercise price of $1.62 per share.
89
For 2013 and 2014, the Company determined the fair value of the convertible preferred stock warrants utilizing the Black-Scholes model with the following weighted-average assumptions:
Series C | |||||||
December 31, | |||||||
2013 | 2014 | ||||||
Risk-free interest rate | 1.3 | % | 1.1 | % | |||
Expected term (in years) | 4 | 3 | |||||
Estimated dividend yield | — | % | — | % | |||
Weighted-average estimated volatility | 41.0 | % | 43.1 | % | |||
Fair value (in thousands) | $ | 442 | $ | 579 | |||
Series D | |||||||
December 31, | |||||||
2013 | 2014 | ||||||
Risk-free interest rate | 0.3 | % | 0.5 | % | |||
Expected term (in years) | 1.5 | 0.5 | |||||
Estimated dividend yield | — | % | — | % | |||
Weighted-average estimated volatility | 36.0 | % | 38.9 | % | |||
Fair value (in thousands) | $ | 859 | $ | 1,156 | |||
Series E | |||||||
December 31, | |||||||
2013 | 2014 | ||||||
Risk-free interest rate | 1.3 | % | 1.1 | % | |||
Expected term (in years) | 4 | 3 | |||||
Estimated dividend yield | — | % | — | % | |||
Weighted-average estimated volatility | 41.0 | % | 43.1 | % | |||
Fair value (in thousands) | $ | 127 | $ | 185 | |||
For 2015, the Company determined the fair value of the convertible preferred stock warrants through April 21, 2015, the closing date of the IPO, utilizing the opening stock price of $24.97 per share.
During the years ended December 31, 2013, 2014 and 2015, the Company recorded an unrealized loss of $0.4 million, $0.5 million and $3.1 million, respectively, from the remeasurement of the warrants to fair value.
Note 9—Stockholders’ Equity
At December 31, 2014 and 2015, the authorized capital stock of the Company included 120,000,000 and 1,400,000,000 shares of common stock, respectively. At December 31, 2014 and 2015 there were 21,165,473 shares of convertible preferred stock and 25,000,000 shares of preferred stock authorized, respectively. The convertible preferred stock, with the exclusion of Series 1 preferred stock, is referred to as “senior preferred stock.”
Common Stock
At December 31, 2013, 2014 and 2015 there were 33,082,948, 44,180,939 and 112,563,354 shares of common stock issued and outstanding, respectively. Holders of common stock are entitled to one vote per share. Holders of common stock are not entitled to receive dividends unless declared by the board of directors. No dividends have been declared through December 31, 2015. The common stock has a $0.001 par value.
90
Convertible Preferred Stock
At December 31, 2014, the Company’s outstanding convertible preferred stock consisted of the following (in thousands, except share data):
Shares Authorized | Shares Outstanding | Carrying Values | |||||||
Series A and A-1 preferred stock | 2,363,786 | 2,363,786 | $ | 808 | |||||
Series B preferred stock | 1,128,431 | 1,128,425 | 865 | ||||||
Series C preferred stock | 1,234,084 | 1,222,282 | 3,361 | ||||||
Series D and D-1 preferred stock | 4,240,120 | 4,215,610 | 27,870 | ||||||
Series E preferred stock | 401,450 | 396,727 | 6,201 | ||||||
Series 1 preferred stock | 203,399 | 203,399 | 1,322 | ||||||
Series F preferred stock | 11,594,203 | 11,594,203 | 39,785 | ||||||
Total convertible preferred stock | 21,165,473 | 21,124,432 | $ | 80,212 | |||||
At December 31, 2014, the holders of the convertible preferred stock had certain voting rights and dividend and liquidity preferences. The liquidation preference provisions of the convertible preferred stock were considered contingent redemption provisions because there were certain elements that were not solely within the control of the Company, such as a change in control of the Company. Accordingly, the Company presented the convertible preferred stock within the mezzanine portion of the accompanying consolidated balance sheets.
Each outstanding share of convertible preferred stock was convertible, at the holder’s option or automatically upon certain events as described below, into shares of common stock at a conversion rate determined by dividing the original issue price for such share by the then Conversion Price for such share. The original issue price, conversion price and liquidation preference price of each series of preferred stock were as follows:
Price Per Share | |||||||||||
Original Issue Price | Conversion Price | Liquidation Preference | |||||||||
Series A preferred stock | $ | 0.2429 | $ | 0.04858 | $ | 0.2429 | |||||
Series A-1 preferred stock | 0.3915 | 0.07830 | 0.3915 | ||||||||
Series B preferred stock | 0.80 | 0.160 | 0.80 | ||||||||
Series C preferred stock | 2.67 | 0.534 | 2.67 | ||||||||
Series D preferred stock | 6.63 | 1.326 | 6.63 | ||||||||
Series D-1 preferred stock | 6.63 | 1.326 | 6.63 | ||||||||
Series E preferred stock | 15.88 | 3.176 | 15.88 | ||||||||
Series 1 preferred stock | 6.45 | 1.290 | 6.45 | ||||||||
Series F preferred stock | 3.45 | 6.90 | 3.45 | ||||||||
The conversion price was subject to adjustment in the event of certain anti-dilutive issuances of shares of common stock. The conversion price per share in the table above reflects the adjustment for the 10-for-1 stock split of the Company’s common stock effective in May 2011 and the 1-for-2 reverse split of the Company's common stock, which was effected on March 25, 2015.
Upon the closing of the IPO on April 21, 2015, all outstanding shares of convertible preferred stock were converted into 53,448,243 shares of common stock. As of December 31, 2015, there was no convertible preferred stock outstanding.
Tender Offers
On January 13, 2014, certain investors participated in a tender offer to purchase shares of common stock and preferred stock at a price of $10.60 per share (on an as-converted basis) from the Company’s employees and existing stockholders with the maximum aggregate offer price of up to $74.2 million. The terms of the tender offer were limited to a maximum of one-half of an employee’s fully-vested stock and options and warrants to purchase stock and a minimum of one-half of a former employee’s or non-employee’s fully-vested stock and options and warrants to purchase stock. At the close of the transaction, 3,154,219 shares were tendered for a total price of $33.4 million.
91
Common Stock Issuances
In April 2014, the Company issued 3,301,887 shares of common stock to certain investors at $10.60 per share for an aggregate value of $35.0 million.
Additionally, the Company issued a total of 3,580,476 shares of common stock in connection with the acquisitions of Grand St. and ALM, of which 2,652,399 shares with an aggregate fair value of $27.7 million on the applicable acquisition dates are included in the Company’s purchase price and 928,077 shares with an aggregate fair value of $9.7 million on the applicable acquisition dates are tied to continued employment with the Company and are being accounted for as post-acquisition compensation expense.
Stock Repurchases
In 2013, the board of directors authorized the repurchase and retirement of 23,500 shares of outstanding common stock at a cost of $0.2 million. The repurchased shares were retired and have been removed from both the issued and outstanding number of shares in the consolidated balance sheet and consolidated statement of stockholders’ equity.
Secondary Transactions
In the year ended December 31, 2014, the Company recorded $0.5 million as compensation expense related to the excess of the selling price per share paid to certain of the Company’s former employees over the fair value of the shares sold to an investor by these former employees in secondary transactions.
Note 10—Stock-based Compensation
The Company's 2015 Equity Incentive Plan (the "2015 Plan") was adopted by its board of directors and approved by stockholders in March 2015. The 2015 Plan became effective immediately upon adoption although no awards were made under it until the effective date of the IPO. The 2015 Plan replaced the 2006 Stock Plan, and no further grants were made under the 2006 Stock Plan as of the effective date of the IPO.
Under the 2006 Stock Plan, incentive and nonqualified stock options or rights to purchase common stock were granted to eligible participants. Options were generally granted for a term of 10 years and generally vested 25% after the first year of service and ratably each month over the remaining 36-month period contingent on continued employment with the Company on each vesting date. At December 31, 2014, 24,252,967 shares were authorized under the 2006 Stock Plan and 1,518,002 shares were available for future grant.
The 2015 Plan provides for the grant of incentive stock options, non-statutory stock options, stock appreciation rights, restricted stock, restricted stock units ("RSUs") and performance cash awards to employees, directors and consultants. Beginning in 2016, the number of shares available for issuance under the 2015 Plan may be increased annually by an amount equal to the lesser of 7,050,000 shares of common stock, 5% of the outstanding shares of common stock as of the last day of the immediately preceding fiscal year, or such other amount as determined by the Company's board of directors. The Board of Directors approved an increase of 2,814,083 shares available for issuance under the 2015 Plan as of January 4, 2016. Any awards issued under the 2015 Plan that are forfeited by the participant will become available for future grant under the 2015 Plan. The number of shares of the Company’s common stock initially reserved for issuance under the 2015 Plan equaled the sum of 14,100,000 shares plus up to 12,653,075 shares reserved for issuance or subject to outstanding awards under the 2006 Stock Plan. At December 31, 2015, 14,735,179 shares were authorized under the 2015 Plan, and 14,362,827 shares were available for future grant.
In the year ended December 31, 2015, we granted incentive stock options, nonqualified stock options and RSUs to eligible participants. Options were generally granted for a term of 10 years and vest 25% after the first year of service and ratably each month over the remaining 36-month period contingent on continued employment with the Company on each vesting date. RSUs generally vest 25% after the first year following the vesting commencement date, which is the first day of the fiscal quarter closest to the date of grant, and then vest ratably each quarter over the remaining 12-quarter period contingent on continued employment with the Company on each vesting date.
The fair value of each option award is estimated on the date of grant using the Black-Scholes option-pricing model using the inputs below. Prior to the IPO, the Company utilized equity valuations based on comparable publicly-traded companies, discounted free cash flows, an analysis of the Company's enterprise value and any other factors deemed relevant in estimating the fair value of its common stock. Subsequent to the IPO, the Company has used the closing price of its common stock on
92
Nasdaq as the fair value of its common stock. The risk-free rate for periods within the contractual life of the option is based on the U.S. Treasury yield curve in effect at the time of grant. Expected volatilities are based on implied volatilities from market comparisons of certain publicly traded companies and other factors. The expected term of stock options granted has been determined using the simplified method, which uses the midpoint between the vesting date and the contractual term. The requisite service period is generally four years from the date of grant. The fair value of RSUs is determined based on the closing price of the Company's common stock on Nasdaq on the grant date.
The fair value of options granted in each year using the Black-Scholes pricing model has been based on the following assumptions:
Year Ended December 31, | |||||
2013 | 2014 | 2015 | |||
Volatility | 45.7% - 50.3% | 43.0% - 49.0% | 40.4% - 45.0% | ||
Risk-free interest rate | 0.9% - 1.9% | 1.7% - 2.1% | 1.3% - 1.9% | ||
Expected term (in years) | 5.48 - 6.08 | 5.46 - 6.08 | 5.5 - 6.1 | ||
Dividend rate | —% | —% | —% | ||
The following table summarizes the activity for the Company’s options:
Shares | Weighted-Average Exercise Price | Weighted-Average Remaining Contract Term (in years) | Aggregate Intrinsic Value | |||||||||
Outstanding at January 1, 2013 | 11,936,131 | $ | 2.36 | |||||||||
Granted | 3,076,101 | 5.52 | ||||||||||
Exercised | (1,024,560 | ) | 1.30 | |||||||||
Forfeited/Cancelled | (797,252 | ) | 3.80 | |||||||||
Outstanding at December 31, 2013 | 13,190,420 | 3.10 | ||||||||||
Granted | 3,206,717 | 10.28 | ||||||||||
Exercised | (4,215,628 | ) | 1.89 | |||||||||
Forfeited/Cancelled | (656,230 | ) | 6.58 | |||||||||
Outstanding at December 31, 2014 | 11,525,279 | 5.34 | ||||||||||
Granted | 1,660,170 | 16.19 | ||||||||||
Exercised | (1,315,735 | ) | 2.76 | |||||||||
Forfeited/Cancelled | (800,855 | ) | 9.94 | |||||||||
Outstanding at December 31, 2015 | 11,068,859 | 6.94 | 7.01 | $ | 31,932,259 | |||||||
Total exercisable at December 31, 2015 | 6,873,262 | 4.43 | 6.14 | 28,485,307 | ||||||||
Total vested and expected to vest at December 31, 2015 | 10,574,276 | 6.79 | 6.94 | 31,678,517 | ||||||||
The weighted-average grant date fair value of options granted in the years ended December 31, 2013, 2014 and 2015 was $2.60, $4.86 and $6.89, respectively. The total intrinsic value of options exercised in the years ended December 31, 2013, 2014 and 2015 was $4.0 million, $24.8 million and $15.1 million, respectively, and the total fair value of awards that vested in the years ended December 31, 2013, 2014 and 2015 was $3.5 million, $4.7 million and $8.3 million, respectively. The total unrecognized compensation at December 31, 2015 was $15.8 million, which will be recognized over a weighted-average period of 2.6 years.
93
The following table summarizes the activity for the Company’s unvested RSUs:
Shares | Weighted-Average Grant Date Fair Value | |||||
Unvested at December 31, 2014 | — | $ | — | |||
Granted | 407,368 | 13.78 | ||||
Vested | — | — | ||||
Forfeited/Cancelled | (11,522 | ) | 16.76 | |||
Unvested at December 31, 2015 | 395,846 | 13.70 | ||||
Total expected to vest at December 31, 2015 | 343,291 | 13.68 | ||||
The total unrecognized compensation at December 31, 2015 was $4.2 million, which will be recognized over a weighted-average period of 3.11 years. Total stock-based compensation expense included in the consolidated statements of operations is as follows (in thousands):
Year Ended December 31, | |||||||||||
2013 | 2014 | 2015 | |||||||||
Cost of revenue | $ | 200 | $ | 1,113 | $ | 871 | |||||
Marketing | 79 | 216 | 560 | ||||||||
Product development | 785 | 1,461 | 2,860 | ||||||||
General and administrative | 2,770 | 7,260 | 6,550 | ||||||||
$ | 3,834 | $ | 10,050 | $ | 10,841 | ||||||
The total stock-based compensation expense in the years ended December 31, 2014 and 2015 includes $4.1 million and $1.9 million in acquisition-related stock-based compensation expense, respectively.
Note 11—Income Taxes
The following are the domestic and foreign components of the Company’s income (loss) before income taxes (in thousands):
Year Ended December 31, | |||||||||||
2013 | 2014 | 2015 | |||||||||
Domestic | $ | (544 | ) | $ | 6,084 | $ | 25,627 | ||||
International | 602 | (16,344 | ) | (53,621 | ) | ||||||
Income (loss) before income taxes | $ | 58 | $ | (10,260 | ) | $ | (27,994 | ) | |||
94
The income tax provision is comprised of the following (in thousands):
Year Ended December 31, | |||||||||||
2013 | 2014 | 2015 | |||||||||
Current: | |||||||||||
Federal | $ | 91 | $ | 5,378 | $ | 24,524 | |||||
State | (614 | ) | 21 | 3,843 | |||||||
Foreign | 95 | 401 | 579 | ||||||||
Total current | (428 | ) | 5,800 | 28,946 | |||||||
Deferred: | |||||||||||
Federal | 871 | (50 | ) | (2,863 | ) | ||||||
State | 411 | (186 | ) | 108 | |||||||
Foreign | — | (581 | ) | (122 | ) | ||||||
Total deferred | 1,282 | (817 | ) | (2,877 | ) | ||||||
Total income tax provision | $ | 854 | $ | 4,983 | $ | 26,069 | |||||
The current tax expense listed above does not reflect income tax benefits of $22,000, $4.9 million and $3.9 million for the years ended December 31, 2013, 2014 and 2015, respectively, related to excess tax deductions on share-based compensation because we recorded these benefits directly to additional paid-in capital.
A reconciliation of the income tax provision (benefit) at the U.S. federal statutory income tax rate of 35% to the Company’s total income tax provision is as follows (in thousands):
Year Ended December 31, | |||||||||||
2013 | 2014 | 2015 | |||||||||
Income tax provision (benefit) at federal statutory rate | $ | 20 | $ | (3,488 | ) | $ | (9,798 | ) | |||
State and local taxes net of federal benefit | (135 | ) | (109 | ) | 2,575 | ||||||
Foreign income tax rate differential | (131 | ) | 3,255 | 11,584 | |||||||
Non-deductible stock-based compensation | 611 | 1,963 | 1,571 | ||||||||
Net unrealized loss on warrant and other liabilities | 143 | 140 | 1,097 | ||||||||
Non-deductible items | 114 | 152 | 1,314 | ||||||||
Uncertain tax positions | — | 398 | 5,523 | ||||||||
Return to provision adjustment | 240 | 36 | (25 | ) | |||||||
Non-deductible acquisition costs | — | 582 | 10 | ||||||||
Change in valuation allowance | — | 2,065 | 7,957 | ||||||||
Research and development credit | — | — | (7,684 | ) | |||||||
Deferred charge on restructuring | — | — | 12,168 | ||||||||
Other | (8 | ) | (11 | ) | (223 | ) | |||||
Total income tax provision | $ | 854 | $ | 4,983 | $ | 26,069 | |||||
95
Deferred income taxes reflect the net tax effect of temporary differences between the carrying amounts of assets and liabilities for financial reporting purposes and the amounts used for income tax purposes. Significant components of the Company’s deferred tax assets (liabilities) are as follows (in thousands):
As of December 31, | |||||||
2014 | 2015 | ||||||
Deferred tax assets: | |||||||
Net operating loss carryforwards | $ | 3,274 | $ | 7,961 | |||
Research and development credit carryforwards | — | 898 | |||||
Stock-based compensation expense | 2,222 | 3,953 | |||||
Accrued VAT liability | 612 | 74 | |||||
Alternative minimum tax credit | 163 | 717 | |||||
Allowance for doubtful accounts | 701 | 650 | |||||
Deferred rent | 108 | 146 | |||||
Accrued vacation | 413 | 640 | |||||
Unrealized loss on foreign currency | 554 | 3,035 | |||||
Other, net | 1,041 | 1,143 | |||||
Total deferred tax assets | 9,088 | 19,217 | |||||
Less valuation allowance | 1,892 | 9,540 | |||||
Total net deferred tax asset | 7,196 | 9,677 | |||||
Deferred tax liabilities: | |||||||
Depreciation and amortization | (5,467 | ) | (4,490 | ) | |||
Restructuring liability | — | (65,585 | ) | ||||
Other liabilities | (1,878 | ) | (1,022 | ) | |||
Total deferred tax liabilities | (7,345 | ) | (71,097 | ) | |||
Net deferred tax liabilities | $ | (149 | ) | $ | (61,420 | ) | |
As of December 31, 2014, the Company had approximately $6.9 million and $4.3 million of federal and preapportionment New York City NOL carryforwards, respectively, as well as immaterial amounts of NOLs in other states. As of December 31, 2015, the Company had approximately $0.2 million and $0.0 million of federal and preapportionment New York City NOL carryforwards, respectively, as well as immaterial amounts of NOLs in other states. The federal NOLs will begin to expire in 2032 if unused. The remainder of the NOL deferred tax asset balance is comprised of losses in certain foreign jurisdiction and are currently subject to a valuation allowance.
The utilization of the Company’s NOL carryforwards is subject to an annual limitation under Section 382 of the Internal Revenue Code due to a change of ownership. However, the Company does not believe such annual limitation will impact its realization of the NOL carryforwards.
As of December 31, 2014 and 2015, the Company had approximately $0.2 million and $0.7 million of federal alternative minimum tax credits, which may be carried forward indefinitely. As of December 31, 2015, the Company had federal research and development tax credit carryforwards of $2.8 million, which will begin to expire in 2031 if unused.
The Company assesses the likelihood of its ability to realize the benefit of its deferred tax assets in each jurisdiction by evaluating all relevant positive and negative evidence. To the extent the Company determines that some or all of its deferred tax assets are not more likely than not to be realized, it establishes a valuation allowance. For the year ended December 31, 2015, the Company determined that the existence of a three-year cumulative loss incurred in certain foreign jurisdictions, inclusive of 2015, constituted sufficiently strong negative evidence to warrant the establishment of a valuation allowance. As a result, a valuation allowance of $9.5 million as of December 31, 2015 has been recorded against certain of the Company’s deferred tax assets. The amount of the deferred tax assets considered realizable is $9.7 million.
96
The following table summarizes the valuation allowance activity for the periods indicated (in thousands):
Year Ended December 31, | |||||||||||
2013 | 2014 | 2015 | |||||||||
Balance as of the beginning of period | $ | — | $ | — | $ | 1,892 | |||||
Additions charged to expense | — | 3,915 | 7,983 | ||||||||
Deletions credited to expense | — | (1,850 | ) | — | |||||||
Currency translation | — | (173 | ) | (335 | ) | ||||||
Balance as of the end of period | $ | — | $ | 1,892 | $ | 9,540 | |||||
The Company has not recorded deferred income taxes with respect to undistributed earnings of foreign subsidiaries as such earnings are expected to remain reinvested indefinitely. Upon distribution as dividends or otherwise, such amounts would be subject to taxation in the U.S. However, U.S. tax liabilities would be offset, in whole or part, by allowable tax credits with respect to income taxes previously paid to foreign jurisdictions. The amount of undistributed earnings of non-U.S. subsidiaries at December 31, 2015, as well as the related deferred income tax, if any, is not material.
As of December 31, 2013, the Company had no unrecognized income tax benefits. As of December 31, 2014 and 2015 the Company had unrecognized income tax benefits of $0.4 million and $22.2 million, respectively.
The following table summarizes the unrecognized tax benefit activity for the periods indicated (in thousands):
As of December 31, | |||||||||||
2013 | 2014 | 2015 | |||||||||
Balance as of the beginning of period | $ | — | $ | — | $ | 398 | |||||
Additions based on tax positions related to the current year | — | 398 | 21,797 | ||||||||
Additions for tax positions of prior years | — | — | 34 | ||||||||
Reductions for tax provisions of prior years | — | — | — | ||||||||
Settlements | — | — | — | ||||||||
Balance as of the end of period | $ | — | $ | 398 | $ | 22,229 | |||||
The Company files tax returns in the United States, New York, and various other state and foreign jurisdictions.
Generally, tax returns for the Company's tax year 2012 and later remain open to examination. To the extent tax attributes generated in earlier closed years are carried forward into years that are open to examination, they may be subject to adjustment in audit.
In January 2015, the Company implemented an updated global corporate structure to more closely align with its global operations and future expansion plans outside of the United States. The new structure changed how the Company uses its intellectual property and implemented certain intercompany arrangements. The Company believes this may eventually result in a reduction in its overall effective tax rate and other operational efficiencies. The revised structure resulted in the setup of a deferred tax liability in the amount of $66.0 million on the taxable gain created in the transaction. A deferred charge was recorded for the same amount representing the future income tax which will be amortized into income tax expense over five years. During the twelve months ended December 31, 2015, $13.2 million was recorded to income tax expense.
The amount of unrecognized tax benefits, included within “other liabilities” on the consolidated balance sheets, increased $21.8 million in the year ended December 31, 2015, from $0.4 million at December 31, 2014 to $22.2 million at December 31, 2015. The increase was primarily in connection with the implementation of the updated global corporate structure. A deferred charge of $19.7 million related to the unrecognized tax benefit of the implementation was recorded representing the future income tax which will be amortized into income tax expense over five years. During the twelve months ended December 31, 2015, $3.9 million was recorded to income tax expense for the implementation. The total amount of unrecognized tax benefits that, if recognized, would favorably affect the effective tax rate is $6.5 million at December 31, 2015.
97
Note 12—Net Loss Per Share
The following table presents the calculation of basic and diluted net loss per share for periods presented (in thousands, except share and per share data):
Year Ended December 31, | |||||||||||
2013 | 2014 | 2015 | |||||||||
Net loss | $ | (796 | ) | $ | (15,243 | ) | $ | (54,063 | ) | ||
Basic and diluted shares: | |||||||||||
Weighted average common shares outstanding | 32,667,242 | 40,246,663 | 91,122,291 | ||||||||
Net loss per share attributable to common stockholders: | |||||||||||
Basic and diluted net loss per share applicable to common stockholders | $ | (0.02 | ) | $ | (0.38 | ) | $ | (0.59 | ) | ||
The following potential common shares were excluded from the calculation of diluted net loss per share attributable to common stockholders because their effect would have been anti-dilutive for the periods presented:
Year Ended December 31, | ||||||||
2013 | 2014 | 2015 | ||||||
Stock options | 12,422,276 | 11,308,241 | 11,806,620 | |||||
Restricted Stock Units | — | — | 128,200 | |||||
Warrants | 203,030 | 203,030 | 182,031 | |||||
Convertible preferred stock | 53,448,243 | 53,448,243 | 16,254,123 | |||||
Total anti-dilutive securities | 66,073,549 | 64,959,514 | 28,370,974 | |||||
Note 13—Segment and Geographic Information
Revenue by country is based on the billing address of the seller. The following table summarizes revenue by geographic area (in thousands):
Year Ended December 31, | |||||||||||
2013 | 2014 | 2015 | |||||||||
United States | $ | 103,428 | $ | 153,866 | $ | 213,389 | |||||
International | 21,594 | 41,725 | 60,110 | ||||||||
Revenue | $ | 125,022 | $ | 195,591 | $ | 273,499 | |||||
No individual international country’s revenue exceeded 5% of total revenue. All significant long-lived assets are located in the United States.
Note 14—Commitments and Contingencies
Lease Commitments
Capital Leases
The Company entered into a credit agreement with ePlus Group, Inc. (“ePlus”) on January 3, 2014, which provided the Company with a credit line of up to $8.0 million for computer equipment leases (the “ePlus Line”), which was increased to $18.0 million during 2015. The ePlus Line allows the Company to order equipment from any approved vendor. ePlus purchases the equipment on behalf of the Company and leases it back to the Company. The leases have a 36-month term and are payable in equal monthly installments with a buy-out option of $1 or fair market value at the end of the lease term depending on the
98
equipment. As of December 31, 2015, the Company has leased approximately $17.2 million of computer equipment using the ePlus Line.
The Company had a credit agreement with TriplePoint Capital, LLC (“TriplePoint”), which provided the Company with a credit line of up to $20.0 million for computer equipment leases (the “TriplePoint Line”). The TriplePoint Line allowed the Company to order equipment from any vendor. TriplePoint purchased the equipment on behalf of the Company and leased it back to the Company. The leases have a 36-month term, interest rate of 8.25%, and are payable in equal monthly installments. The Company stopped buying equipment under the TriplePoint Line in June 2012 and paid off the remaining lease obligations during 2015 in accordance with the terms of the credit agreement. At December 31, 2015, the Company no longer had any leased computer equipment under the TriplePoint Line.
For the years ended December 31, 2013, 2014 and 2015, the accompanying consolidated statement of operations includes charges of approximately $0.2 million, $0.4 million and $1.2 million for interest expense, respectively, related to the equipment leased using the TriplePoint Line and ePlus Lines.
Operating Leases
In 2014, the Company entered into a new lease for office space in Dublin, Ireland expiring in 2024. In 2015, the Company entered into a new lease for office space in London, UK expiring in 2025, and entered into lease extensions for existing office space in San Francisco, California and Hudson, New York expiring in 2020 and 2021, respectively. Rent expense for these operating leases is recognized over the term of each respective lease on a straight-line basis. In addition, the Company leases other office facilities under shorter terms and cancellable leases.
Total rent expense for the years ended December 31, 2013, 2014 and 2015 was $2.4 million, $3.6 million and $5.1 million respectively.
Build-to-Suit Lease
In May 2014, the Company entered into a 10-year lease agreement for approximately 199,000 rentable square feet of office space in Brooklyn, New York for the Company’s new headquarters, which commenced in 2015. Of the total new office space, approximately 172,000 rentable square feet is being accounted for as a build-to-suit lease and approximately 27,000 rentable square feet located in an adjacent building is being accounted for as an operating lease. In connection with the lease agreement, the Company established a $5.3 million collateral account, reflected in the restricted cash balance on the consolidated balance sheet.
The following table represents the Company’s commitments under its current capital, operating, and build-to-suit lease agreements as of December 31, 2015 (in thousands):
Capital Lease Obligations | Operating Leases | Build-to-Suit Lease | |||||||||
Periods ending | |||||||||||
2016 | $ | 7,011 | $ | 3,716 | $ | — | |||||
2017 | 5,946 | 2,912 | 5,883 | ||||||||
2018 | 2,413 | 3,901 | 9,381 | ||||||||
2019 | — | 3,951 | 9,451 | ||||||||
2020 | — | 3,604 | 9,522 | ||||||||
Thereafter | — | 13,801 | 59,188 | ||||||||
Total minimum payments required | $ | 15,370 | $ | 31,885 | $ | 93,425 | |||||
Amounts representing interest | 2,189 | ||||||||||
Present value of net minimum payments | 13,181 | ||||||||||
Current maturities | 5,610 | ||||||||||
Long-term payment obligations | $ | 7,571 | |||||||||
99
Tax Contingencies
The Company had reserves of $3.5 million and $2.6 million at December 31, 2014 and 2015, respectively, for certain non-income tax obligations, representing management’s best estimate of its potential liability. The Company could also be subject to examination in various jurisdictions related to income tax and non-income tax matters. The resolution of these types of matters, if in excess of the recorded reserve, could have an adverse impact on the Company’s business.
Legal Proceedings
On May 13, 2015, a purported securities class action complaint (Altayyar v. Etsy, Inc., et al., Docket No. 1:15-cv-02785) was filed in the United States District Court for the Eastern District of New York against the Company and certain officers. The complaint was brought on behalf of a purported class consisting of all persons or entities who purchased or otherwise acquired shares of the Company's common stock from April 16, 2015 through and including May 10, 2015. It asserted violations of Sections 10(b) and 20(a) of the Securities Exchange Act of 1934 based on allegedly false or misleading statements and omissions with respect to, among other things, merchandise for sale on the Company's website that may be counterfeit or constitute trademark or copyright infringement and actions taken by third-party brands against Etsy sellers for trademark or copyright infringement.
On October 22, 2015, the court appointed a lead plaintiff and lead plaintiff’s counsel. On January 21, 2016, lead plaintiff filed an amended class action complaint alleging false or misleading statements or omissions with respect to substantially the same topics as the original complaint. The amended complaint adds certain outside directors and underwriters as defendants, expands the purported class period to be April 16, 2015 to August 4, 2015, inclusive, and asserts violations of Sections 11, 12(a)(2), and 15 of the Securities Act of 1933, as well as Sections 10(b) and 20(a) of the Securities Exchange Act of 1934. The amended complaint seeks certification as a class action and unspecified compensatory damages plus interest and attorneys' fees. The Company and the named officers and directors intend to defend themselves vigorously against this action. In light of, among other things, the early stage of the litigation, the Company is unable to predict the outcome of this matter and is unable to make a meaningful estimate of the amount or range of loss, if any, that could result from an unfavorable outcome.
On July 21, 2015, a purported securities class action complaint (Cervantes v. Dickerson, et.al., Case No. CIV 534768) was filed in the Superior Court of State of California, County of San Mateo against the Company, certain officers, directors and underwriters. The complaint asserts violations of Sections 11 and 15 of the Securities Act of 1933. As in the Altayyar litigation, the complaint alleges misrepresentations in the Company’s Registration Statement on Form S-1 and Prospectus with respect to, among other things, merchandise for sale on the Company's website that may be counterfeit or constitute trademark or copyright infringement. The complaint seeks certification as a class action and unspecified compensatory damages plus interest and attorneys' fees. On December 7, 2015, the Company and the underwriter defendants moved to stay the Cervantes action on the grounds of forum non conveniens.
On November 5, 2015, another purported securities class action complaint (Weiss v. Etsy et al., No. CIV 536123) was filed in the Superior Court of State of California, County of San Mateo. The Weiss complaint names as defendants the Company and the same officers, directors and underwriters named in the Cervantes complaint, and also asserts violations of Sections 11 and 15 of the Securities Act of 1933 based on allegedly false or misleading statements or omissions with respect to, among other things, merchandise for sale on the Company's website that may be counterfeit or constitute trademark or copyright infringement. On December 24, 2015, the court consolidated the Cervantes and Weiss actions. The Company and the named officers and directors intend to defend themselves vigorously against these consolidated actions. In light of, among other things, the early stage of the litigation, the Company is unable to predict the outcome of this matter and is unable to make a meaningful estimate of the amount or range of loss, if any, that could result from an unfavorable outcome. On February 3, 2016, the court granted the Company’s motion to stay the consolidated actions.
In addition, from time to time in the normal course of business, various other claims and litigation have been asserted or commenced against the Company. Due to uncertainties inherent in litigation and other claims, the Company can give no assurance that it will prevail in any such matters, which could subject the Company to significant liability for damages. Any claims or litigation, regardless of their success, could have an adverse effect on the Company’s consolidated results of operations or cash flows in the period the claims or litigation are resolved. As of December 31, 2015, the Company does not believe that there are any material litigation exposures relating to these other claims.
100
Item 9. Changes in and Disagreements With Accountants on Accounting and Financial Disclosure.
None.
Item 9A. Controls and Procedures.
Evaluation of Disclosure Controls and Procedures
Our management, with the participation of our Chief Executive Officer and our Chief Financial Officer, evaluated the effectiveness of our disclosure controls and procedures as of December 31, 2015. “Disclosure controls and procedures,” as defined in Rules 13a-15(e) and 15d-15(e) under the Exchange Act, are designed to ensure that information required to be disclosed by a company in the reports that it files or submits under the Exchange Act is (i) recorded, processed, summarized and reported within the time periods specified in the Securities and Exchange Commission’s rules and forms and (ii) accumulated and communicated to the company's management, including its principal executive officer and principal financial officer, as appropriate to allow timely decisions regarding required disclosure. Based on the evaluation of our disclosure controls and procedures, our Chief Executive Officer and Chief Financial Officer concluded that our disclosure controls and procedures were effective as of December 31, 2015 at the reasonable assurance level.
Management’s Report on Internal Controls Over Financial Reporting
This Annual Report on Form 10-K does not include a report of management’s assessment regarding internal control over financial reporting or an attestation report of our registered public accounting firm due to a transition period established by rules of the SEC for newly public companies.
Previously Identified Material Weaknesses in Internal Control Over Financial Reporting
We previously identified and disclosed in our Registration Statement on Form S-1 for the period ended December 31, 2014, as well as in our Quarterly Reports on Form 10-Q for each interim period in fiscal year 2015, material weaknesses in our internal control over financial reporting relating to the following:
• | We did not have adequate procedures and controls to appropriately account for certain non-income tax-related expenses and comply with the related filing requirements. |
• | We determined that we did not have adequate cut-off procedures to ensure the timely recording of certain period-end accruals. |
The impact of these material weaknesses resulted in the revision of our consolidated financial statements for the years ended December 31, 2012 and 2013, for the three months ended March 31, 2013, the three and six months ended June 30, 2013, the three and nine months ended September 30, 2013, the three months ended December 31, 2013 and the three months ended September 30, 2014. The impacts of these material weaknesses also resulted in the restatement of our consolidated financial statements for the three months ended March 31, 2014, the three and six months ended June 30, 2014 and the nine months ended September 30, 2014.
Remediation Efforts to Address the Previously Disclosed Material Weaknesses
Our management, with oversight from our Audit Committee, has implemented the following remediation steps to address the previously disclosed material weaknesses and to improve our internal control over financial reporting:
• | Enhanced and supplemented the tax and accounts payable functions by increasing the number of roles and hiring additional individuals with an appropriate level of knowledge and experience commensurate with the financial reporting complexities of the organization; |
• | Updated our systems so that we collect the necessary information to enable us to more effectively monitor and comply with applicable non-income tax accounting and filing requirements on a timely basis; |
• | Implemented additional internal reporting procedures, including enhancing the analytical procedures used to assess period-end accruals, to add depth to our review process and improve our segregation of duties; and |
• | Enhanced the communication and coordination among our finance departments and expanded cross-functional involvement and input into period-end accruals. |
101
During the quarter ended September 30, 2015, we substantially completed the assessment of the design of existing controls and implemented new controls as needed to remediate the previously identified material weaknesses. However, as we had yet to complete the testing and evaluation of the operating effectiveness of controls, the previously disclosed material weaknesses remained unremediated as of the end of the third quarter.
For the quarter ended December 31, 2015 we completed the testing and evaluation of the operating effectiveness of the controls, and based on the results of our testing, the controls were determined to be designed and operating effectively as of December 31, 2015. Accordingly, we concluded the previously reported material weaknesses have been remediated as of December 31, 2015.
Changes in Internal Control over Financial Reporting
There were no changes in our internal control over financial reporting identified during the fourth quarter of 2015 that materially affected, or are reasonably likely to materially affect, our internal control over financial reporting.
Limitations on Controls
Our disclosure controls and procedures and internal control over financial reporting are designed to provide reasonable assurance of achieving the desired control objectives. Our management recognizes that any control system, no matter how well designed and operated, is based upon certain judgments and assumptions and cannot provide absolute assurance that its objectives will be met. Similarly, an evaluation of controls cannot provide absolute assurance that misstatements due to error or fraud will not occur or that all control issues and instances of fraud, if any, have been detected.
Item 9B. Other Information.
None.
102
PART III.
Item 10. Directors, Executive Officers and Corporate Governance.
The information required by this item is incorporated by reference to our Proxy Statement for the 2016 Annual Meeting of Stockholders ("Proxy Statement") to be filed with the SEC within 120 days of the fiscal year ended December 31, 2015.
Our board of directors has adopted a Code of Conduct applicable to all officers, directors and employees, which is available on
our website (investors.etsy.com) under "Leadership & Governance—Governance Documents." We intend to satisfy the disclosure requirement under Item 5.05 of Form 8-K regarding amendments and waivers of our Code of Conduct by posting information on the website address specified above.
Item 11. Executive Compensation.
The information required by this item is incorporated by reference to our Proxy Statement.
Item 12. Security Ownership of Certain Beneficial Owners and Management and Related Stockholder Matters.
The information required by this item is incorporated by reference to our Proxy Statement.
Item 13. Certain Relationships and Related Transactions, and Director Independence.
The information required by this item is incorporated by reference to our Proxy Statement.
Item 14. Principal Accounting Fees and Services.
The information required by this item is incorporated by reference to our Proxy Statement.
103
PART IV.
Item 15. Exhibits, Financial Statement Schedules.
(a) The following documents are filed as part of this report:
(1) Financial Statements.
Our Consolidated Financial Statements are listed in the “Index to Consolidated Financial Statements” under Part II, Item 8
of this Annual Report on Form 10-K.
(2) Financial Statement Schedules.
All schedules are omitted because they are not applicable or because the required information is shown in the consolidated financial statements and notes.
(3) Exhibits.
See the Exhibit Index immediately following the signature page of this Annual Report on Form 10-K.
104
Signatures
Pursuant to the requirements of Section 13 or 15(d) of the Securities Exchange Act of 1934, the registrant has duly caused this report to be signed on its behalf by the undersigned, thereunto duly authorized.
ETSY, INC. | |
Date: March 1, 2016 | /s/ Kristina Salen |
Kristina Salen Chief Financial Officer | |
(Principal Financial and Accounting Officer) | |
Power of Attorney
KNOW ALL PERSONS BY THESE PRESENTS, that each person whose signature appears below hereby constitutes and appoints Chad Dickerson and Kristina Salen, and each of them, as his or her true and lawful attorney-in-fact and agent with full power of substitution, for him or her in any and all capacities, to sign any and all amendments to this Annual Report on Form 10-K and to file the same, with all exhibits thereto and other documents in connection therewith, with the Securities and Exchange Commission, granting unto said attorney-in-fact and agent full power and authority to do and perform each and every act and thing requisite and necessary to be done in connection therewith, as fully for all intents and purposes as he or she might or could do in person, hereby ratifying and confirming all that said attorney-in-fact and agent, or his or her substitute, may lawfully do or cause to be done by virtue hereof.
Pursuant to the requirements of the Securities Exchange Act of 1934, this report has been signed below by the following persons on behalf of the registrant and in the capacities and on the dates indicated.
Signature | Title | Date |
/s/ Chad Dickerson Chad Dickerson | President, Chief Executive Officer, Chair (Principal Executive Officer) | March 1, 2016 |
/s/ Kristina Salen Kristina Salen | Chief Financial Officer (Principal Financial and Accounting Officer) | March 1, 2016 |
/s/ James W. Breyer James W. Breyer | Director | March 1, 2016 |
/s/ M. Michele Burns M. Michele Burns | Director | March 1, 2016 |
/s/ Jonathan D. Klein Jonathan D. Klein | Director | March 1, 2016 |
/s/ Melissa Reiff Melissa Reiff | Director | March 1, 2016 |
/s/ Fred Wilson Fred Wilson | Director | March 1, 2016 |
105
Exhibit Index
Exhibit Number | Incorporated by Reference | Filed Herewith | ||||||||||||||||||||||
Exhibit Description | Form | File No. | Exhibit | Filing Date | ||||||||||||||||||||
3.1 | Amended and Restated Certificate of Incorporation of Etsy, Inc. | 8-K | 001-36911 | 3.1 | 4/21/2015 | |||||||||||||||||||
3.2 | Amended and Restated Bylaws of Etsy, Inc. | 8-K | 001-36911 | 3.2 | 4/21/2015 | |||||||||||||||||||
4.1 | Registration Rights Agreement by and among Etsy, Inc. and the other parties thereto | S-1/A | 333-202497 | 4.2 | 3/31/2015 | |||||||||||||||||||
4.2 | Warrant to Purchase Stock, dated November 15, 2007, by and among Etsy, Inc. and Silicon Valley Bank | S-1 | 333-202497 | 4.3 | 3/4/2015 | |||||||||||||||||||
4.3 | Plain English Warrant Agreement, dated May 15, 2008, by and among Etsy, Inc. and TriplePoint Capital LLC | S-1 | 333-202497 | 4.4 | 3/4/2015 | |||||||||||||||||||
4.4 | Plain English Warrant Agreement, dated August 9, 2010, by and among Etsy, Inc. and TriplePoint Capital LLC | S-1 | 333-202497 | 4.5 | 3/4/2015 | |||||||||||||||||||
10.1 | Form of Indemnification Agreement between Etsy, Inc. and each of its directors and executive officers | S-1/A | 333-202497 | 10.1 | 3/31/2015 | |||||||||||||||||||
10.2.1* | 2006 Stock Plan, as amended, and forms of agreements thereunder | S-1 | 333-202497 | 10.2.1 | 3/4/2015 | |||||||||||||||||||
10.2.2* | Form of Stock Option Agreement under 2006 Stock Plan with Chad Dickerson | S-1 | 333-202497 | 10.2.2 | 3/4/2015 | |||||||||||||||||||
10.3* | 2015 Equity Incentive Plan and form of agreement thereunder | S-1/A | 333-202497 | 10.3 | 4/14/2015 | |||||||||||||||||||
10.4* | 2015 Employee Stock Purchase Plan | S-1/A | 333-202497 | 10.4 | 3/31/2015 | |||||||||||||||||||
10.5 | Agreement of Lease, dated April 14, 2009, between Etsy, Inc. and 55 Washington Street LLC, as amended | S-1 | 333-202497 | 10.5 | 3/4/2015 | |||||||||||||||||||
10.6 | Agreement of Lease, dated May 12, 2014, among Etsy, Inc., 117 Adams Owner LLC and 55 Prospect Owner LLC | S-1 | 333-202497 | 10.6 | 3/4/2015 | |||||||||||||||||||
10.7.1 | Revolving Credit and Guaranty Agreement, dated May 16, 2014, between Etsy, Inc. and the other parties thereto, as amended as of April 15, 2015 (conformed copy) | S-1 | 333-202497 | 10.7 | 3/4/2015 | |||||||||||||||||||
10.7.2 | Amendment No. 2 to Revolving Credit and Guaranty Agreement, dated December 21, 2015, between Etsy, Inc. and the other parties thereto | X | ||||||||||||||||||||||
10.8* | Employment offer letter between Etsy, Inc. and Chad Dickerson, dated March 24, 2015 | S-1/A | 333-202497 | 10.8 | 3/31/2015 | |||||||||||||||||||
10.9.1* | Employment offer letter between Etsy, Inc. and Kristina Salen, dated January 12, 2013, as amended | S-1/A | 333-202497 | 10.9.1 | 3/31/2015 | |||||||||||||||||||
10.9.2* | Relocation letter agreement between Etsy, Inc. and Kristina Salen, dated June 18, 2013 | S-1/A | 333-202497 | 10.9.2 | 3/31/2015 | |||||||||||||||||||
106
10.10* | Employment offer letter between Etsy, Inc. and Jordan Breslow, dated October 20, 2013 | S-1/A | 333-202497 | 10.10 | 3/31/2015 | |||||||||||||||||||
10.11* | 2014 Executive Bonus Plan | S-1 | 333-202497 | 10.11 | 3/4/2015 | |||||||||||||||||||
10.12* | Severance Plan and form of Participation Notice thereunder. | S-1/A | 333-202497 | 10.12 | 4/14/2015 | |||||||||||||||||||
10.13* | Change in Control Severance Plan and form of Participation Notice thereunder | S-1 | 333-202497 | 10.13 | 3/4/2015 | |||||||||||||||||||
10.14* | Management Cash Incentive Plan | S-1 | 333-202497 | 10.14 | 3/4/2015 | |||||||||||||||||||
10.15* | Compensation Program for Non-Employee Directors | S-1 | 333-202497 | 10.15 | 3/4/2015 | |||||||||||||||||||
21.1 | List of Subsidiaries of Etsy, Inc. | X | ||||||||||||||||||||||
23.1 | Consent of PricewaterhouseCoopers LLP, Independent Registered Public Accounting Firm | X | ||||||||||||||||||||||
24.1 | Power of Attorney (contained in the signature page to this Annual Report on Form 10-K) | X | ||||||||||||||||||||||
31.1 | Certification of Principal Executive Officer Required Under Rule 13a-14(a) and 15d-14(a) of the Securities Exchange Act of 1934, as amended | X | ||||||||||||||||||||||
31.2 | Certification of Principal Financial Officer Required Under Rule 13a-14(a) and 15d-14(a) of the Securities Exchange Act of 1934, as amended | X | ||||||||||||||||||||||
32.1† | Certification of Chief Executive Officer Required Under Rule 13a-14(b) of the Securities Exchange Act of 1934, as amended, and 18 U.S.C. §1350 | X | ||||||||||||||||||||||
32.2† | Certification of Chief Financial Officer Required Under Rule 13a-14(b) of the Securities Exchange Act of 1934, as amended, and 18 U.S.C. §1350 | X | ||||||||||||||||||||||
101.INS | XBRL Instance Document | X | ||||||||||||||||||||||
101.SCH | XBRL Taxonomy Schema Linkbase Document | X | ||||||||||||||||||||||
101.CAL | XBRL Taxonomy Calculation Linkbase Document | X | ||||||||||||||||||||||
101.DEF | XBRL Taxonomy Definition Linkbase Document | X | ||||||||||||||||||||||
101.LAB | XBRL Taxonomy Labels Linkbase Document | X | ||||||||||||||||||||||
101.PRE | XBRL Taxonomy Presentation Linkbase Document | X | ||||||||||||||||||||||
* | Indicates a management contract or compensatory plan. |
† | These certifications are not deemed to be filed with the SEC and are not to be incorporated by reference into any filing of Etsy, Inc. under the Securities Act of 1933, as amended, or the Securities Exchange Act of 1934, as amended. |
107