Attached files
| file | filename |
|---|---|
| EX-32.1 - EX-32.1 - WebMD Health Corp. | d78402dex321.htm |
| EX-32.2 - EX-32.2 - WebMD Health Corp. | d78402dex322.htm |
| EX-23.1 - EX-23.1 - WebMD Health Corp. | d78402dex231.htm |
| EX-14.1 - EX-14.1 - WebMD Health Corp. | d78402dex141.htm |
| EX-99.2 - EX-99.2 - WebMD Health Corp. | d78402dex992.htm |
| EX-99.1 - EX-99.1 - WebMD Health Corp. | d78402dex991.htm |
| EX-21.1 - EX-21.1 - WebMD Health Corp. | d78402dex211.htm |
| EX-31.2 - EX-31.2 - WebMD Health Corp. | d78402dex312.htm |
| EX-31.1 - EX-31.1 - WebMD Health Corp. | d78402dex311.htm |
Table of Contents
Index to Financial Statements
UNITED STATES
SECURITIES AND EXCHANGE COMMISSION
Washington, D.C. 20549
Form 10-K
| þ | ANNUAL REPORT PURSUANT TO SECTION 13 OR 15(d) OF THE SECURITIES EXCHANGE ACT OF 1934 |
For the fiscal year ended December 31, 2015
or
| ¨ | TRANSITION REPORT PURSUANT TO SECTION 13 OR 15(d) OF THE SECURITIES EXCHANGE ACT OF 1934 |
For the transition period from to
Commission file number: 001-35337
WebMD Health Corp.
(Exact name of registrant as specified in its charter)
| Delaware | 20-2783228 | |
| (State of incorporation) | (I.R.S. Employer Identification No.) | |
| 395 Hudson Street | 10014 | |
| New York, New York (Address of principal executive office) |
(Zip code) | |
(212) 624-3700
(Registrant’s telephone number including area code)
Securities registered pursuant to Section 12(b) of the Act:
| Title of Each Class |
Name of Each Exchange on Which Registered | |
| Common Stock, par value $0.01 per share | The Nasdaq Stock Market LLC (Global Select Market) | |
Securities registered pursuant to Section 12(g) of the Act: Not Applicable
Indicate by check mark if the registrant is a well-known seasoned issuer, as defined in Rule 405 of the Securities Act. Yes þ No ¨
Indicate by check mark if the registrant is not required to file reports pursuant to Section 13 or Section 15(d) of the Exchange Act. Yes ¨ No þ
Indicate by check mark whether the registrant: (1) has filed all reports required to be filed by Section 13 or 15(d) of the Securities Exchange Act of 1934 during the preceding 12 months (or for such shorter period that the registrant was required to file such reports), and (2) has been subject to such filing requirements for the past 90 days. Yes þ No ¨
Indicate by check mark whether the registrant has submitted electronically and posted on its corporate Web site, if any, every Interactive Data File required to be submitted and posted pursuant to Rule 405 of Regulation S-T during the preceding 12 months (or for such shorter period that the registrant was required to submit and post such files). Yes þ No ¨
Indicate by check mark if disclosure of delinquent filers pursuant to Item 405 of Regulation S-K is not contained herein, and will not be contained, to the best of registrant’s knowledge, in definitive proxy or information statements incorporated by reference into Part III of this Form 10-K or any amendment to this Form 10-K. ¨
Indicate by check mark whether the registrant is a large accelerated filer, an accelerated filer, a non-accelerated filer, or a smaller reporting company. See the definitions of “large accelerated filer,” “accelerated filer” and “smaller reporting company” in Rule 12b-2 of the Exchange Act. (Check one):
| Large accelerated filer þ | Accelerated filer ¨ | Non-accelerated filer ¨ | Smaller reporting company ¨ | |||
| (Do not check if a smaller reporting company) | ||||||
Indicate by check mark whether the registrant is a shell company (as defined in Rule 12b-2 of the Exchange Act.) Yes ¨ No þ
As of June 30, 2015, the aggregate market value of the registrant’s Common Stock held by non-affiliates of the registrant was approximately $1,572,977,000 (based on the closing price of the Common Stock of $44.28 per share on that date, as reported on the Nasdaq Global Select Market).
As of February 19, 2016, there were 38,015,720 shares of Common Stock outstanding (including unvested shares of restricted Common Stock).
DOCUMENTS INCORPORATED BY REFERENCE
Certain information in the registrant’s definitive proxy statement to be filed with the Commission relating to the registrant’s 2016 Annual Meeting of Stockholders is incorporated by reference into Part III.
Table of Contents
Index to Financial Statements
| Page | ||||||
| Forward-Looking Statements | ii | |||||
| Definitions of Certain Measures | iii | |||||
| References to Our Websites | iii | |||||
| PART I | ||||||
| Item 1. | 1 | |||||
| Item 1A. | 34 | |||||
| Item 1B. | 54 | |||||
| Item 2. | 54 | |||||
| Item 3. | 54 | |||||
| Item 4. | 54 | |||||
| PART II | ||||||
| Item 5. | Market for Registrant’s Common Equity, Related Stockholder Matters and Issuer Purchases of Equity Securities | 55 | ||||
| Item 6. | 58 | |||||
| Item 7. | Management’s Discussion and Analysis of Financial Condition and Results of Operations |
59 | ||||
| Item 7A. | 78 | |||||
| Item 8. | 79 | |||||
| Item 9. | Changes in and Disagreements with Accountants on Accounting and Financial Disclosure |
79 | ||||
| Item 9A. | 79 | |||||
| Item 9B. | 79 | |||||
| PART III | ||||||
| Item 10. | 80 | |||||
| Item 11. | 80 | |||||
| Item 12. | Security Ownership of Certain Beneficial Owners and Management and Related Stockholder Matters | 80 | ||||
| Item 13. | Certain Relationships and Related Transactions, and Director Independence |
80 | ||||
| Item 14. | 80 | |||||
| PART IV | ||||||
| Item 15. | 81 | |||||
| Signatures | 82 | |||||
| Financial Statements | F-1 | |||||
| Index to Exhibits | E-1 | |||||
WebMD®, Medscape®, CME Circle®, Medpulse®, eMedicine®, MedicineNet®, theheart.org® and RxList® are among the trademarks of WebMD Health Corp. or its subsidiaries.
i
Table of Contents
Index to Financial Statements
This Annual Report on Form 10-K contains both historical and forward-looking statements. All statements other than statements of historical fact are, or may be, forward-looking statements. For example, statements concerning projections, predictions, expectations, estimates or forecasts and statements that describe our objectives, future performance, plans or goals are, or may be, forward-looking statements. These forward-looking statements reflect management’s current expectations concerning future results and events and can generally be identified by the use of expressions such as “may,” “will,” “should,” “could,” “would,” “likely,” “predict,” “potential,” “continue,” “future,” “estimate,” “believe,” “expect,” “anticipate,” “intend,” “plan,” “foresee,” and other similar words or phrases, as well as statements in the future tense.
Forward-looking statements involve known and unknown risks, uncertainties and other factors that may cause our actual results, performance or achievements to be different from any future results, performance and achievements expressed or implied by these statements. The following important risks and uncertainties could affect our future results, causing those results to differ materially from those expressed in our forward-looking statements:
| • | failure to achieve sufficient levels of usage of our public and private portals and mobile applications; |
| • | failure to attract sufficient consumers and healthcare professionals to our public portals and mobile applications, including as a result of existing and new competitors for those audiences; |
| • | competition for advertisers and sponsors for our public portals and mobile applications; |
| • | reductions in promotional and educational spending by pharmaceutical and biotechnology companies, whether resulting from the number and timing of regulatory approvals of new products or indications, from the number and timing of regulatory approvals of generic products that compete with existing brand name products or from other factors affecting the relevant markets; |
| • | the inability to successfully deploy new or updated applications or services for our public portals, mobile platforms and private portals or, if deployed, the failure to create new or enhanced revenue streams from those applications or services; |
| • | failure to preserve and enhance the “WebMD” and “Medscape” brands and our other brands; |
| • | the inability to provide health coaching and condition management services that meet the needs of clients and potential clients of our private portals or the failure to do so with sufficient efficiency to make those services profitable for us; |
| • | the inability to attract and retain qualified personnel; |
| • | adverse economic conditions and disruptions in the capital markets; |
| • | adverse changes in general business or regulatory conditions affecting the healthcare, information technology and Internet industries; and |
| • | the Risk Factors described in Item 1A of this Annual Report. |
These factors are not necessarily all of the important factors that could cause actual results to differ materially from those expressed in any of our forward-looking statements. Other factors, including unknown or unpredictable ones, also could have material adverse effects on our future results.
The forward-looking statements included in this Annual Report on Form 10-K are made only as of the date of this Annual Report. Except as required by law or regulation, we do not undertake any obligation to update any forward-looking statements to reflect subsequent events or circumstances.
ii
Table of Contents
Index to Financial Statements
DEFINITIONS OF CERTAIN MEASURES
In this Annual Report, we provide information regarding usage of The WebMD Health Network that we have determined using internal technology that identifies and monitors usage by individual computers, smartphones, tablets and other electronic devices used to access the Internet (which we refer to, collectively, as electronic devices). As used in this Annual Report:
| • | A “unique user” or “unique visitor” during any calendar month is an individual electronic device, using a specific Web browser, that accesses a page in The WebMD Health Network during the course of such calendar month, as determined by our tracking technology. Accordingly, with respect to such calendar month, once an individual electronic device, using a specific Web browser, accesses a page in The WebMD Health Network, that electronic device will generally be included in the total number of unique users or visitors for that month. Similarly, with respect to any calendar month, an individual electronic device using a specific Web browser accessing a specific public portal, Website or mobile property in The WebMD Health Network (which we refer to as a “WebMD Destination”) may be counted only once as a single unique user or visitor regardless of the number of times it accesses that WebMD Destination or the number of individuals who may use it. However, if an electronic device using a specific Web browser accesses more than one WebMD Destination within The WebMD Health Network during a calendar month, it will be counted once for each such WebMD Destination. An electronic device that accesses a WebMD Destination using more than one Web browser will be counted as if it were a separate device for each browser used. In addition, if an electronic device blocks our tracking technology, it will be counted as a unique user or visitor in a particular month each time it visits a WebMD Destination. An electronic device that does not access any WebMD Destination during a particular calendar month is not included in the total number of unique users or visitors for that calendar month, even if such electronic device has, in the past, accessed one or more WebMD Destinations. |
| • | A “page view” is a page that is viewed on an electronic device, as determined by our tracking technology. The number of “page views” in The WebMD Health Network is not limited by its number of unique users or visitors. Accordingly, each unique user or visitor may generate multiple page views. |
| • | With respect to any given time period, “aggregate page views” are the total number of “page views” during such time period on The WebMD Health Network as a whole. |
Third-party services that measure Internet usage apply their own methodologies to do so and, accordingly, may provide different usage statistics than those reported by our internal tracking technology.
Our WebMD Health Services private portals are provided to employers and health plans for use by their employees and members. These private portals are not part of The WebMD Health Network, do not involve advertising or sponsorship by third parties, and their users and page views are not included in measurements of The WebMD Health Network’s traffic volume.
The contents of the Websites in The WebMD Health Network and our other Websites referred to in this Annual Report are not incorporated into this filing. In addition, references to URLs for our Websites are intended to be inactive textual references only.
iii
Table of Contents
Index to Financial Statements
| Item 1. | Business |
INTRODUCTION
Overview of Our Services
We are a leading provider of health information services to consumers, physicians and other healthcare professionals, employers and health plans through our public and private online portals, mobile platforms and health-focused publications. We engage consumers, physicians and other healthcare professionals across a multi-screen experience, allowing us to empower and enable health decisions anytime and anywhere.
The WebMD Health Network – Our Public Portals. Our network of public portals for consumers and healthcare professionals includes: www.WebMD.com (which we sometimes refer to as WebMD Health), our primary public portal for consumers and related mobile-optimized sites and mobile apps; www.Medscape.com, our primary public portal for physicians and other healthcare professionals and related mobile-optimized sites and mobile apps; and other sites through which we provide our branded health and wellness content, tools and services.
| • | Our Websites and mobile applications for consumers help them take an active role in managing their health by providing objective health and wellness information and access to decision-support tools and other services. We also provide content relating to lifestyle and healthy living, including healthy beauty, diet and food, exercise and fitness, and family and pregnancy. Our content offerings for consumers include news articles and features, special reports, interactive guides, originally produced videos, self-assessment questionnaires, expert led Q&As, community discussions, and reference resources. Our mobile applications for consumers include the WebMD App, the WebMD Pregnancy App, the WebMD Baby App, the WebMD Pain Coach App, the WebMD Allergy App and the WebMD Magazine App. |
| • | Our Websites and mobile applications for healthcare professionals help them improve their clinical knowledge and practice of medicine. We make it easier for physicians and other healthcare professionals to access clinical reference sources, to stay abreast of the latest clinical information, to learn about new treatment options, to earn continuing medical education (or CME) and continuing education (or CE) credit, and to communicate with peers. Medscape’s original content includes daily medical news, conference coverage and expert commentary and columns by authors from widely respected clinical and academic institutions. Medscape also provides access to full-text journal articles, reference materials and other medical content. Through Medscape Education (www.medscape.org), we offer a wide selection of free online CME and CE activities designed to educate healthcare professionals about important diagnostic and therapeutic issues. Our Medscape App for physicians and other healthcare professionals provides formulary information, medical calculators, drug, disease and condition references, and a drug interaction checker. In addition, our Medscape App provides physicians access to Medscape Consult™, an online community where physicians can share and discuss clinical cases in real time in a moderated environment. Our Medscape CME & Education App enables healthcare professionals to access Medscape Education CME and CE activities on iPhone® and iPad® and to earn and track CME and CE credits for completed Medscape Education activities. Our Medscape MedPulse App enables healthcare professionals to stay up-to-date on the latest medical news and expert perspectives. |
In 2015, The WebMD Health Network reached an average of approximately 207 million monthly unique visitors and delivered approximately 16.34 billion page views during the year, increases of 13% and 15% over the prior year, respectively. Traffic to Medscape properties from physicians and other healthcare professionals averaged approximately 7.1 million physician sessions per month during 2015, an increase of approximately 14% over the prior year. For additional information regarding traffic to The WebMD Health Network, see “Management’s Discussion and Analysis of Financial Condition and Results of Operations – Introduction –Background Information on Certain Trends and Developments Affecting Our Business – Traffic Trends” in Item 7 below. We do not charge any usage, membership or download fees for access to our public portals or
1
Table of Contents
Index to Financial Statements
mobile applications. Our public portals generate revenue primarily through the sale of various types of advertising and sponsorship products to our clients, which include: pharmaceutical, biotechnology and medical device companies; hospitals, clinics and other healthcare services companies; health insurance providers; consumer products companies whose products or services relate to health, wellness, diet, fitness, lifestyle, safety and illness prevention; and various other businesses, organizations and governmental entities. Advertisers and sponsors use our services to reach, educate and inform target audiences of consumers, physicians and other healthcare professionals. We also generate revenue through the sale of advertising in WebMD Magazine, a consumer publication that we distribute free of charge to physician office waiting rooms and make available online and through an iPad app. Advertising and sponsorship revenue was approximately 78% of our total revenue for each of the fiscal years ended December 31, 2014 and 2015. Approximately 60% of our advertising and sponsorship revenue in 2015 was from our Medscape Websites and mobile apps for physicians and other healthcare professionals.
WebMD Health Services – Our Private Portals. Our private portals platform and related services help employers and health plans improve the health of their employee and plan participant populations and, as a result, manage their healthcare costs. We market these private portals and related services under the WebMD Health Services brand. We host our WebMD Health Services platform for private and public sector employers and health plans, and our cloud-based online services can be accessed by their employees and plan participants using a computer, a tablet or a smartphone. The WebMD Health Services platform provides an online personal health record application and personalized content, tools and other resources relevant to the specific individual’s eligibility, coverage and wellness profile, including decision-support applications that help users make informed decisions about health risks, lifestyle choices, healthcare providers, treatment options, and healthcare benefits options. Our flexible architecture allows us to integrate with the client’s existing programs, Websites and intranets for their employees and plan participants. We also offer clients the ability to design team-based and individual wellness challenges that help foster a culture of wellness in the workplace. In addition, we offer telephonic, online and onsite health coaching and targeted condition management programs that help employees and plan participants make healthier lifestyle choices to achieve their health and wellness goals.
We generate revenue from subscriptions to our WebMD Health Services platform by employers and health plans, either directly or through distribution relationships, including relationships with employee benefits outsourcing companies, employee benefits consultants and other companies that assist employers in purchasing or managing employee benefits. In addition, we offer our health coaching and condition management services on a per participant basis. Private portal services revenue was approximately 18% and 17% of our total revenue for the fiscal years ended December 31, 2014 and 2015, respectively. Our WebMD Health Services private portals do not display advertisements or generate revenue from advertising or sponsorship.
Information Services. We sell certain information products and services on a stand-alone basis using de-identified data that we license from a small number of third party data sources, of which the principal source is a license retained by HLTH Corporation, our former parent company, in connection with the sale of its Emdeon Business Services (EBS) business. As the successor to HLTH, we received this license, which provides us the rights to certain de-identified data from the operation of the EBS business (which is now known as Change Healthcare) through early February 2018 for use in the development and commercialization of various information products and services. To date, these stand-alone information products and services do not include any data derived from the operation of our Websites. Customers for these products and services include data services, informatics and consulting companies. Revenue from the sale of stand-alone information products and services was approximately 4% of our total revenue for each of the fiscal years ended December 31, 2014 and 2015. For additional information, see “Regulatory Matters – HIPAA Privacy Standards and Security Standards” below.
Corporate Information
WebMD Health Corp. is a Delaware corporation that was incorporated on May 3, 2005 under the name WebMD Health Holdings, Inc. Our principal executive offices are located at 395 Hudson Street, New York, New York 10014 and our telephone number is (212) 624-3700. We completed the initial public offering of our Class A Common Stock on September 28, 2005. Prior to that time, WebMD was a wholly-owned subsidiary of
2
Table of Contents
Index to Financial Statements
HLTH Corporation (which we refer to as HLTH). Upon completion of our merger with HLTH in October 2009 and the resulting cancellation of our Class B Common Stock (all of which had been owned by HLTH), our Class A Common Stock began being referred to simply as Common Stock. Our Common Stock trades on the NASDAQ Global Select Market under the symbol “WBMD.”
Available Information
We make available free of charge at www.wbmd.com (in the “Investor Relations” section) copies of materials we file with, or furnish to, the Securities and Exchange Commission, or SEC, including our Annual Reports on Form 10-K, Quarterly Reports on Form 10-Q, Current Reports on Form 8-K, and amendments to those reports, as soon as reasonably practicable after we electronically file such materials with, or furnish them to, the SEC.
3
Table of Contents
Index to Financial Statements
THE WEBMD HEALTH NETWORK – OUR PUBLIC PORTALS
Overview
Our Multi-Screen Platform. The WebMD Health Network delivers content through a multi-screen platform that engages users regardless of whether they are on a personal computer, a smartphone or a tablet. Our consumer portals and mobile applications help consumers take an active role in managing their health by providing objective health and wellness information. Our content offerings for consumers include access to news articles and features and decision-support tools that help them make better informed decisions about treatment options, health risks and healthcare providers. Our Websites and mobile applications for physicians and other healthcare professionals help them improve their clinical knowledge and practice of medicine. Our content offerings for these professionals, which include daily medical news, conference coverage, expert commentary and columns and CME activities, are written by authors from widely respected clinical and academic institutions and edited and managed by our in-house editorial staff.
The following provides a summary of the Websites included in The WebMD Health Network:
| Consumer Sites |
Description | |
| www.webmd.com
|
WebMD Health, our flagship consumer portal.
| |
| www.medicinenet.com |
A health information site for consumers offering content that is written and edited by practicing physicians, including an online medical dictionary with thousands of medical terms.
| |
| www.rxlist.com |
An online drug directory, which provides comprehensive descriptions of pharmaceutical products (including chemical names, brand names, molecular structure, clinical pharmacology, directions and dosage, side effects, drug interactions and precautions).
| |
| www.emedicinehealth.com |
A health information site for consumers offering articles written and edited by physicians for consumers, including first aid and emergency information that is also accessible at firstaid.webmd.com.
| |
| Professional Sites
|
||
| www.medscape.com |
Medscape, our flagship portal for physicians and other healthcare professionals, is organized by medical specialty, with each supported specialty having its own customized home page. Medscape content includes:
• News Content – including coverage of breaking medical news, expert perspectives and columns, medical conference coverage, business of medicine content, slideshows, special reports and access to full-text journal articles.
• Reference Content – including comprehensive clinical overviews of diseases and conditions, procedures and drugs.
| |
| www.medscape.org |
Medscape Education, the Website through which Medscape, LLC and WebMD Global LLC distribute online CME and CE to physicians and other healthcare professionals. | |
The WebMD Health Network also includes the co-branded Boots/WebMD health information site for United Kingdom consumers at www.WebMD.boots.com.
4
Table of Contents
Index to Financial Statements
We also provide related mobile applications, which are included in The WebMD Health Network. Our mobile applications for consumers include the WebMD App, the WebMD Pregnancy App, the WebMD Baby App, the WebMD Pain Coach App, the WebMD Allergy App and the WebMD Magazine App. Our Medscape App for physicians and other healthcare professionals provides formulary information, medical calculators, drug, disease and condition references, and a drug interaction checker. In addition, our Medscape App provides physicians access to Medscape Consult™, an online community where physicians can share and discuss clinical cases in real time in a moderated environment. Our Medscape CME & Education App enables healthcare professionals to access Medscape Education CME and CE activities on iPhone® and iPad® and to earn and track CME and CE credits for completed Medscape Education activities. Our Medscape MedPulse App enables healthcare professionals to stay up-to-date on the latest medical news and expert perspectives. We also provide access to our content through versions of our Websites tailored for viewing through mobile browsers.
Traffic to The WebMD Health Network. In 2015, The WebMD Health Network reached an average of approximately 207 million monthly unique visitors and delivered approximately 16.34 billion page views during the year, increases of 13% and 15% over the prior year, respectively. Traffic to The WebMD Health Network was an average of approximately 201 million unique users per month and total traffic of 3.97 billion page views during the fourth quarter of 2015, increases of 6% and 7%, respectively, over the prior year period. Traffic to Medscape properties from physicians and other healthcare professionals averaged approximately 7.1 million physician sessions per month in 2015, an increase of approximately 14% over the prior year, and averaged approximately 7.3 million physician sessions per month during the fourth quarter of 2015, an increase of approximately 9% over the prior year period.
Consumers and healthcare professionals are increasingly using smartphones, tablets and other mobile devices to access the Internet, with physicians increasingly using mobile devices during treatment at the point of care. Accordingly, the portion of our page views from mobile devices has increased rapidly in the past several years as usage has increased on mobile devices, and increased utilization of our mobile offerings was the primary driver of our traffic growth in the fourth quarter of 2015, as well as for full year 2015. During the fourth quarter of 2015, approximately 23% of our page views came from a U.S. personal computer (or PC); approximately 39% came from a U.S. smartphone; approximately 7% came from a U.S. tablet device; and approximately 31% came from non-U.S. sources. For additional information regarding traffic to The WebMD Health Network and our efforts to monetize mobile traffic, see “Management’s Discussion and Analysis of Financial Condition and Results of Operations – Introduction – Background Information on Certain Trends and Developments Affecting Our Business – Traffic Trends” and “– Efforts to Increase Advertising and Sponsorship Revenue from Mobile” in Item 7 below.
Our Editorial Policies. We are dedicated to providing quality health and wellness information and to upholding the integrity of our editorial process. The goal of our Editorial Policies is to maintain WebMD as an objective, practical and relevant content source for health and medical information. Our original content is reviewed by physician reviewers and by our editors for accuracy, objectivity, appropriateness of medical language, and proper characterization of findings. We uphold traditional journalistic principles in reviewing and corroborating information from other sources. When WebMD licenses health and wellness content from third parties for publication on our site, our editors review the third party’s editorial policies and procedures for consistency with the WebMD Editorial Policies. In addition, our physician reviewers and other editorial staff review a representative sample of the third party’s content to ensure that such third party follows the editorial policies and procedures reviewed by WebMD.
Our Policies Regarding Advertisements, Sponsorships and Promotions. All advertisements, sponsorships and promotions that appear on our Websites are subject to our Advertising Policy and/or our Sponsor Policy. We do not accept advertising that, in our opinion, is not factually accurate or is not in good taste. WebMD makes a clear distinction between the news stories, articles and other content that we create or license and the promotional information that comes from our sponsors. While content from a sponsor is subject to our Advertising Policy, it is not subject to our Editorial Policy. The sponsor is responsible for the accuracy and objectivity of its content and it is not reviewed by our Editorial Department for accuracy, objectivity or balance. Sponsors may also provide funding directly to WebMD without the sponsor having any control over the content.
5
Table of Contents
Index to Financial Statements
Consumer Services
Introduction. The Internet has fundamentally changed the way consumers obtain information, enabling them to have immediate access to searchable information and dynamic interactive content. Healthcare consumers increasingly seek to educate themselves online about their health-related issues, motivated in part by the larger share of healthcare costs they are being asked to bear due to changes in the benefit designs being offered by health plans and employers. Our goal is to provide consumers with an objective and trusted source of information and online tools that help them play an active role in managing their health. We also provide content relating to lifestyle and healthy living, including healthy beauty, diet and food, exercise and fitness, and family and pregnancy.
In the past several years, video and multimedia applications have become an important part of what users expect from Internet sites. In addition, consumers are increasingly using the Internet to access social media as a means to communicate and exchange information, including information regarding health and wellness. Consumers are also increasingly using smartphones and tablets to access online content and tools. We have invested and intend to continue to invest in software and systems that allow us to meet the demands of our users and sponsors, including customized content management and publishing technology to deliver interactive content, multimedia programming and personalized health applications that engage our users. In addition, we continue to focus on delivering a multi-screen platform that extends the user experience onto mobile devices and tablets.
Overview of Content and Service Offerings. WebMD Health and the other consumer portals in The WebMD Health Network provide our users with information, tools and applications in a variety of content formats. These content offerings include access to news articles and features, special reports, interactive guides, originally produced videos, self-assessment questionnaires, expert led Q&As, community discussions, and reference resources. By becoming a registered WebMD member, consumers can participate in our online communities and can opt-in to receive e-newsletters from WebMD on a variety of health-related topics or on specific conditions. There are no membership fees, usage charges or download charges for our consumer portals or mobile applications.
Our in-house staff, which includes professional writers, editors, designers, board-certified physicians and other healthcare professionals, creates content for The WebMD Health Network. Our in-house staff is supplemented by medical advisors and authors from widely respected academic and clinical institutions. The news stories and other original content and reporting presented in The WebMD Health Network are based on our editors’ selections of the most important and relevant public health events occurring on any given day, obtained from an array of credible sources, including peer-reviewed medical journals, medical conferences, federal or state government actions and materials derived from interviews with medical experts. We offer searchable access to the full content of our Websites, including licensed content and reference-based content.
Key Features of WebMD Health. WebMD Health includes the following key features:
| Feature |
Description | |
| WebMD News Center |
Health news articles that are written by journalists and reviewed by our professional staff. Content focuses on “news you can use” and the article topics reflect national news stories of interest in the popular media that day with original perspective from health and medical experts.
| |
| WebMD Editorial Features |
Comprehensive content focusing on major health, wellness and lifestyle issues that are in the news or otherwise contemporary, with emphasis on health trends and national health issues.
|
6
Table of Contents
Index to Financial Statements
| Feature |
Description | |
| WebMD Health and Wellness Centers |
WebMD Health and Wellness Centers are centralized locations for content and services for both WebMD Health editorial offerings and sponsor offerings focusing on topics related to health, wellness and lifestyle. Each Center features expert and medically reviewed information enabling the user to easily locate the top articles, news, videos, community features and health or wellness assessments for each topic. We also provide users an alphabetical listing of all Health and Wellness Centers and other collections of articles, organized by specific health conditions and concerns, known as Health A-Z.
| |
| WebMD Health Guides and Wellness Guides |
Anchored within our Health and Wellness Centers, our Health Guides and Wellness Guides are designed to guide users through their individual health journeys. The most current symptom, diagnosis, treatment and care information related to a particular disease or condition topic can be found in our Health Guides. Our Wellness Guides cover a broad range of topics, including nutrition, fitness, pregnancy and parenting. These guides were created by our editorial staff of professional health writers in collaboration with our proprietary physician network.
| |
| WebMD Video |
Originally produced multi-media content served on our custom video player. Includes health-related video of real patient stories and expert interviews, among other things, and includes narration, graphics and links to additional content on a given health topic. Sponsors are able to stream promotional messages within the video feature itself and within the surrounding viewing area. Videos are also included in our Health and Wellness Centers.
| |
| Slideshows |
Our slideshows are designed to educate users on specific conditions and other health and healthy living topics in an engaging, visually rich format. Slideshows are also included in our Health and Wellness Centers.
| |
| General Medical Information |
Our medical library allows consumers to research information relating to diseases and common health conditions by providing searchable access and easy-to-read content, including:
| |
| — self-care articles
| ||
| — drug and supplement references from leading publications, including First Data Bank®
| ||
| — clinical trials and research study information
| ||
| — a patient’s guide to medical tests
| ||
| — interactive, illustrated presentations that visually explain common health conditions and diseases
| ||
| — a medical dictionary
| ||
| — doctors’ views on important health topics. |
Decision-Support Services and Other Online Tools. Our decision-support services and other online tools help consumers make better-informed decisions about treatment options, health risks and healthcare providers, and assist consumers in their management and monitoring, on an ongoing basis, of personal health goals, specific conditions and treatment regimens.
7
Table of Contents
Index to Financial Statements
| Feature |
Description | |
| WebMD Health Checks and Evaluators |
Clinical, algorithm-based self assessments for health conditions and wellness topics, including a personalized risk score based on the user’s individual self-reported characteristics (e.g., gender, age, behavioral risks, heredity), along with customized recommendations for further education, potential treatment options and a summary report to share with the user’s physician or healthcare professional.
| |
| WebMD Symptom Checker |
Our patented interactive graphic interface with advanced clinical decision-support rules that allows users to identify potential conditions associated with their physical symptoms, gender and age.
| |
| WebMD Food & Fitness Planner |
Our Food & Fitness Planner is an online journaling service focusing on diet, food and fitness, designed to help users attain their personal health, weight loss and weight management goals. Our Food & Fitness Planner helps users make more informed food, beverage and nutrition choices.
| |
| WebMD Recipe Finder |
Our Recipe Finder allows users to search our collection of recipes from WebMD, Eating Well and other sources to help make healthy meal choices. Recipes can be searched and filtered by nutritional criteria.
| |
| First Aid & Emergencies |
Directs users to educational and treatment information that may be useful in the event of certain medical emergencies. Also included in this resource is a First Aid A-Z glossary of terms.
| |
| Health and Wellness Tests & Tools |
Provides access to interactive calculators and quizzes to assess or demonstrate health topics, including a target heart rate calculator, body mass index calculator, pregnancy due date calculator and ovulation calendar.
| |
| Drugs & Treatments |
Users can search for information about prescription and over-the-counter medications by brand or generic name, or by condition.
| |
| WebMD Physician Directory |
Enables users to find a physician based on the physician or practice name, specialty, zip code and distance. The directory also includes patient ratings, as well as measures of a physician’s condition and disease experience. We continue to update the directory to provide consumers with information to assist them in finding physicians who meet their specific requirements. |
8
Table of Contents
Index to Financial Statements
Mobile. We provide access to our consumer content and tools through WebMD Mobile, a version of our WebMD.com site tailored for viewing through mobile browsers at www.m.webmd.com. In addition, we offer the following mobile applications for consumers, which had been downloaded over 29 million times in total through the end of 2015:
| • | Our WebMD App, which is available for Android™, iPhone®, iPad® and Kindle Fire®, provides mobile access to certain WebMD content and tools, including Symptom Checker, First Aid, and Pill Identifier applications, as well as other health information. The mobile-optimized content also covers health and beauty, diet, parenting and children’s health, and sex and relationships. WebMD App users can choose from and save information tailored to their specific interests and can select topics to populate tips, fun facts, articles, videos and quizzes relevant to their healthy-living goals. In April 2015, we launched an enhanced version of our WebMD App, with an experience built specifically for Apple Watch that includes a new medication reminder feature designed to encourage medication compliance and help improve patient outcomes. In 2014, we launched WebMD Healthy Target, an integrated health improvement program available within the WebMD App for iPhone®, and later that year released additional features and functionality, including integration with Apple’s HealthKit. WebMD Healthy Target provides valuable assistance to individuals looking to manage chronic conditions like Type 2 diabetes and obesity, as well as to a broader audience interested in achieving fitness goals or more generally living a healthier lifestyle. WebMD Healthy Target allows users to set their health goals and can receive data from a variety of biometric devices, including activity trackers, wireless scales, blood pressure monitors and glucose meters, to monitor progress against those health goals. Based on the user’s goals and the data, WebMD Healthy Target delivers contextually relevant content and personalized action plans and motivational tips. |
| • | Our WebMD Magazine App, which is available for iPad®, provides a tablet-optimized reading experience for WebMD Magazine, offering links to relevant articles, videos, blogs and slideshows on WebMD.com. |
| • | Our WebMD Baby App, which is available for Android™ and iPhone®, gives new parents access to content created exclusively for the app, personalized for a baby’s specific age. WebMD Baby helps keep parents informed with easily accessible baby health and wellness information that they can trust. A personal growth chart for baby/toddler is also integrated into the app, allowing information to be easily added right from the pediatrician’s office. WebMD Baby received the 2012 Medical Marketing & Media Gold Award for Best Mobile App for Consumers. |
| • | Our WebMD Pregnancy App, which is available for iPhone®, combines trusted medical information and fun, shareable content to help expecting mothers celebrate the milestones along their pregnancy journey and empower them to make healthy decisions. WebMD Pregnancy delivers timely physician-reviewed content based on the baby’s expected delivery date, including checklists, questions to ask the doctor, and multimedia information. |
| • | Our WebMD Pain Coach App, which is available for Android™ and iPhone®, is a mobile companion to coach people living with chronic pain through daily health and wellness choices so that they can better manage their pain while living a healthy life. It offers users a personalized experience by delivering daily physician-reviewed tips about managing their specific conditions to their mobile device, including those suffering from chronic back pain, neck pain, nerve pain, fibromyalgia, migraine, osteoarthritis, and rheumatoid arthritis. With the app, WebMD helps users take control of their lifestyle choices by enabling them to easily review their pain patterns so they can understand triggers, set goals and share progress with their physician. |
| • | Our WebMD Allergy App, which is available for Android™ and iPhone®, empowers users to take control of their allergies. The WebMD Allergy App provides allergy sufferers with personalized location-based allergy condition forecasts in combination with WebMD’s trusted information and insights. The WebMD Allergy App is further personalized with optional mobile push notifications that warn when allergen levels are high, enabling app users to proactively manage their allergy conditions. |
International. Since October 2009, we have operated a health information Website in the United Kingdom with Boots UK, the United Kingdom’s leading pharmacy-led health and beauty retailer. The
9
Table of Contents
Index to Financial Statements
co-branded Boots/WebMD site at www.WebMD.boots.com features daily health and wellness news, condition and healthy living centers, interactive health tools, WebMD’s symptom checker, specialized health search, health videos and interactive slide shows.
We may pursue additional opportunities to expand the reach of the WebMD brand outside the United States. However, because of restrictions on consumer advertising by pharmaceutical and medical device companies that apply in many countries, we expect to focus our efforts outside the United States primarily on expanding our Medscape offerings for physicians and other healthcare professionals, rather than consumer offerings. For additional information, see “– Professional Services – International” below.
Social Media and Video Initiatives. Until 2015, most of our efforts to grow our consumer audience and to monetize traffic were focused on content delivered on our own consumer Websites and apps. However, people are increasingly using social media platforms not only to connect with their friends and family but also to find and consume information. Accordingly, in 2015, we began actively pursuing a strategy to take our content and the WebMD brand off-network into new environments. To implement that strategy, we are building the infrastructure to develop content offerings that are tailored for specific social networks and platforms and to allow consumers to more easily discover, share and interact with content from WebMD in other online locations.
Another key aspect of these initiatives is to create new video content that is both highly engaging and easily sharable across social networks. We launched approximately 165 such videos during the fourth quarter of 2015, some on topics relating to specific health conditions and some on healthy living and wellness topics. To continue to build our video content into a scalable library, we are growing our team of video producers and editors, as well as building additional in-house expertise to create video content. We are also continuing to develop longer-form video offerings.
We believe that, by taking WebMD into new online environments and onto new platforms, we will strengthen our connection to existing users, reach new audiences and diversify our traffic sources. Our strategy will, in some cases, allow us to drive people back to WebMD’s own sites and apps, where we can monetize that traffic as we do today; in other cases, we expect to use new monetization models as we engage with users outside of The WebMD Health Network.
WebMD Magazine
WebMD Magazine is a print magazine delivered free of charge to physicians in the United States for use in their office waiting rooms and reaches consumers right before they meet with their physicians. This allows sponsors to extend their advertising reach and to deliver their message when consumers are actively engaged in the healthcare process, and allows us to extend the WebMD brand into offline channels. We publish eight issues per year and had a rate base, in 2015, of over 1.4 million copies of each issue. We estimate that more than 10 million people are reading each issue of WebMD Magazine.
The editorial format of WebMD Magazine is specifically designed for the physician’s waiting room. Its editorial features and highly interactive format of assessments, quizzes and questions are designed to inform consumers about important health and wellness topics. We also publish a digital edition of WebMD Magazine online and, as described under “– Mobile” above, WebMD Magazine is available as a free interactive application for the iPad®. We also produce certain specialized editions of WebMD Magazine, including one for college campuses and one that focuses on diabetes.
Professional Services
Introduction. The Internet is a primary source of information for physicians and other healthcare professionals, and is growing relative to other sources, such as conferences, meetings and offline journals. Our Websites for healthcare professionals include Medscape and Medscape Education. We also provide related apps
10
Table of Contents
Index to Financial Statements
for healthcare professionals described below, as well as a version of each of our professional Websites that is tailored for viewing through mobile browsers. There are no membership fees and no usage charges for our professional sites and apps. However, users must register to access the full array of content and features. We generate revenue from our professional services by selling advertising and sponsorship programs primarily to companies that desire to reach physicians and other healthcare professionals. We also generate revenue through educational grants.
Medscape. Medscape (www.medscape.com), our flagship portal for physicians and other healthcare professionals, is organized by medical specialty, with each supported specialty having its own customized content. Medscape also includes areas for nurses, pharmacists, medical students, and members interested in medical policy and business of medicine topics. Registration by users enables us to deliver medical content targeted to their specialty and areas of interest, based on information they provide in their registration profiles. The registration process also enables professional members to choose a home page tailored to their medical specialty or interests. Medscape members receive e-mail newsletters, tailored to their specialty and other areas of interest, which highlight new information and resources on Medscape. Medscape content includes:
| • | News Content. Medscape provides timely coverage of medical news, including insightful perspectives from leading medical experts in both text and multimedia formats. Medscape news content is written by our in-house team of professional journalists and editors, faculty from widely respected academic and clinical institutions, and seasoned freelance professional writers. Medscape news content is edited and managed by our editorial staff. The content is produced in various formats, including: in-depth interviews with experts on topics related to the current and future practice of medicine; news alerts on critical clinical issues such as breaking drug information, including pharmaceutical recalls and product advisories; coverage of healthcare policy and politics; and coverage of key professional meetings and conferences from around the world. Medscape’s news content also includes widely read Business of Medicine coverage on complex practice management, compensation, legal, and ethical issues. The Medscape editorial team also creates recurring features and columns such as clinical cases, slideshows, and special reports. Medscape also provides access to wire service news stories and to licensed full-text journal articles. |
| • | Reference Content (Drugs and Diseases). Medscape provides original content spanning more than 30 medical specialties, authored and reviewed by physicians and pharmacists from leading medical centers, in the following categories: |
| — | Disease and Condition Articles. Evidence-based and physician-reviewed disease and condition articles are organized to answer clinical questions, as well as to provide in-depth information in support of diagnosis, treatment, and other clinical decision-making. Our over 6,000 comprehensive disease and condition monographs are illustrated with over 40,000 diagnostic images and clinical drawings. |
| — | Drug Reference. A proprietary drug reference database, with more than 7,000 monographs, for researching prescribing and safety information on brand-name, generic and over-the-counter (OTC) drugs, including herbals and supplements. |
| — | Drug Interaction Checker. A drug interaction checker that identifies interactions for drugs, herbals and/or supplements, with detailed information from minor to contraindicated interactions. |
| — | Clinical Procedure Articles. More than 1,000 clinical procedure articles provide detailed instructions, and include videos and images to help clinicians with new techniques or to improve their skills in procedures they have previously performed. |
| — | Image Collections. Image collections are visually engaging presentations of both common and uncommon diseases, case presentations, and current controversies in medicine. They are designed to challenge physicians while expanding their knowledge of clinically important topics. |
| — | Formulary Information. Drug formulary information for over 1,800 insurance plans that allows for comparison of tier status for drugs in the same class when considering alternatives for patients. |
11
Table of Contents
Index to Financial Statements
Our Medscape App is a free mobile application, available on Android™, Blackberry®, iPhone®, iPad®, and Kindle Fire®, for physicians and other healthcare professionals that provides registered users with access to Medscape news and reference content, including: articles and other resources; the drug reference database and drug interaction checker; clinical reference, treatment and procedure guides; and physician, pharmacy and hospital directories. Our Medscape App also provides access to CME programs from Medscape Education (described below). In addition, our Medscape App gives users offline access to reference content, treatment guides, a pill identification tool, and the drug interaction checker. In November 2015, we launched a new feature for our Medscape App called Medscape Consult™, an online community where physicians can ask and answer clinical questions and share and discuss clinical challenges in real time in a moderated environment supported by expert oversight and built on the foundation of Medscape’s Drugs and Diseases reference database. Medscape Consult™ provides a clinical knowledge platform that combines our authoritative Medscape content with the expertise of our physician community. Medscape Consult™ is now also available for desktop use.
Our Medscape MedPulse App is a medical news app for iPhone® and iPad® that enables healthcare professionals to stay up-to-date on the latest medical news and expert perspectives and that can be personalized to an individual’s areas of interest. Medscape MedPulse features the latest medical content from Medscape’s award-winning editorial team and includes a curated Twitter feed to help users stay informed of important medical trends being shared in real time by physicians and other leading medical commentators.
Continuing Medical Education (CME). Medscape Education (www.medscape.org) is the primary Website through which our ACCME-accredited CME provider, Medscape, LLC, distributes online CME and CE to physicians and other healthcare professionals. The ACCME (the Accreditation Council for Continuing Medical Education) accredits and oversees providers of CME credit, as described under “Regulatory Matters –Regulation and Accreditation of Continuing Medical Education” below. Medscape is also accredited as a provider of continuing nursing education by the American Nurses Credentialing Center’s Commission on Accreditation and as a provider of continuing pharmacy education by the Accreditation Council for Pharmacy Education.
Medscape Education offers a wide selection of free online CME and CE activities designed to educate healthcare professionals about important diagnostic and therapeutic issues, including both original CME and CE activities that Medscape, LLC develops as well as activities developed and accredited by third parties. Medscape Education also offers CME developed by our WebMD Global LLC subsidiary, which is intended for physicians and other healthcare professionals located outside of the United States. Medscape Education educational activities are supported by independent educational grants provided by pharmaceutical and medical device companies, as well as foundations and government agencies. In addition, in order to provide broad and timely coverage of areas of interest to healthcare professionals, Medscape Education offers numerous CME and CE activities for which it does not receive grants or other outside support.
In July 2015, we launched the Medscape CME & Education App, a mobile app that enables healthcare professionals to access Medscape Education CME and CE activities on iPhone® and iPad®. Healthcare professionals can use the Medscape CME and Education App to earn and track CME and CE credit and to obtain certificates for completed Medscape Education activities. Tracking of Medscape Education credits is synchronized between the desktop and mobile devices that a healthcare professional uses to access the activities.
Medscape Business of Medicine Magazine. Medscape’s Business of Medicine Magazine is a print magazine delivered free of charge to physicians in the United States, bundled with WebMD Magazine. The Business of Medicine Magazine provides physicians with practical articles to help them build and maintain a successful and profitable practice. We believe that the Business of Medicine Magazine will provide a new vehicle for sponsors to reach practicing physicians and for Medscape to build its brand. The first issue was published in January 2016 and we plan to publish four issues each year.
12
Table of Contents
Index to Financial Statements
International. We are pursuing opportunities to extend the reach of the Medscape brand outside the United States. Physicians and healthcare professionals from around the world access our content in English through Medscape. In addition, we publish Spanish, French and German language editions of Medscape through which healthcare professionals can access our content in those languages. We have also entered into collaborations with companies having expertise in a specific country or region to extend our reach, including:
| • | China. In May 2014, we began a collaboration with DXY, the largest online community for healthcare professionals in China, that enables the distribution of our Medscape educational programs to physicians and healthcare professionals in China through the DXY.cn site, bringing timely and valuable clinical information to physicians in China who are looking to improve their knowledge and skills in rapidly changing areas of medicine. |
| • | Japan. In May 2015, Medscape began a collaboration with CareNet, Inc. to provide Medscape’s independent educational programs and editorial content to physicians in Japan through CareNet.com, one of the leading websites for healthcare professionals in Japan. This collaboration extends our global reach in an important market and allows us to provide clinicians and other healthcare professionals in Japan with timely, comprehensive and relevant clinical information in local language. |
We expect to seek to enter these types of collaborations in certain additional markets outside of the United States, while in other such markets we may rely primarily on our own internal resources.
Advertising and Sponsorship
We believe that The WebMD Health Network offers an efficient means for advertisers and sponsors to reach a large audience of health-involved consumers, clinically active physicians and other healthcare professionals or to target specific groups of consumers, physicians and other healthcare professionals based on their interests or specialties with placements in relevant locations on The WebMD Health Network or in our e-newsletters. The following are some of the types of placements and programs we offer to advertisers and sponsors:
| • | Media Solutions. These are traditional online advertising solutions, such as banners, used to reach health-involved consumers and physicians and other healthcare professionals. In addition, customers can select targeted media packages, including condition-specific or specialty-specific e-newsletters, keyword searches and educational programs. |
| • | Sponsored Solutions. These are customized collections of articles, topics, and decision-support tools and applications, sponsored by clients and distributed within The WebMD Health Network. |
The pricing for our advertising and sponsorship services varies from contract to contract based on numerous factors, including the specific services to be provided, the content areas where advertisements or sponsored content are to be displayed, the nature of any exclusivity provided, the total size of the commitment by the sponsor, and other factors. We also sell advertising on a CPM (cost per thousand impressions) basis, where an advertiser can purchase a set amount of impressions on that basis. An “impression” is a single instance of an ad appearing on a Web page. However, our services for advertisers and sponsors are generally more complex and have more complex pricing than simple cost per thousand impressions pricing.
As our audience of mobile users continues to grow, we are seeing increased acceptance of and demand for mobile advertising and sponsorship programs from our customers. While we offer mobile as a standalone purchase, our advertising and sponsorship clients are generally interested in reaching a targeted audience, regardless of what device the user is engaging on, and choose multi-platform advertising and sponsorship programs. In 2015, our advertising and sponsorship revenue delivered on a mobile device grew to approximately $189 million, or 38% of our total advertising and sponsorship revenue, from approximately $156 million in 2014 (which was 34% of our total advertising and sponsorship revenue in that year). This includes stand-alone mobile advertising and sponsorship revenue as well as the allocation of multi-platform advertising and sponsorship revenue for the portion delivered on smartphone or tablet.
13
Table of Contents
Index to Financial Statements
We have been investing in improved data analytics capabilities to enhance our ability to demonstrate to advertisers and sponsors how promotional strategies implemented through WebMD impact physician and consumer behaviors and preferences. Enhanced analytic capabilities also support WebMD’s internal development of user engagement strategies and new messaging and education services.
Sales and Marketing
Our sales, marketing and account management personnel work with pharmaceutical, medical device and biotechnology companies, hospitals, health insurance companies, governmental entities and consumer products companies and their ad agencies to place their advertisements and other sponsored products on The WebMD Health Network and in WebMD Magazine. These individuals work closely with clients and potential clients and their agencies to develop innovative ways to bring their companies and their products and services to the attention of specific groups of consumers and healthcare professionals, and to create channels of communication with these audiences.
WEBMD HEALTH SERVICES – OUR PRIVATE PORTALS
Introduction
In response to increasing healthcare costs, employers and health plans have been changing benefit plan designs to increase deductibles, co-payments and other out-of-pocket costs and taking other steps to motivate employees and plan participants to live healthier lives and use healthcare in a cost-effective manner. In connection with shifting greater responsibility for healthcare costs to employees and plan participants, employers and health plans are making available more health and benefits information and decision-support applications to help their employees and plan participants make informed decisions about health risks, lifestyle choices, healthcare providers, treatment options, and healthcare benefits options. The goal is to encourage individuals to take a more active role in managing their health by providing relevant information, including data related to healthcare costs and quality. Since lifestyle choices, including choices regarding nutrition, exercise and tobacco use, are key drivers of health and can dramatically impact risks for acquiring chronic, costly health conditions, employers and health plans seek to reduce demand for healthcare services by focusing on health and wellness initiatives for their employees and plan participants.
For more than a decade, our cloud-based platform has helped employers and health plans improve the health of their employee and plan participant populations and, as a result, manage their healthcare costs. We host our WebMD Health Services platform for private and public sector employers and health plans for use by their employees and plan participants (we generally refer to the individuals given access to our services by their employers and health plans as “participants” below). We provide personalized content, tools and other resources relevant to the specific participant’s eligibility, coverage and wellness profile. Our online services can be accessed by participants using a desktop computer, a tablet or a smartphone. Our flexible architecture allows us to integrate with the client’s existing programs, Websites and intranets for participants. As described more fully below, our WebMD Health Services solutions also include telephonic, online and onsite individual health coaching and targeted condition management programs that help employees and plan participants make healthier lifestyle choices to achieve their health and wellness goals. We also offer clients the ability to design team-based and individual wellness challenges that help foster a culture of wellness in the workplace. In addition, we offer a suite of decision-support and transparency tools that help participants understand the financial implications of their benefits options and factor quality and cost into decisions about care and treatment options.
We generate revenue from subscriptions to our WebMD Health Services platform by employers and health plans, either directly or through distribution relationships, including relationships with employee benefits outsourcing companies, employee benefits consultants and other companies that assist employers in purchasing or managing employee benefits. In addition, we offer our health coaching and condition management services on a per participant basis. Our WebMD Health Services private portals do not display advertisements or generate revenue from advertising or sponsorship.
14
Table of Contents
Index to Financial Statements
Our Online Platform
Overview. Our WebMD Health Services cloud-based platform provides a personalized user experience by integrating: individual user data (including personal health information); plan-specific data from clients; and WebMD content, decision-support technology and personal communication services. We host our WebMD Health Services platform for our clients. Our flexible architecture allows us to integrate with each of our client’s existing programs, Websites and intranets.
Our platform has been designed to integrate complex data from multiple sources, including self-reported health information, health and pharmacy claims data, electronic medical records and lab results. Through our device and app connection center, we can import biometric data from devices, monitors and apps used for health and fitness purposes. Once the information from any of these multiple sources has been imported into a participant’s profile on the platform, it can be used in other WebMD Health Services products, such as in connection with issuing rewards, designing wellness challenges or participating in one of our coaching programs. Each participant’s health profile drives personalized messaging to the individual, including recommendations for educational resources and online tools.
Health Assessments, Personal Health Records and Related Tools. Our proprietary health assessment tool (sometimes referred to in the industry as a health risk assessment), once completed by the participant, helps identify modifiable risk factors and health conditions. The health assessment tool also provides participants, based on their individual risks and conditions, with initial steps they can take to lead a healthier life.
Our WebMD Health RecordSM provides a secure repository for self-reported and professionally sourced health data and helps participants gather, store, manage and share that data. Medical and pharmacy claims data as well as lab and biometric results can be automatically imported. In addition, the WebMD Health RecordSM allows individual users to authorize access by healthcare providers, which can encourage better communication and coordination of care. Through the portability feature, WebMD also offers individual users the ability to access their health record even if they change jobs, health plans or providers. We also provide the capability to upload, track, and share data from mobile devices and home medical devices. Our health trackers and related tools allow individuals to graphically track health measurements over time. We also offer two mobile applications that can be integrated with the WebMD Health Services platform: WebMD Daily VictorySM, which provides healthy activity tracking capabilities; and WebMD Weigh TodaySM, which enables participants to track their weight on a daily basis and offers encouragement throughout the tracking process to solidify the healthy habit of weighing in.
Communications Services and Incentive Program Services. We provide communications services and incentive program services to support client health and wellness programs, to increase completion rates of the health assessments, and to drive ongoing utilization of our tools and services by participants. With the rewards platform, we assist clients in motivating their participants through wellness incentive programs that encourage and reward use of the services we provide and specific health behaviors. Our flexible rewards platform enables clients to design and manage custom rewards programs based on participation, activity or outcomes. Rewards fulfillment may include premium reductions, gift cards, electronic funds transfer into HSA accounts, rewards debit cards or check rewards. Our messaging platform enables targeted email and text messaging communication campaigns that inform and motivate participants to change their behaviors and improve health status. Messages can be targeted based on health profile characteristics, demographics, or site usage, and they can be designed to raise awareness of specific resources and programs or to motivate lifestyle changes. We also provide print media as an additional channel to motivate utilization by individuals and their dependents.
Our Health Coaching and Condition Management Services
Telephonic and onsite health coaching are integrated with our online coaching platform and can be accessed by an employee or plan participant through a client’s private portal. Our health coaches work one-on-one with participants to motivate them to improve their own health status by managing modifiable risk factors that can lead to health conditions. Health coaching focuses on supporting participants to pursue health-conscious lifestyles, actively seeking health and wellness knowledge, and understanding the impact of lifestyle decisions. In addition, a health coach can refer participants to employer or plan sponsored health programs or recommend appropriate online or offline health resources to help them meet their wellness goals. We offer tobacco cessation
15
Table of Contents
Index to Financial Statements
and weight management coaching programs specifically designed to support participants with smoking cessation and weight management. Our condition management specialty coaching programs address the health risks associated with certain other chronic conditions.
We tailor WebMD Lifestyle FirstSM coaching programs to the goals of our clients by offering different levels of coaching intensity and allowing targeting of various risk factor profiles for coaching eligibility. Individuals are notified about their eligibility to participate in telephonic health coaching under programs selected by their employer or health plan. Our health coaching services, together with our online services, not only can help high-risk individuals identify important risk factors and change unhealthy behaviors, but also can help moderate-risk individuals to lower their risks and those who are healthy to stay that way. In addition to telephonic coaching, we offer the following related services:
| • | Online Coaching. WebMD Digital Health AssistantSM online, self-directed health coaching programs focus on exercise, nutrition, smoking cessation, weight management, emotional health and stress management. These programs let individuals set and track wellness goals, learn more about their behaviors and risks and follow self-paced personal action plans to improve their health. Each program includes comprehensive education modules and interactive goal setting and experience tracking. |
| • | Onsite Services. We offer three types of onsite services to our employer clients: onsite wellness coordinators to help augment in-house staff; onsite health coaches that extend the telephonic coaching model to an onsite, in-person model (often delivered within an onsite clinic); and turnkey biometric screening and health fair solutions through a combination of third-party vendors and our own services. |
WebMD Lifestyle FirstSM coaching programs extend to cover condition management. These condition management programs are designed to give individuals access to a wide range of online and offline resources to provide long-term support and motivation and help them make better decisions to manage their health, including ongoing, intensive one-on-one coaching by condition specialists, along with progress tracking tools and personalized messaging and rewards programs. We offer Condition Management programs for five conditions: coronary artery disease, congestive heart failure, diabetes, chronic obstructive pulmonary disease and asthma.
We offer tools and services that enable our clients to integrate programs from third parties, including their disease management vendors, into the programs and portal solutions we offer. Participants are referred to third-party services through our proprietary Health Program Referral System, and those services can be promoted throughout the online or coaching experiences that we deliver.
Our WebMD Wellness Challenge Platform
Through our WebMD Wellness Challenge Platform, we offer clients the ability to create and configure team-based and individual wellness challenges that help foster a culture of wellness in the workplace. These challenges may be activity or points-based custom challenges designed by the client for its specific employee population or one of our core supported challenges, such as the WebMD Hit Your StrideSM walking program that allows participants in the challenge to compete on number of steps and the WebMD Ready! Set! Move!SM activity program that allows challenge participants to compete on the most exercise minutes or exercise intensity. Wellness challenges are integrated with the WebMD Health Services solution, including WebMD Digital Health AssistantSM, WebMD Lifestyle FirstSM coaching programs, and the rewards platform.
Our Decision Support and Transparency Tools
We offer clients a suite of decision support and transparency tools that help their participants understand the financial implications of their benefits options, make more informed benefits-related purchase decisions, and obtain access to information and services that can help them factor quality and cost into decisions about care and treatment options. WebMD Health ConciergeSM provides access to information on conditions, treatments, and drugs. It presents participants with an integrated set of personalized results, including out-of-pocket cost estimates, medication information, news and alerts from WebMD and government sources, questions to ask their doctor, treatment options to consider, and health education, based on their gender, location, age, benefit plan and financial balances. WebMD Coverage AdvisorSM allows participants to compare costs across available health plan options based on personalized information regarding coverage alternatives, using cost-modeling and projection
16
Table of Contents
Index to Financial Statements
utilities that take into consideration the individual’s gender, geographic location, family composition, eligibility status, and projected utilization. WebMD Coverage AdvisorSM dynamically displays benefit plan features, co-pays, pharmacy coverage and provider coverage, and can also help participants determine appropriate contributions to flexible spending accounts (FSAs), health savings accounts (HSAs), and health reimbursement accounts (HRAs). In addition, through WebMD Hospital AdvisorSM, WebMD Medication AdvisorSM and WebMD Treatment Cost Advisor, participants can access quality ratings and cost comparisons for physicians, hospitals, medications, conditions and procedures to assist in making treatment decisions.
Sales and Marketing
We market our WebMD Health Services cloud-based platform and health coaching and condition management services to private and public sector employers and health plans through a dedicated sales, marketing and account management team. Our services are also distributed through relationships with employee benefits outsourcing companies, certain of our clients who have limited distribution rights, employee benefits consultants and other companies that assist employers in purchasing or managing employee benefits. A typical contract provides for a multi-year term. The pricing of these contracts is generally based on several factors, including the complexity involved in integrating our online platform for the client, the number of wellness and decision support tools and other services being provided, the degree of customization of the services involved and the anticipated number of participants covered by such contract.
TECHNOLOGICAL INFRASTRUCTURE
Our services are delivered through Websites and mobile platforms designed to address the healthcare information needs of our users with easy-to-use interfaces and navigation capabilities. We use customized content management and publishing technology to develop, edit, publish, manage, and organize our content. We use ad-serving technology to store, manage and serve online advertisements. We also use specialized software for delivering personalized content through our private portals and, for registered members, through our public Websites and related mobile applications.
Continued development of our technological infrastructure is critical to our success. We have invested and intend to continue to invest in software and systems that allow us to meet the demands of our users and sponsors and the clients of our private portals. Our development teams work closely with marketing and account management employees to create content management capabilities, interactive tools and other applications. The goal of our current and planned investments is to further develop our content and technology platform serving various end-users, including consumers and physicians, and to create innovative services that provide value for our advertisers and sponsors for The WebMD Health Network and for the employer and payer customers of our private portals.
USER PRIVACY AND TRUST
We have adopted internal policies and practices relating to, among other things, content standards and user privacy, designed to foster our relationships with our users. For additional information regarding the policies and practices of our public portals, see “The WebMD Health Network – Our Public Portals – Our Editorial Policies” and “– Our Policies Regarding Advertisements, Sponsorships and Promotions” above. In addition, we participate in the following external, independent verification programs:
| • | URAC. We have been awarded Health Web Site accreditation from URAC, an independent accrediting body that has reviewed and approved the WebMD.com site and our WebMD Health Services platform for compliance with its quality and ethics standards. The current term of our accreditation goes through July 1, 2016. |
| • | TRUSTe. WebMD.com, MedicineNet.com, RxList.com, eMedicineHealth.com, our mobile site and our WebMD App are licensees of the TRUSTe Privacy Seal. TRUSTe is an independent organization whose goal is to build users’ trust and confidence in the Internet. TRUSTe is also a Children’s Online Privacy |
17
Table of Contents
Index to Financial Statements
| Protection Act (COPPA) Safe Harbor organization for the Federal Trade Commission and our fit WebMD site is certified under its Children’s Privacy Seal Program. |
| • | Health on the Net Foundation. Our WebMD.com, eMedicineHealth.com, MedicineNet.com, RxList.com and WebMD.Boots.com sites and the WebMD Health Services platform comply with the principles of the HON Code of Conduct established by the Health on the Net Foundation, an independent, non-profit organization. |
| • | Children’s Advertising Review Unit (CARU). Our fit WebMD site complies with the standards set forth by CARU. CARU is the children’s arm of the advertising industry’s self-regulation program and evaluates child-directed advertising and promotional material in all media to advance truthfulness, accuracy and consistency with its Self-Regulatory Guidelines for Children’s Advertising and relevant laws. |
| • | Digital Advertising Alliance (About Ads). WebMD.com, MedicineNet.com, RxList.com, and eMedicineHealth.com are licensees of the Digital Advertising Alliance’s Ad Choices program. The Digital Advertising Alliance is a self-regulatory body that develops industry best practices and effective self-regulatory solutions for consumer choice in online behavioral advertising. |
| • | NCQA. Our WebMD Health Services wellness programs have obtained the following National Committee for Quality Assurance (NCQA) accreditations and certifications: Wellness and Health Promotion (WHP) Accreditation; Health Information (HIP) 3 — Support for Healthy Living Certification; and Disease Management (DM) Accreditation. NCQA is a private, non-profit organization dedicated to improving healthcare quality and providing healthcare quality information for consumers, purchasers, healthcare providers and researchers. |
We have won numerous awards for our Websites and for specific articles. We have been awarded the Webby’s People’s Voice Award in the Health Category for three consecutive years. Other awards include: the prestigious Society of Professional Journalists Award for deadline reporting; the Weidenbaum Center Award for Evidence-Based Journalism; a Gold Award from Medical Marketing and Media (MM&M) for Best Mobile App for Consumers (WebMD Baby App); and numerous Telly Awards for our video programming. WebMD has also been named the most trusted U.S. brand by Millward Brown.
We understand how important the privacy of personal information is to our users. Our Privacy Policies are posted on our Websites and inform users regarding the information we collect about them and about their use of our portals and our services. Our Privacy Policies also explain the choices users have about how their personal information is used and how we protect that information.
COMPETITION
The markets we participate in are intensely competitive, continually evolving and, in some cases, are subject to rapid change. Some of our competitors have greater financial, technical, marketing and other resources than we do, and some are better known than we are. We cannot provide assurance that we will be able to compete successfully against these organizations.
Public Portals
Overview. Our public portals and mobile applications face competition from numerous other companies, both in attracting users and in generating revenue from advertisers and sponsors, and we expect that additional competitors will continue to enter the markets we participate in. Our advertisers and sponsors have numerous alternatives to choose from, including traditional media, Internet search engines, social media Internet sites, and general interest consumer sites, as well as the alternative of communicating through their own Websites or other channels that they manage in-house or through their advertising agencies. Such competition may result in smaller customer commitments or pressure to reduce prices, both of which could reduce our revenues and profit margins. Competitors for the attention of consumers and healthcare professionals also include public sector, non-profit and other Websites that provide healthcare information without advertising or sponsorships from third parties.
18
Table of Contents
Index to Financial Statements
Consumer Portals. Our consumer portals and mobile applications compete with online services, Websites and mobile applications that provide health, wellness and lifestyle information for consumers. These competitors include:
| • | general purpose consumer Websites or search engines that offer specialized health, wellness and lifestyle sub-channels or functions, such as yahoo.com, msn.com, AOL.com, Google and Bing; |
| • | other high traffic Websites that include healthcare-related and non-healthcare-related content and services, including social media Websites, such as Facebook and Google+; and |
| • | Websites and mobile applications that provide information and tools relating to specific diseases and conditions or other specific types of health, wellness and lifestyle content, such as Demand Media and Everyday Health as well as online communities, social media sites and blogs focused on these matters. |
Competitors to our consumer portals also include advertising networks that aggregate traffic from multiple Websites, including advertising.com (which is a division of AOL Platforms and owned by Verizon), Tribal Fusion, Undertone Networks and AdBlade. Other competitors to our consumer portals include: publishers and distributors of traditional offline media, including television, radio, books, newspapers and magazines targeted to consumers; and manufacturers and distributors of activity trackers, heart rate monitors, blood pressure monitors and similar devices relating to health and wellness that can download data to a PC, tablet or smartphone, as well as numerous other companies developing applications and tools for use with those devices.
Professional Portals. Competitors to our professional portals and mobile applications include Epocrates, Inc. (which is part of athenahealth, Inc.), Clinical Care Options, MedPage Today (which is owned by Everyday Health), QuantiaMD, Sermo (which is operated by WorldOne) and UpToDate Inc. (which is owned by Wolters Kluwer Health). Other competitors to our professional portals include:
| • | print journals and other specialized media targeted to healthcare professionals, many of which have established or may establish their own Websites or partner with other Websites; |
| • | offline medical conferences, CME and CE programs and symposia; |
| • | vendors of e-detailing services, such as Physicians Interactive, and our clients’ own in-house detailing efforts; and |
| • | vendors of healthcare information and related services distributed through other means, including direct sales, mail and fax messaging. |
Private Portals
Our WebMD Health Services private portals solutions and coaching and condition management services compete, directly or indirectly, with various types of services provided by many different types of companies, including:
| • | similar services offered by health insurance companies and their affiliates, such as Aetna, Humana, Kaiser Permanente and United Healthcare, and by employee benefits services companies and their affiliates; |
| • | services offered by health management and disease management vendors, such as Mayo Foundation for Medical Education and Research, Wellness + Prevention, Inc. (which was formerly known as HealthMedia), Healthways, StayWell, Limeade, RedBrick Health and Optum (which is owned by United Health Group); and |
| • | services of other providers of online platforms and applications for personal health records and decision-support and transparency tools for evaluating health insurance coverage options and healthcare provider and treatment options, such as Castlight Health, Change Healthcare, Dossia, Epic Systems, HealthSparq, Microsoft, and a variety of other companies. |
Employers may also decide to develop similar solutions for their own populations rather than obtaining solutions from WebMD Health Services or its competitors.
19
Table of Contents
Index to Financial Statements
REGULATORY MATTERS
Introduction
Healthcare Regulation. The healthcare industry is highly regulated and is subject to changing political, regulatory and other influences. Most of our revenue is derived either directly from the healthcare industry or from other sources that are subject to healthcare laws and related regulations and could be affected by changes in those laws and regulations. This section of our Annual Report contains a description of healthcare laws and regulations applicable to us, either directly or through their effect on our healthcare industry customers, as well as healthcare industry standards that serve a self-regulatory function, and certain related matters. Changes in those laws, regulations and standards may create unexpected liabilities for us, may cause us to incur additional costs and may restrict our operations.
Many healthcare laws are complex, and their application to specific products, services, and business arrangements may not be clear. In particular, many existing healthcare laws and regulations, when enacted, did not anticipate the healthcare information services that we provide. These laws, regulations and industry standards may nonetheless be applied to our products, services, and business arrangements in ways we cannot accurately anticipate, which could create liability for us, result in adverse publicity, and negatively affect our business. Even in areas where we are not subject to healthcare regulation directly, we may become involved in governmental actions or investigations through our relationships with customers that are regulated, and participation in such actions or investigations, even if we are not a party and not the subject of an investigation, may cause us to incur significant expenses.
Other Regulation. This section of our Annual Report also contains a description of other laws and regulations, including general consumer protection laws and Internet-related laws that may affect our operations. Laws and regulations have been adopted, and may be adopted in the future, that address Internet-related issues, including online content, privacy, online marketing, unsolicited commercial email, taxation, pricing, and quality of products and services. Some of these laws and regulations were adopted relatively recently, and their scope and application may still be subject to uncertainties. Interpretations of these laws, as well as any new or revised laws or regulations, could decrease demand for our services, increase our cost of doing business, or otherwise cause our business to suffer.
Regulation of Drug and Medical Device Advertising and Promotion
The FDA and the Federal Trade Commission, or FTC, regulate the form, content and dissemination of labeling, advertising and promotional materials prepared by, or for, pharmaceutical or medical device companies. The FTC regulates over-the-counter (OTC) drug and dietary supplement advertising and, in some cases, medical device advertising. Based on FDA requirements, regulated companies must limit advertising and promotional materials to discussions of FDA-approved uses and claims. In limited circumstances, regulated companies may disseminate certain non-promotional scientific information or disease-state information.
Information on our Websites that promotes the use of pharmaceutical products or medical devices is subject to FDA and FTC requirements and enforcement actions, and information regarding other products and services is subject to FTC requirements. If either agency finds that information on our Websites violates regulations or guidance, it may take regulatory or judicial action against us or the advertiser or sponsor of that information. State attorneys general may also take similar action based on their state’s consumer protection statutes. Areas of our Websites that could be the primary focus of regulators include pages and programs that discuss use of a regulated product or that the regulators believe may lack editorial independence from the control of sponsoring pharmaceutical or device companies. Television broadcast advertisements that we may provide may also be subject to FTC and FDA regulation, depending on the content. The agencies place the principal burden of compliance with advertising and promotional regulations on advertisers and sponsors to make truthful, substantiated claims.
The Federal Food, Drug, and Cosmetic Act, or FDC Act, and its implementing regulations require that prescription drugs be approved by the FDA prior to marketing. It is a violation to market, advertise or otherwise commercialize such products prior to approval. The FDA allows for preapproval exchange of scientific information, provided it is non-promotional in nature and does not draw conclusions regarding the ultimate safety
20
Table of Contents
Index to Financial Statements
or effectiveness of the unapproved drug. The FDA also refrains from regulating certain disease state materials so long as those materials do not make a representation or suggestion about a drug or device. Upon approval or clearance, the FDA’s regulatory authority extends to the labeling and advertising of prescription drugs and medical devices. Such products may be promoted and advertised only for uses reviewed and approved by the FDA. Labeling and advertising can be neither false nor misleading and must present all material information, including risk information, in a clear, conspicuous and neutral manner. There are also requirements for certain information (the “prescribing information” or “package insert” for promotional labeling and the “brief summary” for advertising) to be part of labeling and advertising. Labeling and advertising that violate these legal standards are subject to enforcement.
The FDA also regulates the safety, effectiveness, and labeling of OTC drugs either through specific product approvals or through regulations that define approved claims for specific categories of products. The FTC regulates the advertising of OTC drugs and dietary supplements under the section of the Federal Trade Commission Act that prohibits unfair or deceptive trade practices. The FDA and FTC regulatory framework requires that OTC drugs and dietary supplements be formulated and labeled in accordance with FDA approvals or regulations and promoted in a manner that is truthful, adequately substantiated, and consistent with the labeled uses. OTC drugs that do not meet these requirements are subject to FDA or FTC enforcement action depending on the nature of the violation. In addition, state attorneys general may bring enforcement actions for alleged unfair or deceptive advertising.
There are several administrative, civil and criminal sanctions available to the FDA for violations of the FDC Act or FDA regulations as they relate to labeling and advertising. Administrative sanctions include a written request that violative advertising or promotion cease and/or that corrective action be taken, such as requiring a company to provide to healthcare providers and/or consumers information to correct misinformation previously conveyed. More serious civil sanctions include seizures, injunctions, fines and consent decrees. Any of these enforcement measures could prevent a company from introducing or maintaining its product in the marketplace. Criminal penalties for severe violations can result in a prison term and/or substantial fines. State attorneys general have similar investigative tools and sanctions available to them.
In the last 15 years, the FDA has gradually relaxed its formerly restrictive policies on direct-to-consumer advertising of prescription drugs, allowing companies to advertise prescription drugs to consumers in any medium, provided that they satisfy FDA requirements. For example, in August 2015, the FDA issued revised draft guidance regarding the “brief summary” requirement for prescription drug advertising and promotional labeling in print media, allowing those statements to focus primarily on the most clinically significant information on the most serious and the most common risks associated with the product(s). If, in the future, the FDA issues more restrictive policies or guidance regarding direct-to-consumer advertising or if new laws or regulations impose additional restrictions on such advertising, it could become more difficult for us to obtain advertising and sponsorship revenue.
In response to a Congressional directive, the FDA has issued several guidance documents regarding the use of the Internet to promote FDA-regulated medical products. Most recently, in 2014, the FDA issued draft guidances clarifying rules regarding drug promotion through interactive social media tools. The draft guidances recommended how drug and device firms can correct inaccurate information about their products posted by third parties on Internet and social media sites and clarified how these same firms can discuss their products on Internet platforms with space restrictions, including social media sites and paid search links. None of these draft guidances directly affect a core part of our current business, but, to the extent that they affect social media aspects of our Websites, they may trigger certain obligations for our customers. We do not know how our customers might change their business practices in light of the 2014 guidances. We cannot predict what effect, if any, such changes would have on our business.
There are also advertising restrictions that apply outside of the United States. Under European laws, there are several restrictions regarding advertising of drugs or medical devices. There are, in particular, broad prohibitions on the advertising of prescription or reimbursed drugs to the general public, the use of indirect or disguised marketing, and the offering and providing of gifts or benefits with promotional purpose that are not of minor value. If the relevant European national competent authorities find that any of our products and services,
21
Table of Contents
Index to Financial Statements
or any information on our Websites or in our mobile applications, violate applicable regulations, they may take regulatory or judicial action against us and/or the advertisers or sponsors of that information. Moreover, our competitors, or even competitors of advertisers and sponsors, may take actions against us and/or advertisers or sponsors of the information.
Regulation of Mobile Applications and Other Mobile Health Technology
The FDA regulates medical devices in the U.S. Some health-related applications running on mobile platforms, as well as other health-related software products, among other types of products, are considered medical devices. Such actively regulated medical devices are subject to extensive regulation by the FDA and other federal, state, and local authorities. In order to be subject to FDA regulation, the particular application or product must meet the definition of a medical device as provided in the FDC Act. In February 2015, the FDA clarified via guidance document that the agency intends to actively regulate only those mobile applications that meet the agency’s definition of “device” and that could pose a risk to patients’ safety if they fail to work as intended. The FDA is exercising enforcement discretion, meaning that they will not actively enforce FDC Act regulatory requirements, with respect to certain lower risk mobile applications that meet the device definition. In addition, the FDA has recently proposed refraining from exercising active enforcement over certain products that promote health or healthy lifestyles even when promoted for patients with certain diseases or conditions.
In light of current FDA guidance, we believe that none of our existing online services and mobile applications are subject to regulation as a medical device under applicable FDA regulations. We are required to determine whether FDA regulations would apply to any of our applications and the FDA could disagree with our determination. If the FDA disagrees, the agency may take regulatory action against us. It is also possible that products or services that we may offer in the future could subject us to such regulation or that current rules could change or be interpreted to apply to some of our existing online services or mobile applications. Complying with such regulations could be burdensome and expensive and could delay our introduction of new services or applications.
Regulation and Accreditation of Continuing Medical Education
Activities and information provided in the context of an independent medical or scientific educational program, often referred to as continuing medical education, or CME, usually are treated as non-promotional and fall outside the FDA’s jurisdiction. The FDA does, however, evaluate CME activities to determine whether they are independent of the promotional influence of the activities’ supporters. To determine whether a CME provider’s activities are sufficiently independent, the FDA looks at a number of factors related to the planning, content, speakers and audience selection of such activities. To the extent that the FDA concludes that such activities are not independent, such content must fully comply with the FDA’s requirements and restrictions regarding promotional activities.
Medscape, LLC distributes online CME to physicians and other healthcare professionals and is accredited by the Accreditation Council for Continuing Medical Education (ACCME), which oversees providers of CME credit. Medscape Education (www.medscape.org) is the Website through which Medscape, LLC distributes online CME. If any CME activity that Medscape, LLC certifies for CME credit is considered promotional, Medscape, LLC may face regulatory action or the loss of accreditation by the ACCME. Supporters of CME activities may also face regulatory action, potentially leading to termination of support.
Medscape, LLC’s current ACCME accreditation expires in August 2016 and we are currently in the process of pursuing a renewal. In order for Medscape, LLC to renew its accreditation, it will be required to demonstrate to the ACCME that it continues to meet ACCME requirements. If Medscape, LLC fails to maintain its status as an accredited ACCME provider (whether at the time of such renewal or at an earlier time as a result of a failure to comply with existing or additional ACCME standards), it will not be permitted to accredit CME activities for physicians and other healthcare professionals. Instead, Medscape, LLC would be required to use third parties to provide such CME-related accreditation services. That, in turn, could discourage potential supporters from engaging Medscape, LLC to develop CME or education-related activities, which could have a material adverse effect on our business.
22
Table of Contents
Index to Financial Statements
Medscape, LLC’s CME activities are planned and implemented in accordance with the Essential Areas and Elements and the Policies of the ACCME and other applicable accreditation standards. The ACCME’s standards for commercial support of CME are intended to ensure, among other things, that CME activities of ACCME-accredited providers, such as Medscape, LLC, are independent of “commercial interests,” which are defined as entities that produce, market, re-sell or distribute healthcare goods and services, excluding certain organizations. Commercial interests and entities owned or controlled by commercial interests are ineligible for accreditation by the ACCME. The standards provide that accredited CME providers may not place certain CME content on Websites owned or controlled by a commercial interest. In addition, accredited CME providers may not ask commercial interests for speaker or topic suggestions, and are also prohibited from asking commercial interests to review CME content prior to delivery. Further, there are limitations and requirements for CME providers using employees of a commercial interest as planners or speakers at CME events.
From time to time, the ACCME revises its standards for commercial support of CME. As a result of prior ACCME revisions, we have adjusted our corporate structure and made changes to our management and operations intended to allow Medscape, LLC to provide CME activities that are developed independently from those programs developed by its sister companies, which may not be independent of commercial interests. We believe that these changes allow Medscape, LLC to satisfy the applicable standards.
Over the years, the ACCME and other organizations have discussed ways to assure that commercial interests do not bias CME activities. The ACCME has published several proposals since 2008, including proposals to reduce communications between commercial interests and CME providers and to create special designations for CME activities that are not funded by commercial interests. The ACCME also suggested creating an independent CME funding entity to build a firewall between commercial interests and CME activities. The ACCME has not adopted these proposals but has revised its policies. It is possible that adoption of additional proposals could significantly affect Medscape, LLC’s business model.
The Department of Justice continues to examine CME sponsorship by pharmaceutical companies. In addition, as part of the Affordable Care Act, pharmaceutical companies are now required to publicly report certain payments and transfers of value that they make to U.S. physicians. Beginning this year, this reporting requirement may include payments to CME authors. The federal government’s interpretation of this reporting requirement, which has been evolving and may continue to change, could affect pharmaceutical companies’ views of their reporting obligations with respect to payments in support of authors and presenters of CME material. In implementing internal controls and procedures that promote adherence to applicable regulations and requirements, supporters of CME may interpret the regulations and requirements differently and may implement varying procedures or requirements. These regulations and requirements, and the related internal controls and procedures:
| • | may discourage pharmaceutical companies from providing grants for independent educational activities; |
| • | may slow their internal approval for such grants; |
| • | may reduce the volume of sponsored educational programs that Medscape, LLC produces to levels that are lower than in the past, thereby reducing revenue; and |
| • | may require Medscape, LLC to make changes to how it offers or provides educational programs, including CME. |
In addition, future changes to laws, regulations or accreditation standards, or to the internal compliance programs of supporters or potential supporters, may further discourage, significantly limit, or prohibit supporters or potential supporters from engaging in educational activities with Medscape, LLC, or may require Medscape, LLC to make further changes in the way it offers or provides educational activities.
Federal False Claims Act
The Federal False Claims Act imposes liability on any person or entity who, among other things, knowingly presents, or causes to be presented, a false or fraudulent claim for payment by a federal healthcare program. The whistleblower (or “qui tam”) provisions of the Federal False Claims Act allow a private individual to bring actions on behalf of the federal government alleging that the defendant has submitted a false claim to the federal government and to share in any monetary recovery. After the filing of a qui tam suit, the federal government may
23
Table of Contents
Index to Financial Statements
intervene and control the case; if it does not, the private individual may pursue the claim on his or her own. In addition, various states and European countries have enacted false claim laws analogous to the Federal False Claims Act, and many of these laws apply where a claim is submitted to any third-party payor and not merely a federal healthcare program. When an entity is determined to have violated the Federal False Claims Act, it may be required to pay up to three times the actual damages sustained by the government, plus civil penalties. Federal False Claims Act cases have been brought against drug manufacturers, and resulted in significant monetary settlements and the imposition of federally-supervised corporate integrity agreements in circumstances that include allegations that company-sponsored CME was unlawful off-label promotion. It is not clear whether there is a basis for the application of the Federal False Claims Act to the types of services that WebMD provides. However, plaintiffs have in the past, and may in the future, seek to name us as defendants in these types of cases. Any action against us for violation of these laws could cause us to incur significant legal expenses and may adversely affect our ability to operate our business. Similarly, Federal False Claims Act actions and resulting corporate integrity agreements involving our customers may reduce the use of our services by our advertising and sponsorship clients.
HIPAA Privacy Standards and Security Standards
The Privacy Standards and Security Standards under the Health Insurance Portability and Accountability Act of 1996 (referred to as HIPAA), as amended by the Health Information Technology for Economic and Clinical Health Act of 2009 (referred to as HITECH), establish a set of national privacy and security standards for the protection of individually identifiable health information by health plans, healthcare clearinghouses and healthcare providers (referred to as “covered entities”) and their “business associates,” which are persons or entities that perform certain services for or on behalf of a covered entity that involve the use or disclosure of protected health information. In connection with the sale by HLTH of its Emdeon Business Services (EBS) business, EBS (which is now known as Change Healthcare) agreed to license to HLTH, through February 2018, certain data, de-identified by Change Healthcare in conformity with HIPAA, for use in the development and commercialization of certain information products and services. We are currently using the data received under this license in our information services products.
As a “business associate” of covered entities, we are subject to HIPAA with regard to certain aspects of our business, such as managing employee or plan member health information for employers or health plans. With respect to our WebMD Health Services private portals and coaching services, HITECH creates obligations for us to report any unauthorized use or disclosure of protected health information, known as a breach, to our covered entity customers. The 2013 final HITECH rule modifies the breach reporting standard in a manner that makes more data security incidents qualify as reportable breaches. In addition, HITECH and its implementing regulations impose similar data breach notification requirements on vendors of personal health records that require us to notify affected individuals and the FTC in the event of a data breach involving the unsecured personal information of users of the WebMD Health Manager personal health record application on WebMD.com.
Violations of HIPAA may result in civil and criminal penalties. HITECH increased civil penalty amounts for violations of HIPAA and significantly strengthens enforcement by requiring the U.S. Department of Health and Human Services (HHS) to conduct periodic audits to confirm compliance and authorizing state attorneys general to bring civil actions seeking either injunctions or damages in response to violations of HIPAA Privacy Standards and Security Standards that threaten the privacy of state residents. These Privacy Standards and Security Standards may require us to incur additional costs and may restrict our business operations. These provisions, as modified by the 2013 final HITECH rule, may be subject to interpretation by various courts and other governmental authorities, thus creating potentially complex compliance issues for us and our customers and strategic partners.
Genetic Information Nondiscrimination Act (GINA)
The Genetic Information Nondiscrimination Act (referred to as GINA), enacted in May 2008, does not apply directly to WebMD, although it does apply to our WebMD Health Services private portal customers, including both employers and group health plans. GINA was enacted to prevent discrimination by group health
24
Table of Contents
Index to Financial Statements
plans, health insurance issuers and employers on the basis of genetic information. Our WebMD Health Services health assessment is typically offered to employees by their employer or group health plan as a voluntary component of a wellness program. The U.S. Departments of Labor, HHS and Treasury published Interim Final Rules implementing portions of Title I of GINA in October 2009. The Interim Final Rules prohibit health plans from requesting, requiring or purchasing genetic information prior to or in connection with enrollment, or at any time for underwriting purposes, and state that “underwriting purposes” includes any incentive or disincentive (such as decreasing or increasing premiums) for completing a health assessment. “Genetic information” is defined broadly to include information about an individual’s family medical history. The agencies have not finalized the regulations to date. However, in September 2010, the Department of Labor provided additional guidance in the form of frequently asked questions stating that, while a plan may not require an individual to complete a health assessment that requests family medical history in order to receive a wellness program reward, it may use genetic information to make a determination regarding payment, or regarding the medical appropriateness of a treatment or service. HHS also issued a final rule implementing Section 105 of GINA in January 2013. The final rule specifically provides that genetic information is a type of health information that is covered by HIPAA’s Privacy Standards and Security Standards, and specifically prohibits it from being used or disclosed for underwriting purposes (including any incentive or disincentive for completing a health assessment).
Title II of GINA prohibits employment discrimination based on genetic information as well as the request or purchase of genetic information of employees or their family members with limited exceptions. The Equal Employment Opportunity Commission issued final rules implementing Title II in November 2010. The final rules specify that genetic information may be collected in a health assessment that is part of a wellness program only if participation in the collection of such information is voluntary, and indicate that the agency will consider participation voluntary if the employer neither requires participation nor penalizes employees who do not participate. In October 2015 the agency issued proposed amendments to the final rules which would require the employer to provide a notice explaining to the employee what medical information will be obtained, and other facts, and limit incentives to participate to the 30% maximum under HIPAA.
While each customer is responsible for ensuring that the wellness and benefit selections it offers are compliant with GINA, WebMD may face challenges as a result of varying interpretations of the law by our customers and by the multiple enforcing agencies and uncertainties over the final form of certain of the rules. Our customers’ interpretations of the law have required us to modify our WebMD Health Services health assessment product, and we could experience increases in operational costs or decreases in demand for our products.
State legislation, such as some in California prohibiting any form of discrimination by businesses based on genetic information, including in housing, public accommodation, and the provision of emergency services, could have additional implications for service we provide in those states.
Other Restrictions Regarding Confidentiality, Privacy and Security of Health Information
In addition to HIPAA, numerous other state and federal laws, including those described in “Consumer Protection Regulation” below, govern the collection, dissemination, use, access to, confidentiality and security of patient health and prescriber information. In addition, Congress and some states are considering new laws and regulations that further protect the privacy and security of medical records or medical information. In some cases, more protective state privacy and security laws are not preempted by the HIPAA Privacy Standards and Security Standards and may be subject to interpretation by various courts and other governmental authorities, thus creating potentially complex compliance issues for us and our customers and strategic partners.
These laws at a state or federal level, or new interpretations of these laws, could create liability for us, could impose additional operational requirements on our business, could affect the manner in which we use and transmit patient information and could increase our cost of doing business. Claims of violations of privacy rights or contractual breaches, even if we are not found liable, could be expensive and time-consuming to defend and could result in adverse publicity that could harm our business.
Anti-Corruption Laws
The United States and other countries have adopted anti-corruption laws that generally prohibit directly or indirectly giving, offering or promising inducements to public officials to elicit an improper commercial
25
Table of Contents
Index to Financial Statements
advantage. Under applicable U.S., German, and most European law, this prohibition has been interpreted to apply to doctors and other medical professionals who work in state-run hospitals and state-run healthcare systems outside the United States. Some of these laws also prohibit directly or indirectly giving, offering or promising (and, in some cases, accepting or soliciting) inducements to (or from) private parties to elicit (or grant) an improper commercial advantage. In recent years, the U.S. government and governmental authorities outside the U.S. have brought enforcement actions that resulted in significant monetary penalties against several companies operating in the global healthcare industry for violations of anti-corruption laws resulting from illegal payments made to non-U.S. medical professionals.
As our business expands outside the United States, we (and others acting on our behalf) increasingly interact with non-U.S. doctors and other medical professionals, at least some of whom work in state-run hospitals or state-run healthcare systems. Such interactions inherently increase the risk of violating applicable anti-corruption laws. While we believe that we have appropriate compliance policies and procedures in place to mitigate such risk, our personnel and others acting on our behalf might engage in conduct that violates such laws, for which we might be held responsible. Under such circumstances, we could be subject to civil and/or criminal penalties and other consequences that could have a material adverse effect on our business, financial condition and results of operations. In addition, our brand and reputation, as well as our sales activities, could be adversely affected if we were to become the target of any resulting negative publicity.
Anti-Kickback Laws
There are federal and state laws that govern patient referrals, physician financial relationships and inducements to healthcare providers and patients. For example, the federal anti-kickback law prohibits any person or entity from offering, paying, soliciting or receiving anything of value, directly or indirectly, for the referral of patients for items or services reimbursed by Medicare, Medicaid and other federal healthcare programs or the leasing, purchasing, ordering or arranging for or recommending the lease, purchase or order of any item, good, facility or service reimbursed by these programs. Many states and European countries also have similar anti-kickback laws that are not necessarily limited to items or services for which payment is made by a government healthcare program. These laws are applicable to any person or entity, including manufacturers and distributors and, therefore, may restrict how we and some of our customers market products to healthcare providers, including e-details. We carefully review our practices with regulatory experts in an effort to ensure that we comply with all applicable laws. However, the laws in this area are both broad and vague, and it is often difficult or impossible to determine precisely how the laws will be applied, particularly to new services. Penalties for violating the federal anti-kickback law include imprisonment, fines and exclusion from participating, directly or indirectly, in Medicare, Medicaid and other federal healthcare programs. Any determination by a state, federal, or foreign regulatory agency that any of our practices violate any of these laws could subject us to civil or criminal penalties and require us to change or terminate some portions of our business and could have a material adverse effect on our business.
International Regulation
We are pursuing opportunities to expand the reach of our brands outside the United States. In certain markets outside the United States, we have entered into partnerships or joint ventures with other companies having expertise in the specific country or region, and we may do that in additional markets where we believe it is appropriate; in other such markets, we have relied primarily on our own internal resources, and we expect to do that in additional markets in the future. We structure our participation in markets outside the United States in compliance with the laws and regulations that apply to such participation. However, as in the United States, the healthcare industry is highly regulated in many other jurisdictions, and we may not be able to accurately anticipate the applicability of healthcare laws and regulations to our participation in such markets.
Many European countries have adopted laws and regulations similar to the U.S. laws and regulations described elsewhere in this section of our Annual Report. These include, for example, regulations like the anti-kickback laws, false claim laws, medical professional regulations, genetic privacy and nondiscrimination regulations, restrictions regarding advertising and promotion of drugs and medical devices, sunshine regulations and CME regulations. These European laws and regulations may impose additional operational requirements or
26
Table of Contents
Index to Financial Statements
restrictions on our business, and increase our cost of doing business. For example, we have implemented certain Website access restrictions that are intended to limit the display of advertising of drugs and medical devices if required by local law, so that such advertising will be seen only by appropriate healthcare professionals. If the applicable regulatory authorities find our access restrictions to be inadequate, they may require us to establish stricter access restrictions. Moreover, such authorities and/or our competitors or even competitors of our advertisers and sponsors may take action against us and/or our advertisers or sponsors if they believe that we have violated the applicable laws.
In addition, many countries and governmental bodies have, or are developing, laws that may apply to online health information services of the types we provide, or to Internet sites generally, including laws regarding the collection, use, storage and dissemination of personal information or patient data. To the extent our operations are located within their jurisdiction or are directed at individuals within their jurisdiction, these laws may apply to us. In addition, those governments may attempt to apply such laws extraterritorially or through treaties or other arrangements with U.S. governmental entities. To the extent we fail to accurately anticipate the application or interpretation of these laws, we could be subject to liability and adverse publicity, which could negatively affect our business. In Europe, the current national implementations of the existing general data protection Directive 95/46/EC and of the e-Privacy Directive 2002/58/EC provide for criminal and administrative sanctions in case of violations, even though criminal sanctions are very rarely imposed. For example, France and Germany provide for administrative fines of up to 300,000 Euros in case of illegal collection or processing of personally identifiable information. Under the General Data Protection Regulation that the European Union is expected to approve in 2016 and that will take effect two years thereafter, there can be fines of up to 10,000,000 Euros or up to 2% of global sales for certain comparatively minor offenses, or up to 20,000,000 Euros or up to 4% of the global sales for more serious offenses. The GDPR will increase privacy-related compliance requirements in the EU and also the likelihood of applicability of European law to entities established outside the European Union but processing data of European data subjects. Under EU law, the rules on cross-border personal data transfers from the EU to the U.S. are strict and only certain mechanisms are acceptable to effectuate such transfers. This framework will continue even with the enactment of the GDPR, but the viability of a number of transfer mechanisms is in flux. For example, on October 6, 2015, the Court of Justice of the European Union (CJEU), the European Union’s highest court, declared the U.S.-EU Safe Harbor Framework invalid as a mechanism to legitimize transfers of personal data from the EU to the U.S. On February 2, 2016, the European Commission and the U.S. Department of Commerce announced the EU-U.S. Privacy Shield, which is designed to replace the Safe Harbor Framework. The ultimate viability of the Privacy Shield is unclear. Various stakeholders, including EU data protection authorities, intend to review the Privacy Shield once the details are released. It is also possible the EU-U.S. Privacy Shield or other transfer mechanisms will be challenged in the CJEU, and it is unclear what the outcome of such a challenge would be.
Many European countries have established cost reduction measures within their health systems or are intending to do so. This is intended to reduce the spending of the mainly publicly funded health systems in Europe. For example, Germany has established a risk/benefit drug assessment that adversely affects the prices of newly introduced medicinal products. Thus, it is possible that our advertisers and sponsors will face cost reduction measures and reduce their expenditures or postpone expenditure decisions, including expenditures for our services, which could have material adverse effects on our business.
We describe additional laws and regulations that apply to our participation in markets outside the United States elsewhere in this “Regulatory Matters” section, including under the captions “– Regulation of Drug and Medical Device Advertising and Promotion” and “– Consumer Protection Regulation – General.” In addition, under the caption “– Anti-Corruption Laws,” we discuss U.S. and non-U.S. laws relevant to our interactions with public officials outside the U.S.
Consumer Protection Regulation
General. Advertising and promotional activities presented to visitors on our Websites are subject to federal and state consumer protection laws that regulate unfair and deceptive practices. We are also subject to various other federal and state consumer protection laws, including the specific ones described later in this section.
27
Table of Contents
Index to Financial Statements
Internet and mobile user privacy, personal data security and the use of information to track online activities are major issues in the U.S. and abroad. In the U.S., the FTC and many state attorneys general are applying federal and state consumer protection laws to advertising activities and to require that the online collection, use and dissemination of data, including personal information, and the presentation of Website content, comply with certain standards for notice, choice, security and access. Courts may also adopt these developing standards. In many cases, the specific limitations imposed by these standards are subject to interpretation by courts and other governmental authorities. We believe that we are in compliance with the consumer protection standards that apply to our Websites, but a determination by a state or federal agency or court that any of our practices do not meet these standards could result in liability and adversely affect our business. New interpretations of these standards could also require us to incur additional costs and restrict our business operations. In addition, claims that we are violating any such standards could, even if we are not found liable, be expensive and time-consuming to defend and could result in adverse publicity that could harm our business.
There is also a possibility of legislation, regulations and increased enforcement activities, relating to behavioral advertising. To the extent that our existing practices are inconsistent with any revised principles, new rules, new legislation and/or future enforcement activities, our business may become subject to restrictions that could reduce our revenues or increase our cost of doing business.
The FTC Guides Concerning the Use of Endorsements and Testimonials in Advertising, which regulate disclosures relating to endorsements and testimonials, apply to online and social media forums. In 2013, the FTC revised guidance applicable to online advertising known as the Dot Com Disclosures, which was originally released in 2000. In December 2015, the FTC issued the Native Advertising Guide and accompanying Enforcement Policy Statement on deceptively formatted advertising, which summarize the FTC’s interpretation of traditional truth-in-advertising principles as applied to native advertising. Native advertising is considered to be the placement of sponsored content in media that consumers usually use to obtain independent, impartial content, when the sponsored content has the same look and feel as the independent content. The Native Advertising guidelines are a reminder that disclosures regarding sponsored content must be made in a clear and conspicuous manner. The revised Guides, the revised Dot Com Disclosures, and the Native Advertising Guidance may be an indication that the FTC may apply increased scrutiny to the use of endorsements, testimonials, and other advertising content online and through traditional media. We will review any relevant disclosures for compliance with the revised Guides, the revised Dot Com Disclosures, and the Native Advertising Guidance, and we will otherwise endeavor to follow legal standards applicable to advertising.
The FTC periodically holds workshops on issues relevant to online consumer privacy and uses the information it collects to help guide its policy and enforcement agenda. For example, in 2014, the FTC held a seminar regarding privacy issues associated with “consumer generated and controlled health data,” which is relevant to services we offer. Previously, following a series of workshops and prior guidance on online behavioral advertising, the FTC issued a preliminary staff report in December 2010 containing a proposed framework for businesses and policymakers for online consumer privacy issues and, in March 2012, the FTC issued a final report setting forth its current views on best practices, to protect the privacy of consumers, to be implemented by companies that collect and use consumer data. There is a possibility of legislation, regulations and increased enforcement activities relating to behavioral advertising and other aspects of consumer data usage, privacy and security. To the extent that our existing practices are inconsistent with any revised principles, new rules, new legislation and/or future enforcement activities, our business may become subject to restrictions that could reduce our revenues or increase our cost of doing business. Moreover, the FTC’s staff reports and workshops, and calls for legislation, reflect a continuing governmental interest in, and assessment of, online privacy issues. How these issues are ultimately resolved, whether through self-regulatory programs, legislation and regulation or some combination and the specifics of any such regimes, may significantly impact our operations.
In Europe, Directive 2009/136/EC of the European Parliament and of the Council requires the user’s full information and consent prior to the installation and use of any so-called “cookie” on a user’s computer. This Directive has been implemented differently, in various member states of the European Union, and national requirements to remain compliant with the respective laws may vary. Nevertheless, the provisions of this directive, whether effectively implemented in national laws, are now applicable in all the member states of the European Union and enforcement actions are now being considered by local data protection authorities. In
28
Table of Contents
Index to Financial Statements
addition, the European Union Commission, Parliament and Council have agreed on a new General Data Protection Regulation (GDPR) that is close to approval and which will take effect two years after that. The new draft General Data Protection Regulation will replace the currently applicable data protection framework. The GDPR will impose new requirements to an already very highly regulated area of Internet privacy in Europe. In addition, the GDPR will increase the likelihood of the applicability of European law to entities established outside the European Union but processing personal data of European data subjects. Countries outside of Europe are also increasingly focusing on data privacy legislation and regulation. Certain such legislative activity, such as data localization laws, could have an impact on our operations and how we do business.
European healthcare advertising laws stipulate several restrictions on advertising of drugs and medical devices to the public. In particular, in several countries, the advertising of prescription drugs to the general public is not allowed. Thus, these European countries require access restrictions for Websites that contain such advertisements, which are only allowed to be addressed to healthcare professionals. Accordingly, Websites in The WebMD Health Network that are addressed to physicians in specific European countries must be accessible only to healthcare professionals by an appropriate access check. If the applicable European competent authority does not acknowledge the respective Website to have appropriate access controls, the authority may require us to establish stricter access controls or ultimately may take action against us.
Data Security Regulation. With the publicity regarding data breaches resulting in improper dissemination of consumer information, many states have passed laws regulating the actions that a business must take if it experiences a data breach, such as prompt disclosure to affected customers. Generally, these laws are limited to electronic data and make some exemptions for smaller breaches. Congress has also been considering similar federal legislation relating to data breaches. The FTC and state attorneys general have also brought enforcement actions and prosecuted some data breach cases as unfair and/or deceptive acts or practices under the FTC Act and similar state laws. In addition to data breach notification laws, some states have enacted statutes and rules requiring businesses to reasonably protect certain types of personal information they hold or to otherwise comply with certain specified data security requirements for personal information. In Europe, the new General Data Protection Regulation will include new data breach notification and security requirements. These laws may apply directly to our business or indirectly by contract when we provide services to other companies. We intend to continue to endeavor to protect all consumer data and to comply with all applicable laws regarding the protection of this data.
Website Accessibility. The laws and regulations relating to Website accessibility for persons with disabilities are evolving. We monitor those laws and regulations and seek to comply with their requirements to the extent they apply to our business. Changes in those laws and regulations or new interpretations regarding their application may cause us to have to make changes to our Websites and could result in additional expense to us. However, we believe that it is important that our Websites be accessible by members of our audience who have disabilities and expect to continue our efforts to serve that portion of our audience.
CAN-SPAM Act. The Controlling the Assault of Non-Solicited Pornography and Marketing Act of 2003, or the CAN-SPAM Act, regulates commercial emails, provides a right on the part of the recipient to request the sender to stop sending messages, and establishes penalties for the sending of email messages that are intended to deceive the recipient as to source or content. Under the CAN-SPAM Act, senders of commercial emails (and other persons who initiate those emails) are required to make sure that those emails do not contain false or misleading transmission information. Commercial emails are required to include a valid return email address and other subject heading information so that the sender and the Internet location from which the message has been sent are accurately identified. Recipients must be furnished with an electronic method of informing the sender of the recipient’s decision to not receive further commercial emails. In addition, the email must include a postal address of the sender and notice that the email is an advertisement. We believe that our email practices comply with the requirements of the CAN-SPAM Act. Many states have also enacted anti-spam laws. The CAN-SPAM Act preempts many of these statutes. To the extent that these laws are not preempted, we believe that our email practices are designed to comply with these laws.
COPPA. The Children’s Online Privacy Protection Act, or COPPA, and associated rules promulgated by the FTC, applies to operators of commercial Websites and online services directed to U.S. children under the age of 13 that collect personal information from children, and to operators of general audience sites with actual
29
Table of Contents
Index to Financial Statements
knowledge that they are collecting information from U.S. children under the age of 13. Except for our fit.WebMD.com site, our sites are not directed at children and our general audience site, WebMD Health, states that no one under the applicable age is entitled to use the site. In addition, WebMD Health employs a kick-out procedure whereby users identifying themselves as being under the age of 13 during the registration process are not allowed to register for the site’s member only services, such as message boards and live chat events. Our fit.WebMD.com site is designed to comply with COPPA and we believe that that site and our other sites comply, where applicable, with the FTC’s COPPA rule.
FACTA. In an effort to reduce the risk of identity theft from the improper disposal of consumer information, Congress passed the Fair and Accurate Credit Transactions Act (or FACTA), which requires businesses to take reasonable measures to prevent unauthorized access to such information. FACTA’s disposal standards are flexible and allow businesses discretion in determining what measures are reasonable based upon the sensitivity of the information, the costs and benefits of different disposal methods and relevant changes in technology. We believe that we are in compliance with FACTA.
Telemarketing. The Telemarketing and Consumer Fraud Abuse Prevention Act (TCFAPA) and the Telephone Consumer Protection Act (TCPA) are laws that govern telemarketing and other calling activities. Both the FTC (via the Telephone Sales Rule) and the FCC have enacted rules under these statutes that implement the national do-not-call registry and which also apply to a broad range of other telephone calling activities, including as relevant to text message marketing and autodialed calls to cell phones. States also have their own telemarketing laws governing an array of telephone calling activities. We believe that we are in compliance with the TCFAPA, the TCPA, and state telemarketing laws.
Regulation of Wellness Incentive Programs
Certain provisions of HIPAA (commonly referred to as the HIPAA nondiscrimination provisions) generally prohibit group health plans from charging similarly situated individuals different premiums or contributions or imposing different deductible, co-payment, or other cost-sharing requirements based on a “health factor.” Such differentials are, however, acceptable under the HIPAA nondiscrimination provisions if the differentials are applied through “wellness programs.” The Department of Labor, in coordination with the Departments of the Treasury and HHS, has issued regulations (finalized in 2013) that define “wellness programs” for purposes of the HIPAA nondiscrimination provisions, establishing specific requirements for wellness programs that reward participants who satisfy a standard related to a health factor (referred to as “health-contingent wellness programs”) and for other types of wellness programs. These requirements for health-contingent wellness programs include (1) limiting the amount of the wellness program’s rewards, which the Affordable Care Act generally increased to 30% (50% for programs designed to prevent or reduce tobacco use) of the cost of coverage, (2) the wellness program being reasonably designed to promote good health and prevent disease, (3) giving those eligible to participate in the wellness program the opportunity to qualify for the reward at least once a year, (4) providing a reward that is available to all similarly situated individuals, and (5) requiring disclosure of reasonable alternative standards that must be available under the wellness program.
Although HIPAA and its regulations state that certain excepted benefits, including supplemental benefits, are not subject to the wellness program rules, it does not define the term “similar supplemental coverage.” On December 7, 2007, the Department of Labor, in coordination with the Departments of the Treasury and HHS, released Field Assistance Bulletin No. 2007-04 (FAB 2007-04) in response to the development of questionable health and wellness programs that were marketed as “similar supplemental coverage.” FAB 2007-04 clarifies the rules for supplemental programs and provides that supplemental benefits under a wellness program cannot discriminate on the basis of a health factor. With these requirements in place, wellness programs that require individuals to meet certain health factors can no longer be considered supplemental and thus have to comply with HIPAA wellness program regulations described in the immediately preceding paragraph. According to FAB 2007-04, programs that do not meet these requirements may be subject to enforcement actions. HHS provided parallel guidance in Program Memorandum 08-01 (May 2008).
The Americans with Disabilities Act (ADA) prohibits discrimination on the basis of an employee’s disability or perceived disability. Among other things, it limits employers from inquiring about the disabilities of
30
Table of Contents
Index to Financial Statements
employees unless the questions are job-related and consistent with business necessity. The ADA also limits the circumstances in which an employer may require physical examinations or answers to medical inquiries. However, the ADA allows employers to conduct voluntary medical examinations and activities, including voluntary medical histories, as part of a voluntary wellness program. A wellness program is “voluntary” if the employer neither requires participation nor penalizes employees who do not participate. Records acquired as part of a wellness program must be kept confidential and may not be used for a discriminatory purpose. Many states and localities provide similar protections to employees.
The Genetic Information Nondiscrimination Act restricts the collection or use of genetic information for underwriting purposes, and treats the offering of incentives or disincentives for completing an HRA or participating in a wellness program as underwriting. See “– Genetic Information Nondiscrimination Act (GINA)” above.
We provide services related to wellness programs in connection with our WebMD Health Services private portals and coaching services. See “WebMD Health Services – Our Private Portals” above. We believe that we are in compliance with the laws and regulations applicable to these services, to the extent they apply to us.
Medical Professional Regulation
The practice of most healthcare professions requires licensing under applicable state law, as well as under applicable national law of most European countries. In addition, the laws in some states and European countries prohibit business entities from practicing medicine, which is generally referred to as the prohibition against the corporate practice of medicine. We do not believe that we engage in the practice of medicine, and we have attempted to structure our Websites, strategic relationships and other operations to avoid violating these state licensing and professional practice laws. We do not believe that we provide professional medical advice, diagnosis or treatment. We employ and contract with physicians who provide only health information to consumers, and we have no intention to provide medical care or treatment. A state or other enforcement authority, however, may determine that some portion of our business violates these laws and may seek to have us discontinue those portions or subject us to penalties or licensure requirements. Any determination that we are a healthcare provider and acted improperly as a healthcare provider may result in liability to us.
Healthcare Reform
The Patient Protection and Affordable Care Act, as amended by the Health Care and Education Reconciliation Act of 2010 (which we refer to as the Affordable Care Act), was signed into law in March 2010. The Affordable Care Act made extensive changes to the system of healthcare insurance and benefits in the U.S. In general, the Affordable Care Act seeks to reduce healthcare costs and decrease the number of uninsured legal U.S. residents by, among other things, requiring individuals to carry, and certain employers to offer, health insurance or be subject to penalties. The Affordable Care Act also imposed new regulations on health insurers, including guaranteed coverage requirements, prohibitions on certain annual and all lifetime limits on amounts paid on behalf of or to plan members, increased restrictions on rescinding coverage, establishment of minimum medical loss ratio requirements, a requirement to cover certain preventive services on a first dollar basis, the establishment of state insurance exchanges and essential benefit packages, and greater limitations on how health insurers price certain of their products. The Affordable Care Act also contains provisions that will affect the revenues and profits of pharmaceutical and medical device companies, including new taxes on certain sales of their products.
Many of the provisions of the Affordable Care Act that expand insurance coverage did not become effective until 2014, and some will not become effective until later, and many provisions will require additional regulations and interpretive guidance to be issued before they will be fully implemented. Some provisions do not apply to health plans that were in place when the Affordable Care Act was enacted and have not been substantially changed since. It is difficult to foresee how individuals and businesses will respond to the choices available to them under the Affordable Care Act. Furthermore, the Affordable Care Act will result in future state legislative and regulatory changes, which we are unable to predict at this time, in order for states to comply with certain provisions of the Affordable Care Act and to participate in grants and other incentive opportunities. In addition, Congress has considered various proposals to repeal some or all of the Affordable Care Act, and multiple lawsuits challenging various provisions of the Affordable Care Act are pending in U.S. courts.
31
Table of Contents
Index to Financial Statements
While we do not currently anticipate any significant adverse effects on WebMD as a direct result of application of the Affordable Care Act to our business or on our company in its capacity as an employer, we are unable to predict what the indirect impacts of the Affordable Care Act will be on WebMD’s business through its effects on other healthcare industry participants, including pharmaceutical and medical device companies that are advertisers and sponsors of our public portals and employers and health plans that are clients of our private portals. Healthcare industry participants may respond to the Affordable Care Act or to uncertainties created by the Affordable Care Act by reducing their expenditures or postponing expenditure decisions, including expenditures for our services, which could have a material adverse effect on our business.
However, we believe that certain aspects of the Affordable Care Act and future implementing regulations that seek to reduce healthcare costs may create opportunities for WebMD, including with respect to our personal health record applications and health and benefits decision-support tools and, more generally, with respect to our capabilities in providing health and wellness information and education. For example, the Affordable Care Act encourages use of wellness programs through grants to small employers to establish such programs, permission for employers to offer larger rewards than under prior law in the form of waivers of cost-sharing, premium discounts, or additional benefits to employees for participating in these programs and meeting certain standards, and the inclusion of wellness services and chronic disease management among the essential health benefits that certain plans are required to provide. However, we cannot yet determine the scope of the opportunities that the Affordable Care Act may create or what competition we may face in our efforts to pursue such opportunities.
32
Table of Contents
Index to Financial Statements
OTHER INFORMATION
Employees
As of December 31, 2015, we had approximately 1,740 employees.
Intellectual Property
We use trademarks, trade names and service marks for our products and services, including those listed below the Table of Contents of this Annual Report. We also use other registered and unregistered trademarks and service marks for our products and services. In addition, we have registered domain names, including “webmd.com” and “medscape.com” and the other domain names listed in this Annual Report. If we are unable to protect our marks and domain names adequately, that could have a material adverse effect on our business and hurt us in establishing and maintaining our brands.
We rely upon a combination of patent, trade secret, copyright and trademark laws, license agreements, confidentiality procedures, employee and client nondisclosure agreements and technical measures to protect intellectual property used in our businesses. We also rely on a variety of intellectual property rights licensed from third parties, including Internet server software, databases and healthcare content used on our Websites and elsewhere in our business. These third-party licenses may not continue to be available to us on commercially reasonable terms. Our loss of or inability to maintain or obtain upgrades to any of these licenses could significantly harm us. In addition, because we license content from third parties, we may be exposed to copyright infringement actions if those parties are subject to claims regarding the origin and ownership of that content.
Seasonality
For a discussion of seasonality affecting our business, see “Management’s Discussion and Analysis of Financial Condition and Results of Operations – Seasonality” in Item 7 below.
Other
To the extent required by Item 1 of Form 10-K, the information contained in Item 7 of this Annual Report is hereby incorporated by reference in this Item 1.
33
Table of Contents
Index to Financial Statements
| Item 1A. | Risk Factors |
This section describes circumstances or events that could have a negative effect on our financial results or operations or that could change, for the worse, existing trends in some or all of our businesses. The occurrence of one or more of the circumstances or events described below could have a material adverse effect on our financial condition, results of operations and cash flows or on the trading prices of our Common Stock and Convertible Notes or of securities that we may issue in the future. The risks and uncertainties described in this Annual Report are not the only ones facing us. Additional risks and uncertainties that are not currently known to us, or that we currently believe are immaterial, may also adversely affect our business and operations.
Risks Related to Our Operations and the Healthcare Content We Provide
If we are unable to provide content and services that attract users to The WebMD Health Network on a consistent basis, our advertising and sponsorship revenue could be reduced
Users of The WebMD Health Network have numerous other online and offline sources of healthcare information and related services. Our ability to compete for user traffic on our public portals depends upon our ability to make available a variety of health, wellness and medical content, decision-support applications and other services that meet the needs of a variety of types of users, including consumers, physicians and other healthcare professionals, with a variety of reasons for seeking information. Our ability to do so depends, in turn, on:
| • | our ability to hire and retain qualified authors, journalists and independent writers and healthcare professionals; |
| • | our ability to license quality content from third parties; and |
| • | our ability to monitor and respond to increases and decreases in user interest in specific topics. |
If consumers and healthcare professionals do not perceive our content, applications and tools to be useful, reliable and trustworthy, we may not be able to attract or retain users or otherwise maintain or increase the frequency and duration of their engagement with our health information services. We cannot assure you that we will be able to continue to develop or acquire needed content, applications and tools at a reasonable cost. In addition, since consumer users of our public portals may be attracted to The WebMD Health Network as a result of a specific condition or for a specific purpose, it is difficult for us to predict the rate at which they will return to our public portals. Because we generate revenue by, among other things, selling sponsorships of specific pages, sections or events on The WebMD Health Network, a decline in user traffic levels or a reduction in the number of pages viewed by users could cause our advertising and sponsorship revenue to decrease and could have a material adverse effect on our results of operations. However, overall traffic to The WebMD Health Network does not have a direct correlation to our advertising and sponsorship revenue, which can continue to grow even if overall traffic were to remain constant or go down. Our ability to generate advertising and sponsorship revenue depends primarily on our ability to create content on specific topics and to program various parts of The WebMD Health Network to build and maintain traffic in areas most important to both our audience and our advertising and sponsorship clients. If we unable to do that, our advertising and sponsorship revenue could decrease even if our overall traffic remains the same or increases.
A significant portion of the traffic to The WebMD Health Network is directed to us through algorithmic search results on Internet search engines and, if we are listed less prominently in search result listings or our traffic from search is otherwise reduced, our business and operating results could be harmed
A significant portion of the traffic to The WebMD Health Network is directed to us through the algorithmic search results on Internet search engines. In addition to providing quality content and tools, we seek to produce and deliver our content and tools in ways that will cause them to rank well in algorithmic search engine results, which makes it more likely that search engine users will visit our Websites. This is commonly referred to as search engine optimization, or SEO. However, there can be no assurance that our SEO efforts will succeed in improving the ranking of our content or, even if they do result in such improvement, that the improved ranking
34
Table of Contents
Index to Financial Statements
will result in increased numbers of users and page views for our Websites. In addition, search engines frequently change the criteria that determine site rankings in their search results or make other changes and our SEO efforts may not be successful if we do not respond to those changes appropriately and on a timely basis. Search engine providers may also prioritize search results generated by certain types of queries, including health-related queries, based on criteria they select, which could, in some circumstances, reduce the ranking that would otherwise be provided to our Websites and increase the ranking of other sites. If we are unable to respond effectively to changes made by search engine providers in their algorithms and other processes or to respond effectively to other factors and challenges that may impair our ability to attract traffic through search, a substantial decrease in traffic to The WebMD Health Network could occur, which could cause our revenue to decrease and could have a material adverse effect on our results of operations. We cannot predict if, or how long, efforts to improve SEO or otherwise increase traffic may take to mitigate any such declines.
Search engine providers also typically display, together with algorithmic search results, content and links that may divert traffic from the pages referenced in the algorithmic search results, including: advertisements that are presented with the algorithmic search results for which the search engine provider receives compensation (sometimes referred to as paid search results); and content and links that the search engine provider selects and displays in response to the specific search queries in a format determined by the search engine provider. Accordingly, even if we rank highly in algorithmic search results, traffic to our Websites may be reduced as a result of the paid search results and other content included on the search results page generated by a search query. We cannot control the amount, quality or presentation of such paid search results and other content and, accordingly, we cannot predict any reductions in our traffic that may occur from time to time as search engine providers make changes in their policies and procedures regarding paid search results or regarding content they provide. In addition, to the extent that there is a reduction in the total volume of health-related searches on Internet search engines, traffic to The WebMD Health Network could also be reduced and we may have little or no ability to take steps to mitigate the effect on our traffic. In addition, we have experienced in the past, and may experience in the future, declines in traffic to The WebMD Health Network from search for reasons that we are unable to identify. Any resulting reduction in our traffic for any of the reasons described above, if significant, could cause our revenue to decrease and could have a material adverse effect on our results of operations.
If we fail to implement and maintain successful monetization strategies for smartphone traffic, our financial results could be adversely affected
The number of people, including the number of physicians and other healthcare professionals, who access online content and services through smartphones, tablets and other mobile devices has increased rapidly and is expected to continue to increase. Although monetization of tablet page views is generally similar to monetization of PC page views, the monetization of smartphone page views is more challenging because of the smaller screen size. If users access our services through smartphones as a substitute for access through personal computers and tablets (or if our page views from personal computers and tablets decline significantly for other reasons) and we are unable to maintain successful monetization strategies for smartphone traffic, our financial results could be negatively affected. In addition, it is difficult to predict the problems we may encounter in developing and maintaining competitive mobile services and related mobile monetization strategies, and we may need to devote significant resources to their creation, maintenance and support.
We face significant competition for our healthcare information products and services
The markets for healthcare information products and services are intensely competitive, continually evolving and, in some cases, subject to rapid change.
| • | The WebMD Health Network faces competition from numerous other companies, both in attracting users and in generating revenue from advertisers and sponsors. We compete for users with Websites and mobile applications that provide health-related information, including both commercial ones and not-for-profit ones. We compete for advertisers and sponsors with: health-related Websites and mobile applications; general interest consumer Websites that offer specialized health sub-channels or functions; other |
35
Table of Contents
Index to Financial Statements
| high-traffic Websites that include both healthcare-related and non-healthcare-related content and services, including social media Websites; search engines that provide specialized health search capabilities; and advertising networks that aggregate traffic from multiple sites. The WebMD Health Network also faces competition from: traditional media and offline publications and information services; and manufacturers and distributors of activity trackers, heart rate monitors, blood pressure monitors and similar devices relating to health and wellness that can download data to a PC, tablet or smartphone, as well as numerous other companies developing applications and tools for use with those devices. |
| • | Our WebMD Health Services private portals and coaching services compete with: providers of decision-support and transparency tools that assist in evaluating health insurance coverage options and healthcare provider and treatment options; and online health management applications, including personal health records; wellness and disease management vendors; and competing services provided by health insurance companies, employee benefits services companies, and their affiliates. Employers may also decide to develop similar solutions for their own populations rather than obtaining solutions from WebMD Health Services or its competitors. |
Many of our competitors have greater financial, technical, product development, marketing and other resources than we do. These organizations may be better known than we are and may have more customers or users than we do. We cannot provide assurance that we will be able to compete successfully against these organizations. In addition, we expect that competitors will continue to enter these markets. The competition we face for our services may result in fewer or smaller customer commitments or pressure to reduce prices, which could reduce our profit margins.
Developing and implementing new and updated features and services may be more difficult than expected and may not result in sufficient increases in revenue to justify the costs
Attracting and retaining users of our public portals and our mobile applications and clients for our private portals requires us to continue to improve the technology underlying those portals and applications and to continue to develop new and updated features and services for those portals and applications. If we are unable to do so on a timely basis or if we are unable to implement new features and services without disruption to our existing ones, we may lose potential users and clients. For example, we are in the process of working to enable users to more easily discover, share and interact with content from WebMD not just on our Websites but also in other online locations and, in support of this initiative, we are creating new content offerings tailored for specific social networks and platforms and building our capabilities to create video content. If we are not successful in creating content offerings that support this initiative, our ability to compete for advertising and sponsorship revenue may be reduced. Even if we are successful in creating such content offerings and users respond favorably, there can be no assurance that we will be able to adequately monetize audience usage of such content or to drive sufficient traffic to our own Websites to make this initiative profitable.
We rely on a combination of internal development, strategic relationships, licensing and acquisitions to develop our portals, mobile applications and related features and services. Our development and/or implementation of new technologies, features and services may cost more than expected, may take longer than originally expected, may require more testing than originally anticipated and may require the acquisition of additional personnel and other resources. There can be no assurance that the revenue opportunities from any new or updated technologies, applications, features or services will justify the amounts spent.
Failure to effectively identify, assess and pursue new business initiatives could adversely affect our company and its prospects
We are working to broaden our portfolio of services and taking steps to diversify our client base and revenue streams. The development of new products and services in response to evolving trends in healthcare and evolving technologies for Internet-based and mobile services, as well as the identification of new business opportunities in this dynamic environment, requires significant time and resources. We may not be able to respond quickly enough or in a cost-effective manner, appropriately time the introduction of new products and services to the market or identify new business opportunities in a timely manner. In addition, while evolving technologies may offer new opportunities, they may also present additional challenges, including challenges relating to security and privacy.
36
Table of Contents
Index to Financial Statements
Some of the business initiatives we are working on have challenges that are different from those associated with our existing products and services and could strain our financial, operational and management resources. Furthermore, there can be no assurance that the potential revenue streams from any investments that we may make in pursuing new business opportunities will justify the amounts spent. Failure to effectively identify, assess and pursue new business initiatives may adversely affect our company and its prospects.
Failure to continue to enhance the analytic capabilities we use to demonstrate the value of our services to advertisers and sponsors could adversely affect our ability to market our services
We continue to work to enhance the analytic capabilities we use to demonstrate to advertisers and sponsors how promotional strategies implemented through The WebMD Health Network impact physician and consumer behaviors and preferences. Our ability to demonstrate the value of advertising and sponsorship on The WebMD Health Network will depend, in part, on our ability to develop accurate and reliable analytics and measurement capabilities and to continue to improve such capabilities. If we are unable to continue to enhance our analytic capabilities, it could adversely affect our ability to market our services or to satisfy client expectations and commitments that rely on analytics to measure performance and, as a result, we may lose business to competitors even if our advertising and sponsorship services are superior to theirs.
Restrictions on our ability to access or use various forms and sources of data could adversely impact our business
We are increasingly using data analytics based on information that we collect regarding usage of our public portals, as well as other third party sources of data. Our use of data regarding users of our public portals is governed by the privacy policies posted on those sites and is designed to comply with applicable laws and regulations as is our use of any third-party data. In addition, we sell certain information products and services on a stand-alone basis using de-identified data that we license from a small number of third party data sources, of which the principal source is a license retained by HLTH Corporation in connection with the sale of its Emdeon Business Services (EBS) business. As the successor to HLTH, we received this license, which provides us the rights to certain de-identified data from the operation of the EBS business (which is now known as Change Healthcare) through early February 2018 for use in the development and commercialization of various information products and services as to which we pay Change Healthcare a royalty. To date, these stand-alone information products and services do not include any data derived from the operation of our Websites. We are seeking to acquire additional third-party data sources and to develop data generated from our Website operations in order to strengthen and diversify our data product offerings. Revenue from the stand-alone products and services that utilize data under the current Change Healthcare license is highly profitable and is recorded net of royalties and commissions paid by us to Change Healthcare or others. We do not expect that the current license agreement with Change Healthcare will continue after February 2018, and expect if such agreement is renewed or is replaced with new third party data sources, the terms of any such renewal or replacement license would not be as favorable to us as those in the current agreement. Accordingly, we cannot provide any assurance that the sales of, or the profits generated by, our stand-alone information products would not be materially adversely affected by the expiration of our license agreement with Change Healthcare. To date, we have not used data we license from Change Healthcare to support our current advertising business.
Changes to our ability to access or use data could adversely affect our ability to implement improved analytics or to offer information products on a stand-alone basis. Accordingly, our business could be adversely impacted if, for any reason (including, but not limited to, changes in applicable laws and regulations) the data we use becomes unavailable or the conditions on its availability are not commercially reasonable or are inconsistent with our planned usage. In addition, the quality of our data analytics depends on the reliability of the information that we are able to obtain. If the information we use contains errors or is otherwise unreliable, analyses we create and actions we take based on those analyses could be wrong, which could hurt our reputation and business.
Failure to maintain and enhance the “WebMD” and “Medscape” brands and our other brands could have a material adverse effect on our business
We believe that the “WebMD” and “Medscape” brand identities that we have developed have contributed to the success of our business and have helped us achieve recognition as a trusted source of health and wellness
37
Table of Contents
Index to Financial Statements
information and tools for consumers and of online content for physicians and other healthcare professionals. We also believe that maintaining and enhancing those brands is important to expanding the user base for our public portals and to our relationships with sponsors and advertisers. The “WebMD” brand is also important to our ability to gain additional employer and healthcare payer clients for our private portals. We have expended considerable resources on establishing and enhancing the “WebMD” and “Medscape” brands and our other brands, and we have developed policies and procedures designed to preserve and enhance our brands, including editorial procedures designed to provide quality control of the information we publish. We expect to continue to devote resources and efforts to maintain and enhance our brands. However, we may not be able to successfully maintain or enhance our brands, and events outside of our control may have a negative effect on our brands. If we are unable to maintain or enhance our brands, and do so in a cost-effective manner, our business could be adversely affected.
The markets we participate in are relatively new and continue to change
We participate in relatively new markets. These markets, and our business, have undergone significant changes during their short history and can be expected to continue to change. Many companies with business plans based on providing healthcare information and related services online and through mobile platforms have failed to be profitable and some have filed for bankruptcy or ceased operations. Even if demand from users exists, we cannot assure you that our business will be profitable.
Because our public portals participate in relatively new markets, the standards that our advertising and sponsorship clients apply to our services continue to evolve, including standards for ad delivery, placement and frequency and for measuring the effectiveness of our services as compared to other alternatives available to our clients. Our ability to meet such standards as they change in the future will be important to our ability to compete for business and we cannot provide assurance that we will be able to do so or estimate what the costs for doing so may be. For example, standards are continuing to evolve in the online advertising marketplace regarding the viewability of online advertising, or the length of time an advertisement is visible to a user as determined by a third party verification source. We cannot predict how the requirements of advertisers will continue to evolve. If we fail to meet the standards that our advertisers require, our advertising revenues could be reduced.
Our failure to attract and retain qualified executives and employees may have a material adverse effect on our business
Our business depends largely on the skills, experience and performance of key members of our management team and other key employees. We also depend, in part, on our ability to attract and retain qualified writers and editors, software developers and other technical personnel, healthcare professionals, and sales and marketing personnel. Competition for qualified personnel in the healthcare information services and Internet industries is intense. We cannot assure you that we will be able to hire or retain a sufficient number of qualified personnel to meet our requirements, or that we will be able to do so at costs that are acceptable to us. Failure to do so may have an adverse effect on our business.
Our advertising and sponsorship revenue may vary significantly from quarter to quarter and its amount and timing may be subject to factors beyond our control, including regulatory changes
Our advertising and sponsorship revenue may vary significantly from quarter to quarter due to a number of factors, many of which are not within our control, and some of which may be difficult to forecast accurately, including potential effects on demand for our services as a result of regulatory changes affecting advertising and promotion of drugs and medical devices and general economic conditions. The majority of our advertising and sponsorship programs are for terms of approximately four to twelve months. We have relatively few longer term advertising and sponsorship programs. We cannot assure you that our current advertisers and sponsors will continue to use our services beyond the terms of their existing contracts or that they will enter into any additional contracts.
The time between the date of initial contact with a potential advertiser or sponsor regarding a specific program and the execution of a contract with the advertiser or sponsor for that program, as well as the additional time period before our services are delivered, may be longer than expected, especially for medium-sized and larger contracts, and may be subject to delays over which we have little or no control, including as a result of
38
Table of Contents
Index to Financial Statements
budgetary constraints of the advertiser or sponsor or their need for internal approvals, including internal approvals relating to compliance with the laws and regulations applicable to the marketing of healthcare products. We have experienced, from time to time, a lengthening of this internal review process by pharmaceutical and biotechnology companies, which has resulted in delays in contracting as well as delays in recognizing expected revenue under executed contracts and which may continue to cause such delays. Other factors that could affect the timing of contracting for specific programs with advertisers and sponsors, or receipt of revenue under such contracts, include the timing of:
| • | U.S. Food and Drug Administration (FDA) approval for new products or for new approved uses for existing products; |
| • | any adverse determinations by the FDA affecting products previously approved or expected to be approved or the permitted uses of such products or their marketing; |
| • | FDA approval of generic products that compete with existing brand name products and any increase in the number or significance of such approvals; |
| • | recalls, withdrawals or shortages of products from the market; |
| • | consolidation of companies in the pharmaceutical and biotechnology industries; |
| • | rollouts of new or enhanced services on our public portals; |
| • | seasonal factors relating to the prevalence of specific health conditions and other seasonal factors that may affect the timing of promotional campaigns for specific products; and |
| • | the scheduling of conferences for physicians and other healthcare professionals. |
Some of our pharmaceutical company customers have experienced patent expirations for certain of their products in the past several years and some are expected to experience patent expirations over the next several years. In the pharmaceutical industry, patent expirations allow for competition from lower-priced generic versions of the patented drugs and generally result in the termination of marketing efforts for the drug. In addition, expirations of patents that result in a significant reduction in revenue for a pharmaceutical company can lead to reductions in their advertising and sponsorship expenditures for other drugs in their product portfolios or for their entire product portfolio.
Applications and other software that can block advertisements could reduce demand for our advertising and sponsorship products and decrease our revenue
We derive a significant portion of our revenue from advertising and sponsorship on The WebMD Health Network. Applications and software are available that can block or obscure the display of advertisements or block the cookies used to deliver such advertisements, or shift the location in which advertising appears on pages. While the use of ad-blocking programs by visitors to The WebMD Health Network has been limited to date and our audience consists primarily of individuals who have not typically adopted ad-blocking programs so far, if these programs gain acceptance among our users in the future, they could reduce our ability to deliver advertisements to our audience which, in turn, could reduce demand for our advertising and sponsorship products and cause our revenue from those products to decrease.
Mergers and acquisitions among our clients may reduce the volume of our services purchased by the consolidated company following such a transaction, which could harm our operating results
Mergers and acquisitions among our pharmaceutical, biotechnology and medical device company clients have in the past and could in the future reduce the number of our clients and potential clients. Similarly, mergers and acquisitions among health insurance company clients of our WebMD Health Services private portals could reduce the number of those clients. In addition, when companies consolidate, the number of vendors used for services, or the amount spent, by the separate companies may be reduced by the consolidated entity and some vendors and services may no longer be used at all. Any such event could have a negative effect on our revenue and profitability and we cannot provide assurance that we would be able to mitigate any such negative effect.
39
Table of Contents
Index to Financial Statements
We may be unsuccessful in our efforts to generate advertising and sponsorship revenue from consumer products companies
Much of our advertising and sponsorship revenue has, in the past, come from pharmaceutical, biotechnology and medical device companies. We also seek to generate advertising and sponsorship revenue from consumer products companies that are interested in communicating health-related or safety-related information about their products to our audience. However, while many consumer products companies are increasing the portion of their promotional spending used on the Internet, we cannot assure you that these advertisers and sponsors will find our consumer Websites to be as effective for promoting their products and services as competing channels, which include traditional media, Internet search engines, social media Internet sites, general interest consumer sites, and numerous other alternatives. Competition for this business may also result in smaller customer commitments or pressure to reduce prices, both of which could reduce our profit margins even if we are able to generate revenue.
In addition, revenues from consumer products companies are more likely to reflect general economic conditions, and to be reduced to a greater extent during economic downturns, than revenues from pharmaceutical, biotechnology and medical device companies. Accordingly, revenues from this portion of our business may be subject to significant quarter-to-quarter variations and we may be unsuccessful in our efforts to develop it further.
Lengthy sales and implementation cycles for our WebMD Health Services private online portals make it difficult to forecast our revenues from these applications and may have an adverse impact on our results of operations
The period from our initial contact with a potential client for a private online portal and entry into a contract for a subscription to our solution by the client is difficult to predict. In the past, this period has generally ranged from six to twelve months, but in some cases has been longer. Potential contracts may be subject to delays or cancellations due to a client’s internal procedures for approving large expenditures and other factors beyond our control, including the effect of general economic conditions on the willingness of potential clients to subscribe to our WebMD Health Services solution. The time it takes to implement a private online portal is also difficult to predict and has lasted as long as six months from contract execution to the commencement of live operation. Implementation may be subject to delays based on the availability of the internal resources of the client that are needed and other factors outside of our control. As a result, we have limited ability to forecast the timing of revenue from new clients. This, in turn, makes it more difficult to forecast our financial performance for future periods. In addition, some of our client contracts may permit termination, by the client, prior to the end of the stated contract term, which can also make it more difficult to forecast our future financial performance.
During the contracting cycle and the implementation period, we may expend substantial time, effort and money preparing contract proposals, negotiating contracts and implementing our population health management platform without receiving any related revenue. In addition, many of the expenses related to providing our platform are relatively fixed in the short term, including personnel costs and technology and infrastructure costs. If our private portal services revenue is lower than expected, we may not be able to reduce related short-term spending in response. Any shortfall in such revenue would have a direct impact on our results of operations.
Our ability to renew existing agreements with employers and health plans will depend, in part, on our ability to continue to increase usage of our private portal services by their employees and plan members
In a healthcare market where a greater share of the responsibility for healthcare costs and decision-making has been shifting to consumers, use of information technology (including personal health records) to assist consumers in making informed decisions about healthcare has also increased. We believe that through our WebMD Health Services private online portals as well as our telephonic, online and onsite health and wellness coaching programs and our targeted condition management programs, we are well positioned to play a role in this environment. However, our strategy depends, in part, on increasing usage of our services by our employer and health plan clients’ employees and plan participants and being able to demonstrate a sufficient return on investment and other benefits for our clients from those services. Increasing usage of our private portal services requires us to continue to develop new and updated applications, features and services. In addition, there are numerous competitors for the services we provide, many of which have greater financial, technical, product
40
Table of Contents
Index to Financial Statements
development, marketing and other resources than we do, and may be better known than we are. We cannot provide assurance that we will be able to meet our development and implementation goals or that we will be able to compete successfully against other vendors offering competitive services and, if we are unable to do so, we may experience static or diminished usage for our private portal services and possible non-renewals of our customer agreements.
The condition management programs that we provide to clients of our WebMD Health Services private portals involve risk and challenges with which we have limited experience and may not be profitable
We provide condition management services to clients of our WebMD Health Services private portals and plan to continue to expand that portion of our business. Our current offerings include programs targeting individuals struggling with coronary artery disease, congestive heart failure, diabetes, chronic obstructive pulmonary disease and asthma. Our condition management programs include ongoing, intensive one-on-one coaching by condition specialists, along with targeted online resources and progress tracking tools. Providing condition management services involves new risks and challenges for us, including: potential requirements to obtain and retain licenses, permits and regulatory clearances and approvals related to these services; difficulty in quantifying the costs savings and other benefits for our clients from these services; and difficulty in differentiating our condition management services from those of competitors, some of whom may be able to provide such services at a lower cost. We cannot predict the demand among our existing private portals clients and other potential clients for our condition management services and cannot provide assurance that the revenue opportunities from providing our current offerings or ones for additional conditions will justify the costs involved in maintaining or developing the required capabilities and delivering the services to clients.
Contractual relationships with governmental customers may impose special burdens on us and provide special benefits to those customers, including the right to change or terminate the contract in response to budgetary constraints or policy changes
A portion of our revenues come from customers that are governmental agencies or vendors to such agencies. Government contracts and subcontracts may be subject to some or all of the following:
| • | termination when appropriated funding for the current fiscal year is exhausted or becomes unavailable; |
| • | termination for the governmental customer’s convenience, subject to a negotiated settlement for costs incurred and profit on work completed, along with the right to place contracts out for bid before the full contract term, as well as the right to make unilateral changes in contract requirements, subject to negotiated price adjustments; |
| • | “most-favored” pricing disclosure requirements that are designed to ensure that the government can negotiate and receive pricing akin to that offered commercially and requirements to submit proprietary cost or pricing data to ensure that government contract pricing is fair and reasonable; |
| • | commercial customer price tracking requirements that require contractors to monitor pricing offered to a specified class of customers and to extend price reductions offered to that class of customers to the government; |
| • | reporting and compliance requirements related to, among other things: equal employment opportunity, affirmative action for veterans and for workers with disabilities, and accessibility for the disabled; |
| • | broader audit rights than we would usually grant to non-governmental customers; and |
| • | specialized remedies for breach and default or failure to meet service level commitments, including setoff rights, retroactive price adjustments, and civil or criminal fraud penalties, as well as mandatory administrative dispute resolution procedures instead of state contract law remedies. |
In addition, certain violations of federal law may subject government contractors to having their contracts terminated and, under certain circumstances, suspension and/or debarment from future government contracts.
41
Table of Contents
Index to Financial Statements
Expansion to markets outside the United States subjects us to additional risks
One element of our growth strategy is to seek to expand our online services to markets outside the United States. In certain markets outside the United States, we expect to accomplish this through partnerships or joint ventures with other companies having expertise in the specific country or region, while in other such markets we expect to rely primarily on our own internal resources. In certain markets outside of the United States, we are providing some of our online services in the local language directly to healthcare professionals. We also provide our online services in English to healthcare professionals outside the United States. Our participation in international markets is subject to certain risks beyond those applicable to our operations in the United States, such as:
| • | challenges caused by cultural differences; |
| • | difficulties in staffing and managing operations from a distance; |
| • | uncertainty regarding liability for services and content; |
| • | potential burdens of complying with a wide variety of legal, regulatory and market requirements, as well as uncertainty as to the applicability of non-U.S. laws to operations based in the United States and regarding the interpretation of such laws by local authorities; |
| • | potential regulation or interpretation of existing regulation that could limit or eliminate our ability to distribute one or more of our products in one or more countries; |
| • | variability of economic and political conditions, including the extent of the impact of adverse economic conditions in markets outside the United States; |
| • | tariffs or other trade barriers; |
| • | fluctuations in currency exchange rates; |
| • | potentially adverse tax consequences, including restrictions on repatriation of earnings; and |
| • | difficulties in protecting intellectual property. |
In addition, outside the United States, we face competition from locally-based companies that have experience doing business in their home countries or regions and familiarity with local business practices, customs and laws and, as a result, generally do not face, or are better positioned to face, the risks described above.
Risks Related to the Internet and Our Technological Infrastructure
Any service interruption or failure in the systems that we use to provide online portals and other services could harm our business
Our online portals and other services are designed to operate 24 hours a day, seven days a week, without interruption. However, we have experienced and expect that we will in the future experience interruptions and delays in services and availability from time to time. We rely on internal systems as well as third-party vendors, including data center providers, bandwidth providers and mobile carriers, to provide our online portals and other services. We may not maintain redundant systems or facilities for some of these services. In the event of a catastrophic event with respect to one or more of these systems or facilities, we may experience an extended period of system unavailability, which could negatively impact our relationship with users. In addition, system failures may result in loss of data, including user registration data, business intelligence data, content, and other data critical to the operation of our online portals and other services, which could cause significant harm to our business and our reputation.
To operate without interruption or loss of data, both we and our service providers must guard against:
| • | damage from fire, power loss and other natural disasters; |
| • | communications failures; |
| • | software and hardware errors, failures and crashes; |
42
Table of Contents
Index to Financial Statements
| • | security breaches, computer viruses, distributed denial-of-service (DDOS) attacks and similar disruptive problems; and |
| • | other potential service interruptions. |
Any disruption in the network access or co-location services provided by third-party providers to us or any failure by these third-party providers or our own systems to handle current or higher volume of use could significantly harm our business. We exercise little control over these third-party vendors, which increases our vulnerability to problems with services they provide. Any errors, failures, interruptions or delays experienced in connection with these third-party technologies and information services or our own systems could negatively impact our relationships with users and adversely affect our brand and our business and could expose us to liabilities to third parties. Although we maintain insurance for our business, the coverage under our policies may not be adequate to compensate us for all losses that may occur. In addition, we cannot provide assurance that we will continue to be able to obtain adequate insurance coverage at an acceptable cost.
Failure to update our technology infrastructure could adversely affect our business
Evolving technologies could require us to modify our technology infrastructure and any failure to do so on a timely basis may limit the types of services we can provide or the quality of those services, and may put us in a weaker position relative to our competitors. Competitors with newer technology infrastructure may also have greater flexibility and be in a position to respond more quickly than us to new opportunities, which may impact our competitive position in certain markets and adversely affect our business.
Implementation of updates to our technology infrastructure may result in performance problems and may not provide the additional functionality that was expected
From time to time, we implement additions to or changes in the hardware and software platforms we use for providing our online portals and other services. During and after the implementation of additions or changes, a platform may not perform as expected, which could result in interruptions in operations, an increase in response time or an inability to track performance metrics. In addition, in connection with integrating acquired businesses, we may move their operations to our hardware and software platforms or make other changes, any of which could result in interruptions in those operations. Any significant interruption in our ability to operate any of our online portals and other services could have an adverse effect on our relationships with users and clients and, as a result, on our financial results. We rely on a combination of purchasing, licensing, internal development, and acquisitions to develop our hardware and software platforms. Our implementation of additions to or changes in these platforms may cost more than originally expected, may take longer than originally expected, and may require more testing than originally anticipated. In addition, we cannot provide assurance that additions to or changes in these platforms will provide the additional functionality and other benefits that were originally expected.
If the systems we use to provide online portals and other services experience security breaches or are otherwise perceived to be insecure, our business could suffer
We retain and transmit confidential information, including personal health records, in the processing centers and other facilities we use to provide online portals and other services. It is critical that these facilities and infrastructure remain secure and be perceived by the marketplace as secure. A security breach could damage our reputation or result in liability. We may be required to expend significant capital and other resources to protect against security breaches and hackers or to alleviate problems caused by breaches. Despite the implementation of security measures, this infrastructure or other systems that we interface with, including the Internet and related systems, may be vulnerable to physical break-ins, hackers, improper employee or contractor access, computer viruses, programming errors, denial-of-service attacks or other attacks by third parties or similar disruptive problems. Because the techniques used by hackers to sabotage or to obtain unauthorized access to computer systems change frequently, we may be unable to anticipate specific types of attacks or to implement adequate preventative measures. If an actual or perceived breach of our security occurs, the market perception of the effectiveness of our security measures could be harmed and we could lose users, customers, advertisers or publishers. Any compromise of our security, whether as a result of breaches or failures of our own systems or the systems with which they interface, could reduce demand for our services and could subject us to legal claims from our clients and users, including for breach of contract or breach of warranty.
43
Table of Contents
Index to Financial Statements
Our online services are dependent on the development and maintenance of the Internet infrastructure
Our ability to deliver our online services is dependent on the development and maintenance of the infrastructure of the Internet by third parties. The Internet has experienced a variety of outages and other delays as a result of damages to portions of its infrastructure, and it could face outages and delays in the future. The Internet has also experienced, and is likely to continue to experience, significant growth in the number of users and the amount of traffic. If the Internet continues to experience increased usage, the Internet infrastructure may be unable to support the demands placed on it. In addition, the reliability and performance of the Internet may be harmed by increased usage or by denial-of-service attacks. Any resulting interruptions in our services or increases in response time could, if significant, result in a loss of potential or existing users of and advertisers and sponsors on our Websites and, if sustained or repeated, could reduce the attractiveness of our services.
Customers who utilize our online services depend on Internet service providers and other Website operators for access to our Websites. Many of these providers have experienced significant outages in the past and they could experience outages, delays and other difficulties in the future due to system failures unrelated to our systems. Any such outages or other failures on their part could reduce traffic to our Websites.
Third parties may challenge the enforceability of our online agreements
The law governing the validity and enforceability of online agreements and other electronic transactions is evolving. We could be subject to claims by third parties that the online terms and conditions for use of our Websites, including disclaimers or limitations of liability, are unenforceable. A finding by a court that these terms and conditions or other online agreements are invalid could harm our business.
We could be subject to breach of warranty or other claims by clients of our online portals and other services if the software and systems we use to provide them contain errors or experience failures
Errors in the software and systems we use could cause serious problems for clients of our online portals and other services. We may fail to meet contractual performance standards or client expectations. Clients of our online portals and other services may seek compensation from us or may seek to terminate their agreements with us, withhold payments due to us, seek refunds from us of part or all of the fees charged under those agreements or initiate litigation or other dispute resolution procedures. In addition, we could face breach of warranty or other claims by clients, or additional development costs. Our software and systems are inherently complex and, despite testing and quality control, we cannot be certain that they will perform as planned.
We attempt to limit, by contract, our liability to our clients for damages arising from our negligence, errors or mistakes. However, contractual limitations on liability may not be enforceable in certain circumstances or may otherwise not provide sufficient protection to us from liability for damages. We maintain liability insurance coverage, including coverage for errors and omissions. However, it is possible that claims could exceed the amount of our applicable insurance coverage, if any, or that this coverage may not continue to be available on acceptable terms or in sufficient amounts. Even if these claims do not result in liability to us, investigating and defending against them would be expensive and time consuming and could divert management’s attention away from our operations. In addition, negative publicity caused by these events may delay or hinder market acceptance of our services, including unrelated services.
Risks Related to the Healthcare Industry, Healthcare Regulation and Internet Regulation
Developments in the healthcare industry could adversely affect our business
Our business could be adversely impacted by changes in the structure of the healthcare industry and other changes that reduce healthcare spending. We are particularly dependent on pharmaceutical, biotechnology and medical device companies for our advertising and sponsorship revenue. General reductions in expenditures by healthcare industry participants could result from, among other things:
| • | changes in government regulation or private initiatives that affect the manner in which healthcare industry participants interact with patients, payers (including governmental payers) or other healthcare industry |
44
Table of Contents
Index to Financial Statements
| participants, including any such regulations or initiatives that seek to control the pricing or means of delivery of healthcare products and services or that create restrictions on the advertising or promotion of healthcare products and services; |
| • | consolidation of healthcare industry participants; |
| • | reductions in governmental funding for healthcare; and |
| • | adverse changes in business or economic conditions affecting healthcare payers or providers, pharmaceutical, biotechnology or medical device companies or other healthcare industry participants. |
Even if overall expenditures by industry participants remain the same or increase, developments in the healthcare industry may result in reduced spending in some or all of the specific market segments that we serve or are planning to serve. For example, use of our products and services could be affected by:
| • | changes in the design of health insurance plans or governmental programs that pay for healthcare products and services; |
| • | the timing of FDA, or European or other national regulatory authority, approvals of generic products that compete with existing brand name products and any increase in the number or significance of such approvals or of withdrawals of brand name products from the market; |
| • | the timing of FDA, or European or other national regulatory authority, approvals for new products or for new approved uses for existing products and any decrease in the number or significance of new drugs or medical devices coming to market or new approved uses for existing such products; and |
| • | decreases in marketing expenditures by pharmaceutical or medical device companies, including as a result of governmental regulation or private initiatives that discourage, restrict or prohibit advertising, sponsorship or educational activities by pharmaceutical or medical device companies or that discourage, restrict or prohibit their use of online services for some or all such activities. |
In addition, our customers’ expectations regarding pending or potential industry developments may also affect their budgeting processes and spending plans with respect to products and services of the types we provide.
The healthcare industry has changed significantly in recent years, and we expect that significant changes will continue to occur. However, the timing and impact of developments in the healthcare industry are difficult to predict. We cannot assure you that the markets for our products and services will continue to exist at current levels or that we will have adequate technical, financial and marketing resources to react to changes in those markets.
Government regulation of healthcare creates risks and challenges with respect to our compliance efforts and our business strategies
The healthcare industry is highly regulated and is subject to changing political, legislative, regulatory and other influences. Existing and new laws and regulations affecting the healthcare industry could create unexpected liabilities for us, could cause us to incur additional costs and could restrict our operations. Many healthcare laws are complex, and their application to specific products, services, and business arrangements may not be clear. In particular, many existing healthcare laws and regulations, when enacted, did not anticipate the healthcare information services that we provide. However, these laws and regulations may nonetheless be applied to our products, services, and business arrangements. Our failure to accurately anticipate the application of these laws and regulations, or other failure to comply, could create liability for us, result in adverse publicity and negatively affect our business. Even in areas where we are not subject to healthcare regulation directly, we may become involved in governmental actions or investigations through our relationships with customers that are regulated, and participation in such actions or investigations, even if we are not a party and not the subject of an investigation, may cause us to incur significant expenses. Some of the risks we face from healthcare regulation are as follows:
| • | U.S. Regulation of Drug and Medical Device Advertising and Promotion. The WebMD Health Network provides services involving advertising and promotion of prescription and over-the-counter drugs and medical devices and claims of nutritional supplements. If the FDA or the Federal Trade Commission |
45
Table of Contents
Index to Financial Statements
| (FTC) finds that any of our products and services or any information on The WebMD Health Network, in our mobile applications, or in WebMD Magazine violates applicable regulations and guidance documents, they may take regulatory or judicial action against us and/or the advertiser or sponsor of that information. State attorneys general may take similar action based on their respective states’ consumer protection statutes. Any increase or change in regulation of drug or medical device advertising and promotion could make it more difficult for us to contract for sponsorships and advertising and could have a material adverse effect on our revenues and results of operations. In 2014, the FDA issued multiple draft guidance documents clarifying the application of its promotional regulations to certain content on social media Websites. In 2015, the FTC issued guidance concerning native advertising (the placement of sponsored content with the same look and feel as the publisher’s independent content), which provides recommendations for integrating sponsored content on publisher websites while maintaining a clear distinction between the publisher’s editorial content and the sponsored content. We cannot predict how our customers or others in the industry might implement the FDA’s guidance in the future or how its implementation might affect our business. Recent private industry initiatives have resulted in voluntary restrictions, which advertisers and sponsors have agreed to follow. |
| • | Non-U.S. Regulation of Drug and Medical Device Advertising and Promotion. To the extent that The WebMD Health Network reaches users outside of the United States, our Websites may be required to comply with the national laws of the respective countries whose users they address. In many countries, the advertising of prescription drugs to the general public is not allowed and, accordingly, these countries generally require access restrictions for Websites that contain such advertisements, which are only allowed to be addressed to healthcare professionals. In addition, there are laws and regulations regarding the use of indirect or disguised marketing, and regarding the offering and providing of gifts or benefits with promotional purpose that are not of minor value. |
| • | Anti-Kickback Laws. There are federal and state laws that govern patient referrals, physician financial relationships and inducements to healthcare providers and patients. The federal anti-kickback law prohibits any person or entity from offering, paying, soliciting or receiving anything of value, directly or indirectly, in exchange for the referral of patients for items or services reimbursed by Medicare, Medicaid and other federal healthcare programs, or to induce or reward the leasing, purchasing, ordering or arranging for or recommending the lease, purchase or order of any item, good, facility or service reimbursed by these programs. Many states and European countries also have similar anti-kickback laws that are not necessarily limited to items or services for which payment is made by a government healthcare program. These laws are applicable to any person or entity, including manufacturers and distributors and, therefore, may restrict how we and some of our customers market products to healthcare providers. We carefully review our practices with regulatory experts in an effort to ensure that we comply with all applicable laws. However, the laws in this area are both broad and vague, and it is often difficult or impossible to determine precisely how the laws will be applied, particularly to new services. Penalties for violating the federal anti-kickback law include imprisonment, fines and exclusion from participating, directly or indirectly, in Medicare, Medicaid and other federal healthcare programs. Any determination by a state, federal, or foreign regulatory agency that any of our practices violate any of these laws could subject us to civil or criminal penalties and require us to change or terminate some portions of our business and could have an adverse effect on our business. Even an unsuccessful challenge by regulatory authorities of our practices could cause us to incur significant costs or cause adverse publicity. In addition, enforcement or the potential for enforcement of these laws against some of our customers may influence the services we are able to offer and/or our customers’ willingness to continue to use our services. |
| • | False Claims Laws. The Federal False Claims Act imposes liability on any person or entity who, among other things, knowingly presents, or causes to be presented, a false or fraudulent claim for payment by a Federal healthcare program. The whistleblower (or “qui tam”) provisions of the Federal False Claims Act allow a private individual to bring actions on behalf of the Federal government alleging that the defendant has submitted a false claim to the federal government and to share in any monetary recovery. After the filing of a qui tam suit, the Federal government may intervene and control the case; if it does not, the private individual may pursue the claim on his or her own. In addition, various states and European |
46
Table of Contents
Index to Financial Statements
| countries have enacted false claim laws analogous to the Federal False Claims Act, and many of these laws apply where a claim is submitted to any third-party payor and not merely a federal healthcare program. When an entity is determined to have violated the Federal False Claims Act, it may be required to pay up to three times the actual damages sustained by the government plus civil penalties. In recent years an increasing number of Federal False Claims Act cases have been brought against drug manufacturers and resulted in significant monetary settlements and imposition of federally supervised corporate integrity agreements in circumstances that include allegations that company-sponsored continuing medical education (or CME) was unlawful off-label promotion. It is not clear whether there is a basis for the application of the Federal False Claims Act to the types of services that WebMD provides. However, plaintiffs have in the past, and may in the future, seek to name us as defendants in these types of cases. Any action against us for violation of these laws could cause us to incur significant legal expenses and may adversely affect our ability to operate our business. Similarly, False Claims Act actions and resulting corporate integrity agreements involving our customers may reduce the use of our services by our advertising and sponsorship clients. |
| • | Medical Professional Regulation. The practice of most healthcare professions requires licensing under applicable state law. In addition, the laws in some states prohibit business entities from practicing medicine. If a state determines that some portion of our business violates these laws, it may seek to have us discontinue those portions or subject us to penalties or licensure requirements. |
| • | Regulation of Mobile Medical Applications and Other Mobile Health Technology. Over the last several years, the FDA has issued guidance regarding mobile medical applications and other mobile health technology, clarifying the agency’s intent to regulate only those applications that meet the agency’s definition of “device” and could pose a risk to patients’ safety if they fail to work as intended. The FDA is exercising enforcement discretion with respect to certain lower risk mobile applications that meet the device definition. Mobile applications that do not meet the device definition are beyond the FDA’s jurisdiction and, therefore, not subject to the agency’s oversight. In February 2015, the FDA issued guidance stating it would refrain from exercising enforcement over certain products that promote health or healthy lifestyles even when promoted for patients with certain diseases or conditions. In light of FDA guidance, we believe that none of our existing online services and mobile applications are subject to regulation as a medical device under applicable FDA regulations. We are required to determine whether FDA regulations would apply to any of our applications and the FDA could disagree with our determination. It is also possible that products or services that we may offer in the future could subject us to such regulation or that current rules could change or be interpreted to apply to some of our existing online services or mobile applications. Complying with such regulations could be burdensome and expensive and could delay our introduction of new services or applications. |
The Affordable Care Act could adversely affect some of our healthcare industry customers and clients
The Patient Protection and Affordable Care Act, as amended by the Health Care and Education Reconciliation Act of 2010 (which we refer to as the Affordable Care Act), was signed into law in March 2010. The Affordable Care Act made extensive changes to the system of healthcare insurance and benefits in the U.S. While we do not currently anticipate any significant adverse effects on WebMD as a direct result of application of the Affordable Care Act to our business or on our company in its capacity as an employer, we are unable to predict what the future indirect impacts of the Affordable Care Act will be on WebMD’s business through its effects on other healthcare industry participants, including pharmaceutical and medical device companies that are advertisers and sponsors of our public portals, and employers and health plans that are clients of our WebMD Health Services private portals.
We may be subject to claims brought against us as a result of content we provide
Consumers access health-related information through our online services, including information regarding particular medical conditions and possible adverse reactions or side effects from medications. Physicians and other healthcare professionals use our services to access clinical reference sources, commentary from leading medical experts, medical news, and coverage of professional meetings and conferences. If our content, or content
47
Table of Contents
Index to Financial Statements
we obtain from third parties, contains inaccuracies, it is possible that physicians, consumers, employees, health plan members or others may sue us for various causes of action. Although our Websites and mobile applications contain terms and conditions, including disclaimers of liability, that are intended to reduce or eliminate our liability, the law governing the validity and enforceability of online agreements and other electronic transactions is evolving. We could be subject to claims by third parties that our online agreements with consumers and physicians that provide the terms and conditions for use of our public or private portals or mobile applications are unenforceable. A finding by a court that these agreements are invalid and that we are subject to liability could harm our business and require costly changes to our business.
We have editorial procedures in place to provide quality control of the information that we publish or provide. However, we cannot assure you that our editorial and other quality control procedures will be sufficient to ensure that there are no errors or omissions in particular content. Even if potential claims do not result in liability to us, investigating and defending against these claims could be expensive and time-consuming and could divert management’s attention away from our operations. In addition, our business is based on establishing the reputation of our portals as trustworthy and dependable sources of healthcare information. Allegations of impropriety or inaccuracy, even if unfounded, could harm our reputation and business.
Government regulation of the Internet could adversely affect our business
The Internet and its associated technologies are subject to various laws and government regulation. Our failure, or the failure of our business partners or third-party service providers, to accurately anticipate the application of these laws and regulations to our products and services and the manner in which we deliver them, or any other failure to comply with such laws and regulations, could create liability for us, result in adverse publicity and negatively affect our business. In addition, new laws and regulations, or new interpretations of existing laws and regulations, may be adopted with respect to online services, including in areas such as user privacy, confidentiality, consumer protection, marketing, pricing, content, copyrights and patents, and characteristics and quality of products and services. For example, in 2015 the Federal Communications Commission (FCC) altered a long-standing regulatory regime by classifying broadband Internet access services as common carrier telecommunications services. While this decision appears to most directly impact broadband Internet service providers, FCC rulemakings are coming and we cannot predict how this decision or other laws or regulations will affect our business.
Internet and mobile user privacy, personal data security and the use of consumer information to track online activities are major issues both in the United States and abroad. The FTC and state attorneys general continue to pay close attention to Internet privacy issues and have been active in investigating and entering into consent decrees under their current unfair or deceptive trade practices authority with companies because of their online privacy and data security practices. In the U.S., there is a possibility of new legislation and regulation and increased enforcement activities relating to privacy and behavioral advertising. In addition, changes in industry practice (whether on their own or when combined with regulatory changes) could adversely impact our ability to deliver advertisements based on online behavior. Whether through industry practice or in combination with government regulation, such a development could limit our ability to serve advertisements to consumers based on online behavior on third party sites or on our sites, which could adversely affect our revenue.
In Europe, Directive 2009/136/EC of the European Parliament and of the Council requires the user’s full information and consent prior to the installation and use of any so-called “cookie” on a user’s computer. This Directive has been implemented differently, if at all, in member states of the European Union and national requirements to remain compliant with the respective law may vary. Nevertheless, the provisions of this directive, whether or not effectively implemented in national laws, are now applicable in all the member states of the European Union and enforcement actions are now being considered by local data protection authorities. In addition, the European Union Commission, Parliament and Council have agreed on a new General Data Protection Regulation (GDPR) that is close to approval and which will take effect two years after that. The GDPR will replace the current European privacy regime and will impose new requirements to an already very highly regulated area of Internet privacy in Europe. In addition, the GDPR and recent case law in some European countries will increase the likelihood of applicability of European law to entities established outside the European Union but processing data of European data subjects.
48
Table of Contents
Index to Financial Statements
We have privacy policies posted on our Websites that we believe comply with existing applicable laws requiring notice to users about our information collection, use and disclosure practices. We also notify users about our information collection, use and disclosure practices relating to data we receive through offline means such as paper health risk assessments. Moreover, we take steps to reasonably protect certain sensitive personal information we hold. We cannot assure you that the privacy policies and other statements we provide to users of our products and services, or our practices, will sufficiently protect us from liability or adverse publicity in this area. A determination by a state or federal agency or court, or European data protection authority or competent court, that any of our practices do not meet applicable standards, or the implementation of new standards or requirements, could adversely affect our business.
Failure to comply with laws relating to privacy and security of personal information, including personal health information, could result in liability to us and concerns about privacy-related issues could damage our reputation and our business
Privacy and security of personal information stored or transmitted electronically, including personal health information, are a major issue in the United States and abroad. While we strive to comply with all applicable privacy and security laws and regulations, as well as our own posted privacy policies, legal standards for privacy (including, but not limited to, “unfairness” and “deception” as enforced by the FTC and state attorneys general) continue to evolve and any failure or perceived failure to comply may result in private party litigation against us or proceedings or actions against us by government entities, or could cause us to lose users and customers, which could have a material adverse effect on our business. There has been an increase in the number of privacy-related lawsuits filed against companies recently. In addition, we are unable to predict what additional legislation or regulation in the area of privacy of personal information, including personal health information, could be enacted and what effect that could have on our operations and business. Concerns about our practices with regard to the collection, use, disclosure, or security of personal information or other privacy-related matters, even if unfounded and even if we are in compliance with applicable laws, could damage our reputation and harm our business.
The Privacy Standards and Security Standards under the Health Insurance Portability and Accountability Act of 1996 (or HIPAA), as amended by the Health Information Technology for Economic and Clinical Health (HITECH) Act of 2009, establish a set of national privacy and security standards for the handling of protected health information by health plans, healthcare clearinghouses and healthcare providers (referred to as “covered entities”) and their “business associates,” which are persons or entities that perform certain services for, or functions or activities on behalf of, a covered entity that involve the creation, receipt, maintenance, or transmission of protected health information. Certain portions of our business, such as those managing employee or plan member health information for employers or health plans, are subject to HIPAA as business associates of covered entities. In addition to imposing privacy and security requirements, HIPAA also creates obligations for us to report any unauthorized acquisition, access, use or disclosure of unsecured protected health information, known as a breach, to our covered entity customers. The 2013 final HITECH rule modified the breach reporting standard in a manner that made more data security incidents qualify as reportable breaches. In addition, HITECH and its implementing regulations impose similar data breach notification requirements on vendors of personal health records that require us to notify affected individuals, the FTC, and, in some cases, the media in the event of a data breach involving the unsecured personal information of users of our public portal services. Violations of HIPAA may result in civil and criminal penalties and could damage our reputation and harm our business. HITECH increased civil penalty amounts for violations of HIPAA and significantly strengthened enforcement by requiring the U.S. Department of Health and Human Services (HHS) to conduct periodic audits to confirm compliance and authorizing state attorneys general to bring civil actions seeking either injunctions or damages in response to violations of HIPAA Privacy Standards and Security Standards that threaten the privacy of state residents. We cannot assure you that we will adequately address the risks created by these amended HIPAA Privacy Standards and Security Standards. In addition, we are unable to predict what changes to these Standards might be made in the future or how those changes, or other changes in applicable laws and regulations, could affect our business.
In Europe, transfers of EU individuals’ personal data from EU member states to countries not recognized as having adequate protections for personal data, which includes the U.S., are regulated by general data protection Directive 95/46/EC and national implementations. As discussed above, this regime is expected to be replaced by
49
Table of Contents
Index to Financial Statements
the GDPR two years after expected passage in 2016. On October 6, 2015, the Court of Justice of the European Union (CJEU), the European Union’s highest court, declared the U.S.-EU Safe Harbor Framework invalid as a mechanism to legitimize transfers of personal data from the EU to the U.S. On February 2, 2016, the European Commission and the U.S. Department of Commerce announced the EU-U.S. Privacy Shield, which is designed to replace the Safe Harbor Framework. The ultimate viability of the Privacy Shield is unclear. Various stakeholders, including EU data protection authorities, intend to review the Privacy Shield once the details are released. It is also possible the EU-U.S. Privacy Shield will be challenged in the CJEU, and it is unclear what the outcome of such a challenge would be. With the Safe Harbor Framework invalidated by the CJEU, WebMD will assess alternatives, including the Privacy Shield, to legitimatize relevant cross-border data transfers. There is a risk that EU data protection authorities may conclude that various alternatives are not sufficient and that they could investigate or bring enforcement actions with criminal and administrative sanctions. Such actions could also damage our business and harm our reputation.
Criminal sanctions in Europe for violations of national implementations of the existing general data protection Directive 95/46/EC and of the e-Privacy Directive 2002/58/EC are rarely imposed, though national implementations provide for both criminal and administrative sanctions. For example, France and Germany provide for administrative fines of up to 300,000 Euros in case of illegal collection or processing of personal identifiable information. Under the General Data Protection Regulation that the European Union is expected to approve in early 2016 and which will take effect two years thereafter, there can be fines of up to 10,000,000 Euros or up to 2% of the global sales for certain comparatively minor offenses, or up to 20,000,000 Euros or up to 4% of the global sales for more serious offenses.
Failure to maintain CME accreditation could adversely affect Medscape, LLC’s ability to provide online CME offerings
Medscape, LLC’s CME activities are planned and implemented in accordance with the current Essential Areas and Elements and the Policies of the Accreditation Council for Continuing Medical Education (or ACCME), which oversees providers of CME credit, and other applicable accreditation standards. ACCME’s standards for commercial support of CME are intended to assure, among other things, that CME activities of ACCME-accredited providers, such as Medscape, LLC, are independent of “commercial interests,” which are defined as entities that produce, market, re-sell or distribute healthcare goods and services, excluding certain organizations. Commercial interests and entities owned or controlled by commercial interests are ineligible for accreditation by the ACCME. From time to time, the ACCME revises its standards for commercial support of CME. As a result of certain past ACCME revisions, we adjusted our corporate structure and made changes to our management and operations intended to allow Medscape, LLC to provide CME activities that are developed independently from programs developed by its sister companies, which may not be independent of commercial interests. We believe that these changes allow Medscape, LLC to satisfy the applicable standards.
Medscape, LLC’s current ACCME accreditation expires in August 2016 and we are currently in the process of pursuing a renewal. In order for Medscape, LLC to renew its accreditation, it will be required to demonstrate to the ACCME that it continues to meet ACCME requirements. If Medscape, LLC fails to maintain its status as an accredited ACCME provider (whether at the time of such renewal or at an earlier time as a result of a failure to comply with existing or additional ACCME standards), it will not be permitted to accredit CME activities for physicians and other healthcare professionals. Instead, Medscape, LLC would be required to use third parties to provide such CME-related services. That, in turn, could discourage potential supporters from engaging Medscape, LLC to develop CME or education-related activities, which could have a material adverse effect on our business.
CME regulations also apply in other countries. For example, under German law, certain CME programs must be approved by the State Medical Chamber. Additionally, German CME-related services must be free of commercial/business interests and the provider of CME services must be compliant with German laws and regulations. In France, a similar regulatory framework that restricts the organization of CME activities has been completed. These or similar restrictions in other countries may restrict our ability to carry out activities related to CME programs. Moreover, if we are not able to demonstrate compliance with these regulations, applicable approvals may not be obtained from governmental authorities, which may impact our ability to provide CME-related services and which could have an adverse effect on our business.
50
Table of Contents
Index to Financial Statements
Government regulation and industry initiatives could adversely affect the volume of sponsored online CME programs implemented through our Websites or require changes to how Medscape, LLC offers CME
CME activities may be subject to government oversight or regulation by Congress, the FDA, HHS, and state regulatory agencies. Medscape, LLC and/or the sponsors of the CME activities that Medscape, LLC accredits may be subject to enforcement actions if any of these CME activities are deemed improperly promotional, potentially leading to the termination of sponsorships. Medscape, LLC and/or the sponsors of the CME activities that Medscape, LLC accredits also could be affected by industry initiatives regarding funding for CME.
The Department of Justice continues to examine CME sponsorship by pharmaceutical companies. In addition, as part of the Affordable Care Act, pharmaceutical companies are now required to publicly report certain payments and transfers of value that they make to U.S. physicians, including payments related to CME. Legislation has been introduced to roll back this requirement, but such legislation has not yet been and may never be enacted. The federal government’s interpretation of this reporting requirement, which has been evolving and may continue to change, could affect pharmaceutical companies’ views of their reporting obligations with respect to payments in support of authors and presenters of CME material. In implementing internal controls and procedures that promote adherence to applicable regulations and requirements, supporters of CME may interpret the regulations and requirements differently and may implement varying procedures or requirements. These regulations and requirements, and the related internal controls and procedures:
| • | may discourage pharmaceutical and medical device companies from providing grants for independent educational activities; |
| • | may slow their internal approval for such grants; |
| • | may reduce the volume of sponsored educational programs that Medscape, LLC produces to levels that are lower than in the past, thereby reducing revenue; and |
| • | may require Medscape, LLC to make changes to how it offers or provides educational programs, including CME. |
In addition, future changes to laws, regulations or accreditation standards, or to the internal compliance programs of supporters or potential supporters, may further discourage, significantly limit, or prohibit supporters or potential supporters from engaging in educational activities with Medscape, LLC, or may require Medscape, LLC to make further changes in the way it offers or provides educational activities.
Failure to comply with applicable anti-corruption laws could subject us to penalties and other adverse consequences
The United States and other countries have adopted anti-corruption laws that generally prohibit directly or indirectly giving, offering or promising inducements to public officials to elicit an improper commercial advantage. Under applicable U.S., German, and most European laws, this prohibition has been interpreted to apply to doctors and other medical professionals who work in state-run hospitals and state-run healthcare systems. Some of these laws broadly prohibit bribery in both the private and public sectors. In recent years, several global anti-corruption enforcement actions led to significant monetary penalties against several companies operating in the global healthcare industry for providing illegal inducements to medical professionals.
As our business expands globally, we (and others acting on our behalf) increasingly interact with doctors and other medical professionals, at least some of whom work in state-run hospitals or healthcare systems. Such interactions inherently increase the risk of violating applicable anti-corruption laws. While we have implemented compliance policies and procedures to mitigate such risk, our personnel and others acting on our behalf could engage in conduct that violates such laws, for which we could be held responsible. Under such circumstances, we could be subject to civil and/or criminal penalties and other consequences that could have a material adverse effect on our business, reputation, brand, financial condition and results of operations.
51
Table of Contents
Index to Financial Statements
Other Risks Applicable to Our Company and to Ownership of Our Securities
Provisions in our organizational documents and Delaware law may inhibit a takeover, which could adversely affect the value of our Common Stock
Our Restated Certificate of Incorporation and Bylaws, as well as Delaware corporate law, contain provisions that could delay or prevent a change of control or changes in our management and board of directors that holders of our Common Stock might consider favorable and may prevent them from receiving a takeover premium for their shares. These provisions include, for example, our classified board structure and the authorization of our board of directors to issue up to 50 million shares of preferred stock without a stockholder vote. In addition, our Restated Certificate of Incorporation provides that stockholders may not act by written consent and may not call special meetings. These provisions apply even if an offer to purchase our company may be considered beneficial by some of our stockholders. If a change of control or change in management is delayed or prevented, the market price of our Common Stock could decline.
If certain transactions occur with respect to our capital stock, limitations may be imposed on our ability to utilize net operating loss carryforwards and tax credits to reduce our income taxes
WebMD has substantial accumulated net operating loss (NOL) carryforwards and tax credits available to offset taxable income in future tax periods. If certain transactions occur with respect to WebMD’s capital stock (including issuances, redemptions, recapitalizations, exercises of options, conversions of convertible debt, purchases or sales by 5%-or-greater shareholders and similar transactions) that result in a cumulative change of more than 50% of the ownership of capital stock over a three-year period (as determined under rules prescribed by Section 382 of the U.S. Internal Revenue Code and applicable Treasury regulations), an annual limitation would be imposed with respect to the ability to utilize WebMD’s NOL carryforwards and federal tax credits that existed at the time of the ownership change.
In November 2008, HLTH repurchased shares of its Common Stock in a tender offer. The tender offer resulted in a cumulative change of more than 50% of the ownership of HLTH’s capital, as determined under rules prescribed by Section 382 of the Code and applicable Treasury regulations. As a result of this ownership change, there is an annual limitation imposed on the amount of the NOL carryforwards and federal tax credits existing at the time of the ownership change that we may use to offset income in each tax year following the ownership change.
In April 2012, September 2013 and September 2014, WebMD repurchased shares of its Common Stock in tender offers (collectively, the “Tender Offers”). Completion of the Tender Offers may increase the possibility of another ownership change, which could decrease the existing annual limitation and would apply to all NOL carryforwards and tax credits generated prior to this potential new ownership change.
We may not be successful in protecting our intellectual property and proprietary rights
Our intellectual property and proprietary rights are important to our businesses. The steps that we take to protect our intellectual property, proprietary information and trade secrets may prove to be inadequate and, whether or not adequate, may be expensive. We rely on a combination of trade secret, patent and other intellectual property laws and confidentiality procedures and non-disclosure contractual provisions to protect our intellectual property. We cannot assure you that we will be able to detect potential or actual misappropriation or infringement of our intellectual property, proprietary information or trade secrets. Even if we detect misappropriation or infringement by a third party, we cannot assure you that we will be able to enforce our rights at a reasonable cost, or at all. In addition, our rights to intellectual property, proprietary information and trade secrets may not prevent independent third-party development and commercialization of competing products or services.
Third parties may claim that we are infringing their intellectual property, and we could suffer significant litigation or licensing expenses or be prevented from providing certain services
We have been, and may continue to be, subject to claims that we are misappropriating or infringing intellectual property or other proprietary rights of others. These claims, even if not meritorious, may be expensive to defend and divert management’s attention from our operations. If we become liable to third parties for infringing
52
Table of Contents
Index to Financial Statements
these rights, we could be required to pay a substantial damage award and to develop non-infringing technology, obtain a license or cease selling the products or services that use or contain the infringing intellectual property. We may be unable to develop non-infringing products or services or obtain a license on commercially reasonable terms, or at all. We may also be required to indemnify our customers if they become subject to third-party claims relating to intellectual property that we license or otherwise provide to them, which could be costly.
Acquisitions, business combinations and other transactions may be difficult to complete and, if completed, may have negative consequences for our business and our security holders
We may seek to acquire or to engage in business combinations with companies engaged in complementary businesses. In addition, we may enter into joint ventures, strategic alliances or similar arrangements with third parties. These transactions may result in changes in the nature and scope of our operations and changes in our financial condition. Our success in completing these types of transactions will depend on, among other things, our ability to locate suitable candidates and negotiate mutually acceptable terms with them, and to obtain adequate financing. Significant competition for these opportunities exists, which may increase the cost of and decrease the opportunities for these types of transactions. Financing for these transactions may come from several sources, including:
| • | cash and cash equivalents on hand and marketable securities; |
| • | proceeds from the incurrence of indebtedness; and |
| • | proceeds from the issuance of common stock, preferred stock, convertible debt or of other securities. |
The issuance of additional equity or debt securities could:
| • | cause substantial dilution of the percentage ownership of our stockholders at the time of the issuance; |
| • | cause substantial dilution of our earnings per share; |
| • | subject us to the risks associated with increased leverage, including a reduction in our ability to obtain financing or an increase in the cost of any financing we obtain; |
| • | subject us to restrictive covenants that could limit our flexibility in conducting future business activities; and |
| • | adversely affect the prevailing market price for our outstanding securities. |
We do not intend to seek security holder approval for any such acquisition or security issuance unless required by applicable law, regulation or the terms of then-existing securities.
Our business will suffer if we fail to successfully integrate acquired businesses and technologies or to assess the risks in particular transactions
We have in the past acquired, and may in the future acquire, businesses, technologies, services, product lines and other assets. The successful integration of the acquired businesses and assets into our operations, on a cost-effective basis, can be critical to our future performance. The amount and timing of the expected benefits of any acquisition, including potential synergies between our company and the acquired business, are subject to significant risks and uncertainties. These risks and uncertainties include, but are not limited to, those relating to:
| • | our ability to maintain relationships with the customers of the acquired business; |
| • | our ability to retain or replace key personnel of the acquired business; |
| • | potential conflicts in sponsor or advertising relationships or in relationships with strategic partners; |
| • | our ability to coordinate organizations that are geographically diverse and may have different business cultures; and |
| • | compliance with regulatory requirements. |
53
Table of Contents
Index to Financial Statements
We cannot guarantee that any acquired businesses will be successfully integrated with our operations in a timely or cost-effective manner, or at all. Failure to successfully integrate acquired businesses or to achieve anticipated operating synergies, revenue enhancements or cost savings could have a material adverse effect on our business, financial condition and results of operations.
Although our management attempts to evaluate the risks inherent in each transaction and to value acquisition candidates appropriately, we cannot assure you that we will properly ascertain all such risks or that acquired businesses and assets will perform as we expect or enhance the value of our company as a whole. In addition, acquired companies or businesses may have larger than expected liabilities that are not covered by the indemnification, if any, that we are able to obtain from the sellers.
We may not be able to raise additional funds when needed for our business or to exploit opportunities
Our future liquidity and capital requirements will depend upon numerous factors, including the success of our service offerings, market developments, and repurchases of our Common Stock. We may need to raise additional funds to support expansion, develop new or enhanced applications and services, respond to competitive pressures, acquire complementary businesses or technologies or take advantage of unanticipated opportunities. If required, we may raise such additional funds through public or private debt or equity financing, strategic relationships or other arrangements. There can be no assurance that such financing will be available on acceptable terms, if at all, or that such financing will not be dilutive to our stockholders.
| Item 1B. | Unresolved Staff Comments |
None.
| Item 2. | Properties |
We believe that our company’s offices and other facilities are, in general, in good operating condition and adequate for our current operations and that additional leased space in appropriate locations can be obtained on acceptable terms if needed.
We lease approximately 148,000 square feet of office space in New York City for our corporate headquarters and certain of our operations for a term expiring April 2024. At our option, the term can be extended for an additional five years. We also lease additional office space in New York City and lease office space and operational facilities in: Elmwood Park, New Jersey; Atlanta, Georgia; Chicago, Illinois; Ashburn, Virginia; Indianapolis, Indiana; Portland, Oregon; San Clemente and San Diego, California; Seattle, Washington; Durham, North Carolina; and London, England.
| Item 3. | Legal Proceedings |
The information relating to legal proceedings contained in Note 7 to the Consolidated Financial Statements included in this Annual Report is incorporated herein by this reference.
| Item 4. | Mine Safety Disclosures |
Not applicable.
54
Table of Contents
Index to Financial Statements
| Item 5. | Market for Registrant’s Common Equity, Related Stockholder Matters and Issuer Purchases of Equity Securities |
Market Information
Our Common Stock trades on the Nasdaq Global Select Market. The high and low prices of our Common Stock for each quarterly period during the last two fiscal years are as follows:
| High | Low | |||||||
| 2014 |
||||||||
| First quarter |
$ | 51.41 | $ | 38.54 | ||||
| Second quarter |
49.99 | 37.43 | ||||||
| Third quarter |
53.30 | 41.27 | ||||||
| Fourth quarter |
43.59 | 34.48 | ||||||
| 2015 |
||||||||
| First quarter |
$ | 44.94 | $ | 37.62 | ||||
| Second quarter |
48.91 | 41.53 | ||||||
| Third quarter |
46.28 | 37.57 | ||||||
| Fourth quarter |
49.88 | 39.67 | ||||||
The market price of our Common Stock has fluctuated in the past and is likely to fluctuate in the future. Changes in the market price of our Common Stock may result from, among other things:
| • | quarter-to-quarter variations in operating results or other financial or operational metrics; |
| • | operating results or other financial or operational metrics being different from our previously announced guidance or from analysts’ estimates or opinions; |
| • | changes in analysts’ or financial commentators’ earnings estimates, ratings or opinions; |
| • | changes in financial guidance or other forward-looking information; |
| • | new products, services or pricing policies introduced by us or our competitors; |
| • | acquisitions by us or our competitors; |
| • | developments in existing customer relationships; |
| • | actual or perceived changes in our business strategy; |
| • | developments in new or pending litigation and claims; |
| • | sales of large amounts of our Common Stock; |
| • | changes in general business or regulatory conditions affecting the healthcare, information technology or Internet industries; |
| • | changes in general economic conditions; and |
| • | fluctuations in the securities markets in general. |
In addition, the market prices of our Common Stock and of the stock of other Internet-related companies have experienced large fluctuations, sometimes quite rapidly. These fluctuations often may be unrelated to or disproportionate to operating performance.
55
Table of Contents
Index to Financial Statements
Holders
On February 19, 2016, there were approximately 1,000 holders of record of our Common Stock. Because many of these shares are held by brokers and other institutions on behalf of stockholders, we are unable to determine the total number of stockholders represented by these record holders, but we believe there are more than 20,000 holders of our Common Stock.
Dividends
We have never declared or paid any cash dividends on our Common Stock, and we do not anticipate paying cash dividends in the foreseeable future.
Repurchases of Equity Securities During the Fourth Quarter of 2015
The following table provides information about purchases by WebMD during the three months ended December 31, 2015 of equity securities that are registered by us pursuant to Section 12 of the Exchange Act:
Issuer Purchases of Equity Securities
| Period |
Total Number of Shares Purchased(1) |
Average Price Paid per Share |
Total Number
of Shares Purchased as Part of Publicly Announced Plans or Programs(2) |
Approximate Dollar Value of Shares that May Yet Be Purchased Under the Plans or Programs(2) |
||||||||||||
| 10/01/15 – 10/31/15 |
7,059 | $ | 42.64 | — | $ | 34,056,192 | ||||||||||
| 11/01/15 – 11/30/15 |
1,143 | $ | 43.81 | — | $ | 34,056,192 | ||||||||||
| 12/01/15 – 12/31/15 |
37,467 | $ | 46.96 | — | $ | 34,056,192 | ||||||||||
|
|
|
|
|
|||||||||||||
| Total |
45,669 | $ | 46.21 | — | ||||||||||||
|
|
|
|
|
|||||||||||||
| (1) | Includes the following number of shares withheld from WebMD Restricted Common Stock that vested during the respective periods in order to satisfy withholding tax requirements related to the vesting of the awards: 7,059 in October; 1,143 in November; and 37,467 in December. The value of these shares was determined based on the closing price of WebMD Common Stock on the date of vesting. |
| (2) | In August 2011, a stock repurchase program (the “Program”) was established through which WebMD was authorized to use up to $75,000,000 to purchase shares of its Common Stock. Increases to the Program of $75,000,000, $50,000,000, $40,000,000, $30,000,000 and $23,895,440 were authorized in October 2011, February 2014, March 2014, April 2014 and November 2014, respectively. On September 12, 2015, WebMD’s Board of Directors authorized an additional increase to the Program of $27,450,843. For additional information, see Note 10 to the Consolidated Financial Statements included in this Annual Report. |
Performance Graph
The following graph compares the cumulative total stockholder return on WebMD Common Stock with the comparable cumulative return of:
| • | the NASDAQ Composite Index; |
| • | the Research Data Group (RDG) Internet Composite Index; and |
| • | a customized peer group of 19 companies that includes Advisory Board Co, Angie’s List Inc., Athenahealth Inc., Bankrate Inc., Blucora Inc., Constant Contact Inc., Costar Group Inc., DHI Group Inc., E. W. Scripps Co., Everyday Health Inc., Healthways Inc., Media General Inc., Meredith Corp, Monster Worldwide Inc., Nexstar Broadcasting Group Inc., Pandora Media Inc., Press Ganey Holdings Inc., Yelp Inc. and Zillow Group Inc. |
56
Table of Contents
Index to Financial Statements
The companies in our peer group are publicly-traded Internet, publishing, media and healthcare information services companies that share business model characteristics with WebMD. These companies are also used by the Compensation Committee for purposes of compensation benchmarking. The graph assumes that, on December 31, 2010, $100 was invested in WebMD Common Stock, in each index and in the peer group and tracks the value of those investments (including reinvestment of dividends) through December 31, 2015. The stock price performance on the following graph is not necessarily indicative of future stock price performance.
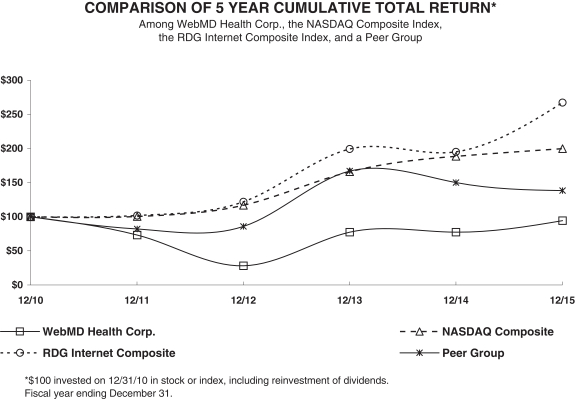
| 12/10 | 12/11 | 12/12 | 12/13 | 12/14 | 12/15 | |||||||||||||||||||
| WebMD Health Corp. |
100.00 | 73.54 | 28.08 | 77.36 | 77.46 | 94.59 | ||||||||||||||||||
| NASDAQ Composite |
100.00 | 100.53 | 116.92 | 166.19 | 188.78 | 199.95 | ||||||||||||||||||
| RDG Internet Composite |
100.00 | 102.11 | 122.23 | 199.42 | 195.42 | 267.25 | ||||||||||||||||||
| Peer Group |
100.00 | 82.04 | 85.85 | 167.06 | 150.25 | 138.58 | ||||||||||||||||||
The Performance Graph shall not be deemed “filed” for purposes of Section 18 of the Securities Exchange Act of 1934, as amended (the Exchange Act), or incorporated by reference into any filing of WebMD under the Securities Act of 1933, as amended, or the Exchange Act, except to the extent we specifically incorporate it by reference into any such filing.
57
Table of Contents
Index to Financial Statements
| Item 6. | Selected Financial Data |
The following selected consolidated financial data should be read in conjunction with “Management’s Discussion and Analysis of Financial Condition and Results of Operations” and with the Consolidated Financial Statements and notes thereto, which are included elsewhere in this Annual Report.
| Years Ended December 31, | ||||||||||||||||||||
| 2015 | 2014 | 2013 | 2012 | 2011 | ||||||||||||||||
| (In thousands, except per share data) | ||||||||||||||||||||
| Consolidated Statements of Operations Data: |
||||||||||||||||||||
| Revenue |
$ | 636,399 | $ | 580,449 | $ | 515,293 | $ | 469,866 | $ | 558,775 | ||||||||||
| Cost of operations |
247,311 | 224,094 | 209,740 | 216,361 | 201,677 | |||||||||||||||
| Sales and marketing |
138,025 | 136,160 | 127,997 | 127,659 | 124,326 | |||||||||||||||
| General and administrative |
91,580 | 94,119 | 93,220 | 97,618 | 91,271 | |||||||||||||||
| Depreciation and amortization |
30,521 | 29,811 | 26,606 | 28,399 | 26,801 | |||||||||||||||
| Interest income |
51 | 69 | 76 | 86 | 112 | |||||||||||||||
| Interest expense |
23,123 | 24,686 | 22,826 | 23,334 | 20,645 | |||||||||||||||
| Loss on convertible notes |
2,058 | — | 4,871 | — | — | |||||||||||||||
| Gain on investments |
139 | — | — | 8,074 | 18,516 | |||||||||||||||
| Restructuring |
— | — | — | 7,579 | — | |||||||||||||||
| Transaction, severance and other expense |
4,100 | — | 1,353 | 2,297 | 2,328 | |||||||||||||||
|
|
|
|
|
|
|
|
|
|
|
|||||||||||
| Income (loss) from continuing operations before income tax provision (benefit) |
99,871 | 71,648 | 28,756 | (25,221 | ) | 110,355 | ||||||||||||||
| Income tax provision (benefit) |
35,847 | 30,707 | 13,640 | (2,134 | ) | 46,167 | ||||||||||||||
|
|
|
|
|
|
|
|
|
|
|
|||||||||||
| Income (loss) from continuing operations |
64,024 | 40,941 | 15,116 | (23,087 | ) | 64,188 | ||||||||||||||
| Income from discontinued operations, net of tax |
— | 1,122 | — | 2,743 | 10,388 | |||||||||||||||
|
|
|
|
|
|
|
|
|
|
|
|||||||||||
| Net income (loss) |
$ | 64,024 | $ | 42,063 | $ | 15,116 | $ | (20,344 | ) | $ | 74,576 | |||||||||
|
|
|
|
|
|
|
|
|
|
|
|||||||||||
| Basic income (loss) per common share: |
||||||||||||||||||||
| Income (loss) from continuing operations |
$ | 1.75 | $ | 1.08 | $ | 0.32 | $ | (0.45 | ) | $ | 1.11 | |||||||||
| Income from discontinued operations |
— | 0.03 | — | 0.05 | 0.18 | |||||||||||||||
|
|
|
|
|
|
|
|
|
|
|
|||||||||||
| Net income (loss) |
$ | 1.75 | $ | 1.11 | $ | 0.32 | $ | (0.40 | ) | $ | 1.29 | |||||||||
|
|
|
|
|
|
|
|
|
|
|
|||||||||||
| Diluted income (loss) per common share: |
||||||||||||||||||||
| Income (loss) from continuing operations |
$ | 1.48 | $ | 0.97 | $ | 0.31 | $ | (0.45 | ) | $ | 1.08 | |||||||||
| Income from discontinued operations |
— | 0.03 | — | 0.05 | 0.17 | |||||||||||||||
|
|
|
|
|
|
|
|
|
|
|
|||||||||||
| Net income (loss) |
$ | 1.48 | $ | 1.00 | $ | 0.31 | $ | (0.40 | ) | $ | 1.25 | |||||||||
|
|
|
|
|
|
|
|
|
|
|
|||||||||||
| Weighted-average shares outstanding used in computing per share amounts: |
||||||||||||||||||||
| Basic |
36,600 | 37,869 | 46,830 | 50,862 | 57,356 | |||||||||||||||
|
|
|
|
|
|
|
|
|
|
|
|||||||||||
| Diluted |
52,653 | 45,614 | 48,398 | 50,862 | 59,124 | |||||||||||||||
|
|
|
|
|
|
|
|
|
|
|
|||||||||||
| As of December 31, | ||||||||||||||||||||
| 2015 | 2014 | 2013 | 2012 | 2011 | ||||||||||||||||
| (In thousands) | ||||||||||||||||||||
| Consolidated Balance Sheet Data: |
||||||||||||||||||||
| Cash, cash equivalents and investments |
$ | 641,165 | $ | 706,776 | $ | 824,880 | $ | 991,835 | $ | 1,121,217 | ||||||||||
| Working capital (excluding assets and liabilities of discontinued operations) |
564,541 | 713,163 | 817,088 | 966,235 | 1,132,431 | |||||||||||||||
| Total assets |
1,165,967 | 1,197,557 | 1,325,628 | 1,490,625 | 1,641,025 | |||||||||||||||
| Long-term convertible notes |
700,000 | 952,232 | 952,232 | 800,000 | 800,000 | |||||||||||||||
| Stockholders' equity |
156,228 | 61,589 | 190,900 | 509,989 | 674,436 | |||||||||||||||
58
Table of Contents
Index to Financial Statements
| Item 7. | Management’s Discussion and Analysis of Financial Condition and Results of Operations |
This Item 7 contains forward-looking statements that involve risks and uncertainties. Please see “Forward-Looking Statements” on page ii of this Annual Report for a discussion of the uncertainties, risks and assumptions associated with these statements. The results of operations for the periods reflected herein are not necessarily indicative of results that may be expected for future periods, and our actual results may differ materially from those discussed in our forward-looking statements as a result of various factors, including but not limited to those listed under “Risk Factors” in Item 1A of this Annual Report and those included elsewhere in this Annual Report. In this Item 7, dollar amounts (other than per share amounts) are stated in thousands, unless otherwise noted.
Overview
Management’s discussion and analysis of financial condition and results of operations, or MD&A, is provided as a supplement to the Consolidated Financial Statements and notes thereto included elsewhere in this Annual Report and is intended to provide an understanding of our results of operations, financial condition and changes in our results of operations and financial condition. Our MD&A is organized as follows:
| • | Introduction. This section provides: a general description of our company and its business; background information on certain trends, transactions and other developments affecting our company; and a discussion of how seasonal factors may impact the timing of our revenue. |
| • | Critical Accounting Estimates and Policies. This section discusses those accounting policies that are considered important to the evaluation and reporting of our financial condition and results of operations, and whose application requires us to exercise subjective and often complex judgments in making estimates and assumptions. In addition, all of our significant accounting policies, including our critical accounting policies, are summarized in Note 2 to the Consolidated Financial Statements included in this Annual Report. |
| • | Results of Operations and Supplemental Financial and Operating Information. These sections provide our analysis and outlook for the significant line items on our statements of operations, as well as other information that we deem meaningful to understand our results of operations on a consolidated basis. |
| • | Liquidity and Capital Resources. This section provides an analysis of our liquidity and cash flows, as well as a discussion of our commitments that existed as of December 31, 2015. |
| • | Recent Accounting Pronouncements. This section provides a summary of the most recent authoritative accounting standards and guidance that have either been recently adopted by our company or may be adopted in the future. |
Introduction
Our Company. WebMD Health Corp. is a Delaware corporation that was incorporated on May 3, 2005. We completed an initial public offering on September 28, 2005. Our Common Stock trades under the symbol “WBMD” on the Nasdaq Global Select Market.
Our Business. We generate revenue from the advertising and sponsorship services of The WebMD Health Network and related operations, from the private portal services we market under the WebMD Health Services brand and from certain information services, each of which is described below and discussed further under “Supplemental Financial and Operating Information” below.
Advertising and Sponsorship. The WebMD Health Network includes: www.WebMD.com, our primary public portal for consumers and related mobile-optimized sites and mobile apps; www.Medscape.com, our primary public portal for physicians and other healthcare professionals and related mobile services; and other sites and apps through which we provide our branded health and wellness content, tools and services. Our services for consumers enable them to obtain information on health and wellness topics or on a particular disease or condition, to assess their personal health status, to use online trackers, tools and quizzes, to locate physicians, to receive periodic e-mailed newsletters and alerts on topics of individual interest, and to participate in online
59
Table of Contents
Index to Financial Statements
communities with peers and experts. Our services for physicians and healthcare professionals make it easier for them to access clinical reference sources, stay abreast of the latest clinical information, learn about new treatment options, earn continuing medical education (which we refer to as CME) credit and communicate with peers. We do not charge any usage, membership or download fees for access to our public portals or mobile platforms. We generate revenue from our public portals and mobile platforms primarily through the sale of various types of advertising and sponsorship programs to our clients, which include: pharmaceutical, biotechnology and medical device companies; hospitals, clinics and other healthcare services companies; health insurance providers; consumer products companies whose products or services relate to health, wellness, diet, fitness, lifestyle, safety and illness prevention; and various other businesses, organizations and governmental entities. Advertisers and sponsors use our services to reach, educate and inform target audiences of consumers, physicians and other healthcare professionals. We also generate revenue from advertising sold in WebMD Magazine, a consumer magazine distributed to physician office waiting rooms.
Private Portal Services. Our private portals platform and related services help employers and health plans improve the health of their employee and plan participant populations and, as a result, manage their healthcare costs. We market these private portals and related services under the WebMD Health Services brand. We host our WebMD Health Services platform for private and public sector employers and health plans and our cloud-based online services can be accessed by their employees and plan participants using a computer, a tablet or a smartphone. The WebMD Health Services platform provides an online personal health record application and personalized content, tools and other resources relevant to the specific individual’s eligibility, coverage and wellness profile, including decision-support applications that help users make informed decisions about health risks, lifestyle choices, healthcare providers, treatment options, and healthcare benefits options. Our flexible architecture allows us to integrate with the client’s existing programs, Websites and intranets for their employees and plan participants. We also offer clients the ability to design team-based and individual wellness challenges that help foster a culture of wellness in the workplace. In addition, we offer telephonic, online and onsite health coaching and targeted condition management programs that help employees and plan participants make healthier lifestyle choices to achieve their health and wellness goals. We generate revenue from subscriptions to our WebMD Health Services platform by employers and health plans, either directly or through distributors. In addition, we offer our health coaching services and our condition management programs on a per participant basis.
Information Services. We generate revenue from the sale of certain information products and services on a stand-alone basis using de-identified data that we license from a small number of third party data sources, of which the principal source is a license retained by HLTH Corporation, our former parent company, in connection with the sale of its Emdeon Business Services (EBS) business. As the successor to HLTH, we received this license which provides us the rights to certain de-identified data from the operation of the EBS business (now known as Change Healthcare) through early February 2018 for use in the development and commercialization of various information products and services. Customers include data services, informatics and consulting companies.
Background Information on Certain Trends and Developments Affecting Our Business. Key trends and developments affecting the use of healthcare information services of the types we provide or are developing and our ability to generate revenue from those services include the following:
| • | Use of the Internet by Consumers and Physicians. The Internet has emerged as a major communications medium and has fundamentally changed many sectors of the economy, including the marketing and sales of financial services, travel, and entertainment, among others. The Internet is also changing the healthcare industry and has transformed how consumers and physicians find and utilize healthcare information. |
| — | Healthcare consumers increasingly seek to educate themselves online about their healthcare-related issues, motivated by the desire to become better informed patients and to become more engaged healthcare consumers because of the larger share of healthcare costs they are being asked to bear due to changes in the benefit designs being offered by health plans and employers. The Internet has fundamentally changed the way consumers obtain health and wellness information, enabling them to have immediate access to searchable information and dynamic interactive content to check symptoms, understand diseases, find providers and evaluate treatment options. |
60
Table of Contents
Index to Financial Statements
| — | The Internet has become a primary source of information for physicians and other healthcare professionals seeking to improve clinical practice and to interact with their peers. The Internet has also become one of the primary means for physicians and other healthcare professionals to obtain CME and CE. |
| • | Online Marketing and Education Spending for Healthcare Products. Pharmaceutical, biotechnology and medical device companies spend large amounts each year marketing their products and educating consumers and physicians about them; however, only a small portion is currently spent on online services. We believe that these companies, which represented approximately 74% of our advertising and sponsorship revenue in 2015, are aware of the effectiveness of the Internet relative to traditional media in providing health, clinical and product-related information to consumers and physicians. In addition, in an effort to improve operating efficiencies, some pharmaceutical companies have been reducing their field sales forces in the past several years. For 2016, we believe that we are well-positioned to provide advertising solutions for pharmaceutical products that are currently being marketed as well as those in the pipeline for FDA approval. Many of these pharmaceutical products are expensive therapies that treat complex conditions affecting relatively small patient populations, for which we believe that our online services provide an efficient way to reach target audiences. However, notwithstanding our general expectation for increased future demand, we cannot predict the extent or the pace of any shift by pharmaceutical, biotechnology and medical device companies of their marketing expenditures to online services or to what extent they will choose WebMD to provide such services. Furthermore, our advertising and sponsorship revenue may vary significantly from quarter to quarter due to a number of other factors, many of which are outside our control, including general economic and regulatory conditions and the following: |
| — | The majority of our advertising and sponsorship contracts are for terms of approximately four to twelve months. We have relatively few longer term advertising and sponsorship contracts. |
| — | The time between the date of initial contact with a potential advertiser or sponsor regarding a specific program and the execution of a contract with the advertiser or sponsor for that program, as well as the additional time period before our services are delivered, may be longer than expected, especially for medium-sized and larger contracts, and may be subject to delays over which we have little or no control, including as a result of budgetary constraints of the advertiser or sponsor or their need for internal approvals, including internal approvals relating to compliance with the laws and regulations applicable to the marketing of healthcare products. We have experienced, from time to time in the past, a lengthening of this internal review process by pharmaceutical and biotechnology companies, which has resulted in delays in contracting, as well as delays in recognizing expected revenue under executed contracts, and we cannot predict whether similar delays may occur in future periods. |
Additional factors that may affect the timing of contracting for specific programs with advertisers and sponsors, or receipt of revenue under such contracts, include: the timing of Food and Drug Administration (“FDA”) approval for new products or for new approved uses for existing products; the timing of FDA approval of generic products that compete with existing brand name products and any increase in the number or significance of such approvals or of withdrawals of products from the market; consolidation of companies in the pharmaceutical and biotechnology industries; the timing of roll-outs of new or enhanced services on our public portals; seasonal factors relating to the prevalence of specific health conditions and other seasonal factors that may affect the timing of promotional campaigns for specific products; and the scheduling of conferences for physicians and other healthcare professionals.
| • | Other Factors Affecting the Demand for Our Advertising and Sponsorship Services. Some of our pharmaceutical company customers have experienced patent expirations for certain of their products in the past several years and some are expected to experience patent expirations over the next several years. In the pharmaceutical industry, patent expirations allow for competition from lower-priced generic versions of the patented drugs and generally result in the termination of marketing efforts for the drug and, in certain instances, have resulted in reductions in the overall online advertising budgets for some of our customers. Our public portals advertisers and sponsors include companies that provide over-the-counter drugs and other healthcare products, food and beverages, beauty products and other consumer products, |
61
Table of Contents
Index to Financial Statements
| particularly for products and services that relate to health, wellness, diet, fitness, lifestyle, safety and illness prevention, as well as clients such as retailers, pharmacies, hospitals, health insurance companies and government agencies. Revenues from these clients are more likely to reflect trends in general economic conditions than revenues from pharmaceutical, biotechnology and medical device companies. Accordingly, revenues from these clients may be subject to significant quarter-to-quarter variations and we may not be able to forecast those variations accurately. Our advertising and sponsorship services are subject to competition from numerous alternatives, including other Internet sites that focus on health-related content, Internet search engines, social media Internet sites, general interest consumer sites and traditional media. Such competition may result in smaller customer commitments or pressure to reduce prices, both of which could reduce our revenues and profit margins. |
| • | Traffic Trends. In 2015, The WebMD Health Network reached an average of approximately 207 million monthly unique visitors and delivered approximately 16.34 billion page views during the year, increases of 13% and 15% over the prior year, respectively. Traffic to The WebMD Health Network was an average of approximately 201 million unique users per month and total traffic of approximately 3.97 billion page views during the fourth quarter of 2015, increases of 6% and 7%, respectively, over the prior year period. Traffic to Medscape properties from physicians and other healthcare professionals averaged approximately 7.1 million physician sessions per month in 2015, an increase of approximately 14% over the prior year, and averaged approximately 7.3 million physician sessions per month during the fourth quarter of 2015, an increase of approximately 9% over the prior year period. |
| — | Consumers and healthcare professionals are increasingly using smartphones, tablets and other mobile devices to access the Internet, with physicians increasingly using mobile devices during treatment at the point of care. Accordingly, the portion of our page views from mobile devices has increased rapidly in the past several years as usage has increased on mobile devices, and increased utilization of our mobile offerings was the primary driver of our traffic growth in the fourth quarter of 2015, as compared to the prior year period, as well as for the full year 2015 as compared to full year 2014. During the fourth quarter of 2015: approximately 39% of our page views came from a U.S. smartphone; approximately 23% came from a U.S. personal computer (or PC); approximately 7% came from a U.S. tablet device; and approximately 31% came from non-U.S. sources. See “– Efforts to Increase Advertising and Sponsorship Revenue from Mobile” below for discussion of trends in our advertising and sponsorship revenue from mobile. |
| — | Starting in the third quarter of 2015, we began to experience slower growth in our overall traffic than in the prior several years and this has continued into the first quarter of 2016. We are working to understand the reasons for the slower growth and, based on the information available to us, we believe that the following two factors may have contributed to it: (1) slower growth in the total volume of health-related searches across Internet search engines; and (2) changes that Google has implemented to the presentation of its search results. However, in the fourth quarter of 2015, our advertising and sponsorship revenue grew 25% even though our overall page views grew only 7%. We are able to do this because overall traffic to The WebMD Health Network does not have a direct correlation to our advertising and sponsorship revenue, which can continue to grow even if overall traffic were to remain the same or go down. We create content on specific topics and program various parts of The WebMD Health Network to build and maintain traffic in areas most important to both our audience and our advertising and sponsorship clients. For example, the total Medscape audience is small compared to the total audience of The WebMD Health Network, but Medscape Websites and mobile apps contributed approximately 60% of our advertising and sponsorship revenue in 2015 because of the high value our clients place on being able to reach the Medscape audience of physicians and other healthcare professionals or to reach targeted portions of that Medscape audience. |
| • | Efforts to Increase Advertising and Sponsorship Revenue from Mobile. We remain focused on delivering a multi-screen platform that engages users on their personal computers, tablet devices and smartphones. |
62
Table of Contents
Index to Financial Statements
| As we broaden our mobile offerings for consumers and physicians, we are also expanding our mobile advertising and sponsorship products. We have been seeing increasing customer demand for mobile advertising and sponsorship and have been including mobile components in many of the multi-platform program configurations that we are selling to advertisers and sponsors. While we offer mobile as a stand-alone purchase, our advertising and sponsorship clients are generally interested in reaching a targeted audience, regardless of what device the user is engaging on, and choose multi-platform advertising and sponsorship programs. In 2015, our advertising and sponsorship revenue delivered on a mobile device grew to approximately $189 million, or 38% of our total advertising and sponsorship revenue, from approximately $156 million in 2014 (which was 34% of our total advertising and sponsorship revenue in that year). This includes stand-alone mobile advertising and sponsorship revenue as well as the allocation of multi-platform advertising and sponsorship revenue for the portion delivered on smartphone or tablet. With our significant scale in both desktop and mobile audience engagement and our ability to reach targeted portions of our audience, we believe that The WebMD Health Network is well-positioned to meet the needs of our advertising and sponsorship clients. |
| • | Social Media and Video Initiatives. Given the increasing prominence of social networks as important platforms for finding and consuming content, WebMD is working to enable users to more easily discover, share and interact with content from WebMD, not just on our own Websites, but also in other online locations. Some of our initiatives are directed toward the creation of new content offerings that are tailored for specific social networks and platforms. Our strategy to extend our content and brand beyond The WebMD Health Network will, in some cases, allow us to drive people back to WebMD’s sites, where we can monetize that traffic as we do today; in other cases, we expect to use new monetization models as we engage with users outside of WebMD’s sites. Another key aspect of these initiatives is to create new video content that is both highly engaging and easily sharable across social networks. We launched approximately 165 such videos during the fourth quarter of 2015, some on topics relating to specific health conditions and some on healthy living and wellness topics. To continue to build our video content into a scalable library, we are growing our team of video producers and editors, as well as building additional in-house expertise to create video content. We are also continuing to develop longer-form video offerings. We believe that by taking WebMD into new online environments and onto new platforms, we will strengthen our connection to existing users, reach new audiences and diversify our traffic sources. We expect that these efforts will, over time, allow us to create additional monetization opportunities. |
| • | Trends Affecting Our Services for Employers and Health Plans. In response to increasing healthcare costs, public and private sector employers and health plans have been changing benefit plan designs to increase deductibles, co-payments and other out-of-pocket costs and taking other steps to motivate employees and plan participants to live healthier lives and use healthcare in a cost-effective manner. In connection with shifting greater responsibility for healthcare costs to employees and plan participants, employers and health plans are making available more health and benefits information and decision-support applications to help their employees and plan participants make informed decisions about treatment options, health risks, lifestyle choices and healthcare providers. Since lifestyle choices, including choices regarding nutrition, exercise and tobacco use, are key drivers of health and can dramatically impact risks for acquiring chronic, costly health conditions, employers and health plans seek to reduce demand for healthcare services by focusing on health and wellness initiatives for their employees and plan participants. We believe that, through our WebMD Health Services private portals and related coaching and condition management services, we are well positioned to play a role in this environment. Our services help employees and plan participants make more informed health and benefit decisions, positively change health behaviors, manage health conditions and lead healthier lives. At the beginning of 2014, we launched our WebMD Health Services platform for the Blue Cross Blue Shield Association Federal Employee Program (or FEP). With this program, over 5 million FEP members have access to a broad range of our WebMD Health Services solutions, including our online personal health record application, as well as to our health coaching services, and to around-the-clock access to nurses by phone, secure message, or chat. Our strategy depends, in part, on increasing usage of our services by our |
63
Table of Contents
Index to Financial Statements
| employer and health plan clients’ employees and plan participants and being able to demonstrate a sufficient return on investment and other benefits for our clients from those services. Increasing such usage requires us to continue to develop new and updated applications, features and services. |
| • | International. Physicians and healthcare professionals from around the world access our content in English through Medscape. In addition, we publish Spanish, French and German language editions of Medscape through which healthcare professionals can access our content in those languages. We have also entered into collaborations with companies having expertise in a specific country or region to extend our reach. We plan to continue to pursue opportunities to expand the reach of our brands outside the United States, particularly with respect to our healthcare professionals audience. In certain markets outside the United States, we expect to accomplish this through partnerships or joint ventures with other companies having expertise in the specific country or region, while in other such markets we expect to rely primarily on our own internal resources. Revenue from our international operations was $56,979, $46,095 and $31,340 during the years ended December 31, 2015, 2014 and 2013, respectively. |
| • | Other Initiatives. We are pursuing, and intend to continue to identify, new business opportunities where our consumer and physician audiences and our resources can be leveraged to develop additional products and services. We may pursue initiatives to create new or enhanced revenue streams or, alternatively, to increase audience engagement even when we have not identified any potential related revenue stream. New business initiatives present risks and challenges that may be different from the ones we have faced in the past. In addition, later events may alter the risks that were evaluated at the time decisions are made on specific initiatives. Failure to effectively identify and assess new business initiatives and to successfully implement them may adversely affect our company and its prospects. |
The healthcare industry in the United States and relationships among healthcare payers, providers and consumers are very complicated. In addition, the Internet and the market for online and mobile services are relatively new and still evolving. Accordingly, there can be no assurance that the trends identified above will continue or that the expected benefits to our business from our responses to those trends will be achieved. In addition, the market for healthcare information services is highly competitive and not only are our existing competitors seeking to benefit from these same trends, but the trends may also attract additional competitors.
Background Information on Certain Significant Developments and Transactions
Tender Offers. On September 10, 2013, we completed a tender offer (which we refer to as the 2013 Tender Offer) for our Common Stock and repurchased 5,000,000 shares at a price of $34.00 per share for a total cost of $170,516, which includes $516 of costs directly attributable to the purchase. On September 9, 2014, we completed a tender offer (which we refer to as the 2014 Tender Offer and, collectively with the 2013 Tender Offer, as the Tender Offers) for our Common Stock and repurchased 2,000,000 shares at a price of $48.50 per share for a total cost of $97,588, which includes $588 of costs directly attributable to the purchase. Each of the Tender Offers represented an opportunity for WebMD to return capital to stockholders who elected to tender their shares of WebMD Common Stock, while stockholders who chose not to participate in the Tender Offers automatically increased their relative percentage interest in our company at no additional cost to them.
Stock Repurchases. During 2013, we repurchased 1,266,962 shares of our Common Stock at an aggregate cost of $42,309 through our stock repurchase program. On October 18, 2013, we entered into an agreement to repurchase 5,527,433 shares of our Common Stock from Carl C. Icahn and certain of his affiliates, at a purchase price of $32.08 per share (the NASDAQ Official Closing Price of our Common Stock on October 18, 2013) at an aggregate cost of $177,420, which includes $100 of costs directly attributable to the purchase. The repurchase was completed on October 21, 2013. This repurchase was made outside of our stock repurchase program.
During 2014, we repurchased 3,160,070 shares of our Common Stock at an aggregate cost of $128,748 through our stock repurchase program.
During 2015, we repurchased 688,467 shares of our Common Stock at an aggregate cost of $28,406 through our stock repurchase program. On September 12, 2015, our Board of Directors authorized an increase to our stock repurchase program of approximately $27,451. As of December 31, 2015, $34,056 remained available for repurchases under our stock repurchase program.
64
Table of Contents
Index to Financial Statements
Convertible Notes. On January 11, 2011, we issued $400,000 aggregate principal amount of 2.50% Convertible Notes due 2018 (which we refer to as the 2.50% Notes) in a private offering. Unless previously converted, the 2.50% Notes will mature on January 31, 2018. Net proceeds from the sale of the 2.50% Notes were approximately $387,345, after deducting the related offering expenses, of which approximately $100,000 was used by us to repurchase 1,920,490 shares of WebMD Common Stock at a price of $52.07 per share, the last reported sale price of WebMD Common Stock on January 5, 2011, which repurchase settled on January 11, 2011. Interest on the 2.50% Notes is payable semi-annually on January 31 and July 31 of each year, commencing July 31, 2011. Under the terms of the 2.50% Notes, as adjusted following completion of tender offers by WebMD for its Common Stock in 2012, 2013 and 2014, holders may surrender their 2.50% Notes for conversion into WebMD Common Stock at a conversion rate of 15.5118 shares of WebMD Common Stock per thousand dollars principal amount of the 2.50% Notes. This is equivalent to a conversion price of approximately $64.47 per share of Common Stock. In the aggregate, the 2.50% Notes were convertible into 6,204,720 shares of Common Stock as of December 31, 2015.
On March 14, 2011, we issued $400,000 aggregate principal amount of 2.25% Convertible Notes due 2016 (which we refer to as the 2.25% Notes) in a private offering. Unless previously converted, the 2.25% Notes will mature on March 31, 2016. Net proceeds from the sale of the 2.25% Notes were approximately $387,400, after deducting the related offering expenses, of which approximately $50,000 was used to repurchase 868,507 shares of WebMD Common Stock at a price of $57.57 per share, the last reported sale price of WebMD Common Stock on March 8, 2011, which repurchase settled on March 14, 2011. Interest on the 2.25% Notes is payable semi-annually on March 31 and September 30 of each year, commencing September 30, 2011. During 2013, we repurchased a total of $147,768 principal amount of our 2.25% Notes for $150,354 in cash and we recognized a pre-tax loss of $4,871 related to these repurchases which included the expensing of the remaining deferred issuance costs outstanding related to the repurchased 2.25% Notes. During 2015, we repurchased a total of $149,550 principal amount of our 2.25% Notes for $151,038 in cash and we recognized a pre-tax loss of $2,058 related to these repurchases which included the expensing of the remaining deferred issuance costs outstanding related to the repurchased 2.25% Notes. Under the terms of the 2.25% Notes, as adjusted following completion of tender offers by WebMD for its Common Stock in 2012, 2013 and 2014, holders may surrender their 2.25% Notes for conversion into WebMD Common Stock at a conversion rate of 13.9202 shares of Common Stock per thousand dollars principal amount of the 2.25% Notes. This is equivalent to a conversion price of approximately $71.84 per share of Common Stock. In the aggregate, the 2.25% Notes were convertible into 1,429,354 shares of Common Stock as of December 31, 2015, at which time the remaining outstanding principal amount was $102,682.
On November 26, 2013, we issued $300,000 aggregate principal amount of 1.50% Convertible Notes due 2020 (which we refer to as the 1.50% Notes) in a private offering. Unless previously converted, the 1.50% Notes will mature on December 1, 2020. Net proceeds from the sale of the 1.50% Notes were approximately $291,823, after deducting the related offering expenses. Interest on the 1.50% Notes is payable semi-annually on June 1 and December 1 of each year, commencing June 1, 2014. Under the terms of the 1.50% Notes, as adjusted in September 2014 following completion of the 2014 Tender Offer, holders may surrender their 1.50% Notes for conversion into WebMD Common Stock at a conversion rate of 18.9795 shares of Common Stock per thousand dollars principal amount of the 1.50% Notes. This is equivalent to a conversion price of approximately $52.69 per share of Common Stock. In the aggregate, the 1.50% Notes were convertible into 5,693,850 shares of Common Stock as of December 31, 2015.
Seasonality
The timing of our revenue is affected by seasonal factors. Our public portal advertising and sponsorship revenue is seasonal, primarily due to the annual spending patterns of the advertising and sponsorship clients of our public portals. This portion of our revenue is usually the lowest in the first quarter of each calendar year, and generally increases during each consecutive quarter throughout the year. The timing of revenue in relation to our expenses, many of which do not vary directly with revenue, has an impact on cost of operations, sales and marketing, and general and administrative expenses as a percentage of revenue in each calendar quarter.
65
Table of Contents
Index to Financial Statements
Critical Accounting Estimates and Policies
Critical Accounting Estimates
Our MD&A is based upon our Consolidated Financial Statements and Notes to Consolidated Financial Statements, which were prepared in conformity with U.S. generally accepted accounting principles (GAAP). The preparation of the Consolidated Financial Statements requires us to make estimates and assumptions that affect the amounts reported in the Consolidated Financial Statements and accompanying notes. We base our estimates on historical experience, current business factors, and various other assumptions that we believe are necessary to consider to form a basis for making judgments about the carrying values of assets and liabilities, the recorded amounts of revenue and expenses and the disclosure of contingent assets and liabilities. We are subject to uncertainties such as the impact of future events, economic and political factors, and changes in our business environment; therefore, actual results could differ from these estimates. Accordingly, the accounting estimates used in the preparation of our financial statements will change as new events occur, as more experience is acquired, as additional information is obtained and as our operating environment changes. Changes in estimates are made when circumstances warrant. Such changes in estimates and refinements in estimation methodologies are reflected in reported results of operations; if material, the effects of changes in estimates are disclosed in the Notes to our Consolidated Financial Statements.
We evaluate our estimates on an ongoing basis, including those related to revenue recognition, the allowance for doubtful accounts, the carrying value of long-lived assets (including goodwill and indefinite-lived intangible assets), the amortization period of long-lived assets (excluding goodwill and indefinite-lived intangible assets), the carrying value, capitalization and amortization of software and Website development costs, the carrying value of investments, the provision for income taxes and related deferred tax accounts, certain accrued expenses, contingencies, litigation and related legal accruals and the value attributed to employee stock options and other stock-based awards.
Critical Accounting Policies
We believe the following reflects our critical accounting policies and our more significant judgments and estimates used in the preparation of our Consolidated Financial Statements:
| • | Revenue Recognition. Revenue from advertising is recognized as advertisements are delivered or as publications are distributed. Revenue from sponsorship arrangements, content syndication and distribution arrangements and subscriptions to our healthcare management tools and private portals as well as related health coaching services is recognized ratably over the term of the applicable agreement. Revenue from information services is recognized as the underlying data is delivered. Revenue from the sponsorship of CME is recognized over the period that we substantially complete our contractual deliverables as determined by the applicable agreements. |
Contracts that contain multiple deliverables are subject to Accounting Standards Update (“ASU”) No. 2009-13 Multiple-Deliverable Revenue Arrangements (“ASU 2009-13”). ASU 2009-13 requires the allocation of revenue to each deliverable of multiple-deliverable revenue arrangements, based on the relative selling price of each deliverable. It also defines the level of evidence of selling price required to separate deliverables and allows a company to make its best estimate of the selling price of deliverables when more objective evidence of selling price is not available.
Pursuant to the guidance of ASU 2009-13, when a sales arrangement contains multiple deliverables, we allocate revenue to each deliverable based on relative selling price. The selling price for a deliverable is based on vendor-specific objective evidence (“VSOE”) if available, third-party evidence (“TPE”) if VSOE is not available, or best estimate of selling price if neither VSOE nor TPE is available. We then recognize revenue on each deliverable in accordance with
66
Table of Contents
Index to Financial Statements
our revenue recognition policies over the period that delivery occurs. VSOE of selling price is based on the price charged when the deliverable is sold separately. In determining VSOE, GAAP requires that a substantial majority of the selling prices fall within a reasonable range based on historical pricing trends for specific products and services. TPE is based on competitor prices of similar deliverables when sold separately. We are generally not able to determine TPE of selling price as we are unable to reliably determine what competitors’ selling prices are for comparable services, combined with the fact that our services often contain unique features and customizations such that comparable services do not exist. The determination of best estimate of selling price is a judgmental process that considers multiple factors including, but not limited to, recent selling prices and related discounting practices for each service, market conditions, customer classes, sales channels and other factors.
| • | Long-Lived Assets. Our long-lived assets consist of property and equipment, goodwill and other intangible assets. Goodwill and other intangible assets arise from the acquisitions we have made. The amount assigned to intangible assets is subjective and based on fair value using exit price and market participant view, such as discounted cash flow and replacement cost models. Our long-lived assets, excluding goodwill and indefinite-lived intangible assets, are amortized over their estimated useful lives, which we determine based on the consideration of several factors including the period of time the asset is expected to remain in service. We evaluate the carrying value and remaining useful lives of long-lived assets, excluding goodwill and indefinite-lived intangible assets, whenever indicators of impairment are present. We evaluate the carrying value of goodwill and indefinite-lived intangible assets annually, or whenever indicators of impairment are present. We test goodwill for impairment at the reporting unit level only when, after completing a qualitative analysis, it is determined that it is more likely than not that the fair value of the reporting unit is less than its carrying value. Long-lived assets held for sale are reported at the lower of cost or fair value less cost to sell. There was no impairment of goodwill or indefinite-lived intangible assets in 2015, 2014 or 2013. |
| • | Stock-Based Compensation. Stock-based compensation expense for all share-based payment awards granted is determined based on the grant date fair value. The grant date fair value for stock options is estimated using the Black-Scholes Option Pricing Model. We recognize these compensation costs net of an estimated forfeiture rate on a straight-line basis over the requisite service period of the award, which is generally the vesting term of the share-based payment awards. As of December 31, 2015, there was approximately $56,930 of unrecognized stock-based compensation expense (net of estimated forfeitures) related to unvested stock options and restricted stock held by employees, which is expected to be recognized over a weighted-average period of approximately 2.3 years, related to our stock-based compensation plans. |
| • | Deferred Taxes. Our deferred tax assets are comprised primarily of net operating loss carryforwards and federal tax credits. These net operating loss carryforwards and federal tax credits may be used to offset taxable income in future periods, reducing the amount of taxes we might otherwise be required to pay. A significant portion of our net deferred tax assets, including the portion related to excess tax benefits of stock-based awards, are reserved for by a valuation allowance as required by relevant accounting literature. Management determines the need for a valuation allowance by assessing the probability of realizing deferred tax assets, taking into consideration factors including historical operating results, expectations of future earnings and taxable income. Management will continue to evaluate the need for a valuation allowance in the future. |
| • | Tax Contingencies. Our tax contingencies are recorded to address potential exposures involving tax positions we have taken that could be challenged by tax authorities. These potential exposures result from applications of various statutes, rules, regulations and interpretations. Our estimates of tax contingencies reflect assumptions and judgments about potential actions by taxing jurisdictions. We believe that these assumptions and judgments are reasonable. However, our accruals may change in the future due to new developments in each matter and the ultimate |
67
Table of Contents
Index to Financial Statements
| resolution of these matters may be greater or less than the amount that we have accrued. Consistent with our historical financial reporting, we have elected to reflect interest and penalties related to uncertain tax positions as part of the income tax provision. |
Results of Operations
The following table sets forth our consolidated statements of operations data and expresses that data as a percentage of revenue for the periods presented:
| Years Ended December 31, | ||||||||||||||||||||||||
| 2015 | 2014 | 2013 | ||||||||||||||||||||||
| $ | % (a) | $ | % (a) | $ | % (a) | |||||||||||||||||||
| Revenue. |
$ | 636,399 | 100.0 | $ | 580,449 | 100.0 | $ | 515,293 | 100.0 | |||||||||||||||
| Cost of operations |
247,311 | 38.9 | 224,094 | 38.6 | 209,740 | 40.7 | ||||||||||||||||||
| Sales and marketing |
138,025 | 21.7 | 136,160 | 23.5 | 127,997 | 24.8 | ||||||||||||||||||
| General and administrative |
91,580 | 14.4 | 94,119 | 16.2 | 93,220 | 18.1 | ||||||||||||||||||
| Depreciation and amortization |
30,521 | 4.8 | 29,811 | 5.1 | 26,606 | 5.2 | ||||||||||||||||||
| Interest income |
51 | — | 69 | — | 76 | — | ||||||||||||||||||
| Interest expense |
23,123 | 3.6 | 24,686 | 4.3 | 22,826 | 4.4 | ||||||||||||||||||
| Loss on convertible notes |
2,058 | 0.3 | — | — | 4,871 | 0.9 | ||||||||||||||||||
| Gain on investments |
139 | — | — | — | — | — | ||||||||||||||||||
| Other expense |
4,100 | 0.6 | — | — | 1,353 | 0.3 | ||||||||||||||||||
|
|
|
|
|
|
|
|
|
|
|
|
|
|||||||||||||
| Income from continuing operations before income tax provision |
99,871 | 15.7 | 71,648 | 12.3 | 28,756 | 5.6 | ||||||||||||||||||
| Income tax provision |
35,847 | 5.6 | 30,707 | 5.3 | 13,640 | 2.6 | ||||||||||||||||||
|
|
|
|
|
|
|
|
|
|
|
|
|
|||||||||||||
| Income from continuing operations |
64,024 | 10.1 | 40,941 | 7.1 | 15,116 | 2.9 | ||||||||||||||||||
| Income from discontinued operations, net of tax |
— | — | 1,122 | 0.2 | — | — | ||||||||||||||||||
|
|
|
|
|
|
|
|
|
|
|
|
|
|||||||||||||
| Net income |
$ | 64,024 | 10.1 | $ | 42,063 | 7.2 | $ | 15,116 | 2.9 | |||||||||||||||
|
|
|
|
|
|
|
|
|
|
|
|
|
|||||||||||||
| (a) | Amounts may not add due to rounding. |
Revenue is derived from four groups. The first group is “Advertising and Sponsorship – Biopharma and Medical Device” and consists of advertising and sponsorship revenue from pharmaceutical, biotechnology and medical device clients relating to ethical pharmaceutical products or other regulated devices or products or for sponsoring educational programs. The second category is “Advertising and Sponsorship – OTC, CPG and Other” and consists of advertising and sponsorship revenue relating to non-Rx or over-the-counter medications and other healthcare products, food and beverages, beauty products and other consumer products, as well as revenue from clients such as retailers, pharmacies, hospitals, health insurance companies and government agencies. The combined revenue of the first two groups is sometimes referred to as “Advertising and Sponsorship” revenue. The third group is “Private Portal Services” and consists of revenue from employers and health plans for subscriptions to our private portals solution and related services, including health coaching and condition management services. The fourth group is “Information Services” and consists of revenue from the sale of stand-alone information and data products.
Cost of operations consists of salaries and related expenses, and non-cash stock-based compensation expense related to providing and distributing services and products we provide to customers and costs associated with the operation and maintenance of our public and private portals. Cost of operations also consists of editorial and production costs, Website operations costs, non-capitalized Website development costs, costs we pay to our distribution partners, costs associated with our health and condition management programs and personalized health coaching services, and costs related to the production and distribution of our publications, including costs related to creating and licensing content, telecommunications, leased properties and printing and distribution.
68
Table of Contents
Index to Financial Statements
Sales and marketing expense consists primarily of salaries and related expenses, and non-cash stock-based compensation for account executives, account management and marketing personnel, as well as costs and expenses for marketing programs, and fees for professional marketing and advertising services.
General and administrative expense consists primarily of salaries and related expenses and non-cash stock-based compensation expense for administrative, finance, legal, information technology, human resources and executive personnel. Also included in general and administrative expense are costs of general insurance and professional services expenses.
Our discussions throughout this MD&A make references to certain non-cash expenses. Our principal non-cash expenses are related to the awards of all share-based payments to employees and non-employee directors, such as grants of employee stock options and restricted stock. Non-cash stock-based compensation expense is reflected in the same expense captions as the related salary cost of the respective employee.
The following table is a summary of our non-cash expenses included in the respective statements of operations captions.
| Years Ended December 31, | ||||||||||||
| 2015 | 2014 | 2013 | ||||||||||
| Stock-based compensation expense included in: |
||||||||||||
| Cost of operations |
$ | 5,217 | $ | 5,940 | $ | 6,762 | ||||||
| Sales and marketing |
7,290 | 7,221 | 8,395 | |||||||||
| General and administrative |
21,236 | 19,385 | 23,393 | |||||||||
|
|
|
|
|
|
|
|||||||
| Total stock-based compensation expense |
$ | 33,743 | $ | 32,546 | $ | 38,550 | ||||||
|
|
|
|
|
|
|
|||||||
2015 and 2014
The following discussion is a comparison of our results of operations for the year ended December 31, 2015 to the year ended December 31, 2014.
Revenue. Our total revenue increased 9.6% to $636,399 in 2015 from $580,449 in 2014. The increase was due to an increase in advertising and sponsorship revenue of $45,065, an increase in private portal services revenue of $7,324 and an increase in information services revenue of $3,561. A more detailed discussion regarding changes in these revenue groupings is included below under “– Supplemental Financial and Operating Information.”
Cost of Operations. Cost of operations was $247,311 in 2015, compared to $224,094 in 2014. Our cost of operations represented 38.9% of revenue in 2015, compared to 38.6% of revenue in 2014. Included in cost of operations were non-cash expenses related to stock-based compensation of $5,217 in 2015, compared to $5,940 in 2014.
Cost of operations, excluding the non-cash stock-based compensation expense discussed above, was $242,094, or 38.0% of revenue in 2015, compared to $218,154, or 37.6% of revenue in 2014. The increase in absolute dollars in 2015, compared to 2014, was primarily attributable to the increased expense associated with the delivery of our advertising and sponsorship programs and the operations of our Websites, as well as the increased expense attributable to the timing of certain discretionary services delivered to our private portal clients during 2015.
Sales and Marketing. Sales and marketing expense was $138,025 in 2015, compared to $136,160 in 2014. Our sales and marketing expense represented 21.7% of revenue in 2015, compared to 23.5% in 2014. Included in sales and marketing expense were non-cash expenses related to stock-based compensation of $7,290 in 2015, compared to $7,221 in 2014.
69
Table of Contents
Index to Financial Statements
Sales and marketing expense, excluding the non-cash expenses discussed above, was $130,735, or 20.5% of revenue, in 2015, compared to $128,939, or 22.2% of revenue, in 2014. The decrease as a percentage of revenue, excluding the non-cash expenses discussed above, for 2015 compared to 2014, was primarily due to the increase in our revenue of 9.6% without a commensurate increase in our sales and marketing expenses as certain of these expenses are fixed in nature.
General and Administrative. General and administrative expense was $91,580 in 2015, compared to $94,119 in 2014. Our general and administrative expenses represented 14.4% of revenue in 2015, compared to 16.2% of revenue in 2014. Included in general and administrative expense was non-cash stock-based compensation expense of $21,236 in 2015, compared to $19,385 in 2014.
General and administrative expense, excluding the non-cash stock-based compensation expense discussed above, was $70,344, or 11.1% of revenue, in 2015, compared to $74,734, or 12.9% of revenue in 2014. The decrease in general and administrative expense as a percentage of revenue, excluding the non-cash expenses discussed above, for 2015 compared to 2014, was primarily due to the increase in our revenue of 9.6% without a commensurate increase in our general and administrative expenses as many of these expenses are fixed in nature.
Depreciation and Amortization. Depreciation and amortization expense was $30,521, or 4.8% of revenue in 2015, compared to $29,811, or 5.1% of revenue in 2014.
Interest Income. Interest income was $51 in 2015, which was relatively consistent when compared to $69 in 2014.
Interest Expense. Interest expense was $23,123 in 2015 compared to $24,686 in 2014. These amounts included non-cash interest expense, related to the amortization of the debt issuance costs for convertible debt, of $4,172 and $4,511 for 2015 and 2014, respectively. The decrease in interest expense for 2015 compared to 2014, was due to the repurchase of $149,550 principal amount of our 2.25% Notes during 2015.
Loss on Convertible Notes. During 2015, we recorded a loss on convertible notes of $2,058 related to the repurchase of $149,550 principal amount of our 2.25% Notes. See “– Introduction – Background Information on Certain Significant Developments and Transactions – Convertible Notes” for additional information.
Gain on Investments. Gain on investments of $139 for 2015 represents the gain from the sale of a portion of our available-for-sale securities.
Other Expense. Other expense of $4,100 for 2015 represents a charge related to the resolution of a patent infringement claim made against us by International Business Machines Corporation.
Income Tax Provision. The income tax provision of $35,847 in 2015 related to pre-tax income of $99,871, compared to the income tax provision of $30,707 in 2014 which related to pre-tax income of $71,648. The income tax provision represented 35.9% and 42.9% of pre-tax income in 2015 and 2014, respectively. The effective tax rate was lower than our statutory tax rate for 2015 as the income tax provision includes a non-cash income tax benefit of $4,724 due to the reversal of an income tax valuation allowance. This benefit reflects a correcting adjustment, made in the quarter ended June 30, 2015, to the income tax valuation allowance originally recorded during the year ended December 31, 2012, which increased our net loss in that year. The effective tax rate exceeded our statutory tax rate for 2014 as a result of certain expenses that are non-deductible for income tax purposes.
Income from Discontinued Operations, Net of Tax. Income from discontinued operations, net of tax, was $1,122 in 2014. During 2014, we paid $384 in connection with the completion of the remaining tax audits for all periods covered under a tax indemnification agreement related to our Porex business which was sold in 2009. The remaining balance in the indemnity liability of $1,122 was adjusted through income from discontinued operations during 2014.
70
Table of Contents
Index to Financial Statements
2014 and 2013
The following discussion is a comparison of our results of operations for the year ended December 31, 2014 to the year ended December 31, 2013.
Revenue. Our total revenue increased 12.6% to $580,449 in 2014 from $515,293 in 2013. The increase was primarily due to an increase of $36,938 of advertising and sponsorship revenue, an increase of $21,071 of revenue from our private portals and an increase of $7,147 from information services. A more detailed discussion regarding changes in these revenue groupings is included below under “– Supplemental Financial and Operating Information.”
Cost of Operations. Cost of operations was $224,094 in 2014, compared to $209,740 in 2013. Our cost of operations represented 38.6% of revenue in 2014, compared to 40.7% of revenue in 2013. Included in cost of operations were non-cash expenses related to stock-based compensation of $5,940 in 2014, compared to $6,762 in 2013.
Cost of operations, excluding the non-cash stock-based compensation expense discussed above, was $218,154, or 37.6% of revenue in 2014, compared to $202,978, or 39.4% of revenue in 2013. The increase in absolute dollars in 2014, compared to 2013, was primarily attributable to the increased expense associated with the delivery of our advertising and sponsorship programs and the operations of our Websites and expenses related to the delivery of services under our contract with the Blue Cross Blue Shield Association Federal Employee Program that launched on January 1, 2014. The decrease as a percentage of revenue in 2014, compared to 2013, was due to the increase in revenue of 12.6% without a commensurate increase in our cost of operations expense as certain of these expenses are fixed in nature.
Sales and Marketing. Sales and marketing expense was $136,160 in 2014, compared to $127,997 in 2013. Our sales and marketing expense represented 23.5% of revenue in 2014, compared to 24.8% in 2013. Included in sales and marketing expense were non-cash expenses related to stock-based compensation of $7,221 in 2014, compared to $8,395 in 2013.
Sales and marketing expense, excluding the non-cash expenses discussed above, was $128,939, or 22.2% of revenue, in 2014, compared to $119,602, or 23.2% of revenue, in 2013. The increase in absolute dollars was primarily attributable to an increase in certain compensation and other personnel related costs due to increased staffing and sales commissions related to the higher revenue in 2014 compared to 2013. The decrease as a percentage of revenue, excluding the non-cash expenses discussed above, for 2014 compared to 2013, was primarily due to the increase in our revenue of 12.6% without a commensurate increase in our sales and marketing expenses as certain of these expenses are fixed in nature.
General and Administrative. General and administrative expense was $94,119 in 2014, compared to $93,220 in 2013. Our general and administrative expenses represented 16.2% of revenue in 2014, compared to 18.1% of revenue in 2013. Included in general and administrative expense was non-cash stock-based compensation expense of $19,385 in 2014, compared to $23,393 in 2013. The decrease in non-cash stock-based compensation expense for 2014, compared to 2013, was primarily due to the acceleration of stock-based compensation expense in 2013, related to certain equity awards held by our former Chief Executive Officer in connection with his severance agreement.
General and administrative expense, excluding the non-cash stock-based compensation expense discussed above, was $74,734, or 12.9% of revenue, in 2014, compared to $69,827, or 13.6% of revenue in 2013. The decrease in general and administrative expense as a percentage of revenue, excluding the non-cash expenses discussed above, for 2014 compared to 2013, was primarily due to the increase in our revenue of 12.6% without a commensurate increase in our general and administrative expenses as many of these expenses are fixed in nature.
71
Table of Contents
Index to Financial Statements
Depreciation and Amortization. Depreciation and amortization expense was $29,811, or 5.1% of revenue in 2014, compared to $26,606, or 5.2% of revenue in 2013.
Interest Income. Interest income was $69 in 2014, which was relatively consistent when compared to $76 in 2013.
Interest Expense. Interest expense was $24,686 in 2014 compared to $22,826 in 2013. Interest expense increased during 2014 compared to 2013, primarily as a result of our 1.50% Notes that were issued on November 26, 2013, as well as the impact of the repurchase of $147,768 principal amount of our 2.25% Notes during 2013. Interest expense in 2014 and 2013 included non-cash interest expense of $4,511 and $4,192, respectively, related to the amortization of the debt issuance costs for the convertible debt outstanding during those periods.
Loss on Convertible Notes. During 2013, we recorded a loss on convertible notes of $4,871 related to the repurchase of $147,768 principal amount of our 2.25% Notes. See “–Introduction – Background Information on Certain Significant Developments and Transactions – Convertible Notes” for additional information.
Other Expense. Other expense of $1,353 during 2013 includes cash severance and related expenses due to the May 2013 departure of a Chief Executive Officer of our company.
Income Tax Provision. The income tax provision of $30,707 in 2014 related to pre-tax income of $71,648, compared to the income tax provision of $13,640 in 2013 which related to pre-tax income of $28,756. During 2014, the income tax provision represented 42.9% of pre-tax income. The effective tax rate exceeded our statutory tax rate as a result of certain expenses that are non-deductible for income tax purposes.
Income from Discontinued Operations, Net of Tax. Income from discontinued operations, net of tax, was $1,122 in 2014. During 2014, we paid $384 in connection with the completion of the remaining tax audits for all periods covered under a tax indemnification agreement related to our Porex business which was sold in 2009. The remaining balance of the indemnity liability of $1,122 was adjusted through income from discontinued operations during 2014.
Supplemental Financial and Operating Information
The following table and the discussion that follows presents information for groups of revenue based on similar services we provide, as well as information related to a non-GAAP performance measure that we use to monitor the performance of our business and which we refer to as “Earnings before interest, taxes, non-cash and other items” or “Adjusted EBITDA.” Due to the fact that Adjusted EBITDA is a non-GAAP measure, we have also included a reconciliation from Adjusted EBITDA to net income.
72
Table of Contents
Index to Financial Statements
| Years Ended December 31, | ||||||||||||
| 2015 | 2014 | 2013 | ||||||||||
| Revenue |
||||||||||||
| Advertising and sponsorship |
||||||||||||
| Biopharma and medical device |
$ | 371,220 | $ | 329,329 | $ | 304,018 | ||||||
| OTC, CPG and other |
127,805 | 124,636 | 113,009 | |||||||||
|
|
|
|
|
|
|
|||||||
| 499,025 | 453,965 | 417,027 | ||||||||||
| Private portal services |
110,441 | 103,182 | 82,111 | |||||||||
| Information services |
26,933 | 23,302 | 16,155 | |||||||||
|
|
|
|
|
|
|
|||||||
| $ | 636,399 | $ | 580,449 | $ | 515,293 | |||||||
|
|
|
|
|
|
|
|||||||
| Earnings before interest, taxes, non-cash and other items (Adjusted EBITDA) |
$ | 193,226 | $ | 158,622 | $ | 122,886 | ||||||
| Interest, taxes, non-cash and other items |
||||||||||||
| Interest income |
51 | 69 | 76 | |||||||||
| Interest expense |
(23,123 | ) | (24,686 | ) | (22,826 | ) | ||||||
| Income tax provision |
(35,847 | ) | (30,707 | ) | (13,640 | ) | ||||||
| Depreciation and amortization |
(30,521 | ) | (29,811 | ) | (26,606 | ) | ||||||
| Non-cash stock-based compensation |
(33,743 | ) | (32,546 | ) | (38,550 | ) | ||||||
| Loss on convertible notes |
(2,058 | ) | — | (4,871 | ) | |||||||
| Gain on investments |
139 | — | — | |||||||||
| Other expense |
(4,100 | ) | — | (1,353 | ) | |||||||
|
|
|
|
|
|
|
|||||||
| Income from continuing operations |
64,024 | 40,941 | 15,116 | |||||||||
| Income from discontinued operations, net of tax |
— | 1,122 | — | |||||||||
|
|
|
|
|
|
|
|||||||
| Net Income |
$ | 64,024 | $ | 42,063 | $ | 15,116 | ||||||
|
|
|
|
|
|
|
|||||||
2015 and 2014
The following discussion is a comparison of the results of operations for our groups of revenue and our Adjusted EBITDA for the year ended December 31, 2015 to the year ended December 31, 2014.
Advertising and Sponsorship. Advertising and sponsorship revenue was $499,025 in 2015, an increase of $45,060, or 9.9%, from 2014. The increase in revenue was primarily attributable to the increased adoption of our advertising and sponsorship offerings by biopharma and medical device companies as well as our OTC, CPG and other customers, which represented increases of $41,891 and $3,169, respectively. In general, pricing remained relatively stable for our public portal advertising and sponsorship offerings and was not a significant source of the revenue increase. For a more detailed discussion, see “– Introduction – Background Information on Certain Trends and Developments Affecting Our Business.”
Private Portal Services. Private portal services revenue was $110,441 in 2015, an increase of $7,259, or 7.0%, from 2014. This increase was primarily attributable to an increase in the services delivered during 2015 for certain client programs. In general, the pricing of our private portal services remained relatively stable and was not a significant source of the revenue increase. The number of customers using our private portal platform at December 31, 2015 was 91, compared to 102 customers using our private portal platform at December 31, 2014.
73
Table of Contents
Index to Financial Statements
Information Services. Information services revenue was $26,933 in 2015, an increase of $3,631, or 15.6%, from 2014. This increase was attributable to an increase in the rates charged to our customers for our information services and an increase in the number of customers licensing our information services.
Adjusted EBITDA. Adjusted EBITDA increased to $193,226 in 2015 compared to $158,622 in 2014. As a percentage of revenue, Adjusted EBITDA was 30.4% of revenue in 2015, compared to 27.3% in 2014. This increase as a percentage of revenue was primarily due to higher revenue in 2015. Many of our expenses are fixed in nature and do not vary directly with revenue, and accordingly, our Adjusted EBITDA as a percentage of revenue will fluctuate primarily as a result of changes in our revenue.
2014 and 2013
The following discussion is a comparison of the results of operations for our groups of revenue and our Adjusted EBITDA for the year ended December 31, 2014 to the year ended December 31, 2013.
Advertising and Sponsorship. Advertising and sponsorship revenue was $453,965 in 2014, an increase of $36,938, or 8.9%, from 2013. The increase in revenue was primarily attributable to an increased usage of our advertising and sponsorship offerings by our biopharma and medical device customers as well as our OTC, CPG and other customers, which represented increases of $25,311 and $11,627, respectively. In general, pricing remained relatively stable for our public portal advertising and sponsorship offerings and was not a significant source of the revenue increase.
Private Portal Services. Private portal services revenue was $103,182 in 2014, an increase of $21,071, or 25.7%, from 2013. This increase was primarily attributable to the January 1, 2014 launch of our contract with the Blue Cross Blue Shield Association Federal Employee Program. In general, the pricing of our private portal services remained relatively stable and was not a significant source of the revenue increase. The number of customers using our private portal platform at December 31, 2014 was 102, compared to 110 customers using our private portal platform at December 31, 2013.
Information Services. Information services revenue was $23,302 in 2014, an increase of $7,147, or 44.2%, from 2013. This increase was primarily attributable to an increase in the number of customers licensing our information services and an increase in the volume of data received by our customers, and to a lesser extent an increase in the rates charged to these customers.
Adjusted EBITDA. Adjusted EBITDA increased to $158,622 in 2014 compared to $122,886 in 2013. As a percentage of revenue, Adjusted EBITDA was 27.3% of revenue in 2014, compared to 23.8% in 2013. This increase as a percentage of revenue was primarily due to higher revenue in 2014. Many of our expenses are fixed in nature and do not vary directly with revenue, and accordingly, our Adjusted EBITDA as a percentage of revenue will fluctuate primarily as a result of changes in our revenue.
* * * *
Explanatory Note Regarding Adjusted EBITDA. Adjusted EBITDA is a non-GAAP financial measure and should be viewed as supplemental to, and not as an alternative for, “income (loss) from continuing operations” or “net income (loss)” calculated in accordance with GAAP. Our management uses Adjusted EBITDA as an additional measure of performance for purposes of business decision-making, including developing budgets, managing expenditures, and evaluating potential acquisitions or divestitures. Period-to-period comparisons of Adjusted EBITDA help our management identify additional trends in financial results that may not be shown solely by period-to-period comparisons of income (loss) from continuing operations or net income (loss). We believe that the presentation of Adjusted EBITDA is useful to investors in their analysis of our results for reasons similar to the reasons why our management finds it useful and because it helps facilitate investor understanding of decisions made by our management in light of the performance metrics used in making those decisions. In
74
Table of Contents
Index to Financial Statements
addition, we believe that providing Adjusted EBITDA, together with a reconciliation of Adjusted EBITDA to income (loss) from continuing operations or to net income (loss), helps investors make comparisons between us and other companies that may have different capital structures, different effective income tax rates and tax attributes, different capitalized asset values and/or different forms of employee compensation. Please see the “Explanation of Non-GAAP Financial Information” filed as Exhibit 99.1 to this Annual Report for additional background information regarding our use of Adjusted EBITDA. Exhibit 99.1 is incorporated in this MD&A by reference.
Liquidity and Capital Resources
Cash Flows
As of December 31, 2015, we had $641,165 of cash and cash equivalents and working capital of $564,541. Our cash and cash equivalents and working capital are affected by the timing of each period end in relation to items such as payments received from customers, payments made to vendors, the timing of interest payments related to our convertible debt, and internal payroll and billing cycles, as well as the seasonality within our business. Accordingly, our working capital, and its impact on cash flow from operations, can fluctuate materially from period to period.
Cash provided by operating activities in 2015 was $107,563, which related to net income of $64,024, adjusted for a loss on convertible notes of $2,058, a gain on investments of $139, a non-cash income tax benefit of $7,713 related to deferred income taxes, and other non-cash expenses of $68,436, which include depreciation and amortization expense, non-cash interest expense and non-cash stock-based compensation expense. Additionally, changes in operating assets and liabilities decreased operating cash flow by $19,103, primarily due to an increase in accounts receivable of $37,507 and an increase in prepaid expenses and other assets of $4,132, which was offset by an increase in accrued expenses and other long-term liabilities of $9,606 and an increase in deferred revenue of $12,930.
Cash provided by operating activities from continuing operations in 2014 was $113,536, which related to net income of $42,063, adjusted for income from discontinued operations of $1,122, a non-cash income tax provision of $14,717 related to deferred income taxes, and other non-cash expenses of $66,868, which include depreciation and amortization expense, non-cash interest expense and non-cash stock-based compensation expense. Additionally, changes in operating assets and liabilities decreased operating cash flow by $8,990, primarily due to an increase in accounts receivable of $12,574, an increase in prepaid expenses and other assets of $673, and a decrease in accrued expenses and other long-term liabilities of $380, which was offset by an increase in deferred revenue of $4,637.
Cash used in investing activities was $48,233 in 2015, compared $26,376 in 2014. We used $48,372 in connection with purchases of property and equipment in 2015, which includes approximately $28,000 related to the relocation and expansion of our corporate offices, compared to $23,194 of property and equipment purchases in 2014. During 2015, we also received $139 in cash proceeds from the sale of available-for-sale securities. Additionally, we used cash of $3,182 during 2014 to acquire the assets of TheraSim, Inc. Therasim’s technology provides the content and programming for certain of our sponsorship services.
Cash used in financing activities was $124,941 in 2015, compared to $204,880 in 2014. We used cash of $28,406 in 2015 and $128,748 in 2014 to repurchase shares of our Common Stock through our authorized repurchase program. Also during 2014, we used cash of $97,588 to repurchase shares of our Common Stock through the 2014 Tender Offer. We also used cash of $151,038 in 2015 to repurchase a portion of our 2.25% Notes. During 2015 and 2014, we received cash proceeds of $21,939 and $40,602, respectively, related to the exercise of stock options, and used cash of $6,438 and $33,385, respectively, for withholding taxes due on stock-based awards. Also included in cash flows from financing activities in 2015 and 2014, were excess tax benefits on stock-based awards of $39,002 and $14,239, respectively.
Included in our consolidated statements of cash flows for 2014, is cash used in discontinued operations of $384 which represents a payment made in connection with the completion of the remaining tax audits for all periods covered under a tax indemnification agreement related to our Porex business which was sold in 2009.
75
Table of Contents
Index to Financial Statements
Contractual Obligations and Commitments
The following table summarizes our principal commitments as of December 31, 2015 for future specified contractual obligations, as well as the estimated timing of the cash payments associated with these obligations. Management’s estimates of the timing of future cash flows are largely based on historical experience, and accordingly, actual timing of cash flows may vary from these estimates.
| Total | Less Than 1 Year |
2-3 Years | 4-5 Years | More Than 5 Years |
||||||||||||||||
| Leases (a) |
$ | 106,867 | $ | 14,773 | $ | 29,948 | $ | 28,449 | $ | 33,697 | ||||||||||
| 2.25% Convertible Notes due 2016 (b) |
$ | 103,260 | $ | 103,260 | $ | — | $ | — | $ | — | ||||||||||
| 2.50% Convertible Notes due 2018 (b) |
$ | 420,833 | $ | 10,000 | $ | 410,833 | $ | — | $ | — | ||||||||||
| 1.50% Convertible Notes due 2020 (b) |
$ | 322,125 | $ | 4,500 | $ | 9,000 | $ | 308,625 | $ | — | ||||||||||
| (a) | Represents leases of office facilities and data centers |
| (b) | Amounts include contractual interest payments |
The above table excludes $14,815 of uncertain tax positions, including interest and penalties, as we are unable to reasonably estimate the timing of the settlement of these items. See Note 11, “Income Taxes” located in the Notes to Consolidated Financial Statements included elsewhere in this Annual Report.
Outlook on Future Liquidity
As of December 31, 2015, we had $641 million of cash and cash equivalents.
Potential future uses of cash include repurchases of our Common Stock and Convertible Notes, payments related to the March 2016 maturity of our 2.25% Notes and our anticipated 2016 capital expenditure requirements. Our capital expenditure requirements during 2016, which we estimate to be approximately $30 million to $35 million, primarily relate to improvements that will be deployed across our public and private portal Websites in order to enable us to service future growth in unique users and page views, as well as to create new sponsorship areas for our customers, and to improve the systems used to provide our private portal applications. Additionally, our capital expenditures during 2016 will include the remaining costs associated with the relocation and expansion of our corporate office facilities.
Based on our plans and expectations, we believe that our available cash resources and future cash flow from operations will provide sufficient cash resources to meet the cash commitments of our convertible notes and to fund our currently anticipated working capital and capital expenditure requirements, for at least the next twenty-four months. Our future liquidity and capital requirements will depend upon numerous factors, including retention of customers at current volume and revenue levels, implementation of new or updated application and service offerings, competing technological and market developments and potential future acquisitions. In addition, our ability to generate cash flow is subject to numerous factors beyond our control, including general economic, regulatory and other matters affecting us and our customers. We plan to continue to enhance our online services and to continue to invest in acquisitions, strategic relationships, facilities and technological infrastructure and product development. We intend to grow each of our existing businesses and enter into complementary ones through both internal investments and acquisitions. We may need to raise additional funds to support expansion, develop new or enhanced applications and services, respond to competitive pressures, acquire complementary businesses or technologies or take advantage of unanticipated opportunities. If required, we may raise such additional funds through public or private debt or equity financing, strategic relationships or other arrangements. We cannot assure that such financing will be available on acceptable terms, if at all, or that such financing will not be dilutive to our stockholders. Future indebtedness may impose various restrictions and covenants on us that could limit our ability to respond to market conditions, to provide for unanticipated capital investments or to take advantage of business opportunities.
Off-Balance Sheet Arrangements
We have no material off-balance sheet arrangements.
76
Table of Contents
Index to Financial Statements
Recent Accounting Pronouncements
Accounting Pronouncement Adopted During 2015
In April 2014, the FASB issued ASU No. 2014-08, Reporting Discontinued Operations and Disclosures of Disposals of Components of an Entity, which changes the criteria for determining which disposals can be presented as discontinued operations and modifies the related disclosure requirements. Under the revised guidance, a discontinued operation is defined as a disposal of a component or group of components that represents a strategic shift that has, or will have, a major effect on an entity’s operations and financial results. The revised guidance was effective for us, on a prospective basis, beginning in the quarter ended March 31, 2015. The adoption of the revised guidance did not have an impact on our consolidated financial statements.
Accounting Pronouncements to be Adopted in the Future
In May 2014, the FASB issued ASU No. 2014-09, Revenue from Contracts with Customers (Topic 606), to achieve a consistent application of revenue recognition within the U.S., resulting in a single revenue model to be applied by reporting companies under GAAP. Under the new model, recognition of revenue occurs when a customer obtains control of promised goods or services in an amount that reflects the consideration to which the entity expects to be entitled in exchange for those goods or services. In addition, the revised guidance requires that reporting companies disclose the nature, amount, timing, and uncertainty of revenue and cash flows arising from contracts with customers. In August 2015, the FASB issued ASU No. 2015-14, Revenue from Contracts with Customers (Topic 606): Deferral of the Effective Date, which delays the effective date of ASU No. 2014-09 by one year. As a result, the revised guidance is effective for us beginning in the quarter ending March 31, 2018. Early adoption is permitted, but not before the original effective date of the guidance. The revised guidance is required to be applied retrospectively to each prior reporting period presented or retrospectively with the cumulative effect of initially applying it recognized at the date of initial application. We have not yet determined the impact that the revised guidance will have on our consolidated financial statements.
In June 2014, the FASB issued ASU No. 2014-12, Accounting for Share-Based Payments When the Terms of an Award Provide That a Performance Target Could Be Achieved after the Requisite Service Period, which requires that a performance target that affects vesting and that could be achieved after the requisite service period be treated as a performance condition. The revised guidance is effective for us beginning in the quarter ending March 31, 2016; early adoption is permitted. We do not expect that the adoption of this guidance will have any impact on our consolidated financial statements as we do not have any share-based awards with performance targets currently outstanding.
In April 2015, the FASB issued ASU No. 2015-03, Interest – Imputation of Interest (Subtopic 835-30): Simplifying the Presentation of Debt Issuance Costs, which requires that debt issuance costs related to a recognized debt liability be presented in the balance sheet as a direct deduction from the carrying amount of that debt liability, consistent with debt discounts. The revised guidance is effective for us beginning in the quarter ending March 31, 2016 and is required to be applied retrospectively. Early adoption is permitted. We expect that the adoption of this guidance will only affect the balance sheet classification of our debt issuance costs.
In April 2015, the FASB issued ASU No. 2015-05, Intangibles – Goodwill and Other – Internal-Use Software (Subtopic 350-40): Customer’s Accounting for Fees Paid in a Cloud Computing Arrangement, which provides guidance in determining whether a cloud computing arrangement includes a software license. If it is determined that a cloud computing arrangement does include a software license, the software element should be accounted for consistent with the acquisition of other software licenses. If the arrangement does not include a software license, it should be accounted for as a service contract. The revised guidance is effective for us beginning in the quarter ending March 31, 2016 and can be applied prospectively to all arrangements entered into or materially modified after the effective date or retrospectively. Early adoption is permitted. We do not expect the adoption of this guidance to have an impact on our consolidated financial statements.
In September 2015, the FASB issued ASU No. 2015-16, Business Combinations (Topic 805): Simplifying the Accounting for Measurement-Period Adjustments, which requires that the acquirer recognize adjustments to
77
Table of Contents
Index to Financial Statements
provisional amounts that are identified during the measurement period in the reporting period in which the adjustment amounts are determined, rather than retrospectively adjusting previously reported amounts. The revised guidance is effective for us beginning in the quarter ending March 31, 2016 and should be applied prospectively. Early adoption is permitted. We do not expect the adoption of this guidance to have an impact on our historical consolidated financial statements.
In November 2015, the FASB issued ASU No. 2015-17, Income Taxes (Topic 740): Balance Sheet Classification of Deferred Taxes, which requires that all deferred tax assets and liabilities, along with any related valuation allowance, be classified as noncurrent in the consolidated balance sheet instead of separating deferred taxes into current and noncurrent. The revised guidance is effective for us beginning in the quarter ending March 31, 2017 and should be applied either prospectively to all deferred tax assets and liabilities or retrospectively to all periods presented. Early adoption is permitted. We have not yet determined the impact the revised guidance will have on our consolidated financial statements.
In January 2016, the FASB issued ASU No. 2016-01, Financial Instruments-Overall (Subtopic 825-10): Recognition and Measurement of Financial Assets and Financial Liabilities, which revises the classification and measurement of investments in certain equity investments and the presentation of certain fair value changes for certain financial liabilities measured at fair value. ASU No. 2016-01 also requires the change in fair value of many equity investments to be recognized in net income. The revised guidance is effective for us beginning in the quarter ending March 31, 2018. We expect that the adoption of this guidance will only affect the balance sheet classification of our deferred tax assets.
In February 2016, the FASB issued ASU No. 2016-01, Leases (Topic 842), which requires lessees to recognize the following for all leases (with the exception of short-term leases) at the commencement date: a lease liability, which is a lessee’s obligation to make lease payments arising from a lease, measured on a discounted basis; and a right-of-use asset, which is an asset that represents the lessee’s right to use, or control the use of, a specified asset for the lease term. The revised guidance must be applied on a modified retrospective transition approach for leases existing at, or entered into after, the beginning of the earliest comparative period presented in the financial statements. The revised guidance is effective for us beginning in the quarter ending March 31, 2019. We have not yet determined the impact the revised guidance will have on our consolidated financial statements.
| Item 7A. | Quantitative and Qualitative Disclosures about Market Risk |
Interest Rate Sensitivity
The primary objective of our investment activities is to preserve principal and maintain adequate liquidity.
The value of our cash and money market investments, which were approximately $641 million at December 31, 2015, is not subject to changes in interest rates.
The 2.50% Notes, 2.25% Notes and 1.50% Notes have fixed interest rates; therefore, changes in interest rates will not impact our results of operations or financial position.
Exchange Rate Sensitivity
Substantially all of our revenues and expenses are denominated in United States dollars; however, a portion of the revenue from our international operations was contracted in foreign currencies. The impact of changes in exchange rates for each of the three years in the period ended December 31, 2015 has been reflected in our results of operations and was not material, and future changes in exchange rates are not expected to have a material impact on our results of operations or financial position.
78
Table of Contents
Index to Financial Statements
| Item 8. | Financial Statements and Supplementary Data |
Financial Statements
Our financial statements required by this item are contained on pages F-1 through F-36 of this Annual Report on Form 10-K. See Item 15(a)(1) for a listing of financial statements provided.
| Item 9. | Changes in and Disagreements with Accountants on Accounting and Financial Disclosure |
None.
| Item 9A. | Controls and Procedures |
As required by Exchange Act Rule 13a-15(b), WebMD management, including the Chief Executive Officer and Chief Financial Officer, conducted an evaluation of the effectiveness of WebMD’s disclosure controls and procedures, as defined in Exchange Act Rule 13a-15(e), as of December 31, 2015. Based on that evaluation, the Chief Executive Officer and Chief Financial Officer concluded that WebMD’s disclosure controls and procedures were effective as of December 31, 2015.
In connection with the evaluation required by Exchange Act Rule 13a-15(d), WebMD management, including the Chief Executive Officer and Chief Financial Officer, concluded that there were no changes in WebMD’s internal control over financial reporting, as defined in Exchange Act Rule 13a-15(f), during the fourth quarter of 2015 that have materially affected, or are reasonably likely to materially affect, WebMD’s internal control over financial reporting.
| Item 9B. | Other Information |
None.
79
Table of Contents
Index to Financial Statements
Information required by Items 10, 11, 12, 13 and 14 of Part III is omitted from this Annual Report and will be filed in a definitive proxy statement or by an amendment to this Annual Report not later than 120 days after the end of the fiscal year covered by this Annual Report.
| Item 10. | Directors, Executive Officers and Corporate Governance |
We will provide information that is responsive to this Item 10 in our definitive proxy statement or in an amendment to this Annual Report not later than 120 days after the end of the fiscal year covered by this Annual Report, in either case under the captions “Directors and Executive Officers” and “Corporate Governance” and possibly elsewhere therein. That information is incorporated in this Item 10 by reference.
| Item 11. | Executive Compensation |
We will provide information that is responsive to this Item 11 in our definitive proxy statement or in an amendment to this Annual Report not later than 120 days after the end of the fiscal year covered by this Annual Report, in either case under the caption “Executive Compensation,” and possibly elsewhere therein. That information is incorporated in this Item 11 by reference.
| Item 12. | Security Ownership of Certain Beneficial Owners and Management and Related Stockholder Matters |
We will provide information that is responsive to this Item 12 in our definitive proxy statement or in an amendment to this Annual Report not later than 120 days after the end of the fiscal year covered by this Annual Report, in either case under the caption “Security Ownership of Certain Beneficial Owners and Management and Related Stockholder Matters,” and possibly elsewhere therein. That information is incorporated in this Item 12 by reference.
| Item 13. | Certain Relationships and Related Transactions, and Director Independence |
We will provide information that is responsive to this Item 13 in our definitive proxy statement or in an amendment to this Annual Report not later than 120 days after the end of the fiscal year covered by this Annual Report, in either case under the caption “Certain Relationships and Related Transactions,” and possibly elsewhere therein. That information is incorporated in this Item 13 by reference.
| Item 14. | Principal Accountant Fees and Services |
We will provide information that is responsive to this Item 14 in our definitive proxy statement or in an amendment to this Annual Report not later than 120 days after the end of the fiscal year covered by this Annual Report, in either case under the caption “Services and Fees of Ernst & Young,” and possibly elsewhere therein. That information is incorporated in this Item 14 by reference.
80
Table of Contents
Index to Financial Statements
| Item 15. | Exhibits and Financial Statement Schedule |
(a)(1)-(2) Financial Statements and Schedule
The financial statements and schedule listed in the accompanying Index to Consolidated Financial Statements and Supplemental Data on page F-1 are filed as part of this Report.
(a)(3) Exhibits
See “Index to Exhibits” beginning on page E-1, which is incorporated by reference herein. The Index to Exhibits lists all exhibits filed with this Report and identifies which of those exhibits are management contracts and compensation plans.
81
Table of Contents
Index to Financial Statements
Pursuant to the requirements of Section 13 or 15(d) of the Securities Exchange Act of 1934, the registrant has duly caused this Annual Report to be signed on its behalf by the undersigned, thereunto duly authorized, on the 29th day of February, 2016.
| WEBMD HEALTH CORP. | ||
| By: | /S/ PETER ANEVSKI | |
| Peter Anevski | ||
| Executive Vice President and Chief Financial Officer | ||
Pursuant to the requirements of the Securities Exchange Act of 1934, this Annual Report has been signed below by the following persons on behalf of the registrant and in the capacities and on the dates indicated.
| Signature |
Capacity |
Date | ||
| /S/ DAVID J. SCHLANGER David J. Schlanger |
Chief Executive Officer (principal executive officer) |
February 29, 2016 | ||
| /S/ PETER ANEVSKI Peter Anevski |
Chief Financial Officer (principal financial and accounting officer) |
February 29, 2016 | ||
| /S/ MARK J. ADLER, M.D. Mark J. Adler, M.D. |
Director |
February 29, 2016 | ||
| /S/ NEIL F. DIMICK Neil F. Dimick |
Director |
February 29, 2016 | ||
| /S/ JEROME C. KELLER Jerome C. Keller |
Director |
February 29, 2016 | ||
| /S/ JAMES V. MANNING James V. Manning |
Director |
February 29, 2016 | ||
| /S/ WILLIAM J. MARINO William J. Marino |
Director |
February 29, 2016 | ||
| /S/ JOSEPH E. SMITH Joseph E. Smith |
Director |
February 29, 2016 | ||
| /S/ STANLEY S. TROTMAN, JR. Stanley S. Trotman, Jr. |
Director |
February 29, 2016 | ||
| /S/ KRISTIINA VUORI, M.D. Kristiina Vuori, M.D. |
Director |
February 29, 2016 | ||
| /S/ MARTIN J. WYGOD Martin J. Wygod |
Director |
February 29, 2016 | ||
82
Table of Contents
Index to Financial Statements
INDEX TO CONSOLIDATED FINANCIAL STATEMENTS AND SUPPLEMENTAL DATA
| Page | ||||
| Historical Financial Statements: |
||||
| Report of Management on Internal Control Over Financial Reporting |
F-2 | |||
| Report of Independent Registered Public Accounting Firm on Internal Control Over Financial Reporting |
F-3 | |||
| F-4 | ||||
| Consolidated Balance Sheets as of December 31, 2015 and 2014 |
F-5 | |||
| Consolidated Statements of Operations for the Years Ended December 31, 2015, 2014 and 2013 |
F-6 | |||
| Consolidated Statements of Comprehensive Income for the Years Ended December 31, 2015, 2014 and 2013 |
F-7 | |||
| Consolidated Statements of Equity for the Years Ended December 31, 2015, 2014 and 2013 |
F-8 | |||
| Consolidated Statements of Cash Flows for the Years Ended December 31, 2015, 2014 and 2013 |
F-9 | |||
| F-10 | ||||
| Supplemental Financial Data: |
||||
| The following supplemental financial data of the Registrant and its subsidiaries required to be included in Item 15(a)(2) on Form 10-K are listed below: |
||||
| S-1 | ||||
All other schedules not listed above have been omitted as not applicable or because the required information is included in the Consolidated Financial Statements or in the notes thereto. Columns omitted from the schedule filed have been omitted because the information is not applicable.
F-1
Table of Contents
Index to Financial Statements
REPORT OF MANAGEMENT ON INTERNAL CONTROL OVER FINANCIAL REPORTING
Management of WebMD Health Corp. is responsible for establishing and maintaining adequate internal control over financial reporting. Internal control over financial reporting is defined in Rules 13a-15(f) and 15d-15(f) promulgated under the Securities Exchange Act of 1934 (the Exchange Act) as a process designed by, or under the supervision of, a company’s principal executive and principal financial officers and effected by its board of directors, management and other personnel, to provide reasonable assurance regarding the reliability of financial reporting and the preparation of financial statements for external purposes in accordance with generally accepted accounting principles. Internal control over financial reporting includes those policies and procedures that:
| • | pertain to the maintenance of records that, in reasonable detail, accurately and fairly reflect the transactions and dispositions of the assets of the company; |
| • | provide reasonable assurance that transactions are recorded as necessary to permit preparation of financial statements in accordance with generally accepted accounting principles, and that receipts and expenditures of the company are being made only in accordance with authorizations of management and directors of the company; and |
| • | provide reasonable assurance regarding prevention or timely detection of unauthorized acquisition, use, or disposition of the company’s assets that could have a material effect on the financial statements. |
Internal control over financial reporting includes the controls themselves, monitoring and internal auditing practices and actions taken to correct deficiencies as identified.
Because of its inherent limitations, internal control over financial reporting may not prevent or detect misstatements. Also, projections of any evaluation of effectiveness to future periods are subject to the risk that controls may become inadequate because of changes in conditions, or that the degree of compliance with the policies or procedures may deteriorate.
WebMD management assessed the effectiveness of WebMD’s internal control over financial reporting as of December 31, 2015. In making this assessment, WebMD management used the criteria set forth in Internal Control — Integrated Framework issued by the Committee of Sponsoring Organizations of the Treadway Commission (2013 framework). Based on that assessment and those criteria, WebMD management concluded that WebMD maintained effective internal control over financial reporting as of December 31, 2015.
Ernst & Young LLP, the independent registered public accounting firm that audited and reported on the Company’s consolidated financial statements as of December 31, 2015 and 2014 and for each of the three years in the period ended December 31, 2015, has audited the Company’s internal control over financial reporting as of December 31, 2015, as stated in their report which appears on page F-3.
February 29, 2016
F-2
Table of Contents
Index to Financial Statements
REPORT OF INDEPENDENT REGISTERED PUBLIC ACCOUNTING FIRM
The Board of Directors and Stockholders of WebMD Health Corp.
We have audited WebMD Health Corp.’s internal control over financial reporting as of December 31, 2015, based on criteria established in Internal Control–Integrated Framework issued by the Committee of Sponsoring Organizations of the Treadway Commission (2013 framework) (the COSO criteria). WebMD Health Corp.’s management is responsible for maintaining effective internal control over financial reporting, and for its assessment of the effectiveness of internal control over financial reporting included in the accompanying Report of Management on Internal Control Over Financial Reporting. Our responsibility is to express an opinion on the company’s internal control over financial reporting based on our audit.
We conducted our audit in accordance with the standards of the Public Company Accounting Oversight Board (United States). Those standards require that we plan and perform the audit to obtain reasonable assurance about whether effective internal control over financial reporting was maintained in all material respects. Our audit included obtaining an understanding of internal control over financial reporting, assessing the risk that a material weakness exists, testing and evaluating the design and operating effectiveness of internal control based on the assessed risk, and performing such other procedures as we considered necessary in the circumstances. We believe that our audit provides a reasonable basis for our opinion.
A company’s internal control over financial reporting is a process designed to provide reasonable assurance regarding the reliability of financial reporting and the preparation of financial statements for external purposes in accordance with generally accepted accounting principles. A company’s internal control over financial reporting includes those policies and procedures that (1) pertain to the maintenance of records that, in reasonable detail, accurately and fairly reflect the transactions and dispositions of the assets of the company; (2) provide reasonable assurance that transactions are recorded as necessary to permit preparation of financial statements in accordance with generally accepted accounting principles, and that receipts and expenditures of the company are being made only in accordance with authorizations of management and directors of the company; and (3) provide reasonable assurance regarding prevention or timely detection of unauthorized acquisition, use or disposition of the company’s assets that could have a material effect on the financial statements.
Because of its inherent limitations, internal control over financial reporting may not prevent or detect misstatements. Also, projections of any evaluation of effectiveness to future periods are subject to the risk that controls may become inadequate because of changes in conditions, or that the degree of compliance with the policies or procedures may deteriorate.
In our opinion, WebMD Health Corp. maintained, in all material respects, effective internal control over financial reporting as of December 31, 2015, based on the COSO criteria.
We also have audited, in accordance with the standards of the Public Company Accounting Oversight Board (United States), the consolidated balance sheets of WebMD Health Corp. as of December 31, 2015 and 2014, and the related consolidated statements of operations, comprehensive income, equity and cash flows for each of the three years in the period ended December 31, 2015 of WebMD Health Corp. and our report dated February 29, 2016 expressed an unqualified opinion thereon.
/s/ Ernst & Young LLP
New York, New York
February 29, 2016
F-3
Table of Contents
Index to Financial Statements
REPORT OF INDEPENDENT REGISTERED PUBLIC ACCOUNTING FIRM
The Board of Directors and Stockholders of WebMD Health Corp.
We have audited the accompanying consolidated balance sheets of WebMD Health Corp. as of December 31, 2015 and 2014, and the related consolidated statements of operations, comprehensive income, equity, and cash flows for each of the three years in the period ended December 31, 2015. Our audits also included the financial statement schedule listed in the Index at Item 15(a). These financial statements and schedule are the responsibility of the Company’s management. Our responsibility is to express an opinion on these financial statements and schedule based on our audits.
We conducted our audits in accordance with the standards of the Public Company Accounting Oversight Board (United States). Those standards require that we plan and perform the audit to obtain reasonable assurance about whether the financial statements are free of material misstatement. An audit includes examining, on a test basis, evidence supporting the amounts and disclosures in the financial statements. An audit also includes assessing the accounting principles used and significant estimates made by management, as well as evaluating the overall financial statement presentation. We believe that our audits provide a reasonable basis for our opinion.
In our opinion, the financial statements referred to above present fairly, in all material respects, the consolidated financial position of WebMD Health Corp. at December 31, 2015 and 2014, and the consolidated results of its operations and its cash flows for each of the three years in the period ended December 31, 2015, in conformity with U.S. generally accepted accounting principles. Also, in our opinion, the related financial statement schedule, when considered in relation to the basic financial statements taken as a whole, presents fairly in all material respects the information set forth therein.
We also have audited, in accordance with the standards of the Public Company Accounting Oversight Board (United States), WebMD Health Corp.’s internal control over financial reporting as of December 31, 2015, based on criteria established in Internal Control-Integrated Framework issued by the Committee of Sponsoring Organizations of the Treadway Commission (2013 framework) and our report dated February 29, 2016 expressed an unqualified opinion thereon.
/s/ Ernst & Young LLP
New York, New York
February 29, 2016
F-4
Table of Contents
Index to Financial Statements
CONSOLIDATED BALANCE SHEETS
(In thousands, except share and per share data)
| December 31, | ||||||||
| 2015 | 2014 | |||||||
| ASSETS |
||||||||
| Current assets: |
||||||||
| Cash and cash equivalents |
$ | 641,165 | $ | 706,776 | ||||
| Accounts receivable, net of allowance for doubtful accounts of $1,040 at December 31, 2015 and $631 at December 31, 2014 |
174,313 | 136,806 | ||||||
| Prepaid expenses and other current assets |
18,998 | 13,877 | ||||||
| Deferred tax assets |
16,126 | 18,147 | ||||||
|
|
|
|
|
|||||
| Total current assets |
850,602 | 875,606 | ||||||
| Property and equipment, net |
81,027 | 59,573 | ||||||
| Goodwill |
202,980 | 202,980 | ||||||
| Intangible assets, net |
10,894 | 14,215 | ||||||
| Deferred tax assets |
— | 18,947 | ||||||
| Other assets |
20,464 | 26,236 | ||||||
|
|
|
|
|
|||||
| TOTAL ASSETS |
$ | 1,165,967 | $ | 1,197,557 | ||||
|
|
|
|
|
|||||
| LIABILITIES AND STOCKHOLDERS’ EQUITY |
||||||||
| Current liabilities: |
||||||||
| Accrued expenses |
$ | 80,664 | $ | 72,658 | ||||
| Deferred revenue |
102,715 | 89,785 | ||||||
| 2.25% convertible notes due 2016 |
102,682 | — | ||||||
|
|
|
|
|
|||||
| Total current liabilities |
286,061 | 162,443 | ||||||
| 2.25% convertible notes due 2016… |
— | 252,232 | ||||||
| 2.50% convertible notes due 2018 |
400,000 | 400,000 | ||||||
| 1.50% convertible notes due 2020 |
300,000 | 300,000 | ||||||
| Other long-term liabilities |
23,678 | 21,293 | ||||||
| Commitments and contingencies |
||||||||
| Stockholders’ equity: |
||||||||
| Preferred stock, 50,000,000 shares authorized; no shares issued and outstanding |
— | — | ||||||
| Common stock, $0.01 par value per share, 650,000,000 shares authorized; 57,437,992 shares issued at December 31, 2015 and December 31, 2014 |
574 | 574 | ||||||
| Additional paid-in capital |
9,238,444 | 9,214,800 | ||||||
| Treasury stock, at cost; 20,621,216 shares at December 31, 2015 and 21,084,995 shares at December 31, 2014 |
(678,069 | ) | (685,659 | ) | ||||
| Accumulated other comprehensive income |
357 | 976 | ||||||
| Accumulated deficit |
(8,405,078 | ) | (8,469,102 | ) | ||||
|
|
|
|
|
|||||
| Stockholders’ equity |
156,228 | 61,589 | ||||||
|
|
|
|
|
|||||
| TOTAL LIABILITIES AND STOCKHOLDERS’ EQUITY |
$ | 1,165,967 | $ | 1,197,557 | ||||
|
|
|
|
|
|||||
See accompanying notes.
F-5
Table of Contents
Index to Financial Statements
CONSOLIDATED STATEMENTS OF OPERATIONS
(In thousands, except per share data)
| Years Ended December 31, | ||||||||||||
| 2015 | 2014 | 2013 | ||||||||||
| Revenue |
$ | 636,399 | $ | 580,449 | $ | 515,293 | ||||||
| Cost of operations |
247,311 | 224,094 | 209,740 | |||||||||
| Sales and marketing |
138,025 | 136,160 | 127,997 | |||||||||
| General and administrative |
91,580 | 94,119 | 93,220 | |||||||||
| Depreciation and amortization |
30,521 | 29,811 | 26,606 | |||||||||
| Interest income |
51 | 69 | 76 | |||||||||
| Interest expense |
23,123 | 24,686 | 22,826 | |||||||||
| Loss on convertible notes |
2,058 | — | 4,871 | |||||||||
| Gain on investments |
139 | — | — | |||||||||
| Other expense |
4,100 | — | 1,353 | |||||||||
|
|
|
|
|
|
|
|||||||
| Income from continuing operations before income tax provision |
99,871 | 71,648 | 28,756 | |||||||||
| Income tax provision |
35,847 | 30,707 | 13,640 | |||||||||
|
|
|
|
|
|
|
|||||||
| Income from continuing operations |
64,024 | 40,941 | 15,116 | |||||||||
| Income from discontinued operations, net of tax |
— | 1,122 | — | |||||||||
|
|
|
|
|
|
|
|||||||
| Net income |
$ | 64,024 | $ | 42,063 | $ | 15,116 | ||||||
|
|
|
|
|
|
|
|||||||
| Basic income per common share: |
||||||||||||
| Income from continuing operations |
$ | 1.75 | $ | 1.08 | $ | 0.32 | ||||||
| Income from discontinued operations |
— | 0.03 | — | |||||||||
|
|
|
|
|
|
|
|||||||
| Net income |
$ | 1.75 | $ | 1.11 | $ | 0.32 | ||||||
|
|
|
|
|
|
|
|||||||
| Diluted income per common share: |
||||||||||||
| Income from continuing operations |
$ | 1.48 | $ | 0.97 | $ | 0.31 | ||||||
| Income from discontinued operations |
— | 0.03 | — | |||||||||
|
|
|
|
|
|
|
|||||||
| Net income |
$ | 1.48 | $ | 1.00 | $ | 0.31 | ||||||
|
|
|
|
|
|
|
|||||||
| Weighted-average shares outstanding used in |
||||||||||||
| computing per share amounts: |
||||||||||||
| Basic |
36,600 | 37,869 | 46,830 | |||||||||
|
|
|
|
|
|
|
|||||||
| Diluted |
52,653 | 45,614 | 48,398 | |||||||||
|
|
|
|
|
|
|
|||||||
See accompanying notes.
F-6
Table of Contents
Index to Financial Statements
CONSOLIDATED STATEMENTS OF COMPREHENSIVE INCOME
(In thousands)
| Years Ended December 31, | ||||||||||||
| 2015 | 2014 | 2013 | ||||||||||
| Net income |
$ | 64,024 | $ | 42,063 | $ | 15,116 | ||||||
| Other comprehensive (loss) income, net of tax: |
||||||||||||
| Unrealized (loss) gain on available-for-sale securities |
(619 | ) | 976 | — | ||||||||
|
|
|
|
|
|
|
|||||||
| Total other comprehensive (loss) income, net of tax |
(619 | ) | 976 | — | ||||||||
|
|
|
|
|
|
|
|||||||
| Comprehensive income |
$ | 63,405 | $ | 43,039 | $ | 15,116 | ||||||
|
|
|
|
|
|
|
|||||||
See accompanying notes.
F-7
Table of Contents
Index to Financial Statements
CONSOLIDATED STATEMENTS OF EQUITY
(In thousands, except share data)
| ` | Stockholders’ Equity | |||||||||||||||||||||||||||||||
| Additional Paid-In Capital |
Accumulated Other Comprehensive Income |
Total Stockholders’ Equity |
||||||||||||||||||||||||||||||
| Common Stock | Treasury Stock | Accumulated Deficit |
||||||||||||||||||||||||||||||
| Shares | Amount | Shares | Amount | |||||||||||||||||||||||||||||
| Balances at December 31, 2012 |
62,437,992 | $ | 624 | $ | 9,489,099 | 13,425,144 | $ | (453,453 | ) | $ | — | $ | (8,526,281 | ) | $ | 509,989 | ||||||||||||||||
| Net income |
— | — | — | — | — | — | 15,116 | 15,116 | ||||||||||||||||||||||||
| Issuance of stock for option exercises and other issuances |
— | — | (83,165 | ) | (1,938,041 | ) | 100,961 | — | — | 17,796 | ||||||||||||||||||||||
| Tax benefit realized from issuances of common stock |
— | — | 58 | — | — | — | — | 58 | ||||||||||||||||||||||||
| Stock-based compensation expense |
— | — | 38,186 | — | — | — | — | 38,186 | ||||||||||||||||||||||||
| Repurchase of shares through tender offers |
(5,000,000 | ) | (50 | ) | (170,466 | ) | — | — | — | — | (170,516 | ) | ||||||||||||||||||||
| Purchases of treasury stock |
— | — | — | 6,794,395 | (219,729 | ) | — | — | (219,729 | ) | ||||||||||||||||||||||
|
|
|
|
|
|
|
|
|
|
|
|
|
|
|
|
|
|||||||||||||||||
| Balances at December 31, 2013 |
57,437,992 | 574 | 9,273,712 | 18,281,498 | (572,221 | ) | — | (8,511,165 | ) | 190,900 | ||||||||||||||||||||||
| Net income |
— | — | — | — | — | — | 42,063 | 42,063 | ||||||||||||||||||||||||
| Other comprehensive income, net of tax |
— | — | — | — | — | 976 | — | 976 | ||||||||||||||||||||||||
| Issuance of stock for option exercises and other issuances |
— | — | (105,382 | ) | (2,356,573 | ) | 112,898 | — | — | 7,516 | ||||||||||||||||||||||
| Tax benefit realized from issuances of common stock |
— | — | 14,239 | — | — | — | — | 14,239 | ||||||||||||||||||||||||
| Stock-based compensation expense |
— | — | 32,231 | — | — | — | — | 32,231 | ||||||||||||||||||||||||
| Repurchase of shares through tender offers |
— | — | — | 2,000,000 | (97,588 | ) | — | — | (97,588 | ) | ||||||||||||||||||||||
| Purchases of treasury stock |
— | — | — | 3,160,070 | (128,748 | ) | — | — | (128,748 | ) | ||||||||||||||||||||||
|
|
|
|
|
|
|
|
|
|
|
|
|
|
|
|
|
|||||||||||||||||
| Balances at December 31, 2014 |
57,437,992 | 574 | 9,214,800 | 21,084,995 | (685,659 | ) | 976 | (8,469,102 | ) | 61,589 | ||||||||||||||||||||||
| Net income |
— | — | — | — | — | — | 64,024 | 64,024 | ||||||||||||||||||||||||
| Other comprehensive loss, net of tax |
— | — | — | — | — | (619 | ) | — | (619 | ) | ||||||||||||||||||||||
| Issuance of stock for option exercises and other issuances |
— | — | (19,135 | ) | (1,152,246 | ) | 35,996 | — | — | 16,861 | ||||||||||||||||||||||
| Tax benefit realized from issuances of common stock |
— | — | 39,002 | — | — | — | — | 39,002 | ||||||||||||||||||||||||
| Correcting adjustment to prior years’ tax benefits realized from issuances |
— | — | (29,499 | ) | — | — | — | — | (29,499 | ) | ||||||||||||||||||||||
| Stock-based compensation expense |
— | — | 33,276 | — | — | — | — | 33,276 | ||||||||||||||||||||||||
| Purchases of treasury stock |
— | — | — | 688,467 | (28,406 | ) | — | — | (28,406 | ) | ||||||||||||||||||||||
|
|
|
|
|
|
|
|
|
|
|
|
|
|
|
|
|
|||||||||||||||||
| Balances at December 31, 2015 |
57,437,992 | $ | 574 | $ | 9,238,444 | 20,621,216 | $ | (678,069 | ) | $ | 357 | $ | (8,405,078 | ) | $ | 156,228 | ||||||||||||||||
|
|
|
|
|
|
|
|
|
|
|
|
|
|
|
|
|
|||||||||||||||||
See accompanying notes.
F-8
Table of Contents
Index to Financial Statements
CONSOLIDATED STATEMENTS OF CASH FLOWS
(In thousands)
| Years Ended December 31, | ||||||||||||
| 2015 | 2014 | 2013 | ||||||||||
| Cash flows from operating activities: |
||||||||||||
| Net income |
$ | 64,024 | $ | 42,063 | $ | 15,116 | ||||||
| Adjustments to reconcile net income to net cash provided by operating activities: |
||||||||||||
| Income from discontinued operations, net of tax |
— | (1,122 | ) | — | ||||||||
| Depreciation and amortization |
30,521 | 29,811 | 26,606 | |||||||||
| Non-cash interest, net |
4,172 | 4,511 | 4,192 | |||||||||
| Non-cash stock-based compensation |
33,743 | 32,546 | 38,550 | |||||||||
| Deferred income taxes |
(7,713 | ) | 14,717 | 13,070 | ||||||||
| Loss on convertible notes |
2,058 | — | 4,871 | |||||||||
| Gain on investments |
(139 | ) | — | — | ||||||||
| Changes in operating assets and liabilities: |
||||||||||||
| Accounts receivable |
(37,507 | ) | (12,574 | ) | (17,610 | ) | ||||||
| Prepaid expenses and other, net |
(4,132 | ) | (673 | ) | 266 | |||||||
| Accrued expenses and other long-term liabilities |
9,606 | (380 | ) | 8,061 | ||||||||
| Deferred revenue |
12,930 | 4,637 | (7,028 | ) | ||||||||
|
|
|
|
|
|
|
|||||||
| Net cash provided by continuing operations |
107,563 | 113,536 | 86,094 | |||||||||
| Net cash used in discontinued operations |
— | (384 | ) | — | ||||||||
|
|
|
|
|
|
|
|||||||
| Net cash provided by operating activities |
107,563 | 113,152 | 86,094 | |||||||||
| Cash flows from investing activities: |
||||||||||||
| Cash paid in business combination |
— | (3,182 | ) | — | ||||||||
| Proceeds from sale of investments |
139 | — | — | |||||||||
| Purchases of property and equipment |
(48,372 | ) | (23,194 | ) | (22,341 | ) | ||||||
| Proceeds from sale of property and equipment |
— | — | 1,381 | |||||||||
|
|
|
|
|
|
|
|||||||
| Net cash used in investing activities |
(48,233 | ) | (26,376 | ) | (20,960 | ) | ||||||
| Cash flows from financing activities: |
||||||||||||
| Proceeds from exercise of stock options |
21,939 | 40,602 | 29,724 | |||||||||
| Cash used for withholding taxes due on stock-based awards |
(6,438 | ) | (33,385 | ) | (12,526 | ) | ||||||
| Net proceeds from issuance of convertible notes |
— | — | 291,823 | |||||||||
| Repurchase of convertible notes |
(151,038 | ) | — | (150,354 | ) | |||||||
| Repurchase of shares through tender offers |
— | (97,588 | ) | (170,516 | ) | |||||||
| Purchases of treasury stock |
(28,406 | ) | (128,748 | ) | (220,298 | ) | ||||||
| Excess tax benefit on stock-based awards |
39,002 | 14,239 | 58 | |||||||||
|
|
|
|
|
|
|
|||||||
| Net cash used in financing activities |
(124,941 | ) | (204,880 | ) | (232,089 | ) | ||||||
|
|
|
|
|
|
|
|||||||
| Net decrease in cash and cash equivalents |
(65,611 | ) | (118,104 | ) | (166,955 | ) | ||||||
| Cash and cash equivalents at beginning of period |
706,776 | 824,880 | 991,835 | |||||||||
|
|
|
|
|
|
|
|||||||
| Cash and cash equivalents at end of period |
$ | 641,165 | $ | 706,776 | $ | 824,880 | ||||||
|
|
|
|
|
|
|
|||||||
See accompanying notes.
F-9
Table of Contents
Index to Financial Statements
NOTES TO CONSOLIDATED FINANCIAL STATEMENTS
(In thousands, except share and per share data)
1. Background and Basis of Presentation
Background
WebMD Health Corp. (the “Company” or “WebMD”) is a Delaware corporation that was incorporated on May 3, 2005. The Company completed an initial public offering on September 28, 2005. The Company’s Common Stock trades under the symbol “WBMD” on the Nasdaq Global Select Market. The Company generates revenue from the advertising and sponsorship services of The WebMD Health Network and related operations, from the private portal services it markets under the WebMD Health Services brand and from certain information services, each of which is described below and discussed further under “Presentation of Segment Information” in Note 2.
Advertising and Sponsorship. The WebMD Health Network includes: www.WebMD.com, the Company’s primary public portal for consumers and related mobile-optimized sites and mobile apps; www.Medscape.com, the Company’s primary public portal for physicians and other healthcare professionals and related mobile services; and other sites and apps through which the Company provides branded health and wellness content, tools and services. The Company’s services for consumers enable them to obtain information on health and wellness topics or on a particular disease or condition, to assess their personal health status, to use online trackers, tools and quizzes, to locate physicians, to receive periodic e-mailed newsletters and alerts on topics of individual interest, and to participate in online communities with peers and experts. The Company’s services for physicians and healthcare professionals make it easier for them to access clinical reference sources, stay abreast of the latest clinical information, learn about new treatment options, earn continuing medical education (“CME”) credit and communicate with peers. The Company does not charge any usage, membership or download fees for access to its public portals or mobile platforms. The Company generates revenue from its public portals and mobile platforms primarily through the sale of various types of advertising and sponsorship programs to its clients, which include: pharmaceutical, biotechnology and medical device companies; hospitals, clinics and other healthcare services companies; health insurance providers; consumer products companies whose products or services relate to health, wellness, diet, fitness, lifestyle, safety and illness prevention; and various other businesses, organizations and governmental entities. Advertisers and sponsors use the Company’s services to reach, educate and inform target audiences of consumers, physicians and other healthcare professionals. The Company also generates revenue from advertising sold in WebMD Magazine, a consumer magazine distributed to physician office waiting rooms.
Private Portal Services. The Company’s private portals platform and related services help employers and health plans improve the health of their employee and plan participant population and, as a result, manage their healthcare costs. The Company markets these private portals and related services under the WebMD Health Services brand. The Company hosts its WebMD Health Services platform for private and public sector employers and health plans and its cloud-based online services can be accessed by their employees and plan participants using a computer, a tablet or a smartphone. The WebMD Health Services platform provides an online personal health record application and personalized content, tools and other resources relevant to the specific individual’s eligibility, coverage and wellness profile, including decision-support applications that help users make informed decisions about health risks, lifestyle choices, healthcare providers, treatment options, and healthcare benefits options. The Company’s flexible architecture allows it to integrate with the client’s existing programs, Websites and intranets for their employees and plan participants. The Company also offers clients the ability to design team-based and individual wellness challenges that help foster a culture of wellness in the workplace. In addition, the Company offers telephonic, online and onsite health coaching and targeted condition management programs that help employees and plan participants make healthier lifestyle choices to achieve their health and wellness goals. The Company generates revenue from subscriptions to its WebMD Health Services platform by employers and health plans, either directly or through its distributors. WebMD offers its health coaching services and its condition management programs on a per-participant basis.
F-10
Table of Contents
Index to Financial Statements
WEBMD HEALTH CORP.
NOTES TO CONSOLIDATED FINANCIAL STATEMENTS — (Continued)
Information Services. The Company also generates revenue from the sale of certain information products and services on a standalone basis using de-identified data that it licenses from a small number of third party data sources, of which the principal source is a license retained by HLTH Corporation (“HLTH”), the Company’s former parent company, in connection with the sale of its Emdeon Business Services (“EBS”) business. As the successor to HLTH, the Company received this license which provides the Company the rights to certain de-identified data from the operation of the EBS business (which is now known as Change Healthcare) through early February 2018 for use in the development and commercialization of various information products and services. Customers include data services, informatics and consulting companies.
Basis of Presentation
The accompanying Consolidated Financial Statements include the consolidated accounts of the Company and its wholly-owned subsidiaries and have been prepared in United States dollars, and in accordance with U.S. generally accepted accounting principles (“GAAP”). The results of operations for companies acquired or disposed of are included in the Consolidated Financial Statements from the effective date of acquisition or up to the date of disposal. All material intercompany balances and transactions have been eliminated in consolidation.
2. Summary of Significant Accounting Policies
Accounting Estimates
The preparation of financial statements in conformity with GAAP requires management to make estimates and assumptions that affect the amounts reported in the Consolidated Financial Statements and accompanying notes. The Company bases its estimates on historical experience, current business factors, and various other assumptions that the Company believes are necessary to consider to form a basis for making judgments about the carrying values of assets and liabilities, the recorded amounts of revenue and expenses, and the disclosure of contingent liabilities. The Company is subject to uncertainties such as the impact of future events, economic and political factors, and changes in the Company’s business environment; therefore, actual results could differ from these estimates. Accordingly, the accounting estimates used in the preparation of the Company’s financial statements will change as new events occur, as more experience is acquired, as additional information is obtained and as the Company’s operating environment changes. Changes in estimates are made when circumstances warrant. Such changes in estimates and refinements in estimation methodologies are reflected in reported results of operations; if material, the effects of changes in estimates are disclosed in the notes to the Consolidated Financial Statements. Significant estimates and assumptions by management affect the allowance for doubtful accounts, the carrying value of long-lived assets (including goodwill and intangible assets), the amortization period of long-lived assets (excluding goodwill and indefinite-lived intangible assets), the carrying value, capitalization and amortization of software and Website development costs, the carrying value of investments, the provision for income taxes and related deferred tax accounts, certain accrued liabilities, revenue recognition, contingencies, litigation and related legal accruals and the value attributed to employee stock options and other stock-based awards.
Seasonality
The timing of the Company’s revenue is affected by seasonal factors. The Company’s public portal advertising and sponsorship revenue is seasonal, primarily due to the annual spending patterns of the advertising and sponsorship clients of the Company’s public portals. This portion of the Company’s revenue is usually the lowest in the first quarter of each calendar year, and generally increases during each consecutive quarter throughout the year. The timing of revenue in relation to the Company’s expenses, many of which do not vary directly with revenue, has an impact on cost of operations, sales and marketing, and general and administrative expenses as a percentage of revenue in each calendar quarter.
F-11
Table of Contents
Index to Financial Statements
WEBMD HEALTH CORP.
NOTES TO CONSOLIDATED FINANCIAL STATEMENTS — (Continued)
Cash and Cash Equivalents
All highly liquid investments with an original maturity from the date of purchase of three months or less are considered to be cash equivalents. These investments are stated at cost, which approximates market. The Company’s cash and cash equivalents are generally invested in various money market accounts.
Fair Value
The carrying amount of cash and cash equivalents, accounts receivable, accrued expenses and deferred revenue is deemed to approximate fair value due to the immediate or short-term maturity of these financial instruments. See Note 12 for further information on the fair value of the Company’s investments.
Allowance for Doubtful Accounts
The allowance for doubtful accounts receivable reflects the Company’s best estimate of losses inherent in the Company’s receivable portfolio determined on the basis of historical experience, specific allowances for known troubled accounts and other currently available evidence.
Long-Lived Assets
Property and Equipment
Property and equipment are stated at cost, net of accumulated depreciation. Depreciation is computed using the straight-line method over the estimated useful lives of the related assets. The useful lives are generally as follows:
| Computer equipment |
3 to 5 years | |
| Office equipment, furniture and fixtures |
4 to 7 years | |
| Software |
3 years | |
| Building and improvements |
Up to 40 years | |
| Website development costs |
3 years | |
| Leasehold improvements |
Shorter of useful life or lease term |
Expenditures for maintenance, repair and renewals of minor items are charged to expense as incurred. Major improvements are capitalized.
Goodwill and Intangible Assets
Goodwill and intangible assets result from business combinations accounted for under the acquisition method. Goodwill and other intangible assets with indefinite lives are not amortized and are subjected to impairment review by applying fair value based tests. Intangible assets with definite lives are amortized on a straight-line basis over the individually estimated useful lives of the related assets as follows:
| Content |
3 to 5 years | |
| Customer relationships |
5 to 12 years | |
| Acquired technology and patents |
3 years | |
| Trade names |
Up to 10 years |
F-12
Table of Contents
Index to Financial Statements
WEBMD HEALTH CORP.
NOTES TO CONSOLIDATED FINANCIAL STATEMENTS — (Continued)
Recoverability
The Company reviews the carrying value of goodwill and indefinite-lived intangible assets annually and whenever indicators of impairment are present. The Company has one reporting unit and tests goodwill for impairment at the reporting unit level only when, after completing a qualitative analysis, it is determined that it is more likely than not that the fair value of the reporting unit is less than its carrying value. Fair value is determined using an income approach valuation. A reporting unit is defined as an operating segment or one level below an operating segment.
Long-lived assets used in operations are reviewed for impairment whenever events or changes in circumstances indicate that carrying amounts may not be recoverable. For long-lived assets to be held and used, the Company recognizes an impairment loss only if its carrying amount is not recoverable through its undiscounted cash flows and measures the impairment loss based on the difference between the carrying amount and the fair value. Long-lived assets held for sale are reported at the lower of cost or fair value less costs to sell.
Based on the Company’s analysis, there was no impairment of goodwill or indefinite-lived intangible assets during the years ended December 31, 2015, 2014 and 2013.
Internal Use Software
Software development costs that are incurred in the preliminary project stage are expensed as incurred. Once certain criteria have been met, direct costs incurred in developing or obtaining computer software are capitalized. The Company capitalized $6,441 and $5,369 during the years ended December 31, 2015 and 2014, respectively. Capitalized internal use software development costs are included in property and equipment in the accompanying consolidated balance sheets. Training and data conversion costs are expensed as incurred. Capitalized software costs are depreciated over a three-year period. Depreciation expense related to internal use software was $6,403, $6,449 and $5,070 for the years ended December 31, 2015, 2014 and 2013, respectively. The remaining balance of internal use software, net of accumulated depreciation, was $11,630 and $11,597 as of December 31, 2015 and 2014, respectively.
Website Development Costs
Costs related to the planning and post-implementation phases of WebMD’s Website development efforts, as well as minor enhancements and maintenance, are expensed as incurred. Direct costs incurred in the development phase are capitalized. The Company capitalized $4,861 and $5,539 during the years ended December 31, 2015 and 2014, respectively. These capitalized costs are included in property and equipment in the accompanying consolidated balance sheets and are depreciated over a three-year period. Depreciation expense related to Website development costs was $6,580, $6,421 and $5,696 during the years ended December 31, 2015, 2014 and 2013, respectively. The remaining balance of Website development costs, net of accumulated depreciation, was $9,624 and $11,343 as of December 31, 2015 and 2014, respectively.
Restricted Cash
The Company’s restricted cash primarily relates to collateral for letters of credit obtained to support the Company’s operations. Total restricted cash was $3,547 and $1,765 as of December 31, 2015 and 2014, respectively, and is included in other assets in the accompanying consolidated balance sheets.
Deferred Charges
Other assets includes costs associated with the issuance of the Company’s convertible notes that are amortized to interest expense in the accompanying consolidated statements of operations, using the effective interest method over the period from issuance through the earliest date on which holders can demand redemption.
F-13
Table of Contents
Index to Financial Statements
WEBMD HEALTH CORP.
NOTES TO CONSOLIDATED FINANCIAL STATEMENTS — (Continued)
During the year ended December 31, 2011, the Company capitalized issuance costs of $12,655 and $12,595, related to the issuance of its 2.50% Convertible Notes due 2018 (the “2.50% Notes”) and its 2.25% Convertible Notes due 2016 (the “2.25% Notes”), respectively. Additionally, during the year ended December 31, 2013, the Company capitalized $8,177 of issuance costs in connection with the 2013 issuance of its 1.50% Convertible Notes due 2020 (the “1.50% Notes”). The aggregate amortization of these issuance costs, which is included within interest expense in the accompanying consolidated statements of operations, was $4,172, $4,511 and $4,192 for the years ended December 31, 2015, 2014 and 2013, respectively. During the years ended December 31, 2015 and 2013, the Company wrote off issuance costs of $571 and $2,285, respectively, in connection with the repurchase of a portion of its 2.25% Notes. As of December 31, 2015 and 2014, there were $9,612 and $14,355, respectively, of unamortized issuance costs included in other assets within the accompanying consolidated balance sheets.
Deferred Revenue
Deferred revenue consists of invoices sent to customers or payments received from customers, in advance of revenue recognition and is recognized as the revenue recognition criteria are met. Deferred revenue is influenced by several factors, including the timing of invoices to our customers and the timing of payments received from our customers in relation to the timing of the revenue recognition for the related customer contract. Deferred revenue at each balance sheet date is expected to be recognized during the succeeding twelve month period and is therefore classified as a current liability within the accompanying consolidated balance sheets.
Leases
The Company recognizes rent expense on a straight-line basis, including predetermined fixed escalations, over the initial lease term including reasonably assured renewal periods, net of lease incentives, from the time that the Company controls the leased property. Leasehold improvements made at the inception of the lease are amortized over the shorter of the useful life of the asset or the lease term. Lease incentives are recorded as a deferred credit and recognized as a reduction to rent expense on a straight-line basis over the lease term as described above.
Presentation of Segment Information
The Company generates revenue in four groups, as set forth in the table below. The first group is “Advertising and Sponsorship – Biopharma and Medical Device” and consists of advertising and sponsorship revenue from pharmaceutical, biotechnology and medical device clients relating to ethical pharmaceutical products or other regulated devices or products or for sponsoring educational programs. The second category is “Advertising and Sponsorship – OTC, CPG and Other” and consists of advertising and sponsorship revenue relating to non-Rx or over-the-counter medications and other healthcare products, food and beverages, beauty products and other consumer products, as well as revenue from clients such as retailers, pharmacies, hospitals, health insurance companies and government agencies. The combined revenue of the first two groups is sometimes referred to as “Advertising and Sponsorship” revenue. The third group is “Private Portal Services” and consists of revenue from employers and health plans for subscriptions to the Company’s private portals solution and related services, including health coaching and condition management services. The fourth group is “Information Services” and consists of revenue from the sale of stand-alone information and data products. Discrete financial information related to a measure of profit or loss for these four revenue groups is not available as they leverage many common expenses, and the Company does not separately allocate these common expenses in assessing the performance of its business. Accordingly, the Company views its business as one reportable segment.
F-14
Table of Contents
Index to Financial Statements
WEBMD HEALTH CORP.
NOTES TO CONSOLIDATED FINANCIAL STATEMENTS — (Continued)
The following table presents the revenues recognized from the four revenue groups described above:
| Years Ended December 31, | ||||||||||||
| 2015 | 2014 | 2013 | ||||||||||
| Advertising and sponsorship |
||||||||||||
| Biopharma and medical device |
$ | 371,220 | $ | 329,329 | $ | 304,018 | ||||||
| OTC, CPG and other |
127,805 | 124,636 | 113,009 | |||||||||
|
|
|
|
|
|
|
|||||||
| 499,025 | 453,965 | 417,027 | ||||||||||
| Private portal services |
110,441 | 103,182 | 82,111 | |||||||||
| Information services |
26,933 | 23,302 | 16,155 | |||||||||
|
|
|
|
|
|
|
|||||||
| $ | 636,399 | $ | 580,449 | $ | 515,293 | |||||||
|
|
|
|
|
|
|
|||||||
The Company’s revenue is principally generated in the United States. An adverse change in economic conditions in the United States could negatively affect the Company’s revenue and results of operations. The Company recorded revenue from its international operations of $56,979, $46,095 and $31,340 during the years ended December 31, 2015, 2014 and 2013, respectively.
Sales, Use and Value Added Tax
The Company excludes sales, use and value-added tax from revenue in the accompanying consolidated statements of operations.
Advertising Costs
Advertising costs are generally expensed as incurred and totaled $4,359, $4,196 and $5,174 in 2015, 2014 and 2013, respectively.
Foreign Currency
The functional currency of the Company’s foreign operations is the U.S. dollar. Fluctuations in foreign currency monetary assets and liabilities result in gains or losses which are credited or charged to income. Foreign currency transactional gains or losses are also credited or charged to income.
Concentration of Credit Risk
None of the Company’s customers individually accounted for more than 10% of the Company’s revenue in 2015, 2014 or 2013 or more than 10% of the Company’s accounts receivable as of December 31, 2015 or 2014.
Loss Contingencies
The Company accounts for loss contingencies in accordance with Financial Accounting Standards Board (“FASB”) ASC No. 450, “Contingencies.” Under ASC No. 450, accruals for loss contingencies are recorded when both (i) the information available indicates that it is probable that a liability has been incurred and (ii) the amount of the loss can be reasonably estimated. The Company records adjustments to these accruals to reflect the status of negotiations, settlements, advice of counsel and other information and events related to an individual matter.
Income Taxes
Deferred income taxes are recognized for the future tax consequence of differences between the tax and financial reporting basis of assets and liabilities at each reporting period. A valuation allowance is established to reduce deferred tax assets to the amount expected to be realized.
F-15
Table of Contents
Index to Financial Statements
WEBMD HEALTH CORP.
NOTES TO CONSOLIDATED FINANCIAL STATEMENTS — (Continued)
Tax contingencies are recorded to address potential exposure involving tax positions the Company has taken that could be challenged by tax authorities. These potential exposures result from applications of various statutes, rules, regulations and interpretations. The Company’s estimates of tax contingencies contain assumptions and judgments about potential actions by taxing jurisdictions. The Company reflects interest and penalties related to uncertain tax positions as part of the income tax provision in the accompanying consolidated statements of operations.
Accounting for Stock-Based Compensation
Stock-based compensation expense for all share-based payment awards granted is determined based on the grant-date fair value. The grant-date fair value for stock options is estimated using the Black-Scholes Option Pricing Model. The Company recognizes these compensation costs net of an estimated forfeiture rate on a straight-line basis over the requisite service period of the award, which is generally the vesting term of the share-based payment award.
Revenue Recognition
Revenue from advertising is recognized as advertisements are delivered or as publications are distributed. Revenue from sponsorship arrangements, content syndication and distribution arrangements and subscriptions to healthcare management tools and private portals as well as related health coaching services is recognized ratably over the term of the applicable agreement. Revenue from information services is recognized as the underlying data is delivered. Revenue from the sponsorship of CME is recognized over the period the Company substantially completes its contractual deliverables as determined by the applicable agreements.
Contracts that contain multiple deliverables are subject to Accounting Standards Update (“ASU”) No. 2009-13 Multiple-Deliverable Revenue Arrangements (“ASU 2009-13”). ASU 2009-13 requires the allocation of revenue to each deliverable of multiple-deliverable revenue arrangements, based on the relative selling price of each deliverable. It also defines the level of evidence of selling price required to separate deliverables and allows a company to make its best estimate of the selling price of deliverables when more objective evidence of selling price is not available.
Pursuant to the guidance of ASU 2009-13, when a sales arrangement contains multiple deliverables, the Company allocates revenue to each deliverable based on relative selling price. The selling price for a deliverable is based on vendor-specific objective evidence (“VSOE”) if available, third-party evidence (“TPE”) if VSOE is not available, or best estimate of selling price if neither VSOE nor TPE is available. The Company then recognizes revenue on each deliverable in accordance with its revenue recognition policies over the period that delivery occurs. VSOE of selling price is based on the price charged when the deliverable is sold separately. In determining VSOE, GAAP requires that a substantial majority of the selling prices fall within a reasonable range based on historical pricing trends for specific products and services. TPE is based on competitor prices of similar deliverables when sold separately. The Company is not able to determine TPE of selling price as it is unable to reliably determine what competitors’ selling prices are for comparable services, combined with the fact that its services often contain unique features and customizations such that comparable services do not exist. The determination of best estimate of selling price is a judgmental process that considers multiple factors including, but not limited to, recent selling prices and related discounting practices for each service, market conditions, customer classes, sales channels and other factors.
F-16
Table of Contents
Index to Financial Statements
WEBMD HEALTH CORP.
NOTES TO CONSOLIDATED FINANCIAL STATEMENTS — (Continued)
Net Income Per Common Share
Basic income per common share has been computed using the weighted-average number of shares of Common Stock outstanding during the periods presented. Diluted income per common share has been computed using the weighted-average number of shares of Common Stock outstanding during the periods, increased to give effect to potentially dilutive securities and assumes that any dilutive convertible notes were converted, only in the periods in which such effect is dilutive (shares in thousands):
| Years Ended December 31, | ||||||||||||
| 2015 | 2014 | 2013 | ||||||||||
| Numerator: |
||||||||||||
| Income from continuing operations – Basic |
$ | 64,024 | $ | 40,941 | $ | 15,116 | ||||||
| Interest expense on 1.50% Notes, net of tax |
3,456 | 3,456 | — | |||||||||
| Interest expense on 2.50% Notes, net of tax |
7,189 | — | — | |||||||||
| Interest expense on 2.25% Notes, net of tax |
3,460 | — | — | |||||||||
|
|
|
|
|
|
|
|||||||
| Income from continuing operations – Diluted |
$ | 78,129 | $ | 44,397 | $ | 15,116 | ||||||
|
|
|
|
|
|
|
|||||||
| Income from discontinued operations, net of tax – Basic and Diluted |
$ | — | $ | 1,122 | $ | — | ||||||
|
|
|
|
|
|
|
|||||||
| Denominator: |
||||||||||||
| Weighted-average shares – Basic |
36,600 | 37,869 | 46,830 | |||||||||
| Stock options and restricted stock |
1,412 | 2,060 | 1,568 | |||||||||
| 1.50% Notes |
5,694 | 5,685 | — | |||||||||
| 2.50% Notes |
6,205 | — | — | |||||||||
| 2.25% Notes |
2,742 | — | — | |||||||||
|
|
|
|
|
|
|
|||||||
| Adjusted weighted-average shares after assumed conversions – Diluted |
52,653 | 45,614 | 48,398 | |||||||||
|
|
|
|
|
|
|
|||||||
| Basic income per common share: |
||||||||||||
| Income from continuing operations |
$ | 1.75 | $ | 1.08 | $ | 0.32 | ||||||
| Income from discontinued operations |
— | 0.03 | — | |||||||||
|
|
|
|
|
|
|
|||||||
| Net income |
$ | 1.75 | $ | 1.11 | $ | 0.32 | ||||||
|
|
|
|
|
|
|
|||||||
| Diluted income per common share: |
||||||||||||
| Income from continuing operations |
$ | 1.48 | $ | 0.97 | $ | 0.31 | ||||||
| Income from discontinued operations |
— | 0.03 | — | |||||||||
|
|
|
|
|
|
|
|||||||
| Net income |
$ | 1.48 | $ | 1.00 | $ | 0.31 | ||||||
|
|
|
|
|
|
|
|||||||
F-17
Table of Contents
Index to Financial Statements
WEBMD HEALTH CORP.
NOTES TO CONSOLIDATED FINANCIAL STATEMENTS — (Continued)
The Company has excluded certain of its convertible notes, as well as certain outstanding stock options and restricted stock, from the calculation of diluted income per common share during the periods in which such securities were anti-dilutive. The following table presents the total weighted-average number of potentially dilutive common shares that were excluded from the computation of diluted income per common share during the periods presented (shares in thousands):
| Years Ended December 31, | ||||||||||||
| 2015 | 2014 | 2013 | ||||||||||
| Options and restricted stock |
3,678 | 2,594 | 5,744 | |||||||||
| 1.50% Notes |
— | — | 556 | |||||||||
| 2.25% Notes |
— | 3,506 | 5,020 | |||||||||
| 2.50% Notes |
— | 6,195 | 6,148 | |||||||||
|
|
|
|
|
|
|
|||||||
| 3,678 | 12,295 | 17,468 | ||||||||||
|
|
|
|
|
|
|
|||||||
Discontinued Operations
A business unit is reported as a discontinued operation if its disposal represents a strategic shift that has, or will have, a major effect on the Company’s operations and financial results. Significant judgments are involved in determining whether a business component meets the criteria for discontinued operation reporting and the period in which these criteria are met.
Recent Accounting Pronouncements
Accounting Pronouncement Adopted During 2015
In April 2014, the FASB issued ASU No. 2014-08, Reporting Discontinued Operations and Disclosures of Disposals of Components of an Entity, which changes the criteria for determining which disposals can be presented as discontinued operations and modifies the related disclosure requirements. Under the revised guidance, a discontinued operation is defined as a disposal of a component or group of components that represents a strategic shift that has, or will have, a major effect on an entity’s operations and financial results. The revised guidance was effective for the Company, on a prospective basis, beginning in the quarter ended March 31, 2015. The adoption of the revised guidance did not have an impact on the Company’s consolidated financial statements.
Accounting Pronouncements to be Adopted in the Future
In May 2014, the FASB issued ASU No. 2014-09, Revenue from Contracts with Customers (Topic 606), to achieve a consistent application of revenue recognition within the U.S., resulting in a single revenue model to be applied by reporting companies under GAAP. Under the new model, recognition of revenue occurs when a customer obtains control of promised goods or services in an amount that reflects the consideration to which the entity expects to be entitled in exchange for those goods or services. In addition, the revised guidance requires that reporting companies disclose the nature, amount, timing, and uncertainty of revenue and cash flows arising from contracts with customers. In August 2015, the FASB issued ASU No. 2015-14, Revenue from Contracts with Customers (Topic 606): Deferral of the Effective Date, which delays the effective date of ASU No. 2014-09 by one year. As a result, the revised guidance is effective for the Company beginning in the quarter ending March 31, 2018. Early adoption is permitted, but not before the original effective date of the guidance. The revised guidance is required to be applied retrospectively to each prior reporting period presented or retrospectively with the cumulative effect of initially applying it recognized at the date of initial application. The Company has not yet determined the impact the revised guidance will have on its consolidated financial statements.
F-18
Table of Contents
Index to Financial Statements
WEBMD HEALTH CORP.
NOTES TO CONSOLIDATED FINANCIAL STATEMENTS — (Continued)
In June 2014, the FASB issued ASU No. 2014-12, Accounting for Share-Based Payments When the Terms of an Award Provide That a Performance Target Could Be Achieved after the Requisite Service Period, which requires that a performance target that affects vesting and that could be achieved after the requisite service period be treated as a performance condition. The revised guidance is effective for the Company beginning in the quarter ending March 31, 2016; early adoption is permitted. The Company does not expect that the adoption of this guidance will have any impact on its consolidated financial statements as it does not have any share-based awards with performance targets currently outstanding.
In April 2015, the FASB issued ASU No. 2015-03, Interest – Imputation of Interest (Subtopic 835-30): Simplifying the Presentation of Debt Issuance Costs, which requires that debt issuance costs related to a recognized debt liability be presented in the balance sheet as a direct deduction from the carrying amount of that debt liability, consistent with debt discounts. The revised guidance is effective for the Company beginning in the quarter ending March 31, 2016 and is required to be applied retrospectively. Early adoption is permitted. The Company expects that the adoption of this guidance will only affect the balance sheet classification of its debt issuance costs.
In April 2015, the FASB issued ASU No. 2015-05, Intangibles – Goodwill and Other – Internal-Use Software (Subtopic 350-40): Customer’s Accounting for Fees Paid in a Cloud Computing Arrangement, which provides guidance in determining whether a cloud computing arrangement includes a software license. If it is determined that a cloud computing arrangement does include a software license, the software element should be accounted for consistent with the acquisition of other software licenses. If the arrangement does not include a software license, it should be accounted for as a service contract. The revised guidance is effective for the Company beginning in the quarter ending March 31, 2016 and can be applied prospectively to all arrangements entered into or materially modified after the effective date or retrospectively. Early adoption is permitted. The Company does not expect the adoption of this guidance to have an impact on its consolidated financial statements.
In September 2015, the FASB issued ASU No. 2015-16, Business Combinations (Topic 805): Simplifying the Accounting for Measurement-Period Adjustments, which requires that the acquirer recognize adjustments to provisional amounts that are identified during the measurement period in the reporting period in which the adjustment amounts are determined, rather than retrospectively adjusting previously reported amounts. The revised guidance is effective for the Company beginning in the quarter ending March 31, 2016 and should be applied prospectively. Early adoption is permitted. The Company does not expect the adoption of this guidance to have an impact on its historical consolidated financial statements.
In November 2015, the FASB issued ASU No. 2015-17, Income Taxes (Topic 740): Balance Sheet Classification of Deferred Taxes, which requires that all deferred tax assets and liabilities, along with any related valuation allowance, be classified as noncurrent in the consolidated balance sheet instead of separating deferred taxes into current and noncurrent. The revised guidance is effective for the Company beginning in the quarter ending March 31, 2017 and should be applied either prospectively to all deferred tax assets and liabilities or retrospectively to all periods presented. Early adoption is permitted. The Company has not yet determined the impact the revised guidance will have on its consolidated financial statements.
In January 2016, the FASB issued ASU No. 2016-01, Financial Instruments-Overall (Subtopic 825-10): Recognition and Measurement of Financial Assets and Financial Liabilities, which revises the classification and measurement of investments in certain equity investments and the presentation of certain fair value changes for certain financial liabilities measured at fair value. ASU No. 2016-01 also requires the change in fair value of many equity investments to be recognized in net income. The revised guidance is effective for the Company beginning in the quarter ending March 31, 2018. The Company expects that the adoption of this guidance will only affect the balance sheet classification of its deferred tax assets.
F-19
Table of Contents
Index to Financial Statements
WEBMD HEALTH CORP.
NOTES TO CONSOLIDATED FINANCIAL STATEMENTS — (Continued)
In February 2016, the FASB issued ASU No. 2016-01, Leases (Topic 842), which requires lessees to recognize the following for all leases (with the exception of short-term leases) at the commencement date: a lease liability, which is a lessee’s obligation to make lease payments arising from a lease, measured on a discounted basis; and a right-of-use asset, which is an asset that represents the lessee’s right to use, or control the use of, a specified asset for the lease term. The revised guidance must be applied on a modified retrospective transition approach for leases existing at, or entered into after, the beginning of the earliest comparative period presented in the financial statements. The revised guidance is effective for the Company beginning in the quarter ending March 31, 2019. The Company has not yet determined the impact the revised guidance will have on its consolidated financial statements.
3. Discontinued Operations
On October 19, 2009, the Company completed the sale of its Porex business. In connection with the sale of Porex, the Company agreed to indemnify Porex for certain tax matters. As of December 31, 2013, the remaining estimate of the Company’s tax indemnification liability related to Porex was $1,506. During the year ended December 31, 2014, the Company paid $384 in connection with the completion of the remaining tax audits for all periods covered under the indemnity agreement. The remaining indemnity liability of $1,122 was adjusted through income from discontinued operations during the year ended December 31, 2014. The Company has no further obligations related to this matter.
4. Convertible Notes
2.50% Convertible Notes due 2018
On January 11, 2011, the Company issued $400,000 aggregate principal amount of its 2.50% Notes in a private offering. Unless previously converted, the 2.50% Notes will mature on January 31, 2018. Net proceeds from the sale of the 2.50% Notes were approximately $387,345, after deducting the related offering expenses, of which approximately $100,000 was used to repurchase 1,920,490 shares of the Company’s Common Stock at a price of $52.07 per share, the last reported sale price of the Company’s Common Stock on January 5, 2011, which repurchase settled on January 11, 2011. Interest on the 2.50% Notes is payable semi-annually on January 31 and July 31 of each year, commencing July 31, 2011. Under the terms of the 2.50% Notes, holders were able to surrender their 2.50% Notes for conversion into the Company’s Common Stock at an initial conversion rate of 15.1220 shares of Common Stock per thousand dollars principal amount of the 2.50% Notes. This was equivalent to an initial conversion price of approximately $66.13 per share of Common Stock. In the aggregate, the 2.50% Notes were convertible into 6,048,800 shares of the Company’s Common Stock.
Effective April 4, 2012, after giving effect to an adjustment resulting from a tender offer for the Company’s Common Stock that the Company completed on April 3, 2012, the conversion rate was adjusted to 15.3223 shares of Common Stock per thousand dollars principal amount of the 2.50% Notes. This was equivalent to an adjusted conversion price of approximately $65.26 per share of Common Stock. In the aggregate, the 2.50% Notes were convertible into 6,128,920 shares of Common Stock following the April 4, 2012 adjustment. Effective September 11, 2013, after giving effect to an adjustment resulting from a tender offer for the Company’s Common Stock that the Company completed on September 10, 2013 (see Note 10 for additional discussion), the conversion rate was adjusted to 15.4764 shares of Common Stock per thousand dollars principal amount of the 2.50% Notes. This was equivalent to an adjusted conversion price of approximately $64.61 per share of Common Stock. In the aggregate, the 2.50% Notes were convertible into 6,190,560 shares of Common Stock following the September 11, 2013 adjustment.
Effective September 10, 2014, after giving effect to an adjustment resulting from a tender offer for the Company’s Common Stock that the Company completed on September 9, 2014 (see Note 10 for additional discussion), the conversion rate was adjusted to 15.5118 shares of Common Stock per thousand dollars principal
F-20
Table of Contents
Index to Financial Statements
WEBMD HEALTH CORP.
NOTES TO CONSOLIDATED FINANCIAL STATEMENTS — (Continued)
amount of the 2.50% Notes. This is equivalent to an adjusted conversion price of approximately $64.47 per share of Common Stock. In the aggregate, the 2.50% Notes are convertible into 6,204,720 shares of Common Stock following the September 10, 2014 adjustment.
Under the terms of the 2.50% Notes, if the Company undergoes certain change of control transactions prior to the maturity date of the 2.50% Notes, holders of the 2.50% Notes will have the right, at their option, to require the Company to repurchase some or all of their 2.50% Notes at a repurchase price equal to 100% of the principal amount of the 2.50% Notes being repurchased, plus accrued and unpaid interest to, but excluding, the repurchase date. At the Company’s option, and to the extent permitted by the applicable rules of the Nasdaq Global Select Market (or the applicable rules of such other exchange on which the Company’s Common Stock may be listed), instead of paying the repurchase price in cash, the Company may pay the repurchase price in shares of its Common Stock or a combination of cash and shares of its Common Stock. However, in the case of certain change of control transactions in which the Company is acquired by a public company, the Company may elect to provide for conversion of the 2.50% Notes into acquirer common stock, in which case the repurchase option would not apply.
2.25% Convertible Notes due 2016
On March 14, 2011, the Company issued $400,000 aggregate principal amount of its 2.25% Notes in a private offering. Unless previously converted, the 2.25% Notes will mature on March 31, 2016. Net proceeds from the sale of the 2.25% Notes were approximately $387,400, after deducting the related offering expenses, of which approximately $50,000 was used to repurchase 868,507 shares of the Company’s Common Stock at a price of $57.57 per share, the last reported sale price of the Company’s Common Stock on March 8, 2011, which repurchase settled on March 14, 2011. Interest on the 2.25% Notes is payable semi-annually on March 31 and September 30 of each year, commencing September 30, 2011. Under the terms of the 2.25% Notes, holders were able to surrender their 2.25% Notes for conversion into the Company’s Common Stock at an initial conversion rate of 13.5704 shares of Common Stock per thousand dollars principal amount of the 2.25% Notes. This was equivalent to an initial conversion price of approximately $73.69 per share of Common Stock. In the aggregate, the 2.25% Notes were convertible into 5,428,160 shares of the Company’s Common Stock.
Effective April 4, 2012, after giving effect to an adjustment resulting from a tender offer for the Company’s Common Stock that the Company completed on April 3, 2012, the conversion rate was adjusted to 13.7502 shares of Common Stock per thousand dollars principal amount of the 2.25% Notes. This was equivalent to an adjusted conversion price of approximately $72.73 per share of Common Stock. In the aggregate, the 2.25% Notes are convertible into 5,500,080 shares of Common Stock following the April 4, 2012 adjustment. Effective September 11, 2013, after giving effect to an adjustment resulting from a tender offer for the Company’s Common Stock that the Company completed on September 10, 2013 (see Note 10 for additional discussion), the conversion rate was adjusted to 13.8884 shares of Common Stock per thousand dollars principal amount of the 2.25% Notes. This was equivalent to an adjusted conversion price of approximately $72.00 per share of Common Stock. In the aggregate, the 2.25% Notes were convertible into 5,555,360 shares of Common Stock following the September 11, 2013 adjustment.
During the year ended December 31, 2013, the Company repurchased $100,000 principal amount of its 2.25% Notes for $101,750 in cash in a privately negotiated transaction. Also during the year ended December 31, 2013, the Company repurchased $47,768 principal amount of its 2.25% Notes for $48,604 in cash in the open market. The Company recognized a pre-tax loss of $4,871 in 2013 related to these repurchases, which is reflected within loss on convertible notes in the accompanying consolidated statement of operations. The loss included the expensing of the remaining deferred issuance costs outstanding related to the repurchased notes. After these repurchases in 2013, the remaining principal amount of the 2.25% Notes outstanding was $252,232, which, in the aggregate, was convertible into 3,503,099 shares of Common Stock.
F-21
Table of Contents
Index to Financial Statements
WEBMD HEALTH CORP.
NOTES TO CONSOLIDATED FINANCIAL STATEMENTS — (Continued)
Effective September 10, 2014, after giving effect to an adjustment resulting from a tender offer for the Company’s Common Stock that the Company completed on September 9, 2014 (see Note 10 for additional discussion), the conversion rate was adjusted to 13.9202 shares of Common Stock per thousand dollars principal amount of the 2.25% Notes. This is equivalent to an adjusted conversion price of approximately $71.84 per share of Common Stock. In the aggregate, the 2.25% Notes were convertible into 3,511,120 shares of Common Stock following the September 10, 2014 adjustment.
During the year ended December 31, 2015, the Company repurchased $149,550 principal amount of its 2.25% Notes for $151,038 in cash in privately negotiated transactions. The Company recognized a pre-tax loss of $2,058 in 2015 related to these repurchases, which is reflected within loss on convertible notes in the accompanying consolidated statement of operations. The loss included the expensing of the remaining deferred issuance costs outstanding related to the repurchased notes. After these repurchases, the remaining principal amount of the 2.25% Notes outstanding was $102,682, which, in the aggregate, is convertible into 1,429,354 shares of Common Stock.
Under the terms of the 2.25% Notes, if the Company undergoes certain change of control transactions prior to the maturity date of the 2.25% Notes, holders of the 2.25% Notes will have the right, at their option, to require the Company to repurchase some or all of their 2.25% Notes at a repurchase price equal to 100% of the principal amount of the 2.25% Notes being repurchased, plus accrued and unpaid interest to, but excluding, the repurchase date. At the Company’s option, and to the extent permitted by the applicable rules of the Nasdaq Global Select Market (or the applicable rules of such other exchange on which the Company’s Common Stock may be listed), instead of paying the repurchase price in cash, the Company may pay the repurchase price in shares of its Common Stock or a combination of cash and shares of its Common Stock. However, in the case of certain change of control transactions in which the Company is acquired by a public company, the Company may elect to provide for conversion of the 2.25% Notes into acquirer common stock, in which case the repurchase option would not apply.
1.50% Convertible Notes due 2020
On November 26, 2013, the Company issued $300,000 aggregate principal amount of its 1.50% Notes in a private offering. Unless previously converted, the 1.50% Notes will mature on December 1, 2020. Net proceeds from the sale of the 1.50% Notes were approximately $291,823, after deducting the related offering expenses. Interest on the 1.50% Notes is payable semi-annually on June 1 and December 1 of each year, commencing June 1, 2014. Under the terms of the 1.50% Notes, holders were able to surrender their 1.50% Notes for conversion into the Company’s Common Stock at an initial conversion rate of 18.9362 shares of Common Stock per thousand dollars principal amount of the 1.50% Notes. This was equivalent to an initial conversion price of approximately $52.81 per share of Common Stock. In the aggregate, the 1.50% Notes were convertible into 5,680,860 shares of the Company’s Common Stock. The conversion rate may be adjusted under certain circumstances.
Effective September 10, 2014, after giving effect to an adjustment resulting from a tender offer for the Company’s Common Stock that the Company completed on September 9, 2014 (see Note 10 for additional discussion), the conversion rate was adjusted to 18.9795 shares of Common Stock per thousand dollars principal amount of the 1.50% Notes. This is equivalent to an adjusted conversion price of approximately $52.69 per share of Common Stock. In the aggregate, the 1.50% Notes are convertible into 5,693,850 shares of Common Stock following the September 10, 2014 adjustment.
Under the terms of the 1.50% Notes, if the Company undergoes certain change of control or other fundamental change transactions prior to the maturity date of the 1.50% Notes, holders of the 1.50% Notes will have the right, at their option, to require the Company to repurchase some or all of their 1.50% Notes at a repurchase price equal to 100% of the principal amount of the 1.50% Notes being repurchased, plus accrued and unpaid interest to, but excluding, the repurchase date. However, the repurchase option will not apply in the case
F-22
Table of Contents
Index to Financial Statements
WEBMD HEALTH CORP.
NOTES TO CONSOLIDATED FINANCIAL STATEMENTS — (Continued)
of certain change of control or other fundamental change transactions in which the Company is acquired by a public company, and (a) not less than 90% of the consideration received or to be received by holders of WebMD Common Stock, excluding cash payments for fractional shares, consists of acquirer common stock and (b) as a result of the transaction, the 1.50% Notes become convertible into the same consideration.
5. Long-Lived Assets
Property and Equipment
Property and equipment consist of the following:
| December 31, | ||||||||
| 2015 | 2014 | |||||||
| Software |
$ | 66,708 | $ | 60,341 | ||||
| Computer equipment |
69,973 | 63,541 | ||||||
| Web site development costs |
62,784 | 57,922 | ||||||
| Leasehold improvements |
72,679 | 44,000 | ||||||
| Office equipment, furniture and fixtures |
17,398 | 15,154 | ||||||
| Land and buildings |
291 | 291 | ||||||
|
|
|
|
|
|||||
| 289,833 | 241,249 | |||||||
| Less: accumulated depreciation |
(208,806 | ) | (181,676 | ) | ||||
|
|
|
|
|
|||||
| Property and equipment, net |
$ | 81,027 | $ | 59,573 | ||||
|
|
|
|
|
|||||
Depreciation expense was $27,200, $27,010 and $24,335 in 2015, 2014 and 2013, respectively.
Goodwill and Intangible Assets
The balance of goodwill was $202,980 as of December 31, 2015 and 2014. Intangible assets consist of the following:
| December 31, 2015 | December 31, 2014 | |||||||||||||||||||||||||||||||
| Gross Carrying Amount |
Accumulated Amortization |
Net | Weighted Average Remaining Useful Life(a) |
Gross Carrying Amount |
Accumulated Amortization |
Net | Weighted Average Remaining Useful Life(a) |
|||||||||||||||||||||||||
| Content |
$ | 15,954 | $ | (15,954 | ) | $ | — | — | $ | 15,954 | $ | (15,954 | ) | $ | — | — | ||||||||||||||||
| Customer relationships |
34,057 | (29,218 | ) | 4,839 | 2.7 | 34,057 | (27,126 | ) | 6,931 | 3.6 | ||||||||||||||||||||||
| Technology and patents |
17,882 | (16,291 | ) | 1,591 | 1.5 | 17,882 | (15,231 | ) | 2,651 | 2.5 | ||||||||||||||||||||||
| Trade names-definite lives |
2,530 | (2,530 | ) | — | — | 2,530 | (2,361 | ) | 169 | 1.0 | ||||||||||||||||||||||
| Trade names-indefinite lives |
4,464 | — | 4,464 | n/a | 4,464 | — | 4,464 | n/a | ||||||||||||||||||||||||
|
|
|
|
|
|
|
|
|
|
|
|
|
|||||||||||||||||||||
| Total |
$ | 74,887 | $ | (63,993 | ) | $ | 10,894 | $ | 74,887 | $ | (60,672 | ) | $ | 14,215 | ||||||||||||||||||
|
|
|
|
|
|
|
|
|
|
|
|
|
|||||||||||||||||||||
| (a) | The calculation of the weighted average remaining useful life is based on the net book value and the remaining amortization period of each respective intangible asset. |
In July 2014, the Company acquired the assets of TheraSim, Inc. for $3,182 in cash. TheraSim’s technology provides the content and programming for certain of the Company’s sponsorship services. The purchase price was allocated to an intangible asset, “Technology,” is being amortized over a 3-year term and is included within “Technology and Patents” in the above table.
F-23
Table of Contents
Index to Financial Statements
WEBMD HEALTH CORP.
NOTES TO CONSOLIDATED FINANCIAL STATEMENTS — (Continued)
Amortization expense was $3,321, $2,801 and $2,271 in 2015, 2014 and 2013, respectively. Future amortization expense for intangible assets is estimated to be:
| Year Ending December 31: |
||||
| 2016 |
$ | 3,120 | ||
| 2017 |
$ | 2,044 | ||
| 2018 |
$ | 1,266 |
6. Accrued Expenses
Accrued expenses consist of the following:
| December 31, | ||||||||
| 2015 | 2014 | |||||||
| Accrued compensation |
$ | 45,715 | $ | 38,856 | ||||
| Accrued outside services |
10,775 | 11,089 | ||||||
| Accrued marketing and distribution |
5,383 | 4,442 | ||||||
| Accrued interest |
5,119 | 5,960 | ||||||
| Other accrued liabilities |
13,672 | 12,311 | ||||||
|
|
|
|
|
|||||
| $ | 80,664 | $ | 72,658 | |||||
|
|
|
|
|
|||||
7. Commitments and Contingencies
Legal Proceedings and Claims
Dual Diagnosis Treatment Center, et al. v. Blue Cross of California, et al.
On May 8, 2015, six providers of substance abuse and/or mental health treatment services located in the States of California, Arizona and Florida filed an action in the United States District Court for the Central District of California initially against twenty-eight (28) Blue Cross and Blue Shield companies (collectively “Blue Cross”), as well as at least forty-one (41) health and benefit plans, including the WebMD Health and Welfare Plan (the “Health Plan”). Additional defendants have since been added. Horizon Blue Cross Blue Shield of New Jersey, one of the Blue Cross companies named as a defendant, serves as third-party claims administrator for the Health Plan, a welfare plan sponsored by the Company under the applicable provisions of the Employee Retirement Income Security Act of 1974 (“ERISA”). The Company self-insures (up to the deductible amount under the Company’s stop loss insurance policy) the group health plan component of the Health Plan. The Company serves as “plan administrator” for the Health Plan under ERISA. The plaintiffs, “out-of-network” providers to Blue Cross, claim that Blue Cross improperly ignored assignments of benefits received by the plaintiffs from the individual plan participants and sent payments directly to such individual participants who then failed to remit those payments to the providers. Plaintiffs claim that defendants’ failures to honor the assignments violate ERISA and state law and they seek recovery for benefit claims in unspecified amounts that they claim have been paid to the wrong party together with attorney fees, as well as removal of all fiduciaries who are found to have breached ERISA-imposed duties under the relevant health and benefit plans on account of such conduct, and injunctive relief to enjoin Blue Cross from alleged unlawful practices regarding assignments of benefits. The Company has not yet filed an answer to the complaint. On September 14, 2015, the defendants in the case, including the Company, filed a motion to dismiss the complaint for failure to state a claim. Thereafter, the plaintiffs amended the complaint and added new parties. The Company received an extension of its time to respond to the amended complaint and on January 25, 2016, renewed its motion to dismiss after all new parties were served and appeared in the case. The Company is unable to predict the outcome of this action or to reasonably estimate the possible loss or range of loss, if any, arising from the claims asserted therein.
F-24
Table of Contents
Index to Financial Statements
WEBMD HEALTH CORP.
NOTES TO CONSOLIDATED FINANCIAL STATEMENTS — (Continued)
Other Legal Proceedings and Claims
In the normal course of business, the Company and its subsidiaries are involved in various claims and legal proceedings. While the ultimate resolution of these matters has yet to be determined, the Company does not believe that their outcomes will have a material adverse effect on the Company’s consolidated financial position, results of operations or liquidity.
Leases
The Company leases its offices and other facilities under operating lease agreements that expire at various dates through 2024. Total rent expense for all operating leases was approximately $6,506, $9,194 and $8,805 in 2015, 2014 and 2013, respectively. Included in other long-term liabilities as of December 31, 2015 and 2014 were $12,071 and $10,605, respectively, related to lease incentives and the difference between rent expense and the rental amount payable for leases with fixed escalations.
Future minimum lease commitments under non-cancelable lease agreements at December 31, 2015 were as follows:
| Year Ending December 31: |
||||
| 2016 |
$ | 14,773 | ||
| 2017 |
15,122 | |||
| 2018 |
14,826 | |||
| 2019 |
14,035 | |||
| 2020 |
14,414 | |||
| Thereafter |
33,697 | |||
|
|
|
|||
| Total minimum lease payments |
$ | 106,867 | ||
|
|
|
Other Contingencies
The Company provides certain indemnification provisions within its customer agreements to protect the other party from any liabilities or damages resulting from a claim of misappropriation or infringement by third parties relating to its products and services. The Company has not incurred a liability relating to any of these indemnification provisions in the past and management believes that the likelihood of any future payment relating to these provisions is unlikely. Therefore, the Company has not recorded a liability during any period for these indemnification provisions.
8. Stock-Based Compensation
The Company has various stock-based compensation plans (collectively, the “Plans”) that provide for the grant of stock options, restricted stock, and other awards based on WebMD Common Stock.
The 2005 Long-Term Incentive Plan (as amended, the “2005 Plan”) is the only existing plan under which future grants can be made. The maximum number of shares of the Company’s Common Stock that may be subject to awards under the 2005 Plan was 24,975,000 as of December 31, 2015, subject to adjustment in accordance with the terms of the 2005 Plan. The Company had an aggregate of 2,320,338 shares of Common Stock available for future grants under the 2005 Plan at December 31, 2015.
Stock Options
Generally, options under the Plans vest and become exercisable ratably over periods ranging from two to five years based on their individual grant dates, subject to continued employment on the applicable vesting dates,
F-25
Table of Contents
Index to Financial Statements
WEBMD HEALTH CORP.
NOTES TO CONSOLIDATED FINANCIAL STATEMENTS — (Continued)
and generally expire within ten years from the date of grant. Options are granted at prices not less than the fair market value of the Company’s Common Stock on the date of grant. The following table summarizes stock option activity for the Plans:
| Shares | Weighted Average Exercise Price Per Share |
Weighted Average Remaining Contractual Life (In Years) |
Aggregate Intrinsic Value (a) |
|||||||||||||
| Outstanding at January 1, 2013 |
13,300,688 | $ | 26.24 | |||||||||||||
| Granted |
2,844,500 | 33.64 | ||||||||||||||
| Exercised |
(2,695,600 | ) | 20.90 | |||||||||||||
| Cancelled |
(2,020,309 | ) | 27.50 | |||||||||||||
|
|
|
|||||||||||||||
| Outstanding at December 31, 2013 |
11,429,279 | 29.12 | ||||||||||||||
| Granted |
899,200 | 43.03 | ||||||||||||||
| Exercised |
(3,875,410 | ) | 24.40 | |||||||||||||
| Cancelled |
(905,543 | ) | 33.42 | |||||||||||||
|
|
|
|||||||||||||||
| Outstanding at December 31, 2014 |
7,547,526 | 32.69 | ||||||||||||||
| Granted |
2,134,900 | 42.75 | ||||||||||||||
| Exercised |
(989,993 | ) | 24.53 | |||||||||||||
| Cancelled |
(821,998 | ) | 38.68 | |||||||||||||
|
|
|
|||||||||||||||
| Outstanding at December 31, 2015 |
7,870,435 | $ | 35.81 | 6.7 | $ | 99,384 | ||||||||||
|
|
|
|||||||||||||||
| Vested and exercisable at the end of the period |
4,101,045 | $ | 32.22 | 5.1 | $ | 67,010 | ||||||||||
|
|
|
|||||||||||||||
| (a) | The aggregate intrinsic value is based on the market price of the Company’s Common Stock on December 31, 2015, which was $48.30, less the applicable exercise price of the underlying option. This aggregate intrinsic value represents the amount that would have been realized if all the option holders had exercised their options on December 31, 2015. |
The following table summarizes information with respect to options outstanding and options exercisable at December 31, 2015:
| Outstanding | Exercisable | |||||||||||||||||||
| Exercise Prices |
Shares | Weighted Average Exercise Price Per Share |
Weighted Average Remaining Contractual Life (In Years) |
Shares | Weighted Average Exercise Price Per Share |
|||||||||||||||
| $13.15 - $19.95 |
532,595 | $ | 13.50 | 6.9 | 465,720 | $ | 13.31 | |||||||||||||
| $20.21 - $25.99 |
636,867 | 22.78 | 4.4 | 497,217 | 22.80 | |||||||||||||||
| $26.03 - $29.92 |
838,411 | 28.08 | 4.0 | 791,961 | 28.07 | |||||||||||||||
| $30.00 - $33.40 |
1,037,794 | 32.15 | 6.8 | 703,044 | 31.64 | |||||||||||||||
| $33.55 - $38.60 |
658,575 | 36.73 | 5.9 | 465,187 | 36.85 | |||||||||||||||
| $38.65 - $39.50 |
1,019,918 | 39.07 | 7.9 | 326,258 | 39.05 | |||||||||||||||
| $39.51 - $42.98 |
531,500 | 40.56 | 6.8 | 170,500 | 40.84 | |||||||||||||||
| $42.99 |
1,336,000 | 42.99 | 9.2 | — | — | |||||||||||||||
| $43.05 - $46.46 |
637,000 | 44.72 | 8.3 | 134,200 | 45.46 | |||||||||||||||
| $46.50 - $58.96 |
641,775 | 49.46 | 4.7 | 546,958 | 49.70 | |||||||||||||||
|
|
|
|
|
|||||||||||||||||
| 7,870,435 | $ | 35.81 | 6.7 | 4,101,045 | $ | 32.22 | ||||||||||||||
|
|
|
|
|
|||||||||||||||||
The fair value of each option granted is estimated on the date of grant using the Black-Scholes option pricing model considering the weighted-average assumptions noted in the following table. Expected volatility is
F-26
Table of Contents
Index to Financial Statements
WEBMD HEALTH CORP.
NOTES TO CONSOLIDATED FINANCIAL STATEMENTS — (Continued)
based on implied volatility from traded options of the Company’s Common Stock combined with historical volatility of the Company’s Common Stock. The expected term represents the period of time that options are expected to be outstanding following their grant date, and was determined using historical exercise data combined with assumptions for future exercise activity. The risk-free rate is based on the U.S. Treasury yield curve for periods equal to the expected term of the options on the grant date.
| Years Ended December 31, | ||||||||||||
| 2015 | 2014 | 2013 | ||||||||||
| Expected dividend yield |
0.0 | % | 0.0 | % | 0.0 | % | ||||||
| Expected volatility |
0.41 - 0.48 | 0.47 - 0.49 | 0.43 - 0.48 | |||||||||
| Risk-free interest rate |
1.01% - 1.56 | % | 1.16% - 1.72 | % | 0.55% - 1.62 | % | ||||||
| Expected term (years) |
4.1 - 4.7 | 4.2 - 5.0 | 4.5 - 5.1 | |||||||||
| Weighted-average fair value of options granted during the period |
$ | 16.26 | $ | 17.58 | $ | 13.95 | ||||||
Restricted Stock
The Company’s Restricted Stock consists of shares of the Company’s Common Stock which have been awarded to employees with restrictions that cause them to be subject to substantial risk of forfeiture and restrict their sale or other transfer by the employee until they vest. Generally, the Company’s Restricted Stock grants vest ratably over periods ranging from three to four years from their individual award dates subject to continued employment on the applicable vesting dates. The following table summarizes the activity of the Company’s Restricted Stock:
| Years Ended December 31, | ||||||||||||||||||||||||
| 2015 | 2014 | 2013 | ||||||||||||||||||||||
| Shares | Weighted Average Grant Date Fair Value |
Shares | Weighted Average Grant Date Fair Value |
Shares | Weighted Average Grant Date Fair Value |
|||||||||||||||||||
| Balance at beginning of the year |
904,083 | $ | 35.58 | 1,184,961 | $ | 33.07 | 932,386 | $ | 31.69 | |||||||||||||||
| Granted |
441,920 | 42.96 | 177,200 | 43.84 | 812,000 | 32.65 | ||||||||||||||||||
| Vested |
(331,558 | ) | 35.72 | (324,453 | ) | 32.70 | (401,825 | ) | 32.57 | |||||||||||||||
| Forfeited |
(159,600 | ) | 36.57 | (133,625 | ) | 31.29 | (157,600 | ) | 24.02 | |||||||||||||||
|
|
|
|
|
|
|
|||||||||||||||||||
| Balance at the end of the year |
854,845 | $ | 39.17 | 904,083 | $ | 35.58 | 1,184,961 | $ | 33.07 | |||||||||||||||
|
|
|
|
|
|
|
|||||||||||||||||||
Proceeds received from the exercise of options to purchase shares of the Company’s Common Stock were $21,939, $40,602 and $29,724 for the years ended December 31, 2015, 2014 and 2013, respectively. Additionally, in connection with the exercise of certain stock options and the vesting of restricted stock, the Company made payments of $6,438, $33,385 and $12,526 during the years ended December 31, 2015, 2014 and 2013, respectively, related to employee statutory withholding taxes that were satisfied by withholding shares of Common Stock of equal value from the respective employees. The proceeds and payments described above are reflected within cash flows from financing activities within the accompanying consolidated statements of cash flows.
The intrinsic value related to stock options that were exercised, combined with the fair value of shares of restricted stock that vested, aggregated $34,670, $100,232 and $45,882 for the years ended December 31, 2015, 2014 and 2013, respectively.
F-27
Table of Contents
Index to Financial Statements
WEBMD HEALTH CORP.
NOTES TO CONSOLIDATED FINANCIAL STATEMENTS — (Continued)
Other
Each year the Company issues shares of its Common Stock to WebMD non-employee directors with a value equal to their annual board and committee retainers. The Company recorded $467, $315 and $364 of stock-based compensation expense for the years ended December 31, 2015, 2014 and 2013, respectively, in connection with these issuances.
Summary of Stock-Based Compensation Expense
The following table summarizes the components and classification of stock-based compensation expense:
| Years Ended December 31, | ||||||||||||
| 2015 | 2014 | 2013 | ||||||||||
| Stock options |
$ | 21,336 | $ | 21,117 | $ | 24,483 | ||||||
| Restricted stock |
11,940 | 11,114 | 13,703 | |||||||||
| Other |
467 | 315 | 364 | |||||||||
|
|
|
|
|
|
|
|||||||
| Total stock-based compensation expense |
$ | 33,743 | $ | 32,546 | $ | 38,550 | ||||||
|
|
|
|
|
|
|
|||||||
| Included in: |
||||||||||||
| Cost of operations |
$ | 5,217 | $ | 5,940 | $ | 6,762 | ||||||
| Sales and marketing |
7,290 | 7,221 | 8,395 | |||||||||
| General and administrative |
21,236 | 19,385 | 23,393 | |||||||||
|
|
|
|
|
|
|
|||||||
| Total stock-based compensation expense |
$ | 33,743 | $ | 32,546 | $ | 38,550 | ||||||
|
|
|
|
|
|
|
|||||||
As of December 31, 2015, approximately $56,930 of unrecognized stock-based compensation expense related to unvested awards (net of estimated forfeitures) is expected to be recognized over a weighted-average period of approximately 2.3 years, related to the Plans.
Tax benefits attributable to stock-based compensation represented approximately 38% of stock-based compensation expense during the year ended December 31, 2015 and 39% of stock-based compensation expense during each of the years ended December 31, 2014 and 2013.
9. Retirement Plans
The Company maintains certain defined contribution retirement plans covering substantially all of its employees, which provide for matching and discretionary contributions. The Company has recorded expenses related to these plans of $4,495, $3,971 and $3,903 for 2015, 2014 and 2013, respectively, related to these matching and discretionary contributions.
10. Equity
Treasury Stock
Repurchased shares are recorded under the cost method and are reflected as treasury stock in the accompanying consolidated balance sheets, unless the shares are cancelled and retired.
Tender Offers
On September 9, 2014, the Company completed a tender offer (the “2014 Tender Offer”) through which it repurchased 2,000,000 shares of its Common Stock at a price of $48.50 per share for total consideration of $97,588, which includes $588 of costs directly attributable to the purchase. The shares repurchased through the 2014 Tender Offer are reflected as treasury stock in the accompanying consolidated balance sheets.
F-28
Table of Contents
Index to Financial Statements
WEBMD HEALTH CORP.
NOTES TO CONSOLIDATED FINANCIAL STATEMENTS — (Continued)
On September 10, 2013, the Company completed a tender offer (the “2013 Tender Offer”) through which it repurchased 5,000,000 shares of its Common Stock at a price of $34.00 per share for total consideration of $170,516, which includes $516 of costs directly attributable to the purchase. The shares repurchased through the 2013 Tender Offer were cancelled and retired.
Stock Repurchase Program
In August 2011, the Board of Directors established a stock repurchase program (the “Program”) through which the Company was authorized to use up to $75,000 to purchase shares of WebMD Common Stock, from time to time, in the open market, through block trades or in private transactions, depending on market conditions and other factors. In October 2011, February 2014, March 2014, April 2014, November 2014 and September 2015, the Company’s Board of Directors authorized increases to the Program of $75,000, $50,000, $40,000, $30,000, $23,895 and $27,451, respectively. During 2013, the Company repurchased 1,266,962 shares at an aggregate cost of $42,309 under the Program. During 2014, the Company repurchased 3,160,070 shares at an aggregate cost of $128,748 under the Program. During 2015, the Company repurchased 688,467 shares at an aggregate cost of $28,406 under the Program. The Company paid cash of $569 in 2013 related to the repurchase of 39,857 shares in 2012, that settled in 2013. As of December 31, 2015, $34,056 remained available for repurchases under the Program.
Other Repurchase Activity
On October 21, 2013, the Company repurchased 5,527,433 shares of its Common Stock that were beneficially owned by Carl C. Icahn and certain of his affiliates, at a purchase price of $32.08 per share, the NASDAQ official closing price of WebMD Common Stock on October 18, 2013. The total purchase price was $177,420, which includes $100 of costs directly attributable to the purchase. This share repurchase was not made under the Program.
Shareholder Rights Agreement
The Board of Directors of the Company adopted, and the Company entered into, a Stockholder Rights Agreement, dated as of November 2, 2011 (the “Rights Agreement”), by and between the Company and American Stock Transfer & Trust Company, LLC, as Rights Agent. Pursuant to the terms of the Rights Agreement, which had a one-year term until amended (as described below), one preferred stock purchase right (a “Right”) was attached to each outstanding share of the Company’s Common Stock held by holders of record as of the close of business on November 14, 2011. The Company issued one Right with each new share of Common Stock issued after that date until the Rights expired. The Rights initially traded with and were inseparable from the Company’s Common Stock and were not evidenced by separate certificates unless they became exercisable. The Rights would, if they had become exercisable, have caused substantial dilution to a person or group that attempted to acquire the Company on terms not approved by the Company’s Board of Directors. However, the Rights would not have interfered with a merger or other business combination approved by the Company’s Board of Directors. Until amended (as described below), each Right entitled its holder to purchase from the Company one one-thousandth of a share (a “Unit”) of Series A Junior Preferred Stock, par value $0.01 per share (the “Preferred Stock”), at an exercise price of $153.00 per Unit, subject to adjustment in accordance with the terms of the Rights Agreement, once the Rights become exercisable. On October 18, 2012, the Board of Directors of the Company adopted, and the Company entered into, an Amendment to Rights Agreement (the “First Amendment”). The First Amendment: extended the expiration date of the Rights Agreement from October 31, 2012 to October 31, 2014; provided that equity compensation awards to directors would not be included in determining whether a stockholder became an “Acquiring Person” under the Rights Agreement; and decreased the purchase price payable by holders of Rights upon exercise of such Rights from $153.00 per Unit to $66.29
F-29
Table of Contents
Index to Financial Statements
WEBMD HEALTH CORP.
NOTES TO CONSOLIDATED FINANCIAL STATEMENTS — (Continued)
per Unit. On August 1, 2013 the Company entered into a Second Amendment to the Rights Agreement (the “Second Amendment”). Pursuant to the Second Amendment, the final expiration date of the Rights Agreement occurred on August 1, 2013, which terminated the Rights Agreement and caused the Rights issued to WebMD stockholders pursuant to the Rights Agreement to expire at the close of business on that date.
Accumulated Other Comprehensive Income
Accumulated other comprehensive income in the accompanying consolidated balance sheets as of December 31, 2015 and 2014 represents the unrealized gain on available-for-sale securities, net of taxes, related to an equity investment in a publicly traded company that completed its initial public offering in December 2014.
11. Income Taxes
Deferred income taxes reflect the net tax effects of temporary differences between the carrying amounts of assets and liabilities for financial reporting purposes and the amounts used for income tax purposes. Significant components of the Company’s deferred tax assets (liabilities) were as follows:
| December 31, | ||||||||
| 2015 | 2014 | |||||||
| Deferred tax assets: |
||||||||
| Federal net operating loss carryforwards |
$ | 83,071 | $ | 91,000 | ||||
| State net operating loss carryforwards |
33,320 | 35,488 | ||||||
| Capital losses |
292 | 458 | ||||||
| Federal tax credits |
28,555 | 56,096 | ||||||
| Accrued expenses |
19,086 | 17,919 | ||||||
| Stock-based compensation |
24,294 | 21,031 | ||||||
| Intangible assets |
3,610 | 3,570 | ||||||
| Other |
3,808 | 3,841 | ||||||
|
|
|
|
|
|||||
| Total deferred tax assets |
196,036 | 229,403 | ||||||
| Valuation allowance |
(142,604 | ) | (157,644 | ) | ||||
|
|
|
|
|
|||||
| Net deferred tax assets |
53,432 | 71,759 | ||||||
|
|
|
|
|
|||||
| Deferred tax liabilities: |
||||||||
| Property and equipment |
(1,466 | ) | (3,063 | ) | ||||
| Goodwill and indefinite-lived intangible asset |
(33,465 | ) | (30,975 | ) | ||||
| Other |
(2,807 | ) | (627 | ) | ||||
|
|
|
|
|
|||||
| Total deferred tax liabilities |
(37,738 | ) | (34,665 | ) | ||||
|
|
|
|
|
|||||
| Net deferred tax assets |
$ | 15,694 | $ | 37,094 | ||||
|
|
|
|
|
|||||
| December 31, | ||||||||
| 2015 | 2014 | |||||||
| Current deferred tax assets, net: |
||||||||
| Current deferred tax assets, net of deferred tax liabilities |
$ | 66,665 | $ | 59,371 | ||||
| Valuation allowance |
(50,539 | ) | (41,224 | ) | ||||
|
|
|
|
|
|||||
| Current deferred tax assets, net |
16,126 | 18,147 | ||||||
|
|
|
|
|
|||||
| Non-current deferred tax (liabilities) assets, net: |
||||||||
| Non-current deferred tax assets, net of deferred tax liabilities |
91,633 | 135,367 | ||||||
| Valuation allowance |
(92,065 | ) | (116,420 | ) | ||||
|
|
|
|
|
|||||
| Non-current deferred tax (liabilities) assets, net |
(432 | ) | 18,947 | |||||
|
|
|
|
|
|||||
| Net deferred tax assets |
$ | 15,694 | $ | 37,094 | ||||
|
|
|
|
|
|||||
F-30
Table of Contents
Index to Financial Statements
WEBMD HEALTH CORP.
NOTES TO CONSOLIDATED FINANCIAL STATEMENTS — (Continued)
The income tax provision was as follows:
| Years Ended December 31, | ||||||||||||
| 2015 | 2014 | 2013 | ||||||||||
| Current: |
||||||||||||
| Federal |
$ | 1,076 | $ | (622 | ) | $ | (73 | ) | ||||
| State |
4,773 | 3,047 | 502 | |||||||||
| Foreign |
268 | 369 | 141 | |||||||||
|
|
|
|
|
|
|
|||||||
| Current income tax provision |
6,117 | 2,794 | 570 | |||||||||
| Deferred: |
||||||||||||
| Federal |
(8,456 | ) | 12,570 | 10,683 | ||||||||
| State |
743 | 2,147 | 2,387 | |||||||||
|
|
|
|
|
|
|
|||||||
| Deferred income tax (benefit) provision |
(7,713 | ) | 14,717 | 13,070 | ||||||||
| Reversal of valuation allowance applied to additional paid-in capital |
37,443 | 13,196 | — | |||||||||
|
|
|
|
|
|
|
|||||||
| Total income tax provision |
$ | 35,847 | $ | 30,707 | $ | 13,640 | ||||||
|
|
|
|
|
|
|
|||||||
The reconciliation between the federal statutory rate and the effective income tax rate is as follows:
| Years Ended December 31, | ||||||||||||
| 2015 | 2014 | 2013 | ||||||||||
| United States federal statutory rate |
35.0% | 35.0% | 35.0% | |||||||||
| State income taxes (net of federal benefit) |
5.7 | 7.4 | 12.5 | |||||||||
| Valuation allowance |
(7.1) | (3.3) | (6.4) | |||||||||
| Non-deductible officer compensation |
1.4 | 2.2 | 3.6 | |||||||||
| Other |
0.9 | 1.6 | 2.7 | |||||||||
|
|
|
|
|
|
|
|||||||
| Effective income tax rate |
35.9% | 42.9% | 47.4% | |||||||||
|
|
|
|
|
|
|
|||||||
During 2015 and 2014, the Company reversed $37,443 and $13,196, respectively, of its valuation allowance through additional paid-in capital as a result of the utilization of net operating loss carryforwards generated by excess tax benefits of share-based payments. In the quarter ended June 30, 2015, the Company increased its valuation allowance by $24,775 for a correcting adjustment related to the realization of excess tax benefits of share-based payments during the years ended December 31, 2011 and 2010, offset by a reversal of a valuation allowance originally recorded during the year ended December 31, 2012. During 2015, 2014 and 2013, the Company reversed $1,455, $1,311 and $1,351, respectively, of its deferred tax asset and related valuation allowance through the tax provision as a result of the expiration of state net operating loss carryforwards, and during 2014, the Company also reversed $1,359 of its deferred tax asset and related valuation allowance through additional paid-in capital as a result of the expiration of state net operating loss carryforwards generated by excess tax benefits of share-based payments. The valuation allowance for deferred tax assets decreased by $15,040 and $16,948 in 2015 and 2014, respectively.
At December 31, 2015, the Company had net operating loss carryforwards for federal income tax purposes of approximately $615,000, of which primarily all expire in 2021 through 2034, and federal tax credits of $66,767, which excludes the impact of any unrecognized tax benefits, of which $44,128 expire in 2017 through 2031 and $22,639 can be carried forward indefinitely.
The Company uses the “with-and-without” approach in determining the order in which tax attributes are utilized. Using the “with-and-without” approach, the Company will only recognize a tax benefit from
F-31
Table of Contents
Index to Financial Statements
WEBMD HEALTH CORP.
NOTES TO CONSOLIDATED FINANCIAL STATEMENTS — (Continued)
share-based payments in additional paid-in capital if an incremental tax benefit is realized after all other tax attributes currently available to the Company have been utilized. As a result of these ordering rules, the composition of tax attributes on a tax return and financial statement basis will differ.
The net operating loss carryforwards that are presented on a tax effected basis within the deferred tax assets include approximately $230,000 of gross excess tax benefits related to share-based payments. Since this amount was recorded through additional paid-in capital, the related valuation allowance on these net operating loss carryforwards will be reversed through additional paid-in capital when these excess tax benefits are realized. The net operating loss carryforwards also include gross excess tax benefits related to share-based payments of approximately $460,000 that are not recognized as a deferred tax asset as the amounts would not have resulted in a reduction in current taxes payable if all other tax attributes currently available to the Company were utilized. The benefit of these deductions will be recognized through additional paid-in capital at the time the tax deduction results in a reduction of current taxes payable.
The tender offer completed on November 25, 2008 resulted in a cumulative change of more than 50% of the ownership of the Company’s capital, as determined under rules prescribed by the U.S. Internal Revenue Code and applicable Treasury regulations. As a result of the ownership change, there is an annual limitation imposed on the Company’s net operating loss carryforwards and federal tax credits. The Company experienced another cumulative change on February 25, 2011. Despite this second ownership change, the Company’s net operating loss carryforwards and federal tax credits continue to be limited by the November 25, 2008 annual limitation.
As of December 31, 2015 and 2014, the Company had unrecognized income tax benefits of $14,815 and $13,553, respectively, of which $14,815 and $8,828, respectively, would result in an income tax benefit if realized. Included in the unrecognized income tax benefits as of December 31, 2015 and 2014 are accrued interest and penalties of $738 and $581, respectively. The Company recognizes interest and penalties related to unrecognized tax benefits as part of the income tax provision.
The following table summarizes the activity of unrecognized tax benefits, excluding accrued interest and penalties, for the years ended December 31, 2015, 2014 and 2013:
| Years Ended December 31, | ||||||||||||
| 2015 | 2014 | 2013 | ||||||||||
| Balance at the beginning of the year |
$ | 12,972 | $ | 13,392 | $ | 13,949 | ||||||
| Increases related to prior year tax positions |
776 | 15 | — | |||||||||
| Increases related to current year tax positions |
394 | — | — | |||||||||
| Decreases related to prior year tax positions |
— | (379 | ) | (532 | ) | |||||||
| Settlements |
(15 | ) | — | — | ||||||||
| Expiration of the statute of limitations for the assessment of taxes |
(50 | ) | (56 | ) | (25 | ) | ||||||
|
|
|
|
|
|
|
|||||||
| Balance at the end of the year |
$ | 14,077 | $ | 12,972 | $ | 13,392 | ||||||
|
|
|
|
|
|
|
|||||||
Although the Company files U.S. federal and various state and other tax returns, the major taxing jurisdiction is the U.S. The Company is currently under audit in a number of state and local taxing jurisdictions and will have statutes of limitations with respect to certain tax returns expiring within the next twelve months. As a result, it is reasonably possible that there may be a reduction in the unrecognized income tax benefits, prior to any annual increase, in the range of $100 to $200 within the next twelve months. With the exception of adjusting net operating loss carryforwards that may be utilized, the Company is no longer subject to federal income tax examinations for tax years before 2012 and for state and local income tax examinations for tax years before 2011.
F-32
Table of Contents
Index to Financial Statements
WEBMD HEALTH CORP.
NOTES TO CONSOLIDATED FINANCIAL STATEMENTS — (Continued)
12. Fair Value of Financial Instruments
The Company accounts for certain assets and liabilities at fair value, which is defined as the price that would be received to sell an asset or paid to transfer a liability in an orderly transaction between market participants at the measurement date. Additionally, the Company uses valuation techniques that maximize the use of observable inputs and minimize the use of unobservable inputs. These inputs are prioritized below:
| Level 1: | Observable inputs such as quoted market prices in active markets for identical assets or liabilities. |
| Level 2: | Observable market-based inputs or unobservable inputs that are corroborated by market data. |
| Level 3: | Unobservable inputs for which there is little or no market data, which require the use of the reporting entity’s own assumptions. |
The Company did not have any Level 2 or Level 3 assets during the years ended December 31, 2015, 2014 and 2013. The following table sets forth the Company’s Level 1 financial assets that were measured and recorded at fair value on a recurring basis as of December 31, 2015 and 2014:
| Fair
Value Estimate Using: |
December 31, 2015 | December 31, 2014 | ||||||||||||||||||||||||||
| Amortized Cost Basis |
Fair Value | Gross Unrealized Gains |
Amortized Cost Basis |
Fair Value | Gross Unrealized Gains |
|||||||||||||||||||||||
| Cash and cash equivalents |
Level 1 | $ | 641,165 | $ | 641,165 | $ | — | $ | 706,776 | $ | 706,776 | $ | — | |||||||||||||||
| Available-for-sale security |
Level 1 | — | 598 | 598 | — | 1,603 | 1,603 | |||||||||||||||||||||
The Company’s available-for-sale security consists of an equity investment in a publicly traded company that completed its initial public offering in December 2014. The following table reconciles the beginning and ending balances of the Company’s available-for-sale security during the year ended December 31, 2015:
| Year Ended December 31, 2015 |
||||
| Fair value as of the beginning of the period |
$ | 1,603 | ||
| Cash proceeds received |
(139 | ) | ||
| Gain included in earnings |
139 | |||
| Change in unrealized gains included in other comprehensive income |
(1,005 | ) | ||
|
|
|
|||
| Fair value as of the end of the period |
$ | 598 | ||
|
|
|
|||
During 2015, the Company recorded a gain on investments of $139, which represents the proceeds received by the Company when it sold a portion of its available-for-sale security. The unrealized gain related to this investment, net of tax, is included within accumulated other comprehensive income in the accompanying consolidated balance sheets as of December 31, 2015 and 2014.
The Company also holds an investment in a privately held company which is carried at cost, and not subject to fair value measurements. However, if events or circumstances indicate that its carrying amount may not be recoverable, it would be reviewed for impairment. The Company made this investment in November 2008 by acquiring preferred stock. During November 2014, this investment was converted into a combination of preferred stock and debt securities of another privately held company through an acquisition. The total amount of the Company’s investment in this privately held company is $6,471. Since the Company does not have the ability to exercise significant influence over this company, the investment is accounted for under the cost method and it is included in other assets on the accompanying consolidated balance sheets as of December 31, 2015 and 2014.
F-33
Table of Contents
Index to Financial Statements
WEBMD HEALTH CORP.
NOTES TO CONSOLIDATED FINANCIAL STATEMENTS — (Continued)
For disclosure purposes, the Company is required to measure the outstanding value of its debt on a recurring basis. The following table presents the carrying value and estimated fair value (based on Level 1 market price data) of the Company’s convertible notes that were carried at historical cost as of December 31, 2015 and 2014:
| December 31, 2015 | December 31, 2014 | |||||||||||||||
| Carrying Amount |
Fair Value | Carrying Amount |
Fair Value | |||||||||||||
| 2.25% Notes |
$ | 102,682 | $ | 102,618 | $ | 252,232 | $ | 254,754 | ||||||||
| 2.50% Notes |
$ | 400,000 | $ | 416,000 | $ | 400,000 | $ | 399,000 | ||||||||
| 1.50% Notes |
$ | 300,000 | $ | 340,566 | $ | 300,000 | $ | 299,250 | ||||||||
13. Other expense
For 2015, other expense represents a charge related to the resolution of a patent infringement claim made by International Business Machines Corporation against the Company. For 2013, other expense consisted of cash severance and related expenses due to the May 2013 departure of a Chief Executive Officer of the Company.
14. Supplemental Disclosures of Cash Flow Information
Supplemental information related to the consolidated statements of cash flows is summarized below:
| Years Ended December 31, | ||||||||||||
| 2015 | 2014 | 2013 | ||||||||||
| Supplemental Disclosure of Cash Flow Information: |
||||||||||||
| Interest paid |
$ | 19,792 | $ | 20,225 | $ | 19,038 | ||||||
|
|
|
|
|
|
|
|||||||
| Taxes paid, net(a) |
$ | 2,850 | $ | 277 | $ | 274 | ||||||
|
|
|
|
|
|
|
|||||||
| (a) | As the Company generally files its tax returns on a consolidated basis, taxes paid, net of refunds, includes all taxes paid by the Company, including those of the Company’s discontinued operations. |
F-34
Table of Contents
Index to Financial Statements
WEBMD HEALTH CORP.
NOTES TO CONSOLIDATED FINANCIAL STATEMENTS — (Continued)
15. Quarterly Financial Data (Unaudited)
The following table summarizes the quarterly financial data for 2015 and 2014. The per common share calculations for each of the quarters are based on the weighted-average number of common shares for each period; therefore, the sum of the quarters may not necessarily be equal to the full year per common share amount.
| 2015 | ||||||||||||||||
| First Quarter |
Second Quarter |
Third Quarter |
Fourth Quarter |
|||||||||||||
| Revenue |
$ | 143,343 | $ | 148,320 | $ | 152,607 | $ | 192,129 | ||||||||
| Cost of operations |
57,877 | 60,407 | 59,552 | 69,475 | ||||||||||||
| Sales and marketing |
32,476 | 32,570 | 32,850 | 40,129 | ||||||||||||
| General and administrative |
21,453 | 23,002 | 22,942 | 24,183 | ||||||||||||
| Depreciation and amortization |
8,245 | 7,592 | 7,266 | 7,418 | ||||||||||||
| Interest income |
17 | 9 | 10 | 15 | ||||||||||||
| Interest expense |
6,172 | 6,171 | 5,681 | 5,099 | ||||||||||||
| Loss on convertible notes |
— | — | 2,058 | — | ||||||||||||
| Gain on investments |
— | 139 | — | — | ||||||||||||
| Other expense |
— | 4,100 | — | — | ||||||||||||
|
|
|
|
|
|
|
|
|
|||||||||
| Income before income tax provision |
17,137 | 14,626 | 22,268 | 45,840 | ||||||||||||
| Income tax provision |
7,133 | 1,255 | 9,080 | 18,379 | ||||||||||||
|
|
|
|
|
|
|
|
|
|||||||||
| Net income |
$ | 10,004 | $ | 13,371 | $ | 13,188 | $ | 27,461 | ||||||||
|
|
|
|
|
|
|
|
|
|||||||||
| Net income per common share – Basic |
$ | 0.27 | $ | 0.36 | $ | 0.36 | $ | 0.75 | ||||||||
|
|
|
|
|
|
|
|
|
|||||||||
| Net income per common share – Diluted |
$ | 0.25 | $ | 0.32 | $ | 0.32 | $ | 0.60 | ||||||||
|
|
|
|
|
|
|
|
|
|||||||||
| Net Income per Common Share: |
||||||||||||||||
| Numerator: |
||||||||||||||||
| Net income – Basic |
$ | 10,004 | $ | 13,371 | $ | 13,188 | $ | 27,461 | ||||||||
| Interest expense on 1.50% Notes, net of tax |
864 | 864 | 864 | 864 | ||||||||||||
| Interest expense on 2.50% Notes, net of tax |
— | 1,797 | 1,797 | 1,797 | ||||||||||||
| Interest expense on 2.25% Notes, net of tax |
— | 1,103 | — | 449 | ||||||||||||
|
|
|
|
|
|
|
|
|
|||||||||
| Net income – Diluted |
$ | 10,868 | $ | 17,135 | $ | 15,849 | $ | 30,571 | ||||||||
|
|
|
|
|
|
|
|
|
|||||||||
| Denominator: |
||||||||||||||||
| Weighted-average shares – Basic |
36,393 | 36,705 | 36,721 | 36,583 | ||||||||||||
| Stock options and restricted stock |
1,378 | 1,503 | 1,338 | 1,427 | ||||||||||||
| 1.50% Notes |
5,694 | 5,694 | 5,694 | 5,694 | ||||||||||||
| 2.50% Notes |
— | 6,205 | 6,205 | 6,205 | ||||||||||||
| 2.25% Notes |
— | 3,511 | — | 1,429 | ||||||||||||
|
|
|
|
|
|
|
|
|
|||||||||
| Adjusted weighted-average shares after assumed conversions – Diluted |
43,465 | 53,618 | 49,958 | 51,338 | ||||||||||||
|
|
|
|
|
|
|
|
|
|||||||||
F-35
Table of Contents
Index to Financial Statements
WEBMD HEALTH CORP.
NOTES TO CONSOLIDATED FINANCIAL STATEMENTS — (Continued)
| 2014 | ||||||||||||||||
| First Quarter |
Second Quarter |
Third Quarter |
Fourth Quarter |
|||||||||||||
| Revenue |
$ | 133,832 | $ | 140,400 | $ | 143,490 | $ | 162,727 | ||||||||
| Cost of operations |
52,564 | 54,456 | 56,398 | 60,676 | ||||||||||||
| Sales and marketing |
32,911 | 33,321 | 32,950 | 36,978 | ||||||||||||
| General and administrative |
23,781 | 22,339 | 23,243 | 24,756 | ||||||||||||
| Depreciation and amortization |
7,328 | 7,042 | 7,667 | 7,774 | ||||||||||||
| Interest income |
15 | 17 | 19 | 18 | ||||||||||||
| Interest expense |
6,172 | 6,172 | 6,171 | 6,171 | ||||||||||||
|
|
|
|
|
|
|
|
|
|||||||||
| Income from continuing operations before income tax provision |
11,091 | 17,087 | 17,080 | 26,390 | ||||||||||||
| Income tax provision |
4,825 | 7,371 | 7,275 | 11,236 | ||||||||||||
|
|
|
|
|
|
|
|
|
|||||||||
| Income from continuing operations |
6,266 | 9,716 | 9,805 | 15,154 | ||||||||||||
| Income from discontinued operations, net of tax |
— | — | — | 1,122 | ||||||||||||
|
|
|
|
|
|
|
|
|
|||||||||
| Net income |
$ | 6,266 | $ | 9,716 | $ | 9,805 | $ | 16,276 | ||||||||
|
|
|
|
|
|
|
|
|
|||||||||
| Basic income per common share: |
||||||||||||||||
| Income from continuing operations |
$ | 0.16 | $ | 0.26 | $ | 0.26 | $ | 0.42 | ||||||||
| Income from discontinued operations |
— | — | — | 0.03 | ||||||||||||
|
|
|
|
|
|
|
|
|
|||||||||
| Net income |
$ | 0.16 | $ | 0.26 | $ | 0.26 | $ | 0.45 | ||||||||
|
|
|
|
|
|
|
|
|
|||||||||
| Diluted income per common share: |
||||||||||||||||
| Income from continuing operations |
$ | 0.15 | $ | 0.23 | $ | 0.23 | $ | 0.36 | ||||||||
| Income from discontinued operations |
— | — | — | 0.02 | ||||||||||||
|
|
|
|
|
|
|
|
|
|||||||||
| Net income |
$ | 0.15 | $ | 0.23 | $ | 0.23 | $ | 0.38 | ||||||||
|
|
|
|
|
|
|
|
|
|||||||||
| Net Income per Common Share: |
||||||||||||||||
| Numerator: |
||||||||||||||||
| Income from continuing operations – Basic |
$ | 6,266 | $ | 9,716 | $ | 9,805 | $ | 15,154 | ||||||||
| Interest expense on 1.50% Notes, net of tax |
— | 864 | 864 | 864 | ||||||||||||
| Interest expense on 2.50% Notes, net of tax |
— | — | — | 1,797 | ||||||||||||
| Interest expense on 2.25% Notes, net of tax |
— | — | — | 1,103 | ||||||||||||
|
|
|
|
|
|
|
|
|
|||||||||
| Income from continuing operations – Diluted |
$ | 6,266 | $ | 10,580 | $ | 10,669 | $ | 18,918 | ||||||||
|
|
|
|
|
|
|
|
|
|||||||||
| Income from discontinued operations, net of tax – Basic and Diluted |
$ | — | $ | — | $ | — | $ | 1,122 | ||||||||
|
|
|
|
|
|
|
|
|
|||||||||
| Denominator: |
||||||||||||||||
| Weighted-average shares – Basic |
39,268 | 37,819 | 37,960 | 36,427 | ||||||||||||
| Stock options and restricted stock |
2,584 | 2,301 | 2,113 | 1,245 | ||||||||||||
| 1.50% Notes |
— | 5,681 | 5,684 | 5,694 | ||||||||||||
| 2.50% Notes |
— | — | — | 6,205 | ||||||||||||
| 2.25% Notes |
— | — | — | 3,511 | ||||||||||||
|
|
|
|
|
|
|
|
|
|||||||||
| Adjusted weighted-average shares after assumed conversions – Diluted |
41,852 | 45,801 | 45,757 | 53,082 | ||||||||||||
|
|
|
|
|
|
|
|
|
|||||||||
F-36
Table of Contents
Index to Financial Statements
Schedule II. Valuation and Qualifying Accounts
| Years Ended December 31, 2015, 2014 and 2013 | ||||||||||||||||||||
| Balance at | Charged to | |||||||||||||||||||
| Beginning | Costs and | Balance at | ||||||||||||||||||
| of Year | Expenses | Write-offs | Other | End of Year | ||||||||||||||||
| (in thousands) | ||||||||||||||||||||
| December 31, 2015 |
||||||||||||||||||||
| Allowance for Doubtful Accounts |
$ | 631 | $ | 874 | $ | (465 | ) | $ | — | $ | 1,040 | |||||||||
| Valuation Allowance for Deferred Tax Assets |
157,644 | (7,061 | ) | — | (7,979 | )(a) | 142,604 | |||||||||||||
| December 31, 2014 |
||||||||||||||||||||
| Allowance for Doubtful Accounts |
793 | 577 | (739 | ) | — | 631 | ||||||||||||||
| Valuation Allowance for Deferred Tax Assets |
174,592 | (2,350 | ) | — | (14,598 | )(b) | 157,644 | |||||||||||||
| December 31, 2013 |
||||||||||||||||||||
| Allowance for Doubtful Accounts |
1,304 | 283 | (794 | ) | — | 793 | ||||||||||||||
| Valuation Allowance for Deferred Tax Assets |
176,403 | (1,831 | ) | — | 20 | 174,592 | ||||||||||||||
| (a) | Primarily represents the valuation allowance released as a result of the utilization of net operating loss carryforwards generated by excess tax benefits of share-based payments, offset by a correcting adjustment, made in the quarter ended June 30, 2015, related to the realization of excess tax benefits of share-based payments during the years ended December 31, 2011 and 2010. |
| (b) | Primarily represents the valuation allowance released as a result of the utilization and expiration of net operating loss carryforwards generated by excess tax benefits of share-based payments. |
S-1
Table of Contents
Index to Financial Statements
| Exhibit No. |
Description | |
| 3.1 | Restated Certificate of Incorporation of the Registrant (incorporated by reference to Exhibit 3.1 to the Registrant’s Registration Statement on Form S-8 filed on October 23, 2009 (Reg. No. 333-162651)) | |
| 3.2 | Amended and Restated By-laws of the Registrant effective February 19, 2016 (incorporated by reference to Exhibit 3.1 to the Registrant’s Current Report on Form 8-K filed on February 22, 2016) | |
| 4.1 | Specimen Common Stock Certificate (incorporated by reference to Exhibit 4.1 in Amendment No. 1, filed on August 11, 2009, to the Registrant’s Registration Statement on Form S-4 (Reg. No. 333-160530)) | |
| 4.2 | Indenture, dated as of January 11, 2011, between the Registrant and The Bank of New York Mellon Trust Company, N.A. (incorporated by reference to Exhibit 4.1 to Amendment No. 1, filed on January 14, 2011, to the Registrant’s Current Report on Form 8-K filed on January 11, 2011) | |
| 4.3 | Form of 2.50% Convertible Note Due 2018 (included in Exhibit 4.2) | |
| 4.4 | Indenture, dated as of March 14, 2011, between the Registrant and The Bank of New York Mellon Trust Company, N.A. (incorporated by reference to Exhibit 4.1 to Amendment No. 1, filed on March 15, 2011, to the Registrant’s Current Report on Form 8-K filed on March 14, 2011) | |
| 4.5 | Form of 2.25% Convertible Note Due 2016 (included in Exhibit 4.4) | |
| 4.6 | Indenture, dated as of November 26, 2013, between the Registrant and The Bank of New York Mellon Trust Company, N.A. (incorporated by reference to Exhibit 4.1 to Amendment No. 1, filed on November 27, 2013, to the Registrant’s Current Report on Form 8-K filed on November 26, 2013) | |
| 4.7 | Form of 1.50% Convertible Note Due 2020 (included in Exhibit 4.6) | |
| 4.8 | Rights Agreement, dated as of November 2, 2011, between the Registrant and American Stock Transfer & Trust Company, LLC (incorporated by reference to Exhibit 4.1 to the Registrant’s Registration Statement on Form 8-A filed on November 3, 2011) | |
| 4.9 | Amendment to Rights Agreement, dated as of October 18, 2012, between the Registrant and American Stock Transfer & Trust Company, LLC, as Rights Agent (incorporated by reference to Exhibit 4.1 to the Registrant’s Current Report on Form 8-K filed on October 19, 2012) | |
| 4.10 | Second Amendment to Rights Agreement, dated as of August 1, 2013 (incorporated by reference to Exhibit 4.3 to Amendment No. 2, filed on August 2, 2013, to the Registrant’s Registration Statement on Form 8-A) | |
| 4.11* | WebMD Health Corp. Long-Term Incentive Plan for Employees of Subimo, LLC (incorporated by reference to Exhibit 10.2 to HLTH’s Annual Report on Form 10-K for the year ended December 31, 2006)(1) | |
| 4.12* | Form of Amendment to HLTH’s Equity Compensation Plans and Stock Option Agreements (incorporated by reference to Exhibit 10.1 to the Quarterly Report on Form 10-Q filed by HLTH on November 9, 2006)(1) | |
| 4.13* | 2001 Employee Non-Qualified Stock Option Plan of HLTH, as amended (incorporated by reference to Exhibit 10.46 to HLTH’s Annual Report on Form 10-K for the year ended December 31, 2001, as amended by Amendment No. 1 on Form 10-K/A)(1) | |
| 4.14* | Amended and Restated 1996 Stock Plan of HLTH (incorporated by reference to Exhibit 10.8 to HLTH’s Quarterly Report on Form 10-Q for the quarter ended March 31, 2006)(1) | |
E-1
Table of Contents
Index to Financial Statements
| Exhibit No. |
Description | |
| 4.15* | Amended and Restated 2000 Long-Term Incentive Plan of HLTH (incorporated by reference to Annex E to HLTH’s Proxy Statement for its 2006 Annual Meeting filed on August 14, 2006)(1) | |
| 4.16* | WebMD Health Corp. Amended and Restated 2005 Long-Term Incentive Plan, as amended effective October 1, 2015 (the “2005 LTIP”) (incorporated by reference to Exhibit 4.1 to the Registrant’s Current Report on Form 8-K filed on October 2, 2015) | |
| 4.17* | Form of Restricted Stock Agreement with Employees (incorporated by reference to Exhibit 4.2 to the Registrant’s Registration Statement on Form S-8 filed on October 23, 2009 (Reg. No. 333-162653)) | |
| 4.18* | Form of Restricted Stock Agreement with Non-Employee Directors (incorporated by reference to Exhibit 10.49 to the Registrant’s Registration Statement on Form S-1 (No. 333-124832) (which we refer to as the “IPO Registration Statement”) | |
| 4.19* | Form of Non-Qualified Stock Option Agreement with Employees (incorporated by reference to Exhibit 4.3 to the Registrant’s Registration Statement on Form S-8 filed on October 23, 2009 (Reg. No. 333-162653)) | |
| 4.20* | Form of Non-Qualified Stock Option Agreement with Non-Employee Directors (incorporated by reference to Exhibit 10.51 to the IPO Registration Statement) | |
| 4.21* | Form of Non-Qualified Stock Option Agreement between HLTH and Employees for Grants Under HLTH’s 2000 Long-Term Incentive Plan (incorporated by reference to Exhibit 10.58 to HLTH’s Annual Report on Form 10-K for the year ended December 31, 2005)(1) | |
| 4.22* | Form of Non-Qualified Stock Option Agreement between HLTH and Employees for Grants Under HLTH’s 1996 Stock Plan (incorporated by reference to Exhibit 10.59 to HLTH’s Annual Report on Form 10-K for the year ended December 31, 2005)(1) | |
| 10.1 | Form of Indemnification Agreement between HLTH and each of its directors and executive officers (incorporated by reference to Exhibit 10.1 to HLTH’s Quarterly Report on Form 10-Q for the quarter ended June 30, 2002)(1) | |
| 10.2 | Form of Indemnification Agreement between the Registrant and its directors and executive officers (incorporated by reference to Exhibit 10.9 to the IPO Registration Statement) | |
| 10.3 | Form of Letter Agreement between the Registrant and Certain Non-Employee Directors (incorporated by reference to Exhibit 10.3 to the Registrant’s Annual Report on Form 10-K for the year ended December 31, 2012 (the “2012 Form 10-K”) | |
| 10.4* | Amended and Restated Employment Agreement, dated as of August 3, 2005 between HLTH and Martin J. Wygod (incorporated by reference to Exhibit 10.1 to HLTH’s Current Report on Form 8-K filed on August 5, 2005)(1) | |
| 10.5* | Letter Agreement, dated as of February 1, 2006, between HLTH and Martin J. Wygod (incorporated by reference to Exhibit 10.3 to HLTH’s Current Report on Form 8-K filed on February 2, 2006)(1) | |
| 10.6* | Employment Agreement, dated September 23, 2004, between HLTH and Kevin Cameron (incorporated by reference to Exhibit 10.1 to HLTH’s Current Report on Form 8-K filed September 28, 2004)(1) | |
| 10.7* | Letter Agreement, dated as of February 1, 2006, between HLTH and Kevin M. Cameron (incorporated by reference to Exhibit 10.2 to HLTH’s Current Report on Form 8-K filed on February 2, 2006)(1) | |
| 10.8* | Employment Agreement between WebMD Health Holdings, Inc. and Douglas W. Wamsley (incorporated by reference to Exhibit 10.15 to the IPO Registration Statement) | |
E-2
Table of Contents
Index to Financial Statements
| Exhibit No. |
Description | |
| 10.9* | Employment Agreement between WebMD Health Holdings, Inc. and Steven Zatz, M.D. (incorporated by reference to Exhibit 10.17 to the IPO Registration Statement) | |
| 10.10* | Amendment No. 2, dated as of December 1, 2008, between HLTH and Martin J. Wygod (incorporated by reference to Exhibit 10.1 to HLTH’s Current Report on Form 8-K filed on December 5, 2008)(1) | |
| 10.11* | Letter Agreement, dated December 29, 2008, between HLTH and Martin J. Wygod (incorporated by reference to Exhibit 10.52 to HLTH’s Annual Report on Form 10-K for the year ended December 31, 2008)(1) | |
| 10.12* | Amendment to Employment Agreement, dated as of December 16, 2008, between HLTH and Kevin M. Cameron (incorporated by reference to Exhibit 10.53 to HLTH’s Annual Report on Form 10-K for the year ended December 31, 2008)(1) | |
| 10.13* | Letter Amendment, dated as of July 9, 2009, among HLTH Corporation, WebMD Health Corp. and Martin J. Wygod (incorporated by reference to Exhibit 10.1 to the Current Report on Form 8-K filed by the Registrant on July 14, 2009) | |
| 10.14* | WebMD, LLC Supplemental Bonus Program Trust Agreement (incorporated by reference to Exhibit 10.48 to Amendment No. 1, filed on April 29, 2008, to the Registrant’s Annual Report on Form 10-K for the year ended December 31, 2007)(2) | |
| 10.15* | Amendment No. 1, dated as of March 30, 2009, to the WebMD Supplemental Bonus Program Trust Agreement (incorporated by reference to Exhibit 10.58 to Amendment No. 1, filed on April 30, 2009, to the Registrant’s Annual Report on Form 10-K for the year ended December 31, 2008) | |
| 10.16* | Letter Amendment, dated as of November 3, 2009, between the Registrant and Kevin M. Cameron (incorporated by reference to Exhibit 10.72 to the Registrant’s Annual Report on Form 10-K for the year ended December 31, 2009 (the “2009 Form 10-K”)) | |
| 10.17* | Letter Amendment, dated as of December 14, 2008, between the Registrant and Steven Zatz, M.D. (incorporated by reference to Exhibit 10.74 to Amendment No. 1, filed April 30, 2010, to the 2009 Form 10-K) | |
| 10.18* | Letter Agreement, dated as of June 28, 2010, between the Registrant and Kevin Cameron (incorporated by reference to Exhibit 10.2 to the Registrant’s Quarterly Report on Form 10-Q filed on August 9, 2010) | |
| 10.19* | Letter Amendment, dated as of July 23, 2011, between the Registrant and Steven Zatz, M.D. (incorporated by reference to Exhibit 10.1 to the Registrant’s Quarterly Report on Form 10-Q filed on November 9, 2011) | |
| 10.20* | Letter Agreement, dated as of September 25, 2011, between the Registrant and Kevin Cameron (incorporated by reference to Exhibit 10.5 to the Registrant’s Quarterly Report on Form 10-Q filed on November 9, 2011) | |
| 10.21* | Letter Agreement, dated as of September 25, 2011, between the Registrant and Martin J. Wygod (incorporated by reference to Exhibit 10.6 to the Registrant’s Quarterly Report on Form 10-Q filed on November 9, 2011) | |
| 10.22* | Letter Amendment, dated as of September 21, 2011, between the Registrant and Martin J. Wygod (incorporated by reference to Exhibit 10.7 to the Registrant’s Quarterly Report on Form 10-Q filed on November 9, 2011) | |
E-3
Table of Contents
Index to Financial Statements
| Exhibit No. |
Description | |
| 10.23* | Form of Agreement to Forfeit Non-Qualified Options, dated as of February 23, 2012, between the Registrant and Each of its Non-Employee Directors (incorporated by reference to Exhibit 10.1 to the Registrant’s Current Report on Form 8-K filed on February 29, 2012) | |
| 10.24* | Form of Agreement to Forfeit Non-Qualified Options, dated as of February 23, 2012, between the Registrant and Certain Employees (incorporated by reference to Exhibit 10.2 to the Registrant’s Current Report on Form 8-K filed on February 29, 2012) | |
| 10.25* | Amendment No. 2, dated as of January 9, 2012, to the WebMD Supplemental Bonus Program Trust Agreement (incorporated by reference to Exhibit 10.80 to the Registrant’s Annual Report on Form 10-K for the year ended December 31, 2013 (the “2013 Form 10-K”) | |
| 10.26* | Amendment No. 3, dated as of February 25, 2013, to the WebMD Supplemental Bonus Program Trust Agreement (incorporated by reference to Exhibit 10.81 to the 2013 Form 10-K) | |
| 10.27* | Amendment No. 4, dated as of February 25, 2014, to the WebMD Supplemental Bonus Program Trust Agreement (incorporated by reference to Exhibit 10.82 to Amendment No. 1, filed April 29, 2014, to the 2013 Form 10-K) | |
| 10.28* | Amendment No. 5, dated as of February 26, 2015, to the WebMD Supplemental Bonus Program Trust Agreement (incorporated by reference to Exhibit 10.55 to Amendment No. 1, filed April 29, 2015, to the Registrant’s Annual Report on Form 10-K for the year ended December 31, 2014 (the “2014 Form 10-K”)) | |
| 10.29* | Letter Agreement, dated as of November 14, 2012, between the Registrant and Steven Zatz, M.D. (incorporated by reference to Exhibit 10.70 to the 2012 Form 10-K) | |
| 10.30* | Letter Agreement, dated as of November 14, 2012, between the Registrant and Douglas Wamsley (incorporated by reference to Exhibit 10.71 to the 2012 Form 10-K) | |
| 10.31* | Letter Amendment, dated as of March 5, 2013, between the Registrant and Steven Zatz, M.D. (incorporated by reference to Exhibit 10.74 to Amendment No. 1, filed April 30, 2013, to the 2012 Form 10-K) | |
| 10.32* | Letter Amendment, dated as of May 7, 2013, between the Registrant and David Schlanger (incorporated by reference to Exhibit 10.1 to the Registrant’s Quarterly Report on Form 10-Q filed on August 9, 2013) | |
| 10.33* | Letter Amendment, dated as of May 7, 2013, between the Registrant and Peter Anevski (incorporated by reference to Exhibit 10.2 to the Registrant’s Quarterly Report on Form 10-Q filed on August 9, 2013) | |
| 10.34* | Letter Amendment, dated as of May 8, 2013, between the Registrant and Martin J. Wygod (incorporated by reference to Exhibit 10.4 to the Registrant’s Quarterly Report on Form 10-Q filed on August 9, 2013) | |
| 10.35* | Amendment, dated as of August 11, 2013, to the Employment Agreement between the Registrant and David J. Schlanger (incorporated by reference to Exhibit 10.1 to the Registrant’s Current Report on Form 8-K filed on August 15, 2013) | |
| 10.36* | Amendment, dated as of August 11, 2013, to the Employment Agreement between the Registrant and Steven L. Zatz, M.D. (incorporated by reference to Exhibit 10.2 to the Registrant’s Current Report on Form 8-K filed on August 15, 2013) | |
| 10.37* | Letter Agreement, dated as of March 25, 2015, between the Registrant and David Schlanger (incorporated by reference to Exhibit 10.56 to Amendment No. 1, filed April 29, 2015, to the Registrant’s 2014 Form 10-K) | |
E-4
Table of Contents
Index to Financial Statements
| Exhibit No. |
Description | |
| 10.38* | Letter Agreement, dated as of March 25, 2015, between the Registrant and Peter Anevski (incorporated by reference to Exhibit 10.57 to Amendment No. 1, filed April 29, 2015, to the Registrant’s 2014 Form 10-K) | |
| 10.39* | Letter Agreement, dated as of March 25, 2015, between the Registrant and Michael B. Glick (incorporated by reference to Exhibit 10.58 to Amendment No. 1, filed April 29, 2015, to the Registrant’s 2014 Form 10-K) | |
| 10.40* | Letter Agreement, dated as of March 25, 2015, between the Registrant and Douglas W. Wamsley (incorporated by reference to Exhibit 10.59 to Amendment No. 1, filed April 29, 2015, to the Registrant’s 2014 Form 10-K) | |
| 10.41* | Letter Agreement, dated as of March 25, 2015, between the Registrant and Steven Zatz, M.D (incorporated by reference to Exhibit 10.60 to Amendment No. 1, filed April 29, 2015, to the Registrant’s 2014 Form 10-K) | |
| 10.42* | Letter Amendment, dated as of December 14, 2008, between the Registrant and Douglas W. Wamsley (incorporated by reference to Exhibit 10.61 to Amendment No. 1, filed April 29, 2015, to the Registrant’s 2014 Form 10-K) | |
| 10.43* | Letter Amendment, dated as of July 23, 2011, between the Registrant and Douglas W. Wamsley (incorporated by reference to Exhibit 10.62 to Amendment No. 1, filed April 29, 2015, to the Registrant’s 2014 Form 10-K) | |
| 10.44* | Letter Amendment, dated as of March 5, 2013, between the Registrant and Douglas W. Wamsley (incorporated by reference to Exhibit 10.63 to Amendment No. 1, filed April 29, 2015, to the Registrant’s 2014 Form 10-K) | |
| 10.45* | Letter Agreement, dated as of February 11, 2011, between the Registrant and Michael B. Glick (incorporated by reference to Exhibit 10.64 to Amendment No. 1, filed April 29, 2015, to the Registrant’s 2014 Form 10-K) | |
| 10.46* | Letter Agreement, dated as of November 14, 2012, between the Registrant and Michael B. Glick (incorporated by reference to Exhibit 10.65 to Amendment No. 1, filed April 29, 2015, to the Registrant’s 2014 Form 10-K) | |
| 10.47* | Letter Amendment, dated as of March 5, 2013, between the Registrant and Michael B. Glick (incorporated by reference to Exhibit 10.66 to Amendment No. 1, filed April 29, 2015, to the Registrant’s 2014 Form 10-K) | |
| 14.1 | Code of Business Conduct | |
| 21.1 | Subsidiaries of the Registrant | |
| 23.1 | Consent of Ernst & Young LLP, Independent Registered Public Accounting Firm | |
| 31.1 | Rule 13a-14(a)/15d-14(a) Certification of Chief Executive Officer of the Registrant | |
| 31.2 | Rule 13a-14(a)/15d-14(a) Certification of Chief Financial Officer of the Registrant | |
| 32.1 | Section 1350 Certification of Chief Executive Officer of the Registrant | |
| 32.2 | Section 1350 Certification of Chief Financial Officer of the Registrant | |
| 99.1 | Explanation of Non-GAAP Measures | |
| 99.2 | Audit Committee Charter | |
| 99.3 | Compensation Committee Charter (incorporated by reference to Exhibit 99.3 to the 2013 Form 10-K) | |
E-5
Table of Contents
Index to Financial Statements
| Exhibit No. |
Description | |
| 99.4 | Nominating & Governance Committee Charter (incorporated by reference to Exhibit 99.4 to the 2014 Form 10-K) | |
| 101.INS | XBRL Instance Document | |
| 101.SCH | XBRL Taxonomy Extension Schema Document | |
| 101.CAL | XBRL Taxonomy Extension Calculation Linkbase Document | |
| 101.DEF | XBRL Taxonomy Extension Definition Linkbase Document | |
| 101.LAB | XBRL Taxonomy Extension Label Linkbase Document | |
| 101.PRE | XBRL Taxonomy Extension Presentation Linkbase Document | |
| * | Agreement relates to executive compensation. |
| (1) | This Exhibit is filed under Commission File No. 000-24975. |
| (2) | This Exhibit is filed under Commission File No. 000-51547. |
E-6