Attached files
| file | filename |
|---|---|
| EX-99.1 - EXHIBIT 99.1 - OCWEN FINANCIAL CORP | ex99_1.htm |
| EX-99.2 - OCWEN FINANCIAL CORP | ex99_2.htm |
| 8-K - FORM 8-K - OCWEN FINANCIAL CORP | ocn_8k.htm |
Exhibit 99.3

Investor Presentation February 29, 2016 ©2016 Ocwen Financial Corporation. All rights reserved.

FORWARD-LOOKING STATEMENTS: Our presentation contains certain forward-looking statements as defined under the federal securities laws such as our statements relating to our expectations and strategies for growth, including through our new business lines, and our statements relating to anticipated cost containment efforts. These forward-looking statements may be identified by a reference to a future period or by the use of forward-looking terminology, and include pro forma financial information presented solely for illustrative purposes. Forward-looking statements by their nature address matters that are, to different degrees, uncertain. Our business has been undergoing substantial change which has magnified such uncertainties. Readers should bear these factors in mind when considering such statements and should not place undue reliance on such statements. Forward-looking statements involve a number of assumptions, risks and uncertainties that could cause actual results to differ materially. In the past, actual results have differed from those suggested by forward looking statements and this may happen again. Important factors that could cause actual results to differ materially from those suggested by the forward-looking statements include, but are not limited to, the following: our servicer and credit ratings as well as other actions from various rating agencies, including the impact of downgrades of our servicer and credit ratings; adverse effects on our business as a result of regulatory settlements; reactions to the announcement of such settlements by key counterparties; increased regulatory scrutiny and media attention; uncertainty related to claims, litigation and investigations brought by government agencies and private parties regarding our servicing, foreclosure, modification and other practices; any adverse developments in existing legal proceedings or the initiation of new legal proceedings; our ability to effectively manage our regulatory and contractual compliance; the adequacy of our financial resources, including our sources of liquidity and ability to sell, fund and recover advances, repay borrowings and comply with our debt agreements, including the financial and other covenants contained in them; volatility in our stock price; the characteristics of our servicing portfolio, including prepayment speeds along with delinquency and advance rates; our ability to contain and reduce our operating costs, including our ability to successfully execute on our cost improvement initiative; our ability to successfully modify delinquent loans, manage foreclosures and sell foreclosed properties; uncertainty related to legislation, regulations, regulatory agency actions, government programs and policies, industry initiatives and evolving best servicing practices; as well as other risks detailed in Ocwen s reports and filings with the SEC, including its annual report on Form 10-K for the year ended December 31, 2015. Anyone wishing to understand Ocwen s business should review its SEC filings. Ocwen s forward-looking statements speak only as of the date they are made and we disclaim any obligation to update or revise forward-looking statements whether as a result of new information, future events or otherwise. Information contained in this presentation that reflects assumptions as to facts or circumstances may or may not reflect current or future facts or circumstances and may simplify certain variable or otherwise complex outcomes for purposes of presenting such information. Such information is presented solely for illustrative purposes and readers should not place undue reliance on information reflecting such assumptions. Ocwen may post information that is important to investors on its website. NON-GAAP FINANCIAL MEASURES: Our presentation contains certain non-GAAP financial measures, such as our references to adjusted operating expense, normalized adjusted cash flow from operations, available liquidity and the economic value to Ocwen of our MSRs. We believe these non-GAAP financial measures provide a useful supplement to discussions and analysis of our financial condition. We believe these non-GAAP financial measures provide an alternative way to view certain aspects of our business that is instructive. Non-GAAP financial measures should be viewed in addition to, and not as an alternative for, Ocwen’s reported results under accounting principles generally accepted in the United States. Other companies may use non-GAAP financial measures with the same or similar titles that are calculated differently to our non-GAAP financial measures. As a result, comparability may be limited. Further information may be found on Ocwen’s website. Ocwen Financial Corporation? 2

Agenda Executive Summary Q4 and Total Year 2015 Results Ocwen Strategy Appendix Ocwen Financial Corporation? 3
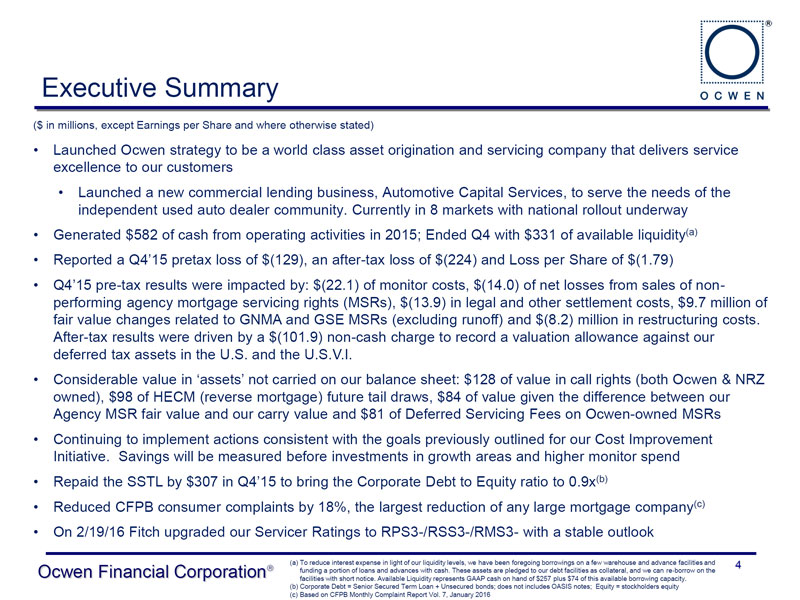
Executive Summary ($ in millions, except Earnings per Share and where otherwise stated) Launched Ocwen strategy to be a world class asset origination and servicing company that delivers service excellence to our customers Launched a new commercial lending business, Automotive Capital Services, to serve the needs of the independent used auto dealer community. Currently in 8 markets with national rollout underway Generated $582 of cash from operating activities in 2015; Ended Q4 with $331 of available liquidity(a) Reported a Q4 15 pretax loss of $(129), an after-tax loss of $(224) and Loss per Share of $(1.79) Q4 15 pre-tax results were impacted by: $(22.1) of monitor costs, $(14.0) of net losses from sales of non-performing agency mortgage servicing rights (MSRs), $(13.9) in legal and other settlement costs, $9.7 million of fair value changes related to GNMA and GSE MSRs (excluding runoff) and $(8.2) million in restructuring costs. After-tax results were driven by a $(101.9) non-cash charge to record a valuation allowance against our deferred tax assets in the U.S. and the U.S.V.I. Considerable value in assets not carried on our balance sheet: $128 of value in call rights (both Ocwen & NRZ owned), $98 of HECM (reverse mortgage) future tail draws, $84 of value given the difference between our Agency MSR fair value and our carry value and $81 of Deferred Servicing Fees on Ocwen-owned MSRs Continuing to implement actions consistent with the goals previously outlined for our Cost Improvement Initiative. Savings will be measured before investments in growth areas and higher monitor spend Repaid the SSTL by $307 in Q4 15 to bring the Corporate Debt to Equity ratio to 0.9x(b) Reduced CFPB consumer complaints by 18%, the largest reduction of any large mortgage company(c) On 2/19/16 Fitch upgraded our Servicer Ratings to RPS3-/RSS3-/RMS3- with a stable outlook (a) To reduce interest expense in light of our liquidity levels, we have been foregoing borrowings on a few warehouse and advance facilities and 4 Ocwen Financial Corporation? funding a portion of loans and advances with cash. These assets are pledged to our debt facilities as collateral, and we can re-borrow on the facilities with short notice. Available Liquidity represents GAAP cash on hand of $257 plus $74 of this available borrowing capacity. (b) Corporate Debt = Senior Secured Term Loan + Unsecured bonds; does not includes OASIS notes; Equity = stockholders equity (c) Based on CFPB Monthly Complaint Report Vol. 7, January 2016

Servicing performance(a) In October, 2015, the National Housing Resource Center (NHRC) conducted a national survey of 200 housing counselors, as well as a small number of legal services lawyers who work with homeowners who are in foreclosure, to ask how well mortgage servicers were complying with the CFPB servicing rules Ocwen ranked #4 of 11 top servicers, including #1 among the large non-bank servicers Ocwen Financial Corporation? (a) As defined by the NHRC 2016 Survey Report, published on 2/19/16 5

Q4 and Total Year 2015 Results Ocwen Financial Corporation? 6

Q4 2015 Reported Financial Results ($ in millions except loss per share) Key Results Q4 15 Q3 15 VPQ$ Servicing revenue down 8% driven by MSR sales and Revenues $362 405 (42) runoff; Lending revenue down 39% primarily due to ??Servicing 344 375 (31) lower lock volumes ??Lending 18 30 (12) $28 lower expenses vs. Q3 15 driven by: - $38 favorable MSR amortization and FV changes, $9 Operating expenses (360) (388) (28) lower other expenses and $23 of non-repeat Q3 15 expenses partially offset by $22 higher Servicing Other Income / (Expense) (132) (73) (59) expenses, $11 higher legal expenses & $10 higher monitor expenses Closed Agency MSR sales on $1B UPB of non- Reported Pre-Tax Loss $(129) $(56) (73) performing agency loans and recorded a $(14) loss Other Expenses $(59) higher driven by Net Loss $(224) $(67) (157) - $(55) lower gain on sold MSR s and $(10) higher SSTL amortization partially offset by $6 lower SSTL Diluted Loss per Share (1.79) (0.53) (1.26) interest expense Operating Cash Flow (192) 239 (431) Net loss includes a $(102) deferred tax asset valuation allowance Normalized Adjusted 28 100 (73) Delivered $28 of Normalized Adjusted Operating Cash Operating Cash Flow(b) Flow despite $(224) net loss(b) Ocwen Financial Corporation? Note: “VPQ$” = Dollar variance versus prior quarter 7 (a) All variances are versus Q3 15 (b) Detailed calculation for Normalized adjusted Operating Cash Flow on slide 25

Q4 2015 Reported Segment Results ($ in millions, except where otherwise stated) Servicing Lending Q4 15 Q3 15 VPQ%(a) Q4 15 Q3 15 VPQ%(a) Revenues $344 $375 (8)% Revenues $18 $30 (39)% ??Servicing / Sub-servicing 255 289 (12) ??Gain on loans held for sale 12 23 (49) ??HAMP/Late/Other fees 74 71 4 ??Other revenue 6 7 (6) ??Gains / Other 16 15 3 Operating expenses (24) (23) 5 Operating expenses (281) (318) (12) Other Income / (Expense) 1 2 (47) Other Income / (Expense) (126) (69) 82 Pre-tax Income $(5) $9 U Pre-tax Loss $(63) $(13) U Drivers: Drivers: (8)% decline in revenue due to asset sales, transfers Portfolio recapture rates declined versus Q3 15 in retail and portfolio runoff and broker channels $37 lower operating expense driven by $31 favorable Reverse channel volumes have yet to recover from change in the GNMA MSR impairment quarter to industry-wide Financial Assessment underwriting quarter changes; margin rates also down from Q3 15 $57 or (82)% higher other expense driven by losses on Continued to invest in Retail channel and technology non-performing MSR asset sales in Q4 compared to platform build-out gains on performing MSR asset sales in Q3 ? 8 Ocwen Financial Corporation Note: “VPQ%” = Variance % versus Prior Quarter (a) All variances are versus Q3 15. Variances more significant than -100% represented as “U”
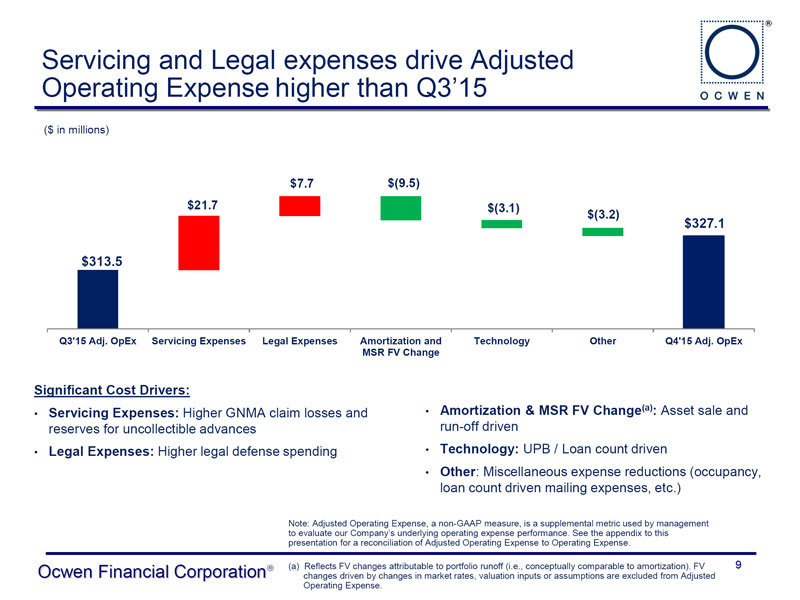
Servicing and Legal expenses drive Adjusted Operating Expense higher than Q3 15 ($ in millions) $7.7 $(9.5) $21.7 $(3.1) $(3.2) $327.1 $313.5 Q3’15 Adj. OpEx Servicing Expenses Legal Expenses Amortization and Technology Other Q4’15 Adj. OpEx MSR FV Change Significant Cost Drivers: Servicing Expenses: Higher GNMA claim losses and Amortization & MSR FV Change(a): Asset sale and reserves for uncollectible advances run-off driven Legal Expenses: Higher legal defense spending Technology: UPB / Loan count driven Other: Miscellaneous expense reductions (occupancy, loan count driven mailing expenses, etc.) Note: Adjusted Operating Expense, a non-GAAP measure, is a supplemental metric used by management to evaluate our Company s underlying operating expense performance. See the appendix to this presentation for a reconciliation of Adjusted Operating Expense to Operating Expense. Ocwen Financial Corporation? (a) Reflects FV changes attributable to portfolio runoff (i.e., conceptually comparable to amortization). FV 9 changes driven by changes in market rates, valuation inputs or assumptions are excluded from Adjusted Operating Expense.

Leverage & Liquidity Update ($ in millions, except where otherwise stated) SSTL as of 12/31/15 Liquidity and Financing Update Average Available Liquidity(b) of $377 in the fourth quarter 2015, with $331 of Available Liquidity at the end of the quarter OMART private label servicing advance facility refinancing closed in September, 2015; issued $500 1-year term notes, $400 of 2 year term notes and $600 of 1 year variable funding notes, all rated by Standard & Poor s Successfully refinanced all Originations warehouse lines into 2016, and we believe we will be able to renew them upon maturity 1.6x 1.0x 0.9x Corporate Corporate Corporate We expect to seek an amendment to or to Debt/Equity(a) Debt/Equity(a) Debt/Equity(a) refinance our SSTL in Q2 or Q3 of 2016 as our Debt to Tangible Net Worth covenant comes Expect SSTL balance to be ~$380 by the end of under pressure Q2 16, depending on the timing of receipt of trailing (a)Corporate Debt = Senior Secured Term Loan + Unsecured bonds. Does not include OASIS notes. asset sale proceeds (b)To reduce interest expense in light of our liquidity levels, we have been foregoing borrowings on a few warehouse and advance facilities and funding a portion of loans and advances with cash. These assets are pledged to our debt facilities as collateral, and we can re-borrow on the facilities with short notice. Available Liquidity represents GAAP cash on hand plus this available borrowing capacity. Average cash in Q4 = $231 ? 10 Ocwen Financial Corporation Credit ratings are not a recommendation to buy, sell or hold any security and are subject to change

2015 Financial Results ($ millions except EPS) FY 15 FY 14 V$(a) Pre-tax Loss Walk vs. Prior Year Revenues $1,741 $2,111 (370) ??Servicing 1,614 1,985 (372) FY 14 Pre-tax Income: $(443) ??Lending 125 119 6 Goodwill Impairment (2014) 420 NY DFS Settlement (2014) 150 Operating expenses (1,478) (2,035) (557) NRZ Interest Expense 92 Income from Operations 263 76 187 Gain on MSR Sales (2015) 83 MSR Amortization/ FV Change 58 Other Income (expense) (393) (519) 126 Servicer & Bad Debt Expense 48 Servicing Revenue (372) Reported Pre-Tax Loss (130) (443) 313 Legal / Monitor Expenses (45) Servicing 16 (174) 190 GNMA Losses (36) Lending 34 (27) 61 Strategic Advisor Expenses (2015) (25) Corporate (180) (242) 62 NRZ S&P Downgrade-related Payments (2015) (14) Unsecured Bonds Interest Expense (10) Net Loss (247) (470) 223 Fiserv Termination Expense (2015) (10) Backstop / Commitment Letter Expense (2015) (8) Operating Cash Flow 582 353 229 RMBS Trustee Review (2015) / Other (18) Normalized Adj. Cash Flow (b) 254 609 (355) FY 15 Pre-tax Income: $(130) ? 11 Ocwen Financial Corporation (a) All variances are dollar variances versus FY 14 (b) Detailed calculation for Normalized Adjusted Operating Cash Flow appears on slide 25
Ocwen Strategy Ocwen Financial Corporation? 12

Corporate Governance Continue to enhance Ocwen s Corporate Governance structures Named Phyllis Caldwell Chairwoman effective 3/15/16 Recently named Carol Galante and Jacques Busquet as new independent directors, in addition to three new independent directors added in 2015 Caldwell Galante Busquet Formed a new Board-level Risk Committee made up of independent directors. The new Risk Committee is in addition to the existing independent Audit and Compliance committees Compliance, Risk(a), Internal Audit and the Internal Review Group all report to Board committees made up of independent directors Maintain a Board-level Independent Review Committee that reviews related party transactions No longer a related party with our largest advance financing partner (formerly HLSS, now NRZ) (a) Also reports to Ocwen s CEO 13 Ocwen Financial Corporation?

Ocwen Vision and Strategy Our vision for Ocwen is to be a world-class asset Vision origination and servicing company that delivers service excellence to our customers and strong equity returns for our investors Strategic Operational and Service Asset Generation Pillars Excellence Continuous Cost “Our Culture(a)” Improvement Capital Compliance Employee Inclusion & Global Foundational Allocation Culture Engagement Diversity Workforce Keys Customer Technology Corporate LEAN Six Risk Experience Excellence Development Sigma Management ? 14 Ocwen Financial Corporation (a) Culture of Compliance, Risk Management, Ethics and Service Excellence

Asset Generation Strategy We intend to grow by originating, servicing and refinancing select consumer and commercial loans where Ocwen has a competitive advantage. We plan to take limited interest rate risk, moderate credit risk and moderate collateral risk. Our goal is to generate profits throughout the asset lifecycle. Loan Origination Servicing & Other Opportunities Consumer Loans Servicing FHA & Agency Conforming Mortgage Loans Selective MSR acquisitions if we obtain NY HECM / Reverse Mortgages DFS and CA DBO approvals Portfolio refinance & retail originations Call right transactions Non-Agency Mortgage Loans Explore subservicing opportunities based on developing comprehensive compliance and Others TBD risk management infrastructure Commercial Loans Other Auto Floor Plan Select insurance products REO Rental Finance Other Small Commercial Ocwen Financial Corporation? 15

Mortgage Originations Growth Strategy ??Ocwen currently a ~$5B / year originator ??Aspire to be “Top-10”, but prioritizing profitable growth that includes underserved markets ??Focus on maximizing each channel supported by initiatives Retail ($1 $5B) Wholesale ($1 $5B) Correspondent ($TBD) Reverse ($1 $2B) Retention Plus Geographic Expansion Selective Player at Right Scale Back Up to #1 External Leads Margin Share #1 Product Differentiated including FHA and potential non-agency #2 Systems Single integrated proprietary system Already Landed: ??Great Service #3 Process Lean Six Sigma Operations Approach ??Portfolio Retention ??Expanded #4 Retail 3x call center expansion Distribution #5 Engagement Energized teams and consumers Ocwen Financial Corporation? 16

Ocwen Well Positioned to Reach “Underserved” Unmet Need Segments Originations Market for Qualified Mortgages #1 Customers are creditworthy and kept QM away by other factors (Language, trust, etc.) Agency #2 Customers who “perceive they don t qualify h and don t attempt to access credit FHA #3 Customers are creditworthy but don t VA qualify for conforming credit products We believe Ocwen s experience with over 2.5 We re finding many customers that fit into FHA million non-prime historical customers is a programs so we expect to grow origination competitive advantage volume in this higher-margin product - Data on how to reach these customers We believe we can make these loans perform effectively above average - Ability to look beyond FICO for high quality - Proven Ocwen ability to keep more people in customers their homes(a) We can rapidly run pilots to refine the non- - If successful, results in better returns for agency product parameters originator (i.e. Ocwen) and mortgage loan investors ? 17 Ocwen Financial Corporation (a) As defined by 66% Ocwen mods outstanding v. 59% non-Ocwen loan modifications outstanding per BlackBox Logic Subprime non-agency securities data; Jan 1, 2016

Automotive Capital Services Launched www.autocapservices.com Ocwen Financial Corporation? 18

Automotive Capital Services Milestones Market Opportunity Business formed in 2015 under the leadership of Tom Gilman, a 30+ year leader in 18,000 ~$9B+ automotive finance (TD Bank, Chrysler Financial) Created team of automotive industry experts with ~200 years of collective experience Identified market opportunity to provide floor plan financing to independent used auto dealerships while helping dealers improve operations, optimize cash flows and maximize Independent Used Annual Financing profitability Auto Dealers Opportunity Pilot program launched in August, 2015 Large, highly fragmented market First funding on September 17, 2015 Top 2 competitors average ~$1.3B in annual Began national roll-out in December, 2015 volumes representing ~25% market share As of February 25, 2016: open in 8 markets across 5 states with $19 million of credit Sources: National Independent Automotive Dealers Association, KAR Auction extended Services, Inc. SEC filings, internal market analysis and estimates based on publically available information Ocwen Financial Corporation? 19

Automotive Capital Services Business Launch Why we like this business Growth Aspiration ??Seasoned leadership team with significant 2/25/16 12/31/18 ($ in millions) domain expertise ??Business to business focus Active Dealers (#) 22 3,600 ??Provides value to dealers with a differentiated lending alternative Total Markets (#) 8 55 ??Large, highly fragmented market Headcount (#) 27 140 ??New car trends indicate robust used auto market for next three to five years Total Credit Approved ($) $19 $1,500 ??Collateralized lending with assets relatively easy to value Amount Outstanding(a)($) $8 $1,000 ??Short duration reduces exposure to interest rate volatility Securitizations / year (#) - 2 - 4 ??We believe it s scalable without large capital Deployed Equity ($) $6 $250 or resource investment ??Financeable asset-class with past capital Return on Equity (%) 0% 25%+ markets execution by other players ??Anticipated financial returns ? 20 Ocwen Financial Corporation (a) $12 million of funds advanced to customers, $4 million paid off, $8 million currently outstanding

Cost Improvement Initiative From September 2015 Presentation: February 2016 Update: Significant progress made on cost improvement efforts, but more work needed to return to profitability Currently project the Servicing + Corporate segment(a) cost reductions to be within the September 2015 implied range for savings in 2016 Adding costs in Lending to build scale and grow the business; new spending will be moderated if growth doesn t materialize Projected cost savings exclude interest-rate driven MSR valuation changes Exploring ways to drive significant additional cost savings to improve financial performance Implied Range: $238 - $368 savings in 16 ? 21 Ocwen Financial Corporation (a) Excluding investments in ACS, increases in monitor costs and other new business initiatives

Shareholder Relations Information Ocwen Financial Corporation is a financial services holding company which, through its subsidiaries, originates and services loans. We are headquartered in West Palm Beach, Exchange New York Stock Exchange (NYSE) Florida, with offices throughout the United States and in the U.S. Virgin Islands and About Ocwen Ticker OCN operations in India and the Philippines. We have been serving our customers since Headquarters West Palm Beach, FL 1988. We may post information that is important to investors on our website (www.Ocwen.com). Contact Information All Shareholder Relations inquiries should be Employees Approximately 10,400 sent to: shareholderrelations@ocwen.com Ocwen Financial Corporation? 22

Appendix Ocwen Financial Corporation? 23

Debt Facilities Overview (balances as of 12/31/15) ($ in millions, except where otherwise stated) Debt Available Weighted Average Weighted Average Balance Facility Cap Credit Advance Rate Interest Rate Maturity Comments Advance Facilities 9/19/2016 3.09% for term Notes; 2016 maturity for $1,100 of notes, 2017 maturity OMART $ 1,393 $ 1,500 $ - 88.5% 11/15/2016 1 L + 2.84% for VFN for $400 11/15/2017 OFAF 139 150 7 88.0% 1 L + 2.39% for VFN 6/10/2016 2016 maturity OSART III 51 75 18 74.3% CoF + 3.31% 12/19/2016 2016 maturity EBO (Counterparty 1) 44 44 - 79.0% 1L + 4.5% N/A N/A EBO (Counterparty 2) 16 16 - 87.0% 1L + 5.5% N/A N/A Subtotal - Advance Facilities 1,644 1,785 24 Warehouse Lines OLS - Lender 1 73 150 - 100.0% WAC 4/30/2016 2016 maturity OLS - Lender 2 43 100 7 89.9% 1L + 2.00% to 3.45% 9/29/2016 2016 maturity HRI - Lender 3 156 200 34 94.5% 1L + 2.00% 8/23/2016 2016 maturity HRI - Lender 4 50 100 8 100.0% WAC 4/30/2016 2016 maturity Liberty - Lender 5 63 100 - 99.0% 1L + 2.75% 5/27/2016 2016 maturity Subtotal - Warehouse Lines 385 650 50 Structured Transactions OASIS 97 97 N/A N/A N/A 2/28/2028 Subtotal - Structured Transactions 97 97 - Corporate Debt SSTL 398 398 N/A N/A 1L (with a floor at 2/15/2018 Interest rate excludes impact of fee amortization 1.25%) + 4.25% 6.625% Sr Notes 350 350 N/A N/A 6.6% 5/15/2019 Interest rate excludes impact of fee amortization Subtotal - Corporate Debt 748 748 Total $ 2,874 $ 3,280 Available Credit represents loans and advances that are eligible to be financed but are currently being funded with cash WAC = Weighted Average Coupon on underlying mortgage loans Ocwen Financial Corporation? 24

Consolidated Statement of Cash Flows: Adjusted Cash Flow from Operations Calculation ($ in millions) Q3 2014 Q4 2014 Q1 2015 Q2 2015 Q3 2015 Q4 2015 Cash Provided by Operating Activities (A) $349 $(206) $325 $210 $239 $(192) Decrease in Advances and Match Funded Advances (B) 113 55 104 279 109$40 Funding Efficiency (C) 61% 63% 63% 64% 61%72% Reduction of match funded liabilities (D=B*C) 69 35 66 178 6629 Adjusted Cash Flow from Operations (A-D) 280 (241) 259 32 173(221) Payment for NMS/DFS Settlement (E) 150 Loans Held for Sale Adjustments (F) (58) 115 (62) (51) 8116 Impact of HLSS/NRZ settlement timing (G)(1) (98) 98 FHLMC advances reimbursement (H)(2) (80)80 Q4 reclass (move from Investing usage to Operating usage) (I)(3) (53) 53 Normalized Adjusted Cash Flow from Operations (A-D) + (E) + (F) + (G) + (H) + (I) $222 $24 $100 $25 $100 $28 (1) Adjustment reflects timing impact of the normal monthly HLSS/NRZ settlement payments. March 2015 payment did not settle until 4/1/15. This adjustment normalizes that impact as if the settlement occurred in Q1 2015 as anticipated. The Company does not expect this to be an adjustment in future periods (2) Reimbursement for financing on advances already sold to FHLMC in Q3 15 which was paid back in Q4 15 (3) Reclassification of transaction-related cash usage; previously disclosed as investing cash usage in Q2 15 and adjusted to an operating cash usage in Q4 15 Ocwen Financial Corporation? 25

Adjusted Operating Expense Reconciliation Adjusted Operating Expense, a non-GAAP measure, is a supplemental metric used by management to evaluate our Company s underlying operating expense performance. Adjusted Operating Expense adjusts GAAP operating expense for (1) changes in fair value of our MSRs due to changes in market rates, valuation inputs and other assumptions, (2) expense related to business restructuring items such as severance expenses and lease termination costs, (3) legal, regulatory or counterparty settlement expenses as well as monitoring costs and (4) other expense items, including certain non-recurring costs, that management believes do not reflect the underlying operating expense performance of the Company, consistent with the intent of providing management and investors with a supplemental means of evaluating our operating performance. Set forth below is a reconciliation from GAAP Operating Expense to Adjusted Operating Expense. Q4 15 Q3 15 ($ in millions) Reported Operating Expense (GAAP) $359.8 $387.7 GNMA MSR FV Change 7.7 (23.4) MSR FV Change (Agency only)(a) 2.0 (2.0) MSR FV Change (Non-Agency)(a) (2.5) 4.0 Strategic Advisors (0.3) (0.7) Legal and Other settlements (13.9) (6.0) Mortgage Insurance Legacy Settlement - (11.1) MBS Trustee Operations Review Expenses - (5.0) Restructuring costs (Severance/Leases/Plane/Fiserv/Vendors/etc) (8.2) (17.4) MSR Sale Related: Comp Fee Release 13.6 - True-up for historical bank fees, offset in revenue (9.0) - Monitor Costs (22.1) (12.5) Adjusted Operating Expense (Non-GAAP) $327.1 $313.5 Certain components excluded from Adjusted Operating Expense are expected to occur in each period. For example, fair value changes in our MSR portfolio are regularly expected to occur and we may incur settlement expenses in each period. Adjusted Operating Expense should not be considered an alternative to operating expense determined in accordance with GAAP. Adjusted Operating Expense has important limitations as an analytical tool, and should not be considered in isolation or as a substitute for analysis of our results as reported under GAAP. We compensate for these limitations by relying primarily on our GAAP results and using Adjusted Operating Expense only as a supplement. Readers are cautioned not to place undue reliance on Adjusted Operating Expense. Ocwen Financial Corporation? (a) FV changes that are driven by changes in market rates, valuation inputs or assumptions are 26 recorded here

Operating Expense Roll-forward Compensation & Amortization of Servicing & Technology & Professional Occupancy & Other Operating Total ($ in millions) Benefits Servicing Rights Origination Communication Services Equipment Expenses Q3’15 Actual Operating Expenses (GAAP) 102.6 18.1 101.5 37.2 62.4 31.0 34.8 387.7 GNMA MSR FV Change (23.4) (23.4) Mortgage Insurance Legacy Settlement (3.6) (7.5) (11.1) Legal & Other Settlements (2.2) (3.8) (6.0) MBS Trustee Operations Review Expenses (5.0) (5.0) MSR FV Change (Agency only) (a) (2.0) (2.0) MSR FV Change (Non Agency) (a) 4.0 4.0 Restructuring (3.0) (2.1) (2.6) (9.8) (17.4) Strategic Advisors (0.7) (0.7) Monitor Costs (12.5) (12.5) Q3’15 Adjusted Operating Expense 99.7 18.1 76.4 35.1 42.0 28.4 13.7 313.5 Servicing Expenses 21.7 21.7 Legal Expenses 7.7 7.7 Amortization and MSR FV Change (b) (7.1) (2.4) (9.5) Technology (3.1) (3.1) Other (0.2) - - - (1.3) (2.3) 0.6 (3.2) Q4’15 Adjusted Operating Expense 99.5 11.0 95.8 32.0 48.4 26.1 14.3 327.1 Restructuring (2.0) (5.0) (1.2) (8.2) GNMA MSR FV Change 7.7 7.7 MSR FV Change (Agency only) (a) 2.0 2.0 MSR FV Change (Non Agency) (a) (2.5) (2.5) Strategic Advisors (0.3) (0.3) Legal & Other Settlements (13.9) (13.9) MSR Sale Related: Comp Fee Release 13.6 13.6 True-up for historical bank fees, offset in revenue (9.0) (9.0) Monitor Costs (22.1) (22.1) Q4’15 Actual Operating Expenses (GAAP) 101.5 11.0 88.7 37.0 84.7 27.3 9.7 359.8 (a) FV changes that are driven by changes in market rates, valuation inputs or assumptions are recorded here (b) FV changes for portfolio run-off (i.e., conceptually comparable to amortization) are recorded here Ocwen Financial Corporation? 27

Ocwen-only MSR Economics The below chart reflects illustrative geconomich values to Ocwen of the MSRs based upon the 12/31/15 balance sheet. The chart excludes MSRs whose Rights have been sold to NRZ as well as the economics sold off in the OASIS notes ($ in millions) $2,004 NRZ Subservicing reflects $1,330 our estimate of the economic $1,187 value of the NRZ contracts to Ocwen under certain $836 $663 assumptions $552 $244 $667 $817 $552 $592 Ocwen Retained reflects the MSRs whose rights the Company still owns. Book Value Fair Value Internal Updated Assumptions Assumptions Fair Value of the MSRs reflects independent, third-party broker estimates of value using the midpoint estimate of the broker range. Internal Assumptions revises third-party broker estimates of value to reflect existing lower direct servicing costs (i.e.: costs related to directly servicing the loans) and recoverability of Deferred Servicing Fees (DSF). It does not reflect Ocwen’s proven ability to lower delinquencies that would further increase the value of our MSRs Updated Assumptions revises Non-Agency Internal Assumptions components to reflect lower discount rate to 8% from 15% for NonAgency and lower CPR from 18% to 12% for Non-Agency MSRs. No change was made to Agency CPRs NRZ Subservicing Value reflects our estimate of the value to Ocwen of the existing NRZ contracts maintained through the life of the MSR asset. For these purposes it is assumed there will be no future transfer of servicing rights, including due to the existing S&P servicer rating. Additionally it is assumed the Company will be able to extend the existing contracts on the same terms at future maturity dates. Ocwen Financial Corporation? Note: Please refer to rest of the appendix for detailed assumptions. This is not a full valuation of 28 the Company, just an illustration of economic values to Ocwen of the MSRs on the 12/31/15 balance sheet. All values other than “Book Value” are non-GAAP

MSR Valuation Assumptions (a) “OASIS Financed” represents the value attributed to the securitized 21 bp service fee strip, and “OASIS Retained” the left over service fee and other cash flows that remain with Ocwen (b) “OASIS Retained” + “MSRs Retained” = Line 9 on page 30 (c) The ($17mm) difference between GNMA FV and BV is carried as asset impairment at 12/31, favorable to the 9/30 level of ($25mm) due to an increase in market interest rates (d) 3rd party broker assumptions (e) Total voluntary payoffs and involuntary defaults; does not include scheduled payments (f) Annual $ per loan Ocwen Financial Corporation? 29

MSR Valuation Reconciliation ($ in Note: This is not a full valuation of the Company, just an illustration of the implied value of our MSRs adjusting for certain 30 Ocwen Financial Corporation? factors. A full valuation would need to include fixed / overhead costs not captured in the value of the MSR and the value of our lending business, among other factors DSF is Deferred Servicing Fees, which is only recognized in our P&L, when collected

P&L Impact of Fair Value & Amortization Changes ($ in millions) Q3’15 Q4’15 V$ Slide Reference Non-Agency MSR Fair Value Change 0 - Portfolio Run-off $ (26.2) $ (23.9) $ 2.3 Slide 9 via line 7 below - Interest Rate and Other Assumption Changes 4.0 (2.5) (6.5) Slide 26 1 Total Non-Agency MSR Fair Value Change (22.2) (26.4) (4.2) Agency MSR Fair Value Change 2 - Portfolio Run-off (0.6) (0.5) $ 0.1 Slide 9 via line 7 below - Interest Rate and Other Assumption Changes (2.0) 2.0 4.0 Slide 26 3 Total Agency MSR Fair Value Change (Reflected on slide 17) (2.6) 1.5 4.1 Total MSR Fair Value Changes - Portfolio Run-off (26.7) (24.3) $ 2.4 - Interest Rate and Other Assumption Changes 1.9 (0.6) (2.5) 4 Total MSR Fair Value Changes (1 + 3) (24.8) (24.9) (0.1) 5 Fair Value Impact on Carrying Value of GNMA MSRs (LOCOM) (23.4) 7.7 31.2 6 NRZ Liability Fair Value Change (impacts interest expense) 21.2 18.4 (2.8) Income Statement Impact of Fair Value Related Changes (4 + 5 + 6) $ (27.1) $ 1.1 $ 28.2 Additional Reconciliation: Amortization Expense (Agency) (18.1) (11.0) 7.1 MSR Fair Value Change (Portfolio Run-off) (0 + 2) (26.7) (24.3) 2.4 7 Total Amortization and Non-Agency Fair Value Change (44.8) (35.4) 9.5 Slide 9 Ocwen Financial Corporation? 31