Attached files
| file | filename |
|---|---|
| EX-12 - COMPUTATION OF RATIO OF EARNINGS TO FIXED CHARGES - Avanos Medical, Inc. | hyh2015form10kex12.htm |
| EX-21 - SUBSIDIARIES OF THE CORPORATION - Avanos Medical, Inc. | hyh2015form10kex21.htm |
| EX-24 - POWERS OF ATTORNEY - Avanos Medical, Inc. | hyh2015form10kex24.htm |
| EX-31.B - CERTIFICATION OF CFO REQUIRED BY RULE 13A-14(A) OR RULE 15D-14(A) - Avanos Medical, Inc. | hyh2015form10kex31b.htm |
| EX-32.B - CERTIFICATION OF CFO REQUIRED BY RULE 13A-14(B) OR RULE 15D-14(B) - Avanos Medical, Inc. | hyh2015form10kex32b.htm |
| EX-23 - CONSENT OF INDEPENDENT REGISTERED PUBLIC ACCOUNTING FIRM - Avanos Medical, Inc. | hyh2015form10kex23.htm |
| EX-31.A - CERTIFICATION OF CEO REQUIRED BY RULE 13A-14(A) OR RULE 15D-14(A) - Avanos Medical, Inc. | hyh2015form10kex31a.htm |
| EX-32.A - CERTIFICATION OF CEO REQUIRED BY RULE 13A-14(B) OR RULE 15D-14(B) - Avanos Medical, Inc. | hyh2015form10kex32a.htm |
UNITED STATES
SECURITIES AND EXCHANGE COMMISSION
WASHINGTON, D.C. 20549
FORM 10-K
(Mark One) | |
x | Annual Report Pursuant to Section 13 or 15(d) of the Securities Exchange Act of 1934 |
For the fiscal year ended December 31, 2015
OR
o | Transition Report Pursuant to Section 13 OR 15(d) of the Securities Exchange Act of 1934 |
For the transition period from to
Commission file number: 001-36440 |

Halyard Health, Inc.
(Exact name of registrant as specified in its charter)
Delaware | 46-4987888 | |
(State or other jurisdiction of incorporation) | (I.R.S. Employer Identification No.) | |
5405 Windward Parkway Suite 100 South Alpharetta, Georgia | 30004 | |
(Address of principal executive offices) | (Zip Code) | |
Registrant’s telephone number, including area code: (678) 425-9273
Securities registered pursuant to Section 12(b) of the Act:
Common Stock—$0.01 Par Value | New York Stock Exchange | |
(Title of each class) | (Name of each exchange on which registered) | |
Securities registered pursuant to Section 12(g) of the Act: None
Indicate by check mark if the registrant is a well-known seasoned issuer, as defined in Rule 405 of the Securities Act. Yes o No x
Indicate by check mark if the registrant is not required to file reports pursuant to Section 13 or Section 15(d) of the Act. Yes o No x
Indicate by check mark whether the registrant (1) has filed all reports required to be filed by Section 13 or 15(d) of the Securities Exchange Act of 1934 during the preceding 12 months (or for such shorter period that the registrant was required to file such reports), and (2) has been subject to such filing requirements for the past 90 days. Yes x No o
Indicate by check mark whether the registrant has submitted electronically and posted on its corporate website, if any, every Interactive Data File required to be submitted and posted pursuant to Rule 405 of Regulation S-T (§232.405 of this chapter) during the preceding 12 months (or for such shorter period that the registrant was required to submit and post such files). Yes x No o
Indicate by check mark if disclosure of delinquent filers pursuant to Item 405 of Regulation S-K (§229.405 of this chapter) is not contained herein, and will not be contained, to the best of registrant’s knowledge, in definitive proxy or information statements incorporated by reference in Part III of this Form 10-K or any amendment to this Form 10-K. o
Indicate by check mark whether the registrant is a large accelerated filer, an accelerated filer, a non-accelerated filer, or a smaller reporting company. See the definitions of “large accelerated filer,” “accelerated filer” and “smaller reporting company” in Rule 12b-2 of the Exchange Act.
Large accelerated filer x | Accelerated filer o | |
Non-accelerated filer o (Do not check if a smaller reporting company) | Smaller reporting company o | |
Indicate by check mark whether the registrant is a shell company (as defined in Rule 12b-2 of the Act). Yes o No x
The aggregate market value of common stock held by non-affiliates or registrant on June 30, 2015 was $1,886,601,497.
As of February 25, 2016, there were 46,614,947 shares of Halyard Health, Inc. common stock outstanding.
DOCUMENTS INCORPORATED BY REFERENCE
Certain information contained in the definitive Proxy Statement for Halyard’s Annual Meeting of Stockholders to be held on April 28, 2016 is incorporated by reference into Part III.
HALYARD HEALTH, INC.
TABLE OF CONTENTS
Part I | Page | |
Item 1. | ||
Item 1A. | ||
Item 1B. | ||
Item 2. | ||
Item 3. | ||
Item 4. | ||
Part II | ||
Item 5. | ||
Item 6. | ||
Item 7. | ||
Item 7A. | ||
Item 8. | ||
Item 9. | ||
Item 9A. | ||
Item 9B. | ||
Part III | ||
Item 10. | ||
Item 11. | ||
Item 12. | ||
Item 13. | ||
Item 14. | ||
Part IV | ||
Item 15. | ||
PART I
ITEM 1. BUSINESS
Overview
Halyard Health, Inc. is a global company which seeks to advance health and healthcare by preventing infection, eliminating pain and speeding recovery. We have two business segments: Surgical and Infection Prevention (“S&IP”) and Medical Devices. Unless the context indicates otherwise, the terms “Halyard,” “we,” “our” and “us” refer to Halyard Health, Inc. and its consolidated subsidiaries. References to “Kimberly-Clark” mean Kimberly-Clark Corporation, a Delaware corporation, and its subsidiaries.
Our products and solutions are designed to address some of today’s most important healthcare needs; namely, preventing infection and reducing the use of narcotics while helping patients move from surgery to recovery. We sell our products in more than 100 countries. We market and support the efficacy, safety and economic benefit of our products with a significant body of clinical evidence.
On October 31, 2014, Kimberly-Clark distributed all of our capital stock to its shareholders and completed the previously announced spin-off of its healthcare division (the “Spin-off”). Halyard was incorporated as a Delaware corporation in February, 2014 in anticipation of that Spin-off and Kimberly-Clark transferred its Health Care business to us prior to the Spin-off.
The address of our principal executive offices is 5405 Windward Parkway, Suite 100 South, Alpharetta, Georgia 30004, and our telephone number is (678) 425-9273.
Business Segments
We are organized into two operating segments based on product groupings: S&IP and Medical Devices. These operating segments, which are also our reportable global business segments, were determined in accordance with how our executive managers develop and execute global strategies to drive growth and profitability. These strategies include global plans for branding and product positioning, technology, research and development programs, cost reductions including supply chain management, and capacity and capital investments for each of these businesses. Segment management is evaluated on several factors, including operating profit. Segment operating profit excludes general corporate costs and expenses not associated with the business units including charges related to pre-Spin-off transaction, post-Spin-off transition, certain litigation matters, manufacturing footprint changes in Thailand and goodwill impairment.
The principal sources of revenue in each global business segment are described below:
• | S&IP provides healthcare supplies and solutions that target the prevention of healthcare-associated infections. This segment has recognized brands across its portfolio of product offerings, including sterilization wrap, surgical drapes and gowns, facial protection, protective apparel and medical exam gloves. This business is also a global leader in education to prevent healthcare-associated infections. Products in this segment are sold under the HALYARD or KIMGUARD ONE-STEP, QUICK CHECK, SMART-FOLD, POWERGUARD, MICROCOOL, FLUIDSHIELD, PURPLE NITRILE, LAVENDER, STERLING and other brand names. |
• | Medical Devices provides a portfolio of innovative product offerings focused on pain management and respiratory and digestive health to improve patient outcomes and reduce the cost of care. These products include post-operative pain management solutions, minimally invasive interventional (or chronic) pain therapies, closed airway suction systems and enteral feeding tubes. Products in this segment are sold under the ON-Q, COOLIEF, MICROCUFF, MIC-KEY, QUIKBLOC, HOMEPUMP and other brand names. |
For additional information concerning our business segments, please refer to Note 14 to the consolidated and combined financial statements.
Sales and Marketing
We direct our primary sales and marketing efforts toward hospitals and other healthcare providers to highlight the unique benefits and competitive differentiation of our branded products. We work directly with physicians, nurses, professional societies, hospital administrators and healthcare group purchasing organizations (“GPOs”) to collaborate and educate on emerging practices and clinical techniques that prevent infection, eliminate pain and speed recovery. These marketing programs are delivered directly to healthcare providers. Additionally, we provide marketing programs to our strategic distribution partners throughout the world.
1 | ||
Distribution
While our products are generally marketed directly to hospitals and other healthcare providers, they are often sold through third-party distribution channels.
Our products are sold principally through independent wholesale distributors, with some sales directly to healthcare facilities and other end customers. In 2015, approximately 65% of our net sales in North America were made through distributors. Globally, sales to one distributor accounted for approximately 18% of our 2015 net sales. No other customer or distributor accounted for more than 10% of our net sales in 2015. This distributor purchases both S&IP and Medical Device products from us under standard terms and conditions of sale. In certain cases, this distributor also competes with us. See “Competition.”
Approximately 45% of our 2015 global net sales, including sales to wholesale distributors, were contracted through five major national GPOs, principally relating to our S&IP business. Of these 2015 GPO-contracted sales, 57% were represented by contracts that will expire by the end of 2016 and 43% were represented by contracts that will expire between 2017 and 2018.
Outside North America, sales are made either directly to end customers or through distributors, depending on the market served. In 2015, approximately 63% of our net sales outside North America were made through wholesalers or distributors.
We operate six major distribution centers located in North America, Europe, Australia and Japan that ship multiple finished products to multiple customers, as well as ten other distribution sites that also have customer shipping capabilities, in order to optimize cost and customer service requirements.
No material portion of our business is subject to renegotiation of profits or termination of contracts at the election of the government.
Raw Materials
We use a wide variety of raw materials and other inputs in our production processes, with polypropylene polymers and nitrile constituting our most significant raw material purchases. We base our purchasing decisions on quality assurance, cost effectiveness and regulatory requirements, and we work closely with our suppliers to assure continuity of supply while maintaining high quality and reliability. We primarily purchase these materials from external suppliers, some of which are single-source suppliers.
Global commodity prices can affect pricing of certain raw materials on which we rely. In our S&IP business, polypropylene polymers, which are oil based, and nitrile represent a significant component of our manufacturing costs. In addition, the prices of other raw materials we use, such as resins and finishing supplies, often fluctuate in response to changes in oil prices. Prices of these commodities can be volatile and have varied significantly in recent years, contributing to fluctuations in our results of operations.
Competition
The markets for our products are highly competitive. No one company competes with us across the breadth of our offerings, but we face significant competition in U.S. and international markets.
Surgical and Infection Prevention
There are a significant number of manufacturers and distributors of medical supplies, and the market for S&IP products is extremely competitive. In developed markets, the major competitors of our S&IP business include Cardinal Health, Inc., Medline Industries, Inc., Hogy Medical, Multigate Medical Products, Mölnlycke Health Care and HARTMANN Group. In the United States several of our distribution partners and GPOs are also competitors or are increasingly seeking to compete with us by direct sourcing their own products. In developing and emerging markets, we compete against multiple use products, or non-use of infection prevention products, due in large part to lower infection prevention awareness and education.
The highly competitive environment of the S&IP business requires us to continually seek out technological innovations and to market our products effectively. Our products face competition from other brands that may be less expensive than our products and from other companies that may have more resources than we do. Competitive factors include price, alternative clinical practices, innovation, quality and reputation. To successfully compete, we must often demonstrate that our products offer higher quality, more innovative features or better value versus other products.
2 | ||
Medical Devices
There are a variety of treatment means and alternative clinical practices to address the management of surgical and chronic pain and respiratory and digestive health. We face competition from these alternative treatments, as well as improvements and innovations in products and technologies by our competitors.
Competitors for our medical device products are fragmented by particular product category, and the individual markets for these products are highly competitive. Major competitors of our Medical Devices business include, among others:
• | Pain Management: B. Braun Medical Inc., St. Jude Medical, Pacira Pharmaceuticals, Inc., Stryker Corporation, Teleflex Incorporated, Ambu A/S and Baxter International, Inc. |
• | Respiratory: Becton, Dickinson and Company, Sage Products LLC and Smiths Medical |
• | Digestive Health: Boston Scientific Corporation, Cook Medical, and Applied Medical Technology, Inc. |
In developing and emerging markets, alternative clinical practices and different standards of care are our primary competition.
While we believe that the number of procedures using our medical devices will grow due, in part, to increasing global access to healthcare, we expect that our ability to compete with other providers of similar devices will be impacted by rapid technological advances, pricing pressures and third-party reimbursement practices. We believe that our key product characteristics, such as proven efficacy, reliability and safety, coupled with our core competencies such as our efficient manufacturing processes, established distribution network, field sales organization and customer service, are important factors that distinguish us from our competitors.
Research and Development
We continuously engage in research and development to commercialize new products and enhance the effectiveness, reliability and safety of our existing products. We incurred $32 million in 2015, $34 million in 2014 and $38 million in 2013 on research and development to develop new products and processes, and to improve existing products and processes. These expenses consisted primarily of salaries and related expenses for personnel, product trial costs, outside laboratory and license fees, the costs of laboratory equipment and facilities and asset write-offs for equipment that does not reach success in product manufacturing certifications. We intend to increase our research and development efforts as a key strategy for growth.
In our S&IP business, we are focused on maintaining our market position by providing innovative customer-preferred product enhancements, with a particular focus on the operating room. Leveraging customer insights and our vertically integrated manufacturing capabilities, we seek to continuously improve our product designs, specifications and features to deliver cost efficiencies while improving healthcare worker and patient protection. We continuously refresh our surgical drape and gown portfolio to ensure that our products are aligned with the latest procedural and market trends. Our research team works with healthcare providers to develop and design exam glove and apparel portfolios that optimize comfort and fit and provide cost-effective infection prevention solutions for use throughout the hospital.
In our Medical Devices business, we collaborate with physicians to develop solutions that seek to accelerate the global adoption of our therapies and procedures. We are investing to expand the indications for use of our pain products with clinical research and studies and associated new product developments. We are expanding our portfolio with customer-preferred product enhancements, such as next generation cooled radiofrequency generators and a full line of needles, kits and accessories for continuous peripheral nerve block procedures.
We are also investing in new categories and solutions that complement our technical expertise and existing intellectual property. We are particularly focused on those new categories that we believe will leverage our existing scalable technology platforms as well as our sales and marketing expertise.
Intellectual Property
Patents, trademarks and other proprietary rights are very important to our business. We also rely upon trade secrets, manufacturing know-how, continuing technological innovations and licensing opportunities to maintain and improve our competitive position. We review third-party proprietary rights, including patents and patent applications, as available, in an effort to develop an effective intellectual property strategy, avoid infringement of third-party proprietary rights, identify licensing opportunities and monitor the intellectual property owned by others.
3 | ||
We hold numerous patents and have numerous patent applications pending in the United States and other countries that relate to the technology used in many of our products. For example, we utilize patents in our sterilization wrap, surgical drapes and gowns, facial protection, protective apparel and medical exam gloves in our S&IP segment. These patents generally expire between 2016 and 2032. None of the patents we license from third parties are material to our S&IP segment. In our Medical Devices segment, we utilize patents in our surgical pain management, chronic pain management, respiratory health and digestive health products. These patents generally expire between 2019 and 2032. None of the patents we license from third parties are material to our Medical Devices segment.
We are undertaking efforts to ensure our customers’ transition from the Kimberly-Clark brand to our Halyard-branded products. In conjunction with the Spin-off, we have entered into a royalty agreement under which we have access to use the Kimberly-Clark brand for up to 24 months following the Spin-off date as we manage the packaging changes with global regulatory bodies. Royalties are required to be paid for products sold bearing the Kimberly-Clark brand only.
We consider the patents and trademarks which we own and the trademarks under which we sell certain of our products, as a whole, to be material to our business. However, we do not consider our business to be materially dependent upon any individual patent or trademark.
Regulatory Matters
The development, manufacture, marketing, sale, promotion and distribution of our products are subject to comprehensive government regulation. Government regulation by various national, regional, federal, state and local agencies, both in the United States and other countries, addresses (among other matters) inspection of, and controls over, research and laboratory procedures, clinical investigations, product approvals and manufacturing, labeling, packaging, marketing and promotion, pricing and reimbursement, sampling, distribution, quality control, post-market surveillance, record keeping, storage and disposal practices. Our operations are also affected by trade regulations in many countries that limit the import of raw materials and finished products and by laws and regulations that seek to prevent corruption and bribery in the marketplace (including the U.S. Foreign Corrupt Practices Act and the United Kingdom Bribery Act, which provide guidance on corporate interactions with government officials) and require safeguards for the protection of personal data. In addition, we are subject to laws and regulations pertaining to healthcare fraud and abuse, including state and federal anti-kickback and false claims laws in the United States.
Compliance with these laws and regulations is costly and materially affects our business. Among other effects, healthcare regulations substantially increase the time, difficulty and costs incurred in obtaining and maintaining approval to market newly developed and existing products. For example, in the United States, before we can market a new medical product, or market a new use for, claim for or significant modification to an existing product, we generally must first receive clearance under Section 510(k) of the Food, Drug and Cosmetic Act (“510(k) clearance”) from the United States Food and Drug Administration (“FDA”). In order for us to obtain 510(k) clearance, the FDA must determine that our proposed product is substantially equivalent to a device legally on the market, known as a predicate device, with respect to intended use, technology, safety and effectiveness. Similarly, most major markets for medical devices outside the United States also require clearance, approval or compliance with certain standards before a product can be commercially marketed. For instance, the European Commission, or EC, has harmonized national regulations for the control of medical devices through European Medical Device Directives with which manufacturers must comply. Under these regulations, manufacturing plants must have received certification of conformity from a notified body in order to be able to sell products within the member states of the European Union. Certification allows manufacturers to stamp the products of certified plants with a “CE” mark. Products covered by the EC regulations that do not bear the CE mark may not be sold or distributed in the European Union.
We expect compliance with these regulations to continue to require significant technical expertise and capital investment to ensure compliance. Failure to comply can delay the release of a new product or result in regulatory and enforcement actions, the seizure or recall of a product, the suspension or revocation of the authority necessary for a product’s production and sale, and other civil or criminal sanctions, including fines and penalties.
In addition to regulatory initiatives, our business can be affected by ongoing studies of the utilization, safety, efficacy, and outcomes of healthcare products and their components that are regularly conducted by industry participants, government agencies, and others. These studies can call into question the utilization, safety, and efficacy of previously marketed products. In some cases, these studies have resulted, and may in the future result, in the discontinuance of, or limitations on, marketing of such products domestically or worldwide, and may give rise to claims for damages from persons who believe they have been injured as a result of their use.
4 | ||
Access to healthcare products continues to be a subject of investigation and action by governmental agencies, legislative bodies, and private organizations in the United States and other countries. A major focus is cost containment. Efforts to reduce healthcare costs are also being made in the private sector, notably by healthcare payors and providers, which have instituted various cost reduction and containment measures. We expect insurers and providers to continue attempts to reduce the cost of healthcare products. Outside the United States, many countries control the price of healthcare products directly or indirectly, through reimbursement, payment, pricing, coverage limitations, or compulsory licensing. Budgetary pressures in the United States and in other countries may also heighten the scope and severity of pricing pressures on our products for the foreseeable future.
We expect debate to continue during the next several years at all government levels worldwide over the marketing, availability, method of delivery, and payment for healthcare products and services. We believe that future legislation and regulation in the markets we serve could affect access to healthcare products and services, increase rebates, reduce prices or the rate of price increases for healthcare products and services, change healthcare delivery systems, create new fees and obligations, or require additional reporting and disclosure. It is not possible to predict the extent to which we or the healthcare industry in general might be affected by the matters discussed above.
Since we market our products worldwide, certain products of a local nature and variations of product lines must also meet other local regulatory requirements. Certain additional risks are inherent in conducting business outside the United States, including price and currency exchange controls, changes in currency exchange rates, limitations on participation in local enterprises, expropriation, nationalization, and other governmental action.
Demand for many of our existing and new medical products is, and will continue to be, affected by the extent to which government healthcare programs and private health insurers reimburse our customers for patients’ medical expenses in the countries where we do business. Statutory and regulatory requirements for Medicaid, Medicare, and other government healthcare programs govern provider reimbursement levels. From time to time, legislative changes are made to government healthcare programs that impact our business, and the federal and/or state governments may continue to enact measures in the future aimed at containing or reducing reimbursement levels for medical expenses paid for in whole or in part with government funds. We cannot predict the nature of such measures or their impact on our business, results of operations, financial condition and cash flows. Any reduction in the amount of reimbursements received by our customers could harm our business by reducing their selection of our products and the prices they are willing to pay.
Employee and Labor Relations
In our worldwide operations, we had approximately 12,000 employees as of December 31, 2015. We believe that we have good relations with our employees.
Environmental, Health and Safety Matters
Our operations are subject to federal, state, provincial and local laws, regulations and ordinances relating to various environmental, health and safety matters. Our operations are in compliance with, or we are taking actions designed to ensure compliance with, these laws, regulations and ordinances. However, the nature of our operations exposes us to the risk of claims concerning non-compliance with environmental, health and safety laws or standards, and there can be no assurance that material costs or liabilities will not be incurred in connection with those claims. We are not currently named as a party in any judicial or administrative proceeding relating to environmental, health and safety matters.
While we have incurred in the past several years, and will continue to incur, capital and operating expenditures in order to comply with environmental, health and safety laws, regulations and ordinances, we believe that our future cost of compliance with environmental, health and safety laws, regulations and ordinances, and our exposure to liability for environmental, health and safety claims will not have a material adverse effect on our business, results of operations, financial condition or cash flows. However, future events, such as changes in existing laws and regulations, or contamination of sites owned, operated or used for waste disposal by us (including currently unknown contamination and contamination caused by prior owners and operators of such sites or other waste generators) may give rise to additional costs which could have a material adverse effect on our financial condition, results of operations or liquidity.
5 | ||
Available Information
We make financial information, news releases and other information available on our corporate website at www.halyardhealth.com. Our annual reports on Form 10-K, quarterly reports on Form 10-Q, current reports on Form 8-K, and any amendments to those reports filed or furnished pursuant to Section 13(a) or 15(d) of the Securities Exchange Act of 1934 are available free of charge on our corporate website as soon as reasonably practicable after we file these reports and amendments with, or furnish them to, the SEC. The information contained on or connected to our website is not incorporated by reference into this Annual Report on Form 10-K and should not be considered part of this or any other report filed with the SEC. Stockholders may also contact Stockholder Services, 5405 Windward Parkway, Suite 100 South, Alpharetta, Georgia 30004 or call (678) 425-9273 to obtain a hard copy of these reports without charge.
ITEM 1A. RISK FACTORS
Our business faces many risks and uncertainties that we cannot control. Any of the risks discussed below, as well as factors described in other places in this Annual Report on Form 10-K, or in our other filings with the SEC, could adversely affect our business, consolidated financial position, results of operations or cash flows. In addition, these items could cause our future results to differ from those in any of our forward-looking statements. These risks are not the only ones we face. Other risks that we do not presently know about or that we presently believe are not material could also adversely affect us.
Risks Related to our Business and Industry
We face strong competition. Our failure to compete effectively could have a material adverse effect on our business.
Our industry is highly competitive. We compete with many domestic and foreign companies ranging from small start-up enterprises that might sell only a single or limited number of competitive products or compete only in a specific market segment, to companies that are larger and more established than us, have a broad range of competitive products, participate in numerous markets and have access to significantly greater financial and marketing resources than we do. We also face competition from distributors who are expanding their private label portfolios and aggressively marketing their own product lines. For example, our products are distributed by Cardinal Health, Inc. and Medline Industries, Inc., each of which sells its own private label products and solutions that compete with some of our offerings. Competitive factors include price, alternative clinical practices, innovation, quality and reputation. Our failure to compete effectively could have a material adverse effect on our business, results of operations, financial condition and cash flows.
We may not be successful in developing, acquiring or marketing competitive products and technologies.
Our industry is characterized by extensive research and development and rapid technological advances. The future success of our business will depend, in part, on our ability to design, acquire and manufacture new competitive products and enhance existing products. Accordingly, we commit substantial time, funds and other resources to new product development, including research and development, acquisitions, licenses, clinical trials and physician education. We make these substantial expenditures without any assurance that our products will obtain regulatory clearance or reimbursement approval, acquire adequate intellectual property protection or receive market acceptance. Development by our competitors of improved products, technologies or enhancements may make our products, or those we develop, license or acquire in the future, obsolete or less competitive which could negatively impact our net sales. Our failure to successfully develop, acquire or market competitive new products or enhance existing products could have a material adverse effect on our business, results of operations, financial condition and cash flows.
We are exposed to price fluctuations of key commodities, which may negatively impact our results of operations.
We rely on product inputs, such as polypropylene and nitrile, as well as other commodities, in the manufacture of our products. Prices of oil and gas affect our distribution and transportation costs. Prices of these commodities are volatile and have fluctuated significantly in recent years, which has contributed to, and in the future may continue to contribute to, fluctuations in our results of operations. Our ability to hedge commodity price volatility is limited. Furthermore, due to competitive dynamics, the cost containment efforts of our customers and third-party payors, and contractual limitations, particularly with respect to products we sell under group purchasing agreements, which generally set pricing for a three-year term, we may be unable to pass along commodity-driven cost increases through higher prices. If we cannot fully offset cost increases through other cost reductions, or recover these costs through price increases or surcharges, we could experience lower margins and profitability which could have a material adverse effect on our business, results of operations, financial condition and cash flows.
6 | ||
An inability to obtain key components, raw materials or manufactured products from third parties may have a material adverse effect on our business.
We depend on the availability of various components, raw materials and manufactured products supplied by others for our operations. If the capabilities of our suppliers and third-party manufacturers are limited or stopped, due to quality, regulatory or other reasons, it could negatively impact our ability to manufacture or deliver our products and could expose us to regulatory actions. Further, for quality assurance or cost effectiveness, we purchase from sole suppliers certain components and raw materials such as polymers used in our S&IP products, latex bladders for our pain pumps, and synthetic rubber nitrile for our medical exam gloves. Although there are other sources in the market place for these items, we may not be able to quickly establish additional or replacement sources for certain components or materials due to regulations and requirements of the FDA and other regulatory authorities regarding the manufacture of our products. The loss of any sole supplier or any sustained supply interruption that affects our ability to manufacture or deliver our products in a timely or cost effective manner could have a material adverse effect on our business, results of operations, financial condition and cash flows.
An interruption in our ability to manufacture products may have a material adverse effect on our business.
Many of our key products are manufactured at single locations, with limited alternate facilities, including in certain cases by third-party manufacturers. If one or more of these facilities experience damage, or if these manufacturing capabilities are otherwise limited or stopped due to quality, regulatory or other reasons, including natural disasters or prolonged power or equipment failures, or labor dispute, it may not be possible to timely manufacture the relevant products at previous levels or at all. For example, floods have negatively impacted our medical exam gloves manufacturing facility in Thailand in recent years, which has resulted in temporary shut downs of the facility and an associated decrease in production of our medical exam gloves. A reduction or interruption in any of these manufacturing processes could have a material adverse effect on our business, results of operations, financial condition and cash flows.
An interruption in distribution or transportation may have a material adverse effect on our business.
We rely on various transportation channels for global distribution of our products through shipping ports located throughout the world. Labor unrest, political instability, the outbreak of pandemics, trade restrictions, transport capacity and costs, port security, weather conditions, natural disasters or other events could slow port activities and could adversely affect our business by interrupting product shipments and may increase our transportation costs if we are forced to use more expensive shipping alternatives.
We are subject to extensive government regulation, which may require us to incur significant expenses to ensure compliance.
Many of our products are subject to extensive regulation in the United States by the FDA and other regulatory authorities and by comparable government agencies in other countries concerning the development, design, approval, manufacture, labeling, importing and exporting and sale and marketing of many of our products. Furthermore, our facilities are subject to periodic inspection by the FDA and other federal, state and foreign government authorities, which require manufacturers of medical devices to adhere to certain regulations, including the FDA’s Quality System Regulation, which requires periodic audits, design controls, quality control testing and documentation procedures, as well as complaint evaluations and investigation. Regulations regarding the development, manufacture and sale of medical products are evolving and subject to future change. We cannot predict what impact those regulatory changes may have on our business. Failure to comply with applicable regulations could lead to manufacturing shutdowns, product shortages, delays in product manufacturing, product seizures, recalls, operating restrictions, withdrawal or suspension of required licenses, and prohibitions against exporting of products to, or importing products from, countries outside the United States and may require significant resources to resolve. Any one or more of these events could have a material adverse effect on our business, results of operations, financial condition and cash flows.
We are subject to healthcare fraud and abuse laws and regulations that could result in significant liability, require us to change our business practices or restrict our operations in the future.
We are subject to various U.S. federal, state and local laws targeting fraud and abuse in the healthcare industry, including anti-kickback and false claims laws. Violations of these laws are punishable by criminal or civil sanctions, including substantial fines, imprisonment and exclusion from participation in healthcare programs such as Medicare and Medicaid. These laws and regulations are wide ranging and subject to changing interpretation and application, which could restrict our sales or marketing practices. Furthermore, since many of our customers rely on reimbursement from Medicare, Medicaid and other governmental
7 | ||
programs to cover a substantial portion of their expenditures, our exclusion from such programs as a result of a violation of these laws could have a material adverse effect on our business, results of operations, financial condition and cash flows.
We must obtain clearance or approval from the appropriate regulatory authorities prior to introducing a new product or a modification to an existing product. The regulatory clearance process may result in substantial costs, delays and limitations on the types and uses of products we can bring to market, any of which could have a material adverse effect on our business.
In the United States, before we can market a new product, or a new use of, or claim for, or significant modification to, an existing product, we generally must first receive clearance or approval from the FDA and certain other regulatory authorities. Most major markets for medical devices outside the United States also require clearance, approval or compliance with certain standards before a product can be commercially marketed. The process of obtaining regulatory clearances and approvals to market a medical device can be costly and time consuming, involve rigorous pre-clinical and clinical testing, require changes in products or result in limitations on the indicated uses of products. There can be no assurance that these clearances and approvals will be granted on a timely basis, or at all. In addition, once a medical device has been cleared or approved, a new clearance or approval may be required before the medical device may be modified, its labeling changed or marketed for a different use. Medical devices are cleared or approved for one or more specific intended uses and promoting a device for an off-label use could result in government enforcement action. Furthermore, a product approval or clearance can be withdrawn or limited due to unforeseen problems with the medical device or issues relating to its application. The regulatory clearance and approval process may result in, among other things, delayed, if at all, realization of product net sales, substantial additional costs and limitations on the types of products we may bring to market or their indicated uses, any one of which could have a material adverse effect on our business, results of operations, financial condition and cash flows.
We may incur product liability losses, litigation liability, product recalls, safety alerts or regulatory action associated with our products which can be costly and disruptive to our business.
The risk of product liability claims is inherent in the design, manufacture and marketing of the medical products of the type we produce and sell. A number of factors could result in an unsafe condition or injury to, or death of, a patient with respect to the products that we manufacture or sell, including physician technique and experience in performing the relevant surgical procedure, component failures, manufacturing flaws, design defects or inadequate disclosure of product-related risks or information.
In addition to product liability claims and litigation, an unsafe condition or injury to, or death of, a patient associated with our products could lead to a recall of, or issuance of a safety alert relating to, our products, or suspension or delay of regulatory product approvals or clearances, product seizures or detentions, governmental investigations, civil or criminal sanctions or injunctions to halt manufacturing and distribution of our products. Any one of these could result in significant costs and negative publicity resulting in reduced market acceptance and demand for our products and harm our reputation. In addition, a recall or injunction affecting our products could temporarily shut down production lines or place products on a shipping hold.
All of the foregoing types of legal proceedings and regulatory actions are inherently unpredictable and, regardless of the outcome, could disrupt our business, result in substantial costs or the diversion of management attention and could have a material adverse effect on our business, results of operations, financial condition and cash flows.
Economic conditions have affected and may continue to adversely affect our business, results of operations, financial condition and cash flows.
Disruptions in the financial markets and other macro-economic challenges affecting the economy and the economic outlook of the United States, Europe, China and other parts of the world may have an adverse impact on our results of operations, financial condition and cash flows. Economic conditions and depressed levels of consumer and commercial spending have caused and may continue to cause our customers to reduce, modify, delay or cancel plans to purchase our products, and we have observed certain hospitals delaying and prioritizing purchasing decisions, which has had and may continue to have a material adverse effect on our business, results of operations, financial condition and cash flows.
In addition, as a result of economic conditions, our customers inside and outside the United States, including foreign governmental entities or other entities that rely on government healthcare systems or government funding, may be unable to pay their obligations on a timely basis or to make payment in full. If our customers’ cash flow or operating and financial performance deteriorate or fail to improve, or if our customers are unable to make scheduled payments or obtain credit, they may not be able to pay, or may delay payment of, accounts receivable owed to us. These conditions also may have an adverse effect on certain of our suppliers who may reduce output or change terms of sales, which could cause a disruption in our ability
8 | ||
to produce our products. Any inability of current and/or potential customers to pay us for our products or any demands by our suppliers for different payment terms may have a material adverse effect on our business, results of operations, financial condition and cash flows.
Currency exchange rate fluctuations could have a material adverse effect on our business and results of operations.
Due to our international operations, we transact business in many foreign currencies and are subject to the effects of changes in foreign currency exchange rates, including the Thai baht, Mexican peso, Japanese yen, Australian dollar and the Euro. Our financial statements are reported in U.S. dollars with international transactions being translated into U.S. dollars. If the U.S. dollar strengthens in relation to the currencies of other countries where we sell our products, our U.S. dollar reported net sales and income will decrease. Additionally, we incur significant costs in foreign currencies and a fluctuation in those currencies’ value can negatively impact manufacturing and selling costs. While we have in the past engaged, and may in the future engage, in various hedging transactions in attempts to minimize the effects of foreign currency exchange rate fluctuations, there can be no assurance that these hedging transactions will be effective. Changes in the relative values of currencies occur regularly and could have an adverse effect on our business, results of operations, financial condition and cash flows.
Cost-containment efforts of our customers, healthcare purchasing groups, third-party payors and governmental organizations could adversely affect our sales and profitability.
Many of our customers are members of GPOs, or integrated delivery networks (“IDNs”). GPOs and IDNs negotiate pricing arrangements with healthcare product manufacturers and distributors and offer the negotiated prices to affiliated hospitals and other members. Although we are the sole contracted supplier to certain GPOs for certain product categories, members of the GPO are generally free to purchase from other suppliers, and such contract positions can offer no assurance that sales volumes of those products will be maintained. In addition, initiatives sponsored by government agencies and other third-party payors to limit healthcare costs, including price regulation and competitive bidding for the sale of our products, are ongoing in markets where we sell our products. Pricing pressure has also increased in our markets due to consolidation among healthcare providers, trends toward managed care, governments becoming payors of healthcare expenses and regulation relating to reimbursements. The increasing leverage of organized buying groups and consolidated customers and pricing pressure from third-party payors may reduce market prices for our products, thereby reducing our profitability and have a material adverse effect on our business, results of operations, financial condition and cash flows.
We face significant uncertainty in the healthcare industry due to government healthcare reform in the United States and elsewhere.
In March 2010, comprehensive healthcare reform legislation was signed into law in the United States through the passage of the Patient Protection and Affordable Care Act and the Health Care and Education Reconciliation Act. Among other initiatives, the legislation implemented a 2.3% excise tax on the sales of certain medical devices in the United States, effective January 2013. In 2015, the excise tax had an impact on us of approximately $6 million. In addition, the legislation implemented payment system reforms and significantly altered Medicare and Medicaid reimbursements for medical services and medical devices, which could result in downward pricing pressure and decreased demand for our products. As a result of the passage of the Consolidated Appropriations Act in December 2015, the medical device excise tax has been suspended for the 2016 and 2017 calendar years.
As additional provisions of healthcare reform are implemented, we anticipate that the U.S. Congress, regulatory agencies and certain state legislatures, as well as international legislators and regulators, will continue to review and assess alternative healthcare delivery systems and payment methods with an objective of ultimately reducing healthcare costs and expanding access. We cannot predict with certainty what healthcare initiatives, if any, will be implemented by states or foreign governments or what ultimate effect federal healthcare reform or any future legislation or regulation may have on our customers’ purchasing decisions regarding our products. However, the implementation of new legislation and regulation may lower reimbursements for our products, reduce medical procedure volumes and adversely affect our business, results of operations, financial condition and cash flows.
Our customers depend on third-party coverage and reimbursements. The failure of healthcare programs to provide coverage and reimbursement, or reductions in levels of reimbursement, could have a material adverse effect on our business.
The ability of our customers to obtain coverage and reimbursements for products they purchase from us is important to our business. Demand for many of our existing and new medical products is, and will continue to be, affected by the extent to which government healthcare programs and private health insurers reimburse our customers for patients’ medical expenses in
9 | ||
the countries where we do business. Any reduction in the amount of reimbursements received by our customers could harm our business by reducing their selection of our products and the prices they are willing to pay.
In addition, as a result of their purchasing power, third-party payors are implementing cost-cutting measures such as seeking discounts, price reductions or other incentives from medical products suppliers and imposing limitations on coverage and reimbursements for medical technologies and procedures. These trends could compel us to reduce prices for our existing products and potential new products and could cause a decrease in the size of the market or a potential increase in competition that could have a material adverse effect on our business, results of operations, financial condition and cash flows.
We are subject to political, economic and regulatory risks associated with doing business outside of the United States.
We operate manufacturing facilities outside the United States in Honduras, Mexico and Thailand and source many of our raw materials and components from foreign suppliers. We distribute and sell our products in over 100 countries. In 2015, approximately 24% of our net sales were generated outside of North America and we expect this percentage will grow over time. Our operations outside of the United States are subject to risks that are inherent in conducting business internationally, including compliance with both United States and foreign laws and regulations that apply to our international operations. These laws and regulations include robust data privacy requirements, labor relations laws that may impede employer flexibility, tax laws, anti-competition regulations, import, customs and trade restrictions, export requirements, economic sanction laws, environmental, health and safety laws, anti-bribery laws such as the U.S. Foreign Corrupt Practices Act and similar anti-bribery laws in other jurisdictions. Given the high level of complexity of these laws, there is a risk that some provisions may be violated inadvertently or through fraudulent or negligent behavior of individual employees, our failure to comply with certain formal documentation requirements or otherwise. In addition, these laws are subject to changes, which may require additional resources or make it more difficult for us to comply with these laws. Violations of the laws and regulations governing our international operations could result in fines or criminal sanctions against us, our officers or our employees, and prohibitions on the conduct of our business. Any such violations could include prohibitions on our ability to manufacture or distribute our products in one or more countries and could have a material adverse effect on our reputation, our brand, our international expansion efforts, our ability to attract and retain employees, our business, results of operations, financial condition and cash flows. Our success depends, in part, on our ability to anticipate and prevent or mitigate these risks and manage difficulties as they arise.
In addition to the foregoing, engaging in international business inherently involves a number of other difficulties and risks, including:
• | different local medical practices, product preferences and product requirements, |
• | price and currency controls and exchange rate fluctuations, |
• | cost and availability of international shipping channels, |
• | longer payment cycles in certain countries other than the United States, |
• | minimal or diminished protection of intellectual property in certain countries, |
• | uncertainties regarding judicial systems, including difficulties in enforcing agreements through certain non-U.S. legal systems, |
• | political instability and actual or anticipated military or political conflicts, expropriation of assets, economic instability and the impact on interest rates, inflation and the credit worthiness of our customers, |
• | potentially negative consequences from changes in or interpretations of tax laws, including changes regarding taxation of income earned outside the United States, and |
• | difficulties and costs of staffing and managing non-U.S. operations. |
These risks and difficulties, individually or in the aggregate, could have a material adverse effect on our business, results of operations, financial condition and cash flows.
We cannot guarantee that any of our strategic acquisitions, investments or alliances will be successful.
We intend to supplement our growth through strategic acquisitions of, investments in and alliances with new medical technologies. The success of any acquisition, investment or alliance may be affected by a number of factors, including our ability to properly assess and value the potential business opportunity or to successfully integrate any business we may acquire
10 | ||
into our existing business. These types of transactions may require more resources and investments than originally anticipated, may divert management’s attention from our existing business, may result in exposure to unexpected liabilities of the acquired business, and may not result in the expected benefits, savings or synergies. There can be no assurance that any past or future acquisition, investment or alliance will be cost-effective, profitable or successful.
We may need additional financing in the future to meet our capital needs or to make acquisitions and such financing may not be available on favorable terms, if at all, and may be dilutive to existing stockholders.
We intend to increase our investment in research and development activities and make acquisitions. Prior to the Spin-off, our working capital and capital expenditure requirements were met from cash flow generated by our businesses and from Kimberly-Clark. Going forward, we may need to seek additional debt or equity financing. We may be unable to obtain any desired additional financing on terms favorable to us, if at all. If we lose a previously assigned credit rating or adequate funds are not available on acceptable terms, we may be unable to fund our expansion, successfully develop or enhance products or respond to competitive pressures, any of which could negatively affect our business. If we raise additional funds through the issuance of equity securities, Halyard stockholders will experience dilution of their ownership interest.
We may be unable to protect our intellectual property rights or may infringe the intellectual property rights of others.
We rely on patents, trademarks, trade secrets and other intellectual property assets in the operation of our business. Our efforts to protect our intellectual property and proprietary rights may not be sufficient. We cannot be sure that pending patent applications will result in the issuance of patents or that patents issued or licensed to us will remain valid or prevent competitors from introducing similar competing technologies. Our ability to enforce and protect our intellectual property rights may be limited in certain countries outside of the United States in which we operate, which could make it easier for our competitors to develop or distribute similar competing technologies in those jurisdictions. In addition, our competitive position may be adversely affected by expirations of our significant patents, which would allow competitors to freely use our technology to compete with us.
We operate in an industry characterized by extensive patent litigation and competitors may claim that our products infringe their intellectual property rights. Resolution of patent litigation or other intellectual property claims is inherently unpredictable, typically time consuming and costly and can result in significant damage awards and injunctions that could prevent the manufacture and sale of the affected products or require us to make significant royalty payments in order to continue selling the affected products. Any one of these could have a material adverse effect on our business, results of operations, financial condition and cash flows. At any given time we are involved as either a plaintiff or a defendant in a number of patent infringement actions, the outcomes of which may not be known for prolonged periods of time. We can expect to face additional claims of patent infringement in the future.
We may be unable to attract and retain key employees necessary to be competitive.
Our ability to compete effectively depends upon our ability to attract and retain executives and other key employees, including people in technical, marketing, sales and research and development positions. Competition for experienced employees, particularly for persons with specialized skills, can be intense. Our ability to recruit such talent will depend on a number of factors, including compensation and benefits, work location and work environment. If we cannot effectively recruit and retain qualified executives and employees, our business could be materially adversely affected.
Breaches of our information technology systems could have a material adverse effect on our business.
We rely on information technology systems to process, transmit and store electronic information in our day-to-day operations. Our information technology systems may be subjected to computer viruses or other malicious codes, unauthorized access attempts and cyber- or phishing-attacks. We also store certain information with third parties that could be subject to these types of attacks. These attacks could result in our intellectual property and other confidential information, including personal health information, being lost or stolen, disruption of our operations, loss of reputation and other negative consequences, such as increased costs for security measures or remediation costs and diversion of management attention. While we will continue to implement additional protective measures to reduce the risk of and detect future cyber incidents, cyber-attacks are becoming more sophisticated and frequent, and the techniques used in such attacks change rapidly. There can be no assurances that our protective measures will prevent future attacks that could have a material adverse effect on our business.
11 | ||
Risks Related to the Spin-off and Our Separation from Kimberly-Clark
We had no operating history as a separate company prior to the Spin-off, and prior to the Spin-off, our historical and pro-forma financial data were not necessarily representative of the results we would have achieved as a stand-alone publicly-traded company and therefore may not be reliable as an indicator of our performance.
The historical combined and consolidated financial data included in this annual report on Form 10-K presents our results of operations and financial position as a stand-alone public company in 2015 and for the period from November 1, 2014 through December 31, 2014, and as Kimberly-Clark’s Health Care business through October 31, 2014 (the Spin-off date). Prior to the Spin-off date, the historical combined financial data presented the results and financial position of Kimberly-Clark’s Health Care business that was transferred to us at the Spin-off date as that business was operated by Kimberly-Clark. Our historical combined financial data included in this Form 10-K for the periods prior to the Spin-off are derived from the historical consolidated financial statements and accounting records of Kimberly-Clark. Accordingly, this data may not be indicative of our future performance, or necessarily reflect what our financial position and results of operations or cash flows would have been, had we operated as a separate, stand-alone publicly-traded entity during all of the periods presented. This is because, among other things:
• | Prior to the Spin-off, Kimberly-Clark performed various corporate functions for us, such as employee payroll and benefits administration, information technology services, financial and tax services, transportation and logistics, procurement services, order management and processing, regulatory compliance and other support services. Kimberly-Clark provided some of these functions to us during 2015 (see Note 3, “Spin-Off Transition Costs and Sale of Exam Glove Facility,” to the consolidated financial statements). Our historical combined financial data reflect adjustments and allocations with respect to corporate and administrative costs relating to these functions which are less than the expenses we expect would have been incurred had we operated as a stand-alone company. |
• | Prior to the Spin-off, our business was integrated with the other businesses of Kimberly-Clark. Historically, we shared economies of scale in costs, employees, vendor relationships and customer relationships with Kimberly-Clark. At the time of the Spin-off, we entered into transition agreements that govern certain commercial and other relationships between us and Kimberly-Clark after the distribution. Those transitional arrangements do not fully capture the benefits our business enjoyed as a result of being integrated with the other businesses of Kimberly-Clark. The loss of these benefits could have a material adverse effect on our business, results of operations, financial condition and cash flows. |
• | Prior to the Spin-off, our working capital requirements and capital for our general corporate purposes, including acquisitions, research and development and capital expenditures, were satisfied as part of the corporate-wide cash management policies of Kimberly-Clark. As a stand-alone public company, we may need to obtain additional financing from banks, public offerings or private placements of debt or equity securities, strategic relationships or other arrangements. |
• | Our cost of capital is higher than Kimberly-Clark’s cost of capital prior to the Spin-off due to, among other reasons, our credit rating being lower than Kimberly-Clark’s. |
• | Other significant changes may occur in our cost structure, management, financing and business operations as a result of operating as a stand-alone company separate from Kimberly-Clark. |
For additional information about the historical financial performance of our business see “Management’s Discussion and Analysis of Financial Condition and Results of Operations” and the consolidated financial statements and accompanying notes included elsewhere in this annual report on Form 10-K.
Following our separation from Kimberly-Clark, we have a significant amount of debt that could adversely affect our business.
In connection with the Spin-off, we issued $250 million of 6.25% senior unsecured notes and obtained a $390 million term loan. This debt could have important consequences to us and our investors, including:
• | requiring a substantial portion of our cash flow from operations to make interest payments on this debt, |
• | reducing the cash flow available to fund capital expenditures and other corporate purposes and to grow our business, |
• | increasing our vulnerability to general adverse economic and industry conditions, |
12 | ||
• | increasing the risk of a future downgrade of our credit rating, which could increase future debt costs and limit the future availability of debt financing, |
• | limiting our ability to borrow additional funds as needed or take advantage of business opportunities as they arise, and |
• | limiting our flexibility in planning for, or reacting to, changes in our business and the industry and placing us at a competitive disadvantage to our competitors that may not be as highly leveraged. |
To the extent that we incur additional indebtedness, the risks described above could increase. In addition, our actual cash requirements in the future may be greater than expected. Our cash flow from operations may not be sufficient to repay all of the outstanding debt as it becomes due, and we may not be able to borrow money, sell assets or otherwise raise funds on acceptable terms, or at all, to refinance our debt.
Prior to the Spin-off, we had not previously operated as an independent company and our management team has been assembled for only a short time.
Prior to the Spin-off, we had not previously operated as an independent public company, and our management has limited experience, as a group, in operating our business as a stand-alone entity. Following the Spin-off, we became fully responsible for arranging our own funding, managing all of our own administrative and employee arrangements and supervising all of our legal and financial affairs, including publicly reported financial statements. We have adopted separate stock-based and performance-based incentive plans for our employees and have developed our own compliance and administrative procedures necessary for a publicly-held company. We entered into an agreement with Kimberly-Clark in which Kimberly-Clark will provide certain transition services to us. See Note 3, “Spin-Off Transition Costs and Sale of Exam Glove Facility,” to the consolidated financial statements. In addition, our ability to grow our business may be affected by our indebtedness following the transaction. We anticipate that our success in these endeavors will depend substantially upon the ability of our Board of Directors, senior management and other key employees to work together. Although the individual members of our Board of Directors and senior management team have significant experience, they previously have not worked together as a group.
Accordingly, there is no assurance that as an independent company, our aggregate results of operations will continue at the same level as in the past. Moreover, the inability of our Board of Directors or senior management to function cohesively could delay or prevent us from implementing fully our business strategy, which could have a material adverse effect on our business, results of operations, financial condition and cash flows.
We could incur significant tax liabilities if the distribution becomes a taxable event.
In connection with the Spin-off, Kimberly-Clark received an opinion from Baker Botts L.L.P. to the effect that the distribution of Halyard common stock qualified as a tax-free spin-off under Sections 368(a)(1)(D) and 355 of the Code. The opinion relied on certain facts, assumptions, representations and undertakings from Kimberly-Clark and us regarding the past and future conduct of the companies’ respective businesses and other matters. If any of these facts, assumptions, representations or undertakings are incorrect or not satisfied, Kimberly-Clark and its stockholders may not be able to rely on the opinion of Baker Botts L.L.P. and could be subject to significant tax liabilities.
Notwithstanding Kimberly-Clark’s receipt of the legal opinion from Baker Botts L.L.P., there can be no assurance that the U.S. Internal Revenue Service will determine that the distribution is not a taxable event, including as a result of certain significant changes in the share ownership of Kimberly-Clark or Halyard after the distribution. If the distribution is determined to be taxable for U.S. federal income tax purposes, Kimberly-Clark and its stockholders that are subject to U.S. federal income tax could incur significant U.S. federal income tax liabilities and we could incur significant liabilities as well.
We may not be able to engage in certain corporate transactions for up to two years after the distribution.
To preserve the treatment to Kimberly-Clark of the separation and the distribution as a “reorganization” under Sections 368(a)(1)(D) and 355 of the Code, under the tax matters agreement that we entered into with Kimberly-Clark, we are restricted from taking any action that prevents the separation and distribution from satisfying the requirements for tax-free treatment under Sections 368(a)(1)(D) and 355 of the Code, limiting our flexibility in planning for, or reacting to, changes in our business and the industry and placing us at a competitive disadvantage to our competitors that may not be as highly leveraged. Under the tax matters agreement, for the two-year period following the distribution date (the “Restricted Period”), Halyard is prohibited, except in certain circumstances, from, among other things:
13 | ||
• | selling 50 percent or more of the assets of the healthcare business or engaging in mergers or other strategic transactions that may result in any stockholder owning (as determined under U.S. federal income tax law) 40 percent or more (by vote or value) of the outstanding shares of Halyard stock, |
• | repurchasing outstanding shares of its stock, other than in open market repurchases constituting less than 20 percent of such stock outstanding immediately following the distribution, and |
• | ceasing to actively conduct its business or liquidating. |
The foregoing prohibitions are in some cases more restrictive than that required under the Code due to the potential significant liability to Kimberly-Clark and its stockholders were the separation and the distribution determined to be a taxable transaction. Under the tax matters agreement, we have the ability to engage in certain otherwise prohibited transactions, such as additional stock issuances or stock repurchases during the Restricted Period, provided we first deliver to Kimberly-Clark a tax opinion that doing so will not adversely affect the tax-free treatment of the separation and the distribution.
The foregoing restrictions may limit our ability to pursue certain strategic transactions or other transactions that we believe to be in the best interests of our stockholders or that might increase the value of our business. In addition, under the tax matters agreement, we are required to indemnify Kimberly-Clark against any tax liabilities incurred primarily as a result of the violation of any of the foregoing restrictions, as well as any transaction (or series of transactions) that results in the distribution being considered part of a plan by us that includes a later change in control of us during the Restricted Period (as determined under U.S. federal income tax law).
We may not realize potential benefits from the separation of our business from Kimberly-Clark’s other businesses.
There is no assurance that we will realize the potential benefits that we expect from our separation from Kimberly-Clark. The separation and Spin-off is expected to provide the following benefits, among others: (1) the ability of Halyard to focus on its own strategic and operational plans; (2) more efficient allocation of capital for Halyard; (3) a distinct investment identity allowing investors to evaluate the merits, performance and future prospects of Halyard separately from those of Kimberly-Clark; and (4) more effective equity-based compensation and greater alignment of management interests with our business.
Following the Spin-off, we may not achieve these and other anticipated benefits for a variety of reasons, including, among others:
• | we will not have the same access to the financial, managerial and professional resources from which we have benefited in the past and will incur significant costs, which may be greater than those for which we have planned, to replace these resources, |
• | the transition to a stand-alone company may require significant amounts of management’s time and effort, which may divert management’s attention away from Halyard’s business, |
• | certain costs and liabilities that were otherwise less significant to Kimberly-Clark as a whole are more significant to us as a stand-alone company, |
• | we may be more susceptible to market fluctuations and other adverse events than if we were still a part of Kimberly-Clark, and |
• | our business is significantly less diversified than Kimberly-Clark’s business prior to the Spin-off. |
If we fail to achieve some or all of the benefits expected to result from the separation and distribution, or if such benefits are delayed, our business, financial condition, results of operations and cash flows could be adversely affected and the value of Halyard common stock could be adversely impacted.
The transition services being provided to us by Kimberly-Clark for a limited time may be difficult for us to perform or replace without operational problems or additional cost.
We entered into a transition services agreement with Kimberly-Clark pursuant to which we and Kimberly-Clark and both our respective affiliates are providing to each other certain transition services for a period of time following the Spin-off. These services included employee payroll and benefits administration, information technology services, financial services, transportation and logistics, procurement services, order management and processing, regulatory compliance and other support services. If, after the expiration of the transition services agreement, we are unable to perform these services or replace them in a timely manner or on reasonable terms, we may experience operational problems and increased costs to us.
14 | ||
Following our separation from Kimberly-Clark, we may experience increased costs resulting from decreased purchasing power, which could decrease our overall profitability and cash flow.
As part of Kimberly-Clark, we were able to take advantage of Kimberly-Clark’s size and purchasing power in procuring goods, services and technology, such as management information services, health insurance, pension and other employee benefits, payroll administration, risk management, tax and other services. As a separate, stand-alone entity following the Spin-off, we pay higher costs for certain materials used in our products due to a decline in purchasing scale if we are unable to obtain other similar goods, services and technology at prices or on terms as favorable as those obtained prior to the distribution.
Risks Related to Ownership of Halyard Common Stock
We cannot guarantee that our stock price will not decline or fluctuate significantly.
Halyard common stock only began trading at the time of the Spin-off. The price at which Halyard common stock trades has and may continue to fluctuate significantly. The market price, or fluctuations in price, for Halyard common stock may be negatively influenced by many factors, including:
• | actual or unanticipated fluctuations in our quarterly and annual operating results, |
• | our failure to achieve the quarterly financial results forecast provided from time to time by the securities analysts who cover our stock, |
• | developments generally affecting the healthcare industry, |
• | changes in market valuations of comparable companies, |
• | the amount of our indebtedness, |
• | general economic, industry and market conditions, |
• | the depth and liquidity of the market for Halyard common stock, |
• | fluctuations in interest and currency exchange rates, |
• | our dividend policy, and |
• | perceptions of or speculations by the press or investment community. |
These and other factors may lower the market price of Halyard common stock, regardless of our actual financial condition or operating performance.
We have no present intention to pay dividends on Halyard common stock.
We have no present intention to pay dividends on Halyard common stock. Any determination to pay dividends to holders of Halyard common stock will be at the discretion of our Board of Directors and will depend on many factors, including our financial condition, results of operations, projections, liquidity, earnings, legal requirements, restrictions in our debt agreements and other factors that our Board of Directors deems relevant.
Your percentage of ownership in Halyard may be diluted in the future.
In the future, your percentage ownership in Halyard may be diluted because of equity issuances for acquisitions, capital market transactions or otherwise, including equity awards that we may grant to our directors, officers and employees. We also anticipate that our compensation committee will grant stock options or other equity based awards to our employees in the future. These awards will have a dilutive effect on existing stockholders and on our earnings per share, which could adversely affect the market price of shares of Halyard common stock.
In addition, our certificate of incorporation authorizes us to issue, without the approval of Halyard stockholders, one or more classes or series of preferred stock having such designation, powers, preferences and relative, participating, optional and other special rights, including preferences over Halyard common stock with respect to dividends and distributions, as our Board of Directors generally may determine. If our Board of Directors were to approve the issuance of preferred stock in the future, the terms of one or more classes or series of such preferred stock could dilute the voting power or reduce the value of Halyard common stock. Similarly, the repurchase or redemption rights or liquidation preferences we could assign to Halyard preferred stock could affect the residual value of Halyard common stock.
15 | ||
Certain provisions of our certificate of incorporation and by-laws and of Delaware law may make it difficult for stockholders to change the composition of our Board of Directors and may discourage hostile takeover attempts which some of our stockholders may consider to be beneficial.
Certain provisions contained in our certificate of incorporation and by-laws and those contained in Delaware law may have the effect of delaying or preventing changes in control if our Board of Directors determines that such changes in control are not in the best interests of us and our stockholders. These provisions include, among other things, the following:
• | the division of our Board of Directors into three classes, each with three-year staggered terms, |
• | the ability of our Board of Directors to issue shares of preferred stock and to determine the price and other terms, including preferences and voting rights, of those shares without stockholder approval, |
• | the inability of our stockholders to call a special meeting of stockholders, |
• | stockholder action may be taken only at a special or regular meeting of stockholders, |
• | advance notice procedures for nominating candidates to our Board of Directors or presenting matters at stockholder meetings, |
• | stockholder removal of directors only for cause and only by a supermajority vote, |
• | the ability of our Board of Directors, and not our stockholders, to fill vacancies on our Board of Directors, and |
• | supermajority voting requirements to amend our by-laws and certain provisions of our certificate of incorporation and to engage in certain types of business combinations. |
While these provisions have the effect of encouraging persons seeking to acquire control of our company to negotiate with our Board of Directors, they could enable the Board of Directors to hinder or frustrate a transaction that some, or a majority, of the stockholders might believe to be in their best interests and, in that case, may prevent or discourage attempts to remove and replace incumbent directors. We are also subject to Delaware laws that could have similar effects. One of these laws prohibits us from engaging in a business combination with a significant stockholder unless specific conditions are met.
ITEM 1B. UNRESOLVED STAFF COMMENTS
None.
ITEM 2. PROPERTIES
We own or lease operating facilities located throughout the world that handle manufacturing production, assembly, research, quality assurance testing, distribution and packaging of our products. We believe our facilities are suitable and adequate for our present operations. We have entered into a commercial lease related to our principal executive offices, located in Alpharetta, Georgia. The locations of our principal production facilities owned or leased by us around the world are as follows:
Segment | Location | Country | Owned/Leased | |||
S&IP | Tambol Prik | Thailand | Owned | |||
S&IP | Lexington, North Carolina | USA | Owned | |||
S&IP | Acuña | Mexico | Owned | |||
S&IP | Nogales | Mexico | Leased | |||
S&IP | San Pedro Sula | Honduras | Leased | |||
Medical Devices | Nogales | Mexico | Owned | |||
Medical Devices | Tucson, Arizona | USA | Leased | |||
Medical Devices | Magdalena | Mexico | Leased | |||
Medical Devices | Nogales | Mexico | Leased | |||
Medical Devices | Tijuana | Mexico | Leased | |||
Medical Devices | Weinheim | Germany | Leased | |||
16 | ||
ITEM 3. LEGAL PROCEEDINGS
We are subject to various legal proceedings, claims and governmental inspections, audits or investigations pertaining to issues such as contract disputes, product liability, tax matters, patents and trademarks, advertising, governmental regulations, employment and other matters, including the matters described below. Under the terms of the distribution agreement we entered into with Kimberly-Clark prior to the Spin-off, legal proceedings, claims and other liabilities that are primarily related to our business are our responsibility and we are obligated to indemnify and hold Kimberly-Clark harmless for such matters (“Indemnification Obligation”). For the year ended December 31, 2015, we have incurred $17 million related to these matters.
The only exception to the Indemnification Obligation relates to the pain pump litigation referenced in this paragraph. We are one of several manufacturers of continuous infusion medical devices, such as our ON-Q PAINBUSTER pain pumps, that are involved in several different pending or threatened litigation matters from multiple plaintiffs alleging that use of the continuous infusion device to deliver anesthetics directly into a synovial joint after surgery resulted in postarthroscopic glenohumeral chondrolysis, or a disintegration of the cartilage covering the bones in the joint (typically, in the shoulder). Plaintiffs generally seek monetary damages and attorneys’ fees. While Kimberly-Clark is retaining the liabilities related to these matters, the distribution agreement between us and Kimberly-Clark provides that we will indemnify Kimberly-Clark for any such claims or causes of actions arising after the Spin-off.
We have an Indemnification Obligation for, and have assumed the defense of, the matter styled Shahinian, et al. v. Kimberly-Clark Corporation, et al., No. 2:14-cv-08390-DMG-SH (C.D. Cal.), filed on October 29, 2014. In that case, the plaintiff brings a putative nationwide class action asserting claims for common law fraud (affirmative misrepresentation and fraudulent concealment), negligent misrepresentation, and violation of California’s Unfair Competition Law in connection with our marketing and sale of MicroCool surgical gowns. On February 6, 2015, we moved to dismiss the complaint on multiple grounds. On July 10, 2015, the Court issued an order on the motion to dismiss, dismissing the negligent misrepresentation claim but permitting the remaining claims to stand and proceed to discovery. On December 11, 2015, the plaintiff filed a second amended complaint that added additional plaintiffs in California, Texas and Rhode Island, named Halyard Health, Inc. as an additional defendant, and extend the timeframe for the lawsuit to include products sold after the Spin-off through December 2015. The parties are currently engaged in discovery. We intend to continue our vigorous defense of the matter.
In June 2015, we were served with a subpoena from the Department of Veterans Affairs Office of the Inspector General (“VA OIG”) seeking information related to the design, manufacture, testing, sale and promotion of MicroCool and other Company surgical gowns, and, in July 2015, also became aware that the subpoena and an earlier VA OIG subpoena served on Kimberly-Clark requesting information about gown sales to the federal government are related to a United States Department of Justice (“DOJ”) investigation. We could be subject to litigation relating to this investigation, by either governmental agencies or private parties. If a claim is asserted against Kimberly-Clark relating to MicroCool gowns or other Company surgical gowns, we expect that such a claim would give rise to an Indemnification Obligation under the distribution agreement with Kimberly-Clark. The Company is cooperating with the VA OIG’s request and the DOJ investigation.
We operate in an industry characterized by extensive patent litigation and competitors may claim that our products infringe upon their intellectual property. Resolution of patent litigation or other intellectual property claims is typically time consuming and costly and can result in significant damage awards and injunctions that could prevent the manufacture and sale of the affected products or require us to make significant royalty payments in order to continue selling the affected products. At any given time we are involved as either a plaintiff or a defendant in a number of patent infringement actions, the outcomes of which may not be known for prolonged periods of time.
Although the results of litigation and claims cannot be predicted with certainty, we believe that the ultimate disposition of these matters, to the extent not previously provided for, will not have a material adverse effect, individually or in the aggregate, on our business, financial condition, results of operations or liquidity.
We are subject to federal, state and local environmental protection laws and regulations with respect to our business operations and are operating in compliance with, or taking action aimed at ensuring compliance with, these laws and regulations. None of our compliance obligations with environmental protection laws and regulations, individually or in the aggregate, is expected to have a material adverse effect on our business, financial condition, results of operations or liquidity.
ITEM 4. MINE SAFETY DISCLOSURES
Not applicable.
17 | ||
EXECUTIVE OFFICERS OF THE REGISTRANT
The names and ages of our executive officers as of February 29, 2016, together with certain biographical information, are as follows:
Name | Position | |
Robert E. Abernathy | Chairman of the Board and Chief Executive Officer | |
Rhonda D. Gibby | Senior Vice President and Chief Human Resources Officer | |
Christopher G. Isenberg | Senior Vice President - Global Supply Chain and Procurement | |
Christopher M. Lowery | Senior Vice President and Chief Operating Officer | |
Warren J. Machan | Senior Vice President - Business Strategy | |
Steven E. Voskuil | Senior Vice President and Chief Financial Officer | |
John W. Wesley | Senior Vice President, General Counsel and Chief Ethics and Compliance Officer | |
Robert E. Abernathy, age 61, is the Chairman of our Board of Directors and our Chief Executive Officer. Prior to the Spin-off, he served as President Global Health Care since June 2014. Prior to that he served as an Executive Vice President of Kimberly-Clark from November 2013 to June 2014 and prior to that served as Group President - Europe, Global Nonwovens, and Continuous Improvement & Sustainability from 2012 to November 2013. He had overall responsibility for Kimberly-Clark’s Health Care business from 1997 to early 2004. His past responsibilities at Kimberly-Clark have also included overseeing its businesses in Asia, Latin America, Eastern Europe, the Middle East and Africa, as well as operations and major project management in North America. He was appointed Vice President - North American Diaper Operations in 1992; Managing Director of Kimberly-Clark Australia Pty. Limited in 1994; Group President - Developing and Emerging Markets in 2004; and Group President - North Atlantic Consumer Products in 2008. Mr. Abernathy currently serves as a director of RadioShack Corporation. Mr. Abernathy was selected to serve as the Chairman of our Board of Directors due to his leadership experience as an executive vice president of Kimberly-Clark, knowledge of and experience in the healthcare industry, international experience and governance and public company board experience.
Rhonda D. Gibby, age 48, is our Senior Vice President and Chief Human Resources Officer. Prior to the Spin-off, she had been serving as Kimberly-Clark’s Vice President - Human Resources for its global business-to-business units (K-C Professional and Kimberly-Clark’s Health Care business) as well as the leader of Kimberly-Clark’s global labor relations since 2010. Prior to that, Ms. Gibby served as Kimberly-Clark’s Global Vice President of Talent Management from 2008 to 2010. Prior to joining Kimberly-Clark in 2005, Ms. Gibby held leadership roles in operations, sales and human resources in a variety of industries and employers, including most recently at Covidien, a global healthcare products company.
Christopher G. Isenberg, age 49, is our Senior Vice President - Global Supply Chain and Procurement. Prior to the Spin-off, he had been with Kimberly-Clark for over 25 years, serving most recently as Kimberly-Clark’s Vice President of Global Health Care Manufacturing and Supply Chain since July 2012. Before assuming this role, Mr. Isenberg served as Senior Manufacturing Director for K-C Professional, beginning in January 2011. From October 2007 until January 2011, Mr. Isenberg served as Plant Manager at Kimberly-Clark’s Everett, Washington Pulp and Tissue Mill. Prior to that, he served in various manufacturing operations, marketing and other roles for Kimberly-Clark’s Family Care business.
Christopher M. Lowery, age 52, is our Senior Vice President and Chief Operating Officer, and in that role has responsibility for leading worldwide sales, marketing, research and development, quality, regulatory and clinical affairs. Prior to the Spin-off, he had been serving as Kimberly-Clark’s Vice President - Global Health Care Sales and Marketing since July 2013. Prior to this role he served as Vice President, Global Medical Devices. Mr. Lowery joined Kimberly-Clark in 2010 bringing 15 years of healthcare industry experience. Before joining Kimberly-Clark, he held several senior marketing and sales roles at Covidien, a global healthcare products company.
Warren J. Machan, age 50, is our Senior Vice President - Business Strategy. Prior to the Spin-off, he had been serving as Kimberly-Clark’s Senior Director of Strategy - Global Health Care since January 2012 and before that served as Senior Director of Finance for Kimberly-Clark’s Health Care business from 2008 to 2012. Mr. Machan served as Director of Finance and Strategic Planning for the Kimberly-Clark International business from 2004 to 2008. He joined Kimberly-Clark in 1987 and, while spending the majority of time in Kimberly-Clark’s Health Care business, he has also held roles in sales, marketing and finance for the K-C Professional, Personal Care and Family Care businesses.
18 | ||
Steven E. Voskuil, age 47, is our Senior Vice President and Chief Financial Officer. Prior to the Spin-off, he had been serving as Vice President - Finance for Kimberly-Clark International since September 2011 and previously served as Kimberly-Clark’s Vice President and Treasurer from January 2008 to September 2011. He joined Kimberly-Clark in 1991 in Finance and has held a variety of roles in business analysis, strategic analysis and treasury for Kimberly-Clark’s businesses worldwide. Mr. Voskuil also served as the executive sponsor for talent development for the company’s Global Finance organization.
John W. Wesley, age 57, is our Senior Vice President, General Counsel and Chief Ethics and Compliance Officer. Prior to the Spin-off, he had been serving as Kimberly-Clark’s Vice President, Deputy General Counsel and Corporate Secretary since 2009. He joined Kimberly-Clark in May 2000 as Senior Counsel, Corporate Affairs and has held a variety of positions, overseeing corporate transactions and corporate governance matters. Prior to joining Kimberly-Clark, he was a partner at the Dallas law firm of Carrington, Coleman, Sloman & Blumenthal, L.L.P., where he specialized in corporate, securities, corporate finance, mergers and acquisitions and general, commercial and business law.
19 | ||
PART II
ITEM 5. | MARKET FOR REGISTRANT’S COMMON EQUITY, RELATED STOCKHOLDER MATTERS AND ISSUER PURCHASES OF EQUITY SECURITIES |
Halyard common stock is listed on the New York Stock Exchange (“NYSE”) under the ticker symbol “HYH”. The following table sets forth for the indicated periods the high and low sales prices per share of our common stock on the NYSE:
Three Months Ended | |||||||||||||||
March 31, 2015 | June 30, 2015 | September 30, 2015 | December 31, 2015 | ||||||||||||
High | $ | 49.95 | $ | 50.92 | $ | 41.84 | $ | 34.88 | |||||||
Low | 42.29 | 40.14 | 27.76 | 26.58 | |||||||||||
The high and low sales price of our common stock was $53.85 and $32.81, respectively, during the fourth quarter of 2014, beginning on October 21, 2014, the date on which our common stock began trading on a when-issued basis on the NYSE.
We did not pay any dividends on our common stock in the year ended December 31, 2015 and we do not expect to pay any cash dividends on our common stock in the foreseeable future.
As of February 11, 2016, we had 17,264 holders of record of our common stock.
For information relating to securities authorized for issuance under equity compensation plans, see Part III, Item 12 of this Form 10-K.
Performance
The graph below compares the cumulative total return of our common stock from October 21, 2014, the first day of trading for our common stock on a when-issued basis, through December 31, 2015 with the cumulative return of companies comprising the Standard and Poor’s S&P MidCap 400 Index and the S&P 500 Health Care Equipment and Services Index. The graph plots the change in value of an initial investment of $100 in each of our common stock, the S&P MidCap 400 Index and the S&P 500 Health Care Equipment and Services Index over the indicated time periods and assumes reinvestment of all dividends, if any, paid on the securities. We have not paid any cash dividends, and therefore, the cumulative total return calculation for us is based solely upon stock price appreciation and not upon reinvestment of cash dividends. The stock price performance shown on the graph is not necessarily indicative of future price performance.
20 | ||
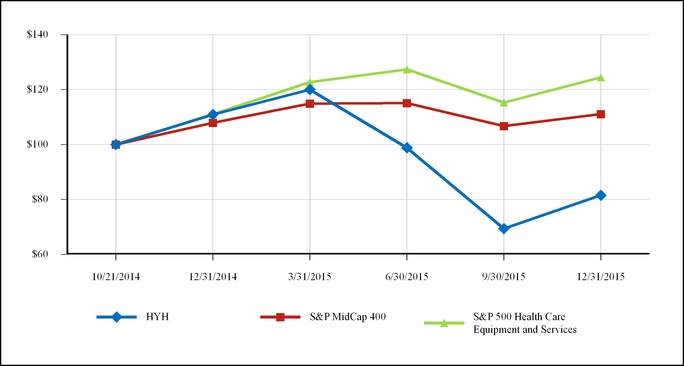
10/21/2014 | 12/31/2014 | 3/31/2015 | 6/30/2015 | 9/30/2015 | 12/31/2015 | ||||||||||||||||||
HYH | $ | 100.00 | $ | 110.90 | $ | 120.00 | $ | 98.78 | $ | 69.37 | $ | 81.49 | |||||||||||
S&P MidCap 400 | 100.00 | 107.89 | 114.92 | 115.04 | 106.70 | 111.07 | |||||||||||||||||
S&P 500 Health Care Equipment and Services | 100.00 | 110.93 | 122.70 | 127.35 | 115.26 | 124.40 | |||||||||||||||||
ITEM 6. | SELECTED FINANCIAL DATA |
The following selected financial data should be read in conjunction with Item 7, “Management’s Discussion and Analysis of Financial Condition and Results of Operations” and Item 8, “Financial Statements and Supplementary Data” in this annual report on Form 10-K (in millions, except per-share amounts):
Year Ended December 31, | |||||||||||||||||||
2015 | 2014 | 2013 | 2012 | 2011 | |||||||||||||||
Income Statement Data: | |||||||||||||||||||
Net Sales | $ | 1,574.4 | $ | 1,672.1 | $ | 1,677.5 | $ | 1,684.0 | $ | 1,659.9 | |||||||||
Gross Profit | 531.6 | 548.6 | 612.2 | 602.5 | 590.8 | ||||||||||||||
Operating (Loss) Profit | (377.7 | ) | 94.3 | 225.3 | 228.0 | 210.7 | |||||||||||||
(Loss) Income Before Income Taxes | (410.5 | ) | 91.2 | 227.8 | 229.8 | 214.6 | |||||||||||||
Net (Loss) Income(a)(b) | (426.3 | ) | 27.1 | 154.6 | 152.6 | 142.4 | |||||||||||||
Earnings Per Share | |||||||||||||||||||
Basic | $ | (9.15 | ) | $ | 0.58 | $ | 3.32 | $ | 3.28 | $ | 3.06 | ||||||||
Diluted | $ | (9.15 | ) | $ | 0.58 | $ | 3.32 | $ | 3.28 | $ | 3.06 | ||||||||
______________________________
(a) | Net loss in 2015 includes a $474 million goodwill impairment charge, $33 million, net of tax, of spin-related transition expenses and $11 million, net of tax, of costs related to legal expenses and litigation partially offset by a $8 million net gain on the disposal of one of our exam glove manufacturing facilities in Thailand. |
(b) | Net income in 2014 includes charges of $88 million, net of tax, related to the Spin-off and $47 million, net of tax, related to our strategic changes to our manufacturing footprint (see Note 3, “Spin-related Transition Costs and Sale of Exam Glove Facility”) and $8 million, net of tax, related to post Spin-Off transition charges. |
21 | ||
As of December 31, | |||||||||||||||||||
2015 | 2014 | 2013 | 2012 | 2011 | |||||||||||||||
Balance Sheet Data: | |||||||||||||||||||
Cash | $ | 129.5 | $ | 149.0 | $ | 44.1 | $ | 47.9 | $ | 20.1 | |||||||||
Property, Plant and Equipment, Net | 279.5 | 277.8 | 324.9 | 325.7 | 320.0 | ||||||||||||||
Total Assets | 2,000.2 | 2,517.9 | 2,484.0 | 2,534.2 | 2,509.5 | ||||||||||||||
Debt | 578.1 | 626.5 | 11.9 | 75.9 | 100.0 | ||||||||||||||
Stockholders’ equity | 1,055.3 | 1,491.2 | — | — | — | ||||||||||||||
Kimberly-Clark’s Net Investment | — | — | 2,098.7 | 2,045.6 | 2,000.9 | ||||||||||||||
22 | ||
ITEM 7. | MANAGEMENT’S DISCUSSION AND ANALYSIS OF FINANCIAL CONDITION AND RESULTS OF OPERATIONS |
Introduction
Halyard is a global company which seeks to advance health and healthcare by preventing infection, eliminating pain and speeding recovery. Our products and solutions are designed to address some of today’s most important healthcare needs, namely, preventing infection and reducing the use of narcotics while helping patients move from surgery to recovery. We market and support the efficacy, safety and economic benefit of our products with a significant body of clinical evidence. We have two business segments: Surgical and Infection Prevention (“S&IP”) and Medical Devices.
This management’s discussion and analysis is intended to provide investors with an understanding of our recent performance, financial condition and prospects and should be read in conjunction with the consolidated financial statements contained in Item 8, “Financial Statements and Supplementary Data” in this annual report on Form 10-K. This management’s discussion and analysis represents the global operations of Halyard and its subsidiaries as an independent publicly-traded company following our spin-off from Kimberly-Clark (the “Spin-off”), and a combined reporting entity comprising the financial position, results of operations and cash flows of Kimberly-Clark’s Health Care business prior to the Spin-off. The results of operations of our business after the Spin-off are significantly different than the results of operations of our business prior to the Spin-off. This difference results from, among other things, the impact of debt incurred, the impact of our operating as a separate, stand-alone public company, and the impact of, and transactions contemplated by, the various agreements between us and Kimberly-Clark. The following will be discussed and analyzed:
• | Overview of Business |
• | Goodwill Impairment |
• | Spin-Related Transition Costs and Sale of Exam Glove Facility |
• | Results of Operations and Related Information |
• | Unaudited Quarterly Data |
• | Liquidity and Capital Resources |
• | Critical Accounting Policies and Use of Estimates |
• | Legal Matters |
• | Information Concerning Forward Looking Statements |
Overview of Business
During 2015, our results were driven by challenges in the S&IP business partially offset by growth in our Medical Devices business. Our S&IP business experienced a number of challenges during 2015, resulting in a sales decline of 10%. This decline in sales is primarily the result of unfavorable currency exchange rates, lower volumes and pricing pressure due to an increasingly competitive market intensity in exam gloves and sterilization wrap, which are two of the three largest product categories within the S&IP business. While we have renewed important supply contracts and have improved our exam glove sales pipeline, we anticipate that pricing pressure due to the competitive market will continue into 2016. Consequently, during our annual goodwill impairment test conducted in the third quarter, we determined that the fair value of our S&IP business declined and caused us to recognize an impairment charge which is discussed further under “Goodwill Impairment” below and in Note 2 to the Consolidated Financial Statements in Item 8 of this report.
Our Medical Devices business experienced an increase in net sales in 2015 led primarily by strong growth of COOLIEF in our interventional pain business. Our digestive health product category experienced global volume growth primarily in line with overall market growth and secured some market share gain. Our respiratory health product category experienced growth in North America and Europe, Middle East and Africa (“EMEA”) which was in line with overall market growth.
Goodwill Impairment
In 2014, upon completion of our goodwill impairment test, we concluded that the fair value for our S&IP reporting unit exceeded its carrying value by approximately 6%. During the course of 2015, the S&IP reporting unit experienced a gradually more challenging competitive landscape, which resulted in price erosion, particularly in the exam glove category, and lower
23 | ||
volumes and some market share loss in other S&IP categories. Changes in commodities costs, the competitive landscape and the resulting price erosion have caused us to revise our expectations with regard to future performance for the S&IP reporting unit and have adversely impacted its fair value. Consequently, we concluded that the carrying value of the S&IP reporting unit’s net assets exceeded its fair value. Accordingly, we completed the second step of the goodwill impairment test to determine the impairment amount, as discussed further below.
The fair value of our S&IP reporting unit was estimated using a combination of income (discounted cash flow analysis) and market approaches. The income approach is dependent upon several assumptions regarding future periods, including assumptions with respect to future sales growth, commodity costs and a terminal growth rate. In addition, a weighted average cost of capital (“WACC”) was used to discount future estimated cash flows to their present values. The WACC was based on externally observable data considering market participants’ cost of equity and debt, optimal capital structure and risk factors specific to our company. The market approach estimated the fair value of our business based on comparable publicly-traded companies in our industry.
The second step of the goodwill impairment test involved performing a hypothetical purchase price allocation to determine the implied fair value of our S&IP reporting unit’s goodwill (“Step 2”). This process was complex and required judgment in the development of assumptions that affected the determination of the fair value of the S&IP reporting unit’s individual assets and liabilities, including previously unrecognized intangible assets. Upon completion of Step 2, the amount by which the carrying value of the S&IP reporting unit’s goodwill exceeded its implied fair value was $474 million and was recognized as an impairment loss for the year ended December 31, 2015 in the accompanying consolidated income statement as “Goodwill impairment.” This goodwill impairment does not impact our business operations, compliance with debt covenants or cash flows.
Spin-Related Transition Costs and Sale of Exam Glove Facility
Our Spin-off from Kimberly-Clark was completed on October 31, 2014. As a result of the Spin-off, we made changes to our plant and equipment, primarily in North America to align with our manufacturing requirements. These changes include modifications to certain equipment and the movement of healthcare equipment from Kimberly-Clark locations to Halyard facilities.
We are undertaking efforts to ensure our customers transition from the Kimberly-Clark brand to our Halyard-branded products. We have entered into a royalty agreement under which we have access to use the Kimberly-Clark brand for up to 24 months from the Spin-off date as we manage the packaging changes with global regulatory bodies. Royalties are required to be paid for products sold bearing the Kimberly-Clark brand only. In addition to royalty expense, we expect to incur costs for packaging, marketing and regulatory approval in order to complete this transition.
While building our own capabilities as a stand-alone company, we have entered into transition service agreements with Kimberly-Clark to provide temporary supporting services until we have the necessary resources and infrastructure in place. As of December 31, 2015, we have successfully exited nearly all of our transition service agreements with Kimberly-Clark.
In the year ended December 31, 2015, we incurred $42 million of expenses, net of the gain described below, and from the Spin-off through December 31, 2014, we incurred $12 million of expenses related to the above activities.
In December 2014, we entered into a definitive agreement to sell an exam glove manufacturing facility to a third party and received advance cash payments of $8 million before the end of 2014, which were included in “Accrued Expenses” in the accompanying consolidated balance sheet as of December 31, 2014. We received the remaining $8 million of the sale price when the sale closed in January 2015. The sale resulted in a net gain of $12 million, which was recorded in “Other income, net” in the accompanying consolidated income statement for the year ended December 31, 2015. There were no remaining accrued expenses related to this plan as of December 31, 2015 or 2014. In the year ended December 31, 2014, we recognized $60 million of charges consisting of non-cash asset impairment of $42 million, accelerated depreciation of $13 million and workforce reduction and other exit cash costs of $5 million.
Results of Operations and Related Information
This section presents a discussion and analysis of our net sales, operating profit and other information relevant to an understanding of our results of operations. This discussion and analysis compares 2015 results to 2014 results, and 2014 to 2013.
24 | ||
Net Sales
Year Ended December 31, | |||||||||||||||||
(in millions) | 2015 | 2014 | Change | 2013 | Change | ||||||||||||
Business Segment | |||||||||||||||||
Surgical and Infection Prevention | $ | 1,030.2 | $ | 1,139.3 | (9.6 | )% | $ | 1,153.1 | (1.2 | )% | |||||||
Medical Devices | 509.5 | 501.7 | 1.6 | 499.0 | 0.5 | ||||||||||||
Corporate and Other | 34.7 | 31.1 | N.M. | 25.4 | N.M. | ||||||||||||
Total Net Sales | $ | 1,574.4 | $ | 1,672.1 | (5.8 | )% | $ | 1,677.5 | (0.3 | )% | |||||||
Percentage Change
Changes Due To | ||||||||||||||
2015 vs. 2014 | Total | Volume(a) | Pricing / Mix | Currency | Other(b) | |||||||||
Consolidated | (6 | )% | (1 | )% | (1 | )% | (3 | )% | (1 | )% | ||||
S&IP | (10 | ) | (3 | ) | (2 | ) | (3 | ) | (2 | ) | ||||
Medical Devices | 2 | 3 | — | (1 | ) | — | ||||||||
2014 vs. 2013 | ||||||||||||||
Consolidated | — | % | 2 | % | (1 | )% | (1 | )% | — | % | ||||
S&IP | (1 | ) | 1 | (1 | ) | (1 | ) | — | ||||||
Medical Devices | 1 | 2 | (1 | ) | — | — | ||||||||
______________________________
(a) Volume excludes changes in sales volume to Kimberly-Clark.
(b) Other includes changes in sales volume to Kimberly-Clark and rounding.
N.M. - Not meaningful
Net Sales by Segment - 2015 Compared to 2014
Net sales declined 6% to $1.6 billion compared to $1.7 billion in 2014 due to unfavorable currency exchange rates and lower pricing and volume resulting from an increasingly competitive environment in the S&IP segment. This decline was partially offset by higher volume in the Medical Devices segment.
Surgical and Infection Prevention
S&IP net sales declined 10% to $1.0 billion compared to $1.1 billion in 2014. This decline was due to unfavorable currency exchange rates, lower pricing and volume particularly for exam gloves and sterilization wrap due to competitive pressure, and lower volume in facial protection and protective apparel primarily due to pandemic-related sales in 2014.
Medical Devices
Medical Devices net sales increased 2% to $510 million compared to $502 million in 2014 primarily due to higher volume in interventional pain due to healthy sales growth of COOLIEF, as well as growth in digestive health. The impacts were partially offset by lower volume in surgical pain and unfavorable currency exchange rates.
Net Sales by Segment - 2014 Compared to 2013
Full-year 2014 net sales of $1.7 billion were even compared to 2013 as volume growth of 2% was offset by the impact of price and unfavorable changes in currency exchange rates.
Surgical and Infection Prevention
S&IP net sales decreased 1% to $1.1 billion, compared to net sales of $1.2 billion in the prior year driven by lower pricing across the majority of our categories and net unfavorable changes in currency exchange rates primarily in Asia Pacific and Latin America. These impacts were partially offset by volume growth in facial protection, sterilization and surgical drapes and gowns.
25 | ||
Medical Devices
Net sales of Medical Devices increased 1% to $502 million compared to $499 million in the prior year driven by volume growth in digestive health, respiratory health and interventional pain management partially offset by lower selling prices in digestive health and respiratory health and net unfavorable changes in currency exchange rates due to the weakening of the Australian dollar and the Japanese yen.
Year Ended December 31, | |||||||||||||||||
(in millions) | 2015 | 2014 | Change | 2013 | Change | ||||||||||||
Geography | |||||||||||||||||
North America | $ | 1,193.9 | $ | 1,218.5 | (2.0 | )% | $ | 1,202.4 | 1.3 | % | |||||||
EMEA | 197.4 | 234.9 | (16.0 | ) | 251.8 | (6.7 | ) | ||||||||||
Asia Pacific and Latin America | 183.1 | 218.7 | (16.3 | ) | 223.3 | (2.1 | ) | ||||||||||
Total Net Sales | $ | 1,574.4 | $ | 1,672.1 | (5.8 | )% | $ | 1,677.5 | (0.4 | )% | |||||||
Net Sales by Geographic Region - 2015 Compared to 2014
Net sales in North America decreased by 2% compared to 2014 primarily due to lower S&IP volume in surgical drapes and gowns and apparel and unfavorable pricing in exam gloves, partially offset by higher Medical Devices volume in interventional pain and digestive health.
Net sales in EMEA decreased by 16% compared to 2014 primarily due to unfavorable currency exchange rates and lower S&IP volume in surgical drapes and gowns partially offset by higher Medical Devices volume in digestive health.
In Asia Pacific and Latin America, net sales decreased by 16% compared to 2014 driven by unfavorable currency exchange rates, lower S&IP volume in surgical drapes and gowns and sterilization, unfavorable pricing in surgical drapes and gowns and exam gloves partially offset by higher exam glove volume.
Net Sales by Geographic Region - 2014 Compared to 2013
Net sales in North America were up 1% compared to 2013 driven primarily by S&IP volume gains in facial protection, sterilization wrap and surgical drapes and gowns and Medical Devices volume gains in interventional pain management, digestive health and respiratory health. This was partially offset by lower selling prices in S&IP primarily in sterilization wrap and exam gloves and lower Medical Devices selling prices for respiratory health and digestive health.
In EMEA, net sales decreased 7% driven primarily by lower S&IP volume for exam gloves and surgical drapes and gowns, lower Medical Devices volume in surgical pain and lower selling prices for respiratory health and surgical pain. This was partially offset by increased S&IP volume in facial protection, Medical Devices volume in digestive health and favorable currency exchange rates driven primarily by the strengthening of the euro relative to the U.S. dollar.
In Asia Pacific and Latin America, net sales decreased 2% driven by unfavorable currency exchange rates due primarily to the weakening Australian dollar and the Japanese yen relative to the U.S. dollar. This was partially offset by increased demand for S&IP products primarily in surgical drapes and gowns, sterilization wrap and exam gloves and Medical Devices volume in surgical pain and increased selling prices.
26 | ||
Operating (Loss) Profit
Year Ended December 31, | |||||||||||||||||
2015 | 2014 | Change | 2013 | Change | |||||||||||||
Business Segment | |||||||||||||||||
Surgical and Infection Prevention | $ | 98.4 | $ | 166.3 | (40.8 | )% | $ | 151.2 | 10.0 | % | |||||||
Medical Devices | 107.8 | 104.6 | 3.1 | 85.6 | 22.2 | ||||||||||||
Corporate and Other(a)(b) | (105.4 | ) | (180.4 | ) | N.M. | (13.9 | ) | N.M. | |||||||||
Goodwill impairment | (474.0 | ) | — | N.M. | — | N.M. | |||||||||||
Other (expense) and income, net(c) | (4.5 | ) | 3.8 | N.M. | 2.4 | N.M. | |||||||||||
Total Operating (Loss) Profit | $ | (377.7 | ) | $ | 94.3 | N.M. | $ | 225.3 | (58.1 | )% | |||||||
______________________________
(a) | Corporate and Other includes spin-related transition costs of $54 million for the year ended December 31, 2015. |
(b) | Corporate & Other includes $60 million associated with the exit of our exam glove manufacturing facility in Thailand, $89 million of transaction costs associated with the Spin-off and $12 million of transition-related costs incurred following the Spin-off for the year ended December 31, 2014. |
(c) | Other (expense) income for the year ended December 31, 2015 includes $17 million related to legal expenses and litigation partially offset by a gain on the sale of an exam glove facility in Thailand of $12 million. |
N.M. - Not meaningful.
Operating (Loss) Profit - 2015 Compared to 2014
Total
The operating loss in 2015 was driven by a $474 million goodwill impairment charge and continued net spin-related transition costs of $42 million. Goodwill impairment is described under “Goodwill Impairment” above and in Note 2 to the Consolidated Financial Statements in Item 8 of this report and transition costs are described under “Spin-Related Transition Costs and Sale of Exam Glove Facility” above and in Note 3 to the Consolidated Financial Statements in Item 8 of this report. We expect transition costs primarily related to rebranding, including royalties paid to Kimberly-Clark to continue into 2016. In the prior year, “Corporate and Other” included charges of $60 million related to the exit from our glove manufacturing facility in Thailand, $89 million of pre-spin transaction charges associated with the Spin-off and incremental transition expenses of $12 million following the Spin-off.
Surgical and Infection Prevention
Operating profit in the S&IP business was 41% lower than the prior year primarily due to the pricing and volume challenges noted in the discussion of net sales along with unfavorable currency exchange rates and higher general expenses related to operating as a stand-alone company partially offset by favorable raw materials pricing, primarily for oil-based polymers.
Medical Devices
Operating profit in the Medical Devices business was 3% higher than the prior year primarily due to higher volume, manufacturing cost savings and lower general expenses related to lower intangible asset amortization expense partially offset by expenses related to operating as a stand-alone company.
Operating Profit - 2014 Compared to 2013
Operating profit was $94 million versus $225 million in 2013. Operating profit in 2014 was impacted by Corporate and Other charges of $60 million associated with the exit from our glove manufacturing facility in Thailand, $89 million of transaction-related charges associated with the Spin-off and $12 million of transition-related incremental expenses following the Spin-off.
Surgical and Infection Prevention
Operating profit was $166 million compared to $151 million in 2013, an increase of 10% primarily due to improved supply chain costs, a reduction in selling and general expenses mainly due to a strategic reorganization which led to headcount reductions in the fourth quarter of 2013.
27 | ||
Medical Devices
Operating profit was $105 million compared to $86 million in 2013, an increase of 22% primarily due to a reduction in selling and general expenses largely from decreased legal expenses and improved supply chain costs.
Interest Income and Expense
Interest income was not material in the year ended December 31, 2015 and $3 million in each of the years ended December 31, 2014 and 2013, respectively.
Interest expense was $33 million in 2015 compared to $6 million in 2014 and consisted primarily of interest expense, amortization of debt discount and amortization of deferred financing fees on our senior unsecured notes and our senior secured term loan. Interest in 2015 reflects a full year of interest expense compared to two months of expense last year as the debt was issued in the fourth quarter of 2014. See Item 8, Note 6, “Long-Term Debt” for further discussion of our indebtedness. Interest expense was not significant in 2013.
Provision for Income Taxes
The provision for income taxes was $16 million in 2015 compared to $64 million in 2014. Our effective tax rate was (4)% in 2015 driven by goodwill impairment. Our effective tax rate was 70% in 2014 due to spin-related foreign cash repatriation and non-deductible transaction costs. The provision for income taxes was $73 million in 2013 and the effective tax rate was 32%.
Unaudited Quarterly Data
2015 | 2014 | ||||||||||||||||||||||||||||||
(in millions, except per-share amounts) | Fourth | Third | Second | First | Fourth | Third | Second | First | |||||||||||||||||||||||
Net sales | $ | 401.4 | $ | 389.5 | $ | 389.3 | $ | 394.2 | $ | 439.4 | $ | 408.5 | $ | 413.5 | $ | 410.7 | |||||||||||||||
Gross profit | 133.6 | 131.0 | 134.9 | 132.1 | 156.5 | 132.2 | 104.9 | 155.0 | |||||||||||||||||||||||
Operating profit (loss)(a)(b)(c)(d) | 20.5 | (461.2 | ) | 22.1 | 40.9 | 24.0 | 13.1 | (4.5 | ) | 61.7 | |||||||||||||||||||||
Net income (loss) | 14.5 | (470.5 | ) | 8.0 | 21.7 | (2.4 | ) | (7.4 | ) | (4.5 | ) | 41.4 | |||||||||||||||||||
Basic earnings per share | $ | 0.31 | $ | (10.10 | ) | $ | 0.17 | $ | 0.47 | $ | (0.05 | ) | $ | (0.16 | ) | $ | (0.10 | ) | $ | 0.89 | |||||||||||
Diluted earnings per share | $ | 0.31 | $ | (10.10 | ) | $ | 0.17 | $ | 0.46 | $ | (0.05 | ) | $ | (0.16 | ) | $ | (0.10 | ) | $ | 0.89 | |||||||||||
______________________________
(a) | Operating profit (loss) in 2015 include $42 million of net spin-related transition costs. The spin-related charges on a quarterly basis were a net gain of $1 million in the first quarter, $20 million in the second quarter, $16 million in the third quarter and $7 million in the fourth quarter. |
(b) | Operating loss in the third quarter of 2015 includes an estimated goodwill impairment charge of $476 million. See Note 2, “Goodwill Impairment,” in Item 8 of this report. The goodwill impairment charge was reduced by $2 million when the goodwill impairment analysis was completed in the fourth quarter of 2015. |
(c) | Operating profit (loss) in 2014 include $89 million of pre-spin transaction charges. The pre-spin transaction charges on a quarterly basis were $7 million in the first quarter, $19 million in the second quarter, $35 million in the third quarter and $28 million in the fourth quarter. In addition, post-spin transition charges were $12 million in the fourth quarter of 2014. |
(d) | Operating loss in the second quarter of 2014 includes $49 million of charges related to the disposal of one of our exam glove facilities in Thailand. Additional charges related to the disposal of $6 million were recognized in the third quarter and $5 million were recognized in the fourth quarter. A $12 million gain on the final sale of the facility was recognized in the first quarter of 2015. |
Liquidity and Capital Resources
General
Our primary sources of liquidity are cash on hand provided from operating activities and amounts available under our revolving credit facility. Prior to the Spin-off, Kimberly-Clark provided financing, cash management and other treasury services to us and we received funding from Kimberly-Clark for most of our operating and investing cash needs.
We believe that our ability to generate cash from operations and our capacity to issue short-term and long-term debt are adequate to fund working capital, capital spending and other needs for the foreseeable future. Further, we do not expect restrictions or taxes on repatriation of cash held outside of the United States to have a material effect on our overall liquidity, financial condition or results of operations for the foreseeable future.
28 | ||
Operating Activities
Cash provided by operating activities decreased to $98 million in 2015 compared to $148 million in 2014 primarily due to lower net income, excluding goodwill and asset impairments, and net cash used by operating assets and liabilities.
Cash provided by operating activities was $148 million in 2014 compared to $224 million in 2013 with the decrease primarily due to lower net income partially offset by cash provided by changes in operating assets and liabilities.
Investing Activities
During 2015, investing activities used $63 million compared to $71 million used in 2014. Capital expenditures were $70 million in 2015 compared to $79 million in 2014.
During 2014, our cash used in investing activities was $71 million compared to $51 million in 2013. Capital expenditures in 2014 were $79 million compared to $49 million in 2013. The increase in capital expenditures was primarily related to the separation from Kimberly-Clark and associated with modifying facilities necessary to operate as a stand-alone company.
Financing Activities
Financing activities used $51 million in 2015, which consisted primarily of debt repayments as described below. Financing activities provided $29 million in 2014, consisting primarily of debt proceeds and contributions from Kimberly-Clark partially offset by the Spin-off cash distribution to Kimberly-Clark.
During 2014, financing activities provided $29 million compared to $180 million used by financing activities in 2013, consisting primarily of transfers to Kimberly-Clark and debt repayments.
Senior Secured Term Loan and Revolving Credit Facility
In the year ended December 31, 2014, we entered into a credit agreement establishing credit facilities in aggregate principal amount of $640 million, including a five-year senior secured revolving credit facility allowing borrowings of up to $250 million, with a letter of credit sub-facility in an amount of $75 million and a swingline sub-facility in an amount of $25 million (the “Revolving Credit Facility”), and a seven-year senior secured term loan of $390 million (the “Term Loan Facility” and together with the Revolving Credit Facility, the “Senior Credit Facilities”). The Term Loan Facility is secured by substantially all of our assets located in the United States and a certain percentage of our foreign subsidiaries’ capital stock. In conjunction with the Senior Credit Facilities, we paid $12 million in financing fees that were deferred and are being amortized to interest expense over the life of the credit agreement using the effective interest method.
In the year ended December 31, 2015, we made $51 million of principal payments on our senior secured term loan, including a $50 million prepayment without penalties pursuant to the terms of the Term Loan Facility. In conjunction with the prepayment, we recognized a charge of $1 million for the write-off of related debt issuance costs and original issue discount and the remaining balance of the senior secured term loan is due at maturity. Following this principal payment, quarterly amortization payments are no longer required for the senior secured term loan.
Borrowings under the Term Loan Facility bear interest, at Halyard’s option, at either (i) a reserve-adjusted London Interbank Offer Rate (“LIBOR”) rate, subject to a floor of 0.75%, plus 3.25%, or (ii) a base rate, subject to a floor of 0.75%, (calculated as the greatest of (1) the prime rate, (2) the U.S. federal funds effective rate plus 0.50% and (3) the one month LIBOR rate plus 1.00%) plus 2.25%. As of December 31, 2015, the interest rate in effect for the Term Loan Facility was 4.00%.
Borrowings under the Revolving Credit Facility will bear interest, at Halyard’s option, at either (i) a reserve-adjusted LIBOR rate, plus a margin ranging between 1.75% to 2.50% per annum, depending on Halyard’s consolidated total leverage ratio, or (ii) the base rate plus a margin ranging between 0.75% to 1.50% per annum, depending on Halyard’s consolidated total leverage ratio. The unused portion of Halyard’s Revolving Credit Facility will be subject to a commitment fee equal to (i) 0.25% per annum, when Halyard’s consolidated total leverage ratio is less than 2.25 to 1.00 and (ii) 0.40% per annum, otherwise.
Senior Unsecured Notes
In the year ended December 31, 2014, we issued $250 million of senior unsecured notes (the “Notes”). The Notes will mature on October 15, 2022 and interest accrues at a rate of 6.25% per annum and is payable semi-annually in arrears on April 15 and October 15 of each year.
During the year ended December 31, 2015, we completed an exchange of our senior unsecured notes (the “Old Notes”) for senior unsecured notes (the “New Notes” and collectively with the Old Notes, the “Notes”) that were registered under the
29 | ||
Securities Act of 1933, as amended (the “Securities Act”). The terms of the New Notes are substantially identical to the terms of the Old Notes, except that the New Notes are registered under the Securities Act and are not subject to the transfer restrictions and registration rights relating to the Old Notes.
As of December 31, 2015, the balances on our senior secured term loan and our senior unsecured notes were $332 million and $246 million, respectively. As of December 31, 2014, the balances on our senior secured term loan and our senior unsecured notes were $381 million and $245 million, respectively. For further information regarding our debt arrangements, see Item 8, Note 6, “Debt.”
Obligations
The following table presents our total contractual obligations for which cash flows are fixed or determinable as of December 31, 2015 (in millions):
Payments Due by Period | |||||||||||||||||||
Total | Less than 1 Year | 1-3 Years | 3-5 Years | More than 5 Years | |||||||||||||||
Debt | $ | 589.0 | $ | — | $ | — | $ | — | $ | 589.0 | |||||||||
Interest payments on long-term debt | 189.6 | 29.4 | 58.7 | 58.8 | 42.7 | ||||||||||||||
Operating leases | 106.3 | 14.0 | 26.2 | 17.8 | 48.3 | ||||||||||||||
Open purchase orders(a) | 212.2 | 210.2 | 1.5 | 0.5 | — | ||||||||||||||
Pension obligations | 7.7 | 0.5 | 0.2 | 0.6 | 6.4 | ||||||||||||||
Other commitments(b) | 28.0 | 5.1 | 5.6 | 4.7 | 12.6 | ||||||||||||||
Total contractual obligations | $ | 1,132.8 | $ | 259.2 | $ | 92.2 | $ | 82.4 | $ | 699.0 | |||||||||
______________________________
(a) | The open purchase orders displayed in the table represent amounts that we anticipate will become payable within the next year for goods and services that we have negotiated for delivery. The table does not include payments that are discretionary or for which timing is uncertain. |
(b) | Other commitments includes uncertain tax positions of $2 million. See Item 8, Note 7, “Income Taxes.” |
Critical Accounting Policies and Use of Estimates
The preparation of financial statements in conformity with accounting principles generally accepted in the United States of America requires management to make estimates and assumptions that affect the reported amounts of assets and liabilities at the date of the financial statements and the reported amounts of net sales and expenses during the reporting period. The critical accounting policies we used in the preparation of the consolidated and combined financial statements are those that are important both to the presentation of our financial condition and results of operations and require significant judgments by management with regard to estimates used. The critical judgments by management relate to distributor rebate accruals, future cash flows associated with impairment testing for goodwill and long-lived assets, loss contingencies and deferred income taxes and potential tax assessments.
Recently Adopted and Issued Pronouncements
See “Accounting Policies” in Note 1 to the consolidated financial statements in Item 8 of this report for recently adopted and recently issued accounting pronouncements.
Use of Estimates
We prepare our consolidated financial statements in accordance with GAAP, which requires that we make estimates and assumptions that affect the reported amounts of assets and liabilities at the date of the financial statements and the reported amounts of net sales and expenses during the reporting periods. Estimates are used in accounting for, among other things, distributor rebate accruals, future cash flows associated with impairment testing for goodwill and long-lived assets, loss contingencies, and deferred tax assets and potential income tax assessments. Actual results could differ from these estimates, and the effect of the change could be material to our financial statements. Changes in these estimates are recorded when known.
Revenue Recognition and Accounts Receivable
Sales revenue is recognized at the time of product shipment or delivery, depending on when title passes, to unaffiliated customers, and when all of the following have occurred: evidence of a sales arrangement is in place, pricing is fixed or determinable, and collection is reasonably assured. Sales are reported net of returns, rebates and freight allowed. Distributor
30 | ||
rebates are estimated based on the historical cost difference between list prices and average end user contract prices and the quantity of products expected to be sold to specific end users. We maintain liabilities at the end of each period for the estimated rebate costs incurred but unpaid for these programs. Differences between estimated and actual rebate costs are normally not material and are recognized in earnings in the period such differences are determined. Rebate accruals were $74 million and $82 million as of December 31, 2015 and 2014, respectively. Taxes imposed by governmental authorities on our revenue-producing activities with customers, such as sales taxes and value-added taxes, are excluded from net sales.
Goodwill and Other Intangible Assets
Goodwill is tested for impairment annually and whenever events and circumstances indicate that impairment may have occurred. For 2015, we completed the required annual testing of goodwill for impairment for all reporting units using the beginning of the third quarter of 2015 as the measurement date. For our Medical Devices reporting unit, we determined that there was no impairment because the fair value of the Medical Devices reporting unit substantially exceeded the carrying value of its net assets. For the S&IP reporting unit, the fair value of its net assets was below the carrying value. Consequently, after performing Step 2 of the impairment test, we recorded an impairment charge. See Note 2, “Goodwill” to the Consolidated Financial Statements in Item 8 of this report for further discussion.
The evaluation of goodwill involves comparing the current fair value of each reporting unit to its carrying value, including goodwill. We used a combination of income and market approaches to estimate the current fair value of our reporting units. The fair value determination utilized key assumptions regarding the growth of the business and stand-alone public company corporate and ongoing costs, each of which required management judgment, including estimated future sales volumes, selling prices and costs, changes in working capital and investments in property and equipment. These assumptions and estimates were based upon our historical experience and projections of future activity. In addition, the selection of the discount rate used to determine fair value was based upon a market participant’s view considering current market rates and our current cost of financing. There can be no assurance that the assumptions and estimates made for purposes of the annual goodwill impairment test will prove to be accurate. Volatility in the equity and debt markets, or increases in interest rates, could result in a higher discount rate. Changes in sales volumes, selling prices and costs of goods sold, additional stand-alone public company costs, and increases in interest rates could cause changes in our forecasted cash flows. Unfavorable changes in any of the factors described above could result in a goodwill impairment charge in the future.
As of December 31, 2015 we had no indefinite-lived intangible assets. As of December 31, 2014, we had intangible assets with indefinite useful lives of $7 million related to acquired in-process research and development efforts that were completed during 2015. Accordingly we began amortizing this balance over a period of 10 years.
At December 31, 2015, we had intangible assets with finite useful lives with a gross carrying amount of $331 million and a net carrying amount of $83 million. These intangibles are being amortized over their estimated useful lives and are tested for impairment whenever events or circumstances indicate that impairment may have occurred. If the carrying amount of an intangible asset is not recoverable based on estimated future undiscounted cash flows, an impairment loss would be indicated. The amount of the impairment loss to be recorded would be based on the excess of the carrying amount of the intangible asset over its fair value (based on discounted future cash flows). Judgment is used in assessing whether the carrying amount of intangible assets is not expected to be recoverable over their estimated remaining useful lives. The factors considered are similar to those outlined in the goodwill impairment discussion above.
Loss Contingencies
The outcome of loss contingencies and legal proceedings and claims brought against us is subject to uncertainty. An estimated loss contingency is accrued by a charge to earnings if it is probable that an asset has been impaired or a liability has been incurred and the amount can be reasonably estimated. Determination of whether to accrue a loss requires evaluation of the probability of an unfavorable outcome and the ability to make a reasonable estimate. Changes in these estimates could affect the timing and amount of accrual of loss contingencies.
Income Taxes
We recognize tax benefits in our financial statements when our uncertain tax positions are more likely than not to be sustained upon audit. The amount we recognize is measured as the largest amount of benefit that is greater than 50% likely of being realized upon ultimate settlement.
We recognize deferred tax assets for deductible temporary differences, operating loss carry-forwards and tax credit carry-forwards. We record valuation allowances to reduce deferred tax assets to amounts that are more likely than not to be realized.
31 | ||
In assessing the need for a valuation allowance, we consider both positive and negative evidence related to the likelihood of realization of the deferred tax assets. The weight given to the positive and negative evidence is commensurate with the extent to which the evidence may be objectively verified. As such, it is generally difficult for positive evidence regarding projected future taxable income exclusive of reversing taxable temporary differences to outweigh objective negative evidence of recent financial reporting losses. This assessment, which is completed on a taxing jurisdiction basis, takes into account a number of types of evidence, including the nature, frequency, and severity of current and cumulative financial reporting losses, sources of future taxable income, taxable income in prior carryback year(s) and tax planning strategies.
If it is determined that we would be able to realize deferred tax assets in the future in excess of our net recorded amount, an adjustment to the net deferred tax asset would increase income in the period that such determination was made. Likewise, should we determine that we would not be able to realize all or part of the net deferred tax assets in the future, an adjustment to the net deferred tax asset would decrease income in the period such determination was made. We regularly evaluate the need for valuation allowances against its deferred tax assets.
Prior to the Spin-off, for purposes of the consolidated financial statements, our operations were included in Kimberly-Clark’s consolidated U.S. federal and state income tax returns and some of its foreign income tax returns. The provision for income taxes and related deferred tax balances were estimated as if we filed income tax returns on a stand-alone basis separate from Kimberly-Clark. As a stand-alone entity, our deferred taxes and effective tax rate may differ from those in the historical periods.
Legal Matters
We are subject to various legal proceedings, claims and governmental inspections, audits or investigations pertaining to issues such as contract disputes, product liability, tax matters, patents and trademarks, advertising, governmental regulations, employment and other matters, including the matters described below. Under the terms of the distribution agreement we entered into with Kimberly-Clark prior to the Spin-off, legal proceedings, claims and other liabilities that are primarily related to our business are our responsibility and we are obligated to indemnify and hold Kimberly-Clark harmless for such matters (“Indemnification Obligation”). For the year ended December 31, 2015, we have incurred $17 million related to these matters.
The only exception to the Indemnification Obligation relates to the pain pump litigation referenced in this paragraph. We are one of several manufacturers of continuous infusion medical devices, such as our ON-Q PAINBUSTER pain pumps, that are involved in several different pending or threatened litigation matters from multiple plaintiffs alleging that use of the continuous infusion device to deliver anesthetics directly into a synovial joint after surgery resulted in postarthroscopic glenohumeral chondrolysis, or a disintegration of the cartilage covering the bones in the joint (typically, in the shoulder). Plaintiffs generally seek monetary damages and attorneys’ fees. While Kimberly-Clark is retaining the liabilities related to these matters, the distribution agreement between us and Kimberly-Clark provides that we will indemnify Kimberly-Clark for any such claims or causes of actions arising after the Spin-off.
We have an Indemnification Obligation for, and have assumed the defense of, the matter styled Shahinian, et al. v. Kimberly-Clark Corporation, et al., No. 2:14-cv-08390-DMG-SH (C.D. Cal.), filed on October 29, 2014. In that case, the plaintiff brings a putative nationwide class action asserting claims for common law fraud (affirmative misrepresentation and fraudulent concealment), negligent misrepresentation, and violation of California’s Unfair Competition Law in connection with our marketing and sale of MicroCool surgical gowns. On February 6, 2015, we moved to dismiss the complaint on multiple grounds. On July 10, 2015, the Court issued an order on the motion to dismiss, dismissing the negligent misrepresentation claim but permitting the remaining claims to stand and proceed to discovery. On December 11, 2015, the plaintiff filed a second amended complaint that added additional plaintiffs in California, Texas and Rhode Island, named Halyard Health, Inc. as an additional defendant, and extend the timeframe for the lawsuit to include products sold after the Spin-off through December 2015. The parties are currently engaged in discovery. We intend to continue our vigorous defense of the matter.
In June 2015, we were served with a subpoena from the Department of Veterans Affairs Office of the Inspector General (“VA OIG”) seeking information related to the design, manufacture, testing, sale and promotion of MicroCool and other Company surgical gowns, and, in July 2015, also became aware that the subpoena and an earlier VA OIG subpoena served on Kimberly-Clark requesting information about gown sales to the federal government are related to a United States Department of Justice (“DOJ”) investigation. We could be subject to litigation relating to this investigation, by either governmental agencies or private parties. If a claim is asserted against Kimberly-Clark relating to MicroCool gowns or other Company surgical gowns, we expect that such a claim would give rise to an Indemnification Obligation under the distribution agreement with Kimberly-Clark. The Company is cooperating with the VA OIG’s request and the DOJ investigation.
32 | ||
We operate in an industry characterized by extensive patent litigation and competitors may claim that our products infringe upon their intellectual property. Resolution of patent litigation or other intellectual property claims is typically time consuming and costly and can result in significant damage awards and injunctions that could prevent the manufacture and sale of the affected products or require us to make significant royalty payments in order to continue selling the affected products. At any given time we are involved as either a plaintiff or a defendant in a number of patent infringement actions, the outcomes of which may not be known for prolonged periods of time.
Although the results of litigation and claims cannot be predicted with certainty, we believe that the ultimate disposition of these matters, to the extent not previously provided for, will not have a material adverse effect, individually or in the aggregate, on our business, financial condition, results of operations or liquidity.
We are subject to federal, state and local environmental protection laws and regulations with respect to our business operations and are operating in compliance with, or taking action aimed at ensuring compliance with, these laws and regulations. None of our compliance obligations with environmental protection laws and regulations, individually or in the aggregate, is expected to have a material adverse effect on our business, financial condition, results of operations or liquidity.
Information Concerning Forward-Looking Statements
This annual report on Form 10-K and other materials we have filed or furnished or will file or furnish with the SEC (as well as information included in our oral or other written statements) contain, or will contain, certain “forward-looking statements,” within the meaning of the Private Securities Litigation Reform Act of 1995, regarding business strategies, market potential, future financial performance and other matters. Forward-looking statements include all statements that do not relate solely to historical or current facts, and can generally be identified by the use of words such as “may,” “believe,” “will,” “expect,” “project,” “estimate,” “anticipate,” “plan” or “continue” and similar expressions, among others. These forward-looking statements address, among other things, the anticipated effects of the separation and Spin-off. The matters discussed in these forward-looking statements are based on the current plans and expectations of our management and are subject to certain risks and uncertainties that could cause actual results to differ materially from those projected, anticipated or implied in the forward-looking statements. These factors include, but are not limited to:
• | general economic conditions particularly in the United States, |
• | fluctuations in global equity and fixed-income markets, |
• | the competitive environment, |
• | the loss of current customers or the inability to obtain new customers, |
• | price fluctuations in key commodities, |
• | fluctuations in currency exchange rates, |
• | disruption in supply of raw materials or the distribution of finished goods, |
• | changes in governmental regulations that are applicable to our business, |
• | changes in asset valuations including write-downs of assets such as inventory, accounts receivable or other assets for impairment or other reasons, and |
• | the other matters described under “Risk Factors” and “Management’s Discussion and Analysis of Financial Condition and Results of Operations.” |
Where, in any forward-looking statement, an expectation or belief as to future results or events is expressed, such expectation or belief is based on the current plans and expectations of our management and expressed in good faith and believed to have a reasonable basis, but there can be no assurance that the expectation or belief will result or be achieved or accomplished.
ITEM 7A. | QUANTITATIVE AND QUALITATIVE DISCLOSURES ABOUT MARKET RISK |
We are exposed to risks such as changes in foreign currency exchange rates and commodity prices. A variety of practices are employed to manage these risks, including derivative instruments where deemed appropriate. Derivative instruments are used only for risk management purposes and not for speculation. All foreign currency derivative instruments are entered into with major financial institutions. Our credit exposure under these arrangements is limited to agreements with a positive fair value at the reporting date. Credit risk with respect to the counterparties is actively monitored but is not considered significant.
33 | ||
Presented below is a description of our risk together with a sensitivity analysis, performed annually, based on selected changes in market rates and prices. These analyses reflect management’s view of changes which are reasonably possible to occur over a one-year period. Also included is a description of our commodity price risk.
Foreign Currency Risk
Foreign currency risk is managed by the systematic use of foreign currency forward and swap contracts for a limited portion of our exposure. The use of these instruments allows the management of transactional exposures to exchange rate fluctuations because the gains or losses incurred on the derivative instruments will offset, in whole or in part, losses or gains on the underlying foreign currency exposure.
Foreign currency contracts and transactional exposures are sensitive to changes in foreign currency exchange rates. An annual test is performed to quantify the effects that possible changes in foreign currency exchange rates would have on annual operating profit based on our foreign currency contracts and transactional exposures at the current year-end. The balance sheet effect is calculated by multiplying each affiliate’s net monetary asset or liability position by a 10% change in the foreign currency exchange rate versus the U.S. dollar. The results of these sensitivity tests are presented in the following paragraph.
As of December 31, 2015, a 10% unfavorable change in the exchange rate of the U.S. dollar against the prevailing market rates of foreign currencies involving balance sheet transactional exposures would have an effect of $4 million to our consolidated financial position, results of operations or cash flows. These hypothetical losses on transactional exposures are based on the difference between the December 31, 2015 rates and the assumed rates.
The translation of the balance sheets of non-U.S. operations from local currencies into U.S. dollars is also sensitive to changes in foreign currency exchange rates. Consequently, an annual test is performed to determine if changes in currency exchange rates would have a significant effect on the translation of the balance sheets of non-U.S. operations into U.S. dollars. These translation gains or losses are recorded as unrealized translation adjustments (“UTA”) within stockholders’ equity. The hypothetical change in UTA is calculated by multiplying the net assets of these non-U.S. operations by a 10% change in the currency exchange rates.
As of December 31, 2015, a 10% unfavorable change in the exchange rate of the U.S. dollar against the prevailing market rates of our foreign currency translation exposures would have reduced stockholders’ equity by approximately $17 million. These hypothetical adjustments in UTA are based on the difference between the December 31, 2015 exchange rates and the assumed rates. In the view of management, the above UTA adjustments resulting from these assumed changes in foreign currency exchange rates are not material to our consolidated financial position because they would not affect our cash flow.
Commodity Price Risk
We are subject to commodity price risk, the most significant of which relates to the price of polypropylene and nitrile. As previously discussed under “Risk Factors,” increases in commodities prices could adversely affect our earnings if selling prices are not adjusted or if such adjustments significantly trail the increases in commodities prices.
Our energy, manufacturing and transportation costs are affected by various market factors including the availability of supplies of particular forms of energy, energy prices and local and national regulatory decisions. As previously discussed in “Risk Factors,” there can be no assurance we will be fully protected against substantial changes in the price or availability of energy sources. In addition, we are subject to price risk for utilities and manufacturing inputs, which are used in our manufacturing operations.
Interest Rate Risk
Our Senior Secured Term Loan with a remaining face value of $339 million is subject to a variable interest rate based on LIBOR, subject to a floor of 0.75%. As of December 31, 2015, a one percentage point increase in LIBOR would result in $3 million of incremental interest expense.
34 | ||
ITEM 8. | FINANCIAL STATEMENTS AND SUPPLEMENTARY DATA |
HALYARD HEALTH, INC. AND SUBSIDIARIES
CONSOLIDATED INCOME STATEMENT
(in millions, except per share amounts)
Year Ended December 31, | |||||||||||
2015 | 2014 | 2013 | |||||||||
Net Sales (including related party sales in 2014 and 2013 of $78.7 and $91.3, respectively) | $ | 1,574.4 | $ | 1,672.1 | $ | 1,677.5 | |||||
Cost of products sold (including related party purchases in 2014 and 2013 of $72.5 and $82.8, respectively | 1,042.8 | 1,123.5 | 1,065.3 | ||||||||
Gross Profit | 531.6 | 548.6 | 612.2 | ||||||||
Research and development | 32.3 | 33.6 | 37.9 | ||||||||
Selling and general expenses | 398.5 | 424.5 | 351.4 | ||||||||
Goodwill impairment | 474.0 | — | — | ||||||||
Other expense and (income), net | 4.5 | (3.8 | ) | (2.4 | ) | ||||||
Operating (Loss) Profit | (377.7 | ) | 94.3 | 225.3 | |||||||
Interest income | 0.3 | 2.9 | 2.6 | ||||||||
Interest expense | (33.1 | ) | (6.0 | ) | (0.1 | ) | |||||
(Loss) Income Before Income Taxes | (410.5 | ) | 91.2 | 227.8 | |||||||
Provision for income taxes | (15.8 | ) | (64.1 | ) | (73.2 | ) | |||||
Net (Loss) Income | $ | (426.3 | ) | $ | 27.1 | $ | 154.6 | ||||
Per Share Basis | |||||||||||
Basic | $ | (9.15 | ) | $ | 0.58 | $ | 3.32 | ||||
Diluted | $ | (9.15 | ) | $ | 0.58 | $ | 3.32 | ||||
See Notes to the Consolidated Financial Statements.
35 | ||
HALYARD HEALTH, INC. AND SUBSIDIARIES
CONSOLIDATED STATEMENT OF COMPREHENSIVE (LOSS) INCOME
(in millions)
Year Ended December 31, | |||||||||||
2015 | 2014 | 2013 | |||||||||
Net (Loss) Income | $ | (426.3 | ) | $ | 27.1 | $ | 154.6 | ||||
Other Comprehensive Income (Loss), Net of Tax | |||||||||||
Defined benefit plans | (1.3 | ) | (0.4 | ) | — | ||||||
Unrealized currency translation adjustments | (22.1 | ) | (14.0 | ) | (22.6 | ) | |||||
Cash flow hedges | (0.7 | ) | 3.6 | (7.1 | ) | ||||||
Total Other Comprehensive Loss, Net of Tax | (24.1 | ) | (10.8 | ) | (29.7 | ) | |||||
Comprehensive (Loss) Income | $ | (450.4 | ) | $ | 16.3 | $ | 124.9 | ||||
See Notes to the Consolidated Financial Statements.
36 | ||
HALYARD HEALTH, INC. AND SUBSIDIARIES
CONSOLIDATED BALANCE SHEET
(in millions, except share data)
Year Ended December 31, | |||||||
2015 | 2014 | ||||||
ASSETS | |||||||
Current Assets | |||||||
Cash and cash equivalents | $ | 129.5 | $ | 149.0 | |||
Accounts receivable, net of allowances | 224.7 | 233.9 | |||||
Inventories | 303.2 | 283.1 | |||||
Prepaid and other current assets | 18.6 | 15.5 | |||||
Current deferred income taxes | — | 2.1 | |||||
Total Current Assets | 676.0 | 683.6 | |||||
Property, Plant and Equipment, net | 279.5 | 277.8 | |||||
Assets Held for Sale | — | 2.6 | |||||
Goodwill | 945.2 | 1,426.1 | |||||
Other Intangible Assets, net | 82.6 | 108.3 | |||||
Deferred Tax Assets | 14.9 | 17.3 | |||||
Other Assets | 2.0 | 2.2 | |||||
TOTAL ASSETS | $ | 2,000.2 | $ | 2,517.9 | |||
LIABILITIES AND STOCKHOLDERS’ EQUITY | |||||||
Current Liabilities | |||||||
Debt payable within one year | $ | — | $ | 3.9 | |||
Trade accounts payable | 163.2 | 168.7 | |||||
Accrued expenses | 152.0 | 183.4 | |||||
Total Current Liabilities | 315.2 | 356.0 | |||||
Long-Term Debt | 578.1 | 622.6 | |||||
Deferred Tax Liabilities | 23.8 | 27.9 | |||||
Other Long-Term Liabilities | 27.8 | 20.2 | |||||
Total Liabilities | 944.9 | 1,026.7 | |||||
Commitments and Contingencies | |||||||
Stockholders’ Equity | |||||||
Preferred stock - $0.01 par value - authorized 20,000,000 shares, none issued | — | — | |||||
Common stock - $0.01 par value - authorized 300,000,000 shares, 46,614,947 outstanding at December 31, 2015 and 46,535,951 outstanding at December 31, 2014 | 0.5 | 0.5 | |||||
Additional paid-in capital | 1,518.0 | 1,502.5 | |||||
(Accumulated deficit) Retained earnings | (419.0 | ) | 7.3 | ||||
Treasury stock | (1.0 | ) | — | ||||
Accumulated other comprehensive loss | (43.2 | ) | (19.1 | ) | |||
Total Stockholders’ Equity | 1,055.3 | 1,491.2 | |||||
TOTAL LIABILITIES AND STOCKHOLDERS’ EQUITY | $ | 2,000.2 | $ | 2,517.9 | |||
See Notes to the Consolidated Financial Statements.
37 | ||
HALYARD HEALTH, INC. AND SUBSIDIARIES
CONSOLIDATED STATEMENT OF STOCKHOLDERS’ EQUITY
(in millions, shares in thousands)
Common Stock Issued | Additional Paid-in Capital | Kimberly-Clark’s Net Investment | Retained Earnings (Accumulated Deficit) | Treasury Stock | Accumulated Other Comprehensive Income (Loss) | Total Stockholders’ Equity | |||||||||||||||||||||||||||
Shares | Amount | Shares | Amount | ||||||||||||||||||||||||||||||
Balance at December 31, 2012 | — | $ | — | $ | — | $ | 2,045.6 | $ | — | — | $ | — | $ | 10.1 | $ | 2,055.7 | |||||||||||||||||
Net income | — | — | — | 154.6 | — | — | — | — | 154.6 | ||||||||||||||||||||||||
Change in Kimberly-Clark’s investment, net | — | — | — | (101.5 | ) | — | — | — | — | (101.5 | ) | ||||||||||||||||||||||
Other comprehensive loss, net of tax | — | — | — | — | — | — | — | (29.7 | ) | (29.7 | ) | ||||||||||||||||||||||
Balance at December 31, 2013 | — | — | — | 2,098.7 | — | — | — | (19.6 | ) | 2,079.1 | |||||||||||||||||||||||
Net income | — | — | — | 19.8 | 7.3 | — | — | — | 27.1 | ||||||||||||||||||||||||
Change in Kimberly-Clark’s investment, net | — | — | — | 61.9 | — | — | — | 11.3 | 73.2 | ||||||||||||||||||||||||
Spin-off cash distribution to Kimberly-Clark | — | — | — | (680.0 | ) | — | — | — | — | (680.0 | ) | ||||||||||||||||||||||
Issuance of common stock and consummation of Spin-off | 46,536 | 0.5 | 1,499.9 | (1,500.4 | ) | — | — | — | — | — | |||||||||||||||||||||||
Stock-based compensation expense | — | — | 2.6 | — | — | — | — | — | 2.6 | ||||||||||||||||||||||||
Other comprehensive loss, net of tax | — | — | — | — | — | — | — | (10.8 | ) | (10.8 | ) | ||||||||||||||||||||||
Balance at December 31, 2014 | 46,536 | 0.5 | 1,502.5 | — | 7.3 | — | — | (19.1 | ) | 1,491.2 | |||||||||||||||||||||||
Net loss | — | — | — | — | (426.3 | ) | — | — | — | (426.3 | ) | ||||||||||||||||||||||
Issuance of common stock upon the exercise or redemption of share-based awards | 79 | — | 1.4 | — | — | — | — | — | 1.4 | ||||||||||||||||||||||||
Stock-based compensation expense | — | — | 14.1 | — | — | — | — | — | 14.1 | ||||||||||||||||||||||||
Purchases of treasury stock | — | — | — | — | — | 21 | (1.0 | ) | — | (1.0 | ) | ||||||||||||||||||||||
Other comprehensive loss, net of tax | (24.1 | ) | (24.1 | ) | |||||||||||||||||||||||||||||
Balance at December 31, 2015 | 46,615 | $ | 0.5 | $ | 1,518.0 | $ | — | $ | (419.0 | ) | 21 | $ | (1.0 | ) | $ | (43.2 | ) | $ | 1,055.3 | ||||||||||||||
See Notes to the Consolidated Financial Statements.
38 | ||
HALYARD HEALTH, INC. AND SUBSIDIARIES
CONSOLIDATED CASH FLOW STATEMENT
(in millions)
Year Ended December 31, | |||||||||||
2015 | 2014 | 2013 | |||||||||
Operating Activities | |||||||||||
Net (loss) income | $ | (426.3 | ) | $ | 27.1 | $ | 154.6 | ||||
Depreciation and amortization | 65.4 | 85.4 | 69.2 | ||||||||
Share-based compensation | 14.1 | 7.9 | 6.0 | ||||||||
Goodwill impairment | 474.0 | — | — | ||||||||
Asset impairment | — | 41.9 | — | ||||||||
Net (gains) losses on asset dispositions | (6.7 | ) | 6.7 | 3.4 | |||||||
Changes in operating assets and liabilities, net of acquisition | |||||||||||
Accounts receivable | 9.0 | 15.1 | (19.5 | ) | |||||||
Inventories | (20.2 | ) | (2.9 | ) | 14.3 | ||||||
Prepaid expenses and other assets | (6.0 | ) | (4.8 | ) | 2.0 | ||||||
Accounts payable | 14.7 | 4.5 | 15.1 | ||||||||
Accrued expenses | (14.5 | ) | 0.9 | (23.8 | ) | ||||||
Deferred income taxes and other | (5.9 | ) | (33.9 | ) | 2.5 | ||||||
Cash Provided by Operating Activities | 97.6 | 147.9 | 223.8 | ||||||||
Investing Activities | |||||||||||
Capital expenditures | (70.4 | ) | (78.5 | ) | (49.0 | ) | |||||
Cash outflows for acquisitions | — | — | (2.2 | ) | |||||||
Proceeds from dispositions of property | 7.8 | 7.8 | 0.3 | ||||||||
Cash Used in Investing Activities | (62.6 | ) | (70.7 | ) | (50.9 | ) | |||||
Financing Activities | |||||||||||
Debt proceeds | — | 638.0 | 4.0 | ||||||||
Debt issuance costs | — | (11.8 | ) | — | |||||||
Debt repayments | (51.0 | ) | (13.8 | ) | (67.9 | ) | |||||
Purchase of treasury stock | (1.0 | ) | — | — | |||||||
Proceeds and excess tax benefits from the exercise of stock options | 1.4 | — | — | ||||||||
Spin-off cash distribution to Kimberly-Clark | — | (680.0 | ) | — | |||||||
Net transfers from (to) Kimberly-Clark | — | 93.3 | (119.3 | ) | |||||||
Other | — | 3.5 | 3.2 | ||||||||
Cash (Used in) Provided by Financing Activities | (50.6 | ) | 29.2 | (180.0 | ) | ||||||
Effect of Exchange Rate Changes on Cash and Cash Equivalents | (3.9 | ) | (1.5 | ) | 3.3 | ||||||
Increase (Decrease) in Cash and Cash Equivalents | (19.5 | ) | 104.9 | (3.8 | ) | ||||||
Cash and Cash Equivalents - Beginning of Year | 149.0 | 44.1 | 47.9 | ||||||||
Cash and Cash Equivalents - End of Year | $ | 129.5 | $ | 149.0 | $ | 44.1 | |||||
Supplemental Cash Flow Disclosure: | |||||||||||
Cash paid for income taxes | $ | 43.3 | $ | 87.6 | $ | 74.2 | |||||
Cash paid for interest | $ | 32.6 | $ | — | $ | — | |||||
Supplemental Noncash Disclosure | |||||||||||
Capital expenditures included in accounts payable or accrued expenses | $ | 5.6 | $ | 21.5 | $ | — | |||||
See Notes to the Consolidated Financial Statements.
39 | ||
HALYARD HEALTH, INC. AND SUBSIDIARIES
NOTES TO THE CONSOLIDATED FINANCIAL STATEMENTS
Note 1. Accounting Policies
Background and Basis of Presentation
Halyard Health, Inc. is a global business which seeks to advance health and healthcare by preventing infection, eliminating pain and speeding recovery. Our products and solutions are designed to address some of today’s most important healthcare needs, namely, preventing infections and reducing the use of narcotics while helping patients move from surgery to recovery. We market and support the efficacy, safety and economic benefit of our products with a significant body of clinical evidence. We operate in two business segments: Surgical and Infection Prevention (“S&IP”) and Medical Devices.
References to “Halyard,” “we,” “our” and “us” refer to Halyard Health, Inc. and its consolidated subsidiaries, and references to “Kimberly-Clark” mean Kimberly-Clark Corporation, a Delaware corporation, and its subsidiaries, unless the context otherwise requires.
In November 2013, Kimberly-Clark announced its intention to evaluate a potential tax-free spin-off of its healthcare business (the “Spin-off”). Halyard Health, Inc. was incorporated in Delaware on February 25, 2014 for the purpose of holding the healthcare business following the separation. The Spin-off was completed on October 31, 2014 and Kimberly-Clark’s healthcare business became Halyard Health, Inc. See Note 3, “Spin-Off Transition Costs and Sale of Exam Glove Facility” for further discussion.
The consolidated financial statements as of and for the year ended December 31, 2015 represent our financial position, results of operations and cash flows as an independent publicly-traded company. The consolidated financial statements represent our financial position, results of operations and cash flows as an independent publicly-traded company beginning on November 1, 2014, and a combined reporting entity comprising the financial position, results of operations and cash flows of Kimberly-Clark’s healthcare business prior to November 1, 2014. The consolidated financial statements have been prepared in conformity with accounting principles generally accepted in the United States of America (“GAAP”). Certain prior period amounts have been revised to conform to current presentation.
For periods prior to the Spin-off, our consolidated and combined financial statements include certain expenses of Kimberly-Clark which were allocated to us for certain administrative functions. The total amount allocated was approximately $74 million through the Spin-off date in 2014 and $95 million in 2013. See Note 15, “Related Party Transactions,” for additional information. Following the Spin-off, Kimberly-Clark provided many of these services on a transitional basis for a fee. See Note 3, “Spin-Off Transition Costs and Sale of Exam Glove Facility.”
Prior to the Spin-off, eligible employees participated in benefit plans sponsored by Kimberly-Clark including defined benefit pension plans, postretirement healthcare plans and defined contribution plans. However, our consolidated balance sheet does not include any Kimberly-Clark net benefit plan obligations or Kimberly-Clark equity related to the stock-based compensation programs. Any benefit plan net liabilities that are our direct obligation, such as certain pension and post-retirement plans, are reflected in our consolidated balance sheet as well as within our operating expenses. See Note 8, “Employee Benefit Plans” and Note 10, “Stock-Based Compensation” for further description of these defined benefit and stock-based compensation programs.
For periods prior to the Spin-off, cash transferred to and from Kimberly-Clark is presented as net transfers to or from Kimberly-Clark in the accompanying consolidated cash flow statements.
Principles of Consolidation
The consolidated financial statements include our net assets and results of our operations and cash flows as described above. All intercompany transactions and accounts after the Spin-off within our consolidated businesses have been eliminated. Prior to the Spin-off, the consolidated and combined financial statements were prepared on a stand-alone basis derived from Kimberly-Clark’s consolidated financial statements and accounting records.
Prior to the Spin-off, all intercompany transactions between Kimberly-Clark and us have been included in the combined financial statements. Intercompany transactions with Kimberly-Clark or its affiliates are reflected in the prior years’ combined cash flow statements as net transfers to or from Kimberly-Clark within financing activities.
40 | ||
Use of Estimates
We prepare our consolidated financial statements in accordance with GAAP, which requires that we make estimates and assumptions that affect the reported amounts of assets and liabilities at the date of the financial statements and the reported amounts of net sales and expenses during the reporting periods. Estimates are used in accounting for, among other things, distributor rebate accruals, future cash flows associated with impairment testing for goodwill and long-lived assets, loss contingencies, and deferred tax assets and potential income tax assessments. Actual results could differ from these estimates, and the effect of the change could be material to our financial statements. Changes in these estimates are recorded when known.
Cash Equivalents
Cash equivalents are short-term investments with an original maturity date of three months or less.
Inventories and Distribution Costs
Most U.S. inventories are valued at the lower of cost, using the Last-In, First-Out (“LIFO”) method, or market. The balance of the U.S. and non-U.S. inventories are valued at the lower of cost (determined on the First-In, First-Out (“FIFO”) or weighted-average cost methods) or market. Distribution costs are classified as cost of products sold.
Property, Plant and Equipment and Depreciation
Property, plant and equipment are stated at cost and depreciated on the straight-line method. Buildings are depreciated over their estimated useful lives, primarily 40 years. Machinery and equipment are depreciated over their estimated useful lives, primarily ranging from 16 to 20 years. Leasehold improvements are depreciated over the assets’ estimated useful lives, or the remaining lease term, whichever is shorter. Purchases of computer software, including external costs and certain internal costs (including payroll and payroll-related costs of employees) directly associated with developing significant computer software applications for internal use, are capitalized. Computer software costs are amortized on the straight-line method over the estimated useful life of the software, which is generally three to five years. Depreciation expense is recorded in cost of products sold, research and development and selling and general expenses.
Estimated useful lives are periodically reviewed, and when warranted, changes are made to them. Long-lived assets are reviewed for impairment whenever events or changes in circumstances indicate that their carrying amount may not be recoverable. An impairment loss would be indicated when estimated undiscounted future cash flows from the use and eventual disposition of an asset group, which are identifiable and largely independent of the cash flows of other asset groups, are less than the carrying amount of the asset group. Measurement of an impairment loss would be based on the excess of the carrying amount of the asset group over its fair value. Fair value is measured using discounted cash flows or independent appraisals, as appropriate. When property is sold or retired, the cost of the property and the related accumulated depreciation are removed from the consolidated balance sheet and any gain or loss on the transaction is included in income.
Goodwill and Other Intangible Assets
Goodwill is tested for impairment annually and whenever events and circumstances indicate that impairment may have occurred. For 2015, we completed the required annual testing of goodwill for impairment for all reporting units using the beginning of the third quarter of 2015 as the measurement date. For our Medical Devices reporting unit, we determined that there was no impairment because the fair value of the Medical Devices reporting unit substantially exceeded the carrying value of its net assets. For the S&IP reporting unit, the fair value of its net assets was below the carrying value. Consequently, after performing Step 2 of the impairment test, we recorded an impairment charge, which is discussed in further detail in Note 2, “Goodwill.”
The evaluation of goodwill involves comparing the current fair value of each reporting unit to its carrying value, including goodwill. We used a combination of income and market approaches to estimate the current fair value of our reporting units. The fair value determination utilized key assumptions regarding the growth of the business and stand-alone public company corporate and ongoing costs, each of which required management judgment, including estimated future sales volumes, selling prices and costs, changes in working capital and investments in property and equipment. These assumptions and estimates were based upon our historical experience and projections of future activity. In addition, the selection of the discount rate used to determine fair value was based upon a market participant’s view considering current market rates and our current cost of financing. There can be no assurance that the assumptions and estimates made for purposes of the annual goodwill impairment test will prove to be accurate. Volatility in the equity and debt markets, or increases in interest rates, could result in a higher discount rate. Changes in sales volumes, selling prices and costs of goods sold, additional stand-alone public company costs,
41 | ||
and increases in interest rates could cause changes in our forecasted cash flows. Unfavorable changes in any of the factors described above could result in a goodwill impairment charge in the future.
Intangible assets with finite lives are amortized over their estimated useful lives and reviewed for impairment whenever events or changes in circumstances indicate that their carrying amount may not be recoverable. Estimated useful lives range from 7 to 30 years for trademarks, 7 to 17 years for patents and acquired technologies, and 2 to 16 years for other intangible assets. An impairment loss would be indicated when estimated undiscounted future cash flows from the use of the asset are less than its carrying amount. An impairment loss would be measured as the difference between the fair value (based on discounted future cash flows) and the carrying amount of the asset.
Revenue Recognition and Accounts Receivable
Sales revenue is recognized at the time of product shipment or delivery, depending on when title passes, to unaffiliated customers, and when all of the following have occurred: evidence of a sales arrangement is in place, pricing is fixed or determinable, and collection is reasonably assured. Sales are reported net of returns, rebates and freight allowed. Distributor rebates are estimated based on the historical cost difference between list prices and average end user contract prices and the quantity of products expected to be sold to specific end users. We maintain liabilities at the end of each period for the estimated rebate costs incurred but unpaid for these programs. Differences between estimated and actual rebate costs are normally not material and are recognized in earnings in the period such differences are determined. Taxes imposed by governmental authorities on our revenue-producing activities with customers, such as sales taxes and value-added taxes, are excluded from net sales.
Net sales to one customer accounted for 18%, 19% and 19%, respectively, of net sales in 2015, 2014 and 2013. No other customer accounted for more than 10% of net sales in any of the periods presented herein. As of December 31, 2015 and 2014, we had zero and three customers, respectively, who individually accounted for more than 10% of our consolidated accounts receivable balance.
The allowances for doubtful accounts, sales discounts and returns were $2 million and $1 million as of December 31, 2015 and 2014, respectively. The provision for doubtful account was not material for the years ended December 31, 2015, 2014 and 2013.
Related Party Sales
Prior to the Spin-off, sales to other Kimberly-Clark subsidiaries and affiliates of supplies and other finished products have been reflected as related party sales in our combined financial statements. These sales have historically been transacted under cost-plus pricing arrangements, which is consistent with Kimberly-Clark’s global transfer pricing policies. We entered into manufacturing and supply agreements with Kimberly-Clark prior to the Spin-off pursuant to which we or Kimberly-Clark, as the case may be, manufacture, label and package products for the other party. The manufacturing and supply agreements replaced our historical intercompany arrangements and reflect new pricing. Following the Spin-off, such sales are reflected as third party sales.
Foreign Currency Translation
The income statements of foreign operations are translated into U.S. dollars at rates of exchange in effect each month. Prior to the Spin-off, the balance sheets of these operations are translated at period-end exchange rates, and the differences from historical exchange rates are reflected in invested equity as unrealized translation adjustments. Following the Spin-off, the differences from historical exchange rates are reflected as unrealized translation adjustments in other comprehensive income.
Derivative Instruments and Hedging
All derivative instruments are recorded as assets or liabilities on the balance sheet at fair value. Changes in the fair value of derivatives are either recorded in the income statement or other comprehensive income, as appropriate. The effective portion of the gain or loss on derivatives designated as cash flow hedges is included in other comprehensive income in the period that changes in fair value occur, and is reclassified to income in the same period that the hedged item affects income. Any ineffective portion of cash flow hedges is immediately recognized in income. Certain foreign-currency derivative instruments not designated as hedging instruments have been entered into to manage a portion of our foreign currency transactional exposures. The gain or loss on these derivatives is included in income in the period that changes in their fair values occur. Our policies allow the use of derivatives for risk management purposes and prohibit their use for speculation. Our policies also prohibit the use of any leveraged derivative instrument. Consistent with our policies, foreign currency derivative instruments are entered into with major financial institutions. At inception we formally designate certain derivatives as cash flow hedges
42 | ||
and establish how the effectiveness of these hedges will be assessed and measured. This process links the derivatives to the transactions they are hedging. See Note 12, “Derivative Financial Instruments,” for disclosures about derivative instruments and hedging activities.
Research and Development
Research and development expenses are expensed as incurred. Research and development expenses consist primarily of salaries and related expenses for personnel, product trial costs, outside laboratory and license fees, the costs of laboratory equipment and facilities and asset write-offs for equipment that does not reach success in product manufacturing certifications.
Stock-Based Compensation
We have a stock-based Equity Participation Plan and an Outside Directors’ Compensation Plan that provide for awards of stock options, stock appreciation rights, restricted stock (and in certain limited cases, unrestricted stock), restricted stock units, performance units and cash awards to eligible employees (including officers who are employees), directors, advisors and consultants. Stock-based compensation is initially measured at the fair value of the awards on the grant date and is recognized in the financial statements over the period the employees are required to provide services in exchange for the awards. The fair value of option awards is measured on the grant date using a Black-Scholes option-pricing model. The fair value of performance-based restricted share awards is based on the Halyard stock price at the grant date and the assessed probability of meeting future performance targets. Prior to the Spin-off, stock-based compensation expense was allocated to us based on the awards and terms previously granted to our employees under Kimberly-Clark’s stock-based compensation plans. See Note 10, “Stock-Based Compensation.”
Income Taxes
We account for income taxes under the asset and liability method of accounting, which requires the recognition of deferred tax assets and liabilities for the expected future tax consequences of temporary differences between the carrying amounts and the tax bases of assets and liabilities. Under this method, changes in tax rates and laws are recognized in income in the period such changes are enacted. The provision for federal, state, and foreign income taxes is calculated on income before income taxes based on current tax law and includes the cumulative effect of any changes in tax rates from those used previously in determining deferred tax assets and liabilities. Such provision differs from the amounts currently payable because certain items of income and expense are recognized in different reporting periods for financial reporting purposes than for income tax purposes. Recording the provision for income taxes requires management to make significant judgments and estimates for matters whose ultimate resolution may not become known until the final resolution of an examination by the Internal Revenue Service (IRS) or state and foreign agencies. If it is more likely than not that some portion, or all, of a deferred tax asset will not be realized, a valuation allowance is recognized.
Recording liabilities for uncertain tax positions involves judgment in evaluating our tax positions and developing the best estimate of the taxes ultimately expected to be paid. We include any related tax penalties and interest in income tax expense.
Prior to the Spin-off, our income taxes were calculated on a separate tax return basis, although operations have been included in Kimberly-Clark’s U.S. federal, state and foreign tax returns. Our income tax results as presented were not necessarily indicative of future performance and did not necessarily reflect the results that we would have generated as an independent publicly-traded company for the periods presented.
Employee Defined Benefit Plans
We recognize the funded status of our defined benefit as an asset or a liability on our balance sheet. Actuarial gains or losses are a component of our other comprehensive income, which is then included in our accumulated other comprehensive income. Pension expenses are recognized over the period in which the employee renders service and becomes eligible to receive benefits. We make assumptions (including the discount rate and expected rate of return on plan assets) in computing the pension expense and obligations.
Recently Adopted Pronouncements
In November 2015, the FASB issued ASU No. 2015-17, Balance Sheet Classification of Deferred Taxes. This ASU simplifies the balance sheet presentation of deferred taxes by requiring noncurrent presentation of deferred tax assets and liabilities. This ASU is effective for fiscal years and interim periods within those fiscal years beginning after December 15, 2016. Early adoption is permitted. We elected to adopt this ASU prospectively for the year ended December 31, 2015. Adoption did not have a material effect on our financial position, results of operations or cash flows.
43 | ||
In April 2015, the FASB issued ASU No. 2015-03, Simplifying the Presentation of Debt Issuance Costs. This ASU addresses the different balance sheet presentation requirements for debt issuance costs, discounts and premiums under the FASB ASC Subtopic 835-30, Interest - Imputation of Interest. Currently, GAAP recognizes debt issuance costs as a deferred charge (i.e., an asset), which conflicts with FASB Concepts Statement No. 6, Elements of Financial Statements, which says that debt issuance costs are similar to debt discounts and reduce the proceeds of borrowing, thereby increasing the effective interest rate. Accordingly, ASU No. 2015-03 requires that debt issuance costs related to a recognized debt liability be presented in the balance sheet as a direct deduction from the carrying amount of that debt liability, consistent with debt discounts. This ASU will become effective for fiscal years, and interim periods within those fiscal years, beginning after December 15, 2015. Early adoption will be permitted for financial statements that have not been previously issued. We elected to adopt this ASU as of December 31, 2015. Accordingly, the prior year consolidated balance sheet has been revised to reflect the treatment of $10 million of deferred financing costs as a reduction of long-term debt. These deferred financing costs were formerly included in prepaid and other current assets and other assets in the consolidated balance sheet as of December 31, 2014.
Recently Issued Pronouncements
In January 2016, the Financial Accounting Standards Board (“FASB”) issued Accounting Standards Update (“ASU”) No. 2016-01, Recognition and Measurement of Financial Assets and Liabilities. This ASU requires equity investments, except those accounted for under the equity method or those that result in consolidation of the equity investee, to be measured at fair value with changes in fair value recognized in net income. However, equity investments without readily determinable fair values may be measured at cost less impairment, if any, plus or minus changes resulting from observable price changes in orderly transactions for identical or similar investments in the same issuer. In addition, this ASU provides for a qualitative impairment assessment for equity investments that do not have readily determinable fair values. This ASU also clarifies that entities should evaluate the need for a valuation allowance on a deferred tax asset related to available-for-sale securities in combination with the entity’s other deferred tax assets. This ASU should be applied by means of a cumulative-effect adjustment to the balance sheet as of the beginning of the fiscal year of adoption. The provisions related to equity investments that do not have readily determinable fair values should be applied prospectively to such equity investments that exist as of the date of adoption. This ASU will be effective for fiscal years, and interim periods within those fiscal years beginning after December 15, 2017. Early adoption of this ASU is permitted. The impact of this ASU on our financial position, results of operations and cash flows are not yet known.
In April 2015, the Financial Accounting Standards Board (“FASB”) issued Accounting Standards Update (“ASU”) No. 2015-05, Customer’s Accounting for Fees Paid in a Cloud Computing Arrangement. This ASU provides guidance about whether a cloud computing arrangement includes a software license and the appropriate accounting for such arrangements. Notably, the guidance in this ASU already exists in the FASB Accounting Standards Codification (“ASC”) Subtopic 985-605, Software - Revenue Recognition, which is used by cloud service providers to determine whether an arrangement includes the sale or license of software. This ASU will become effective for fiscal years, and interim periods within those fiscal years, beginning after December 15, 2015. Early adoption of this ASU is permitted. The application of this ASU is not expected to have a material effect on our financial position, results of operations or cash flows.
In January 2015, the FASB issued ASU No. 2015-01, Simplifying Income Statement Presentation by Eliminating the Concept of Extraordinary Items. ASU No. 2015-01 eliminates ASC Subtopic 225-20, Income Statement - Extraordinary and Unusual Items, which, until now, required that an entity separately classify, present, and disclose transactions and events that were determined to be both unusual and infrequent as extraordinary items. This ASU is effective for fiscal years, and interim periods within those fiscal years, beginning after December 15, 2015. A reporting entity may apply the amendments (i) prospectively or (ii) retrospectively to all prior periods presented in the financial statements. The application of this ASU is not expected to have a material effect on our financial position, results of operations and cash flows.
In August 2014, the FASB issued ASU 2014-15, Disclosure of Uncertainties About an Entity’s Ability to Continue as a Going Concern, that will require management to assess an entity’s ability to continue as a going concern, and to provide related footnote disclosures in certain circumstances. In connection with each annual and interim period, management will assess if there is substantial doubt about an entity’s ability to continue as a going concern within one year after the issuance date. Substantial doubt exists if it is probable that the entity will be unable to meet its obligations within one year after the issuance date. The new standard defines substantial doubt and provides example indicators. Disclosures will be required if conditions give rise to substantial doubt. However, management will need to assess if its plans will alleviate substantial doubt to determine the specific disclosures. This ASU will become effective for annual periods ending after December 15, 2016. Earlier application
44 | ||
is permitted. The application of this ASU is not expected to have a material effect on our financial position, results of operations and cash flows.
In May 2014, the FASB issued Accounting Standards Update 2014-09, Revenue from Contracts with Customers, which provides a single comprehensive model for entities to use in accounting for revenue arising from contracts with customers and will supersede most current revenue recognition guidance. This ASU is effective for public entities for annual and interim periods beginning after December 15, 2017. Adoption prior to interim periods beginning after December 15, 2016 is not permitted. The guidance permits two implementation approaches, one requiring retrospective application of the new ASU with restatement of prior years and one requiring prospective application of the new ASU with disclosure of results under old standards. The effects of this ASU on our financial position, results of operations and cash flows are not yet known.
Note 2. Goodwill
Surgical and Infection Prevention
We test goodwill for impairment annually (as of July 1) or more frequently whenever events or circumstances more likely than not indicate that the fair value of the reporting unit may be below its carrying amount. In 2014, upon completion of our goodwill impairment test, we concluded that the fair value for our S&IP reporting unit exceeded its carrying value by approximately 6%. During the course of 2015, the S&IP reporting unit experienced a gradually more challenging competitive landscape, which resulted in price erosion, particularly in the exam glove category, and lower volumes and some market share loss in other S&IP categories. Changes in commodities costs, the competitive landscape and the resulting price erosion have caused us to revise our expectations with regard to future performance for the S&IP reporting unit and have adversely impacted the fair value of our S&IP reporting unit. Consequently, we concluded that the carrying value of the S&IP reporting unit’s net assets exceeded its fair value. Accordingly, we completed the second step of the goodwill impairment test to determine the impairment amount, as discussed further below.
The fair value of our S&IP reporting unit was estimated using a combination of income (discounted cash flow analysis) and market approaches. The income approach is dependent upon several assumptions regarding future periods, including assumptions with respect to future sales growth, commodity costs and a terminal growth rate. In addition, a weighted average cost of capital (“WACC”) was used to discount future estimated cash flows to their present values. The WACC was based on externally observable data considering market participants’ cost of equity and debt, optimal capital structure and risk factors specific to our company. The market approach estimated the fair value of our business based on comparable publicly-traded companies in our industry.
The second step of the goodwill impairment test involved performing a hypothetical purchase price allocation to determine the implied fair value of our S&IP reporting unit’s goodwill (“Step 2”). This process is complex and required judgment in the development of assumptions that affected the determination of the fair value of the S&IP reporting unit’s individual assets and liabilities, including previously unrecognized intangible assets. Upon completion of Step 2, the amount by which the carrying value of the S&IP reporting unit’s goodwill exceeded its implied fair value was $474 million and was recognized as an impairment loss for the year ended December 31, 2015 in the accompanying consolidated income statement as “Goodwill impairment.”
Medical Devices
We completed the annual goodwill impairment test for our Medical Devices reporting unit and determined that there was no impairment. The fair value of the Medical Devices reporting unit substantially exceeded the carrying value of its net assets.
45 | ||
The changes in the carrying amount of goodwill by business segment are as follows (in millions):
S&IP | Medical Devices | Consolidated | |||||||||||||||||||||||||
Goodwill | Accumulated Impairment | Goodwill, net | Goodwill | Accumulated Impairment | Goodwill, net | Goodwill, net | |||||||||||||||||||||
Balance at December 31, 2013 | $ | 743.8 | $ | — | $ | 743.8 | $ | 686.3 | $ | — | $ | 686.3 | $ | 1,430.1 | |||||||||||||
Currency changes | 0.7 | — | 0.7 | (4.7 | ) | — | (4.7 | ) | (4.0 | ) | |||||||||||||||||
Balance at December 31, 2014 | 744.5 | — | 744.5 | 681.6 | — | 681.6 | 1,426.1 | ||||||||||||||||||||
Goodwill impairment | — | (474.0 | ) | (474.0 | ) | — | — | — | (474.0 | ) | |||||||||||||||||
Currency changes | (3.7 | ) | — | (3.7 | ) | (3.2 | ) | — | (3.2 | ) | (6.9 | ) | |||||||||||||||
Balance at December 31, 2015 | $ | 740.8 | $ | (474.0 | ) | $ | 266.8 | $ | 678.4 | $ | — | $ | 678.4 | $ | 945.2 | ||||||||||||
Note 3. Spin-Off Transition Costs and Sale of Exam Glove Facility
Completion of the Sale of Disposable Glove Facility
In December 2014, we entered into a definitive agreement to sell an exam glove manufacturing facility to a third party and received advance cash payments of $8 million before the end of 2014, which were included in “Accrued Expenses” in the accompanying consolidated balance sheet as of December 31, 2014. We received the remaining $8 million of the sale price when the sale closed in January 2015. The sale resulted in a net gain of $12 million, which was recorded in “Other income, net” in the accompanying consolidated income statement for the year ended December 31, 2015. There were no remaining accrued expenses related to this plan as of December 31, 2015 or 2014. In the year ended December 31, 2014, we recognized $60 million of charges consisting of non-cash asset impairment of $42 million, accelerated depreciation of $13 million and workforce reduction and other exit cash costs of $5 million.
Manufacturing Alignment, Marketing and Rebranding and Incremental Transition Services from Kimberly-Clark
As a result of the Spin-off, we have made changes to our plant and equipment, primarily in North America to align with our manufacturing requirements. These changes include modifications to certain equipment and the movement of healthcare equipment from Kimberly-Clark locations to Halyard facilities.
We are undertaking efforts to ensure our customers’ transition from the Kimberly-Clark brand to our Halyard-branded products. We have entered into a royalty agreement under which we have access to use the Kimberly-Clark brand for up to 24 months as we manage the packaging changes with global regulatory bodies. Royalties are required to be paid for products sold bearing the Kimberly-Clark brand only. In addition to royalty expense, we expect to incur costs for packaging, marketing and regulatory approval in order to complete this transition.
While building our own capabilities as a stand-alone company, we have entered into transition service agreements with Kimberly-Clark to provide temporary supporting services until we have the necessary resources and infrastructure in place.
Note 4. Supplemental Balance Sheet Information
Accounts Receivable
Accounts receivable consist of the following (in millions):
As of December 31, | |||||||
2015 | 2014 | ||||||
Accounts Receivable | $ | 226.3 | $ | 234.9 | |||
Allowances and doubtful accounts | (1.6 | ) | (1.0 | ) | |||
Accounts receivable, net | $ | 224.7 | $ | 233.9 | |||
46 | ||
Inventories
Inventories at the lower of cost (determined on the LIFO/FIFO or weighted-average cost methods) or market consists of the following (in millions):
As of December 31, | |||||||||||||||||||||||
2015 | 2014 | ||||||||||||||||||||||
LIFO | Non- LIFO | Total | LIFO | Non- LIFO | Total | ||||||||||||||||||
Raw Materials | $ | 49.7 | $ | 1.1 | $ | 50.8 | $ | 48.4 | $ | 1.3 | $ | 49.7 | |||||||||||
Work in process | 46.1 | 0.1 | 46.2 | 47.7 | 0.3 | 48.0 | |||||||||||||||||
Finished goods | 165.8 | 46.3 | 212.1 | 157.8 | 37.5 | 195.3 | |||||||||||||||||
Supplies and other | 0.1 | 11.6 | 11.7 | — | 11.8 | 11.8 | |||||||||||||||||
261.7 | 59.1 | 320.8 | 253.9 | 50.9 | 304.8 | ||||||||||||||||||
Excess of FIFO or weighted-average cost over LIFO cost | (17.6 | ) | — | (17.6 | ) | (21.7 | ) | — | (21.7 | ) | |||||||||||||
Total | $ | 244.1 | $ | 59.1 | $ | 303.2 | $ | 232.2 | $ | 50.9 | $ | 283.1 | |||||||||||
Property, Plant and Equipment
Property, plant and equipment consists of the following (in millions):
As of December 31, | |||||||
2015 | 2014 | ||||||
Land | $ | 2.1 | $ | 2.3 | |||
Buildings and leasehold improvements | 86.7 | 67.9 | |||||
Machinery and equipment | 492.8 | 436.3 | |||||
Construction in progress | 18.3 | 62.2 | |||||
599.9 | 568.7 | ||||||
Less accumulated depreciation | (320.4 | ) | (290.9 | ) | |||
Total | $ | 279.5 | $ | 277.8 | |||
Property, plant and equipment includes $1 million of capitalized interest in each of the years ended December 31, 2015 and 2014. There were $6 million and $22 million of capital expenditures in accounts payable as of December 31, 2015 and 2014, respectively.
As of December 31, 2015 and 2014, we held $173 million and $156 million, respectively, of net property, plant and equipment in the United States.
Depreciation expense was $40 million, $53 million and $40 million, respectively, in the years ended December 31, 2015, 2014 and 2013.
Intangible Assets
Intangible assets subject to amortization consist of the following (in millions):
As of December 31, | ||||||||||||||||||||||||
2015 | 2014 | |||||||||||||||||||||||
Gross Carrying Amount | Accumulated Amortization | Net Carrying Amount | Gross Carrying Amount | Accumulated Amortization | Net Carrying Amount | |||||||||||||||||||
Trademarks | $ | 126.6 | $ | (90.3 | ) | $ | 36.3 | $ | 126.6 | $ | (86.1 | ) | $ | 40.5 | ||||||||||
Patents and acquired technologies | 149.1 | (117.3 | ) | 31.8 | 149.1 | (99.3 | ) | 49.8 | ||||||||||||||||
Other | 55.1 | (40.6 | ) | 14.5 | 48.3 | (37.0 | ) | 11.3 | ||||||||||||||||
Total | $ | 330.8 | $ | (248.2 | ) | $ | 82.6 | $ | 324.0 | $ | (222.4 | ) | $ | 101.6 | ||||||||||
47 | ||
During the year ended December 31, 2015, we began amortizing $7 million of in-process research and development (“IPR&D”) over a period of 10 years. As of December 31, 2014, this IPR&D was considered indefinite-lived and not subject to amortization as the project was not complete.
Amortization expense for intangible assets was $26 million, $32 million and $29 million for the years ended December 31, 2015, 2014 and 2013, respectively. We estimate amortization expense for the next five years and beyond will be as follows (in millions):
For the years ending December 31, | ||||
2016 | $ | 20.9 | ||
2017 | 15.6 | |||
2018 | 11.7 | |||
2019 | 7.6 | |||
2020 | 5.2 | |||
Thereafter | 21.6 | |||
Total | $ | 82.6 | ||
Accrued Expenses
Accrued expenses consist of the following (in millions):
As of December 31, | |||||||
2015 | 2014 | ||||||
Accrued rebates | $ | 73.9 | $ | 82.2 | |||
Accrued salaries and wages | 34.5 | 46.4 | |||||
Accrued taxes - income and other | 15.3 | 23.4 | |||||
Deposit received on pending sale of assets | — | 7.8 | |||||
Other | 28.3 | 23.6 | |||||
Total | $ | 152.0 | $ | 183.4 | |||
Other Long-Term Liabilities
Other long-term liabilities consist of the following (in millions):
As of December 31, | |||||||
2015 | 2014 | ||||||
Taxes payable | $ | 1.3 | $ | 1.6 | |||
Accrued compensation benefits | 9.5 | 6.3 | |||||
Other | 17.0 | 12.3 | |||||
Total | $ | 27.8 | $ | 20.2 | |||
Note 5. Fair Value Information
The following fair value information is based on a fair value hierarchy that prioritizes the inputs to valuation techniques used to measure fair value. The three levels in the hierarchy used to measure fair value are:
Level 1—Unadjusted quoted prices in active markets accessible at the reporting date for identical assets and liabilities.
48 | ||
Level 2—Quoted prices for similar assets or liabilities in active markets. Quoted prices for identical or similar assets and liabilities in markets that are not considered active or financial instruments for which all significant inputs are observable, either directly or indirectly.
Level 3—Prices or valuations that require inputs that are significant to the valuation and are unobservable.
A financial instrument’s level within the fair value hierarchy is based on the lowest level of any input that is significant to the fair value measurement.
The derivative liabilities for foreign exchange contracts as of December 31, 2015 and 2014 were $2 million and $1 million, respectively, and are included in the consolidated balance sheet in accrued expenses. These derivatives are classified as Level 2 of the fair value hierarchy. The fair values of derivatives used to manage foreign currency risk is based on published quotations of spot currency rates and forward points, which are converted into implied forward currency rates. Additional information on our use of derivative instruments is contained in Note 12, “Derivative Financial Instruments.”
The following table includes the fair value of our financial instruments for which disclosure of fair value is required (in millions):
Fair Value Hierarchy Level | December 31, 2015 | December 31, 2014 | |||||||||||||||
Carrying Amount | Estimated Fair Value | Carrying Amount | Estimated Fair Value | ||||||||||||||
Assets | |||||||||||||||||
Cash and cash equivalents | 1 | $ | 129.5 | $ | 129.5 | $ | 149.0 | $ | 149.0 | ||||||||
Liabilities | |||||||||||||||||
Senior unsecured notes | 1 | 245.9 | 252.5 | — | — | ||||||||||||
Debt(a) | 2 | 332.2 | 337.3 | 626.5 | 644.0 | ||||||||||||
______________________________
(a) | In connection with the adoption of ASU 2015-03 (see “Recently Adopted Pronouncements” in Note 1, “Accounting Policies”), the prior year carrying amount has been revised to reflect the treatment of $10 million of deferred financing costs as a reduction of long-term debt. |
Cash equivalents are recorded at cost, which approximates fair value due to their short-term nature.
The fair value of our senior unsecured notes is determined using observable market prices based on trading activity on a primary exchange. The senior unsecured notes transferred from Level 2 to Level 1 of the fair value hierarchy following registration of the notes during the year ended December 31, 2015. In the prior year, there were no transfers among Level 1, 2 or 3 fair value determinations. Transfers between levels occur when there are changes in the observability of inputs. Changes between levels are assumed to occur at the beginning of the year.
As of December 31, 2015, debt consisted only of our senior secured term loan. As of December 31, 2014, debt consisted of our senior secured term loan and our senior unsecured notes (See Note 6, “Debt”). Fair value for the debt was based on observed trading prices in a secondary market.
Note 6. Debt
As of December 31, 2015 and 2014, our debt balances were as follows (in millions):
Weighted- Average Interest Rate | Maturities | As of December 31, | |||||||||
2015 | 2014 | ||||||||||
Senior Secured Term Loan | 4.00% | 2021 | $ | 332.2 | $ | 381.2 | |||||
Senior Unsecured Notes | 6.25% | 2022 | 245.9 | 245.3 | |||||||
Total long-term debt | 578.1 | 626.5 | |||||||||
Less debt payable within one year | — | 3.9 | |||||||||
Long-term portion | $ | 578.1 | $ | 622.6 | |||||||
49 | ||
Senior Secured Term Loan and Revolving Credit Facility
The senior secured term loan is under a credit agreement that established credit facilities in an aggregate principal amount of $640 million, including a five-year senior secured revolving credit facility allowing borrowings of up to $250 million, with a letter of credit sub-facility in an amount of $75 million and a swingline sub-facility in an amount of $25 million (the “Revolving Credit Facility”), and a seven-year senior secured term loan of $390 million (the “Term Loan Facility” and together with the Revolving Credit Facility, the “Senior Credit Facilities”). The Term Loan Facility is secured by substantially all of our assets located in the United States and a certain percentage of our foreign subsidiaries’ capital stock. In conjunction with the Senior Credit Facilities, we paid $12 million in financing fees and the loan was issued at a discount of $4 million, which amounts were deferred and are being amortized to interest expense over the life of the credit agreement using the effective interest method. In connection with the adoption of ASU 2015-03 (see “Recently Adopted Pronouncements” in Note 1, “Accounting Policies”), the prior year long-term debt balances have been revised to reflect the treatment of $10 million of deferred financing costs as a reduction of long-term debt.
In the year ended December 31, 2015, we made $51 million of principal payments on our senior secured term loan, including a $50 million prepayment without penalties pursuant to the terms of the Term Loan Facility. In conjunction with the prepayment, we recognized a charge of $1 million for the write-off of related debt issuance costs and original issue discount. The remaining balance of the senior secured term loan is due at maturity.
Borrowings under the Term Loan Facility will bear interest, at Halyard’s option, at either (i) a reserve-adjusted LIBOR rate, subject to a floor of 0.75%, plus 3.25%, or (ii) a base rate, subject to a floor of 0.75%, (calculated as the greatest of (1) the prime rate, (2) the U.S. federal funds effective rate plus 0.50% or (3) the one month LIBOR Rate plus 1.00%) plus 2.25%. As of December 31, 2015, the interest rate in effect for the Term Loan Facility was 4.00%.
Borrowings under the Revolving Credit Facility will bear interest, at Halyard’s option, at either (i) a reserve-adjusted LIBOR rate, plus a margin ranging between 1.75% to 2.50% per annum, depending on Halyard’s consolidated total leverage ratio, or (ii) the base rate plus a margin ranging between 0.75% to 1.50% per annum, depending on Halyard’s consolidated total leverage ratio. The unused portion of Halyard’s Revolving Credit Facility will be subject to a commitment fee equal to (i) 0.25% per annum, when Halyard’s consolidated total leverage ratio is less than 2.25 to 1.00 and (ii) 0.40% per annum, otherwise. As of December 31, 2015, we had no borrowings and letters of credit of $3 million outstanding under the Revolving Credit Facility, leaving $247 million available for borrowing.
Senior Unsecured Notes
During the year ended December 31, 2015, we completed an exchange of our senior unsecured notes (“Old Notes”) for senior unsecured notes (New Notes, and collectively with the Old Notes, the “Notes”) that were registered under the Securities Act of 1933, as amended (the “Securities Act”). The terms of the New Notes are substantially identical to the terms of the Old Notes, except that the New Notes are registered under the Securities Act and are not subject to the transfer restrictions and registration rights relating to the Old Notes. The Notes are guaranteed, jointly and severally, by each of our domestic subsidiaries that guarantees the Senior Credit Facilities.
The Notes will mature on October 15, 2022 and interest accrues at a rate of 6.25% per annum and is payable semi-annually in arrears on April 15 and October 15 of each year.
Debt Covenants
The senior secured term loan and the Notes are subject to similar covenants that, among other things, limit our ability and the ability of certain of our subsidiaries to:
• | incur additional indebtedness, guarantee indebtedness or issue disqualified stock or, in the case of our restricted subsidiaries, preferred stock; |
• | pay dividends on, repurchase or make distributions in respect of our capital stock; |
• | make certain investments or acquisitions; |
• | sell, transfer or otherwise convey certain assets; |
• | create liens; |
• | enter into agreements restricting certain subsidiaries’ ability to pay dividends or make other intercompany transfers; |
50 | ||
• | consolidate, merge, sell or otherwise dispose of all or substantially all of our and our subsidiaries’ assets; |
• | enter into transactions with affiliates; and |
• | prepay certain kinds of indebtedness. |
Pursuant to the restrictive covenants that limit our ability to pay dividends, we have the ability to pay dividends, repurchase stock and make investments up to an “Available Amount,” as defined in the credit agreement governing the Senior Credit Facilities, provided that we are in compliance with all required covenants, there are no events of default and upon meeting certain financial ratios.
As of December 31, 2015, we were in compliance with all of our debt covenants. As of December 31, 2015, there are no scheduled principal payments due on our long-term debt in the next five years.
Note 7. Income Taxes
Our income taxes are calculated using the asset and liability method of accounting, which requires the recognition of deferred tax assets and liabilities for the expected future tax consequences of temporary differences between the carrying amounts and the tax bases of assets and liabilities. Prior to the Spin-off, our income taxes were calculated on a separate tax return basis, although operations have been included in Kimberly-Clark’s U.S. federal, state and foreign tax returns. Accordingly, our income tax results as presented are not necessarily indicative of future performance and do not necessarily reflect the results that we would have generated as an independent publicly traded company for the periods presented.
The provision for income taxes includes federal, state and foreign taxes currently payable and those deferred because of net operating losses and temporary differences between the consolidated financial statements and tax bases of assets and liabilities.
The components of income (loss) before income taxes, and the provision (benefit) for income taxes are as follows (in millions):
Year Ended December 31, | |||||||||||
2015 | 2014 | 2013 | |||||||||
Income before income taxes | |||||||||||
United States | $ | (424.4 | ) | $ | 91.8 | $ | 136.8 | ||||
Foreign | 13.9 | (0.6 | ) | 91.0 | |||||||
Total | (410.5 | ) | 91.2 | 227.8 | |||||||
Income tax provision (benefit): | |||||||||||
Current: | |||||||||||
United States | 13.0 | 71.2 | 41.4 | ||||||||
State | 2.7 | 5.5 | 8.2 | ||||||||
Foreign | 5.3 | 18.0 | 23.7 | ||||||||
Total | 21.0 | 94.7 | 73.3 | ||||||||
Deferred: | |||||||||||
United States | (8.3 | ) | (9.8 | ) | (0.4 | ) | |||||
State | (0.6 | ) | (1.4 | ) | 0.2 | ||||||
Foreign | 3.7 | (19.4 | ) | 0.1 | |||||||
Total | (5.2 | ) | (30.6 | ) | (0.1 | ) | |||||
Total income tax provision | $ | 15.8 | $ | 64.1 | $ | 73.2 | |||||
51 | ||
Major differences between the federal statutory rate and the effective tax rate are as follows:
Year Ended December 31, | ||||||||
2015 | 2014 | 2013 | ||||||
Federal statutory rate | 35.0 | % | 35.0 | % | 35.0 | % | ||
Rate of state income taxes, net of federal tax benefit | (0.3 | ) | 3.0 | 2.3 | ||||
Statutory rate other than U.S. statutory rate | 0.6 | (0.3 | ) | (3.2 | ) | |||
Thailand repatriation related to the Spin-off | — | 15.5 | — | |||||
Goodwill | (40.4 | ) | — | — | ||||
Non-deductible expenses related to the Spin-off | — | 17.6 | — | |||||
Change in valuation allowances | 0.1 | 2.1 | 0.6 | |||||
Other, net | 1.2 | (2.6 | ) | (2.6 | ) | |||
Effective tax rate | (3.8 | )% | 70.3 | % | 32.1 | % | ||
The following is a summary of the significant components of the Company’s deferred tax assets and liabilities (in millions):
As of December 31, | ||||||||
2015 | 2014 | |||||||
Deferred tax assets | ||||||||
Intangibles, net | $ | 15.3 | $ | 13.8 | ||||
Accrued liabilities | 25.3 | 16.7 | ||||||
Stock-based compensation | 4.8 | — | ||||||
Other | 5.9 | 2.7 | ||||||
51.3 | 33.2 | |||||||
Valuation allowance | (0.5 | ) | (0.8 | ) | ||||
Total deferred assets | 50.8 | 32.4 | ||||||
Deferred tax liabilities | ||||||||
Inventories | 19.8 | 17.4 | ||||||
Property, plant and equipment, net | 39.4 | 27.5 | ||||||
Other | 0.5 | 1.2 | ||||||
Total deferred tax liabilities | 59.7 | 46.1 | ||||||
Net deferred tax liabilities | $ | 8.9 | $ | 13.7 | ||||
Valuation allowances decreased $0.3 million during the year ended December 31, 2015 impacting earnings by the same amount. Valuation allowances at the end of 2015 and 2014 primarily relate to tax credits and income tax loss carryforwards.
Realization of income tax loss carryforwards is dependent on generating sufficient taxable income prior to expiration of these carryforwards. Although realization is not assured, we believe it is more likely than not that all of the deferred tax assets, net of applicable valuation allowances, will be realized. The amount of the deferred tax assets considered realizable could be reduced or increased due to changes in the tax environment or if estimates of future taxable income change during the carryforward period.
At December 31, 2015, we have credit carryforwards for state income tax purposes of $1.7 million, of which $1.4 million will expire between 2025 and 2030. The remaining credits are available for carryforward indefinitely. At December 31, 2015, certain of our foreign subsidiaries have net operating loss carryforwards for income tax purposes of approximately $7 million, all of which will expire in 2020.
52 | ||
At December 31, 2015, U.S. income taxes and foreign withholding taxes have not been provided on $97 million of current and prior year undistributed earnings of subsidiaries operating outside the U.S. These earnings, which are considered to be invested indefinitely, would become subject to income tax if they were remitted as dividends, were lent to one of our U.S. entities or if we were to sell our stock in the subsidiaries. Determination of the amount of unrecognized deferred U.S. income tax liability on these unremitted earnings is not practical because of the complexities associated with this hypothetical calculation. We do not expect restrictions or taxes on repatriation of cash held outside of the United States to have a material adverse effect on our overall liquidity, financial condition or results of operations for the foreseeable future.
A reconciliation of the beginning and ending amount of unrecognized tax benefit is as follows (in millions):
As of December 31, | ||||||||
2015 | 2014 | |||||||
Beginning of year | $ | 1.6 | $ | 19.5 | ||||
Gross increases for income tax positions taken during current period | — | 0.2 | ||||||
Gross increases for tax positions of prior years | 0.5 | — | ||||||
Gross decreases for tax positions of prior years | — | (0.9 | ) | |||||
Decreases for tax positions retained by Kimberly-Clark as a result of the Spin-off | — | (16.6 | ) | |||||
Decreases for settlements with taxing authorities | — | (0.5 | ) | |||||
Decreases for lapse of the applicable statute of limitations | (0.6 | ) | (0.1 | ) | ||||
End of year | $ | 1.5 | $ | 1.6 | ||||
The amount, if recognized, that would affect our effective tax rate as of each year ended December 31, 2015 and 2014 is $1 million.
We classify interest and penalties on uncertain tax benefits as income tax expense. At December 31, 2015 and 2014, before any tax benefits, we had $0.4 million and $1 million, respectively, of accrued interest and penalties on unrecognized tax benefits.
During the next twelve months, we do not expect the resolution of any tax audits which could potentially reduce unrecognized tax benefits by a material amount. In addition, no expiration of the statute of limitations for a tax year in which we have recorded uncertain tax benefits will occur in the next twelve months.
State income tax returns are generally subject to examination for a period of three to five years after filing of the respective returns. The state effect of any changes to filed federal positions remains subject to examination by various states for a period of up to two years after formal notification to the states. We have various state income tax return positions in the process of examination, administrative appeals or litigation.
Note 8. Employee Benefit Plans
Defined Contribution Plans
Eligible employees participate in our defined contribution plans. Our 401(k) plan and supplemental plan provide for a matching contribution of a U.S. employee’s contributions and accruals, subject to predetermined limits. Halyard also has defined contribution pension plans for certain employees outside the U.S. in which eligible employees may participate. For the year ended December 31, 2015, we recognized $9 million of expense for our matching contributions to the 401(k) plan, and $1 million of expense was recognized in the post Spin-off period from November 1, 2014 to December 31, 2014. Our matching contributions to the 401(k) plan are recognized in cost of products sold, research and development and selling and general expenses in our consolidated income statement.
Defined Benefit Plans
Certain plans in our international operations are our direct obligation, and therefore, the related funded status has been recorded within our consolidated balance sheet. These plans are primarily unfunded and the aggregated projected benefit obligation as of December 31, 2015 and 2014 was $8 million and $5 million, respectively. Net periodic pension cost for the years ended December 31, 2015, 2014 and 2013 was $3 million, $3 million and $1 million, respectively. Over the next ten years, we expect gross benefit payments to be $1 million in the years 2016 through 2020, and $1 million in total for the years 2021 through 2025.
53 | ||
Participation in Kimberly-Clark’s Benefit Plans
Prior to the Spin-off, eligible employees participated in benefit plans sponsored by Kimberly-Clark including defined benefit pension plans, postretirement healthcare plans and defined contribution plans. Our allocated expenses for these plans were $13 million and $15 million for the years ended December 31, 2014 and 2013, respectively.
Note 9. Accumulated Other Comprehensive Income
The changes in the components of Accumulated Other Comprehensive Income (“AOCI”), net of tax, are as follows (in millions):
Unrealized Translation | Cash Flow Hedges | Defined Benefit Pension Plans | Accumulated Other Comprehensive Income | ||||||||||||
Balance, December 31, 2012 | $ | 6.5 | $ | 3.6 | $ | — | $ | 10.1 | |||||||
Other comprehensive loss | (22.6 | ) | (7.1 | ) | — | (29.7 | ) | ||||||||
Balance, December 31, 2013 | (16.1 | ) | (3.5 | ) | — | (19.6 | ) | ||||||||
Change in Kimberly-Clark’s net investment | 11.8 | (0.6 | ) | 0.1 | 11.3 | ||||||||||
Other comprehensive (loss) income | (14.0 | ) | 3.6 | (0.4 | ) | (10.8 | ) | ||||||||
Balance, December 31, 2014 | (18.3 | ) | (0.5 | ) | (0.3 | ) | (19.1 | ) | |||||||
Other comprehensive (loss) income | (22.1 | ) | (0.7 | ) | (1.3 | ) | (24.1 | ) | |||||||
Balance, December 31, 2015 | $ | (40.4 | ) | $ | (1.2 | ) | $ | (1.6 | ) | $ | (43.2 | ) | |||
The net changes in the components of AOCI, including the tax effect, are as follows (in millions):
Year Ended December 31, | |||||||||||
2015 | 2014 | 2013 | |||||||||
Unrealized translation | $ | (22.1 | ) | $ | (14.0 | ) | $ | (22.6 | ) | ||
Defined benefit pension plans | (1.9 | ) | (0.4 | ) | — | ||||||
Tax effect | 0.6 | — | — | ||||||||
Defined benefit pension plans, net of tax | (1.3 | ) | (0.4 | ) | — | ||||||
Cash flow hedges | (1.0 | ) | 4.3 | (5.4 | ) | ||||||
Tax effect | 0.3 | (0.7 | ) | (1.7 | ) | ||||||
Cash flow hedges, net of tax | (0.7 | ) | 3.6 | (7.1 | ) | ||||||
Change in AOCI | $ | (24.1 | ) | $ | (10.8 | ) | $ | (29.7 | ) | ||
Note 10. Stock-Based Compensation
The Halyard Health, Inc. Equity Participation Plan and the Halyard Health, Inc. Outside Directors’ Compensation Plan (together, the “Plans”) provide for awards of stock options, stock appreciation rights, restricted stock (and in certain limited cases, unrestricted stock), restricted stock units, performance units and cash awards to eligible employees (including officers who are employees), directors, advisors and consultants of Halyard or its subsidiaries. A maximum of 4,900,000 shares of Halyard common stock may be issued under the Plans, and there are 3,134,439 shares remaining available for issuance as of December 31, 2015.
Aggregate stock-based compensation expense under the Plans was $14 million for the year ended December 31, 2015 and $3 million for the post Spin-off period from November 1, 2014 through December 31, 2014. Stock-based compensation expense is included in cost of sales, research and development expenses and selling and general expenses.
54 | ||
Stock Options
Stock options are granted at an exercise price equal to the fair market value of Halyard’s common stock on the date of grant. Stock options are generally subject to graded vesting whereby options vest 30% at the end of each of the first two 12-month periods following the grant and 40% at the end of the third 12-month period and have a term of 10 years.
Any unvested options awarded by Kimberly-Clark held by the Halyard employees under the age of 55 at the time of the Spin-off were forfeited on the Spin-off date. Certain awards granted to employees to replace Kimberly-Clark awards forfeited at the time of Spin-off have shorter vesting periods.
The fair value of stock option awards was determined using a Black-Scholes option-pricing model utilizing a range of assumptions related to volatility, risk-free interest rate, expected term and dividend yield. Expected volatility was based on historical weekly closing stock price volatility for a peer group of companies. The risk-free interest rate was based on the U.S. Treasury yield curve in effect at the time of grant. The expected term was based on historical observed settlement behavior. The dividend yield was based on the expectation that no dividends are expected to be paid on our common stock.
The weighted-average fair value of options granted in the year ended December 31, 2015 and the period from the Spin-off date to December 31, 2014 was $15.15 and $10.01, respectively, based on the following assumptions:
Year Ended December 31, 2015 | November 1, 2014 to December 31, 2014 | ||||||
Volatility | 25% | to | 34% | 25% | to | 27% | |
Risk-free rate | 0.7% | to | 1.9% | 0.8% | to | 1.6% | |
Expected term (Years) | 2 | to | 7 | 3 | to | 5 | |
Dividend Yield | 0% | 0% | |||||
Stock-based compensation expense related to stock options was $6 million and $1 million for the year ended December 31, 2015 and the period from the Spin-off date through December 31, 2014, respectively.
A summary of stock option activity is presented below:
Shares (in thousands) | Weighted- Average Exercise Price | Weighted- Average Remaining Contractual Term (Years) | Aggregate Intrinsic Value (in millions) | |||||||||
Outstanding at December 31, 2014 | 611 | $ | 34.94 | |||||||||
Granted | 628 | $ | 45.52 | |||||||||
Exercises | (37 | ) | $ | 31.05 | ||||||||
Forfeitures | (56 | ) | $ | 38.33 | ||||||||
Outstanding at December 31, 2015 | 1,146 | $ | 40.70 | 8.6 | $ | 0.5 | ||||||
Vested and exercisable at December 31, 2015 | 225 | $ | 33.58 | 7.6 | $ | 0.5 | ||||||
The following table summarizes information about options outstanding as of December 31, 2015:
Options Outstanding | Options Exercisable | ||||||||||||
Range of Exercise Prices | Shares (in thousands) | Weighted-Average Remaining Contractual Term (Years) | Shares (in thousands) | Weighted-Average Exercise Price | |||||||||
$25.00 | to | $35.00 | 215 | 7.0 | 125 | $ | 29.97 | ||||||
$35.00 | to | $45.00 | 320 | 8.5 | 92 | $ | 37.52 | ||||||
$45.00+ | 611 | 9.3 | 8 | $ | 45.53 | ||||||||
1,146 | 8.6 | 225 | $ | 33.58 | |||||||||
55 | ||
In the year ended December 31, 2015, options with an aggregate intrinsic value of $0.4 million were exercised resulting in an excess tax benefit of $0.2 million which was recognized as a component of additional paid in capital in the accompanying consolidated balance sheet as of December 31, 2015. For stock options outstanding at December 31, 2015, we expect to recognize an additional $8 million of expense over the remaining average service period of two years.
Restricted Share Units
Restricted shares, time-vested restricted share units and performance-based restricted share units granted to employees and directors are valued at the closing market price of our common stock on the grant date with vesting conditions determined upon approval of the award. The fair value of restricted share units is based on our closing stock price on the date of grant.
Any unvested restricted share units awarded by Kimberly-Clark held by the Halyard employees under the age of 55 at the time of the Spin-off were forfeited on the Spin-off date. Certain awards granted to employees to replace Kimberly-Clark awards forfeited at the time of Spin-off have shorter vesting periods.
Stock-based compensation expense related to restricted stock units was $8 million for the year ended December 31, 2015 and $2 million for the period from the Spin-off date through December 31, 2014. A summary of restricted share unit activity is presented below:
Shares (in thousands) | Weighted Average Fair Value | |||||
Outstanding at December 31, 2014 | 375 | $ | 37.88 | |||
Granted | 234 | $ | 44.40 | |||
Released | (63 | ) | $ | 38.28 | ||
Forfeited | (27 | ) | $ | 39.54 | ||
Outstanding at December 31, 2015 | 519 | $ | 40.69 | |||
For restricted share units outstanding at December 31, 2015, we expect to recognize an additional $7 million of expense over the remaining average service period of one year.
Expense under Kimberly-Clark Equity Incentive Plans
Stock-based compensation expense allocated to us by Kimberly-Clark prior to the Spin-off under their incentive plans was $5 million through the Spin-off date in 2014 and $6 million in 2013.
Note 11. Commitments and Contingencies
Legal Matters
We are subject to various legal proceedings, claims and governmental inspections, audits or investigations pertaining to issues such as contract disputes, product liability, tax matters, patents and trademarks, advertising, governmental regulations, employment and other matters, including the matters described below. Under the terms of the distribution agreement we entered into with Kimberly-Clark prior to the Spin-off, legal proceedings, claims and other liabilities that are primarily related to our business are our responsibility and we are obligated to indemnify and hold Kimberly-Clark harmless for such matters (“Indemnification Obligation”). For the year ended December 31, 2015, we have incurred $17 million related to these matters.
The only exception to the Indemnification Obligation relates to the pain pump litigation referenced in this paragraph. We are one of several manufacturers of continuous infusion medical devices, such as our ON-Q PAINBUSTER pain pumps, that are involved in several different pending or threatened litigation matters from multiple plaintiffs alleging that use of the continuous infusion device to deliver anesthetics directly into a synovial joint after surgery resulted in postarthroscopic glenohumeral chondrolysis, or a disintegration of the cartilage covering the bones in the joint (typically, in the shoulder). Plaintiffs generally seek monetary damages and attorneys’ fees. While Kimberly-Clark is retaining the liabilities related to these matters, the distribution agreement between us and Kimberly-Clark provides that we will indemnify Kimberly-Clark for any such claims or causes of actions arising after the Spin-off.
We have an Indemnification Obligation for, and have assumed the defense of, the matter styled Shahinian, et al. v. Kimberly-Clark Corporation, et al., No. 2:14-cv-08390-DMG-SH (C.D. Cal.), filed on October 29, 2014. In that case, the plaintiff brings a putative nationwide class action asserting claims for common law fraud (affirmative misrepresentation and fraudulent
56 | ||
concealment), negligent misrepresentation, and violation of California’s Unfair Competition Law in connection with our marketing and sale of MicroCool surgical gowns. On February 6, 2015, we moved to dismiss the complaint on multiple grounds. On July 10, 2015, the Court issued an order on the motion to dismiss, dismissing the negligent misrepresentation claim but permitting the remaining claims to stand and proceed to discovery. On December 11, 2015, the plaintiff filed a second amended complaint that added additional plaintiffs in California, Texas and Rhode Island, named Halyard Health, Inc. as an additional defendant, and extended the timeframe for the lawsuit to include products sold after the Spin-off through December 2015. The parties are currently engaged in discovery. We intend to continue our vigorous defense of the matter.
In June 2015, we were served with a subpoena from the Department of Veterans Affairs Office of the Inspector General (“VA OIG”) seeking information related to the design, manufacture, testing, sale and promotion of MicroCool and other Company surgical gowns, and, in July 2015, also became aware that the subpoena and an earlier VA OIG subpoena served on Kimberly-Clark requesting information about gown sales to the federal government are related to a United States Department of Justice (“DOJ”) investigation. We could be subject to litigation relating to this investigation, by either governmental agencies or private parties. If a claim is asserted against Kimberly-Clark relating to MicroCool gowns or other Company surgical gowns, we expect that such a claim would give rise to an Indemnification Obligation under the distribution agreement with Kimberly-Clark. The Company is cooperating with the VA OIG’s request and the DOJ investigation.
We operate in an industry characterized by extensive patent litigation and competitors may claim that our products infringe upon their intellectual property. Resolution of patent litigation or other intellectual property claims is typically time consuming and costly and can result in significant damage awards and injunctions that could prevent the manufacture and sale of the affected products or require us to make significant royalty payments in order to continue selling the affected products. At any given time we are involved as either a plaintiff or a defendant in a number of patent infringement actions, the outcomes of which may not be known for prolonged periods of time.
Although the results of litigation and claims cannot be predicted with certainty, we believe that the ultimate disposition of these matters, to the extent not previously provided for, will not have a material adverse effect, individually or in the aggregate, on our business, financial condition, results of operations or liquidity.
We are subject to federal, state and local environmental protection laws and regulations with respect to our business operations and are operating in compliance with, or taking action aimed at ensuring compliance with, these laws and regulations. None of our compliance obligations with environmental protection laws and regulations, individually or in the aggregate, is expected to have a material adverse effect on our business, financial condition, results of operations or liquidity.
Operating Leases
We have entered into operating leases for principal executive offices, located in Alpharetta, Georgia, as well as certain warehouse, manufacturing and distribution facilities. The future minimum obligations under operating leases having a non-cancelable term in excess of one year are as follows (in millions):
Year | Amount | |||
2016 | $ | 14.0 | ||
2017 | 13.8 | |||
2018 | 12.4 | |||
2019 | 10.4 | |||
2020 | 7.4 | |||
Thereafter | 48.3 | |||
Future minimum obligations | $ | 106.3 | ||
Rental expense under operating leases was $22 million, $17 million and $17 million in 2015, 2014 and 2013, respectively.
Note 12. Derivative Financial Instruments
We are exposed to financial risks, such as changes in foreign currency exchange rates, interest rates and commodity prices. We manage these risks, where appropriate, with the use of derivative instruments. We enter into derivative instruments to hedge a portion of forecasted cash flows denominated in Thai baht. The derivative instruments used to manage these exposures are
57 | ||
designated and qualify as cash flow hedges. The foreign currency exposure on certain monetary assets and liabilities, primarily intercompany loans and accounts payable, is hedged with undesignated derivative instruments.
Translation adjustments result from translating foreign entities’ financial statements into U.S. dollars from their functional currencies. The risk to any particular entity’s net assets is reduced to the extent that the entity is financed with local currency borrowing. Translation exposure, which results from changes in translation rates between functional currencies and the U.S. dollar, is not hedged.
The derivative assets for foreign exchange contracts were not material as of December 31, 2015 and 2014. The derivative liabilities for foreign exchange contracts as of December 31, 2015 and 2014 were $2 million and $1 million, respectively, and are included in the consolidated balance sheet in accrued expenses.
For derivative instruments that are designated and qualify as cash flow hedges, the effective portion of the gain or loss on the derivative instrument is initially recorded in AOCI, net of related income taxes, and recognized in earnings in the same period that the hedged exposure affects earnings. These gains or losses recognized to earnings were not significant in each of the three years ended December 31, 2015, 2014 and 2013. As of December 31, 2015, the aggregate notional value of outstanding foreign exchange derivative contracts designated as cash flow hedges was approximately $37 million. Cash flow hedges resulted in no significant ineffectiveness in each of the three years ended December 31, 2015, 2014 and 2013. For each of the three years ended December 31, 2015, 2014 and 2013, no gains or losses were reclassified into earnings as a result of the discontinuance of cash flow hedges due to the original forecasted transaction no longer being probable of occurring. At December 31, 2015, amounts to be reclassified from AOCI during the next year are not expected to be significant. The maximum maturity of cash flow hedges in place at December 31, 2015 is December 2016.
Gains or losses on undesignated foreign exchange hedging instruments are immediately recognized in other (income) and expense, net. These gains or losses have not been significant for each of the three years ended December 31, 2015, 2014 and 2013. The effect on earnings from the use of these non-designated derivatives is substantially neutralized by the transactional gains and losses recorded on the underlying assets and liabilities. At December 31, 2015, the notional amount of these undesignated derivative instruments was approximately $8 million.
Note 13. Earnings Per Share (“EPS”)
Basic EPS is calculated by dividing net income by the weighted average number of common shares outstanding during each period. Diluted earnings per share is calculated by dividing net income by the number of common shares outstanding and the effect of all dilutive common stock equivalents outstanding during each period, as determined using the treasury stock method. The contribution of Kimberly-Clark’s Health Care business to us was treated as a reorganization of entities under common control under Kimberly-Clark. Consequently, we are retrospectively reporting EPS for the year ended December 31, 2013 using the 47 million weighted average shares outstanding as of the Spin-off date for both basic and diluted EPS as no Halyard common stock or dilutive stock-based compensation awards were authorized or outstanding prior to the Spin-off.
The calculation of basic and diluted earnings per share for each of the three years ended December 31, 2015, 2014 and 2013 is set forth in the following table (in millions, except per share amounts):
Year Ended December 31, | |||||||||||
2015 | 2014 | 2013 | |||||||||
Net (loss) income | $ | (426.3 | ) | $ | 27.1 | $ | 154.6 | ||||
Weighted Average Shares Outstanding: | |||||||||||
Basic weighted average shares outstanding | 46.6 | 46.5 | 46.5 | ||||||||
Dilutive effect of stock options and restricted share unit awards | — | — | — | ||||||||
Diluted weighted average shares outstanding | 46.6 | 46.5 | 46.5 | ||||||||
(Loss) Earnings Per Share: | |||||||||||
Basic | $ | (9.15 | ) | $ | 0.58 | $ | 3.32 | ||||
Diluted | $ | (9.15 | ) | $ | 0.58 | $ | 3.32 | ||||
For the year ended December 31, 2015, 1 million of potentially dilutive stock options and restricted share unit awards were excluded from the computation of earnings per share as their effect would have been anti-dilutive.
58 | ||
Note 14. Business Segment Information
We are organized into two operating segments based on product groupings: S&IP and Medical Devices. These operating segments, which are also our reportable global business segments, were determined in accordance with how our executive managers develop and execute global strategies to drive growth and profitability. These strategies include global plans for branding and product positioning, technology, research and development programs, cost reductions including supply chain management, and capacity and capital investments for each of these businesses. Segment management is evaluated on several factors, including operating profit. Segment operating profit excludes other (income) and expense, net.
The principal sources of revenue in each global business segment are described below:
• | S&IP provides healthcare supplies and solutions that target the prevention and management of healthcare-associated infections. This segment has recognized brands across its portfolio of product offerings, including sterilization wrap, surgical drapes and gowns, facial protection, protective apparel and medical exam gloves. This business is also a global leader in education to prevent healthcare-associated infections. |
• | Medical Devices provides a portfolio of innovative product offerings focused on pain management and respiratory and digestive health to improve patient outcomes and reduce the cost of care. These products include post-operative pain management solutions, minimally invasive interventional (or chronic) pain therapies, closed airway suction systems and enteral feeding tubes. |
Information concerning operations by business segment is presented in the following table (in millions):
Year Ended December 31, | |||||||||||
2015 | 2014 | 2013 | |||||||||
Net Sales | |||||||||||
S&IP | $ | 1,030.2 | $ | 1,139.3 | $ | 1,153.1 | |||||
Medical Devices | 509.5 | 501.7 | 499.0 | ||||||||
Corporate and Other | 34.7 | 31.1 | 25.4 | ||||||||
Total Net Sales(a) | 1,574.4 | 1,672.1 | 1,677.5 | ||||||||
Operating Profit | |||||||||||
S&IP | 98.4 | 166.3 | 151.2 | ||||||||
Medical Devices | 107.8 | 104.6 | 85.6 | ||||||||
Corporate and Other(b) | (105.4 | ) | (180.4 | ) | (13.9 | ) | |||||
Goodwill impairment | (474.0 | ) | — | — | |||||||
Other (expense) income, net(c) | (4.5 | ) | 3.8 | 2.4 | |||||||
Total Operating (Loss) Profit | (377.7 | ) | 94.3 | 225.3 | |||||||
Interest income | 0.3 | 2.9 | 2.6 | ||||||||
Interest expense | (33.1 | ) | (6.0 | ) | (0.1 | ) | |||||
(Loss) Income before Income Taxes | $ | (410.5 | ) | $ | 91.2 | $ | 227.8 | ||||
______________________________
(a) | Net sales in the United States to third parties totaled $1.1 billion in each of the last three years ended December 31, 2015. |
(b) | Corporate and Other for the year ended December 31, 2014 includes $60 million associated with the disposal of one of our disposable glove facilities in Thailand (see Note 3, “Spin-Off Transition Costs and Sale of Exam Glove Facility”). |
(c) | Other (expense) income for the year ended December 31, 2015 includes $17 million related to legal expenses and litigation partially offset by a gain on the sale of our exam glove manufacturing facility in Thailand of $12 million. |
Within the S&IP segment, surgical drapes and gowns and medical exam gloves each accounted for more than 10% of total net sales in the year ended December 31, 2015. Surgical drapes and gowns, medical exam gloves and sterilization wrap each accounted for more than 10% of total net sales in each of the years ended December 31, 2014 and 2013. Within the Medical Devices segment, our digestive health and surgical pain products accounted for more than 10% of total net sales in the year ended December 31, 2015. No products in the Medical Devices segment accounted for 10% or more of total net sales in either of the years ended December 31, 2014 or 2013.
59 | ||
Depreciation, amortization and capital expenditures by segment are as follows (in millions):
Year Ended December 31, | |||||||||||
2015 | 2014 | 2013 | |||||||||
Depreciation and Amortization | |||||||||||
S&IP | $ | 23.3 | $ | 41.4 | $ | 31.0 | |||||
Medical Devices | 30.8 | 40.4 | 36.2 | ||||||||
Corporate and Other | 11.3 | 3.6 | 2.0 | ||||||||
Total Depreciation and Amortization | $ | 65.4 | $ | 85.4 | $ | 69.2 | |||||
Capital Expenditures | |||||||||||
S&IP | $ | 30.0 | $ | 46.3 | $ | 20.4 | |||||
Medical Devices | 23.2 | 19.1 | 13.4 | ||||||||
Corporate and Other | 17.2 | 13.1 | 15.2 | ||||||||
Total Capital Expenditures | $ | 70.4 | $ | 78.5 | $ | 49.0 | |||||
Information concerning assets by business segment is presented in the following table (in millions):
As of December 31, | |||||||
2015 | 2014 | ||||||
Assets | |||||||
S&IP | $ | 766.5 | $ | 1,235.2 | |||
Medical Devices | 1,030.9 | 1,042.2 | |||||
Corporate and Other | 202.8 | 240.5 | |||||
Total Assets | $ | 2,000.2 | $ | 2,517.9 | |||
Note 15. Related Party Transactions
Our consolidated financial statements include net sales to Kimberly-Clark subsidiaries and affiliates of $79 million through the Spin-off date in 2014 and $91 million in 2013.
Our consolidated financial statements include certain expenses of Kimberly-Clark which were allocated to us for certain administrative functions. The total amount of these allocations from Kimberly-Clark were approximately as follows (in millions):
Year Ended December 31, | |||||||
2014 | 2013 | ||||||
Cost of products sold | $ | 22 | $ | 25 | |||
Selling and general expenses | 41 | 60 | |||||
Research expenses | 11 | 10 | |||||
Total | $ | 74 | $ | 95 | |||
During 2015, we sold products to a company with which one of the members of our Board of Directors had a relationship. The sales transactions during the period of time that our Director was affiliated with that company were approximately $0.4 million. We determined that these sales transactions were made in the ordinary course of business.
60 | ||
Note 16. Supplemental Guarantor Financial Information
In October 2014, Halyard Health, Inc. (referred to below as “Parent”) issued the Notes (described in Note 6, “Debt”). The Notes are guaranteed, jointly and severally by each of our domestic subsidiaries that guarantees the Senior Credit Facilities (each, a “Guarantor Subsidiary” and collectively, the “Guarantor Subsidiaries”). The guarantees are full and unconditional, subject to certain customary release provisions as defined in the Indenture dated October 17, 2014. Each Guarantor Subsidiary is directly or indirectly 100%-owned by Halyard Health, Inc. Each of the guarantees of the Notes is a general unsecured obligation of each Guarantor and ranks equally in right of payment with all existing and future indebtedness and all other obligations (except subordinated indebtedness) of each Guarantor.
The following condensed consolidating balance sheets as of December 31, 2015 and 2014 and the condensed consolidating statements of income and cash flows for the years ended December 31, 2015, 2014 and 2013 provide condensed consolidating financial information for Halyard Health, Inc. (“Parent”), the Guarantor Subsidiaries on a combined basis, the Non-Guarantor subsidiaries on a combined basis and the Parent and its subsidiaries on a consolidating basis.
The Parent and the Guarantor Subsidiaries use the equity method of accounting to reflect ownership interests in subsidiaries which are eliminated upon consolidation. Eliminating entries in the following condensed consolidating financial information represent adjustments to (i) eliminate intercompany transactions between or among the Parent, the Guarantor Subsidiaries and the non-guarantor subsidiaries and (ii) eliminate the investments in subsidiaries.
HALYARD HEALTH, INC. AND SUBSIDIARIES
CONDENSED CONSOLIDATING INCOME AND COMPREHENSIVE INCOME STATEMENTS
(in millions)
Year Ended December 31, 2015 | |||||||||||||||||||
Parent | Guarantor Subsidiaries | Non-Guarantor Subsidiaries | Eliminations | Consolidated | |||||||||||||||
Net Sales | $ | — | $ | 1,470.8 | $ | 452.2 | $ | (348.6 | ) | $ | 1,574.4 | ||||||||
Cost of products sold | — | 997.5 | 393.9 | (348.6 | ) | 1,042.8 | |||||||||||||
Gross Profit | — | 473.3 | 58.3 | — | 531.6 | ||||||||||||||
Research and development expenses | — | 32.3 | — | — | 32.3 | ||||||||||||||
Selling and general expenses | 30.6 | 309.2 | 58.7 | — | 398.5 | ||||||||||||||
Goodwill impairment | — | 455.0 | 19.0 | — | 474.0 | ||||||||||||||
Other (income) expense, net | (2.7 | ) | 45.8 | (38.6 | ) | — | 4.5 | ||||||||||||
Operating (Loss) Profit | (27.9 | ) | (369.0 | ) | 19.2 | — | (377.7 | ) | |||||||||||
Interest income | 0.3 | — | 3.1 | (3.1 | ) | 0.3 | |||||||||||||
Interest expense | (33.8 | ) | (2.1 | ) | (0.3 | ) | 3.1 | (33.1 | ) | ||||||||||
(Loss) Income Before Income Taxes | (61.4 | ) | (371.1 | ) | 22.0 | — | (410.5 | ) | |||||||||||
Benefit from (provision for) income taxes | 24.6 | (29.2 | ) | (11.2 | ) | — | (15.8 | ) | |||||||||||
Equity in earnings of consolidated subsidiaries | (389.5 | ) | 22.4 | — | 367.1 | — | |||||||||||||
Net (Loss) Income | (426.3 | ) | (377.9 | ) | 10.8 | 367.1 | (426.3 | ) | |||||||||||
Total other comprehensive loss, net of tax | — | (0.1 | ) | (24.0 | ) | — | (24.1 | ) | |||||||||||
Comprehensive Loss | $ | (426.3 | ) | $ | (378.0 | ) | $ | (13.2 | ) | $ | 367.1 | $ | (450.4 | ) | |||||
61 | ||
HALYARD HEALTH, INC. AND SUBSIDIARIES
CONDENSED COMBINED CONSOLIDATING INCOME AND COMPREHENSIVE INCOME STATEMENTS
(in millions)
Year Ended December 31, 2014 | |||||||||||||||||||
Parent | Guarantor Subsidiaries | Non-Guarantor Subsidiaries | Eliminations | Consolidated and Combined | |||||||||||||||
Net Sales | $ | — | $ | 1,455.0 | $ | 619.8 | $ | (402.7 | ) | $ | 1,672.1 | ||||||||
Cost of products sold | — | 979.6 | 546.6 | (402.7 | ) | 1,123.5 | |||||||||||||
Gross Profit | — | 475.4 | 73.2 | — | 548.6 | ||||||||||||||
Research and development expenses | — | 33.6 | — | — | 33.6 | ||||||||||||||
Selling and general expenses | 3.0 | 363.0 | 58.5 | — | 424.5 | ||||||||||||||
Other expense (income), net | 0.1 | — | (3.9 | ) | — | (3.8 | ) | ||||||||||||
Operating (Loss) Profit | (3.1 | ) | 78.8 | 18.6 | — | 94.3 | |||||||||||||
Interest income | — | 2.6 | 0.3 | — | 2.9 | ||||||||||||||
Interest expense | (5.2 | ) | (0.7 | ) | (0.1 | ) | — | (6.0 | ) | ||||||||||
(Loss) Income Before Income Taxes | (8.3 | ) | 80.7 | 18.8 | — | 91.2 | |||||||||||||
Provision for income taxes | — | (62.8 | ) | (1.3 | ) | — | (64.1 | ) | |||||||||||
Equity in earnings of consolidated subsidiaries | (6.2 | ) | 13.8 | — | (7.6 | ) | — | ||||||||||||
Net (Loss) Income | (14.5 | ) | 31.7 | 17.5 | (7.6 | ) | 27.1 | ||||||||||||
Total other comprehensive loss, net of tax | — | (0.9 | ) | (9.9 | ) | — | (10.8 | ) | |||||||||||
Comprehensive (Loss) Income | $ | (14.5 | ) | $ | 30.8 | $ | 7.6 | $ | (7.6 | ) | $ | 16.3 | |||||||
62 | ||
HALYARD HEALTH, INC. AND SUBSIDIARIES
CONDENSED COMBINED CONSOLIDATING INCOME AND COMPREHENSIVE INCOME STATEMENTS
(in millions)
Year Ended December 31, 2013 | |||||||||||||||||||
Parent | Guarantor Subsidiaries | Non-Guarantor Subsidiaries | Eliminations | Consolidated and Combined | |||||||||||||||
Net Sales | $ | — | $ | 1,429.9 | $ | 663.6 | $ | (416.0 | ) | $ | 1,677.5 | ||||||||
Cost of products sold | — | 974.9 | 506.4 | (416.0 | ) | 1,065.3 | |||||||||||||
Gross Profit | — | 455.0 | 157.2 | — | 612.2 | ||||||||||||||
Research and development expenses | — | 37.9 | — | — | 37.9 | ||||||||||||||
Selling and general expenses | — | 295.4 | 56.0 | — | 351.4 | ||||||||||||||
Other income, net | — | (1.0 | ) | (1.4 | ) | — | (2.4 | ) | |||||||||||
Operating Profit | — | 122.7 | 102.6 | — | 225.3 | ||||||||||||||
Interest income | — | 2.5 | 0.1 | — | 2.6 | ||||||||||||||
Interest expense | — | — | (0.1 | ) | — | (0.1 | ) | ||||||||||||
Income Before Income Taxes | — | 125.2 | 102.6 | — | 227.8 | ||||||||||||||
Provision for income taxes | — | (52.3 | ) | (20.9 | ) | — | (73.2 | ) | |||||||||||
Equity in earnings of consolidated subsidiaries | — | 71.9 | — | (71.9 | ) | — | |||||||||||||
Net Income | — | 144.8 | 81.7 | (71.9 | ) | 154.6 | |||||||||||||
Total other comprehensive loss, net of tax | — | (4.2 | ) | (25.5 | ) | — | (29.7 | ) | |||||||||||
Comprehensive Income | $ | — | $ | 140.6 | $ | 56.2 | $ | (71.9 | ) | $ | 124.9 | ||||||||
63 | ||
HALYARD HEALTH, INC. AND SUBSIDIARIES
CONDENSED CONSOLIDATING BALANCE SHEETS
(in millions)
As of December 31, 2015 | |||||||||||||||||||
Parent | Guarantor Subsidiaries | Non-Guarantor Subsidiaries | Eliminations | Consolidated | |||||||||||||||
ASSETS | |||||||||||||||||||
Current Assets | |||||||||||||||||||
Cash and cash equivalents | $ | 92.3 | $ | — | $ | 39.7 | $ | (2.5 | ) | $ | 129.5 | ||||||||
Accounts receivable, net | 3.0 | 440.8 | 221.7 | (440.8 | ) | 224.7 | |||||||||||||
Inventories | — | 258.4 | 44.8 | — | 303.2 | ||||||||||||||
Prepaid and other current assets | 5.0 | 10.8 | 3.0 | (0.2 | ) | 18.6 | |||||||||||||
Total Current Assets | 100.3 | 710.0 | 309.2 | (443.5 | ) | 676.0 | |||||||||||||
Property, Plant and Equipment, Net | — | 228.7 | 50.8 | — | 279.5 | ||||||||||||||
Investment in Consolidated Subsidiaries | 1,750.8 | 277.7 | — | (2,028.5 | ) | — | |||||||||||||
Goodwill | — | 918.6 | 26.6 | — | 945.2 | ||||||||||||||
Other Intangible Assets, net | — | 82.6 | — | — | 82.6 | ||||||||||||||
Other Assets | 1.4 | 0.3 | 15.2 | — | 16.9 | ||||||||||||||
TOTAL ASSETS | $ | 1,852.5 | $ | 2,217.9 | $ | 401.8 | $ | (2,472.0 | ) | $ | 2,000.2 | ||||||||
LIABILITIES AND EQUITY | |||||||||||||||||||
Current Liabilities | |||||||||||||||||||
Trade accounts payable | $ | 251.4 | $ | 309.4 | $ | 42.7 | $ | (440.3 | ) | $ | 163.2 | ||||||||
Accrued expenses | 6.6 | 115.4 | 33.4 | (3.4 | ) | 152.0 | |||||||||||||
Total Current Liabilities | 258.0 | 424.8 | 76.1 | (443.7 | ) | 315.2 | |||||||||||||
Long-Term Debt | 578.1 | — | — | — | 578.1 | ||||||||||||||
Other Long-Term Liabilities | 1.8 | 41.6 | 8.2 | — | 51.6 | ||||||||||||||
Total Liabilities | 837.9 | 466.4 | 84.3 | (443.7 | ) | 944.9 | |||||||||||||
Total Equity | 1,014.6 | 1,751.5 | 317.5 | (2,028.3 | ) | 1,055.3 | |||||||||||||
TOTAL LIABILITIES AND EQUITY | $ | 1,852.5 | $ | 2,217.9 | $ | 401.8 | $ | (2,472.0 | ) | $ | 2,000.2 | ||||||||
64 | ||
HALYARD HEALTH, INC. AND SUBSIDIARIES
CONDENSED COMBINED CONSOLIDATING BALANCE SHEETS
(in millions)
As of December 31, 2014 | |||||||||||||||||||
Parent | Guarantor Subsidiaries | Non-Guarantor Subsidiaries | Eliminations | Consolidated | |||||||||||||||
ASSETS | |||||||||||||||||||
Current Assets | |||||||||||||||||||
Cash and cash equivalents | $ | 101.2 | $ | 3.9 | $ | 43.9 | $ | — | $ | 149.0 | |||||||||
Accounts receivable, net | 45.4 | 366.4 | 229.8 | (407.7 | ) | 233.9 | |||||||||||||
Inventories | — | 244.1 | 39.0 | — | 283.1 | ||||||||||||||
Current deferred income taxes and other current assets | 4.1 | 12.5 | 1.0 | — | 17.6 | ||||||||||||||
Total Current Assets | 150.7 | 626.9 | 313.7 | (407.7 | ) | 683.6 | |||||||||||||
Property, Plant and Equipment, Net | — | 216.7 | 61.1 | — | 277.8 | ||||||||||||||
Assets Held for Sale | — | — | 2.6 | — | 2.6 | ||||||||||||||
Investment in Consolidated Subsidiaries | 2,144.6 | 241.6 | — | (2,386.2 | ) | — | |||||||||||||
Goodwill | — | 1,373.6 | 52.5 | — | 1,426.1 | ||||||||||||||
Other Intangible Assets, net | — | 108.3 | — | — | 108.3 | ||||||||||||||
Other Assets | 1.7 | 0.2 | 17.6 | — | 19.5 | ||||||||||||||
TOTAL ASSETS | $ | 2,297.0 | $ | 2,567.3 | $ | 447.5 | $ | (2,793.9 | ) | $ | 2,517.9 | ||||||||
LIABILITIES AND EQUITY | |||||||||||||||||||
Current Liabilities | |||||||||||||||||||
Debt payable within one year | $ | 3.9 | $ | — | $ | — | $ | — | $ | 3.9 | |||||||||
Trade accounts payable | 165.2 | 325.6 | 85.6 | (407.7 | ) | 168.7 | |||||||||||||
Accrued expenses | 12.6 | 137.4 | 33.4 | — | 183.4 | ||||||||||||||
Total Current Liabilities | 181.7 | 463.0 | 119.0 | (407.7 | ) | 356.0 | |||||||||||||
Long-Term Debt | 622.6 | — | — | — | 622.6 | ||||||||||||||
Other Long-Term Liabilities | 1.5 | 42.2 | 4.4 | — | 48.1 | ||||||||||||||
Total Liabilities | 805.8 | 505.2 | 123.4 | (407.7 | ) | 1,026.7 | |||||||||||||
Total Equity | 1,491.2 | 2,062.1 | 324.1 | (2,386.2 | ) | 1,491.2 | |||||||||||||
TOTAL LIABILITIES AND EQUITY | $ | 2,297.0 | $ | 2,567.3 | $ | 447.5 | $ | (2,793.9 | ) | $ | 2,517.9 | ||||||||
65 | ||
HALYARD HEALTH, INC. AND SUBSIDIARIES
CONDENSED CONSOLIDATING STATEMENTS OF CASH FLOWS
(in millions)
Year Ended December 31, 2015 | |||||||||||||||||||
Parent | Guarantor Subsidiaries | Non-Guarantor Subsidiaries | Eliminations | Consolidated | |||||||||||||||
Operating Activities | |||||||||||||||||||
Cash (Used in) Provided by Operating Activities | $ | (44.7 | ) | $ | 110.5 | $ | 34.3 | $ | (2.5 | ) | $ | 97.6 | |||||||
Investing Activities | |||||||||||||||||||
Capital expenditures | — | (61.3 | ) | (9.1 | ) | — | (70.4 | ) | |||||||||||
Proceeds from property dispositions | — | — | 7.8 | — | 7.8 | ||||||||||||||
Intercompany contributions | 39.9 | (53.1 | ) | 1.3 | 11.9 | — | |||||||||||||
Cash Provided by (Used in) Investing Activities | 39.9 | (114.4 | ) | — | 11.9 | (62.6 | ) | ||||||||||||
Financing Activities | |||||||||||||||||||
Intercompany contributions | 46.5 | — | (34.6 | ) | (11.9 | ) | — | ||||||||||||
Debt repayments | (51.0 | ) | — | — | — | (51.0 | ) | ||||||||||||
Purchase of treasury stock | (1.0 | ) | — | — | — | (1.0 | ) | ||||||||||||
Proceeds and excess tax benefits from the exercise of stock options | 1.4 | — | — | — | 1.4 | ||||||||||||||
Cash (Used in) Provided by Financing Activities | (4.1 | ) | — | (34.6 | ) | (11.9 | ) | (50.6 | ) | ||||||||||
Effect of Exchange Rate on Cash and Cash Equivalents | — | — | (3.9 | ) | — | (3.9 | ) | ||||||||||||
Decrease in Cash and Cash Equivalents | (8.9 | ) | (3.9 | ) | (4.2 | ) | (2.5 | ) | (19.5 | ) | |||||||||
Cash and Cash Equivalents, Beginning of Period | 101.2 | 3.9 | 43.9 | — | 149.0 | ||||||||||||||
Cash and Cash Equivalents, End of Period | $ | 92.3 | $ | — | $ | 39.7 | $ | (2.5 | ) | $ | 129.5 | ||||||||
66 | ||
HALYARD HEALTH, INC. AND SUBSIDIARIES
CONDENSED COMBINED CONSOLIDATING STATEMENTS OF CASH FLOWS
(in millions)
Year Ended December 31, 2014 | |||||||||||||||||||
Parent | Guarantor Subsidiaries | Non-Guarantor Subsidiaries | Eliminations | Consolidated and Combined | |||||||||||||||
Operating Activities | |||||||||||||||||||
Cash Provided by Operating Activities | $ | — | $ | 41.9 | $ | 106.0 | $ | — | $ | 147.9 | |||||||||
Investing Activities | |||||||||||||||||||
Capital expenditures | — | (70.8 | ) | (7.7 | ) | — | (78.5 | ) | |||||||||||
Deposit received on pending sale of assets | — | — | 7.8 | — | 7.8 | ||||||||||||||
Cash (Used in) Provided by Investing Activities | — | (70.8 | ) | 0.1 | — | (70.7 | ) | ||||||||||||
Financing Activities | |||||||||||||||||||
Intercompany contributions | 66.7 | (48.4 | ) | (18.3 | ) | — | — | ||||||||||||
Debt proceeds | 636.1 | — | 1.9 | — | 638.0 | ||||||||||||||
Debt issuance costs | (11.8 | ) | — | — | — | (11.8 | ) | ||||||||||||
Debt repayments | — | (2.9 | ) | (10.9 | ) | — | (13.8 | ) | |||||||||||
Spin-off cash distribution to Kimberly-Clark | (680.0 | ) | — | — | — | (680.0 | ) | ||||||||||||
Net transfers from (to) Kimberly-Clark | 90.2 | 77.4 | (74.3 | ) | — | 93.3 | |||||||||||||
Other | — | 3.5 | — | — | 3.5 | ||||||||||||||
Cash Provided by (Used in) Financing Activities | 101.2 | 29.6 | (101.6 | ) | — | 29.2 | |||||||||||||
Effect of Exchange Rate on Cash and Cash Equivalents | — | 0.1 | (1.6 | ) | — | (1.5 | ) | ||||||||||||
Increase in Cash and Cash Equivalents | 101.2 | 0.8 | 2.9 | — | 104.9 | ||||||||||||||
Cash and Cash Equivalents, Beginning of Period | — | 3.1 | 41.0 | — | 44.1 | ||||||||||||||
Cash and Cash Equivalents, End of Period | $ | 101.2 | $ | 3.9 | $ | 43.9 | $ | — | $ | 149.0 | |||||||||
67 | ||
HALYARD HEALTH, INC. AND SUBSIDIARIES
CONDENSED COMBINED CONSOLIDATING STATEMENTS OF CASH FLOWS
(in millions)
Year Ended December 31, 2013 | |||||||||||||||||||
Parent | Guarantor Subsidiaries | Non-Guarantor Subsidiaries | Eliminations | Consolidated and Combined | |||||||||||||||
Operating Activities | |||||||||||||||||||
Cash Provided by Operating Activities | $ | — | $ | 114.6 | $ | 109.2 | $ | — | $ | 223.8 | |||||||||
Investing Activities | |||||||||||||||||||
Capital expenditures | — | (36.0 | ) | (13.0 | ) | — | (49.0 | ) | |||||||||||
Cash outflows for acquisitions | — | (2.2 | ) | — | — | (2.2 | ) | ||||||||||||
Deposit received on pending sale of assets | — | 0.2 | 0.1 | — | 0.3 | ||||||||||||||
Cash Used in Investing Activities | — | (38.0 | ) | (12.9 | ) | — | (50.9 | ) | |||||||||||
Financing Activities | |||||||||||||||||||
Debt proceeds | — | — | 4.0 | — | 4.0 | ||||||||||||||
Debt repayments | — | (6.4 | ) | (61.5 | ) | — | (67.9 | ) | |||||||||||
Net transfers from (to) Kimberly-Clark | — | (76.7 | ) | (42.6 | ) | — | (119.3 | ) | |||||||||||
Other | — | 3.2 | — | — | 3.2 | ||||||||||||||
Cash Used in Financing Activities | — | (79.9 | ) | (100.1 | ) | — | (180.0 | ) | |||||||||||
Effect of Exchange Rate on Cash and Cash Equivalents | — | 0.9 | 2.4 | — | 3.3 | ||||||||||||||
Decrease in Cash and Cash Equivalents | — | (2.4 | ) | (1.4 | ) | — | (3.8 | ) | |||||||||||
Cash and Cash Equivalents, Beginning of Period | — | 5.5 | 42.4 | — | 47.9 | ||||||||||||||
Cash and Cash Equivalents, End of Period | $ | — | $ | 3.1 | $ | 41.0 | $ | — | $ | 44.1 | |||||||||
68 | ||
REPORT OF INDEPENDENT REGISTERED PUBLIC ACCOUNTING FIRM
To the Board of Directors and Stockholders of
Halyard Health, Inc.
Atlanta, Georgia
We have audited the accompanying consolidated balance sheets of Halyard Health, Inc. and subsidiaries (the "Company") as of December 31, 2015 and 2014, and the related consolidated statements of income, comprehensive income, stockholders' equity, and cash flows for each of the three years in the period ended December 31, 2015. These financial statements are the responsibility of the Company's management. Our responsibility is to express an opinion on the financial statements based on our audits.
We conducted our audits in accordance with the standards of the Public Company Accounting Oversight Board (United States). Those standards require that we plan and perform the audit to obtain reasonable assurance about whether the financial statements are free of material misstatement. An audit includes examining, on a test basis, evidence supporting the amounts and disclosures in the financial statements. An audit also includes assessing the accounting principles used and significant estimates made by management, as well as evaluating the overall financial statement presentation. We believe that our audits provide a reasonable basis for our opinion.
In our opinion, such consolidated financial statements present fairly, in all material respects, the financial position of Halyard Health, Inc. and subsidiaries at December 31, 2015 and 2014, and the results of their operations and their cash flows for each of the three years in the period ended December 31, 2015, in conformity with accounting principles generally accepted in the United States of America.
We have also audited, in accordance with the standards of the Public Company Accounting Oversight Board (United States), the Company's internal control over financial reporting as of December 31, 2015, based on the criteria established in Internal Control - Integrated Framework (2013) issued by the Committee of Sponsoring Organizations of the Treadway Commission and our report dated February 29, 2016 expressed an unqualified opinion on the Company's internal control over financial reporting.
/s/ DELOITTE & TOUCHE LLP |
Deloitte & Touche LLP |
Atlanta, Georgia |
February 29, 2016 |
69 | ||
ITEM 9. | CHANGES IN AND DISAGREEMENTS WITH ACCOUNTANTS ON ACCOUNTING AND FINANCIAL DISCLOSURE |
None.
ITEM 9A. | CONTROLS AND PROCEDURES |
Disclosure Controls and Procedures
Our management, with the participation of our Chief Executive Officer and Chief Financial Officer, evaluated the effectiveness of our disclosure controls and procedures as of December 31, 2015. The term "disclosure controls and procedures," as defined in Rule 13a-15 under the Securities Exchange Act of 1934, as amended (or the “Exchange Act”), means controls and other procedures of a company that are designed to ensure that information required to be disclosed by a company in the reports that it files or submits under the Exchange Act is recorded, processed, summarized and reported, within the time periods specified in the SEC’s rules and forms. Disclosure controls and procedures include, without limitation, controls and procedures designed to ensure that information required to be disclosed by a company in the reports that it files or submits under the Exchange Act is accumulated and communicated to management, including our principal executive and principal financial officers, as appropriate to allow timely decisions regarding required disclosure.
Based on our evaluation, our chief executive officer and chief financial officer believe that, as of December 31, 2015, our disclosure controls and procedures were effective.
Management’s Annual Report on Internal Control Over Financial Reporting
Our management is responsible for establishing and maintaining adequate internal control over financial reporting as defined in Rule 13a-15(f) under the Securities Exchange Act of 1934. A company’s internal control over financial reporting is a process designed to provide reasonable assurance regarding the reliability of financial reporting and the preparation of financial statements for external purposes in accordance with generally accepted accounting principles. A company’s internal control over financial reporting includes those policies and procedures that (1) pertain to the maintenance of records that, in reasonable detail, accurately and fairly reflect the transactions and dispositions of the assets of the company; (2) provide reasonable assurance that transactions are recorded as necessary to permit preparation of financial statements in accordance with generally accepted accounting principles, and that receipts and expenditures of the company are being made only in accordance with authorizations of management and directors of the company; and (3) provide reasonable assurance regarding prevention or timely detection of unauthorized acquisition, use, or disposition of the company’s assets that could have a material effect on the financial statements.
Because of its inherent limitations, internal control over financial reporting may not prevent or detect misstatements. Also, projections of any evaluation of effectiveness to future periods are subject to the risk that controls may become inadequate because of changes in conditions, or that the degree of compliance with the policies or procedures may deteriorate.
Under the supervision and with the participation of our management, including our principal executive officer and principal financial officer, we conducted an evaluation of the effectiveness of our internal control over financial reporting as of December 31, 2015 based on the criteria related to internal control over financial reporting described in Internal Control - Integrated Framework (2013) issued by the Committee of Sponsoring Organizations of the Treadway Commission. Based on our evaluation, management concluded that our internal control over financial reporting was effective as of December 31, 2015.
Deloitte & Touche LLP, the independent registered public accounting firm that audited the consolidated financial statements included in this Form 10-K, has issued a report, included herein, on the effectiveness of the Company's internal control over financial reporting as of December 31, 2015.
Changes in Internal Control Over Financial Reporting
Historically, we have relied on Kimberly-Clark’s financial controls and resources to manage certain aspects of our business and report our results. As a result of the Spin-off, we reviewed, revised and adopted policies, procedures and controls, as needed, to meet all regulatory requirements applicable to us as an independent, publicly-traded company. These revisions led to changes in staffing, policies, procedures, controls and systems that were accomplished prior to December 31, 2015.
Other than those noted above, there have been no changes in our internal control over financial reporting that occurred during our fourth fiscal quarter that have materially affected, or are reasonably likely to materially affect, our internal control over financial reporting.
70 | ||
REPORT OF INDEPENDENT REGISTERED PUBLIC ACCOUNTING FIRM
To the Board of Directors and Stockholders of
Halyard Health, Inc.
Atlanta, Georgia
We have audited the internal control over financial reporting of Halyard Health, Inc. and subsidiaries (the "Company") as of December 31, 2015, based on criteria established in Internal Control - Integrated Framework (2013) issued by the Committee of Sponsoring Organizations of the Treadway Commission. The Company's management is responsible for maintaining effective internal control over financial reporting and for its assessment of the effectiveness of internal control over financial reporting, included in the accompanying Management's Annual Report on Internal Control Over Financial Reporting. Our responsibility is to express an opinion on the Company's internal control over financial reporting based on our audit.
We conducted our audit in accordance with the standards of the Public Company Accounting Oversight Board (United States). Those standards require that we plan and perform the audit to obtain reasonable assurance about whether effective internal control over financial reporting was maintained in all material respects. Our audit included obtaining an understanding of internal control over financial reporting, assessing the risk that a material weakness exists, testing and evaluating the design and operating effectiveness of internal control based on the assessed risk, and performing such other procedures as we considered necessary in the circumstances. We believe that our audit provides a reasonable basis for our opinion.
A company's internal control over financial reporting is a process designed by, or under the supervision of, the company's principal executive and principal financial officers, or persons performing similar functions, and effected by the company's board of directors, management, and other personnel to provide reasonable assurance regarding the reliability of financial reporting and the preparation of financial statements for external purposes in accordance with generally accepted accounting principles. A company's internal control over financial reporting includes those policies and procedures that (1) pertain to the maintenance of records that, in reasonable detail, accurately and fairly reflect the transactions and dispositions of the assets of the company; (2) provide reasonable assurance that transactions are recorded as necessary to permit preparation of financial statements in accordance with generally accepted accounting principles, and that receipts and expenditures of the company are being made only in accordance with authorizations of management and directors of the company; and (3) provide reasonable assurance regarding prevention or timely detection of unauthorized acquisition, use, or disposition of the company's assets that could have a material effect on the financial statements.
Because of the inherent limitations of internal control over financial reporting, including the possibility of collusion or improper management override of controls, material misstatements due to error or fraud may not be prevented or detected on a timely basis. Also, projections of any evaluation of the effectiveness of the internal control over financial reporting to future periods are subject to the risk that the controls may become inadequate because of changes in conditions, or that the degree of compliance with the policies or procedures may deteriorate.
In our opinion, the Company maintained, in all material respects, effective internal control over financial reporting as of December 31, 2015, based on the criteria established in Internal Control - Integrated Framework (2013) issued by the Committee of Sponsoring Organizations of the Treadway Commission.
We have also audited, in accordance with the standards of the Public Company Accounting Oversight Board (United States), the consolidated financial statements as of and for the year ended December 31, 2015 of the Company and our report dated February 29, 2016 expressed an unqualified opinion on those financial statements.
/s/ DELOITTE & TOUCHE LLP |
Deloitte & Touche LLP |
Atlanta, Georgia |
February 29, 2016 |
71 | ||
ITEM 9B. OTHER INFORMATION
None.
PART III
ITEM 10. DIRECTORS, EXECUTIVE OFFICERS AND CORPORATE GOVERNANCE
The following sections of our 2016 Proxy Statement for the Annual Meeting of Stockholders (the “2016 Proxy Statement”) are incorporated in this Item 10 by reference:
• | “The Nominees” and “Directors Continuing in Office” under “Proposal 1. Election of Directors,” which identifies our directors and nominees for our Board of Directors. |
• | “Other Information—Section 16(a) Beneficial Ownership Reporting Compliance.” |
• | “Corporate Governance—Other Corporate Governance Policies and Practices–Code of Conduct,” which describes our Code of Conduct. |
• | “Other Information—Stockholder Nominations for Board of Directors,” which describes the procedures by which stockholders may nominate candidates for election to our Board of Directors. |
• | “Corporate Governance—Board Committees–Audit Committee,” which identifies members of the Audit Committee of our Board of Directors and an audit committee financial expert. |
Information regarding our executive officers is reported under the caption “Executive Officers of the Registrant” in Part I of this Report.
ITEM 11. EXECUTIVE COMPENSATION
The information in the sections of the 2016 Proxy Statement captioned “Compensation Discussion and Analysis,” “Compensation Tables,” “Director Compensation” and “Corporate Governance—Compensation Committee Interlocks and Insider Participation” is incorporated in this Item 11 by reference.
ITEM 12. | SECURITY OWNERSHIP OF CERTAIN BENEFICIAL OWNERS AND MANAGEMENT AND RELATED STOCKHOLDER MATTERS |
The information in the section of the 2016 Proxy Statement captioned “Other Information—Security Ownership Information” is incorporated in this Item 12 by reference.
Equity Compensation Plan Information
The following table gives information about our common stock that may be issued upon the exercise of options, warrants and rights under all of our equity compensation plans as of December 31, 2015.
Number of securities to be issued upon exercise of outstanding options, warrants, and rights (in thousands) (a) | Weighted average exercise price of outstanding options, warrants, and rights (b) | Number of securities remaining available for future issuance under equity compensation plans (excluding securities reflected in column (a)) (in thousands) (c) | |||
Equity compensation plans approved by stockholders(1) | 1,665(2) | $40.70 | 3,134 | ||
(1) | Includes (a) the Halyard Health, Inc. Equity Participation Plan (the “Employee Plan”), effective November 1, 2014 and (b) the Halyard Health, Inc. Outside Directors’ Compensation Plan, effective November 1, 2014 (the “Director Plan”). |
(2) | Includes 492 restricted share units granted under the Employee Plan (including shares that may be issued pursuant to outstanding performance-based restricted share units, assuming the target award is met; actual shares issued may vary, depending on actual performance). Upon vesting, a share of Halyard common stock is issued for each restricted share unit. Column (a) also includes 27 restricted share units granted under the Director Plan. Under the Director Plan, upon retirement from, or any other termination of service from the Board, a share of Halyard common stock is issued for each restricted share unit. Column (b) does not take these awards into account because they do not have an exercise price. |
72 | ||
Halyard Health, Inc. Outside Directors’ Compensation Plan
In 2014, our Board of Directors and our stockholders approved the Director Plan. A maximum of 400,000 shares of our common stock is available for grant under this plan. The Board may grant awards in the form of stock options, stock appreciation rights, restricted stock, restricted share units or any combination of cash, stock options, stock appreciation rights, restricted stock or restricted share units under this plan.
ITEM 13. CERTAIN RELATIONSHIPS AND RELATED TRANSACTIONS, AND DIRECTOR INDEPENDENCE
The information in the sections of the 2016 Proxy Statement captioned “Other Information—Transactions with Related Persons” and “Corporate Governance—Director Independence” is incorporated in this Item 13 by reference.
ITEM 14. PRINCIPAL ACCOUNTING FEES AND SERVICES
The information in the sections of the 2016 Proxy Statement captioned “Principal Accounting Firm Fees” and “Audit Committee Approval of Audit and Non-Audit Services” under “Proposal 2. Ratification of Auditors” is incorporated in this Item 14 by reference.
73 | ||
PART IV
ITEM 15. EXHIBITS, FINANCIAL STATEMENT SCHEDULES
(a) | Documents filed as part of this report. |
1. | Financial statements. |
The financial statements are set forth under Item 8 of this report on Form 10-K.
2. | Financial statement schedules. |
The following information is filed as part of this Form 10-K and should be read in conjunction with the financial statements contained in Item 8:
•Report of Independent Registered Public Accounting Firm
All other schedules have been omitted because they were not applicable or because the required information has been included in the financial statements or notes thereto.
3. | Exhibits |
Exhibit No. (12) | Computation of ratio of earnings to fixed charges for the five years ended December 31, 2015, filed herewith. |
Exhibit No. (21) | Subsidiaries of the Corporation, filed herewith. |
Exhibit No. (23) | Consent of Independent Registered Public Accounting Firm, filed herewith. |
Exhibit No. (24) | Powers of Attorney, filed herewith. |
Exhibit No. (31)a | Certification of Chief Executive Officer required by Rule 13a-14(a) or Rule 15d-14(a) of the Securities Exchange Act of 1934, as amended (the “Exchange Act”), filed herewith. |
Exhibit No. (31)b | Certification of Chief Financial Officer required by Rule 13a-14(a) or Rule 15d-14(a) of the Exchange Act, filed herewith. |
Exhibit No. (32)a | Certification of Chief Executive Officer required by Rule 13a-14(b) or Rule 15d-14(b) of the Exchange Act and Section 1350 of Chapter 63 of Title 18 of the United States Code, furnished herewith. |
Exhibit No. (32)b | Certification of Chief Financial Officer required by Rule 13a-14(b) or Rule 15d-14(b) of the Exchange Act and Section 1350 of Chapter 63 of Title 18 of the United States Code, furnished herewith. |
Exhibit No. (101).INS | XBRL Instance Document |
Exhibit No. (101).SCH | XBRL Taxonomy Extension Schema Document |
Exhibit No. (101).CAL | XBRL Taxonomy Extension Calculation Linkbase Document |
Exhibit No. (101).DEF | XBRL Taxonomy Extension Definition Linkbase Document |
Exhibit No. (101).LAB | XBRL Taxonomy Extension Label Linkbase Document |
Exhibit No. (101).PRE | XBRL Taxonomy Extension Presentation Linkbase Document |
74 | ||
SIGNATURES
Pursuant to the requirements of Section 13 or 15(d) of the Securities Exchange Act of 1934, the registrant has duly caused this report to be signed on its behalf by the undersigned, thereunto duly authorized.
HALYARD HEALTH, INC. | ||
February 29, 2016 | By: | /s/ Steven E. Voskuil |
Steven E. Voskuil | ||
Senior Vice President and | ||
Chief Financial Officer | ||
Pursuant to the requirements of the Securities Exchange Act of 1934, this report has been signed below by the following persons on behalf of the registrant and in the capacities and on the dates indicated.
/s/ Robert E. Abernathy | Chairman of the Board and Chief Executive Officer and Director (principal executive officer) | February 29, 2016 | |
Robert E. Abernathy | |||
/s/ Steven E. Voskuil | Senior Vice President and Chief Financial Officer (principal financial officer) | February 29, 2016 | |
Steven E. Voskuil | |||
/s/ Renato Negro | Vice President and Controller (principal accounting officer) | February 29, 2016 | |
Renato Negro | |||
Directors
Gary D. Blackford |
John P. Byrnes |
Ronald W. Dollens |
Heidi K. Fields |
William A. Hawkins III |
Patrick J. O’Leary |
Maria Sainz |
Dr. Julie Shimer |
By: | /s/ S. Ross Mansbach | February 29, 2016 | |
S. Ross Mansbach Attorney-in-Fact | |||
75 | ||