Attached files
| file | filename |
|---|---|
| EX-99.1 - EX-99.1 - Starwood Waypoint Homes | sfr-ex991_6.htm |
| 8-K - 8-K - Starwood Waypoint Homes | sfr-8k_20160229.htm |
Exhibit 99.2

On January 5, 2016, we completed the merger between Starwood Waypoint Residential Trust (“SWAY”) and Colony American Homes (“CAH”) (the “Merger”) and the internalization of SWAY’s manager (the “Internalization”), forming a company with a combined asset value of over $7 billion and over 30,000 homes. In connection with the merger, SWAY was renamed Colony Starwood Homes and began trading under the ticker symbol “SFR” on the New York Stock Exchange.
Consolidated financial statements as of and for the three months and year ended December 31, 2015 included herein primarily represent the pre-Merger consolidated financial position and results of operations of SWAY. We have also provided herein selected CAH financial and operating results as of and for the three months and year ended December 31, 2015.
|
|
|

|
|
Pages |
|
|
|
|
COMBINED COMPANY: SWAY & CAH |
1-3 |
|
|
|
|
ABOUT SWAY |
4-6 |
|
|
|
|
FINANCIAL INFORMATION: SWAY |
|
|
Selected Financial & Other Information |
7 |
|
Consolidated Balance Sheets |
8 |
|
Consolidated Statements of Operations |
9 |
|
NAREIT FFO, Core FFO & Core FFO as Adjusted |
10 |
|
NOI and Same Store Growth |
11 |
|
|
|
|
DEBT STRUCTURE: SWAY |
12 |
|
|
|
|
PORTFOLIO INFORMATION: SWAY |
|
|
Total Rental Homes Portfolio |
13 |
|
Rent Growth by Lease Category |
14 |
|
Leasing Statistics |
15 |
|
NPL Portfolio |
16 |
|
|
|
|
TRANSACTION ACTIVITY: SWAY |
|
|
Acquisitions |
17 |
|
|
|
|
DEFINITIONS AND RECONCILIATIONS |
18-22 |
|
|
|
Q4 2015 Highlights
|
|
|
|
|
|
|
|
|
|
|
|
|
|
|
|
|
|
|
|
|
|
|
|
|
|
|
|
n Achieved 63.2% net operating income (“NOI”) margin(1) on SWAY’s stabilized single-family rental (“SFR”)(2) portfolio |
|
||||||||||||||||||
|
Summary |
|
|
n Our Board increased our share repurchase program to $250 million |
|
||||||||||||||||||
|
|
|
|
n Our Board approved a $0.22 quarterly dividend, a 16% increase from SWAY pre-Merger |
|
||||||||||||||||||
|
|
|
|
|
|
|
|
|
|
|
|
|
|
|
|
||||||||
|
|
|
|
|
|
|
|
|
|
|
|
|
|
|
|
|
|
|
|
|
|
|
|
|
|
|
|
|
|
|
|
|
|
|
|
|
|
|
|
|
|
|
|
|
|
|
|
|
|
|
|
|
Three Months Ended |
|
|
|
|
|
Year Ended |
|
|
|
|
||||||||
|
|
|
|
|
December 31, 2015 |
|
|
|
|
|
December 31, 2015 |
|
|
|
|
||||||||
|
Financial Results: SWAY and CAH |
|
|
(in millions, except per share data) |
SWAY |
|
CAH |
|
|
|
|
|
SWAY |
|
CAH |
|
|
|
|
||||
|
|
|
Total Revenue |
$ |
64.9 |
|
$ |
80.9 |
|
|
|
|
|
$ |
271.8 |
|
$ |
303.7 |
|
|
|
|
|
|
|
|
Net Loss Attributable to Common Shareholders |
$ |
(29.8 |
) |
$ |
(14.3 |
) |
|
|
|
|
$ |
(44.4 |
) |
$ |
(37.8 |
) |
|
|
|
|
|
|
|
|
Core FFO as Adjusted(1) |
$ |
6.9 |
|
$ |
22.1 |
|
|
|
|
|
$ |
63.7 |
|
$ |
65.1 |
|
|
|
|
|
|
|
|
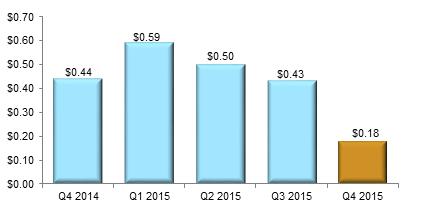
Core FFO as Adjusted per common share(1) |
$ |
0.18 |
|
|
|
|
|
|
|
|
$ |
1.68 |
|
|
|
|
|
|
|
|
|
|
|
|
|
|
|
|
|
|
|
|
|
|
|
|
|
|
|
|
|
|
|
|
|
|
|
|
|
|
|
|
|
|
|
|
|
|
|
|
|
|
|
|
|
|
|
|
|
|
|
|
|
|
|
|
|
|
|
|
|
|
|
|
|
|
|
|
|
|
|
|
|
|
|
|
|
|
|
|
|
|
|
|
|
|
Three Months Ended |
|
|||||||
|
|
|
|
|
As of December 31, 2015 |
|
|
December 31, 2015 |
|
||||||||||||||
|
|
|
|
|
|
|
|
|
|
|
Combined |
|
|
|
|
|
|
|
|
Combined |
|
||
|
|
|
|
|
SWAY |
|
CAH |
|
Company |
|
|
SWAY |
|
CAH |
|
Company |
|
||||||
|
Operations: SWAY and CAH |
|
|
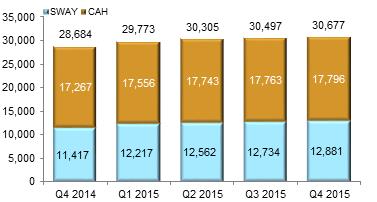
SFR Portfolio Homes(3) |
|
12,881 |
|
|
17,796 |
|
|
30,677 |
|
|
|
|
|
|
|
|
|
|
|
|
|
|
Average monthly rent per home(3) |
$ |
1,510 |
|
$ |
1,503 |
|
$ |
1,506 |
|
|
|
|
|
|
|
|
|
|
|
|
|
|
|
Total portfolio occupancy(3)(4) |
|
89.5 |
% |
|
94.9 |
% |
|
92.6 |
% |
|
|
|
|
|
|
|
|
|
|
|
|
|
|
|
Stabilized occupancy(3)(5) |
|
93.2 |
% |
|
95.5 |
% |
|
94.6 |
% |
|
|
|
|
|
|
|
|
|
|
|
|
|
|
Renewal rent growth(3)(6) |
|
|
|
|
|
|
|
|
|
|
|
3.5 |
% |
|
5.7 |
% |
|
4.9 |
% |
|
|
|
|
Replacement rent growth(3) |
|
|
|
|
|
|
|
|
|
|
|
2.1 |
% |
|
4.1 |
% |
|
3.4 |
% |
|
|
|
|
Blended rent growth(3) |
|
|
|
|
|
|
|
|
|
|
|
2.6 |
% |
|
5.0 |
% |
|
4.2 |
% |
|
|
|
|
Retention(3) |
|
|
|
|
|
|
|
|
|
|
|
72.3 |
% |
|
76.8 |
% |
|
75.0 |
% |
|
|
|
|
Turnover(7) |
|
|
|
|
|
|
|
|
|
|
|
30.7 |
% |
|
33.3 |
% |
|
32.3 |
% |
|
|
|
|
|
|
|
|
|
|
|
|
|
|
|
|
|
|
|
|
|
|
|
|
|
|
(1) |
NOI margin and Core Funds from Operations (“FFO”) as Adjusted are non-generally accepted accounting principles (“GAAP”) measures. For explanations of these measures and reconciliations to the applicable GAAP measures, please refer to the “NAREIT FFO, Core FFO & Core FFO as Adjusted” and “Definitions and Reconciliations” pages of this presentation. |
(2)As used in this presentation, SFR refers to “single-family rental” homes and not the ticker symbol “SFR” under which our shares are traded subsequent to the Merger.
|
|
(3) |
Excludes 1,218 and 106 homes SWAY and CAH did not intend to hold for the long term as of December 31, 2015, respectively. |
|
|
(4) |
Represents number of homes occupied as of the last day of the period, divided by total SFR portfolio homes. |
|
|
(5) |
Represents occupied homes as of the last day of the period divided by homes that are currently occupied or have been occupied in prior periods. |
|
|
(6) |
Renewal rent growth includes rent growth from renewals and escalation clauses on multi-year leases. |
|
|
(7) |
Turnover is calculated as the annualized monthly average of total resident move-outs for the month divided by occupied homes at the end of the month. |
|
|
1 |
Portfolio and Leasing Trends
|
Total SFRs(1) |
|
% Occupied: Total Rental Portfolio(1) |
|
|
|
|
|
% Leased: Homes Owned 180 Days or Longer(1) |
|
% Occupied: Stabilized Home Portfolio(1) |
|
|
|
|


|
|
(1) |
SWAY values exclude 1,218, 1,421, 1,205, 1,151 and 909 homes that SWAY did not intend to hold for the long term as of December 31, 2015, September 30, 2015, June 30, 2015, March 31, 2015, and December 31, 2014, respectively. CAH values exclude 106, 180, 231, 331 and 34 homes that CAH did not intend to hold for the long term as of December 31, 2015, September 30, 2015, June 30, 2015, March 31, 2015, and December 31, 2014, respectively. Also, please refer to the “Definitions and Reconciliations” pages for units as a measure of SFR count and a roll-forward of homes we do not intend to hold for the long term. |
|
|
2 |
Financing Overview
|
SWAY 2015 Financing Activity(1) |
|
Combined Company Financing Activity (1) |
|
(in millions)
|
|
(in millions)
|
|
SWAY Total Capacity(1)(2) |
|
Combined Company Total Capacity(1)(2) |
|
|
|
|


|
|
(1) |
As of December 31, 2015. |
|
|
(2) |
Total Capacity figures reflect both SFR and non-performing loan (“NPL”) activity. |
|
|
(3) |
Amounts exclude principal-only bearing subordinate Certificates, Class G, in the amounts of $26.6 million and $33.7 million retained by SWAY and CAH, respectively. |
|
|
3 |
Financial and Operating Performance Trends
|
SFR Rental Revenue (in millions) |
|
Core FFO (1)(2) |
|
|
|
|
|
Stabilized Portfolio NOI Margin(1)(2) |
|
G&A as % Total Assets(3) |
|
|
|
|


|
|
(1) |
Core FFO and Stabilized Portfolio NOI margin are non-GAAP measures. For explanations of these measures and reconciliations to the applicable GAAP measures, please refer to the “NAREIT FFO, Core FFO & Core FFO as Adjusted” and “Definitions and Reconciliations” pages of this presentation. |
|
|
(2) |
Q4 2015 results, as shown, have been adjusted for certain “out of period” tax expenses. Please refer to the “NAREIT FFO, Core FFO & Core FFO as Adjusted” page of this presentation for details of this adjustment. |
|
|
(3) |
Represents annualized quarterly G&A expense divided by total assets at quarter end. |
|
|
4 |
NPL Resolution Activity
|
Total NPL Resolutions(1)(2) |
|
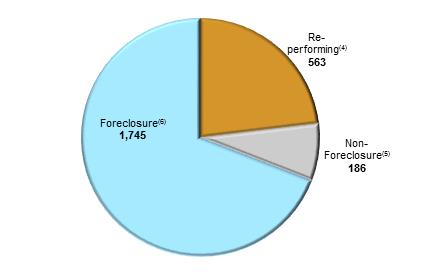
Resolutions by Type: Cumulative Since Q1 2014 |
|||||||
|
|
|
|
|||||||
|
% Resolutions by Year of Acquisition(3) |
|
||||||||
|
65% of all NPLs Acquired Have Been Resolved |
|
||||||||
|
|
|
||||||||
|
|
|
Target Allocation % |
|
Estimated |
|
Cumulative |
|
||
|
|
|
|
|
|
|
|
|
||
|
|
|
Re-performing(4) (~10-15% of loans) |
|
7 – 16 months |
|
12.1 months |
|
||
|
|
|
|
|
|
|
|
|
||
|
|
|
Non-Foreclosure(5) (~5-10% of loans) |
|
7 – 15 months |
|
13.7 months |
|
||
|
|
|
|
|
|
|
|
|
||
|
|
|
Foreclosures(6) (~75-85% of loans) |
|
12 – 21 months |
|
14.0 months |
|
||
|
|
|
|
|
|
|
|
|
|
|


|
|
(1) |
Does not include repurchases, resolutions initiated prior to closing, or trailing deeds. Resolutions also exclude Q1 2015 bulk sale of 171 loans and one individual loan sale in that quarter, and Q3 2015 bulk sale of 461 re-performing loans (“RPLs”). |
|
|
(2) |
Of the 5,758 total NPLs acquired since 2012, 2,494 were resolved during the period Q1 2014 through Q4 2015 which are broken out by quarter in the top left graph above. An additional 1,283 NPLs were resolved prior to Q1 2014. |
|
|
(3) |
A total of 3,735 NPLs, 1,538 NPLs, and 485 NPLs were acquired in 2014, 2013, and 2012, respectively. No NPLs were acquired in 2015. |
|
|
(4) |
Defined as NPLs that were either modified or reinstated and were re-performing as of the end of December 31, 2015. All resolutions included in this category have either been sold as RPLs or remain held in our portfolio and were less than 60 days past due as of December 31, 2015. |
|
|
(5) |
Includes paid-in-full, short payoff, sold notes and short sales. |
|
|
(6) |
Includes foreclosure auction sales and real estate owned (“REO”) assets (including rental conversions). |
|
|
(7) |
Represents actual timing through Q4 2015. Average time to resolution could lengthen during the life of the NPL portfolio. |
|
|
5 |
NPL Performance
|
Returns by Resolution Type: Cumulative Since Q1 2014 |
|
REO Sold |
||||||||
|
|
|
|
|
|
|
|
|
|
|
|
|
|
|
|
Estimated |
|
Cumulative |
|
|
|
Since Q1 2014, a total of $137.4 million of REO |
|
|
|
|
|
|
|
|
|
|
|
|
|
|
|
Re-performing(1) |
|
~1.20 – 1.45x |
|
9.5% current yield(6) |
|
|
|
Cumulative REO Sold(7) |
|
|
|
|
|
|
|
|
|
|
|
|
|
|
|
Non-Foreclosure(2) |
|
~1.15 – 1.35x |
|
1.40x |
|
|
|||
|
|
|
|
|
|
|
|
|
|||
|
|
Foreclosed and Sold(3) |
|
~1.20 – 1.30x |
|
1.21x |
|
|
|||
|
|
|
|
|
|
|
|
|
|||
|
|
|
|||||||||
|
|
|
|
|
|
|
|
|
|
||


|
|
(1) |
Defined as NPLs that were either modified or reinstated and were re-performing as of the end of the reported quarter. All loans in this category were less than 60 days past due at December 31, 2015 and exclude Q1 2015 resolutions of a bulk sale of 171 loans and one individual loan sale and Q3 2015 bulk sale of 461 RPLs. |
|
|
(2) |
Includes paid-in-full, short payoff, sold notes and short sales. |
|
|
(3) |
Includes foreclosure auction sales and REO assets (including rental conversions). Actual Total Return includes foreclosure auction sales and sold REO assets only. |
|
|
(4) |
Estimated return multiples are meant to illustrate an estimated return for a standard NPL resolution of a single asset. Ranges are affected by the equity percentage of each asset as well as other factors. |
|
|
(5) |
Total Return is defined as proceeds (net of selling costs but before conversion costs) divided by purchase price. Conversion costs vary by state but have averaged less than 10% (unlevered) for REO that has been sold. |
|
|
(6) |
Yield is defined as principal and interest payments as a percentage of purchase price. |
|
|
(7) |
Excludes 363 of REO held for sale as of December 31, 2015. |
|
|
6 |
Selected Financial & Other Information
|
|
|
|
|
|
|
|
|
Three Months Ended |
|
|
Twelve Months Ended |
|
||
|
(in thousands, except share and per share data) |
|
|
|
|
|
|
|
December 31, 2015 |
|
|
December 31, 2015 |
|
||
|
|
|
|
|
|
|
|
|
(unaudited) |
|
|
(unaudited) |
|
||
|
|
|
|
|
|
|
|
|
|
|
|
|
|
|
|
|
Total revenues |
|
|
|
|
|
|
|
$ |
64,894 |
|
|
$ |
271,837 |
|
|
Net loss attributable to Starwood Waypoint Residential Trust shareholders |
|
|
|
|
|
$ |
(29,786 |
) |
|
$ |
(44,393 |
) |
||
|
Core FFO as Adjusted(1) |
|
|
|
|
|
|
|
$ |
6,915 |
|
|
$ |
63,697 |
|
|
|
|
|
|
|
|
|
|
|
|
|
|
|
|
|
|
Per common share - basic and diluted |
|
|
|
|
|
|
|
|
|
|
|
|
|
|
|
Net loss attributable to Starwood Waypoint Residential Trust shareholders |
|
|
|
|
|
$ |
(0.78 |
) |
|
$ |
(1.17 |
) |
||
|
Core FFO as Adjusted per common share(1) |
|
|
|
|
|
$ |
0.18 |
|
|
$ |
1.68 |
|
||
|
Dividends declared per common share |
|
|
|
|
|
$ |
0.19 |
|
|
$ |
0.66 |
|
||
|
Weighted-average shares outstanding - basic and diluted |
|
|
|
|
|
|
37,972,846 |
|
|
|
37,949,784 |
|
||
|
|
|
|
|
|
|
|
|
|
|
|
|
|
|
|
|
Stabilized Portfolio NOI Margin(2) |
|
|
|
|
|
|
|
|
63.2 |
% |
|
|
64.1 |
% |
|
|
|
|
|
As of |
|
|||||||||||||
|
|
|
|
|
December 31, 2015 |
|
|
September 30, 2015 |
|
|
June 30, 2015 |
|
|
March 31, 2015 |
|
||||
|
Home Count: |
|
|
|
|
|
|
|
|
|
|
|
|
|
|
|
|
|
|
|
Stabilized homes(3) |
|
|
|
|
12,326 |
|
|
|
12,016 |
|
|
|
11,822 |
|
|
|
10,970 |
|
|
Non-stabilized homes(3) |
|
|
|
|
555 |
|
|
|
718 |
|
|
|
740 |
|
|
|
1,247 |
|
|
Total Homes(4) |
|
|
|
|
12,881 |
|
|
|
12,734 |
|
|
|
12,562 |
|
|
|
12,217 |
|
|
|
|
|
|
|
|
|
|
|
|
|
|
|
|
|
|
|
|
|
|
Leased Percentages(4) |
|
|
|
|
|
|
|
|
|
|
|
|
|
|
|
|
|
|
|
Stabilized homes |
|
|
|
|
94.9 |
% |
|
|
95.3 |
% |
|
|
96.6 |
% |
|
|
96.8 |
% |
|
Homes owned 180 days or longer |
|
|
|
|
94.1 |
% |
|
|
94.6 |
% |
|
|
95.7 |
% |
|
|
95.0 |
% |
|
Total rental portfolio |
|
|
|
|
91.5 |
% |
|
|
90.7 |
% |
|
|
92.2 |
% |
|
|
89.1 |
% |
|
(1) |
Please refer to the “Definitions and Reconciliations” pages of this presentation for a definition of Core FFO as Adjusted. Core FFO as Adjusted is a non-GAAP measure. For a reconciliation of Core FFO as Adjusted to net loss attributable to Starwood Waypoint Residential Trusts' shareholders determined in accordance with GAAP, please refer to the “NAREIT FFO, Core FFO & Core FFO as Adjusted” page of this presentation. |
|
(2) |
Stabilized portfolio NOI margin is a non-GAAP measure. For a reconciliation of stabilized portfolio NOI to net loss attributable to Starwood Waypoint Residential Trust shareholders determined in accordance with GAAP, please refer to the “Definitions and Reconciliations” pages of this presentation. |
|
(3) |
Please refer to the “Definitions and Reconciliation” pages of this presentation for a definition of stabilized and non-stabilized homes. |
|
(4) |
Excludes 1,218, 1,421, 1,205, and 1,151 homes that we did not intend to hold for the long term as of December 31, 2015, September 30, 2015, June 30, 2015, and March 31, 2015, respectively. Please refer to the “Definitions and Reconciliations” pages of this presentation for a definition of homes we did not intend to hold for the long term and a period end roll-forward schedule. |
|
|
7 |
Consolidated Balance Sheets
|
(in thousands) |
|
December 31, 2015 |
|
|
December 31, 2014 |
|
||
|
|
|
|
|
|
|
|
|
|
|
ASSETS |
|
|
|
|
|
|
|
|
|
Investments in real estate properties |
|
|
|
|
|
|
|
|
|
Land |
|
$ |
407,848 |
|
|
$ |
359,889 |
|
|
Building and improvements |
|
|
1,928,207 |
|
|
|
1,619,622 |
|
|
Total investments in real estate properties |
|
|
2,336,055 |
|
|
|
1,979,511 |
|
|
Less accumulated depreciation |
|
|
(109,403 |
) |
|
|
(41,563 |
) |
|
Investments in real estate properties, net |
|
|
2,226,652 |
|
|
|
1,937,948 |
|
|
Real estate held for sale, net |
|
|
79,669 |
|
|
|
32,102 |
|
|
Total investments in real estate properties, net |
|
|
2,306,321 |
|
|
|
1,970,050 |
|
|
Non-performing loans |
|
|
64,620 |
|
|
|
125,488 |
|
|
Non-performing loans held for sale |
|
|
— |
|
|
|
26,911 |
|
|
Non-performing loans (fair value option) |
|
|
380,613 |
|
|
|
491,790 |
|
|
Resident and other receivables, net |
|
|
17,670 |
|
|
|
17,270 |
|
|
Cash and cash equivalents |
|
|
87,485 |
|
|
|
175,198 |
|
|
Restricted cash |
|
|
84,542 |
|
|
|
50,749 |
|
|
Deferred financing costs, net |
|
|
26,375 |
|
|
|
34,160 |
|
|
Asset-backed securitization certificates |
|
|
26,553 |
|
|
|
26,553 |
|
|
Other assets |
|
|
13,500 |
|
|
|
17,994 |
|
|
Total assets |
|
$ |
3,007,679 |
|
|
$ |
2,936,163 |
|
|
|
|
|
|
|
|
|
|
|
|
LIABILITIES AND EQUITY |
|
|
|
|
|
|
|
|
|
Liabilities: |
|
|
|
|
|
|
|
|
|
Senior SFR facility |
|
$ |
741,207 |
|
|
$ |
441,239 |
|
|
Master repurchase agreement |
|
|
274,441 |
|
|
|
454,249 |
|
|
Asset-backed securitization, net |
|
|
527,262 |
|
|
|
526,816 |
|
|
Convertible senior notes, net |
|
|
372,636 |
|
|
|
363,110 |
|
|
Accounts payable and accrued expenses |
|
|
58,105 |
|
|
|
52,457 |
|
|
Resident security deposits and prepaid rent |
|
|
23,151 |
|
|
|
17,857 |
|
|
Total liabilities |
|
|
1,996,802 |
|
|
|
1,855,728 |
|
|
|
|
|
|
|
|
|
|
|
|
Equity: |
|
|
|
|
|
|
|
|
|
Starwood Waypoint Residential Trust equity: |
|
|
|
|
|
|
|
|
|
Common shares, at par |
|
|
380 |
|
|
|
378 |
|
|
Additional paid-in capital |
|
|
1,132,308 |
|
|
|
1,133,239 |
|
|
Accumulated deficit |
|
|
(123,626 |
) |
|
|
(53,723 |
) |
|
Accumulated other comprehensive loss |
|
|
(170 |
) |
|
|
(70 |
) |
|
Total Starwood Waypoint Residential Trust equity |
|
|
1,008,892 |
|
|
|
1,079,824 |
|
|
Non-controlling interests |
|
|
1,985 |
|
|
|
611 |
|
|
Total equity |
|
|
1,010,877 |
|
|
|
1,080,435 |
|
|
Total liabilities and equity |
|
$ |
3,007,679 |
|
|
$ |
2,936,163 |
|
|
|
8 |
Consolidated Statements of Operations
|
|
|
Three Months Ended December 31, |
|
|
Twelve Months Ended December 31, |
|
||||||||||
|
(in thousands, except share and per share data) |
|
|
2015 |
|
|
|
2014 |
|
|
|
2015 |
|
|
|
2014 |
|
|
|
|
|
|
|
|
|
||||||||||
|
Revenues |
|
|
|
|
|
|
|
|
|
|
|
|
|
|
|
|
|
Rental revenues, net |
|
$ |
50,211 |
|
|
$ |
37,097 |
|
|
$ |
188,068 |
|
|
$ |
104,830 |
|
|
Other property revenues |
|
|
2,033 |
|
|
|
1,073 |
|
|
|
6,667 |
|
|
|
3,581 |
|
|
Realized gain on non-performing loans, net |
|
|
3,560 |
|
|
|
2,629 |
|
|
|
44,070 |
|
|
|
9,770 |
|
|
Realized gain on loan conversions, net |
|
|
9,090 |
|
|
|
6,994 |
|
|
|
33,032 |
|
|
|
24,682 |
|
|
Total revenues |
|
|
64,894 |
|
|
|
47,793 |
|
|
|
271,837 |
|
|
|
142,863 |
|
|
|
|
|
|
|
|
|
|
|
|
|
|
|
|
|
|
|
|
Expenses |
|
|
|
|
|
|
|
|
|
|
|
|
|
|
|
|
|
Property operating and maintenance |
|
|
12,393 |
|
|
|
8,633 |
|
|
|
45,493 |
|
|
|
31,252 |
|
|
Real estate taxes and insurance |
|
|
13,097 |
|
|
|
9,592 |
|
|
|
40,599 |
|
|
|
22,346 |
|
|
Mortgage loan servicing costs |
|
|
9,533 |
|
|
|
11,020 |
|
|
|
39,518 |
|
|
|
28,959 |
|
|
Non-performing loan management fees and expenses |
|
|
2,141 |
|
|
|
3,150 |
|
|
|
11,442 |
|
|
|
10,944 |
|
|
General and administrative |
|
|
4,609 |
|
|
|
4,866 |
|
|
|
16,436 |
|
|
|
19,307 |
|
|
Share-based compensation |
|
|
1,568 |
|
|
|
3,898 |
|
|
|
7,229 |
|
|
|
8,458 |
|
|
Investment management fees |
|
|
4,517 |
|
|
|
4,825 |
|
|
|
18,843 |
|
|
|
16,097 |
|
|
Acquisition fees and other expenses |
|
|
254 |
|
|
|
637 |
|
|
|
1,120 |
|
|
|
1,301 |
|
|
Interest expense, including amortization |
|
|
19,388 |
|
|
|
16,633 |
|
|
|
76,800 |
|
|
|
35,223 |
|
|
Depreciation and amortization |
|
|
23,305 |
|
|
|
19,918 |
|
|
|
80,080 |
|
|
|
41,872 |
|
|
Separation costs |
|
|
— |
|
|
|
— |
|
|
|
— |
|
|
|
3,543 |
|
|
Transaction-related expenses |
|
|
7,564 |
|
|
|
— |
|
|
|
11,852 |
|
|
|
— |
|
|
Finance-related expenses and write-off of loan costs |
|
|
2,370 |
|
|
|
940 |
|
|
|
4,547 |
|
|
|
7,715 |
|
|
Impairment of real estate |
|
|
2,261 |
|
|
|
171 |
|
|
|
3,122 |
|
|
|
2,579 |
|
|
Total expenses |
|
|
103,000 |
|
|
|
84,283 |
|
|
|
357,081 |
|
|
|
229,596 |
|
|
Loss before other income, income tax expense and non-controlling interests |
|
|
(38,106 |
) |
|
|
(36,490 |
) |
|
|
(85,244 |
) |
|
|
(86,733 |
) |
|
Other income (expense) |
|
|
|
|
|
|
|
|
|
|
|
|
|
|
|
|
|
Realized gain (loss) on sales of investments in real estate, net |
|
|
1,975 |
|
|
|
(148 |
) |
|
|
4,151 |
|
|
|
(224 |
) |
|
Realized loss on divestiture homes, net |
|
|
(3,870 |
) |
|
|
— |
|
|
|
(6,871 |
) |
|
|
— |
|
|
Unrealized gain on non-performing loans, net(1) |
|
|
9,954 |
|
|
|
27,247 |
|
|
|
44,385 |
|
|
|
44,593 |
|
|
Loss on derivative financial instruments, net |
|
|
(12 |
) |
|
|
(132 |
) |
|
|
(319 |
) |
|
|
(706 |
) |
|
Total other income |
|
|
8,047 |
|
|
|
26,967 |
|
|
|
41,346 |
|
|
|
43,663 |
|
|
Loss before income tax expense and non-controlling interests |
|
|
(30,059 |
) |
|
|
(9,523 |
) |
|
|
(43,898 |
) |
|
|
(43,070 |
) |
|
Income tax expense |
|
|
(281 |
) |
|
|
(44 |
) |
|
|
159 |
|
|
|
460 |
|
|
Net loss |
|
|
(29,778 |
) |
|
|
(9,479 |
) |
|
|
(44,057 |
) |
|
|
(43,530 |
) |
|
Net income attributable to non-controlling interests |
|
|
(8 |
) |
|
|
(79 |
) |
|
|
(336 |
) |
|
|
(165 |
) |
|
Net loss attributable to Starwood Waypoint Residential Trust shareholders |
|
$ |
(29,786 |
) |
|
$ |
(9,558 |
) |
|
$ |
(44,393 |
) |
|
$ |
(43,695 |
) |
|
|
|
|
|
|
|
|
|
|
|
|
|
|
|
|
|
|
|
Net loss per common share - basic and diluted |
|
$ |
(0.78 |
) |
|
$ |
(0.25 |
) |
|
$ |
(1.17 |
) |
|
$ |
(1.13 |
) |
|
Dividends declared per common share |
|
$ |
0.19 |
|
|
$ |
0.14 |
|
|
$ |
0.66 |
|
|
$ |
0.28 |
|
|
|
|
|
|
|
|
|
|
|
|
|
|
|
|
|
|
|
|
Weighted-average shares outstanding - basic and diluted |
|
|
37,972,846 |
|
|
|
37,860,335 |
|
|
|
37,949,784 |
|
|
|
38,623,893 |
|
|
(1) |
For the three and twelve months ended December 31, 2015, upon the sale or other resolution of NPLs that resulted in the recognition of a realized gain or loss, we reclassified $5.4 million and $26.0 million, respectively, that had previously been recorded in unrealized (loss) gain on NPLs, net to realized gain on NPLs, net, or realized gain on loan conversions, net, compared to $3.5 million for both the three and twelve month periods in 2014. |
|
|
9 |
NAREIT FFO, Core FFO, and Core FFO as Adjusted
|
|
|
Three Months Ended December 31, |
|
|
Twelve Months Ended December 31, |
|
||||||||||
|
(in thousands, except share and per share data, unaudited) |
|
|
2015 |
|
|
|
2014 |
|
|
2015 |
|
|
2014 |
|
||
|
|
|
|
|
|
|
|
||||||||||
|
Reconciliation of net loss to NAREIT FFO, Core FFO and Core FFO as Adjusted(1) |
|
|
|
|
|
|
|
|
|
|
|
|
|
|
|
|
|
Net loss attributable to Starwood Waypoint Residential Trust shareholders |
|
$ |
(29,786 |
) |
|
$ |
(9,558 |
) |
|
$ |
(44,393 |
) |
|
$ |
(43,695 |
) |
|
Add (deduct) adjustments from net loss to derive NAREIT FFO: |
|
|
|
|
|
|
|
|
|
|
|
|
|
|
|
|
|
Depreciation and amortization on real estate assets |
|
|
23,305 |
|
|
|
19,918 |
|
|
|
80,080 |
|
|
|
41,872 |
|
|
Impairment on depreciated real estate investments |
|
|
99 |
|
|
|
— |
|
|
|
99 |
|
|
|
15 |
|
|
Gain on sales of previously depreciated investments in real estate |
|
|
(1,975 |
) |
|
|
(253 |
) |
|
|
(4,151 |
) |
|
|
(280 |
) |
|
Non-controlling interests |
|
|
8 |
|
|
|
79 |
|
|
|
336 |
|
|
|
165 |
|
|
Subtotal - NAREIT FFO(1) |
|
|
(8,349 |
) |
|
|
10,186 |
|
|
|
31,971 |
|
|
|
(1,923 |
) |
|
Add (deduct) adjustments to NAREIT FFO to derive Core FFO: |
|
|
|
|
|
|
|
|
|
|
|
|
|
|
|
|
|
Share-based compensation |
|
|
1,568 |
|
|
|
3,898 |
|
|
|
7,229 |
|
|
|
8,458 |
|
|
Acquisition fees and other expenses |
|
|
254 |
|
|
|
637 |
|
|
|
1,120 |
|
|
|
1,301 |
|
|
Write-off of loan costs |
|
|
1,587 |
|
|
|
— |
|
|
|
1,587 |
|
|
|
5,032 |
|
|
Adjustments for derivative instruments, net |
|
|
(88 |
) |
|
|
42 |
|
|
|
(82 |
) |
|
|
485 |
|
|
Separation costs |
|
|
— |
|
|
|
— |
|
|
|
— |
|
|
|
3,543 |
|
|
Transaction-related expenses |
|
|
7,564 |
|
|
|
— |
|
|
|
11,852 |
|
|
|
— |
|
|
Severance expense |
|
|
— |
|
|
|
— |
|
|
|
— |
|
|
|
355 |
|
|
Non-cash interest expense related to amortization on convertible senior notes |
|
|
2,366 |
|
|
|
1,998 |
|
|
|
9,105 |
|
|
|
3,046 |
|
|
Subtotal - Core FFO(1) |
|
$ |
4,902 |
|
|
$ |
16,761 |
|
|
$ |
62,782 |
|
|
$ |
20,297 |
|
|
Add (deduct) adjustments to Core FFO to derive Core FFO as adjusted for out of period items: |
|
|
|
|
|
|
|
|
|
|
|
|
|
|
|
|
|
Real estate taxes and insurance (2) |
|
|
2,013 |
|
|
|
722 |
|
|
|
915 |
|
|
|
722 |
|
|
Core FFO as Adjusted(1) for out of period items |
|
$ |
6,915 |
|
|
$ |
17,483 |
|
|
$ |
63,697 |
|
|
$ |
21,019 |
|
|
|
|
|
|
|
|
|
|
|
|
|
|
|
|
|
|
|
|
Core FFO as Adjusted per share |
|
$ |
0.18 |
|
|
$ |
0.46 |
|
|
$ |
1.68 |
|
|
$ |
0.54 |
|
|
Dividends declared per common share |
|
$ |
0.19 |
|
|
$ |
0.14 |
|
|
$ |
0.66 |
|
|
$ |
0.28 |
|
|
|
|
|
|
|
|
|
|
|
|
|
|
|
|
|
|
|
|
Weighted average shares - basic and diluted |
|
|
37,972,846 |
|
|
|
37,860,335 |
|
|
|
37,949,784 |
|
|
|
38,623,893 |
|
|
|
|
|
|
|
|
|
|
|
|
|
|
|
|
|
|
|
|
Contributions to Core FFO as Adjusted per common share by segment |
|
|
|
|
|
|
|
|
|
|
|
|
|
|
|
|
|
SFR |
|
$ |
0.14 |
|
|
$ |
0.02 |
|
|
$ |
0.58 |
|
|
$ |
0.04 |
|
|
NPL |
|
$ |
0.04 |
|
|
$ |
0.44 |
|
|
$ |
1.10 |
|
|
$ |
0.50 |
|
|
Total Core FFO as Adjusted per common share |
|
$ |
0.18 |
|
|
$ |
0.46 |
|
|
$ |
1.68 |
|
|
$ |
0.54 |
|
|
(1) |
Please refer to the “Definitions and Reconciliations” pages of this presentation for definitions of NAREIT FFO, Core FFO and Core FFO as Adjusted. Core FFO and Core FFO as Adjusted are non-GAAP measures. |
|
(2) |
In the three and twelve months ended December 31, 2015, we recorded $2.0 million and $0.9 million of real estate tax expense, respectively, which related to periods prior to the three and twelve months ended December 31, 2015, respectively. The tax adjustments were primarily the result of tax assessment increases from the prior year by certain jurisdictions, and concentrated in the states of Texas and Florida. We excluded the impact of these "out-of-period" tax expenses from results for the three months and year ended December 31, 2015. |
|
|
10 |
NOI and Same Store Growth
|
|
|
Three Months Ended December 31, 2015 |
|
|
Twelve Months Ended December 31, 2015 |
|
||||||||||||||||||||||||||
|
NOI(1) |
|
SFR |
|
|
|
|
|
|
|
|
|
|
SFR |
|
|
|
|
|
|
|
|
|
||||||||||
|
(in thousands, unaudited) |
|
Stabilized Portfolio |
|
|
Non-Stabilized Portfolio |
|
|
NPL |
|
|
Total |
|
|
Stabilized Portfolio |
|
|
Non-Stabilized Portfolio |
|
|
NPL |
|
|
Total |
|
||||||||
|
Revenues |
|
|
|
|
|
|
|
|
|
|
|
|
|
|
|
|
|
|
|
|
|
|
|
|
|
|
|
|
|
|
|
|
|
Rental revenues, net |
|
$ |
50,211 |
|
|
$ |
— |
|
|
$ |
— |
|
|
$ |
50,211 |
|
|
$ |
188,068 |
|
|
$ |
— |
|
|
$ |
— |
|
|
$ |
188,068 |
|
|
Less bad debt expense(2) |
|
|
(531 |
) |
|
|
— |
|
|
|
— |
|
|
|
(531 |
) |
|
|
(2,061 |
) |
|
|
— |
|
|
|
— |
|
|
|
(2,061 |
) |
|
Total rental revenues as adjusted |
|
|
49,680 |
|
|
|
— |
|
|
|
— |
|
|
|
49,680 |
|
|
|
186,007 |
|
|
|
— |
|
|
|
— |
|
|
|
186,007 |
|
|
Other property revenues |
|
|
2,033 |
|
|
|
— |
|
|
|
— |
|
|
|
2,033 |
|
|
|
6,667 |
|
|
|
— |
|
|
|
— |
|
|
|
6,667 |
|
|
Realized gain on non-performing loans, net |
|
|
— |
|
|
|
— |
|
|
|
3,560 |
|
|
|
3,560 |
|
|
|
— |
|
|
|
— |
|
|
|
44,070 |
|
|
|
44,070 |
|
|
Realized gain on loan conversions, net |
|
|
— |
|
|
|
— |
|
|
|
9,090 |
|
|
|
9,090 |
|
|
|
— |
|
|
|
— |
|
|
|
33,032 |
|
|
|
33,032 |
|
|
Unrealized gain (loss) on non-performing loans, net |
|
|
— |
|
|
|
— |
|
|
|
9,954 |
|
|
|
9,954 |
|
|
|
— |
|
|
|
— |
|
|
|
44,385 |
|
|
|
44,385 |
|
|
Total revenues as adjusted |
|
|
51,713 |
|
|
|
— |
|
|
|
22,604 |
|
|
|
74,317 |
|
|
|
192,674 |
|
|
|
— |
|
|
|
121,487 |
|
|
|
314,161 |
|
|
Expenses |
|
|
|
|
|
|
|
|
|
|
|
|
|
|
|
|
|
|
|
|
|
|
|
|
|
|
|
|
|
|
|
|
|
Property operating expenses(3) (4) |
|
|
20,297 |
|
|
|
2,649 |
|
|
|
— |
|
|
|
22,946 |
|
|
|
73,364 |
|
|
|
9,752 |
|
|
|
— |
|
|
|
83,116 |
|
|
Mortgage loan servicing costs |
|
|
— |
|
|
|
— |
|
|
|
9,533 |
|
|
|
9,533 |
|
|
|
— |
|
|
|
— |
|
|
|
39,518 |
|
|
|
39,518 |
|
|
Total expenses |
|
|
20,297 |
|
|
|
2,649 |
|
|
|
9,533 |
|
|
|
32,479 |
|
|
|
73,364 |
|
|
|
9,752 |
|
|
|
39,518 |
|
|
|
122,634 |
|
|
Total NOI |
|
$ |
31,416 |
|
|
$ |
(2,649 |
) |
|
$ |
13,071 |
|
|
$ |
41,838 |
|
|
$ |
119,310 |
|
|
$ |
(9,752 |
) |
|
$ |
81,969 |
|
|
$ |
191,527 |
|
|
|
|
|
|
|
|
|
|
|
|
|
|
|
|
|
|
|
|
|
|
|
|
|
|
|
|
|
|
|
|
|
|
|
|
Stabilized portfolio NOI margin(5) |
|
|
63.2 |
% |
|
|
|
|
|
|
|
|
|
|
|
|
|
|
64.1 |
% |
|
|
|
|
|
|
|
|
|
|
|
|
|
Same Store Growth(4)(6) |
|
|
|
|
|
|
|
|
|
||||||||||||||
|
|
|
|
|
|
Q4 2015 vs. Q4 2014 |
|
|
Q4 YTD 2015 vs. Q4 YTD 2014 |
|
||||||||||||||
|
Stabilized prior to |
Total Number of Homes |
|
|
Revenues |
|
Operating Expenses |
|
NOI(1) |
|
|
Revenues |
|
Operating Expenses |
|
NOI(1) |
|
|||||||
|
1Q 2014 |
|
1,596 |
|
|
|
-4.6 |
% |
|
-18.0 |
% |
|
6.6 |
% |
|
|
-2.4 |
% |
|
-15.4 |
% |
|
6.9 |
% |
|
|
|
|
|
|
|
|
|
|
|
|
|
|
|
|
|
|
|
|
|
|
|
|
|
|
(1) |
Total Stabilized Portfolio NOI, Total Non-Stabilized Portfolio NOI, Total NPL NOI, Total NOI and Same Store NOI are non-GAAP measures. For a reconciliation of these non-GAAP measures to net loss attributable to Starwood Waypoint Residential Trust shareholders determined in accordance with GAAP, please refer to the “Definitions and Reconciliations” pages of this presentation. |
|
(2) |
Allowance for doubtful accounts (“bad debt”) is included in property operating and maintenance expenses in the consolidated statements of operations in accordance with GAAP. However, we believe bad debt represents revenue lost and not an operating expense to the portfolio so for purposes of calculating margins we treat bad debt as a reduction of revenue. |
|
(3) |
Property operating expenses are defined as property operating and maintenance expenses, excluding bad debt, plus real estate taxes and insurance. |
|
(4) |
In the three months ended December 31, 2015, we recorded $2.0 million and $0.9 million of real estate tax which related to periods prior to the three and twelve months ended December 31, 2015, respectively. The tax adjustments were primarily the result of tax assessment increases from the prior year by certain jurisdictions, and concentrated in the states of Texas and Florida. We excluded the impact of these "out-of-period" tax expenses from results for the three and twelve months ended December 31, 2015. |
|
(5) |
NOI margin is calculated as total stabilized portfolio NOI divided by total rental revenues, as adjusted. |
|
(6) |
For an explanation of same store growth, please refer to the “Definitions and Reconciliations” pages of this presentation. |
|
|
11 |
|
As of December 31, 2015 (in thousands, except share and per share data) |
|
|
|
|
|
|
|
|
|
|
|
|
|
|
|
|
|
|||||||
|
|
|
|
|
|
|
|
|
|
|
|
|
|
|
|
|
|
|
|
|
|
|
|
|
|
|
|
|
Debt |
|
|||||||||||||||||||||
|
Debt Maturities(1) |
|
Senior SFR Facility |
|
|
NPL Facility |
|
|
Securitization(2) |
|
|
Convertible Notes - 2019 Convertible Note |
|
|
Convertible Notes - 2017 Convertible Note |
|
|
Total |
|
||||||
|
|
|
|
|
|
|
|
|
|
|
|
|
|
|
|
|
|
|
|
|
|
|
|
|
|
|
2016 |
|
$ |
— |
|
|
$ |
— |
|
|
$ |
— |
|
|
$ |
— |
|
|
$ |
— |
|
|
$ |
— |
|
|
2017 |
|
|
— |
|
|
|
274,441 |
|
|
|
— |
|
|
|
— |
|
|
|
172,500 |
|
|
|
446,941 |
|
|
2018 |
|
|
741,207 |
|
|
|
— |
|
|
|
— |
|
|
|
— |
|
|
|
— |
|
|
|
741,207 |
|
|
2019 |
|
|
— |
|
|
|
— |
|
|
|
— |
|
|
|
230,000 |
|
|
|
— |
|
|
|
230,000 |
|
|
2020 |
|
|
— |
|
|
|
— |
|
|
|
529,011 |
|
|
|
— |
|
|
|
— |
|
|
|
529,011 |
|
|
Thereafter |
|
|
— |
|
|
|
— |
|
|
|
— |
|
|
|
— |
|
|
|
— |
|
|
|
— |
|
|
Total |
|
$ |
741,207 |
|
|
$ |
274,441 |
|
|
$ |
529,011 |
|
|
$ |
230,000 |
|
|
$ |
172,500 |
|
|
$ |
1,947,159 |
|
|
|
|
|
|
|
|
|
|
|
|
|
|
|
|
|
|
|
|
|
|
|
|
|
|
|
|
Weighted average coupon rate |
|
|
3.38% |
|
|
|
2.80% |
|
|
|
2.79% |
|
|
|
3.00% |
|
|
|
4.50% |
|
|
|
3.19% |
|
|
|
|
|
|
|
|
|
|
|
|
|
|
|
|
|
|
|
|
|
|
|
|
|
|
|
|
Weighted average remaining maturity in years |
|
|
2.1 |
|
|
|
1.7 |
|
|
|
4.0 |
|
|
|
3.5 |
|
|
|
1.8 |
|
|
|
2.7 |
|
|
Market equity |
|
|||||||||||
|
Security |
|
Shares |
|
|
Price |
|
|
Value |
|
|||
|
|
|
|
|
|
|
|
|
|
|
|
|
|
|
Common shares |
|
|
37,973,989 |
|
|
$ |
22.64 |
|
|
$ |
859,731 |
|
|
NAV(3) |
|
|
37,973,989 |
|
|
$ |
34.32 |
|
|
$ |
1,303,337 |
|
|
Debt Metrics |
|
|||
|
Total debt to total gross assets(4) |
|
|
62.1 |
% |
|
Net debt to total estimated fair value of assets(4) |
|
|
59.6 |
% |
|
(1) |
Maturity dates include optional extension terms. |
|
(2) |
Amount includes a principle-only bearing subordinate Certificate, Class G, in the amount of $26.6 million, retained by Starwood Waypoint Residential Trust. |
|
(3) |
NAV is a non-GAAP measure. Our methodology for estimating NAV excludes average Turn 2 cost for stabilized homes from estimated renovation reserves. For an explanation of this measure and a reconciliation to the applicable GAAP measure, please refer to the “Definitions and Reconciliations” pages of this presentation. |
|
(4) |
Total debt to total gross assets and net debt to total estimated fair value of assets exclude the principle bearing subordinated Certificate, Class G, of $26.6 million, as noted in footnote 2 above. For definitions of gross assets, net debt, and estimated fair value of assets please refer to the “Definitions and Reconciliations” pages of this presentation. |
|
|
|
|
12 |
Total Rental Homes Portfolio – December 31, 2015
|
Markets |
|
Stabilized Homes |
|
|
Non-Stabilized Homes |
|
|
Total Homes(1)(2) |
|
|
Total Homes Leased (%) |
|
|
Total Homes Occupied (%) |
|
|
Average Acquisition Cost per Home |
|
|
Average Investment per Home(3) |
|
|
Aggregate Investment (in millions) |
|
|
Average Home Size (sq. ft.) |
|
|
Weighted Average Age (year) |
|
|
Average Year Purchased |
|
Average Monthly Rent Per Leased Home(4) |
|
|||||||||||
|
South Florida |
|
|
2,478 |
|
|
|
122 |
|
|
|
2,600 |
|
|
|
93.0% |
|
|
|
90.7% |
|
|
$ |
141,094 |
|
|
$ |
177,164 |
|
|
$ |
460.3 |
|
|
|
1,587 |
|
|
|
46 |
|
|
2014 |
|
$ |
1,660 |
|
|
Atlanta |
|
|
2,431 |
|
|
|
44 |
|
|
|
2,475 |
|
|
|
93.5% |
|
|
|
91.1% |
|
|
$ |
102,648 |
|
|
$ |
133,576 |
|
|
|
330.6 |
|
|
|
1,938 |
|
|
|
23 |
|
|
2014 |
|
$ |
1,228 |
|
|
Houston |
|
|
1,566 |
|
|
|
41 |
|
|
|
1,607 |
|
|
|
91.8% |
|
|
|
89.9% |
|
|
$ |
132,095 |
|
|
$ |
151,657 |
|
|
|
243.7 |
|
|
|
2,032 |
|
|
|
28 |
|
|
2014 |
|
$ |
1,552 |
|
|
Tampa |
|
|
1,433 |
|
|
|
49 |
|
|
|
1,482 |
|
|
|
93.3% |
|
|
|
91.1% |
|
|
$ |
106,001 |
|
|
$ |
128,029 |
|
|
|
189.7 |
|
|
|
1,465 |
|
|
|
41 |
|
|
2014 |
|
$ |
1,294 |
|
|
Dallas |
|
|
1,355 |
|
|
|
76 |
|
|
|
1,431 |
|
|
|
92.4% |
|
|
|
90.6% |
|
|
$ |
144,597 |
|
|
$ |
166,214 |
|
|
|
237.9 |
|
|
|
2,168 |
|
|
|
20 |
|
|
2014 |
|
$ |
1,618 |
|
|
Denver |
|
|
713 |
|
|
|
101 |
|
|
|
814 |
|
|
|
84.3% |
|
|
|
82.6% |
|
|
$ |
206,340 |
|
|
$ |
233,271 |
|
|
|
189.9 |
|
|
|
1,628 |
|
|
|
33 |
|
|
2014 |
|
$ |
1,804 |
|
|
Chicago |
|
|
730 |
|
|
|
55 |
|
|
|
785 |
|
|
|
84.5% |
|
|
|
83.8% |
|
|
$ |
122,123 |
|
|
$ |
152,069 |
|
|
|
119.4 |
|
|
|
1,593 |
|
|
|
37 |
|
|
2014 |
|
$ |
1,688 |
|
|
Orlando |
|
|
630 |
|
|
|
55 |
|
|
|
685 |
|
|
|
87.0% |
|
|
|
84.5% |
|
|
$ |
116,461 |
|
|
$ |
143,855 |
|
|
|
98.4 |
|
|
|
1,588 |
|
|
|
38 |
|
|
2014 |
|
$ |
1,335 |
|
|
Southern California |
|
|
440 |
|
|
|
9 |
|
|
|
449 |
|
|
|
88.6% |
|
|
|
87.1% |
|
|
$ |
243,735 |
|
|
$ |
257,310 |
|
|
|
115.5 |
|
|
|
1,651 |
|
|
|
39 |
|
|
2014 |
|
$ |
1,875 |
|
|
Northern California |
|
|
269 |
|
|
|
1 |
|
|
|
270 |
|
|
|
96.3% |
|
|
|
94.8% |
|
|
$ |
214,603 |
|
|
$ |
228,225 |
|
|
|
61.6 |
|
|
|
1,505 |
|
|
|
47 |
|
|
2013 |
|
$ |
1,757 |
|
|
Phoenix |
|
|
244 |
|
|
|
2 |
|
|
|
246 |
|
|
|
97.6% |
|
|
|
96.3% |
|
|
$ |
139,661 |
|
|
$ |
158,732 |
|
|
|
38.7 |
|
|
|
1,536 |
|
|
|
41 |
|
|
2014 |
|
$ |
1,209 |
|
|
Las Vegas |
|
|
37 |
|
|
|
— |
|
|
|
37 |
|
|
|
81.1% |
|
|
|
81.1% |
|
|
$ |
152,650 |
|
|
$ |
164,678 |
|
|
|
6.1 |
|
|
|
1,908 |
|
|
|
30 |
|
|
2013 |
|
$ |
1,269 |
|
|
Total/Average |
|
|
12,326 |
|
|
|
555 |
|
|
|
12,881 |
|
|
|
91.5% |
|
|
|
89.5% |
|
|
$ |
135,717 |
|
|
$ |
162,458 |
|
|
$ |
2,091.8 |
|
|
|
1,764 |
|
|
|
34 |
|
|
2014 |
|
$ |
1,510 |
|
|
|
|
|
|
|
|
|
|
|
|
|
|
|
|
|
|
|
|
|
|
|
|
|
|
|
|
|
|
|
|
|
|
|
|
|
|
|
|
|
|
|
|
|
|
|
|
|
|
|
|
|
|
|
|
|
|
|
|
|
|
|
|
|
|
|
|
|
|
|
|
|
|
|
|
|
|
|
|
|
|
|
|
|
|
|
|
|
|
|
|
|
|
|
|
|
|
Status |
|
Total Homes(1)(2) |
|
|
Total Homes Leased (%) |
|
|
Average Acquisition Cost |
|
|
Average Investment per Home(3) |
|
|
Aggregate Investment (in millions) |
|
|
Average Home Size (sq. ft.) |
|
|
Weighted Average Age (year) |
|
|
Average Year Purchased |
|
|
Average Monthly Rent Per Leased Home(4) |
|
|
|
|
|
|
|
|
|
|
|
|||||||||
|
Stabilized(5) |
|
|
12,326 |
|
|
|
94.9% |
|
|
$ |
134,302 |
|
|
$ |
160,978 |
|
|
$ |
1,984.2 |
|
|
|
1,758 |
|
|
|
34 |
|
|
2014 |
|
|
$ |
1,501 |
|
|
|
|
|
|
|
|
|
|
|
|
|
Non-stabilized(5) |
|
|
555 |
|
|
|
14.6% |
|
|
$ |
167,136 |
|
|
$ |
195,619 |
|
|
|
107.6 |
|
|
|
1,891 |
|
|
|
32 |
|
|
2015 |
|
|
$ |
1,707 |
|
|
|
|
|
|
|
|
|
|
|
|
|
Total/Average |
|
|
12,881 |
|
|
|
91.5% |
|
|
$ |
135,717 |
|
|
$ |
162,458 |
|
|
$ |
2,091.8 |
|
|
|
1,764 |
|
|
|
34 |
|
|
2014 |
|
|
$ |
1,510 |
|
|
|
|
|
|
|
|
|
|
|
|
|
(1) |
Excludes 1,218 homes that we did not intend to hold for the long-term as of December 31, 2015. |
|
(2) |
Effective January 1, 2015, we measure homes by the number of rental units as compared to our previous measure by number of properties. Although historically we have primarily invested in SFRs, and expect to do so in the foreseeable future, this change takes into account our investments in multi-family properties and, we believe, provides a more meaningful measure to investors. |
|
(3) |
Includes acquisition costs and actual and estimated upfront renovation costs. Actual renovation costs may exceed estimated renovation costs, and we may acquire homes in the future with different characteristics that result in higher renovation costs. As of December 31, 2015, the average estimated renovation costs per acquired home were approximately $26,700. |
|
(4) |
Represents average monthly contractual cash rent. Average monthly cash rent is presented before rent concession and incentives (i.e. free rent and other concessions). To date, rent concessions and incentives have been utilized on a limited basis and have not had a significant impact on our average monthly rent. If the use of rent concessions or other leasing incentives increases in the future, they may have a greater impact by reducing the average monthly rent we receive from leased homes. |
|
(5) |
Please refer to the “Definitions and Reconciliation” pages of this presentation for a definition of stabilized and non-stabilized homes. |
|
|
13 |
Rent Growth by Lease Category – Three Months Ended December 31, 2015
|
|
|
Escalations on Multi-year Leases |
|
|
Renewal |
|
|
Replacement |
|
|
Total Weighted Average |
|
||||||||||||
|
|
|
Total |
|
Average |
|
|
Total |
Average |
|
|
Total |
Average |
|
|
Total |
|
Average |
|
||||||
|
Market |
|
Leases |
|
Rent Change (1) |
|
|
Leases |
Rent Change (2) |
|
|
Leases |
Rent Change (3) |
|
|
Leases |
|
Rent Change |
|
||||||
|
Atlanta |
|
131 |
|
|
2.9 |
% |
|
109 |
|
3.7 |
% |
|
148 |
|
1.6 |
% |
|
|
388 |
|
|
2.6 |
% |
|
|
South Florida |
|
149 |
|
|
3.0 |
% |
|
76 |
|
4.0 |
% |
|
150 |
|
3.1 |
% |
|
|
375 |
|
|
3.1 |
% |
|
|
Houston |
|
72 |
|
|
3.0 |
% |
|
80 |
|
1.5 |
% |
|
107 |
|
-1.0 |
% |
|
|
259 |
|
|
0.8 |
% |
|
|
Dallas |
|
75 |
|
|
3.0 |
% |
|
52 |
|
2.9 |
% |
|
85 |
|
3.8 |
% |
|
|
212 |
|
|
3.3 |
% |
|
|
Tampa |
|
57 |
|
|
3.1 |
% |
|
88 |
|
3.4 |
% |
|
94 |
|
3.0 |
% |
|
|
239 |
|
|
3.1 |
% |
|
|
Chicago |
|
47 |
|
|
3.0 |
% |
|
29 |
|
5.1 |
% |
|
29 |
|
1.9 |
% |
|
|
105 |
|
|
3.1 |
% |
|
|
Denver |
|
47 |
|
|
3.0 |
% |
|
20 |
|
5.3 |
% |
|
37 |
|
2.0 |
% |
|
|
104 |
|
|
3.0 |
% |
|
|
Orlando |
|
19 |
|
|
3.0 |
% |
|
28 |
|
4.4 |
% |
|
31 |
|
1.2 |
% |
|
|
78 |
|
|
2.7 |
% |
|
|
Southern California |
|
15 |
|
|
3.0 |
% |
|
17 |
|
3.1 |
% |
|
37 |
|
3.5 |
% |
|
|
69 |
|
|
3.1 |
% |
|
|
Northern California |
|
23 |
|
|
3.1 |
% |
|
10 |
|
4.5 |
% |
|
22 |
|
2.3 |
% |
|
|
55 |
|
|
2.6 |
% |
|
|
Phoenix |
|
7 |
|
|
3.0 |
% |
|
15 |
|
3.9 |
% |
|
15 |
|
1.8 |
% |
|
|
37 |
|
|
2.5 |
% |
|
|
Las Vegas |
|
|
— |
|
|
|
|
|
5 |
|
1.3 |
% |
|
2 |
|
-4.0 |
% |
|
|
7 |
|
|
-0.2 |
% |
|
Total/Average |
|
642 |
|
|
3.0 |
% |
|
529 |
|
3.5 |
% |
|
757 |
|
2.1 |
% |
|
|
1,928 |
|
|
2.6 |
% |
|
|
(1) |
Represents the average percentage change in annual rent of multi-year leases which had contractual rent increases occur during the quarter ended December 31, 2015. |
|
(2) |
Represents the average percentage change in rent on renewal leases for existing resident base during the quarter ended December 31, 2015. Note that month-to-month leases are excluded from this calculation. |
|
(3) |
Represents the average percentage change in annual rent on properties leased to new residents in relation to annual rent for the same respective unit per previously expired leases during the quarter ended December 31, 2015. |
|
|
14 |
Leasing Statistics – December 31, 2015
|
|
|
|
|
|
|
Stabilized Homes(1) |
|
|
Homes Owned 180 Days or Longer |
|
||||||||||||||||||||||
|
|
|
|
|
|
|
|
|
|
|
|
|
|
|
|
|
|
|
Average |
|
|
|
|
|
|
|
|
|
|
Average |
|
||
|
|
|
Total |
|
|
|
|
|
|
|
|
|
|
|
|
|
|
Monthly |
|
|
|
|
|
|
|
|
|
|
Monthly |
|
|||
|
|
|
Number of |
|
|
Number of |
|
|
Percent |
|
|
Percent |
|
|
Rent per |
|
|
Number of |
|
|
Percent |
|
|
Rent per |
|
||||||||
|
Markets |
|
Homes(2)(3) |
|
|
Homes |
|
|
Leased |
|
|
Occupied |
|
|
Leased Home(4) |
|
|
Homes |
|
|
Leased |
|
|
Leased Home(4) |
|
||||||||
|
South Florida |
|
|
2,600 |
|
|
|
2,478 |
|
|
|
96.7% |
|
|
|
95.0% |
|
|
$ |
1,654 |
|
|
|
2,440 |
|
|
|
96.1% |
|
|
$ |
1,652 |
|
|
Atlanta |
|
|
2,475 |
|
|
|
2,431 |
|
|
|
94.4% |
|
|
|
92.2% |
|
|
$ |
1,225 |
|
|
|
2,445 |
|
|
|
93.9% |
|
|
$ |
1,224 |
|
|
Houston |
|
|
1,607 |
|
|
|
1,566 |
|
|
|
93.4% |
|
|
|
91.6% |
|
|
$ |
1,547 |
|
|
|
1,560 |
|
|
|
93.1% |
|
|
$ |
1,547 |
|
|
Tampa |
|
|
1,482 |
|
|
|
1,433 |
|
|
|
96.3% |
|
|
|
94.1% |
|
|
$ |
1,290 |
|
|
|
1,377 |
|
|
|
96.2% |
|
|
$ |
1,286 |
|
|
Dallas |
|
|
1,431 |
|
|
|
1,355 |
|
|
|
96.9% |
|
|
|
95.6% |
|
|
$ |
1,610 |
|
|
|
1,342 |
|
|
|
94.4% |
|
|
$ |
1,602 |
|
|
Denver |
|
|
814 |
|
|
|
713 |
|
|
|
95.2% |
|
|
|
94.0% |
|
|
$ |
1,794 |
|
|
|
714 |
|
|
|
92.4% |
|
|
$ |
1,788 |
|
|
Chicago |
|
|
785 |
|
|
|
730 |
|
|
|
90.3% |
|
|
|
90.0% |
|
|
$ |
1,678 |
|
|
|
707 |
|
|
|
89.4% |
|
|
$ |
1,682 |
|
|
Orlando |
|
|
685 |
|
|
|
630 |
|
|
|
93.7% |
|
|
|
91.9% |
|
|
$ |
1,322 |
|
|
|
605 |
|
|
|
93.2% |
|
|
$ |
1,322 |
|
|
Southern California |
|
|
449 |
|
|
|
440 |
|
|
|
90.2% |
|
|
|
88.6% |
|
|
$ |
1,867 |
|
|
|
442 |
|
|
|
88.9% |
|
|
$ |
1,866 |
|
|
Northern California |
|
|
270 |
|
|
|
269 |
|
|
|
96.7% |
|
|
|
95.2% |
|
|
$ |
1,754 |
|
|
|
270 |
|
|
|
96.3% |
|
|
$ |
1,757 |
|
|
Phoenix |
|
|
246 |
|
|
|
244 |
|
|
|
98.4% |
|
|
|
97.1% |
|
|
$ |
1,209 |
|
|
|
244 |
|
|
|
98.4% |
|
|
$ |
1,209 |
|
|
Las Vegas |
|
|
37 |
|
|
|
37 |
|
|
|
81.1% |
|
|
|
81.1% |
|
|
$ |
1,269 |
|
|
|
37 |
|
|
|
81.1% |
|
|
$ |
1,269 |
|
|
Total/Average |
|
|
12,881 |
|
|
|
12,326 |
|
|
|
94.9% |
|
|
|
93.2% |
|
|
$ |
1,501 |
|
|
|
12,183 |
|
|
|
94.1% |
|
|
$ |
1,499 |
|
|
(1) |
Please refer to the “Definitions and Reconciliation” pages of this presentation for a definition of stabilized homes. |
|
(2) |
Excludes 1,218 homes that we did not intend to hold for the long-term as of December 31, 2015. Refer to the “Definitions and Reconciliations” pages for roll-forward of homes we did not intend to hold for the long term. |
|
(3) |
Effective January 1, 2015, we measure homes by the number of rental units as compared to our previous measure by number of properties. Although historically we have primarily invested in SFRs, and expect to do so in the foreseeable future, this change takes into account our investments in multi-family properties and, we believe provides a more meaningful measure to investors. |
|
(4) |
Represents average monthly contractual cash rent. Average monthly cash rent is presented before rent concession and incentives (i.e. free rent, other concessions). To date, rent concessions and incentives have been utilized on a limited basis and have not had a significant impact on our average monthly rent. If the use of rent concessions or other leasing incentives increases in the future, they may have a greater impact by reducing the average monthly rent we receive from leased homes. |
|
|
15 |
NPL Portfolio – December 31, 2015
|
|
|
|
|
|
|
Total |
|
|
|
|
|
|
|
|
|
|
|
|
|
|
|
|
|
|
|
|
|
|
|
|
|
Loan |
|
|
Purchase Price |
|
|
Total UPB(2) |
|
|
Total BPO |
|
|
Purchase Price |
|
|
Purchase Price |
|
|
Weighted |
|
|||||||
|
State |
|
Count(1) |
|
|
(in millions) |
|
|
(in millions) |
|
|
(in millions) |
|
|
as % of UPB |
|
|
as % of BPO |
|
|
Average LTV(2)(3) |
|
|||||||
|
Florida |
|
|
469 |
|
|
$ |
61.9 |
|
|
$ |
112.9 |
|
|
$ |
104.7 |
|
|
|
54.8% |
|
|
|
59.1% |
|
|
|
125.9% |
|
|
Illinois |
|
|
219 |
|
|
|
30.5 |
|
|
|
48.5 |
|
|
|
46.7 |
|
|
|
62.9% |
|
|
|
65.3% |
|
|
|
127.7% |
|
|
California |
|
|
197 |
|
|
|
62.1 |
|
|
|
84.2 |
|
|
|
97.2 |
|
|
|
73.8% |
|
|
|
63.9% |
|
|
|
99.3% |
|
|
New York |
|
|
179 |
|
|
|
37.1 |
|
|
|
59.0 |
|
|
|
69.3 |
|
|
|
62.9% |
|
|
|
53.6% |
|
|
|
104.8% |
|
|
Indiana |
|
|
128 |
|
|
|
8.9 |
|
|
|
12.2 |
|
|
|
12.3 |
|
|
|
73.1% |
|
|
|
72.5% |
|
|
|
119.7% |
|
|
New Jersey |
|
|
121 |
|
|
|
19.2 |
|
|
|
32.0 |
|
|
|
30.1 |
|
|
|
59.9% |
|
|
|
63.6% |
|
|
|
125.5% |
|
|
Wisconsin |
|
|
116 |
|
|
|
10.2 |
|
|
|
14.0 |
|
|
|
16.3 |
|
|
|
72.9% |
|
|
|
62.6% |
|
|
|
112.7% |
|
|
Maryland |
|
|
113 |
|
|
|
22.5 |
|
|
|
32.5 |
|
|
|
27.5 |
|
|
|
69.2% |
|
|
|
81.7% |
|
|
|
138.4% |
|
|
Pennsylvania |
|
|
81 |
|
|
|
7.9 |
|
|
|
11.4 |
|
|
|
11.6 |
|
|
|
69.2% |
|
|
|
67.9% |
|
|
|
117.7% |
|
|
Arizona |
|
|
55 |
|
|
|
6.9 |
|
|
|
10.4 |
|
|
|
9.3 |
|
|
|
66.1% |
|
|
|
73.9% |
|
|
|
249.3% |
|
|
Georgia |
|
|
59 |
|
|
|
5.8 |
|
|
|
9.4 |
|
|
|
9.2 |
|
|
|
62.3% |
|
|
|
63.7% |
|
|
|
117.3% |
|
|
Other |
|
|
802 |
|
|
|
99.1 |
|
|
|
142.3 |
|
|
|
147.0 |
|
|
|
69.6% |
|
|
|
67.4% |
|
|
|
114.8% |
|
|
Totals |
|
|
2,539 |
|
|
$ |
372.1 |
|
|
$ |
568.8 |
|
|
$ |
581.2 |
|
|
|
65.4% |
|
|
|
64.0% |
|
|
|
119.3% |
|
|
|
|
|
|
|
|
|
|
|
|
|
|
|
|
|
|
|
|
|
|
|
|
|
|
|
|
|
|
|
|
|
|
|
|
|
|
|
|
|
|
|
|
|
|
|
|
|
|
|
|
|
|
|
|
|
|
|
|
|
|
|
|
|
|
|
|
Total |
|
|
|
|
|
|
|
|
|
|
|
|
|
|
|
|
|
|
|
|
|
|
|
|
|
Loan |
|
|
Purchase Price |
|
|
Total UPB(2) |
|
|
Total BPO |
|
|
Purchase Price |
|
|
Purchase Price |
|
|
Weighted |
|
|||||||
|
Status |
|
Count(1) |
|
|
($ in millions) |
|
|
($ in millions) |
|
|
($ in millions) |
|
|
as % of UPB |
|
|
as % of BPO |
|
|
Average LTV(2)(3) |
|
|||||||
|
Foreclosure |
|
|
1,838 |
|
|
$ |
276.1 |
|
|
$ |
431.3 |
|
|
$ |
429.5 |
|
|
|
64.0% |
|
|
|
64.3% |
|
|
|
123.1% |
|
|
Performing |
|
|
578 |
|
|
|
80.3 |
|
|
|
113.8 |
|
|
|
128.3 |
|
|
|
70.6% |
|
|
|
62.6% |
|
|
|
105.0% |
|
|
Delinquent |
|
|
123 |
|
|
|
15.7 |
|
|
|
23.7 |
|
|
|
23.4 |
|
|
|
66.4% |
|
|
|
67.2% |
|
|
|
118.9% |
|
|
Total/Average |
|
|
2,539 |
|
|
$ |
372.1 |
|
|
$ |
568.8 |
|
|
$ |
581.2 |
|
|
|
65.4% |
|
|
|
64.0% |
|
|
|
119.3% |
|
|
(1) |
Represents first liens on 2,481 homes and 58 parcels of land. Excludes 197 unsecured, second and third lien NPLs with an aggregate purchase price of $1.5 million. |
|
(2) |
For definitions of UPB and LTV, please refer to the “Definitions and Reconciliations” pages of this presentation. |
|
(3) |
Weighted average LTV is based on the ratio of UPB to BPO weighted by UPB for each state. |
|
|
|
|
16 |
Acquisitions – Three Months Ended December 31, 2015
|
SFRs by Market |
|
Homes(1) |
|
|
Average Home Size (sq. ft.) |
|
|
Average Acquisition Cost per Home |
|
|
Average Estimated Upfront Renovation Cost per Home |
|
|
Average Estimated Investment per Home(2) |
|
|
Aggregate Investment (in millions) |
|
|
Estimated Average Monthly Rent per Home(3) |
|
|||||||
|
South Florida |
|
|
52 |
|
|
|
1,621 |
|
|
$ |
164,542 |
|
|
$ |
39,268 |
|
|
$ |
203,810 |
|
|
$ |
10.6 |
|
|
$ |
1,815 |
|
|
Tampa |
|
|
19 |
|
|
|
1,726 |
|
|
$ |
140,994 |
|
|
$ |
8,797 |
|
|
$ |
149,791 |
|
|
|
2.8 |
|
|
$ |
1,376 |
|
|
Denver |
|
|
32 |
|
|
|
1,753 |
|
|
$ |
235,473 |
|
|
$ |
15,760 |
|
|
$ |
251,233 |
|
|
|
8.0 |
|
|
$ |
1,926 |
|
|
Chicago |
|
|
18 |
|
|
|
2,212 |
|
|
$ |
155,084 |
|
|
$ |
36,714 |
|
|
$ |
191,797 |
|
|
|
3.5 |
|
|
$ |
1,921 |
|
|
Orlando |
|
|
20 |
|
|
|
1,587 |
|
|
$ |
126,248 |
|
|
$ |
37,143 |
|
|
$ |
163,391 |
|
|
|
3.3 |
|
|
$ |
1,467 |
|
|
Dallas |
|
|
35 |
|
|
|
2,684 |
|
|
$ |
186,911 |
|
|
$ |
21,858 |
|
|
$ |
208,769 |
|
|
|
7.3 |
|
|
$ |
1,894 |
|
|
Houston |
|
|
19 |
|
|
|
1,823 |
|
|
$ |
142,876 |
|
|
$ |
22,889 |
|
|
$ |
165,765 |
|
|
|
3.1 |
|
|
$ |
1,632 |
|
|
Atlanta |
|
|
9 |
|
|
|
2,294 |
|
|
$ |
156,640 |
|
|
$ |
5,261 |
|
|
$ |
161,900 |
|
|
|
1.5 |
|
|
$ |
1,386 |
|
|
Total/Average SFR Acquisitions |
|
|
204 |
|
|
|
1,931 |
|
|
$ |
170,358 |
|
|
$ |
26,296 |
|
|
$ |
196,654 |
|
|
|
40.1 |
|
|
$ |
1,744 |
|
|
|
|
|
|
|
|
|
|
|
|
|
|
|
|
|
|
|
|
|
|
|
|
|
|
|
|
|
|
|
|
Total NPLs Converted to SFRs(4) |
|
|
13 |
|
|
|
1,825 |
|
|
$ |
167,482 |
|
|
$ |
26,196 |
|
|
$ |
193,678 |
|
|
|
2.5 |
|
|
$ |
1,866 |
|
|
|
|
|
|
|
|
|
|
|
|
|
|
|
|
|
|
|
|
|
|
|
|
|
|
|
|
|
|
|
|
Total/Average |
|
|
217 |
|
|
|
1,925 |
|
|
$ |
170,185 |
|
|
$ |
26,356 |
|
|
$ |
196,541 |
|
|
$ |
42.6 |
|
|
$ |
1,751 |
|
|
(1) |
Effective January 1, 2015, we measure homes by the number of rental units as compared to our previous measure by number of properties. Although historically we have primarily invested in SFRs, and expect to do so in the foreseeable future, this change takes into account our investments in multi-family properties and, we believe provides a more meaningful measure to investors. |
|
(2) |
Includes acquisition costs and actual and estimated upfront renovation costs. Actual renovation costs may exceed estimated renovation costs, and we may acquire homes in the future with different characteristics that result in higher renovation costs. |
|
(3) |
Estimated average monthly rent per home represents (a) for vacant homes, management’s estimates of what rent would be generated if such homes were leased based on rents estimated by examining multiple rent data sources (such as realized rents for comparable homes in neighborhood, a proprietary rent setting algorithm, third-party vendors, etc.) and using localized knowledge to establish rent for a given property and (b) for leased homes, average monthly contractual rent. No assurance can be given that these estimates will prove to be accurate, and as such, you should not place undue reliance on them. |
|
(4) |
Represents NPLs converted to portfolio homes during the quarter across various markets. |
|
|
17 |
Definitions and Reconciliations
Estimated Fair Value of Assets. Estimated fair value of assets consists of both estimated SFR value and estimated NPL value as described below.
Estimated NAV. We define Estimated NAV as the estimated value of all assets net of liabilities at current fair market values, and Estimated NAV is not meant to represent the liquidation value of our assets. To calculate the Estimated NAV, the historical net investments in real estate and NPLs at carrying value are deducted from total shareholders’ equity and the Estimated SFR Value and NPL Value are added (see table below).
The fair value of investments in real estate is determined using a progressive method that incorporates three value sources: automated valuation model values (“AVMs”), BPOs and internal desktop evaluations. AVM values, which are value estimates provided by service providers based on their proprietary mathematical modeling platforms that utilize historical sales and public records data of comparable homes and are adjusted based on characteristics specific to the relevant home being valued, are ordered for each home. The AVM value provided by a third-party AVM service provider is prepared as if such home is in “after repair” condition. Because not all of our homes are in “after repair” condition, to arrive at our fair market value for a home using an AVM value, we: (1) for non-stabilized homes, deduct the average remaining estimated capital expense per non- stabilized home from the “after repair” AVM value prepared by a third-party AVM service provider, with the average remaining estimated capital expenses determined by subtracting the actual average capital expenditures per home incurred as of that quarter-end date from the average underwritten initial renovation budget per home; and (2) for stabilized homes, deduct the average costs of preparing a stabilized home for sale from the “after repair” AVM value prepared by the third-party AVM service provider, with the average costs of preparing a stabilized home for sale determined based on the average of the cost components associated with preparing a home for sale for all homes sold during the quarter. The AVMs we receive are accompanied with a confidence index which provides a measure for the perceived reliability of the AVM value. The AVM confidence index is prepared by a third-party AVM service provider and includes a confidence score, which is a statistically based measurement of how similar or dissimilar the results of the third-party AVM service provider’s multiple proprietary valuation models are to each other. We accept AVMs with confidence scores that equate to a statistical error margin of approximately 5% or less. Historically, greater than 90% of the AVMs provided to the Company have had confidence scores that equate to a statistical error margin of approximately 5% or less. When a home’s AVM confidence index falls below our acceptable score, we will rely on a current BPO, which is a value estimate provided by a local broker based on comparable sales data and adjusted based on characteristics specific to the relevant home being valued. If for some reason a current BPO is not available, an internal evaluation is performed by a licensed appraiser using the market approach as defined by the Appraisal Institute to estimate the fair value.
The fair value of investments in NPLs is determined using the net present values of the BPOs of the underlying homes discounted at a then current market discount rate. The net present values of the BPOs of the underlying homes are determined using estimates of the length of time to foreclose or convert the relevant homes, with such estimates made on a state-by-state basis pursuant to market data received from service providers as adjusted from time to time based on our experience.
The costs of selling properties in the portfolio, including commissions and other related costs are not deducted for the purpose of calculating the Estimated SFR Value and Estimated NAV. Further, future promoted interests on the NPL portfolio are not deducted for the purpose of calculating Estimated SFR & NPL Value and Estimated NAV. We consider Estimated NAV to be an appropriate supplemental measure as it illustrates the estimated imbedded value in our SFR portfolio and NPL portfolio that is carried on our balance sheet primarily at historical cost. The Estimated SFR Value, Estimated NPL Value and Estimated NAV are non-GAAP financial measures. However, they are provided for informational purposes to be used by investors in assessing the value of our assets. A reconciliation of total shareholders’ equity to Estimated NAV is provided below.
The use of AVMs in preparing the estimated NAV is subject to certain inherent limitations, including potentially imperfect and/or incomplete information regarding the properties being valued and comparable properties used in the AVM model. SFR and NPL values used in the calculation of estimated NAV are not subject to audit procedures by our independent auditors. These metrics should be considered along with other available information in valuing and assessing us, including our GAAP financial measures and other cash flow and yield metrics.
These metrics should not be viewed as a substitute for book value, net investments in real estate, equity, net income or cash flows from operations prepared in accordance with GAAP, or as measures of profitability or liquidity.
Further, not all real estate investment trusts (“REITs”) compute this same non-GAAP measure, therefore, there can be no assurance that our basis for computing this non-GAAP measure is comparable with that of other REITs.
|
|
18 |
Definitions and Reconciliations (cont’d)
|
|
|
December 31, 2015 |
|
|||||
|
(in thousands, except share and per share data) |
|
Amount |
|
|
Per Share |
|
||
|
|
|
(unaudited) |
|
|||||
|
|
|
|
|
|
|
|
|
|
|
Investments in real estate properties, gross |
|
$ |
2,336,055 |
|
|
$ |
61.52 |
|
|
Less accumulated depreciation |
|
|
(109,403 |
) |
|
|
(2.88 |
) |
|
Add real estate held for sale, net |
|
|
79,669 |
|
|
|
2.10 |
|
|
Investments in real estate, net |
|
|
2,306,321 |
|
|
|
60.73 |
|
|
Add increase in estimated fair value of investments in real estate |
|
|
275,409 |
|
|
|
7.25 |
|
|
Estimated SFR Value |
|
|
2,581,730 |
|
|
|
67.98 |
|
|
Non-performing loans |
|
|
64,620 |
|
|
|
1.70 |
|
|
Non-performing loans (fair value option) |
|
|
380,613 |
|
|
|
10.02 |
|
|
Add increase in estimated fair value of non-performing loans |
|
|
48,900 |
|
|
|
1.29 |
|
|
Estimated NPL Value |
|
|
494,133 |
|
|
|
13.01 |
|
|
Estimated SFR & NPL Value |
|
$ |
3,075,863 |
|
|
$ |
80.99 |
|
|
|
|
|
|
|
|
|
|
|
|
Total shareholders' equity |
|
$ |
1,010,877 |
|
|
$ |
26.62 |
|
|
Less non-controlling interest |
|
|
(1,985 |
) |
|
|
(0.05 |
) |
|
Less unamortized debt discount on convertible senior notes |
|
|
(29,864 |
) |
|
|
(0.79 |
) |
|
Less investments in real estate, net |
|
|
(2,306,321 |
) |
|
|
(60.73 |
) |
|
Less non-performing loans |
|
|
(64,620 |
) |
|
|
(1.70 |
) |
|
Less non-performing loans (fair value option) |
|
|
(380,613 |
) |
|
|
(10.02 |
) |
|
Add estimated SFR & NPL value |
|
|
3,075,863 |
|
|
|
80.99 |
|
|
Estimated NAV |
|
$ |
1,303,337 |
|
|
$ |
34.32 |
|
|
|
|
|
|
|
|
|
|
|
|
Number of Shares |
|
|
|
|
|
|
37,973,989 |
|
Gross Assets. We define gross assets as total assets plus accumulated depreciation in both investments in real estate and real estate held for sale.
Homes We Did Not Intend to Hold For The Long Term. We hold certain homes as REO in our PrimeStar Fund I, LP (“Prime”) portfolio that we intend to sell or transfer from Prime to the rental portfolio, and separately hold certain homes in our SFR portfolio that we are in the process of selling or preparing for sale. Collectively, these two categories of homes are considered as “homes we do not intend to hold for the long term." The period of time that a home remains in this category depends upon (i) the occupancy status at the time the asset is designated as a home that will not be held for the long term, (ii) title or other legal issues that require resolution, (iii) the renovation scope required to list a home for sale, and (iv) conditions in the local real estate market that may impact the time required to sell a home.
|
Homes Not Intended to be Held for the Long Term as of September 30, 2015 |
|
1,421 |
|
|
SFR homes sold |
|
(127 |
) |
|
Prime REOs sold |
|
(314 |
) |
|
Additional SFR not held for long term |
|
54 |
|
|
Additional Prime REOs |
|
184 |
|
|
Homes Not Intended to be Held for the Long Term as of December 31, 2015 |
|
1,218 |
|
Leased percentage. Represents homes that are leased as of the last day of the period for a selected category (e.g. stabilized home portfolio, total rental portfolio, homes held for 180 days or longer, etc.) divided by total homes in the selected portfolio category.
LTV. Loan to value.
NAREIT FFO, Core FFO and Core FFO as Adjusted. FFO is used by industry analysts and investors as a supplemental performance measure of an equity REIT. FFO is defined by the National Association of Real Estate Investment Trusts (“NAREIT”) (“NAREIT FFO”) as net income or loss (computed in accordance with GAAP) excluding gains or losses from sales of previously depreciated real estate assets, plus depreciation and amortization of real estate assets and adjustments for unconsolidated partnerships and joint ventures.
We believe that NAREIT FFO is a meaningful supplemental measure of the operating performance of our SFR business because historical cost accounting for real estate assets in accordance with GAAP assumes that the value of real estate assets diminishes predictably over time, as reflected through depreciation. Because real estate values have historically risen or fallen with market conditions, management considers NAREIT FFO an appropriate supplemental performance measure because it excludes historical cost depreciation, as well as gains or losses related to sales of previously depreciated homes, from GAAP net income. By excluding depreciation and gains or losses on sales of real estate, management uses NAREIT FFO to measure returns on its investments in real estate assets. However, because NAREIT FFO excludes depreciation and amortization and captures neither the changes in the value of the homes that result from use or market conditions nor the level of capital expenditures to maintain the operating performance of the homes, all of which have real economic effect and could materially impact our results from operations, the utility of NAREIT FFO as a measure of our performance is limited.
We believe that Core FFO and Core FFO as Adjusted are meaningful supplemental measures of our operating performance for the same reasons as NAREIT FFO and is further helpful to investors as it provides a more consistent measurement of our performance across reporting periods by removing the impact of certain items that are not comparable from period to period. Our Core FFO begins with NAREIT FFO as defined by the NAREIT White Paper, and is adjusted for: share-based compensation, non-recurring costs associated with the separation, transaction-related expenses, acquisition fees and other expenses, write-off of loan costs, loss on derivative financial instruments, amortization of derivative financial instruments cost, severance expense, non-cash interest expense related to amortization on convertible senior notes, and other non-comparable items, as applicable. Our Core FFO as Adjusted begins with Core FFO and is adjusted further for out of period property tax expense.
|
|
19 |
Definitions and Reconciliations (cont’d)
Management also believes that NAREIT FFO, Core FFO, and Core FFO as Adjusted, combined with the required GAAP presentations, is useful to investors in providing more meaningful comparisons of the operating performance of a company’s real estate between periods or as compared to other companies. NAREIT FFO, Core FFO, and Core FFO as Adjusted do not represent net income or cash flows from operations as defined by GAAP and are not intended to indicate whether cash flows will be sufficient to fund cash needs. They should not be considered an alternative to net income as an indicator of the REIT’s operating performance or to cash flows as a measure of liquidity. Our NAREIT FFO and Core FFO may not be comparable to the NAREIT FFO of other REITs due to the fact that not all REITs use the NAREIT or similar Core FFO definition. For a reconciliation of NAREIT FFO, Core FFO and Core FFO as Adjusted to net loss attributable to common shareholders determined in accordance with GAAP for the three months ended December 31, 2015 and 2014, please refer to the “NAREIT FFO, CORE FFO and CORE FFO as Adjusted” page of this presentation. For a reconciliation of NAREIT FFO and Core FFO to net loss attributable to common shareholders determined in accordance with GAAP for the three months ended September 30, 2015, June 30, 2015, and March 31, 2015, please refer to the table below.
|
|
|
Three Months Ended |
|
|||||||||
|
(in thousands, except share and per share data, unaudited) |
|
September 30, 2015 |
|
|
June 30, 2015 |
|
|
March 31, 2015 |
|
|||
|
|
|
|
|
|
|
|
|
|
|
|
|
|
|
Reconciliation of net loss to NAREIT FFO |
|
|
|
|
|
|
|
|
|
|
|
|
|
|
|
|
|
|
|
|
|
|
|
|
|
|
|
Net loss attributable to Starwood Waypoint Residential Trust shareholders |
|
$ |
(11,163 |
) |
|
$ |
(3,437 |
) |
|
$ |
(7 |
) |
|
|
|
|
|
|
|
|
|
|
|
|
|
|
|
Add (deduct) adjustments to net loss to derive NAREIT FFO: |
|
|
|
|
|
|
|
|
|
|
|
|
|
Depreciation and amortization on real estate assets |
|
|
19,783 |
|
|
|
18,984 |
|
|
|
18,008 |
|
|
Gain on sales of previously depreciated investments in real estate |
|
|
(1,472 |
) |
|
|
(458 |
) |
|
|
(246 |
) |
|
Non-controlling interests |
|
|
109 |
|
|
|
98 |
|
|
|
121 |
|
|
Subtotal - NAREIT FFO |
|
|
7,257 |
|
|
|
15,187 |
|
|
|
17,876 |
|
|
|
|
|
|
|
|
|
|
|
|
|
|
|
|
Add (deduct) adjustments to NAREIT FFO to derive Core FFO: |
|
|
|
|
|
|
|
|
|
|
|
|
|
Share-based compensation |
|
|
2,344 |
|
|
|
1,390 |
|
|
|
1,927 |
|
|
Acquisition fees and other expenses |
|
|
244 |
|
|
|
259 |
|
|
|
363 |
|
|
Adjustment for derivative instruments, net |
|
|
(69 |
) |
|
|
(35 |
) |
|
|
111 |
|
|
Transaction-related expenses |
|
|
4,288 |
|
|
|
— |
|
|
|
— |
|
|
Non-cash interest expense related to amortization on convertible senior notes |
|
|
2,296 |
|
|
|
2,259 |
|
|
|
2,184 |
|
|
Core FFO |
|
$ |
16,360 |
|
|
$ |
19,060 |
|
|
$ |
22,461 |
|
|
|
|
|
|
|
|
|
|
|
|
|
|
|
|
Core FFO per share |
|
$ |
0.43 |
|
|
$ |
0.50 |
|
|
$ |
0.59 |
|
|
Dividends declared per common share |
|
$ |
0.19 |
|
|
$ |
0.14 |
|
|
$ |
0.14 |
|
|
|
|
|
|
|
|
|
|
|
|
|
|
|
|
Weighted average shares - basic and diluted |
|
|
37,906,769 |
|
|
|
38,096,969 |
|
|
|
37,821,364 |
|
Net Debt. We define net debt as total debt outstanding less cash and cash equivalents and asset- backed securitization certificates.
NPL Roll-forward. We hold our NPLs within a condensed consolidated subsidiary that we established with our joint venture, Prime. We hold a controlling interest in the subsidiary and, as such, have power to direct its significant activities while Prime manages the subsidiary’s day-to-day operations. Should this subsidiary realize future returns in excess of specific thresholds, Prime may receive incremental incentive distributions in excess of their ownership interest. The following table summarizes transactions for our NPLs for the year ended December 31, 2015:
|
Loan Count as of December 31, 2014 |
|
4,389 |
|
|
Acquisitions |
|
— |
|
|
Loans sold |
|
(635 |
) |
|
Loans converted to real estate |
|
(989 |
) |
|
Loan liquidations and other basis reductions |
|
(226 |
) |
|
Loan Count as of December 31, 2015 |
|
2,539 |
|
Occupancy Percentage. Represents number of occupied homes as of the last day of the period divided by rental portfolio homes.
Same Store Growth. We define same store properties as homes stabilized at January 1, 2014 and held in operations throughout the full periods in both 2014 and 2015. Same store properties exclude homes that have been disposed of or transitioned to the development period for significant renovation. We believe Same Store Growth is a useful measure of performance because the population of properties in this analysis is consistent from period to period, thereby eliminating the effects of changes in the composition of the portfolio. Refer below for a reconciliation of net loss attributable to Starwood Waypoint Residential Trust shareholders to Same Store NOI.
|
|
20 |
Definitions and Reconciliations (cont’d)
|
|
|
Three Months Ended December 31, |
|
|
Twelve Months Ended December 31, |
|
||||||||||
|
(in thousands, unaudited) |
|
2015 |
|
|
2014 |
|
|
2015 |
|
|
2014 |
|
||||
|
Reconciliation of net loss to same store NOI |
|
|
|
|
|
|
|
|
|
|
|
|
|
|
|
|
|
Net loss attributable to Starwood Waypoint Residential Trust shareholders |
|
$ |
(29,786 |
) |
|
$ |
(9,558 |
) |
|
$ |
(44,393 |
) |
|
$ |
(43,695 |
) |
|
Add (deduct) adjustments to derive total NOI: |
|
|
|
|
|
|
|
|
|
|
|
|
|
|
|
|
|
Non-performing loan management fees and expenses |
|
|
2,141 |
|
|
|
3,150 |
|
|
|
11,442 |
|
|
|
10,944 |
|
|
General and administrative |
|
|
4,609 |
|
|
|
4,866 |
|
|
|
16,436 |
|
|
|
19,307 |
|
|
Share-based compensation |
|
|
1,568 |
|
|
|
3,898 |
|
|
|
7,229 |
|
|
|
8,458 |
|
|
Investment management fees |
|
|
4,517 |
|
|
|
4,825 |
|
|
|
18,843 |
|
|
|
16,097 |
|
|
Acquisition fees and other expenses |
|
|
254 |
|
|
|
637 |
|
|
|
1,120 |
|
|
|
1,301 |
|
|
Interest expense, including amortization |
|
|
19,388 |
|
|
|
16,633 |
|
|
|
76,800 |
|
|
|
35,223 |
|
|
Depreciation and amortization |
|
|
23,305 |
|
|
|
19,918 |
|
|
|
80,080 |
|
|
|
41,872 |
|
|
Separation costs |
|
|
— |
|
|
|
— |
|
|
|
— |
|
|
|
3,543 |
|
|
Transaction-related expense |
|
|
7,564 |
|
|
|
— |
|
|
|
11,852 |
|
|
|
— |
|
|
Finance-related expenses and write-off of loan costs |
|
|
2,370 |
|
|
|
940 |
|
|
|
4,547 |
|
|
|
7,715 |
|
|
Impairment of real estate |
|
|
2,261 |
|
|
|
171 |
|
|
|
3,122 |
|
|
|
2,579 |
|
|
Realized (gain) loss on sales of investments in real estate, net |
|
|
(1,975 |
) |
|
|
148 |
|
|
|
(4,151 |
) |
|
|
224 |
|
|
Realized loss on divestiture homes, net |
|
|
3,870 |
|
|
|
— |
|
|
|
6,871 |
|
|
|
— |
|
|
Loss on derivative financial instruments, net |
|
|
12 |
|
|
|
132 |
|
|
|
319 |
|
|
|
706 |
|
|
Income tax expense |
|
|
(281 |
) |
|
|
(44 |
) |
|
|
159 |
|
|
|
460 |
|
|
Net income attributable to non-controlling interests |
|
|
8 |
|
|
|
79 |
|
|
|
336 |
|
|
|
165 |
|
|
Total NOI(1) |
|
|
39,825 |
|
|
|
45,795 |
|
|
|
190,612 |
|
|
|
104,899 |
|
|
Deduct: non-same store NOI |
|
|
(23,036 |
) |
|
|
(16,457 |
) |
|
|
(92,716 |
) |
|
|
(39,918 |
) |
|
Deduct: total NPL portfolio NOI |
|
|
(13,071 |
) |
|
|
(25,850 |
) |
|
|
(81,969 |
) |
|
|
(50,086 |
) |
|
Same store NOI |
|
$ |
3,718 |
|
|
$ |
3,488 |
|
|
$ |
15,927 |
|
|
$ |
14,895 |
|
|
(1) |
Includes out of period tax expenses of $2.0 million and $0.9 million for the three and twelve months ended December 31, 2015. |
Stabilized and Non-Stabilized Home Portfolio. We define the stabilized home portfolio to include homes from the first day of initial occupancy or subsequent occupancy after a significant renovation. All other homes are considered non-stabilized. Homes are considered stabilized even after subsequent resident turnover. However, homes may be removed from the stabilized home portfolio and placed in the non-stabilized home portfolio due to significant renovation during the home lifecycle.
Total Debt. We define total debt as total debt maturities excluding asset-backed securitization certificates retained by SWAY.
Total NOI, Total NPL NOI, Total Non-Stabilized Portfolio NOI and Total Stabilized Portfolio NOI. We define Total NOI as total revenues less property operating and maintenance expenses and real estate taxes and insurance expenses (“property operating expenses”) and mortgage loan servicing costs. We define Total NPL Portfolio NOI as gains on NPLs, net and gains on loan conversions, net less mortgage loan servicing costs. We define Total Non-Stabilized Portfolio NOI as total revenues on the non-stabilized portfolio less property operating expenses on the non-stabilized portfolio. We define Total Stabilized Portfolio NOI as total revenues on the stabilized portfolio less property operating expenses on the stabilized portfolio. We consider these NOI measures to be appropriate supplemental measures of operating performance to net income attributable to common shareholders because they reflect the operating performance of our homes without allocation of corporate level overhead or general and administrative costs and reflect the operations of the segments and sub-segments of our business. Refer to the table on the next page for a reconciliation of net loss attributable to common shareholders to these NOI measures.
These NOI measures and Same Store NOI should not be considered alternatives to net loss or net cash flows from operating activities, as determined in accordance with GAAP, as indications of our performance or as measures of liquidity. Although we use these non-GAAP measures for comparability in assessing their performance against other REITs, not all REITs compute the same non-GAAP measures. Accordingly, there can be no assurance that our basis for computing these non-GAAP measures are comparable with that of other REITs.
|
|
21 |
Definitions and Reconciliations (cont’d)
|
(in thousands, unaudited) |
|
Q1 2015 |
|
|
Q2 2015 |
|
|
Q3 2015 |
|
|
Q4 2015 |
|
|
YTD 2015 |
|
|
|||||
|
Reconciliation of net loss to stabilized portfolio NOI |
|
|
|
|
|
|
|
|
|
|
|
|
|
|
|
|
|
|
|
|
|
|
Net loss attributable to Starwood Waypoint Residential Trust shareholders |
|
$ |
(7 |
) |
|
$ |
(3,437 |
) |
|
$ |
(11,163 |
) |
|
$ |
(29,786 |
) |
|
$ |
(44,393 |
) |
|
|
|
|
|
|
|
|
|
|
|
|
|
|
|
|
|
|
|
|
|
|
|
|
|
Add (deduct) adjustments to get to total NOI |
|
|
|
|
|
|
|
|
|
|
|
|
|
|
|
|
|
|
|
|
|
|
Non-performing loan management fees and expenses |
|
|
3,566 |
|
|
|
2,589 |
|
|
|
3,146 |
|
|
|
2,141 |
|
|
|
11,442 |
|
|
|
General and administrative |
|
|
3,858 |
|
|
|
4,004 |
|
|
|
3,965 |
|
|
|
4,609 |
|
|
|
16,436 |
|
|
|
Share-based compensation |
|
|
1,927 |
|
|
|
1,390 |
|
|
|
2,344 |
|
|
|
1,568 |
|
|
|
7,229 |
|
|
|
Investment management fees |
|
|
4,781 |
|
|
|
4,881 |
|
|
|
4,664 |
|
|
|
4,517 |
|
|
|
18,843 |
|
|
|
Acquisition fees and other expenses |
|
|
363 |
|
|
|
259 |
|
|
|
244 |
|
|
|
254 |
|
|
|
1,120 |
|
|
|
Interest expense, including amortization |
|
|
17,617 |
|
|
|
19,595 |
|
|
|
20,200 |
|
|
|
19,388 |
|
|
|
76,800 |
|
|
|
Depreciation and amortization |
|
|
18,008 |
|
|
|
18,984 |
|
|
|
19,783 |
|
|
|
23,305 |
|
|
|
80,080 |
|
|
|
Transaction-related expense |
|
|
— |
|
|
|
— |
|
|
|
4,288 |
|
|
|
7,564 |
|
|
|
11,852 |
|
|
|
Finance-related expenses and write-off of loan costs |
|
|
544 |
|
|
|
911 |
|
|
|
722 |
|
|
|
2,370 |
|
|
|
4,547 |
|
|
|
Impairment of real estate |
|
|
219 |
|
|
|
440 |
|
|
|
202 |
|
|
|
2,261 |
|
|
|
3,122 |
|
|
|
Realized (gain) loss on sales of investments in real estate, net |
|
|
(246 |
) |
|
|
(458 |
) |
|
|
(1,472 |
) |
|
|
(1,975 |
) |
|
|
(4,151 |
) |
|
|
Realized loss (gain) on sales of divestiture homes, net |
|
|
782 |
|
|
|
(1,101 |
) |
|
|
3,320 |
|
|
|
3,870 |
|
|
|
6,871 |
|
|
|
Loss on derivative financial instruments, net |
|
|
211 |
|
|
|
65 |
|
|
|
31 |
|
|
|
12 |
|
|
|
319 |
|
|
|
Income tax expense |
|
|
225 |
|
|
|
199 |
|
|
|
16 |
|
|
|
(281 |
) |
|
|
159 |
|
|
|
Net income attributable to non-controlling interests |
|
|
121 |
|
|
|
98 |
|
|
|
109 |
|
|
|
8 |
|
|
|
336 |
|
|
|
Total NOI |
|
|
51,969 |
|
|
|
48,419 |
|
|
|
50,399 |
|
|
|
39,825 |
|
|
|
190,612 |
|
|
|
Add (deduct) adjustments to get to total stabilized home portfolio NOI |
|
|
|
|
|
|
|
|
|
|
|
|
|
|
|
|
|
|
|
|
|
|
NPL portfolio NOI components: |
|
|
|
|
|
|
|
|
|
|
|
|
|
|
|
|
|
|
|
|
|
|
Realized gain on non-performing loans, net |
|
|
(10,171 |
) |
|
|
(4,315 |
) |
|
|
(26,024 |
) |
|
|
(3,560 |
) |
|
|
(44,070 |
) |
|
|
Realized gain on loan conversions, net |
|
|
(8,549 |
) |
|
|
(6,123 |
) |
|
|
(9,270 |
) |
|
|
(9,090 |
) |
|
|
(33,032 |
) |
|
|
Mortgage loan servicing costs |
|
|
9,995 |
|
|
|
9,586 |
|
|
|
10,404 |
|
|
|
9,533 |
|
|
|
39,518 |
|
|
|
Unrealized gain on non-performing loans, net |
|
|
(19,957 |
) |
|
|
(18,426 |
) |
|
|
3,952 |
|
|
|
(9,954 |
) |
|
|
(44,385 |
) |
|
|
Deduct: Total NPL portfolio NOI |
|
|
(28,682 |
) |
|
|
(19,278 |
) |
|
|
(20,938 |
) |
|
|
(13,071 |
) |
|
|
(81,969 |
) |
|
|
Non-stabilized portfolio NOI components: |
|
|
|
|
|
|
|
|
|
|
|
|
|
|
|
|
|
|
|
|
|
|
Property operating expenses on non-stabilized homes |
|
|
3,289 |
|
|
|
1,766 |
|
|
|
2,048 |
|
|
|
2,649 |
|
|
|
9,752 |
|
|
|
Add Total Non-stabilized portfolio NOI |
|
|
3,289 |
|
|
|
1,766 |
|
|
|
2,048 |
|
|
|
2,649 |
|
|
|
9,752 |
|
|
|
|
|
|
|
|
|
|
|
|
|
|
|
|
|
|
|
|
|
|
|
|
|
|
Total stabilized portfolio NOI |
|
$ |
26,576 |
|
|
$ |
30,907 |
|
|
$ |
31,509 |
|
|
$ |
29,403 |
|
|
$ |
118,395 |
|
|
|
|
|
|
|
|
|
|
|
|
|
|
|
|
|
|
|
|
|
|
|
|
|
|
Add (deduct) prior period adjustments recorded in 2015 |
|
|
|
|
|
|
|
|
|
|
|
|
|
|
|
|
|
|
|
|
|
|
Property taxes and insurance(1) |
|
|
— |
|
|
|
— |
|
|
|
— |
|
|
|
2,013 |
|
|
|
915 |
|
|
|
Adjusted total stabilized portfolio NOI |
|
$ |
26,576 |
|
|
$ |
30,907 |
|
|
$ |
31,509 |
|
|
$ |
31,416 |
|
|
$ |
119,310 |
|
|
|
|
|
|
|
|
|
|
|
|
|
|
|
|
|
|
|
|
|
|
|
|
|
|
Calculation of stabilized portfolio NOI margin: |
|
|
|
|
|
|
|
|
|
|
|
|
|
|
|
|
|
|
|
|
|
|
Rental revenues |
|
$ |
41,983 |
|
|
$ |
46,677 |
|
|
$ |
49,197 |
|
|
$ |
50,211 |
|
|
$ |
188,068 |
|
|
|
Less bad debt expense |
|
|
(708 |
) |
|
|
(230 |
) |
|
|
(592 |
) |
|
|
(531 |
) |
|
|
(2,061 |
) |
|
|
Total rental revenues |
|
|
41,275 |
|
|
$ |
46,447 |
|
|
$ |
48,605 |
|
|
$ |
49,680 |
|
|
|
186,007 |
|
|
|
Stabilized portfolio NOI margin |
|
|
64.4 |
% |
|
|
66.5 |
% |
|
|
64.8 |
% |
|
|
63.2 |
% |
|
|
64.1 |
% |
|
|
(1) |
In the fourth quarter of 2015, we adjusted NOI to exclude the impact of $2.0 million and $0.9 million in out of period property tax expenses for the quarter and year, respectively. |
Total Rental Portfolio. We define total rental portfolio to exclude homes designated as non-rental. Non-rental homes are homes we do not intend to hold for the long term.
Units. Effective January 1, 2015, we measure homes by the number of rental units as compared to our previous measure by number of properties. Although historically we have primarily invested in SFRs, and expect to do so in the foreseeable future, this change takes into account our investments in multi-family properties and, we believe provides a more meaningful measure to investors.
UPB. Unpaid principle balance.
|
|
22 |
The statements herein that are not historical facts, and the assumptions upon which those statements are based, are forward-looking statements within the meaning of the Private Securities Litigation Reform Act of 1995, Section 27A of the Securities Act of 1933, as amended, and Section 21E of the Securities Exchange Act of 1934, as amended. These forward-looking statements involve significant risks and uncertainties, which are difficult to predict, and are not guarantees of future performance. Such statements can generally be identified by words such as “projects,” “forecast,” “anticipates,” “expects,” “intends,” “will,” “could,” “believes,” “estimates,” “continue,” and similar expressions. Forward-looking statements are based on certain assumptions and discuss future expectations, describe future plans and strategies, and contain financial and operating projections or state other forward-looking information. Our ability to predict results or the actual effect of future events, actions, plans or strategies is inherently uncertain. Although we believe that the expectations reflected in such forward-looking statements are based on reasonable assumptions, our actual results and performance could differ materially from those set forth in, or implied by, the forward-looking statements. Factors that could materially and adversely affect our business, financial condition, liquidity, results of operations and prospects, as well as our ability to make distributions to our shareholders, include, but are not limited to: failure to plan and manage the Internalization or the Merger effectively and efficiently; the possibility that the anticipated benefits from the Internalization or the Merger may not be realized or may take longer to realize than expected; unexpected costs or unexpected liabilities that may arise from the Internalization or the Merger; the outcome of any legal proceedings that have been or may be instituted against us, CAH or others following the announcement or the completion of the Internalization or the Merger; expectations regarding the timing of generating additional revenues; changes in our business and growth strategies; volatility in the real estate industry, interest rates and spreads, the debt or equity markets, the economy generally or the rental home market specifically, whether the result of market events or otherwise; events or circumstances that undermine confidence in the financial markets or otherwise have a broad impact on financial markets, such as the sudden instability or collapse of large financial institutions or other significant corporations, terrorist attacks, natural or man-made disasters, or threatened or actual armed conflicts; declines in the value of homes, and macroeconomic shifts in demand for, and competition in the supply of, rental homes; the availability of attractive investment opportunities in homes that satisfy our investment objective and business and growth strategies; the impact of changes to the supply of, value of and the returns on NPLs; our ability to convert the homes and NPLs we acquire into rental homes generating attractive returns; our ability to successfully modify or otherwise resolve NPLs; our ability to lease or re-lease our rental homes to qualified residents on attractive terms or at all; the failure of residents to pay rent when due or otherwise perform their lease obligations; our ability to effectively manage our portfolio of rental homes; the concentration of credit risks to which we are exposed; the rates of default or decreased recovery rates on our target assets; the availability, terms and deployment of short-term and long-term capital; the adequacy of our cash reserves and working capital; potential conflicts of interest with Starwood Capital Group Global, L.P., Colony Capital, Inc. and their affiliates; the timing of cash flows, if any, from our investments; unanticipated increases in financing and other costs, including a rise in interest rates; our expected leverage; effects of derivative and hedging transactions; our ability to maintain our exemption from registration as an investment company under the Investment Company Act of 1940, as amended; actions and initiatives of the U.S. government and changes to U.S. government policies that impact the economy generally and, more specifically, the housing and rental markets; changes in governmental regulations, tax laws (including changes to laws governing the taxation of REITs) and rates, and similar matters; limitations imposed on our business and our ability to satisfy complex rules in order for us and, if applicable, certain of our subsidiaries to qualify as a REIT for U.S. federal income tax purposes and the ability of certain of our subsidiaries to qualify as taxable REIT subsidiaries for U.S. federal income tax purposes, and our ability and the ability of our subsidiaries to operate effectively within the limitations imposed by these rules; and estimates relating to our ability to make distributions to our shareholders in the future. You should not place undue reliance on any forward-looking statement and should consider all of the uncertainties and risks described above, as well as those more fully discussed in reports and other documents filed by us with the Securities and Exchange Commission from time to time. Furthermore, except as required by law, we are under no duty to, and we do not intend to, update any of our forward-looking statements appearing herein, whether as a result of new information, future events or otherwise.
|
|
23 |