Attached files
| file | filename |
|---|---|
| 8-K - 8-K - American Homes 4 Rent | amh123120158k.htm |
| EX-99.1 - EXHIBIT 99.1 - American Homes 4 Rent | amh123120158kexhibit991.htm |
| EX-99.2 - EXHIBIT 99.2 - American Homes 4 Rent | amh123120158kexhibit992.htm |
American Homes 4 Rent | ||
Table of Contents
Summary | |
Earnings Press Release | |
Fact Sheet | |
Financial Information | |
Consolidated Statements of Operations | |
FFO and Core FFO attributable to common share and unit holders | |
Initially Leased Property NOI and Core NOI | |
Consolidated Balance Sheets | |
Debt Summary | |
Capital Structure | |
Property Information | |
Same-Home Results—Quarterly Comparisons | |
Same-Home Results—Full Year Comparisons | |
Top 20 Markets Summary | |
Leasing Performance | 17 |
Acquisition, Renovation and Initial Leasing Rates | 18 |
Other Information | |
Top 20 Markets Home Price Appreciation Trends | 19 |
Definitions and Reconciliations | |
Defined Terms | 20 |
Reconciliation of Non-GAAP Financial Measures | 22 |
2
American Homes 4 Rent | ||
Earnings Press Release
American Homes 4 Rent Reports Fourth Quarter and Full Year 2015 Financial and Operating Results
AGOURA HILLS, California—American Homes 4 Rent (NYSE: AMH) (the “Company”), a leading provider of high quality single-family homes for rent, today announced its financial and operating results for the quarter and full year ended December 31, 2015.
Highlights
• | Core Funds from Operations attributable to common share and unit holders (“Core FFO attributable to common share and unit holders”) (as defined) for the fourth quarter of 2015 was $53.8 million, or $0.21 per FFO share and unit, compared to $42.0 million, or $0.16 per FFO share and unit, for the same period in 2014, which represents a 30.0% increase on a per share and unit basis. |
• | Core Net Operating Income from Same-Home properties increased 10.5% and 8.6% year over year for the quarter and year ended December 31, 2015, respectively. |
• | Maintained solid leasing performance with total and stabilized portfolio leased percentages of 93.9% and 95.6%, respectively, as of December 31, 2015. |
• | Net Operating Income from initially leased properties (“Initially Leased Property NOI”) for the quarter ended December 31, 2015, was $95.2 million, a 40.0% increase from $68.0 million for the quarter ended December 31, 2014. |
• | Total portfolio increased by 403 homes to 38,780 as of December 31, 2015, from 38,377 as of September 30, 2015. |
• | During December 2015, the Company, American Residential Properties, Inc. (“ARPI”) and certain of our and their subsidiaries entered into a definitive Agreement and Plan of Merger (see “Merger with American Residential Properties, Inc.” later in this press release). |
“We finished 2015 on a strong note, with another quarter of solid leasing and operating performance resulting in a stabilized leased percentage of 95.6% and year over year Same-Home quarterly Core NOI growth of 10.5%," stated David Singelyn, American Homes 4 Rent's Chief Executive Officer. "As we discussed throughout the year, we have made significant improvements to our operating platform in 2015, implementing best practices and fine-tuning our processes. With our announced merger with American Residential Properties, we believe we are well positioned and confident in our ability to continue to drive value for our shareholders in 2016 and beyond."
Fourth Quarter 2015 Financial Results
Total revenues increased 47.6% to $172.6 million for the fourth quarter of 2015 from $116.9 million for the fourth quarter of 2014. Revenue growth was primarily driven by continued strong leasing activity, as our average leased portfolio grew to 36,010 homes for the fourth quarter of 2015, compared to 27,206 homes for the fourth quarter of 2014.
Core Net Operating Income from Same-Home properties increased 10.5% to $59.6 million for the fourth quarter of 2015, compared to $53.9 million for the fourth quarter of 2014. This increase was primarily due to higher average occupancy levels, rental rate growth and a reduction in property operating expenses.
Initially Leased Property NOI increased 40.0% to $95.2 million for the fourth quarter of 2015, compared to $68.0 million for the fourth quarter of 2014. This increase was primarily due to substantial growth in rental income resulting from a larger number of leased properties.
Core FFO attributable to common share and unit holders was $53.8 million, or $0.21 per FFO share and unit, for the fourth quarter of 2015, compared to $42.0 million, or $0.16 per FFO share and unit, for the fourth quarter of 2014.
3
American Homes 4 Rent | ||
Earnings Press Release (continued)
Net loss totaled $11.3 million for the fourth quarter of 2015, compared to a net loss of $10.0 million for the fourth quarter of 2014.
Full Year 2015 Financial Results
Total revenues increased 58.1% to $630.6 million for the year ended December 31, 2015, from $398.9 million for the year ended December 31, 2014. Revenue growth was primarily driven by continued strong leasing activity, as our average leased portfolio grew to 33,271 homes for the year ended December 31, 2015, compared to 23,154 homes for the year ended December 31, 2014.
Core Net Operating Income from Same-Home properties increased 8.6% to $130.1 million for the year ended December 31, 2015, compared to $119.7 million for the year ended December 31, 2014. This increase was primarily due to higher average occupancy levels and rental rate growth, partially offset by an increase in property operating expenses, which was driven by higher property taxes.
Initially Leased Property NOI increased 48.0% to $343.0 million for the year ended December 31, 2015, compared to $231.8 million for the year ended December 31, 2014. This increase was primarily due to substantial growth in rental income resulting from a larger number of leased properties.
Core FFO attributable to common share and unit holders was $190.4 million, or $0.72 per FFO share and unit, for the year ended December 31, 2015, compared to $143.8 million, or $0.57 per FFO share and unit, for the year ended December 31, 2014.
Net loss totaled $47.9 million for the year ended December 31, 2015, compared to a net loss of $33.1 million for the year ended December 31, 2014.
Initially Leased Property NOI, FFO attributable to common share and unit holders and Core FFO attributable to common share and unit holders are supplemental non-GAAP financial measures. Reconciliations to GAAP measures are provided in a schedule accompanying this press release.
Portfolio
As of December 31, 2015, the Company had 36,403 leased properties, an increase of 786 properties from September 30, 2015. As of December 31, 2015, the leased percentage on stabilized properties was 95.6%, compared to 95.4% as of September 30, 2015.
Investments
During the fourth quarter of 2015, the Company’s total portfolio grew by 403 homes to 38,780 homes as of December 31, 2015, compared to 38,377 homes as of September 30, 2015.
Capital Activities and Balance Sheet
During October 2015, the Company acquired the remaining 67% outside ownership interest in two of its consolidated joint ventures, RJ American Homes 4 Rent One, LLC and RJ American Homes 4 Rent Two, LLC, which own a total of 377 single-family properties, for a purchase price of $44.4 million.
During the fourth quarter of 2015, we repurchased and retired 226,556 of our Class A common shares at a weighted-average price of $15.89 per share and a total price of $3.6 million.
4
American Homes 4 Rent | ||
Earnings Press Release (continued)
As of December 31, 2015, the Company had total outstanding debt of $2.6 billion with a weighted-average interest rate of 3.89% and a weighted-average term to maturity of 16.0 years. The Company’s $800.0 million credit facility, which bears interest at LIBOR plus 275 basis points, had no outstanding balance at the end of the quarter.
Merger with American Residential Properties, Inc.
On December 3, 2015, we, ARPI and certain of our and their subsidiaries entered into a definitive Agreement and Plan of Merger (the "Merger Agreement"). Subject to the terms and conditions of the Merger Agreement, ARPI will merge with and into a wholly owned subsidiary of us in a stock-for-stock transaction, with our subsidiary continuing as the surviving entity (the "Merger"), which was unanimously approved by the members of our board of trustees present at the meeting and by the board of directors of ARPI. As of September 30, 2015, ARPI owned 8,938 single-family properties. If the Merger is completed, each holder of ARPI common stock will receive 1.135 of our Class A common shares for each share of ARPI common stock and each holder of limited partnership interests in ARPI’s operating partnership will receive 1.135 Class A units of our operating partnership. The exchange ratio is fixed and will not be adjusted to reflect changes in the price of our Class A common shares or the price of ARPI common stock occurring prior to the completion of the Merger. It is anticipated that we will issue approximately 36,553,308 Class A common shares and 1,370,626 Class A units in connection with the Merger, representing approximately 12.7% of the total pro forma Class A common shares, Class B common shares and units of our operating partnership, collectively. Among other things, the proposed Merger is subject to approval by the stockholders of ARPI and other customary closing conditions. We anticipate the transaction to close on February 29, 2016.
Additional Information
A copy of the Company’s Fourth Quarter 2015 Supplemental Information Package and this press release are available on our website at www.americanhomes4rent.com. This information has also been furnished to the SEC in a current report on Form 8-K.
Conference Call
A conference call is scheduled on Friday, February 26, 2016, at 11:00 a.m. Eastern Time to discuss the Company’s financial results for the quarter and full year ended December 31, 2015, and to provide an update on its business. The domestic dial-in number is (877) 705-6003 (for U.S. and Canada) and the international dial-in number is (201) 493-6725 (passcode not required). A simultaneous audio webcast may be accessed by using the link at www.americanhomes4rent.com, under “For Investors.” A replay of the conference call may be accessed through Friday, March 11, 2016, by calling (877) 870-5176 (U.S. and Canada) or (858) 384-5517 (international), replay passcode number 13629200#, or by using the link at www.americanhomes4rent.com, under “For Investors.”
About American Homes 4 Rent
American Homes 4 Rent (NYSE: AMH) is a leader in the single-family home rental industry and “American Homes 4 Rent” is fast becoming a nationally recognized brand for rental homes, known for high quality, good value and tenant satisfaction. We are an internally managed Maryland real estate investment trust, or REIT, focused on acquiring, renovating, leasing, and operating attractive, single-family homes as rental properties. As of December 31, 2015, we owned 38,780 single-family properties in selected submarkets in 22 states.
5
American Homes 4 Rent | ||
Earnings Press Release (continued)
Forward-Looking Statements
This press release contains “forward-looking statements.” These forward-looking statements relate to beliefs, expectations or intentions and similar statements concerning matters that are not of historical fact and are generally accompanied by words such as “estimate,” “project,” “predict,” “believe,” “expect,” “anticipate,” “intend,” “potential,” “plan,” “goal” or other words that convey the uncertainty of future events or outcomes. Examples of forward-looking statements contained in this press release include, among others, our belief that, as a result of the Merger, we are well positioned to continue to drive shareholder value. The Company has based these forward-looking statements on its current expectations and assumptions about future events. While the Company's management considers these expectations to be reasonable, they are inherently subject to risks, contingencies and uncertainties, most of which are difficult to predict and many of which are beyond the Company’s control and could cause actual results to differ materially from any future results, performance or achievements expressed or implied by these forward-looking statements. Such factors include, but are not limited to, failure to plan and manage the Merger effectively and efficiently; the possibility that the anticipated benefits from the Merger may not be realized or may take longer than anticipated; unexpected costs or unexpected liabilities that may arise from the Merger; the outcome of any legal proceedings that have been or may be instituted against the Company or others relating to the Merger; and the ability of the Company to successfully integrate pending transactions and implement its operating strategy. Investors should not place undue reliance on these forward-looking statements, which speak only as of the date of this press release. The Company undertakes no obligation to update any forward-looking statements to conform to actual results or changes in its expectations, unless required by applicable law. For a further description of the risks and uncertainties that could cause actual results to differ from those expressed in these forward-looking statements, as well as risks relating to the business of the Company in general, see the “Risk Factors” disclosed in the Company’s Annual Report on Form 10-K for the year ended December 31, 2014, and in the Company’s subsequent filings with the SEC.
Non-GAAP Financial Measures
This press release and the Fourth Quarter 2015 Supplemental Information Package include FFO attributable to common share and unit holders, Core FFO attributable to common share and unit holders and Initially Leased Property NOI, which are non-GAAP financial measures. We believe these measures are helpful in understanding our financial performance and are widely used in the REIT industry. Because other REITs may not compute these financial measures in the same manner, they may not be comparable among REITs. In addition, these metrics are not substitutes for net income / (loss) or net cash flows from operating activities, as defined by GAAP, as measures of our liquidity, operating performance or ability to pay dividends. Reconciliations of these non-GAAP financial measures to the most directly comparable GAAP measures are included in this press release and in the Fourth Quarter 2015 Supplemental Information Package.
6
American Homes 4 Rent | ||
Fact Sheet
(Amounts in thousands, except share, per share and property data)
(Unaudited)
For the Three Months Ended Dec 31, | For the Years Ended Dec 31, | ||||||||||||||
2015 | 2014 | 2015 | 2014 | ||||||||||||
Operating Data | |||||||||||||||
Rents from single-family properties | $ | 152,406 | $ | 109,543 | $ | 559,719 | $ | 376,385 | |||||||
Fees from single-family properties | $ | 1,965 | $ | 1,192 | $ | 7,646 | $ | 5,968 | |||||||
Tenant charge-backs | $ | 16,331 | $ | 5,621 | $ | 56,546 | $ | 14,931 | |||||||
Total revenues from single-family properties | $ | 170,702 | $ | 116,356 | $ | 623,911 | $ | 397,284 | |||||||
Total revenues | $ | 172,587 | $ | 116,899 | $ | 630,576 | $ | 398,874 | |||||||
Leased property operating expenses | $ | 75,472 | $ | 48,326 | $ | 280,907 | $ | 165,474 | |||||||
Initially Leased Property NOI | $ | 95,230 | $ | 68,030 | $ | 343,004 | $ | 231,810 | |||||||
Initially Leased Property NOI margin | 55.8 | % | 58.5 | % | 55.0 | % | 58.3 | % | |||||||
Initially Leased Property Core NOI margin | 62.1 | % | 62.1 | % | 61.1 | % | 61.5 | % | |||||||
G&A expense as % of total revenues | 3.7 | % | 5.0 | % | 3.9 | % | 5.5 | % | |||||||
Annualized G&A expense as % of total assets | 0.38 | % | 0.38 | % | 0.37 | % | 0.35 | % | |||||||
Per FFO share and unit: | |||||||||||||||
FFO attributable to common share and unit holders | $ | 0.17 | $ | 0.11 | $ | 0.62 | $ | 0.43 | |||||||
Core FFO attributable to common share and unit holders | $ | 0.21 | $ | 0.16 | $ | 0.72 | $ | 0.57 | |||||||
Dec 31, 2015 | Sep 30, 2015 | Jun 30, 2015 | Mar 31, 2015 | Dec 31, 2014 | |||||||||||||||
Selected Balance Sheet Information - end of period | |||||||||||||||||||
Single-family properties, net | $ | 6,289,938 | $ | 6,267,464 | $ | 6,162,148 | $ | 6,037,355 | $ | 5,710,671 | |||||||||
Total assets | $ | 6,807,786 | $ | 6,965,816 | $ | 6,686,962 | $ | 6,576,550 | $ | 6,227,351 | |||||||||
Outstanding borrowings under credit facility | $ | — | $ | — | $ | 177,000 | $ | 45,000 | $ | 207,000 | |||||||||
Asset-backed securitizations | $ | 2,530,210 | $ | 2,536,192 | $ | 2,063,663 | $ | 2,068,389 | $ | 1,519,390 | |||||||||
Secured note payable | $ | 50,752 | $ | 50,980 | $ | 51,200 | $ | 51,417 | $ | 51,644 | |||||||||
Total liabilities | $ | 2,872,553 | $ | 2,950,684 | $ | 2,577,099 | $ | 2,436,856 | $ | 2,057,757 | |||||||||
Total equity capitalization | $ | 4,824,925 | $ | 4,672,546 | $ | 4,707,338 | $ | 4,840,764 | $ | 4,967,461 | |||||||||
Total market capitalization | $ | 7,405,887 | $ | 7,259,718 | $ | 6,999,201 | $ | 7,005,570 | $ | 6,745,495 | |||||||||
NYSE AMH Class A common share closing price | $ | 16.66 | $ | 16.08 | $ | 16.04 | $ | 16.55 | $ | 17.03 | |||||||||
Portfolio Data - end of period | ||||||||||||||
Occupied single-family properties | 35,958 | 35,232 | 34,293 | 30,185 | 27,528 | |||||||||
Executed leases for future occupancy | 445 | 385 | 610 | 998 | 722 | |||||||||
Total leased single-family properties | 36,403 | 35,617 | 34,903 | 31,183 | 28,250 | |||||||||
Single-family properties in acquisition process | 151 | 149 | 184 | 371 | 384 | |||||||||
Single-family properties being renovated | 325 | 661 | 502 | 1,492 | 2,502 | |||||||||
Single-family properties being prepared for re-lease | 178 | 283 | 355 | 838 | 630 | |||||||||
Vacant single-family properties available for re-lease | 1,432 | 1,389 | 1,116 | 1,008 | 1,305 | |||||||||
Vacant single-family properties available for initial lease | 246 | 232 | 387 | 1,661 | 1,502 | |||||||||
Single-family properties held for sale | 45 | 46 | 44 | 35 | 26 | |||||||||
Total single-family properties | 38,780 | 38,377 | 37,491 | 36,588 | 34,599 | |||||||||
Total stabilized properties | 37,654 | 36,934 | 36,042 | 32,987 | 29,961 | |||||||||
Total leased percentage | 93.9 | % | 92.8 | % | 93.1 | % | 85.2 | % | 81.6 | % | ||||
Total occupancy percentage | 92.7 | % | 91.8 | % | 91.5 | % | 82.5 | % | 79.6 | % | ||||
Stabilized leased percentage | 95.6 | % | 95.4 | % | 95.8 | % | 93.4 | % | 92.8 | % | ||||
Stabilized occupancy percentage | 94.5 | % | 94.3 | % | 94.1 | % | 90.4 | % | 90.5 | % | ||||
Quarterly lease retention rate | 66.5 | % | 66.0 | % | 69.2 | % | 68.1 | % | 66.6 | % | ||||
Other Data | |||||||||||||||||||
Distributions declared per common share | $ | 0.05 | $ | 0.05 | $ | 0.05 | $ | 0.05 | $ | 0.05 | |||||||||
Distributions declared per Series A preferred share | $ | 0.31 | $ | 0.31 | $ | 0.31 | $ | 0.31 | $ | 0.31 | |||||||||
Distributions declared per Series B preferred share | $ | 0.31 | $ | 0.31 | $ | 0.31 | $ | 0.31 | $ | 0.31 | |||||||||
Distributions declared per Series C preferred share | $ | 0.34 | $ | 0.34 | $ | 0.34 | $ | 0.34 | $ | 0.34 | |||||||||
7
American Homes 4 Rent | ||
Consolidated Statements of Operations
(Amounts in thousands, except share and per share data)
For the Three Months Ended Dec 31, | For the Years Ended Dec 31, | ||||||||||||||
2015 | 2014 | 2015 | 2014 | ||||||||||||
(Unaudited) | (Unaudited) | (Unaudited) | |||||||||||||
Revenues: | |||||||||||||||
Rents from single-family properties | $ | 152,406 | $ | 109,543 | $ | 559,719 | $ | 376,385 | |||||||
Fees from single-family properties | 1,965 | 1,192 | 7,646 | 5,968 | |||||||||||
Tenant charge-backs | 16,331 | 5,621 | 56,546 | 14,931 | |||||||||||
Other | 1,885 | 543 | 6,665 | 1,590 | |||||||||||
Total revenues | 172,587 | 116,899 | 630,576 | 398,874 | |||||||||||
Expenses: | |||||||||||||||
Property operating expenses | |||||||||||||||
Leased single-family properties | 75,472 | 48,326 | 280,907 | 165,474 | |||||||||||
Vacant single-family properties and other | 2,068 | 4,129 | 15,018 | 22,899 | |||||||||||
General and administrative expense | 6,409 | 5,879 | 24,906 | 21,947 | |||||||||||
Interest expense | 27,874 | 9,379 | 89,413 | 19,881 | |||||||||||
Noncash share-based compensation expense | 782 | 691 | 3,125 | 2,586 | |||||||||||
Acquisition fees and costs expensed | 5,280 | 6,465 | 19,577 | 22,386 | |||||||||||
Depreciation and amortization | 62,163 | 47,205 | 242,848 | 165,516 | |||||||||||
Total expenses | 180,048 | 122,074 | 675,794 | 420,689 | |||||||||||
Remeasurement of Series E units | (1,356 | ) | (1,007 | ) | 2,100 | (5,119 | ) | ||||||||
Remeasurement of preferred shares | (2,530 | ) | (3,810 | ) | (4,830 | ) | (6,158 | ) | |||||||
Net loss | (11,347 | ) | (9,992 | ) | (47,948 | ) | (33,092 | ) | |||||||
Noncontrolling interest | 3,558 | 3,751 | 14,353 | 14,965 | |||||||||||
Dividends on preferred shares | 5,569 | 5,569 | 22,276 | 18,928 | |||||||||||
Net loss attributable to common shareholders | $ | (20,474 | ) | $ | (19,312 | ) | $ | (84,577 | ) | $ | (66,985 | ) | |||
Weighted-average shares outstanding–basic and diluted | 208,045,996 | 211,473,906 | 210,600,111 | 196,348,757 | |||||||||||
Net loss attributable to common shareholders per share–basic and diluted | $ | (0.10 | ) | $ | (0.09 | ) | $ | (0.40 | ) | $ | (0.34 | ) | |||
8
American Homes 4 Rent | ||
FFO and Core FFO Attributable to Common Share and Unit Holders
(Amounts in thousands, except share and per share data)
(Unaudited)
For the Three Months Ended Dec 31, | For the Years Ended Dec 31, | ||||||||||||||
2015 | 2014 | 2015 | 2014 | ||||||||||||
Net loss attributable to common shareholders | $ | (20,474 | ) | $ | (19,312 | ) | $ | (84,577 | ) | $ | (66,985 | ) | |||
Adjustments: | |||||||||||||||
Noncontrolling interests in the Operating Partnership | 3,657 | 3,791 | 14,510 | 15,229 | |||||||||||
Depreciation and amortization | 62,163 | 47,205 | 242,848 | 165,516 | |||||||||||
Less: depreciation and amortization of non-real estate assets | (1,351 | ) | (1,746 | ) | (6,869 | ) | (5,062 | ) | |||||||
Less: outside interest in depreciation of partially owned properties | (98 | ) | 54 | (977 | ) | (1,168 | ) | ||||||||
FFO attributable to common share and unit holders | $ | 43,897 | $ | 29,992 | $ | 164,935 | $ | 107,530 | |||||||
Adjustments: | |||||||||||||||
Acquisition fees and costs expensed | 5,280 | 6,465 | 19,577 | 22,386 | |||||||||||
Noncash share-based compensation expense | 782 | 691 | 3,125 | 2,586 | |||||||||||
Remeasurement of Series E units | 1,356 | 1,007 | (2,100 | ) | 5,119 | ||||||||||
Remeasurement of preferred shares | 2,530 | 3,810 | 4,830 | 6,158 | |||||||||||
Core FFO attributable to common share and unit holders | $ | 53,845 | $ | 41,965 | $ | 190,367 | $ | 143,779 | |||||||
Per FFO share and unit: | |||||||||||||||
FFO attributable to common share and unit holders | $ | 0.17 | $ | 0.11 | $ | 0.62 | $ | 0.43 | |||||||
Core FFO attributable to common share and unit holders | $ | 0.21 | $ | 0.16 | $ | 0.72 | $ | 0.57 | |||||||
Weighted-average FFO shares and units | |||||||||||||||
Weighted-average common shares outstanding | 208,045,996 | 211,473,906 | 210,600,111 | 196,348,757 | |||||||||||
Class A units | 14,440,670 | 14,440,670 | 14,440,670 | 14,440,670 | |||||||||||
Series C units | 31,085,974 | 31,085,974 | 31,085,974 | 31,085,974 | |||||||||||
Series D units | 4,375,000 | 4,375,000 | 4,375,000 | 4,375,000 | |||||||||||
Series E units | 4,375,000 | 4,375,000 | 4,375,000 | 4,375,000 | |||||||||||
Total weighted-average FFO shares and units | 262,322,640 | 265,750,550 | 264,876,755 | 250,625,401 | |||||||||||
FFO attributable to common share and unit holders is a non-GAAP financial measure defined as net income or loss calculated in accordance with GAAP, excluding extraordinary items, as defined by GAAP, gains and losses from sales of depreciable real estate, plus real estate-related depreciation and amortization (excluding amortization of deferred financing costs and depreciation of non-real estate assets), and after adjustment for unconsolidated partnerships and joint ventures.
Core FFO attributable to common share and unit holders is a non-GAAP financial measure calculated by adjusting FFO attributable to common share and unit holders for (i) acquisition fees and costs expensed incurred with recent business combinations and the acquisition of individual properties, (ii) noncash share-based compensation expense and (iii) noncash fair value adjustments associated with remeasuring our Series E convertible units liability and preferred shares derivative liability to fair value.
Refer to Defined Terms for further information.
9
American Homes 4 Rent | ||
Initially Leased Property NOI and Core NOI
(Amounts in thousands)
(Unaudited)
For the Three Months Ended Dec 31, | For the Years Ended Dec 31, | ||||||||||||||
2015 | 2014 | 2015 | 2014 | ||||||||||||
Initially Leased Property NOI | |||||||||||||||
Rents from single-family properties | $ | 152,406 | $ | 109,543 | $ | 559,719 | $ | 376,385 | |||||||
Fees from single-family properties | 1,965 | 1,192 | 7,646 | 5,968 | |||||||||||
Tenant charge-backs | 16,331 | 5,621 | 56,546 | 14,931 | |||||||||||
Total revenues from single-family properties | 170,702 | 116,356 | 623,911 | 397,284 | |||||||||||
Leased property operating expenses | 75,472 | 48,326 | 280,907 | 165,474 | |||||||||||
Initially Leased Property NOI | $ | 95,230 | $ | 68,030 | $ | 343,004 | $ | 231,810 | |||||||
Initially Leased Property NOI margin | 55.8 | % | 58.5 | % | 55.0 | % | 58.3 | % | |||||||
Initially Leased Property Core NOI | |||||||||||||||
Rents from single-family properties | $ | 152,406 | $ | 109,543 | $ | 559,719 | $ | 376,385 | |||||||
Fees from single-family properties | 1,965 | 1,192 | 7,646 | 5,968 | |||||||||||
Bad debt expense | (972 | ) | (1,262 | ) | (5,977 | ) | (5,691 | ) | |||||||
Core revenues from single-family properties | 153,399 | 109,473 | 561,388 | 376,662 | |||||||||||
Leased property operating expenses | 75,472 | 48,326 | 280,907 | 165,474 | |||||||||||
Expenses reimbursed by tenant-charge backs | (16,331 | ) | (5,621 | ) | (56,546 | ) | (14,931 | ) | |||||||
Bad debt expense | (972 | ) | (1,262 | ) | (5,977 | ) | (5,691 | ) | |||||||
Core property operating expenses | 58,169 | 41,443 | 218,384 | 144,852 | |||||||||||
Initially Leased Property Core NOI | $ | 95,230 | $ | 68,030 | $ | 343,004 | $ | 231,810 | |||||||
Initially Leased Property Core NOI margin | 62.1 | % | 62.1 | % | 61.1 | % | 61.5 | % | |||||||
Initially Leased Property NOI is a supplemental non-GAAP financial measure defined as rents and fees from single-family properties and tenant charge-backs, less property operating expenses for leased single-family properties. Initially Leased Property Core NOI is also a supplemental non-GAAP financial measure defined as rents and fees from single-family properties, net of bad debt expense, less property operating expenses for initially leased single-family properties, excluding expenses reimbursed by tenant charge-backs and bad debt expense.
Refer to Defined Terms and Reconciliation of Non-GAAP Financial Measures for further information and a reconciliation of Initially Leased Property NOI and Core NOI to net loss, determined in accordance with GAAP.
10
American Homes 4 Rent | ||
Consolidated Balance Sheets
(Amounts in thousands)
Dec 31, 2015 | Dec 31, 2014 | ||||||
(Unaudited) | |||||||
Assets | |||||||
Single-family properties: | |||||||
Land | $ | 1,229,017 | $ | 1,104,409 | |||
Buildings and improvements | 5,469,533 | 4,808,706 | |||||
Single-family properties held for sale | 7,432 | 3,818 | |||||
6,705,982 | 5,916,933 | ||||||
Less: accumulated depreciation | (416,044 | ) | (206,262 | ) | |||
Single-family properties, net | 6,289,938 | 5,710,671 | |||||
Cash and cash equivalents | 57,686 | 108,787 | |||||
Restricted cash | 111,282 | 77,198 | |||||
Rent and other receivables, net | 13,936 | 11,009 | |||||
Escrow deposits, prepaid expenses and other assets | 121,627 | 118,783 | |||||
Deferred costs and other intangibles, net | 66,996 | 54,582 | |||||
Asset-backed securitization certificates | 25,666 | 25,666 | |||||
Goodwill | 120,655 | 120,655 | |||||
Total assets | $ | 6,807,786 | $ | 6,227,351 | |||
Liabilities | |||||||
Credit facility | $ | — | $ | 207,000 | |||
Asset-backed securitizations | 2,530,210 | 1,519,390 | |||||
Secured note payable | 50,752 | 51,644 | |||||
Accounts payable and accrued expenses | 154,751 | 149,706 | |||||
Amounts payable to affiliates | 4,093 | — | |||||
Contingently convertible Series E units liability | 69,957 | 72,057 | |||||
Preferred shares derivative liability | 62,790 | 57,960 | |||||
Total liabilities | 2,872,553 | 2,057,757 | |||||
Commitments and contingencies | |||||||
Equity | |||||||
Shareholders' equity: | |||||||
Class A common shares | 2,072 | 2,108 | |||||
Class B common shares | 6 | 6 | |||||
Preferred shares | 171 | 171 | |||||
Additional paid-in capital | 3,554,063 | 3,618,207 | |||||
Accumulated deficit | (296,865 | ) | (170,162 | ) | |||
Accumulated other comprehensive loss | (102 | ) | (229 | ) | |||
Total shareholders' equity | 3,259,345 | 3,450,101 | |||||
Noncontrolling interest | 675,888 | 719,493 | |||||
Total equity | 3,935,233 | 4,169,594 | |||||
Total liabilities and equity | $ | 6,807,786 | $ | 6,227,351 | |||
11
American Homes 4 Rent | ||
Debt Summary as of December 31, 2015
(Amounts in thousands)
Balance | % of Total | Interest Rate (1) | Years to Maturity | |||||||||
Floating rate debt: | ||||||||||||
Line of credit (2) | $ | — | — | % | 3.18 | % | 2.8 | |||||
AH4R 2014-SFR1 (3) | 473,755 | 18.4 | % | 1.97 | % | 3.4 | ||||||
Total floating rate debt | 473,755 | 18.4 | % | 1.97 | % | 3.4 | ||||||
Fixed rate debt: | ||||||||||||
AH4R 2014-SFR2 | 507,305 | 19.7 | % | 4.42 | % | 8.8 | ||||||
AH4R 2014-SFR3 | 523,109 | 20.3 | % | 4.40 | % | 8.9 | ||||||
AH4R 2015-SFR1 (4) | 549,121 | 21.3 | % | 4.14 | % | 29.3 | ||||||
AH4R 2015-SFR2 (4) | 476,920 | 18.5 | % | 4.36 | % | 29.8 | ||||||
Secured note payable | 50,752 | 2.0 | % | 4.06 | % | 3.5 | ||||||
Total fixed rate debt | 2,107,207 | 81.6 | % | 4.32 | % | 18.8 | ||||||
Total debt | $ | 2,580,962 | 100.0 | % | 3.89 | % | 16.0 | |||||
Note: Total interest expense for the quarter and year ended December 31, 2015, includes $2.7 million and $9.5 million of loan cost amortization, respectively. Total interest expense capitalized during the quarter and year ended December 31, 2015, was $1.0 million and $8.7 million, respectively.
Debt Maturity Schedule
Year | Floating Rate (5) | Fixed Rate | Total | % of Total | |||||||||||
2016 | $ | 4,810 | $ | 21,638 | $ | 26,448 | 1.0 | % | |||||||
2017 | 4,810 | 21,683 | 26,493 | 1.0 | % | ||||||||||
2018 | 4,810 | 21,723 | 26,533 | 1.0 | % | ||||||||||
2019 | 459,325 | 68,564 | 527,889 | 20.5 | % | ||||||||||
2020 | — | 20,714 | 20,714 | 0.8 | % | ||||||||||
2021 | — | 20,714 | 20,714 | 0.8 | % | ||||||||||
2022 | — | 20,714 | 20,714 | 0.8 | % | ||||||||||
2023 | — | 20,714 | 20,714 | 0.8 | % | ||||||||||
2024 | — | 957,420 | 957,420 | 37.1 | % | ||||||||||
2025 | — | 10,302 | 10,302 | 0.4 | % | ||||||||||
Thereafter (4) | — | 923,021 | 923,021 | 35.8 | % | ||||||||||
Total | $ | 473,755 | $ | 2,107,207 | $ | 2,580,962 | 100.0 | % | |||||||
(1) Interest rate on floating rate debt is presented as of end of period.
(2) | Our credit facility provides for borrowing capacity of up to $800.0 million through March 2016 and bears interest at LIBOR plus 2.75% (3.125% beginning in March 2017). Any outstanding borrowings upon expiration of the credit facility period in March 2016 will become due in September 2018. Balance reflects borrowings outstanding as of end of period. Years to maturity based on final maturity date in September 2018. |
(3) | AH4R 2014-SFR1 bears interest at a duration-weighted blended interest rate of LIBOR plus 1.54%, subject to a LIBOR floor of 0.25%. Years to maturity reflects a fully extended maturity date of June 2019, which is based on an initial two-year loan term and three, 12-month extension options, at the Company’s election, provided there is no event of default and compliance with certain other terms. |
(4) | AH4R 2015-SFR1 and AH4R 2015-SFR2 have maturity dates in April 2045 and October 2045, respectively, with anticipated repayment dates in April 2025 and October 2025, respectively. In the event the loans are not repaid by each respective anticipated repayment date, the interest rate on each component is increased to a rate per annum equal to the sum of 3% plus the greater of: (a) the initial interest rate and (b) a rate equal to the sum of (i) the bid side yield to maturity for the “on the run” United States Treasury note with a 10 year maturity plus the mid-market 10 year swap spread, plus (ii) the component spread for each component. |
(5) | Reflects credit facility based on final maturity date of September 2018 and AH4R 2014-SFR1 based on fully extended maturity date of June 2019, which is based on an initial two-year loan term and three, 12-month extension options, at the Company’s election, provided there is no event of default and compliance with certain other terms. |
12
American Homes 4 Rent | ||
Capital Structure as of December 31, 2015
(Amounts in thousands, except share and per share data)
Total Capitalization
Floating rate debt | $ | 473,755 | ||||||||
Fixed rate debt | 2,107,207 | |||||||||
Total debt | 2,580,962 | 34.9 | % | |||||||
Common shares outstanding (1) | 207,870,585 | |||||||||
Operating partnership units (1) | 54,276,644 | |||||||||
Total shares and units | 262,147,229 | |||||||||
Common share price at December 31, 2015 (2) | $ | 16.66 | ||||||||
Market value of common shares and operating partnership units | 4,367,373 | |||||||||
Participating preferred shares (see below) | 457,552 | |||||||||
Total equity capitalization | 4,824,925 | 65.1 | % | |||||||
Total market capitalization | $ | 7,405,887 | 100.0 | % | ||||||
(1) | Reflects total common shares and operating partnership units outstanding as of end of period. |
(2) | Based on NYSE AMH Class A common share closing price. |
Participating Preferred Shares
Initial Redemption Period (1) | Outstanding shares | Initial Liquidation Value | Current Liquidation Value (2) | Annual Dividend Per Share | Annual Dividend Amount | ||||||||||||||||||||||||
Series | Per Share | Total | Per Share | Total | |||||||||||||||||||||||||
5.0% Series A | 9/30/2017-9/30/2020 | 5,060,000 | $ | 25.00 | $ | 126,500 | $ | 26.99 | $ | 136,562 | $ | 1.250 | $ | 6,325 | |||||||||||||||
5.0% Series B | 9/30/2017-9/30/2020 | 4,400,000 | $ | 25.00 | 110,000 | $ | 26.99 | 118,749 | $ | 1.250 | 5,500 | ||||||||||||||||||
5.5% Series C | 3/31/2018-3/31/2021 | 7,600,000 | $ | 25.00 | 190,000 | $ | 26.61 | 202,241 | $ | 1.375 | 10,450 | ||||||||||||||||||
17,060,000 | $ | 426,500 | $ | 457,552 | $ | 22,275 | |||||||||||||||||||||||
(1) | Initial redemption period reflects the timeframe during which the Company has the option to redeem the preferred shares for cash or Class A common shares, at a redemption price equal to the initial liquidation value, adjusted by an amount equal to 50% of the cumulative change in value of an index based on the purchase prices of single-family properties located in our top 20 markets (the “HPA adjustment”), subject to a cap, such that the total internal rate of return, when considering the initial liquidation value, the HPA adjustment and the dividends up to, but excluding, the date of redemption, will not exceed 9.0%. If not redeemed by the end of the initial redemption period, the initial liquidation value will be adjusted by the HPA adjustment as of the end of the initial redemption period and the cumulative annual cash dividend rate will be prospectively increased to 10% of the adjusted liquidation value. Any time after the end of the initial liquidation period, the Company has the option to redeem the preferred shares for cash or Class A common shares, at a redemption price equal to the adjusted liquidation value. |
(2) | Current liquidation value reflects initial liquidation value, adjusted by most recent quarterly HPA adjustment calculation, which is made available under the “For Investors” page of the Company’s website. |
13
American Homes 4 Rent | ||
Same-Home Results – Quarterly Comparisons
For the Three Months Ended Dec 31, | ||||||||||
(In thousands, except property and per property data) | 2015 | 2014 | % Change | |||||||
Number of Same-Home properties | 23,812 | 23,812 | ||||||||
Leased percentage as of period end | 95.5 | % | 93.2 | % | ||||||
Occupancy percentage as of period end | 94.4 | % | 91.6 | % | ||||||
Average leased percentage | 95.3 | % | 93.7 | % | ||||||
Average occupancy percentage | 94.3 | % | 92.4 | % | ||||||
Average contractual monthly rent (1) | $ | 1,449 | $ | 1,415 | ||||||
Core Net Operating Income from Same-Home Properties: | ||||||||||
Rents from single-family properties | $ | 96,373 | $ | 92,759 | 3.9 | % | ||||
Fees from single-family properties | 1,186 | 301 | 294.0 | % | ||||||
Bad debt | (558 | ) | (1,001 | ) | (44.3 | )% | ||||
Core revenues from Same-Home properties | 97,001 | 92,059 | 5.4 | % | ||||||
Property tax | 17,403 | 18,666 | (6.8 | )% | ||||||
HOA fees, net of tenant charge-backs | 2,062 | 2,007 | 2.7 | % | ||||||
R&M and turnover costs, net of tenant charge-backs | 8,132 | 7,471 | 8.8 | % | ||||||
Insurance | 1,305 | 1,583 | (17.6 | )% | ||||||
Property management | 8,510 | 8,399 | 1.3 | % | ||||||
Core property operating expenses from Same-Home properties | 37,412 | 38,126 | (1.9 | )% | ||||||
Core net operating income from Same-Home properties | $ | 59,589 | $ | 53,933 | 10.5 | % | ||||
Core net operating income from Same-Home properties margin | 61.4 | % | 58.6 | % | ||||||
For the Three Months Ended Dec 31, | ||||||||
(In thousands, except per property data) | 2015 | 2014 | ||||||
Capital expenditures | $ | 3,802 | $ | 5,107 | ||||
Average capital expenditures per property | $ | 160 | $ | 214 | ||||
Average Occupancy Percentage | Average Contractual Monthly Rent (1) | ||||||||||||||||||||||||||||
Gross Book Value per Property | % of Q4 15 NOI | ||||||||||||||||||||||||||||
Number of Properties (2) | QTD 15 | QTD 14 | Change | Dec 31, 2015 | Dec 31, 2014 | % Change | |||||||||||||||||||||||
Dallas-Fort Worth, TX | 2,226 | $ | 161,786 | 9.0 | % | 96.0 | % | 94.8 | % | 1.1 | % | $ | 1,551 | $ | 1,502 | 3.3 | % | ||||||||||||
Indianapolis, IN | 2,070 | 150,944 | 7.7 | % | 93.1 | % | 87.9 | % | 5.2 | % | 1,295 | 1,270 | 1.9 | % | |||||||||||||||
Atlanta, GA | 1,473 | 170,851 | 6.1 | % | 95.5 | % | 95.7 | % | (0.2 | )% | 1,400 | 1,353 | 3.5 | % | |||||||||||||||
Greater Chicago area, IL and IN | 1,407 | 174,294 | 4.6 | % | 92.5 | % | 91.8 | % | 0.7 | % | 1,668 | 1,639 | 1.8 | % | |||||||||||||||
Cincinnati, OH | 1,264 | 175,219 | 5.3 | % | 92.4 | % | 89.5 | % | 3.0 | % | 1,453 | 1,425 | 2.0 | % | |||||||||||||||
Houston, TX | 1,210 | 180,494 | 4.6 | % | 93.4 | % | 93.8 | % | (0.4 | )% | 1,629 | 1,586 | 2.7 | % | |||||||||||||||
Charlotte, NC | 1,191 | 173,290 | 5.6 | % | 95.3 | % | 94.0 | % | 1.3 | % | 1,399 | 1,363 | 2.7 | % | |||||||||||||||
Nashville, TN | 1,045 | 207,041 | 6.0 | % | 94.5 | % | 93.5 | % | 1.0 | % | 1,587 | 1,547 | 2.6 | % | |||||||||||||||
Jacksonville, FL | 997 | 151,247 | 3.7 | % | 93.8 | % | 92.2 | % | 1.7 | % | 1,332 | 1,307 | 2.0 | % | |||||||||||||||
Phoenix, AZ | 939 | 156,288 | 3.5 | % | 95.5 | % | 92.3 | % | 3.1 | % | 1,173 | 1,135 | 3.4 | % | |||||||||||||||
All Other (3) | 9,990 | 179,984 | 43.9 | % | 94.4 | % | 92.3 | % | 2.0 | % | 1,442 | 1,409 | 2.3 | % | |||||||||||||||
Total / Average | 23,812 | $ | 173,345 | 100.0 | % | 94.3 | % | 92.4 | % | 1.9 | % | $ | 1,449 | $ | 1,415 | 2.4 | % | ||||||||||||
(1) | Average contractual monthly rent as of end of period. |
(2) | For all periods presented, market concentrations reflect the second quarter 2015 reclassification of 17 Same-Home properties from the Indianapolis, IN market to the Greater Chicago area, IL and IN market. |
(3) | Represents 31 markets in 18 states. |
14
American Homes 4 Rent | ||
Same-Home Results – Full Year Comparisons
For the Years Ended Dec 31, | ||||||||||
(In thousands, except property and per property data) | 2015 | 2014 | % Change | |||||||
Number of Same-Home properties | 13,436 | 13,436 | ||||||||
Leased percentage as of period end | 95.7 | % | 93.2 | % | ||||||
Occupancy percentage as of period end | 94.6 | % | 91.5 | % | ||||||
Average leased percentage | 94.9 | % | 93.7 | % | ||||||
Average occupancy percentage | 93.7 | % | 92.7 | % | ||||||
Average contractual monthly rent (1) | $ | 1,442 | $ | 1,407 | ||||||
Core Net Operating Income from Same-Home Properties: | ||||||||||
Rents from single-family properties | $ | 214,177 | $ | 205,350 | 4.3 | % | ||||
Fees from single-family properties | 2,809 | 1,672 | 68.0 | % | ||||||
Bad debt | (2,159 | ) | (3,406 | ) | (36.6 | )% | ||||
Core revenues from Same-Home properties | 214,827 | 203,616 | 5.5 | % | ||||||
Property tax | 37,050 | 36,084 | 2.7 | % | ||||||
HOA fees, net of tenant charge-backs | 5,017 | 4,682 | 7.2 | % | ||||||
R&M and turnover costs, net of tenant charge-backs | 20,682 | 20,861 | (0.9 | )% | ||||||
Insurance | 3,163 | 3,855 | (18.0 | )% | ||||||
Property management | 18,862 | 18,412 | 2.4 | % | ||||||
Core property operating expenses from Same-Home properties | 84,774 | 83,894 | 1.0 | % | ||||||
Core net operating income from Same-Home properties | $ | 130,053 | $ | 119,722 | 8.6 | % | ||||
Core net operating income from Same-Home properties margin | 60.5 | % | 58.8 | % | ||||||
For the Years Ended Dec 31, | |||||||||
(In thousands, except per property data) | 2015 | 2014 | |||||||
Capital expenditures | $ | 13,097 | $ | 14,014 | |||||
Average capital expenditures per property | $ | 975 | $ | 1,043 | |||||
Average Occupancy Percentage | Average Contractual Monthly Rent (1) | ||||||||||||||||||||||||||||
Gross Book Value per Property | % of YTD 15 NOI | ||||||||||||||||||||||||||||
Number of Properties (2) | YTD 15 | YTD 14 | Change | Dec 31, 2015 | Dec 31, 2014 | % Change | |||||||||||||||||||||||
Indianapolis, IN | 1,216 | $ | 150,044 | 7.1 | % | 91.1 | % | 91.0 | % | 0.1 | % | $ | 1,271 | $ | 1,244 | 2.2 | % | ||||||||||||
Dallas-Fort Worth, TX | 1,142 | 166,931 | 8.7 | % | 95.2 | % | 94.2 | % | 1.0 | % | 1,561 | 1,512 | 3.3 | % | |||||||||||||||
Atlanta, GA | 993 | 173,986 | 7.4 | % | 94.9 | % | 94.4 | % | 0.5 | % | 1,420 | 1,371 | 3.6 | % | |||||||||||||||
Phoenix, AZ | 806 | 153,373 | 5.4 | % | 94.6 | % | 91.2 | % | 3.4 | % | 1,168 | 1,129 | 3.5 | % | |||||||||||||||
Nashville, TN | 719 | 207,623 | 7.2 | % | 93.8 | % | 94.5 | % | (0.7 | )% | 1,584 | 1,540 | 2.9 | % | |||||||||||||||
Charlotte, NC | 677 | 174,456 | 5.6 | % | 94.4 | % | 94.9 | % | (0.4 | )% | 1,394 | 1,355 | 2.8 | % | |||||||||||||||
Cincinnati, OH | 662 | 177,010 | 5.0 | % | 91.9 | % | 89.8 | % | 2.1 | % | 1,453 | 1,424 | 2.0 | % | |||||||||||||||
Tampa, FL | 663 | 200,392 | 4.7 | % | 94.4 | % | 91.4 | % | 3.0 | % | 1,611 | 1,570 | 2.6 | % | |||||||||||||||
Jacksonville, FL | 631 | 155,809 | 4.1 | % | 93.3 | % | 91.3 | % | 2.0 | % | 1,352 | 1,320 | 2.4 | % | |||||||||||||||
Houston, TX | 620 | 188,523 | 4.1 | % | 92.4 | % | 93.4 | % | (1.0 | )% | 1,618 | 1,579 | 2.5 | % | |||||||||||||||
All Other (3) | 5,307 | 179,451 | 40.7 | % | 93.8 | % | 92.6 | % | 1.1 | % | 1,456 | 1,424 | 2.3 | % | |||||||||||||||
Total / Average | 13,436 | $ | 175,234 | 100.0 | % | 93.7 | % | 92.7 | % | 1.0 | % | $ | 1,442 | $ | 1,407 | 2.5 | % | ||||||||||||
(1) | Average contractual monthly rent as of end of period. |
(2) | For all periods presented, market concentrations reflect the second quarter 2015 reclassification of 17 Same-Home properties from the Indianapolis, IN market to the Greater Chicago area, IL and IN market, which is presented in All Other. |
(3) | Represents 31 markets in 19 states. |
15
American Homes 4 Rent | ||
Top 20 Markets Summary as of December 31, 2015
Property Information
Market | Number of Properties | Percentage of Total Properties | Gross Book Value ($ Millions) | Gross Book Value per Property | Avg. Sq. Ft. | Avg. Age (years) | ||||||||||||||
Dallas-Fort Worth, TX | 3,210 | 8.3 | % | $ | 513.8 | $ | 160,063 | 2,126 | 12.2 | |||||||||||
Indianapolis, IN (1) | 2,777 | 7.2 | % | 423.7 | 152,575 | 1,942 | 13.3 | |||||||||||||
Atlanta, GA | 2,802 | 7.2 | % | 456.6 | 162,972 | 2,095 | 15.0 | |||||||||||||
Charlotte, NC | 2,313 | 6.0 | % | 402.2 | 173,865 | 2,009 | 12.7 | |||||||||||||
Greater Chicago area, IL and IN (1) | 2,064 | 5.3 | % | 370.2 | 179,353 | 1,896 | 14.3 | |||||||||||||
Houston, TX | 2,048 | 5.3 | % | 354.4 | 173,043 | 2,213 | 11.3 | |||||||||||||
Cincinnati, OH | 1,872 | 4.8 | % | 322.7 | 172,384 | 1,848 | 13.8 | |||||||||||||
Tampa, FL | 1,567 | 4.0 | % | 295.3 | 188,418 | 1,971 | 12.1 | |||||||||||||
Jacksonville, FL | 1,569 | 4.0 | % | 239.0 | 152,332 | 1,907 | 11.9 | |||||||||||||
Nashville, TN | 1,512 | 3.9 | % | 314.9 | 208,237 | 2,206 | 11.4 | |||||||||||||
Raleigh, NC | 1,472 | 3.8 | % | 265.8 | 180,570 | 1,884 | 11.6 | |||||||||||||
Phoenix, AZ | 1,603 | 4.1 | % | 259.5 | 161,901 | 1,832 | 12.9 | |||||||||||||
Columbus, OH | 1,453 | 3.7 | % | 224.6 | 154,579 | 1,830 | 14.4 | |||||||||||||
Salt Lake City, UT | 1,049 | 2.7 | % | 230.6 | 219,815 | 2,131 | 14.6 | |||||||||||||
Orlando, FL | 1,175 | 3.0 | % | 197.7 | 168,232 | 1,873 | 14.2 | |||||||||||||
Las Vegas, NV | 966 | 2.5 | % | 169.3 | 175,255 | 1,854 | 13.2 | |||||||||||||
San Antonio, TX | 895 | 2.3 | % | 137.0 | 153,053 | 1,989 | 14.2 | |||||||||||||
Denver, CO | 685 | 1.8 | % | 186.1 | 271,715 | 2,146 | 15.9 | |||||||||||||
Austin, TX | 675 | 1.7 | % | 101.3 | 150,058 | 1,842 | 11.6 | |||||||||||||
Greenville, SC | 635 | 1.6 | % | 108.0 | 170,008 | 1,934 | 12.5 | |||||||||||||
All Other (2) | 6,438 | 16.6 | % | 1,133.3 | 176,145 | 1,838 | 12.4 | |||||||||||||
Total / Average | 38,780 | 100.0 | % | $ | 6,706.0 | $ | 172,924 | 1,965 | 13.0 | |||||||||||
Leasing Information
Total Portfolio | Stabilized Properties | ||||||||||||||||||
Market | Leased Percentage | Occupancy Percentage | Avg. Contractual Monthly Rent Per Property | Leased Percentage | Occupancy Percentage | Total Stabilized Properties | |||||||||||||
Dallas-Fort Worth, TX | 95.2 | % | 93.6 | % | $ | 1,537 | 97.3 | % | 95.6 | % | 3,105 | ||||||||
Indianapolis, IN (1) | 94.3 | % | 93.1 | % | 1,306 | 95.1 | % | 93.8 | % | 2,742 | |||||||||
Atlanta, GA | 90.6 | % | 89.1 | % | 1,347 | 96.7 | % | 95.1 | % | 2,591 | |||||||||
Charlotte, NC | 94.9 | % | 93.9 | % | 1,398 | 96.7 | % | 95.7 | % | 2,254 | |||||||||
Greater Chicago area, IL and IN (1) | 93.4 | % | 92.7 | % | 1,698 | 94.0 | % | 93.2 | % | 2,029 | |||||||||
Houston, TX | 93.3 | % | 92.2 | % | 1,611 | 94.7 | % | 93.7 | % | 1,969 | |||||||||
Cincinnati, OH | 93.0 | % | 91.5 | % | 1,445 | 93.8 | % | 92.2 | % | 1,843 | |||||||||
Tampa, FL | 94.4 | % | 93.4 | % | 1,546 | 95.3 | % | 94.4 | % | 1,539 | |||||||||
Jacksonville, FL | 93.1 | % | 92.5 | % | 1,333 | 95.7 | % | 95.1 | % | 1,506 | |||||||||
Nashville, TN | 93.1 | % | 92.3 | % | 1,600 | 95.5 | % | 94.6 | % | 1,452 | |||||||||
Raleigh, NC | 95.2 | % | 94.5 | % | 1,385 | 96.8 | % | 96.1 | % | 1,444 | |||||||||
Phoenix, AZ | 96.8 | % | 95.7 | % | 1,144 | 96.7 | % | 95.7 | % | 1,591 | |||||||||
Columbus, OH | 94.4 | % | 92.8 | % | 1,422 | 96.4 | % | 94.7 | % | 1,400 | |||||||||
Salt Lake City, UT | 96.6 | % | 95.9 | % | 1,485 | 96.6 | % | 95.9 | % | 1,048 | |||||||||
Orlando, FL | 92.3 | % | 91.0 | % | 1,418 | 96.7 | % | 95.3 | % | 1,111 | |||||||||
Las Vegas, NV | 94.0 | % | 92.3 | % | 1,333 | 94.9 | % | 93.1 | % | 919 | |||||||||
San Antonio, TX | 93.6 | % | 93.1 | % | 1,386 | 95.3 | % | 94.7 | % | 874 | |||||||||
Denver, CO | 96.6 | % | 96.2 | % | 1,913 | 98.1 | % | 97.6 | % | 671 | |||||||||
Austin, TX | 94.4 | % | 93.0 | % | 1,372 | 94.6 | % | 93.2 | % | 665 | |||||||||
Greenville, SC | 92.3 | % | 91.0 | % | 1,433 | 94.8 | % | 93.5 | % | 613 | |||||||||
All Other (2) | 93.4 | % | 92.2 | % | 1,403 | 94.8 | % | 93.5 | % | 6,288 | |||||||||
Total / Average | 93.9 | % | 92.7 | % | $ | 1,441 | 95.6 | % | 94.5 | % | 37,654 | ||||||||
(1) | Reflects the second quarter 2015 reclassification of 36 properties from the Indianapolis, IN market to the Greater Chicago area, IL and IN market. |
(2) | Represents 21 markets in 15 states. |
16
American Homes 4 Rent | ||
Leasing Performance
Renewal / Retention Rates
Lease Expirations (1) | Expiration Outcome | Early Terminations (3) | Renewal Rate | Retention Rate | |||||||||||||
Renewed (2) | Move-out | ||||||||||||||||
Q4 2015 | 4,942 | 3,777 | 1,165 | 737 | 76.4 | % | 66.5 | % | |||||||||
(1) | Reflects total non-month-to-month leases scheduled to expire during the quarter ended December 31, 2015. |
(2) | Represents total renewed leases (including both non-month-to-month and month-to-month renewals) during the quarter ended December 31, 2015. |
(3) | Includes non-month-to-month tenant move-outs during the quarter ended December 31, 2015, in advance of contractual expiration scheduled after December 31, 2015. |
Scheduled Lease Expirations
MTM | Q1 2016 | Q2 2016 | Q3 2016 | Q4 2016 | Thereafter | ||||||||||||
Lease expirations | 1,502 | 7,961 | 11,178 | 8,752 | 5,775 | 1,235 | |||||||||||
Renewal / Re-Lease Spreads
Renewals | Re-Leases | ||||||||||||
Market | Number of Leases | Avg Change in Rent (1) | Number of Leases | Avg Change in Rent (2) | |||||||||
Dallas-Fort Worth, TX | 306 | 4.0 | % | 235 | 2.7 | % | |||||||
Indianapolis, IN | 172 | 3.1 | % | 236 | 1.1 | % | |||||||
Atlanta, GA | 126 | 3.8 | % | 158 | 3.7 | % | |||||||
Charlotte, NC | 178 | 3.8 | % | 162 | 4.2 | % | |||||||
Greater Chicago area, IL and IN | 136 | 3.6 | % | 143 | 0.2 | % | |||||||
Houston, TX | 134 | 4.0 | % | 126 | 0.4 | % | |||||||
Cincinnati, OH | 169 | 3.3 | % | 158 | 1.7 | % | |||||||
Tampa, FL | 93 | 4.3 | % | 124 | 2.8 | % | |||||||
Jacksonville, FL | 88 | 3.8 | % | 119 | 2.3 | % | |||||||
Nashville, TN | 134 | 2.7 | % | 115 | 2.4 | % | |||||||
All Other (3) | 1,321 | 3.9 | % | 1,266 | 2.7 | % | |||||||
Total | 2,857 | 3.7 | % | 2,842 | 2.4 | % | |||||||
(1) | Represents average percentage change in rent on non-month-to-month lease renewals during the quarter ended December 31, 2015. |
(2) | Reflects average percentage change in annual rent on properties re-leased during the quarter ended December 31, 2015, compared to annual rent of the previous expired lease for each individual property. |
(3) | Represents 31 markets in 19 states. |
17
American Homes 4 Rent | ||
Acquisition, Renovation and Initial Leasing Rates
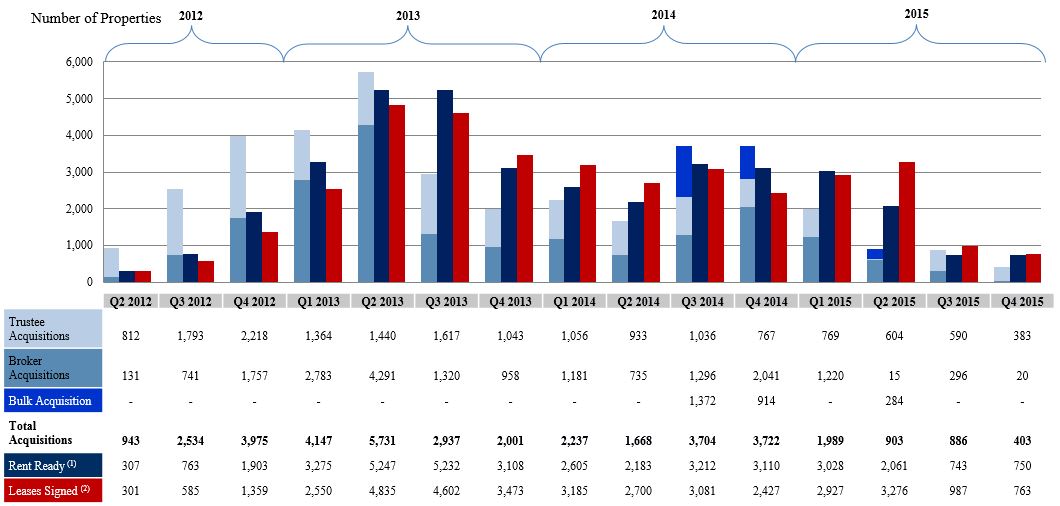
(1) | “Rent Ready” includes properties for which initial construction has been completed during each quarter. Q3 2014 includes 1,338 renovated properties acquired as part of the Beazer Rental Homes portfolio. Q4 2014 includes 896 renovated properties acquired as part of the Ellington Housing Single-Family portfolio. Q2 2015 includes 268 properties acquired as part of bulk acquisitions. |
(2) | “Leases Signed” includes the number of initial leases signed each quarter (includes Pre-Existing Leases). Q3 2014 includes 1,236 leased properties acquired as part of the Beazer Rental Homes portfolio. Q4 2014 includes 880 leased properties acquired as part of the Ellington Housing Single-Family portfolio. Q2 2015 includes 241 properties acquired as part of bulk acquisitions. |
18
American Homes 4 Rent | ||
Top 20 Markets Home Price Appreciation Trends
The table below summarizes historic changes in the House Price Index of the Federal Housing Finance Agency (“FHFA”), known as the Quarterly Purchase-Only Index, specifically the non-seasonally adjusted “Purchase-Only Index” for the “100 Largest Metropolitan Statistical Areas”, which is used for purposes of computing the “HPA Factor” for our 5% Series A participating preferred shares, 5% Series B participating preferred shares and 5.5% Series C participating preferred shares as described in the prospectuses for those securities.
HPA Index (1) | HPA Index Change | ||||||||||||||||||||
Dec 31, 2012 | Dec 31, 2013 | Dec 31, 2014 | Mar 31, 2015 | Jun 30, 2015 | Sep 30, 2015 | ||||||||||||||||
Market | |||||||||||||||||||||
Dallas-Fort Worth, TX (2) | 100.0 | 108.4 | 115.2 | 119.8 | 124.8 | 126.8 | 26.8 | % | |||||||||||||
Indianapolis, IN | 100.0 | 106.4 | 112.3 | 113.9 | 116.8 | 117.4 | 17.4 | % | |||||||||||||
Atlanta, GA | 100.0 | 114.2 | 122.3 | 124.7 | 131.6 | 132.6 | 32.6 | % | |||||||||||||
Charlotte, NC | 100.0 | 113.4 | 118.8 | 120.1 | 126.2 | 124.9 | 24.9 | % | |||||||||||||
Greater Chicago area, IL and IN | 100.0 | 111.0 | 115.1 | 114.0 | 119.7 | 120.9 | 20.9 | % | |||||||||||||
Houston, TX | 100.0 | 110.8 | 123.1 | 123.0 | 126.8 | 128.6 | 28.6 | % | |||||||||||||
Cincinnati, OH | 100.0 | 104.9 | 111.2 | 110.3 | 114.0 | 116.5 | 16.5 | % | |||||||||||||
Tampa, FL | 100.0 | 113.0 | 121.1 | 123.1 | 127.5 | 131.6 | 31.6 | % | |||||||||||||
Jacksonville, FL | 100.0 | 114.2 | 121.7 | 121.3 | 130.8 | 132.0 | 32.0 | % | |||||||||||||
Nashville, TN | 100.0 | 111.0 | 117.4 | 120.6 | 125.8 | 126.5 | 26.5 | % | |||||||||||||
Raleigh, NC | 100.0 | 106.7 | 111.6 | 114.1 | 116.9 | 120.8 | 20.8 | % | |||||||||||||
Phoenix, AZ | 100.0 | 118.0 | 123.3 | 125.9 | 129.4 | 133.9 | 33.9 | % | |||||||||||||
Columbus, OH | 100.0 | 108.9 | 114.5 | 117.2 | 120.8 | 123.1 | 23.1 | % | |||||||||||||
Salt Lake City, UT | 100.0 | 109.4 | 114.5 | 117.4 | 120.4 | 123.7 | 23.7 | % | |||||||||||||
Orlando, FL | 100.0 | 110.3 | 123.5 | 124.4 | 129.3 | 131.8 | 31.8 | % | |||||||||||||
Las Vegas, NV | 100.0 | 125.1 | 141.3 | 141.8 | 142.9 | 149.4 | 49.4 | % | |||||||||||||
San Antonio, TX | 100.0 | 101.1 | 108.0 | 113.0 | 117.3 | 116.0 | 16.0 | % | |||||||||||||
Denver, CO | 100.0 | 111.0 | 121.5 | 128.1 | 134.2 | 136.4 | 36.4 | % | |||||||||||||
Austin, TX | 100.0 | 110.1 | 122.2 | 127.3 | 133.7 | 134.3 | 34.3 | % | |||||||||||||
Greenville, SC | 100.0 | 104.1 | 110.8 | 114.9 | 116.7 | 115.0 | 15.0 | % | |||||||||||||
Average | 27.1 | % | |||||||||||||||||||
(1) | Updates to the Quarterly Purchase-Only Index are released by the FHFA on approximately the 20th day of the second month following quarter-end. Accordingly, information in the above table has been presented through September 30, 2015. For the illustrative purposes of this table, the HPA Index has been indexed as of December 31, 2012, and, as such, HPA Index values presented are relative measures calculated in relation to the baseline index value of 100.0 as of December 31, 2012. |
(2) | Our Dallas-Fort Worth, TX market is comprised of the Dallas-Plano-Irving and Fort Worth-Arlington Metropolitan Divisions. |
19
American Homes 4 Rent | ||
Defined Terms
Equity Capitalization Equity capitalization includes market value of all common shares and operating partnership units (based on NYSE AMH Class A common share closing price at end of respective period) and current liquidation value of preferred shares at end of respective period. FFO / Core FFO attributable to common share and unit holders FFO attributable to common share and unit holders is a non-GAAP financial measure that we calculate in accordance with the White Paper on FFO approved by the Board of Governors of the National Association of Real Estate Investment Trusts (“NAREIT”), which defines FFO as net income or loss calculated in accordance with GAAP, excluding extraordinary items, as defined by GAAP, gains and losses from sales of depreciable real estate, plus real estate-related depreciation and amortization (excluding amortization of deferred financing costs and depreciation of non-real estate assets), and after adjustment for unconsolidated partnerships and joint ventures. Core FFO attributable to common share and unit holders is a non-GAAP financial measure that we use as a supplemental measure of our performance. We compute this metric by adjusting FFO attributable to common share and unit holders for (1) acquisition fees and costs expensed incurred with recent business combinations and the acquisition of individual properties, (2) noncash share-based compensation expense and (3) noncash fair value adjustments associated with remeasuring our Series E convertible units liability and preferred shares derivative liability to fair value. We present FFO attributable to common share and unit holders, as well as on a per FFO share and unit basis, because we consider this metric to be an important measure of the performance of real estate companies, as do many analysts in evaluating the Company. We believe that FFO attributable to common share and unit holders is a helpful measure of a REIT’s performance since this metric excludes depreciation, which is included in computing net income and assumes the value of real estate diminishes predictably over time. We believe that real estate values fluctuate due to market conditions and in response to inflation. | We also believe that Core FFO attributable to common share and unit holders, as well as on a per FFO share and unit basis, are helpful to investors as supplemental measures of the operating performance of the Company as they allow investors to compare our operating performance to prior reporting periods without the effect of certain items that, by nature, are not comparable from period to period. FFO and Core FFO attributable to common share and unit holders are not a substitute for net cash flow provided by operating activities or net loss per share, as determined in accordance with GAAP, as a measure of our liquidity, operating performance or ability to pay dividends. These metrics also are not necessarily indicative of cash available to fund future cash needs. Because other REITs may not compute these measures in the same manner, they may not be comparable among REITs. Refer to FFO and Core FFO attributable to common share and unit holders for a reconciliation of these metrics to net loss attributable to common shareholders, determined in accordance with GAAP. FFO Shares FFO shares includes weighted-average common shares outstanding and assumes full conversion of all operating partnership units outstanding, at end of respective period. Leased Property A property is classified as leased upon the execution (i.e., signature) of a lease agreement. Market Capitalization Market capitalization includes equity capitalization, principal balances on asset-backed securitizations and secured note payable and borrowings outstanding under our credit facility at end of respective period. | ||
20
American Homes 4 Rent | ||
Defined Terms (continued)
Initially Leased Property NOI and Core NOI Initially Leased Property NOI is a supplemental non-GAAP financial measure that we define as rents and fees from single-family properties and tenant charge-backs, less property operating expenses for leased single-family properties. Initially Leased Property Core NOI is also a supplemental non-GAAP financial measure that we define as rents and fees from single-family properties, net of bad debt expense, less property operating expenses for initially leased single-family properties, excluding expenses reimbursed by tenant charge-backs and bad debt expense. Initially Leased Property NOI and Core NOI also exclude remeasurement of preferred shares, remeasurement of Series E convertible units, depreciation and amortization, acquisition fees and costs expensed, noncash share-based compensation expense, interest expense, general and administrative expense, property operating expenses for vacant single-family properties and other, and other revenues. We consider Initially Leased Property NOI to be a meaningful financial measure because we believe it is helpful to investors in understanding the operating performance of our leased single-family properties. Additionally, we believe Initially Leased Property Core NOI is helpful to our investors as it better reflects the operating margin performance of our leased single-family properties and excludes the impact of certain operating expenses that are reimbursed through tenant charge-backs. Initially Leased Property NOI and Core NOI should be considered only as supplements to net loss as measures of our performance. Initially Leased Property NOI and Core NOI should not be used as measures of our liquidity, nor are they indicative of funds available to fund our cash needs, including our ability to pay dividends or make distributions. Initially Leased Property NOI and Core NOI also should not be used as substitutes for net loss or net cash flows from operating activities (as computed in accordance with GAAP). Refer to Reconciliation of Non-GAAP Financial Measures for a reconciliation of Initially Leased Property NOI and Core NOI to net loss, determined in accordance with GAAP. | Occupied Property A property is classified as occupied upon commencement (i.e., start date) of a lease agreement, which can occur contemporaneously with or subsequent to execution (i.e., signature). Re-Lease Spread Re-Lease spreads are calculated as the percentage change in annual rent on properties re-leased during the period, compared to annual rent of the previous expired lease for each individual property. Renewal Rate Renewal rate is calculated as the number of renewed leases in a given period divided by total number of lease expirations during the same period. Renewal Spread Renewal spreads are calculated as the percentage change in rent on non-month-to-month lease renewals during the period. Retention Rate Retention rate is calculated as the number of renewed leases in a given period divided by the sum of total lease expirations and early terminations during the same period. Same-Home Property A property is classified as Same-Home if it has been stabilized longer than 90 days prior to the beginning of the earliest period presented under comparison. A property is removed from Same-Home if it has been classified as held for sale or has been taken out of service as a result of a casualty loss. Stabilized Property A property is classified as stabilized once it has been renovated and then initially leased or available for rent for a period greater than 90 days. | ||
21
American Homes 4 Rent | ||
Reconciliation of Non-GAAP Financial Measures
The following is a reconciliation of net loss, determined in accordance with GAAP, to Initially Leased Property NOI and Core NOI for the quarters and years ended December 31, 2015 and 2014 (amounts in thousands):
For the Three Months Ended Dec 31, | For the Years Ended Dec 31, | ||||||||||||||
2015 | 2014 | 2015 | 2014 | ||||||||||||
Net loss | $ | (11,347 | ) | $ | (9,992 | ) | $ | (47,948 | ) | $ | (33,092 | ) | |||
Remeasurement of preferred shares | 2,530 | 3,810 | 4,830 | 6,158 | |||||||||||
Remeasurement of Series E units | 1,356 | 1,007 | (2,100 | ) | 5,119 | ||||||||||
Depreciation and amortization | 62,163 | 47,205 | 242,848 | 165,516 | |||||||||||
Acquisition fees and costs expensed | 5,280 | 6,465 | 19,577 | 22,386 | |||||||||||
Noncash share-based compensation expense | 782 | 691 | 3,125 | 2,586 | |||||||||||
Interest expense | 27,874 | 9,379 | 89,413 | 19,881 | |||||||||||
General and administrative expense | 6,409 | 5,879 | 24,906 | 21,947 | |||||||||||
Property operating expenses for vacant single-family properties and other | 2,068 | 4,129 | 15,018 | 22,899 | |||||||||||
Other revenues | (1,885 | ) | (543 | ) | (6,665 | ) | (1,590 | ) | |||||||
Initially Leased Property NOI | 95,230 | 68,030 | 343,004 | 231,810 | |||||||||||
Tenant charge-backs | 16,331 | 5,621 | 56,546 | 14,931 | |||||||||||
Expenses reimbursed by tenant charge-backs | (16,331 | ) | (5,621 | ) | (56,546 | ) | (14,931 | ) | |||||||
Bad debt expense excluded from operating expenses | 972 | 1,262 | 5,977 | 5,691 | |||||||||||
Bad debt expense included in revenues | (972 | ) | (1,262 | ) | (5,977 | ) | (5,691 | ) | |||||||
Initially Leased Property Core NOI | $ | 95,230 | $ | 68,030 | $ | 343,004 | $ | 231,810 | |||||||
22
American Homes 4 Rent | ||
Corporate Information | Executive Management | ||
American Homes 4 Rent | David P. Singelyn | ||
30601 Agoura Road, Suite 200 | Chief Executive Officer | ||
Agoura Hills, CA 91301 | |||
Phone: (805) 413-5300 | Jack Corrigan | ||
Website: www.americanhomes4rent.com | Chief Operating Officer | ||
Investor Relations | Diana M. Laing | ||
Phone: (855) 794-AH4R (2447) | Chief Financial Officer | ||
Email: investors@ah4r.com | |||
Analyst Coverage (1)
Bank of America / Merrill Lynch | Jana Galan | jana.galan@baml.com | (646) 855-3081 |
FBR Capital Markets & Co | Patrick Kealey | pkealey@fbr.com | (703) 312-9656 |
GS Global Investment Research | Andrew Rosivach | andrew.rosivach@gs.com | (212) 902-2796 |
JP Morgan Securities | Anthony Paolone | anthony.paolone@jpmorgan.com | (212) 622-6682 |
Keefe, Bruyette & Woods, Inc. | Jade Rahmani | jrahmani@kbw.com | (212) 887-3882 |
Morgan Stanley | Greg Van Winkle | gregory.van.winkle@morganstanely.com | (212) 761-4968 |
Raymond James & Associates, Inc. | Buck Horne | buck.horne@raymondjames.com | (727) 567-2561 |
Wells Fargo Securities | Jeff Donnelly | jeff.donnelly@wellsfargo.com | (617) 603-4262 |
Zelman & Associates | Dan Oppenheim | dan@zelmanassociates.com | (212) 993-5830 |
(1) | The sell-side analysts listed above follow American Homes 4 Rent ("AH4R"). Any opinions, estimates or forecasts regarding AH4R's performance made by these analysts are theirs alone and do not represent the opinions, forecasts or predictions of AH4R or its management. AH4R does not by its reference above or distribution imply its endorsement of or concurrence with such information, conclusions or recommendations. The above list may not be complete and is subject to change as firms add or delete coverage. |