Attached files
| file | filename |
|---|---|
| EX-32 - EX-32 - TOTAL SYSTEM SERVICES INC | d240097dex32.htm |
| 10-K - FORM 10-K - TOTAL SYSTEM SERVICES INC | d240097d10k.htm |
| EX-21.1 - EX-21.1 - TOTAL SYSTEM SERVICES INC | d240097dex211.htm |
| EX-31.2 - EX-31.2 - TOTAL SYSTEM SERVICES INC | d240097dex312.htm |
| EX-23.1 - EX-23.1 - TOTAL SYSTEM SERVICES INC | d240097dex231.htm |
| EX-31.1 - EX-31.1 - TOTAL SYSTEM SERVICES INC | d240097dex311.htm |
Exhibit 13.1
Selected Financial Data
The following financial data should be read in conjunction with the Consolidated Financial Statements and Notes thereto and Financial Review sections of the Annual Report. The historical trends in Total System Services, Inc.’s (TSYS’ or the Company’s) results of operations and financial position over the last five years are presented below.
| Years Ended December 31, | ||||||||||||||||||||
| (in thousands, except per share data) | 2015 | 2014 | 2013 | 2012 | 2011 | |||||||||||||||
| Income Statement Data: |
||||||||||||||||||||
| Total revenues |
$ | 2,779,541 | 2,446,877 | 2,064,305 | 1,793,557 | 1,733,237 | ||||||||||||||
|
|
|
|
|
|
|
|
|
|
|
|||||||||||
| Operating income |
$ | 534,107 | 431,640 | 382,500 | 354,969 | 321,120 | ||||||||||||||
|
|
|
|
|
|
|
|
|
|
|
|||||||||||
| Income from continuing operations, net of tax |
$ | 367,630 | 280,751 | 254,542 | 248,928 | 218,446 | ||||||||||||||
| Income from discontinued operations, net of tax |
1,411 | 48,655 | 2,055 | 995 | 4,216 | |||||||||||||||
|
|
|
|
|
|
|
|
|
|
|
|||||||||||
| Net income |
369,041 | 329,406 | 256,597 | 249,923 | 222,662 | |||||||||||||||
| Net income attributable to noncontrolling interests |
(4,997 | ) | (6,534 | ) | (11,847 | ) | (5,643 | ) | (2,103 | ) | ||||||||||
|
|
|
|
|
|
|
|
|
|
|
|||||||||||
| Net income attributable to TSYS common shareholders |
$ | 364,044 | 322,872 | 244,750 | 244,280 | 220,559 | ||||||||||||||
|
|
|
|
|
|
|
|
|
|
|
|||||||||||
| Basic earnings per share (EPS)* attributable to TSYS common shareholders: |
||||||||||||||||||||
| Income from continuing operations |
$ | 1.97 | 1.48 | 1.31 | 1.31 | 1.14 | ||||||||||||||
| Gain (loss) from discontinued operations |
0.01 | 0.26 | (0.01 | ) | (0.02 | ) | 0.01 | |||||||||||||
|
|
|
|
|
|
|
|
|
|
|
|||||||||||
| Net income |
$ | 1.98 | 1.73 | 1.30 | 1.30 | 1.15 | ||||||||||||||
|
|
|
|
|
|
|
|
|
|
|
|||||||||||
| Diluted EPS* attributable to TSYS common shareholders: |
||||||||||||||||||||
| Income from continuing operations |
$ | 1.96 | 1.47 | 1.30 | 1.31 | 1.14 | ||||||||||||||
| Gain (loss) from discontinued operations |
0.01 | 0.25 | (0.01 | ) | (0.02 | ) | 0.01 | |||||||||||||
|
|
|
|
|
|
|
|
|
|
|
|||||||||||
| Net income |
$ | 1.97 | 1.72 | 1.29 | 1.29 | 1.15 | ||||||||||||||
|
|
|
|
|
|
|
|
|
|
|
|||||||||||
| Cash dividends declared per share |
$ | 0.40 | 0.40 | 0.40 | 0.40 | 0.31 | ||||||||||||||
|
|
|
|
|
|
|
|
|
|
|
|||||||||||
| * | Basic and diluted EPS amounts for continuing operations and net income may not total due to rounding. |
| As of December 31, | ||||||||||||||||||||
| (in thousands) | 2015 | 2014 | 2013 | 2012 | 2011 | |||||||||||||||
| Balance Sheet Data: |
||||||||||||||||||||
| Total assets |
$ | 3,908,300 | 3,733,581 | 3,686,568 | 2,023,838 | 1,858,392 | ||||||||||||||
| Obligations under long-term borrowings and capital leases, excluding current portion |
1,383,634 | 1,405,106 | 1,435,751 | 192,014 | 63,593 | |||||||||||||||
Financial Overview
TSYS’ revenues are derived from providing global payment processing services to financial and nonfinancial institutions, generally under long-term processing contracts. In addition, the Company derives revenues from providing processing services, acquiring solutions, related systems and integrated support services to merchant acquirers and merchants. The Company also derives revenues by providing general-purpose reloadable (GPR) prepaid debit cards and payroll cards and alternative financial services to underbanked and other consumers. The Company’s services are provided through the Company’s four operating segments: North America Services, International Services, Merchant Services and NetSpend.
Through the Company’s North America Services and International Services segments, TSYS processes information through its cardholder systems for financial institutions throughout the United States and
11
internationally. The Company’s North America Services segment provides these services to clients in the United States, Canada, Mexico and the Caribbean. The Company’s International Services segment provides services to clients in Europe, India, Middle East, Africa, Asia Pacific and Brazil. The Company’s Merchant Services segment provides merchant services to merchant acquirers and merchants based primarily in the United States. The Company’s NetSpend segment provides GPR prepaid debit and payroll cards and alternative financial service solutions to underbanked and other consumers in the United States.
The following table sets forth each segment’s revenues as a percentage of the Company’s total revenues:
| Years Ended December 31, | ||||||||||||
| 2015 | 2014 | 2013 | ||||||||||
| North America Services |
47 | % | 45 | % | 48 | % | ||||||
| NetSpend |
21 | 19 | 10 | |||||||||
| Merchant Services |
20 | 21 | 26 | |||||||||
| International Services |
12 | 15 | 16 | |||||||||
|
|
|
|
|
|
|
|||||||
| Total revenues |
100 | % | 100 | % | 100 | % | ||||||
|
|
|
|
|
|
|
|||||||
Due to the somewhat seasonal nature of the credit card industry, TSYS’ revenues and results of operations have generally increased in the fourth quarter of each year because of increased transaction and authorization volumes during the traditional holiday shopping season. Furthermore, growth or declines in card and merchant portfolios of existing clients, the conversion of cardholder and merchant accounts of new clients to the Company’s processing platforms, the receipt of fees for early contract termination and the loss of cardholder and merchant accounts either through purges or deconversions impact the results of operations from period to period.
Another factor which may affect TSYS’ revenues and results of operations from time to time is consolidation in the financial services or retail industries either through the sale, by a client, of its business, its card portfolio or a segment of its accounts to a party which processes cardholder or merchant accounts internally or uses another third-party processor. A change in the economic environment in the retail sector, or a change in the mix of payments between cash and cards could favorably or unfavorably impact TSYS’ financial position, results of operations and cash flows in the future.
TSYS’ reported financial results will also be impacted by significant shifts in currency conversion rates. TSYS does not view foreign currency as an economic event for the Company but as a financial reporting issue. Because changes in foreign currency exchange rates distort the operating growth rates, TSYS discloses the impact of foreign currency translation on its financial performance.
A significant amount of the Company’s revenues are derived from long-term contracts with large clients. Processing contracts with large clients, representing a significant portion of the Company’s total revenues, generally provide for discounts on certain services based on the size and activity of clients’ portfolios. Therefore, revenues and the related margins are influenced by the client mix relative to the size of client portfolios, as well as the number and activity of individual cardholder or merchant accounts processed for each client.
Regulation
Government regulation affects key areas of TSYS’ business, in the U.S. as well as internationally. TSYS, along with the rest of the financial services industry, continues to experience increased legislative and regulatory scrutiny, including the enactment of additional legislative and regulatory initiatives such as the Dodd-Frank Wall Street Reform and Consumer Protection Act (Financial Reform Act). This legislation, which provides for sweeping financial regulatory reform, may have a significant and negative impact on the Company and its clients, which could impact TSYS’ earnings through fee reductions, higher costs (both regulatory and implementation) and new restrictions on operations. The Financial Reform Act may also impact the competitive dynamics of the financial services industry in the U.S. by more adversely impacting large financial institutions, some of which are TSYS clients, and by adversely impacting the competitive position of U.S. financial institutions in comparison to foreign competitors in certain businesses.
12
The Financial Reform Act, which includes the Durbin Amendment to the Electronic Funds Transfer Act, mandates that the Board of Governors of the Federal Reserve System (Board) limit debit card interchange fees. Final rules were issued in June 2011. The final rules cap interchange fees for debit transactions at $0.21 plus five basis points of the transaction and require that the amount of any debit interchange transaction fee charged be reasonable and proportional to the costs incurred in connection with the transaction.
Although this legislative action by the U.S. Congress had been anticipated for some time, it remains impossible to predict the impact, if any, that the law and the regulations to be promulgated thereunder may have on the Company’s operations or its financial condition in the future. However, as TSYS’ business is predominately credit card related, the Durbin Amendment is not expected to have a significant negative impact upon TSYS’ business.
The Financial Reform Act also created a new Consumer Financial Protection Bureau (“CFPB”) with responsibility for regulating consumer financial products and services and enforcing most federal consumer protection laws in the area of financial services, including consumer credit and the prepaid card industry. For example, the CFPB has proposed regulations regarding the prepaid industry, which, if adopted as proposed, could impose significant additional disclosure requirements, overdraft requirements, and other requirements on the prepaid card industry, including the Company’s NetSpend business, effective in 2016 or 2017. Similarly, other future actions of the CFPB may make payment card or product transactions generally less attractive to card issuers, acquirers, consumers and merchants by further regulatory disclosures, payment card practices, fees, routing and other matters with respect to credit, debit and prepaid cards, and thus negatively impact the Company’s business.
Financial Review
This Financial Review provides a discussion of critical accounting policies and estimates, related party transactions and off-balance sheet arrangements. This Financial Review also discusses the results of operations, financial position, liquidity and capital resources of TSYS and outlines the factors that have affected its recent earnings, as well as those factors that may affect its future earnings. The accompanying Consolidated Financial Statements and related Notes are an integral part of this Financial Review and should be read in conjunction with it.
Critical Accounting Policies and Estimates
Risk factors that could affect the Company’s future operating results and cause actual results to vary materially from expectations are listed in the Company’s forward-looking statements. Negative developments in these or other risk factors could have a material adverse effect on the Company’s financial position, results of operations and cash flows.
TSYS’ financial position, results of operations and cash flows are impacted by the accounting policies the Company has adopted. Refer to Note 1 in the Consolidated Financial Statements for more information on the Company’s basis of presentation and a summary of significant accounting policies.
Management believes that the following accounting policies are the most critical to fully understand and evaluate the Company’s results. Within each critical policy, the Company makes estimates that require management’s subjective or complex judgments about the effects of matters that are inherently uncertain.
A summary of the Company’s critical accounting estimates applicable to the reportable operating segments follows:
Allowance for Doubtful Accounts and Billing Adjustments
The Company estimates the allowance for doubtful accounts. When estimating the allowance, the Company takes into consideration such factors as its knowledge of the financial position of specific clients, the industry and size of its clients, the overall composition of its accounts receivable aging, prior experience with specific customers of accounts receivable write-offs and prior history of allowances in proportion to the overall receivable balance. This analysis includes an ongoing and continuous communication with its largest clients and those clients with past due balances. A financial decline of any one of the Company’s large clients could have a material
13
adverse effect on collectability of receivables and thus the adequacy of the allowance for doubtful accounts. If the actual collectability of clients’ accounts is not consistent with the Company’s estimates, bad debt expense, which is recorded in selling, general and administrative expenses, may be materially different than was initially recorded. The Company’s experience and extensive data accumulated historically indicates that these estimates have proven reliable over time.
The Company estimates allowances for billing adjustments for potential billing discrepancies. When estimating the allowance for billing adjustments, the Company considers its overall history of billing adjustments, as well as its history with specific clients and known disputes. If the actual adjustments to clients’ billing are not consistent with the Company’s estimates, billing adjustments, which are recorded as a reduction of revenues in the Company’s Consolidated Statements of Income, may be materially different than was initially recorded. The Company’s experience and extensive data accumulated historically indicates that these estimates have proven reliable over time. The allowance for doubtful accounts and billing adjustments on the Company’s Consolidated Balance Sheet as of December 31, 2015 was $2.7 million.
Contract Acquisition Costs
In evaluating contract acquisition costs for recoverability, expected cash flows are estimated by management. The Company evaluates the carrying value of contract acquisition costs associated with each customer for impairment on the basis of whether these costs are fully recoverable from either contractual minimum fees (conversion costs) or from expected undiscounted net operating cash flows of the related contract (cash incentives paid). The determination of expected undiscounted net operating cash flows requires management to make estimates. If the actual cash flows are not consistent with the Company’s estimates, a material impairment charge may result and net income may be materially different than was initially recorded.
These costs may become impaired with the loss of a contract, the financial decline of a client, termination of conversion efforts after a contract is signed, or diminished prospects for current clients. Note 11 in the Consolidated Financial Statements contains a discussion of contract acquisition costs. The net carrying value of contract acquisition costs on the Company’s Consolidated Balance Sheet as of December 31, 2015 was $247.8 million.
Software Development Costs
In evaluating software development costs for recoverability, expected cash flows are estimated by management. The Company evaluates the unamortized capitalized costs of software development as compared to the net realizable value of the software product, which is determined by expected undiscounted net operating cash flows. The amount by which the unamortized software development costs exceed the net realizable value is written off in the period that such determination is made. If the actual cash flows are not consistent with the Company’s estimates, a material write-off may result and net income may be materially different than was initially recorded. Assumptions and estimates about future cash flows and remaining useful lives of software are complex and subjective. They can be affected by a variety of factors, including industry and economic trends, changes in the Company’s business strategy and changes in the internal forecasts. Note 9 in the Consolidated Financial Statements contains a discussion of internally developed software costs. The net carrying value of internally developed software on the Company’s Consolidated Balance Sheet as of December 31, 2015 was $116.4 million.
Acquisitions – Purchase Price Allocation
TSYS’ purchase price allocation methodology requires the Company to make assumptions and to apply judgment to estimate the fair value of acquired assets and liabilities. TSYS estimates the fair value of assets and liabilities based upon appraised values, the carrying value of the acquired assets and widely accepted valuation techniques, including discounted cash flows and market multiple analyses. Management determines the fair value of fixed assets and identifiable intangible assets such as developed technology or customer relationships, and any other significant assets or liabilities. TSYS adjusts the purchase price allocation, as necessary, up to one year after the acquisition closing date as TSYS obtains more information regarding asset valuations and liabilities assumed. Unanticipated events or circumstances may occur which could affect the accuracy of the Company’s fair value estimates, including assumptions regarding industry economic factors and business strategies, and result in an impairment or a new allocation of purchase price.
14
Given its history of acquisitions, TSYS may allocate part of the purchase price of future acquisitions to contingent consideration as required by generally accepted accounting principles (GAAP) for business combinations. The fair value calculation of contingent consideration will involve a number of assumptions that are subjective in nature and which may differ significantly from actual results. TSYS may experience volatility in its earnings to some degree in future reporting periods as a result of these fair value measurements.
Goodwill
In evaluating for impairment, discounted net cash flows for future periods are estimated by management. In accordance with the provisions of GAAP, goodwill is required to be tested for impairment at least annually. The combination of the income approach, utilizing the discounted cash flow (DCF) method, and the market approach, utilizing readily available market valuation multiples, is used to estimate the fair value. Under the DCF method, the fair value of the asset reflects the present value of the projected earnings that will be generated by each asset after taking into account the revenues and expenses associated with the asset, the relative risk that the cash flows will occur, the contribution of other assets, and an appropriate discount rate to reflect the value of invested capital. Cash flows are estimated for future periods based on historical data and projections provided by management. If the actual cash flows are not consistent with the Company’s estimates, a material impairment charge may result and net income may be materially different than was initially recorded. Note 7 in the Consolidated Financial Statements contains a discussion of goodwill. The net carrying value of goodwill on the Company’s Consolidated Balance Sheet as of December 31, 2015 was $1.5 billion.
Long-lived Assets and Intangibles
In evaluating long-lived assets and intangibles for recoverability, expected undiscounted net operating cash flows are estimated by management. The Company reviews long-lived assets, such as property and equipment and intangibles subject to amortization, including contract acquisition costs and certain computer software, for impairment whenever events or changes in circumstances indicate that the carrying amount of an asset may not be recoverable. Recoverability of assets to be held and used is measured by a comparison of the carrying amount of an asset to estimated undiscounted future cash flows expected to be generated by the asset. If the actual cash flows are not consistent with the Company’s estimates, a material impairment charge may result and net income may be materially different than was initially recorded. The Company did not recognize any impairment charges during the years ended December 31, 2015, 2014 and 2013.
Revenue Recognition
The Company recognizes revenues in accordance with the provisions of GAAP, which sets forth guidance as to when revenue is realized or realizable and earned when all of the following criteria are met: (1) persuasive evidence of an arrangement exists; (2) delivery has occurred or services have been performed; (3) the seller’s price to the buyer is fixed or determinable; and (4) collectability is reasonably assured.
The Company evaluates its contractual arrangements that provide services to clients through a bundled sales arrangement in accordance with the provisions of GAAP to address the determination of whether an arrangement involving more than one deliverable contains more than one unit of accounting and how the arrangement consideration should be measured and allocated to the separate units of accounting.
A deliverable in multiple element arrangements indicates any performance obligation on the part of the seller and includes any combination of obligations to perform different services, grant licenses or other rights. Revenue is allocated to the separate units of accounting in a multiple element arrangement based on relative fair values, provided the delivered element has standalone value to the customer and delivery of any undelivered items is probable and substantially within the Company’s control. Evidence of fair value must be objective and reliable. An item has value to the customer on a standalone basis if it is sold separately by any vendor or the customer could resell the deliverable on a standalone basis.
As TSYS’ business and service offerings change in the future, the determination of the number of deliverables in an arrangement and related units of accounting and future pricing practices may result in changes in the estimates of vendor-specific objective evidence of selling price (VSOE) and estimates of the standalone selling price (ESP), which may change the ratio of fees allocated to each service or unit of accounting in a given
15
customer arrangement. There were no material changes or impact to revenue in revenue recognition in the year ended December 31, 2015 due to any changes in the determination of the number of deliverables in an arrangement, units of accounting, or estimates of VSOE or ESP for existing contractual arrangements.
Cardholders’ Reserve
The Company is exposed to losses due to cardholder fraud, payment defaults and other forms of cardholder activity as well as losses due to non-performance of third parties who receive cardholder funds for transmittal to the Issuing Banks (banks that issue MasterCard International or Visa USA, Inc. branded cards to customers). The Company establishes a reserve for the losses it estimates will arise from processing customer transactions, debit card overdrafts, chargebacks for unauthorized card use and merchant-related chargebacks due to non-delivery of goods or services. These reserves are established based upon historical loss and recovery rates and cardholder activity for which specific losses can be identified. The cardholders’ reserve was $9.4 million as of December 31, 2015. The provision for cardholder losses is included in cost of services in the Consolidated Statements of Income. The Company regularly updates its estimate as new facts become known and events occur that may impact the settlement or recovery of losses.
Provision for Merchant Losses
The Company has potential liability for losses resulting from disputes between a cardholder and a merchant that arise as a result of, among other things, the cardholder’s dissatisfaction with merchandise quality or merchant services. Such disputes may not be resolved in the merchant’s favor. In these cases, the transaction is “charged back” to the merchant, which means the purchase price is refunded to the customer by the card-issuing bank and charged to the merchant. If the merchant is unable to fund the refund, TSYS must do so. TSYS also bears the risk of reject losses arising from the fact that TSYS collects fees from its merchants on the first day after the monthly billing period. If the merchant has gone out of business during such period, TSYS may be unable to collect such fees. TSYS maintains cash deposits or requires the pledge of a letter of credit from certain merchants, generally those with higher average transaction size where the card is not present when the charge is made or the product or service is delivered after the charge is made, in order to offset potential contingent liabilities such as chargebacks and reject losses that would arise if the merchant went out of business. Most chargeback and reject losses are charged to cost of services as they are incurred. However, the Company also maintains a provision against losses, including major fraud losses, which are both less predictable and involve larger amounts. The loss provision is established using historical loss rates, applied to recent bankcard processing volume. As of December 31, 2015, the Company had a merchant loss provision in the amount of $1.3 million.
Transaction Processing Provisions
The Company records estimates to provide for contract contingencies (performance penalties) and processing errors. A significant number of the Company’s contracts with large clients contain service level agreements which can result in TSYS incurring performance penalties if contractually required service levels are not met. When estimating these accruals, the Company takes into consideration such factors as the prior history of performance penalties and processing errors incurred, actual contractual penalties inherent in the Company’s contracts, progress towards milestones, and known processing errors not covered by insurance. If the actual performance penalties incurred are not consistent with the Company’s estimates, performance penalties and processing errors, which are recorded in cost of services, may be materially different than were initially recorded. The Company’s experience and extensive data accumulated historically indicate that these estimates have proven reliable over time. As of December 31, 2015, the Company had a transaction processing provision in the amount of $6.5 million.
Income Taxes
In calculating its effective tax rate, the Company makes decisions regarding certain tax positions, including the timing and amount of deductions and allocations of income among various tax jurisdictions. The Company has various tax filing positions, including the timing and amount of deductions and credits, the establishment of reserves for audit matters and the allocation of income among various tax jurisdictions.
The Company makes estimates as to the amount of deferred tax assets and liabilities and records valuation allowances to reduce its deferred tax assets to reflect the amount that is more likely than not to be realized. The
16
Company considers projected future taxable income and ongoing tax planning strategies in assessing the need for the valuation allowance. Actual results may differ from the Company’s estimates. If the Company realizes a deferred tax asset or the Company was unable to realize a net deferred tax asset, an adjustment to the deferred tax asset would increase or decrease earnings, respectively, in the period the difference is recognized.
Related Party Transactions
In December 2014, TSYS’ majority-owned subsidiary, TSYS Managed Services EMEA Limited (EMEA), obtained a £900,000, or approximately $1.4 million, term loan bearing interest at a rate of LIBOR plus two percentage points. During September 2015, TSYS increased the loan by £1.3 million, or approximately $1.9 million. The loan matures in December 2017, and has monthly interest payments. The lender is Merchants Limited, who has a noncontrolling interest in EMEA.
The Company provides miscellaneous services to Merchants Limited and to the Company’s equity investments, Total System Services de México, S.A. de C.V. (TSYS de México) and China UnionPay Data Co., Ltd. (CUP Data).
The related party services and arrangements are performed under contracts that are similar to its contracts with unrelated third party customers. The Company believes the terms and conditions of transactions between the Company and these related parties are comparable to those which could have been obtained in transactions with unaffiliated parties. The Company’s margins with respect to related party transactions are comparable to margins recognized in transactions with unrelated third parties. The amounts related to these transactions are immaterial. No significant changes have been made to the method of establishing terms with the affiliated companies during the periods presented.
Refer to Note 4 in the Consolidated Financial Statements for more information on transactions with affiliated companies.
Off-Balance Sheet Arrangements
OPERATING LEASES: As a method of funding its operations, TSYS employs noncancelable operating leases for computer equipment, software and facilities. These leases allow the Company to use the latest technology while avoiding the risk of ownership. Neither the assets nor obligations related to these leases are included on the balance sheet. Refer to Notes 1 and 16 in the Consolidated Financial Statements for further information on operating lease commitments.
CONTRACTUAL OBLIGATIONS: The total liability for uncertain tax positions as of December 31, 2015 is $13.1 million. Refer to Note 15 in the Consolidated Financial Statements for more information on income taxes. The Company is not able to reasonably estimate the amount by which the liability will increase or decrease over time; however, at this time, the Company does not expect any significant changes related to these obligations within the next year.
Recent Accounting Pronouncements
In November 2015, the Financial Accounting Standards Board (FASB) issued Accounting Standards Update (ASU) 2015-17 “Income Taxes (Topic 740), Balance Sheet Classification of Deferred Taxes,” which requires the classification of all deferred tax assets and liabilities as noncurrent on the balance sheet instead of separating deferred taxes into current and noncurrent amounts. Also, companies will no longer allocate valuation allowances between current and noncurrent deferred tax assets because those allowances also will be classified as noncurrent. The guidance is effective for public business entities for annual and interim periods in fiscal years beginning after December 15, 2016. Early adoption is permitted. Companies can adopt the guidance either prospectively or retrospectively. The Company does not expect the adoption of this ASU to have a material impact on the Company’s financial position, results of operations or cash flows.
In September 2015, the FASB issued ASU 2015-16 “Business Combinations (Topic 805): Simplifying the Accounting for Measurement-Period Adjustments,” which eliminates the requirement for an acquirer to retrospectively adjust the financial statements for measurement-period adjustments that occur in periods after a business combination is consummated. The guidance is effective for public business entities for annual and
17
interim periods in fiscal years beginning after December 15, 2015. Early adoption is permitted. The Company does not expect the adoption of this ASU to have a material impact on the Company’s financial position, results of operations or cash flows.
In June 2015, the FASB issued ASU 2015-15 “Presentation and Subsequent Measurement of Debt Issuance Costs Associated with Line-of-Credit Arrangements – Amendments to SEC Paragraphs Pursuant to Staff Announcement at June 18, 2015 EITF Meeting.” This ASU allows entities to defer and present debt issuance costs as an asset and subsequently amortize deferred debt issuance costs ratably over the term of a line-of-credit arrangement. The guidance is effective for annual periods and interim periods within those annual periods beginning after December 15, 2015. Early adoption is permitted. The guidance will be applied retrospectively. The Company does not expect the adoption of this guidance to have a material impact on the Company’s financial position, results of operations or cash flows.
In April 2015, the FASB issued ASU 2015-05 “Intangibles – Goodwill and Other – Internal-Use Software (Subtopic 350-40): Customer’s Accounting for Fees Paid in a Cloud Computing Arrangement.” The amendments in this Update provide guidance to customers about whether a cloud computing arrangement includes a software license or a service agreement. The Company does not expect the adoption of this ASU to have a material impact on the Company’s financial position, results of operations or cash flows.
In April 2015, the FASB issued ASU 2015-03 “Interest – Imputation of Interest (Subtopic 835-30), Simplifying the Presentation of Debt Issuance Cost.” The amendments in this update will require entities to present debt issuance costs in the balance sheet as a direct deduction from the carrying amount of the corresponding debt liability, consistent with debt discounts. The guidance is effective for annual periods and interim periods within those annual periods beginning after December 15, 2015. Early adoption is permitted. The guidance will be applied retrospectively. The Company does not expect the adoption of this guidance to have a material impact on the Company’s financial position, results of operations or cash flows.
In January 2015, the FASB issued ASU 2015-01 “Income Statement – Extraordinary and Unusual Items (Subtopic 225-20): Simplifying Income Statement Presentation by Eliminating the Concept of Extraordinary Items.” ASU 2015-01 eliminates from GAAP the concept of extraordinary items. For all entities, the ASU is effective for fiscal years, and interim periods within those years, beginning after December 15, 2015. Early adoption is permitted provided the guidance is applied from the beginning of the fiscal year of adoption. The Company does not expect the adoption of this ASU to have a material impact on the financial position, results of operations or cash flows of the Company.
In May 2014, the FASB issued ASU 2014-09 “Revenue from Contracts with Customers,” which requires an entity to recognize the amount of revenue to which it expects to be entitled for the transfer of promised goods or services to customers. The ASU will replace most existing revenue recognition guidance in U.S. GAAP when it becomes effective. The new standard is effective for the Company on January 1, 2018. Early application is not permitted. The standard permits the use of either the retrospective or cumulative effect transition method. The Company is evaluating the effect that ASU 2014-09 will have on its consolidated financial statements and related disclosures. The Company has not yet selected a transition method nor has it determined the effect on its ongoing financial reporting.
Results of Operations
Revenues
The Company generates revenues by providing transaction processing and other payment-related services. The Company’s pricing for transactions and services is complex. Each category of revenue has numerous fee components depending on the types of transactions processed or services provided. TSYS reviews its pricing and implements pricing changes on an ongoing basis. In addition, standard pricing varies among its regional businesses, and such pricing can be customized further for customers through tiered pricing of various thresholds for volume activity. TSYS’ revenues are based upon transactional information accumulated by its systems or reported by its customers. The Company’s revenues are impacted by currency translation of foreign operations, as well as doing business in the current economic environment.
18
The Company has included reimbursements received for out-of-pocket expenses as revenues and expenses. The largest reimbursable expense items for which TSYS is reimbursed by clients are postage and network association fees. The Company’s reimbursable items are impacted with changes in postal rates and changes in the volumes of mailing activities by its clients. Reimbursable items for the year ended December 31, 2015, were $280.2 million, an increase of $26.3 million, or 10.4%, compared to $253.9 million for the same period last year. Reimbursable items for the year ended December 31, 2014 increased $13.3 million, or 5.5%, compared to $240.6 million for the same period in 2013.
TSYS’ revenues are generated from charges based on the number of accounts on file (AOF), transactions and authorizations processed, statements mailed, cards embossed and mailed, and other processing services for cardholder AOF. Cardholder AOF includes active and inactive consumer credit, retail, prepaid, stored value, government services and commercial card accounts.
TSYS’ revenues in its North America Services and International Services segments are influenced by several factors, including volumes related to AOF and transactions. TSYS estimates that approximately 48.4% of these segments’ revenues is AOF and transaction volume driven. The remaining 51.6% of payment processing revenues are not AOF and transaction volume driven, and are derived from production and optional services TSYS considers to be value added products and services, custom programming and licensing arrangements.
Whether or not an account on file is active can impact TSYS’ revenues differently. Active accounts are accounts that have had monetary activity either during the current month or in the past 90 days based on contractual definition. Inactive accounts are accounts that have not had a monetary transaction (such as a purchase or payment) in the past 90 days. The more active an account is, the more revenue is generated for TSYS (items such as transactions and authorizations processed and statements billed).
Occasionally, a client will purge inactive accounts from its portfolio. An inactive account typically will only generate an AOF charge. A processing client will periodically review its cardholder portfolio based upon activity and usage. Each client, based upon criteria individually set by the client, will flag an account to be “purged” from TSYS’ system and deactivated.
A deconversion involves a client migrating all of its accounts to an in-house solution or another processor. Account deconversions include active and inactive accounts and can impact the Company’s revenues significantly more than an account purge.
A sale of a portfolio typically involves a client selling a portion of its accounts to another party. A sale of a portfolio and a deconversion impact the Company’s financial statements in a similar fashion, although a sale usually has a smaller financial impact due to the number of accounts typically involved.
TSYS’ revenues in its Merchant Services segment are influenced by several factors, including volumes related to transactions and dollar sales volume, which are approximately 92.3% of this segment’s revenues. The remaining 7.7% of Merchant Services’ revenues are derived from value added services, monthly statement fees, compliance fees and miscellaneous services.
TSYS’ revenues in its NetSpend segment primarily consist of a portion of the service fees and interchange revenues received by NetSpend’s prepaid card Issuing Banks in connection with the programs managed by NetSpend. For the year ended December 31, 2015, 69.6% of revenues was derived from fees charged to cardholders and 30.4% of revenues was derived from interchange and other revenues. Service fee revenues are driven by the number of active cards, and in particular by the number of cards with direct deposit. Cardholders with direct deposit generally initiate more transactions and generate more revenues than those that do not take advantage of this feature. Interchange revenues are driven by gross dollar volume. Substantially all of the NetSpend segment’s revenues are volume driven as they are driven by the active card and gross dollar volume indicators.
19
A summary of the consolidated financial highlights for the years ended December 31, 2015, 2014, and 2013 is provided below:
| Years Ended December 31, | Percent Change | |||||||||||||||||||
| (in thousands, except per share data) | 2015 | 2014 | 2013 | 2015 vs. 2014 | 2014 vs. 2013 | |||||||||||||||
| Total revenues |
$ | 2,779,541 | 2,446,877 | 2,064,305 | 13.6 | % | 18.5 | % | ||||||||||||
| Operating income |
534,107 | 431,640 | 382,500 | 23.7 | 12.8 | |||||||||||||||
| Net income attributable to TSYS common shareholders |
364,044 | 322,872 | 244,750 | 12.8 | 31.9 | |||||||||||||||
| Basic EPS attributable to TSYS common shareholders1 |
1.98 | 1.73 | 1.30 | 14.1 | 33.5 | |||||||||||||||
| Diluted EPS attributable to TSYS common shareholders1 |
1.97 | 1.72 | 1.29 | 14.2 | 33.6 | |||||||||||||||
| Adjusted earnings before interest, taxes, depreciation and amortization (Adjusted EBITDA)2 |
833,920 | 712,267 | 624,093 | 17.1 | 14.1 | |||||||||||||||
| Adjusted EPS3 from continuing operations |
2.46 | 1.96 | 1.73 | 25.5 | 13.2 | |||||||||||||||
| Cash flows provided by operating activities |
600,194 | 560,201 | 452,398 | 7.1 | 23.8 | |||||||||||||||
| 1 | Basic and diluted EPS is computed based on the two-class method in accordance with the guidance under GAAP. Refer to Note 26 in the Consolidated Financial Statements for more information on EPS. |
| 2 | Adjusted EBITDA is net income excluding equity in income of equity investments, nonoperating income/(expense), income taxes, depreciation, amortization and stock-based compensation expenses and other non-recurring items. |
| 3 | Adjusted EPS is adjusted earnings divided by weighted average shares outstanding used for basic EPS calculations. Adjusted earnings is net income excluding theafter-tax impact of stock-based compensation expenses, amortization of acquisition intangibles and other nonrecurring items. |
Total revenues increased $332.7 million for the year ended December 31, 2015, compared to the year ended December 31, 2014, which increased $382.6 million compared to the year ended December 31, 2013. The increases in revenues for 2015 and 2014 include a decrease of $31.5 million and an increase of $14.9 million, respectively, related to the effects of currency translation of the Company’s foreign-based subsidiaries and branches.
Excluding reimbursable items, revenues increased 14.0%, or $306.4 million, for the year ended December 31, 2015, compared to the year ended December 31, 2014, which increased 20.2%, or $369.3 million, compared to the year ended December 31, 2013. The increase in revenues excluding reimbursable items for the year ended December 31, 2015, as compared to the same period in 2014, is the result of increases in new business and organic growth, partially offset by decreases associated with currency translation. The increase in revenues excluding reimbursable items for the year ended December 31, 2014 as compared to the same period in 2013 is primarily the result of the acquisition of NetSpend in July 2013. NetSpend’s revenues excluding reimbursable items were $580.4 million, $482.7 million and $207.9 million, respectively, for the years ended December 31, 2015, 2014 and 2013.
20
Below is a summary of AOF for the Company’s North America Services and International Services segments combined:
| As of December 31, | Percent Change | |||||||||||||||||||
| (in millions) | 2015 | 2014 | 2013 | 2015 vs. 2014 | 2014 vs. 2013 | |||||||||||||||
| Consumer Credit |
382.1 | 270.0 | 228.9 | 41.5 | % | 18.0 | % | |||||||||||||
| Retail |
26.1 | 28.4 | 27.8 | (7.9 | ) | 2.2 | ||||||||||||||
|
|
|
|
|
|
|
|||||||||||||||
| Total Consumer |
408.2 | 298.4 | 256.7 | 36.8 | 16.3 | |||||||||||||||
| Commercial |
45.4 | 41.6 | 39.9 | 9.2 | 4.2 | |||||||||||||||
| Other |
26.6 | 22.4 | 18.9 | 18.8 | 18.7 | |||||||||||||||
|
|
|
|
|
|
|
|||||||||||||||
| Subtotal1 |
480.2 | 362.4 | 315.5 | 32.5 | 14.9 | |||||||||||||||
| Prepaid/Stored Value2 |
97.2 | 127.3 | 118.0 | (23.7 | ) | 7.9 | ||||||||||||||
| Government Services3 |
79.3 | 67.4 | 62.2 | 17.8 | 8.2 | |||||||||||||||
| Commercial Card Single Use4 |
75.8 | 59.6 | 45.3 | 27.1 | 31.5 | |||||||||||||||
|
|
|
|
|
|
|
|||||||||||||||
| Total AOF |
732.5 | 616.7 | 541.0 | 18.8 | 14.0 | |||||||||||||||
|
|
|
|
|
|
|
|||||||||||||||
| 1 | Traditional accounts include consumer, retail, commercial, debit and other accounts. These accounts are grouped together due to the tendency to have more transactional activity than prepaid, government services and single use accounts. |
| 2 | Prepaid does not include NetSpend accounts.These accounts tend to have less transactional activity than the traditional accounts. Prepaid and stored value cards are issued by firms through retail establishments to be purchased by consumers to be used at a later date. These accounts tend to be the least active of all accounts on file. |
| 3 | Government services accounts are disbursements of student loan accounts issued by the Department of Education, which have minimal activity. |
| 4 | Commercial card single use accounts are one-time use accounts issued by firms to book lodging and other travel related expenses. |
Major Customer
The Company works to maintain a large and diverse customer base across various industries. Although the Company does not have a major customer on a consolidated basis, a significant amount of the Company’s revenues are derived from long-term contracts with large clients. TSYS derives revenues from providing various processing and other services to these clients, including processing of consumer and commercial accounts, as well as revenues for reimbursable items. The loss of one of the Company’s large clients could have a material adverse effect on the Company’s financial position, results of operations and cash flows.
Refer to Note 22 in the Consolidated Financial Statements for more information on major customers.
Operating Segments
TSYS’ services are provided through four operating segments: North America Services, International Services, Merchant Services and NetSpend.
Issuing Services – North America Services and International Services
The Company’s North America Services and International Services segments have many long-term customer contracts with card issuers providing account processing and output services for printing and embossing items. These contracts generally require advance notice prior to the end of the contract if a client chooses not to renew. Additionally, some contracts may allow for early termination upon the occurrence of certain events such as a change in control. The termination fees paid upon the occurrence of such events are designed primarily to cover balance sheet exposure related to items such as capitalized conversion costs or client incentives associated with the contract and, in some cases, may cover a portion of lost future revenue and profit. Although these contracts may be terminated upon certain occurrences, the contracts provide the segment with a steady revenue stream since a vast majority of the contracts are honored through the contracted expiration date.
These services are provided throughout the period of each account’s use, starting from a card-issuing client processing an application for a card. Services may include processing the card application, initiating service for the cardholder, processing each card transaction for the issuing retailer or financial institution and accumulating
21
the account’s transactions. Fraud management services monitor the unauthorized use of accounts which have been reported to be lost, stolen, or which exceed credit limits. Fraud detection systems help identify fraudulent transactions by monitoring each account holder’s purchasing patterns and flagging unusual purchases. Other services provided include customized communications to cardholders, information verification associated with granting credit, debt collection and customer service.
TSYS’ revenues in its North America Services and International Services segments are derived from electronic payment processing. There are certain basic core services directly tied to accounts on file and transactions. These are provided to all of TSYS’ processing clients. The core services begin with an account on file.
The core services include housing an account on TSYS’ system (AOF), authorizing transactions (authorizations), accumulating monthly transactional activity (transactions) and providing a monthly statement (statements billed). From these core services, TSYS’ clients also have the option to use fraud and portfolio management services. Collectively, these services are considered volume-based revenues.
Non-volume related revenues include processing fees which are not directly associated with AOF and transactional activity, such as value added products and services, custom programming and certain other services, which are only offered to TSYS’ processing clients.
Value added products and services, which includes services such as data analytics and application processing, are primarily non-volume related and are only offered to TSYS’ processing clients (i.e., indirectly derived from accounts on file). These ancillary products and services, along with offerings such as card production, statement production, managed services, customized reporting and custom programming provided to clients at an hourly rate, are considered non-volume based products and services.
Additionally, certain clients license the Company’s processing systems and process in-house. Since the accounts are processed outside of TSYS for licensing arrangements, the AOF and other volumes are not available to TSYS. Thus, volumes reported by TSYS do not include volumes associated with licensing.
A summary of each segment’s results follows:
North America Services
The North America Services segment provides issuer account solutions for financial institutions and other organizations primarily based in North America. Growth in revenues and operating profit in this segment is derived from retaining and growing the core business and improving the overall cost structure. Growing the core business comes primarily from an increase in account usage, growth from existing clients and sales to new clients and the related account conversions.
In July 2012, TSYS executed a master services agreement, with a minimum six year term, with Bank of America to provide processing services for its consumer credit card portfolios in the U.S. In addition, TSYS continues to process Bank of America’s commercial credit card portfolios in the U.S. and internationally. In May 2015, the contract term for processing both the consumer and commercial credit card portfolios was extended for an additional 18 months.
The master services agreement with Bank of America provides for a tiered-pricing arrangement for both the consumer card portfolio and the existing commercial card portfolios.
This segment has two major customers.
22
Below is a summary of the North America Services segment:
| Years Ended December 31, | Percent Change | |||||||||||||||||||
| (in thousands) | 2015 | 2014 | 2013 | 2015 vs. 2014 | 2014 vs. 2013 | |||||||||||||||
| Volume-based revenues |
$ | 595,314 | 480,386 | 433,723 | 23.9 | % | 10.8 | % | ||||||||||||
|
|
|
|
|
|
|
|||||||||||||||
| Non-volume related revenues: |
||||||||||||||||||||
| Processing fees |
235,313 | 216,685 | 195,394 | 8.6 | 10.9 | |||||||||||||||
| Value-added, custom programming, licensing and other |
151,671 | 115,741 | 110,448 | 31.0 | 4.8 | |||||||||||||||
| Output and managed services |
164,956 | 141,270 | 121,080 | 16.8 | 16.7 | |||||||||||||||
|
|
|
|
|
|
|
|||||||||||||||
| Total non-volume related revenues |
551,940 | 473,696 | 426,922 | 16.5 | 11.0 | |||||||||||||||
|
|
|
|
|
|
|
|||||||||||||||
| Total revenues before reimbursable items |
1,147,254 | 954,082 | 860,645 | 20.2 | 10.9 | |||||||||||||||
| Reimbursable items |
187,004 | 163,682 | 139,428 | 14.2 | 17.4 | |||||||||||||||
|
|
|
|
|
|
|
|||||||||||||||
| Total revenues |
$ | 1,334,258 | 1,117,764 | 1,000,073 | 19.4 | 11.8 | ||||||||||||||
|
|
|
|
|
|
|
|||||||||||||||
| Adjusted segment operating income1 |
$ | 429,064 | 351,512 | 321,619 | 22.1 | 9.3 | ||||||||||||||
|
|
|
|
|
|
|
|||||||||||||||
| Adjusted segment operating margin2 |
37.4 | % | 36.8 | % | 37.4 | % | ||||||||||||||
| Key indicators (in millions): |
||||||||||||||||||||
| AOF |
654.1 | 550.0 | 481.9 | 18.9 | 14.1 | |||||||||||||||
| Transactions |
15,774.5 | 10,838.0 | 9,132.8 | 45.5 | 18.7 | |||||||||||||||
| 1 | Adjusted segment operating income excludes acquisition intangible amortization and expenses associated with Corporate Administration and Other. |
| 2 | Adjusted segment operating margin equals adjusted segment operating income divided by revenues before reimbursable items. |
Total segment revenues increased $216.5 million for 2015, as compared to 2014. The increase is attributable to an increase in new business, internal growth and reimbursable items, partially offset by decreases related to client deconversions and price reductions. Total segment revenues increased $117.7 million for 2014, as compared to 2013. The increase is attributable to an increase in new business, internal growth and reimbursable items, partially offset by decreases related to client deconversions, price reductions and other adjustments.
The increases in adjusted segment operating income for 2015 and 2014 are driven primarily by increases in revenues partially offset by increases in total operating expenses.
For the year ended December 31, 2015, approximately 51.9% of revenues before reimbursable items of TSYS’ North America Services segment are driven by the volume of accounts on file and transactions processed and approximately 48.1% were derived from non-volume based revenues, such as processing fees, value-added products and services, custom programming and licensing arrangements.
International Services
The International Services segment provides issuer card solutions to financial institutions and other organizations primarily based outside the North American region. Growth in revenues and operating profit in this segment is derived from retaining and growing the core business and improving the overall cost structure. Growing the core business comes primarily from an increase in account usage, growth from existing clients and sales to new clients and the related account conversions. This segment’s financial results are impacted by foreign currency. Movements in foreign currency exchange rates as compared to the U.S. dollar can result in foreign denominated financial statements being translated into more or fewer U.S. dollars, which impacts the comparison to prior periods when the U.S. dollar was stronger or weaker.
This segment has two major customers.
23
Below is a summary of the International Services segment:
| Years Ended December 31, | Percent Change | |||||||||||||||||||
| (in thousands) | 2015 | 2014 | 2013 | 2015 vs. 2014 | 2014 vs. 2013 | |||||||||||||||
| Volume-based revenues |
$ | 119,974 | 131,322 | 126,714 | (8.6 | )% | 3.6 | % | ||||||||||||
|
|
|
|
|
|
|
|||||||||||||||
| Non-volume related revenues: |
||||||||||||||||||||
| Processing fees |
62,998 | 69,346 | 61,519 | (9.2 | ) | 12.7 | ||||||||||||||
| Value-added, custom programming, licensing and other |
86,318 | 95,040 | 92,807 | (9.2 | ) | 2.4 | ||||||||||||||
| Output and managed services |
61,869 | 46,077 | 40,444 | 34.3 | 13.9 | |||||||||||||||
|
|
|
|
|
|
|
|||||||||||||||
| Total non-volume related revenues |
211,185 | 210,463 | 194,770 | 0.3 | 8.1 | |||||||||||||||
|
|
|
|
|
|
|
|||||||||||||||
| Total revenues before reimbursable items |
331,159 | 341,785 | 321,484 | (3.1 | ) | 6.3 | ||||||||||||||
| Reimbursable items |
23,566 | 21,574 | 20,065 | 9.2 | 7.5 | |||||||||||||||
|
|
|
|
|
|
|
|||||||||||||||
| Total revenues |
$ | 354,725 | 363,359 | 341,549 | (2.4 | ) | 6.4 | |||||||||||||
|
|
|
|
|
|
|
|||||||||||||||
| Adjusted segment operating income1 |
$ | 60,087 | 55,123 | 42,068 | 9.0 | 31.0 | ||||||||||||||
|
|
|
|
|
|
|
|||||||||||||||
| Adjusted segment operating margin2 |
18.1 | % | 16.1 | % | 13.1 | % | ||||||||||||||
| Key indicators (in millions): |
||||||||||||||||||||
| AOF |
78.5 | 66.6 | 59.1 | 17.8 | 12.7 | |||||||||||||||
| Transactions |
2,473.6 | 2,268.4 | 2,007.4 | 9.0 | 13.0 | |||||||||||||||
| 1 | Adjusted segment operating income excludes acquisition intangible amortization and expenses associated with Corporate Administration and Other. |
| 2 | Adjusted segment operating margin equals adjusted segment operating income divided by revenues before reimbursable items. |
The decrease in total segment revenues for 2015, as compared to 2014, is driven primarily by the negative impact of $31.0 million of currency translation. The increase in total segment revenues for 2014, as compared to 2013, was driven primarily by the positive impact of $14.8 million in currency translation, as well as organic growth. Excluding the impact of currency translation, segment revenues increased $22.3 million, or 6.1% in 2015, as compared to 2014 and $7.0 million, or 2.1% in 2014, as compared to 2013.
The increase in adjusted segment operating income for 2015, as compared to 2014, is driven primarily by an increase in non-volume related revenues, excluding the impact of currency translation, due to increased business. The increase in adjusted segment operating income for 2014, as compared to 2013, is driven primarily from an increase in revenues partially offset by an increase in employee related expenses.
For the year ended December 31, 2015, approximately 36.2% of revenues before reimbursable items of TSYS’ International Services segment are driven by the volume of accounts on file and transactions processed and approximately 63.8% are derived from non-volume based revenues, such as processing fees, value-added products and services, custom programming and licensing arrangements.
Merchant Services
The Merchant Services segment provides merchant services and related services to clients based primarily in the United States. The Merchant Services segment’s revenues are derived from providing processing services, acquiring solutions, related systems and integrated support services to merchant acquirers and merchants. Revenues from merchant services include processing all payment forms including credit, debit, prepaid, electronic benefit transfer and electronic check for merchants of all sizes across a wide array of market verticals. Merchant services include authorization and capture of transactions; clearing and settlement of transactions; information reporting services related to transactions; merchant billing services; and point-of-sale equipment sales and service.
24
In June 2009, Bank of America announced that it formed a new joint venture to provide merchant services. In November 2010, TSYS and Bank of America agreed to a new agreement, during the term of which TSYS expects merchant services revenues from Bank of America to decline as Bank of America transitions its services to its new joint venture. The loss of Bank of America as a merchant services client is not expected to have a material adverse effect on the Merchant Services segment’s or TSYS’ financial position, results of operations or cash flows.
Effective June 2013, the Company renewed its processing agreement, which includes revenue minimums, with Bank of America for an additional two years.
This segment has no major customers.
Below is a summary of the Merchant Services segment:
| Years Ended December 31, | Percent Change | |||||||||||||||||||
| (in thousands) | 2015 | 2014 | 2013 | 2015 vs. 2014 | 2014 vs. 2013 | |||||||||||||||
| Revenues before reimbursable items |
$ | 474,040 | 435,649 | 446,277 | 8.8 | % | (2.4 | )% | ||||||||||||
| Reimbursable items |
75,329 | 74,471 | 86,773 | 1.2 | (14.2 | ) | ||||||||||||||
|
|
|
|
|
|
|
|||||||||||||||
| Total revenues |
$ | 549,369 | 510,120 | 533,050 | 7.7 | (4.3 | ) | |||||||||||||
|
|
|
|
|
|
|
|||||||||||||||
| Adjusted segment operating income1 |
$ | 150,225 | 134,872 | 155,643 | 11.4 | (13.3 | ) | |||||||||||||
|
|
|
|
|
|
|
|||||||||||||||
| Adjusted segment operating margin2 |
31.7 | % | 31.0 | % | 34.9 | % | ||||||||||||||
| Key indicators (in millions): |
||||||||||||||||||||
| Point-of-sale transactions |
4,266.5 | 4,052.7 | 4,359.8 | 5.3 | (7.0 | ) | ||||||||||||||
| Dollar sales volume |
$ | 48,072.7 | 46,846.4 | 44,144.0 | 2.6 | 6.1 | ||||||||||||||
| 1 | Adjusted segment operating income excludes acquisition intangible amortization and expenses associated with Corporate Administration and Other. |
| 2 | Adjusted segment operating margin equals adjusted segment operating income divided by revenues before reimbursable items. |
Total segment revenues increased $39.2 million for 2015, as compared to 2014. This increase includes increases associated with new business, internal growth and reimbursable items offset by decreases associated with lost business, deconversions and price reductions. Total segment revenues decreased $22.9 million for 2014, as compared to 2013. This decrease was due primarily to lost business, deconversions and price reductions and reimbursable items offset by new business and internal growth.
The increase in adjusted segment operating income for 2015, as compared to 2014, is driven by an increase in revenues partially offset by increases in associated costs. The decrease in adjusted segment operating income for 2014, as compared to 2013, is driven by lower third party processing revenues and incremental costs related to integration projects.
The Merchant Services segment results are driven by dollar sales volume and the authorization and capture transactions processed at the point-of-sale and clearing and settlement transactions. This segment’s authorization and capture transactions are primarily through dial-up or Internet connectivity.
For the year ended December 31, 2015 approximately 92.3% of the revenues of the Merchant Services segment, were influenced by several factors, including volumes related to transactions and dollar sales volume. The remaining 7.7% of this segment’s revenues were derived from value added services, chargebacks, managed services, investigation, risk and collection services performed.
NetSpend
The NetSpend segment is a program manager for FDIC-insured depository institutions that issue GPR cards and payroll cards and provide alternative financial services to underbanked and other consumers in the United States.
25
The products within this segment provide underbanked consumers with access to FDIC-insured depository accounts with a menu of pricing and features specifically tailored to their needs. This segment has an extensive distribution and reload network comprised of financial service centers, employers and retail locations throughout the United States. The NetSpend segment markets prepaid cards through multiple distribution channels, including alternative financial service providers, traditional retailers, direct-to-consumer and online marketing programs and contractual relationships with corporate employers.
The NetSpend segment’s revenues primarily consist of a portion of the service fees and interchange revenues received by NetSpend’s prepaid card Issuing Banks in connection with the programs managed by this segment. Cardholders are charged fees for transactions including fees for PIN and signature-based purchase transactions made using their prepaid cards, for ATM withdrawals or other transactions conducted at ATMs, for balance inquiries, and monthly maintenance fees among others. Cardholders are also charged fees associated with additional products and services offered in connection with certain cards including the use of overdraft features, bill payment options, custom card designs and card-to-card transfers of funds initiated through call centers. The NetSpend segment also earns revenues from a portion of the interchange fees remitted by merchants when cardholders make purchase transactions using their cards. Subject to applicable law, interchange fees are fixed by card associations and network organizations.
This segment has no major customers.
Below is a summary of the NetSpend segment:
| Years Ended December 31, | Percent Change | |||||||||||||||||||
| (in thousands) | 2015 | 2014 | 2013 | 2015 vs. 2014 | 2014 vs. 2013 | |||||||||||||||
| Total revenues (and revenues before reimbursable items) |
$ | 580,377 | 482,686 | 207,851 | 20.2 | % | nm | % | ||||||||||||
|
|
|
|
|
|
|
|||||||||||||||
| Adjusted segment operating income1 |
$ | 137,837 | 128,285 | 66,353 | 7.4 | nm | ||||||||||||||
|
|
|
|
|
|
|
|||||||||||||||
| Adjusted segment operating margin2 |
23.8 | % | 26.6 | % | 31.9 | % | ||||||||||||||
| Key indicators (in millions): |
||||||||||||||||||||
| Number of active cards |
3.9 | 3.2 | 2.8 | 29.1 | 13.4 | |||||||||||||||
| Number of active cards with direct deposit |
1.9 | 1.6 | 1.3 | 17.7 | 21.9 | |||||||||||||||
| Percentage of active cards with direct deposit |
48.7 | % | 50.1 | % | 46.6 | % | ||||||||||||||
| Gross dollar volume |
$ | 24,274.9 | 20,296.0 | 7,748.5 | 19.6 | % | nm | % | ||||||||||||
nm = not meaningful. Amounts are not comparable because the amounts for 2013 only include six months of results compared to twelve months of results for 2014.
| 1 | Adjusted segment operating income excludes acquisition intangible amortization and expenses associated with Corporate Administration and Other. |
| 2 | Adjusted segment operating margin equals adjusted segment operating income divided by revenues before reimbursable items. |
The results noted above for the year 2013 are for the period from July 1, 2013, the date that TSYS acquired NetSpend, through December 31, 2013. Number of active cards represents the total number of prepaid cards that have had a PIN or signature-based purchase transaction, a point-of-sale load transaction or an ATM withdrawal within three months of the date of determination. Number of active cards with direct deposit represents the number of active cards that have had a direct deposit load within three months of the date of determination. Gross dollar volume represents the total dollar volume of debit transactions and cash withdrawals made using the prepaid cards the NetSpend segment manages.
NetSpend segment revenues increased $97.7 million for 2015 from 2014. This increase was comprised of a $64.3 million increase in service fee revenues and a $33.4 million increase in interchange and other revenues. NetSpend segment revenues increased $274.8 million for 2014, as compared to 2013. This increase is attributable mainly to the inclusion of a full twelve months of results in 2014. The $580.4 million of revenues for 2015 was a combination of 69.6% of revenues derived from service fees charged to cardholders and 30.4% of revenues derived from interchange and other revenues. Service fee revenues are driven by the number of active
26
cards and in particular by the number of cards with direct deposit. Cardholders with direct deposit generally initiate more transactions and generate more revenues than those that do not take advantage of this feature. Interchange revenues are driven by gross dollar volume. Substantially all of the NetSpend segment revenues are volume driven as they are driven by the active card and gross dollar volume indicators.
Cardholder funds and deposits related to NetSpend’s prepaid products are held at FDIC-insured Issuing Banks for the benefit of the cardholders. NetSpend currently has active agreements with six Issuing Banks.
NetSpend’s prepaid card business derived approximately one-fourth of its revenues from cardholders acquired through one of its third-party distributors.
Operating Expenses
The Company’s operating expenses consist of cost of services and selling, general and administrative expenses. Cost of services describes the direct expenses incurred in performing a particular service for customers, including the cost of direct labor expense in putting the service in saleable condition. Selling, general and administrative expenses are incurred in selling or marketing and for the direction of the enterprise as a whole, including accounting, legal fees, officers’ salaries, investor relations and mergers and acquisitions.
Operating expenses were $2.2 million, $2.0 million and $1.7 million in 2015, 2014 and 2013, respectively. The changes in operating expenses for the years ended December 31, 2015 and 2014 include a decrease of $30.4 million and an increase of $5.9 million, respectively, related to the effects of currency translation of the Company’s foreign-based subsidiaries. The changes in operating expenses for the years ended December 31, 2015, 2014 and 2013 were also impacted by the NetSpend acquisition in 2013. NetSpend’s operating expenses were $535.2 million, $443.5 million and $191.0 million in 2015, 2014 and 2013, respectively. Expenses in 2015 were also impacted by certain one-time state tax benefits of $15.6 million that resulted from prior years but were recognized in 2015. Expenses in 2014 were also impacted by a significant nonrecurring charitable contribution.
Federal legislation was enacted which makes extensive changes to the current system of health care insurance and benefits. The Company has reviewed the legislation and, based upon information available, estimates the impact of the legislation was approximately $2.0 million on 2015, $1.8 million on 2014 and $1.1 million on 2013.
The Company’s merger and acquisition expenses were $64,000, $3.2 million and $14.2 million for the years ended December 31, 2015, 2014 and 2013, respectively. These expenses consist of legal, accounting and professional fees, as well as, personnel costs for severance and retention.
Nonoperating Income (Expense)
Nonoperating income (expense) consists of interest income, interest expense, gains and losses on currency transactions and gains and losses on investments in private equity. Nonoperating income (expense) decreased in 2015 as compared to 2014, and increased in 2014 as compared to 2013.
The following table provides a summary of nonoperating expense:
| Years Ended December 31, | Percent Change | |||||||||||||||||||
| (in thousands) | 2015 | 2014 | 2013 | 2015 vs. 2014 | 2014 vs. 2013 | |||||||||||||||
| Interest income |
$ | 1,450 | $ | 1,109 | $ | 1,494 | 30.8 | % | (25.8 | )% | ||||||||||
| Interest expense* |
(40,701 | ) | (40,975 | ) | (32,449 | ) | (0.7 | ) | 26.3 | |||||||||||
| Currency transaction gains(losses), net |
(388 | ) | 142 | (1,013 | ) | nm | nm | |||||||||||||
| Net gains on investments in private equity |
3,324 | 308 | 338 | nm | (8.8 | ) | ||||||||||||||
| Other |
(904 | ) | 705 | 1,606 | nm | (56.1 | ) | |||||||||||||
|
|
|
|
|
|
|
|||||||||||||||
| Total |
$ | (37,219 | ) | (38,711 | ) | (30,024 | ) | (3.9 | ) | 28.9 | ||||||||||
|
|
|
|
|
|
|
|||||||||||||||
| * | Interest expense includes interest on bonds of $33.7 million, $33.7 million, and $20.5 million, respectively, for the years ended December 31, 2015, 2014 and 2013. |
27
Income Taxes
Below is a summary of income tax expense:
| Years Ended December 31, | Percent Change | |||||||||||||||||||
| (in thousands) | 2015 | 2014 | 2013 | 2015 vs. 2014 | 2014 vs. 2013 | |||||||||||||||
| Income tax expense |
$ | 151,364 | 129,761 | 110,981 | 16.6 | % | 16.9 | % | ||||||||||||
| Effective income tax rate |
30.5 | % | 32.0 | % | 31.5 | % | ||||||||||||||
The pretax income and the effective income tax rate includes noncontrolling interest in consolidated subsidiaries’ net income and excludes equity in income of equity investments.
During 2015, the Company generated income tax credits in excess of its utilization capacity based on both the Company’s current operations and with consideration of future tax planning strategies. Based upon these same considerations, the Company reassessed its need for valuation allowances in all jurisdictions. Accordingly, the Company experienced a net decrease in its valuation allowance for deferred income tax assets of $0.5 million.
TSYS has adopted the permanent reinvestment exception as allowed by GAAP, with respect to future earnings of certain foreign subsidiaries. As a result, TSYS considers foreign earnings related to these foreign operations to be permanently reinvested. No provision for U.S. federal and state incomes taxes has been made in the Consolidated Financial Statements for those non-U.S. subsidiaries whose earnings are considered to be reinvested. The amount of undistributed earnings considered to be “reinvested” which may be subject to tax upon distribution was approximately $83.9 million as of December 31, 2015. Although TSYS does not intend to repatriate these earnings, a distribution of these non-U.S. earnings in the form of dividends, or otherwise, would subject the Company to both U.S. federal and state income taxes, as adjusted for non-U.S. tax credits, and withholding taxes payable to the various non-U.S. countries. Determination of the amount of any unrecognized deferred income tax liability on these undistributed earnings is not practicable.
In 2015, TSYS reassessed its contingencies for foreign, federal and state exposures, which resulted in a net increase in tax contingency amounts of approximately $6.4 million.
Refer to Note 15 in the Consolidated Financial Statements for more information on income taxes.
Equity in Income of Equity Investments
Below is a summary of TSYS’ share of income from its interest in equity investments:
| Years Ended December 31, | Percent Change | |||||||||||||||||||
| (in thousands) | 2015 | 2014 | 2013 | 2015 vs. 2014 | 2014 vs. 2013 | |||||||||||||||
| Equity in income of equity investments |
$ | 22,106 | 17,583 | 13,047 | 25.7 | % | 34.8 | % | ||||||||||||
The increase in equity income in 2015 and 2014 is the result of organic growth in CUP Data. Refer to Note 12 in the Consolidated Financial Statements for more information on equity investments.
Discontinued Operations
TSYS sold its Japan-based operations during 2014 and recorded income from discontinued operations, net of tax, of $1.4 million, $48.7 million and $2.1 million for 2015, 2014 and 2013, respectively. Refer to Note 2 in the Consolidated Financial Statements for more information on discontinued operations.
28
Net Income
The following table provides a summary of net income and EPS:
| Years Ended December 31, | Percent Change | |||||||||||||||||||
| (in thousands, except per share data) | 2015 | 2014 | 2013 | 2015 vs. 2014 | 2014 vs. 2013 | |||||||||||||||
| Net Income |
$ | 369,041 | 329,406 | 256,597 | 12.0 | % | 28.4 | % | ||||||||||||
| Net income attributable to noncontrolling interests |
(4,997 | ) | (6,534 | ) | (11,847 | ) | (23.5 | ) | (44.8 | ) | ||||||||||
|
|
|
|
|
|
|
|||||||||||||||
| Net income attributable to TSYS common shareholders |
$ | 364,044 | 322,872 | 244,750 | 12.8 | 31.9 | ||||||||||||||
|
|
|
|
|
|
|
|||||||||||||||
| Basic EPS attributable to TSYS common shareholders1 |
$ | 1.98 | 1.73 | 1.30 | 14.1 | 33.5 | ||||||||||||||
|
|
|
|
|
|
|
|||||||||||||||
| Diluted EPS attributable to TSYS common shareholders1 |
$ | 1.97 | 1.72 | 1.29 | 14.2 | 33.6 | ||||||||||||||
|
|
|
|
|
|
|
|||||||||||||||
| 1 | Basic and diluted EPS is computed based on the two-class method in accordance with the guidance under GAAP. Refer to Note 26 in the Consolidated Financial Statements for more information on EPS. |
Net income attributable to noncontrolling interests in 2015 decreased by $1.5 million, from 2014 and decreased $5.3 million in 2014 from 2013. The decrease in 2015 compared to 2014 is driven by the sale of GP Net in 2014 and the operating results of the Company’s European cost center business. The decrease in 2014 was a result of the additional acquisition of 15% of Central Payment Co., LLC (CPAY) in 2014.
Non-GAAP Financial Measures
Management evaluates the Company’s operating performance based upon operating margin excluding reimbursables, adjusted EBITDA, adjusted segment operating income, adjusted segment operating margin and adjusted EPS, which are all non-generally accepted accounting principles (non-GAAP) measures. TSYS also uses these non-GAAP financial measures to evaluate and assess TSYS’ financial performance against budget.
Although not a substitute for GAAP, TSYS believes that non-GAAP financial measures are important to enable investors to understand and evaluate its ongoing operating results. Accordingly, TSYS includes non-GAAP financial measures when reporting its financial results to shareholders in order to provide them with an additional tool to evaluate TSYS’ ongoing business operations. TSYS believes that the non-GAAP financial measures are representative of comparative financial performance that reflects the economic substance of TSYS’ current and ongoing business operations.
Although non-GAAP financial measures are often used to measure TSYS’ operating results and assess its financial performance, they are not necessarily comparable to similarly titled captions of other companies due to potential inconsistencies in the method of calculation.
TSYS believes that its use of non-GAAP financial measures provides investors with the same key financial performance indicators that are utilized by management to assess TSYS’ operating results, evaluate the business and make operational decisions on a prospective, going-forward basis. Hence, management provides disclosure of non-GAAP financial measures to give shareholders and potential investors an opportunity to see TSYS as viewed by management, to assess TSYS with some of the same tools that management utilizes internally and to be able to compare such information with prior periods. TSYS believes that the presentation of GAAP financial measures alone would not provide its shareholders and potential investors with the ability to appropriately analyze its ongoing operational results, and therefore expected future results. TSYS therefore believes that inclusion of non-GAAP financial measures provides investors with additional information to help them better understand its financial statements just as management utilizes these non-GAAP financial measures to better understand the business, manage budgets and allocate resources.
29
The following tables provide a reconciliation of GAAP to non-GAAP financial measures:
Revenues Before Reimbursable Items and Operating Margin Excluding Reimbursable Items
| Years Ended December 31, | ||||||||||||
| (in thousands) | 2015 | 2014 | 2013 | |||||||||
| Operating income (a) |
$ | 534,107 | 431,640 | 382,500 | ||||||||
|
|
|
|
|
|
|
|||||||
| Total revenues (b) |
$ | 2,779,541 | 2,446,877 | 2,064,305 | ||||||||
| Less reimbursable items |
280,192 | 253,899 | 240,597 | |||||||||
|
|
|
|
|
|
|
|||||||
| Revenues before reimbursable items (c) |
$ | 2,499,349 | 2,192,978 | 1,823,708 | ||||||||
|
|
|
|
|
|
|
|||||||
| Operating margin (as reported) (a)/(b) |
19.22 | % | 17.64 | % | 18.53 | % | ||||||
|
|
|
|
|
|
|
|||||||
| Operating margin excluding reimbursables (a)/(c) |
21.37 | % | 19.68 | % | 20.97 | % | ||||||
|
|
|
|
|
|
|
|||||||
Adjusted EBITDA
| Years Ended December 31, | ||||||||||||
| (in thousands) | 2015 | 2014 | 2013 | |||||||||
| Net income |
$ | 369,041 | 329,406 | 256,597 | ||||||||
| Adjusted for: |
||||||||||||
| Income from discontinued operations |
(1,411 | ) | (48,655 | ) | (2,055 | ) | ||||||
| Equity in income of equity investments, net of taxes |
(22,106 | ) | (17,583 | ) | (13,047 | ) | ||||||
| Income taxes |
151,364 | 129,761 | 110,981 | |||||||||
| Nonoperating expenses, net |
37,219 | 38,711 | 30,024 | |||||||||
| Depreciation and amortization |
258,264 | 246,620 | 199,026 | |||||||||
|
|
|
|
|
|
|
|||||||
| EBITDA |
792,371 | 678,260 | 581,526 | |||||||||
| Adjusted for: |
||||||||||||
| Share-based compensation |
41,549 | 30,790 | 28,933 | |||||||||
| NetSpend merger and acquisition expenses* |
— | 3,217 | 13,634 | |||||||||
|
|
|
|
|
|
|
|||||||
| Adjusted EBITDA |
$ | 833,920 | 712,267 | 624,093 | ||||||||
|
|
|
|
|
|
|
|||||||
| Deduct: State tax credits and related expenses |
$ | (14,903 | ) | — | — | |||||||
|
|
|
|
|
|
|
|||||||
| Adjusted EBITDA without impact of one-time tax items |
$ | 819,017 | 712,267 | 624,093 | ||||||||
|
|
|
|
|
|
|
|||||||
| * | Excludes share-based compensation |
30
Segment Operating Margin and Consolidated Adjusted Operating Margin
| Year Ended December 31, 2015 | ||||||||||||
| (in thousands) | Adjusted Segment Operating Income |
Revenues before Reimbursable Items |
Adjusted Operating Margin |
|||||||||
| North America Services |
$ | 429,064 | 1,147,254 | 37.40 | % | |||||||
| International Services |
60,087 | 331,159 | 18.14 | |||||||||
| Merchant Services |
150,225 | 474,040 | 31.69 | |||||||||
| NetSpend |
137,837 | 580,377 | 23.75 | |||||||||
| Intersegment |
— | (33,481 | ) | |||||||||
| Corporate admin and other |
(109,035 | ) | ||||||||||
|
|
|
|
|
|
|
|||||||
| Adjusted operating margin |
668,178 | 2,499,349 | 26.73 | % | ||||||||
| Acquisition intangible amortization |
(92,522 | ) | ||||||||||
| NetSpend M&A operating expenses |
— | |||||||||||
| Share-based compensation |
(41,549 | ) | ||||||||||
|
|
|
|
|
|
|
|||||||
| Operating income and margin* |
534,107 | 2,499,349 | 21.37 | % | ||||||||
| Reimbursable items |
— | 280,192 | ||||||||||
|
|
|
|
|
|
|
|||||||
| Operating income and margin* |
$ | 534,107 | 2,779,541 | 19.22 | % | |||||||
|
|
|
|
|
|
|
|||||||
| Year Ended December 31, 2014 | ||||||||||||
| Adjusted Segment Operating Income |
Revenues before Reimbursable Items |
Adjusted Operating Margin |
||||||||||
| North America Services |
$ | 351,512 | 954,082 | 36.84 | % | |||||||
| International Services |
55,123 | 341,785 | 16.13 | |||||||||
| Merchant Services |
134,872 | 435,649 | 30.96 | |||||||||
| NetSpend |
128,285 | 482,686 | 26.58 | |||||||||
| Intersegment |
— | (21,224 | ) | |||||||||
| Corporate admin and other |
(107,174 | ) | ||||||||||
|
|
|
|
|
|
|
|||||||
| Adjusted operating margin |
562,618 | 2,192,978 | 25.66 | % | ||||||||
| Acquisition intangible amortization |
(96,971 | ) | ||||||||||
| NetSpend M&A operating expenses |
(3,217 | ) | ||||||||||
| Share-based compensation |
(30,790 | ) | ||||||||||
|
|
|
|
|
|
|
|||||||
| Operating income and margin* |
431,640 | 2,192,978 | 19.68 | % | ||||||||
| Reimbursable items |
— | 253,899 | ||||||||||
|
|
|
|
|
|
|
|||||||
| Operating income and margin* |
$ | 431,640 | 2,446,877 | 17.64 | % | |||||||
|
|
|
|
|
|
|
|||||||
| Year Ended December 31, 2013 | ||||||||||||
| Adjusted Segment Operating Income |
Revenues before Reimbursable Items |
Adjusted Operating Margin |
||||||||||
| North America Services |
$ | 321,619 | 860,645 | 37.37 | % | |||||||
| International Services |
42,068 | 321,484 | 13.09 | |||||||||
| Merchant Services |
155,643 | 446,277 | 34.88 | |||||||||
| NetSpend |
66,353 | 207,851 | 31.92 | |||||||||
| Intersegment |
— | (12,549 | ) | |||||||||
| Corporate admin and other |
(94,137 | ) | — | |||||||||
|
|
|
|
|
|
|
|||||||
| Adjusted operating margin |
491,546 | 1,823,708 | 26.95 | % | ||||||||
| Acquisition intangible amortization |
(65,893 | ) | ||||||||||
| NetSpend M&A operating expenses |
(14,220 | ) | ||||||||||
| Share-based compensation |
(28,933 | ) | ||||||||||
|
|
|
|
|
|
|
|||||||
| Operating income and margin* |
382,500 | 1,823,708 | 20.97 | % | ||||||||
| Reimbursable items |
— | 240,597 | ||||||||||
|
|
|
|
|
|
|
|||||||
| Operating income and margin* |
$ | 382,500 | 2,064,305 | 18.53 | % | |||||||
|
|
|
|
|
|
|
|||||||
| * | Operating margin on revenue before reimbursable items |
31
Adjusted Earnings Per Share
| Years Ended December 31, | ||||||||||||
| (in thousands except per share data) | 2015 | 2014 | 2013 | |||||||||
| Income from continuing operations attributable to TSYS common shareholders |
$ | 362,633 | $ | 275,216 | 246,893 | |||||||
|
|
|
|
|
|
|
|||||||
| Adjust for amounts attributable to TSYS common shareholders (net of taxes): |
||||||||||||
| Acquisition intangible amortization |
61,525 | 65,127 | 43,743 | |||||||||
| Share-based compensation |
27,954 | 20,944 | 19,830 | |||||||||
| NetSpend merger and acquisition expenses |
— | 3,115 | 15,251 | |||||||||
|
|
|
|
|
|
|
|||||||
| Adjusted earnings |
$ | 452,112 | $ | 364,402 | $ | 325,717 | ||||||
|
|
|
|
|
|
|
|||||||
| Basic EPS—Income from continuing operations attributable to TSYS common shareholders |
||||||||||||
| As reported (GAAP) |
$ | 1.97 | 1.48 | 1.31 | ||||||||
|
|
|
|
|
|
|
|||||||
| Adjust for amounts attributable to TSYS common shareholders (net of taxes): |
||||||||||||
| Acquisition intangible amortization |
0.33 | 0.35 | 0.23 | |||||||||
| Share-based compensation |
0.15 | 0.11 | 0.11 | |||||||||
| NetSpend merger and acquisition expenses |
— | 0.02 | 0.08 | |||||||||
|
|
|
|
|
|
|
|||||||
| Adjusted EPS* |
$ | 2.46 | 1.96 | 1.73 | ||||||||
|
|
|
|
|
|
|
|||||||
| Deduct: Federal and state tax credits and related expenses, net of tax |
$ | (0.13 | ) | — | — | |||||||
|
|
|
|
|
|
|
|||||||
| Adjusted EPS without impact of one-time tax items |
$ | 2.33 | 1.96 | 1.73 | ||||||||
|
|
|
|
|
|
|
|||||||
| Average common shares and participating securities |
184,082 | 186,222 | 188,391 | |||||||||
|
|
|
|
|
|
|
|||||||
| * | Adjusted EPS amounts do not total due to rounding. |
Projected Outlook for 2016
As compared to 2015, TSYS expects its 2016 total revenues to increase by 4%-6%, its revenues before reimbursable items to increase by 5%-7%, and its adjusted EPS from continuing operations attributable to TSYS common shareholders to increase by 4%-7%, based on the following assumptions with respect to 2016: (1) there will be no significant movements in the London Interbank Offered Rate (LIBOR) and TSYS will not make any significant draws on the remaining balance of its revolving credit facility; (2) there will be no significant movement in foreign currency exchange rates related to TSYS’ business; (3) TSYS will not incur significant expenses associated with the conversion of new large clients, additional acquisitions, or any significant impairment of goodwill or other intangibles; (4) there will be no deconversions of large clients during the year other than as previously disclosed; and (5) the economy will not worsen. In addition, TSYS’ earnings guidance for 2016 does not include the impact of share repurchases or the pending acquisition of TransFirst Holdings Corp. (“TransFirst”).
Financial Position, Liquidity and Capital Resources
The Consolidated Statements of Cash Flows detail the Company’s cash flows from operating, investing and financing activities. TSYS’ primary methods for funding its operations and growth have been cash generated from current operations, the use of leases and the occasional use of borrowed funds to supplement financing of capital expenditures.
32
Cash Flows from Operating Activities
| Years Ended December 31, | ||||||||||||
| (in thousands) | 2015 | 2014 | 2013 | |||||||||
| Net income |
$ | 369,041 | 329,406 | 256,597 | ||||||||
| Depreciation and amortization |
258,264 | 248,018 | 205,351 | |||||||||
| Other noncash items and charges, net |
50,458 | (27,928 | ) | 76,744 | ||||||||
| Net change in current and other assets and current and other liabilities |
(77,569 | ) | 10,705 | (86,294 | ) | |||||||
|
|
|
|
|
|
|
|||||||
| Net cash provided by operating activities |
$ | 600,194 | 560,201 | 452,398 | ||||||||
|
|
|
|
|
|
|
|||||||
TSYS’ main source of funds is derived from operating activities, specifically net income. The increases in 2015 and 2014, as compared to the previous years, in net cash provided by operating activities were primarily the result of increased earnings.
Net change in current and other assets and current and other liabilities include accounts receivable, prepaid expenses, other current assets and other assets, accounts payable, accrued salaries and employee benefits and other liabilities. The change in accounts receivable between the years is the result of timing of collections compared to billings. The change in accounts payable and other liabilities between years is the result of the timing of payments and the reduction of liabilities related to the disposal of the Company’s Japan operations.
Cash Flows from Investing Activities
| Years Ended December 31, | ||||||||||||
| (in thousands) | 2015 | 2014 | 2013 | |||||||||
| Additions to contract acquisition costs |
$ | (58,728 | ) | (88,871 | ) | (55,965 | ) | |||||
| Purchases of property and equipment, net |
(54,640 | ) | (75,913 | ) | (40,598 | ) | ||||||
| Additions to licensed computer software from vendors |
(50,729 | ) | (29,638 | ) | (63,635 | ) | ||||||
| Additions to internally developed computer software |
(39,219 | ) | (41,501 | ) | (33,600 | ) | ||||||
| Purchases of private equity investments |
(3,525 | ) | (3,291 | ) | (1,378 | ) | ||||||
| Cash used in acquisitions, net of cash acquired |
(750 | ) | (38,584 | ) | (1,314,660 | ) | ||||||
| Proceeds from insurance recovery for loss on disposal |
— | 6,212 | — | |||||||||
| Proceeds from sale of private equity investment |
1,839 | — | — | |||||||||
| Proceeds from dispositions, net of expenses paid and cash disposed |
3,568 | 44,979 | — | |||||||||
|
|
|
|
|
|
|
|||||||
| Net cash used in investing activities |
$ | (202,184 | ) | (226,607 | ) | (1,509,836 | ) | |||||
|
|
|
|
|
|
|
|||||||
The major uses of cash for investing activities in 2015, 2014 and 2013 were for additions to contract acquisition costs, equipment, acquisitions, internally developed computer software and licensed computer software from vendors.
Contract Acquisition Costs
TSYS makes cash payments for processing rights, third-party development costs and other direct salary-related costs in connection with converting new customers to the Company’s processing systems. The Company’s investments in contract acquisition costs were $58.7 million in 2015, $88.9 million in 2014 and $56.0 million in 2013. The Company made cash payments for processing rights of $29.6 million, $21.7 million and $9.7 million in 2015, 2014 and 2013, respectively. Conversion cost additions were $29.1 million, $67.2 million and $46.3 million in 2015, 2014 and 2013, respectively. The decreases in conversion costs in 2015 compared to 2014, and the increase in 2014 compared to 2013, are primarily related to the conversion of Bank of America’s consumer card portfolio.
Property and Equipment
Capital expenditures for property and equipment were $54.6 million in 2015, compared to $75.9 million in 2014 and $40.6 million in 2013. The majority of capital expenditures in 2015 and 2014 related to computer processing
33
hardware. The majority of capital expenditures in 2013 related to investments in new computer processing hardware and building improvements
Internally Developed Computer Software Costs
Additions to capitalized software development costs, including enhancements to, and development of, processing systems, were $39.2 million in 2015, $41.5 million in 2014 and $33.6 million in 2013. The changes in capitalized software development costs in 2015, as compared to 2014, were the result of varying levels of activity in two corporate-wide initiatives. One initiative is a multi-year, multi-phase initiative that consists of enhancing TSYS’ issuing processing platforms. The other is an innovation initiative focused on enhancing existing product and service offerings through several new product concepts and ideas on how to change existing processes.
Licensed Computer Software from Vendors
Expenditures for licensed computer software from vendors for increases in processing capacity were $50.7 million in 2015, compared to $29.6 million in 2014 and $63.6 million in 2013. The increase in expenses in 2015 compared to 2014 was due primarily to the extension of existing mainframe and distributed software agreements. The decrease in expenditures in 2014 was due to purchases of software in 2013 in anticipation of large conversions in future years.
Purchases of Private Equity Investments
The Company has entered into limited partnership agreements in connection with investing in two Atlanta-based venture capital funds focused exclusively on investing in technology-enabled financial services companies. Pursuant to each limited partnership agreement, the Company has committed to invest up to $20.0 million in each fund so long as its ownership interest in each fund does not exceed 50%. The Company made investments in the fund of $3.5 million, $3.3 million and $1.4 million in 2015, 2014 and 2013, respectively. The Company recorded gains on this investment of $4.0 million, $793,000 and $966,000 for the years ended December 31, 2015, 2014 and 2013, respectively.
Cash Used in Acquisitions
In 2014, the Company paid $38.6 million to NetSpend dissenting shareholders to settle the outstanding lawsuit associated with the NetSpend acquisition. In 2013, the Company used cash of $1.3 billion in the acquisition of NetSpend.
Proceeds from Insurance Recovery for Loss on Disposal
In 2014, the Company received $6.2 million of proceeds from insurance coverage related to the destruction of property resulting from a fire. The Company recorded the loss on disposal which was more than offset by the insurance proceeds received.
Proceeds from Dispositions
TSYS received $3.6 million in proceeds from dispositions related to the return of cash in 2015 that was placed in escrow during closing and tax adjustments associated with the sale of the Company’s Japan-based operations in 2014. In 2014, TSYS received $45.0 million of proceeds, net of expenses paid and cash disposed in connection with this transaction. Refer to Note 2 in the Consolidated Financial Statements for more information on discontinued operations.
34
Cash Flows from Financing Activities
| Years Ended December 31, | ||||||||||||
| (in thousands) | 2015 | 2014 | 2013 | |||||||||
| Repurchases of common stock under plans and tax withholding |
$ | (242,235 | ) | (170,516 | ) | (103,857 | ) | |||||
| Dividends paid on common stock |
(73,677 | ) | (74,796 | ) | (56,510 | ) | ||||||
| Principal payments on long-term borrowings and capital lease obligations |
(54,719 | ) | (69,939 | ) | (166,805 | ) | ||||||
| Subsidiary dividends paid to noncontrolling shareholders |
(5,028 | ) | (7,172 | ) | (7,321 | ) | ||||||
| Purchase of noncontrolling interest |
— | (37,500 | ) | — | ||||||||
| Debt issuance costs |
— | — | (13,573 | ) | ||||||||
| Proceeds from long-term borrowings |
1,912 | 1,396 | 1,395,661 | |||||||||
| Excess tax benefit from share-based payment arrangements |
24,357 | 7,185 | 3,528 | |||||||||
| Proceeds from exercise of stock options |
58,636 | 34,869 | 40,691 | |||||||||
|
|
|
|
|
|
|
|||||||
| Net cash (used in) provided by financing activities |
$ | (290,754 | ) | (316,473 | ) | 1,091,814 | ||||||
|
|
|
|
|
|
|
|||||||
The main sources of cash from financing activities in 2015 and 2014 were proceeds from the exercise of stock options. The main source of cash from financing activities in 2013 was the proceeds of borrowed funds. Net cash used in financing activities for the years ended December 31, 2015 and 2014 was primarily the result of the repurchases of common stock, payment of dividends, and principal payments on long-term debt borrowings and capital lease obligations offset by proceeds from the exercise of stock options. Net cash provided by financing activities for the year ended December 31, 2013 was primarily the result of proceeds from long-term borrowings in connection with the NetSpend acquisition. Refer to Notes 13 and 24 in the Consolidated Financial Statements for more information on the long-term debt financing and acquisitions.
Financing
In connection with the NetSpend acquisition, the Company obtained commitments for a $1.2 billion 364-day bridge term loan facility. In May, 2013 the Company closed the bridge term loan and issued debt of $1.4 billion to finance the NetSpend acquisition. In April 2013, the Company entered into a new credit agreement that provided for a five-year term loan to the Company in the amount of $200.0 million. In May 2013, the Company closed its issuance of $550.0 million aggregate principal amount of 2.375% Senior Notes due 2018 and $550.0 million aggregate principal amount of 3.750% Senior Notes due 2023 (collectively, the “Notes”). The interest on the Notes is payable semiannually. Upon the issuance of the Notes, the Company eliminated its bridge term loan facility. In July 2013, the Company borrowed $100 million on its revolving credit facility which was repaid as of December 31, 2013. In connection with the bridge term loan facility and the aforementioned loans, the Company paid debt issuance costs of $13.6 million in 2013.
Refer to Note 13 in the Consolidated Financial Statements for further information on TSYS’ long-term debt and financing arrangements.
Purchase of Noncontrolling Interest
In connection with the acquisition of CPAY, the Company is party to call and put arrangements with respect to the membership units that represent the remaining noncontrolling interest of CPAY. The call arrangement is exercisable by TSYS and the put arrangement is exercisable by the Seller. The put arrangement is outside the control of the Company by requiring the Company to purchase the Seller’s entire equity interest in CPAY at a put price at fair value. At the time of the original acquisition, the redemption of the put option was considered probable based upon the passage of time of the second anniversary date. The put arrangement is recorded on the balance sheet and is classified as redeemable noncontrolling interest outside of permanent equity.
In February 2014, the Company purchased an additional 15% equity interest in CPAY for $37.5 million, reducing the redeemable noncontrolling interest to 25%. The call and put options for the Seller’s 25% equity interest were extended as a result of this transaction.
35
The put option is not currently redeemable, but redemption is considered probable based upon the passage of time toward the third anniversary date of the 2014 purchase of additional equity. The Company’s accounting policy is to accrete changes in the redemption value over the period from the date of issuance to the earliest redemption date, which the Company believes to be in 2017. The Company did not accrete any changes to the redemption value as the balance as of December 31, 2015 exceeded the accretion fair value amount.
Refer to Note 24 in the Consolidated Financial Statements for more information on this purchase.
Stock Repurchase Plan
In January 2015, TSYS announced that its Board had approved a new stock repurchase plan to repurchase up to 20 million shares of TSYS stock. The shares may be purchased from time to time at prices considered appropriate. There is no expiration date for the plan. Through December 31, 2015, the Company purchased 5.2 million shares for approximately $242.1 million, at an average price of $47.01.
In April 2010, TSYS announced a stock repurchase plan to purchase up to 10 million shares of TSYS stock. The shares were to be purchased from time to time over the next two years at prices considered attractive to the Company. In May 2011, TSYS announced that its Board had approved an increase in the number of shares that may be repurchased under its current share repurchase plan from up to 10 million shares to up to 15 million shares of TSYS stock. The expiration date of the plan was also extended to April 30, 2013. In July 2012, TSYS announced that its Board had approved an increase in the number of shares that may be repurchased under its current share repurchase plan from up to 15 million shares to up to 20 million shares of TSYS stock. The expiration date of the plan was also extended to April 30, 2014. In January, 2014, TSYS announced that its Board had approved an increase in the number of shares that may be repurchased under its current share repurchase plan from up to 20 million shares to up to 28 million shares of TSYS stock. With the increase, TSYS had 6.8 million shares available to be repurchased. In addition, the expiration date of the plan was extended to April 30, 2015. Through December 31, 2014 and 2013, respectively, the Company purchased 21.2 million and 16.0 million shares for approximately $503.3 million and $338.0 million, at an average price of $23.75 and $21.13. In January 2015, this plan was terminated.
Dividends
Dividends on common stock of $73.7 million were paid in 2015, compared to $74.8 million and $56.5 million in 2014 and 2013, respectively. The Company paid dividends of $0.40 per share in 2015 and 2014, and $0.30 per share in 2013. The increase in dividends paid in 2014, compared to 2013, is due to the acceleration of the payment of the fourth quarter 2012 dividend. The fourth quarter 2012 dividend payment was paid in December 2012, rather than January 2013, to allow shareholders to benefit from the lower dividend tax rate that was set to expire on December 31, 2012.
Significant Noncash Transactions
During 2015, 2014 and 2013, the Company issued 388,211, 673,724 and 1.7 million shares of common stock, respectively, to certain key employees and non-management members of its Board of Directors. The grants to certain key employees were issued in the form of nonvested stock bonus awards for services to be provided in the future by such officers and employees. The market value of the common stock at the date of issuance is amortized as compensation expense over the vesting period of the awards. The grants to the Board of Directors were fully vested on the date of grant.
The Company acquired computer equipment and software under capital leases in the amount of $4.1 million, $17.9 million and $14.8 million in 2015, 2014 and 2013, respectively.
Refer to Notes 19 and 23 in the Consolidated Financial Statements for more information on share-based compensation and significant noncash transactions.
36
Additional Cash Flow Information
Off-Balance Sheet Financing
TSYS uses various operating leases in its normal course of business. These “off-balance sheet” arrangements obligate TSYS to make payments for computer equipment, software and facilities. These computer and software lease commitments may be replaced with new lease commitments due to new technology. Management expects that, as these leases expire, they will be evaluated and renewed or replaced by similar leases based on need.
The following table summarizes future contractual cash obligations, including lease payments and software arrangements, as of December 31, 2015, for the next five years and thereafter:
| Contractual Cash Obligations Payments Due By Period |
||||||||||||||||||||
| (in thousands) | Total | 1 Year or Less |
2-3 Years |
4-5 Years |
After 5 Years |
|||||||||||||||
| Debt obligations (principal) |
$ | 1,433,669 | 50,364 | 833,305 | — | 550,000 | ||||||||||||||
| Debt obligations (interest) |
195,403 | 37,932 | 64,658 | 41,250 | 51,563 | |||||||||||||||
| Operating leases |
495,238 | 123,812 | 218,550 | 130,159 | 22,716 | |||||||||||||||
| Purchase commitments |
67,425 | 18,144 | 27,165 | 22,091 | 25 | |||||||||||||||
| Redeemable noncontrolling interest |
23,410 | — | 23,410 | — | — | |||||||||||||||
| Capital lease obligations |
7,362 | 3,637 | 3,662 | 63 | — | |||||||||||||||
|
|
|
|
|
|
|
|
|
|
|
|||||||||||
| Total contractual cash obligations |
$ | 2,222,507 | 233,889 | 1,170,750 | 193,563 | 624,304 | ||||||||||||||
|
|
|
|
|
|
|
|
|
|
|
|||||||||||
Amounts utilize prevailing interest rates as of December 31, 2015.
Income Taxes
The total liability for uncertain tax positions as of December 31, 2015 is $13.1 million. Refer to Note 15 in the Consolidated Financial Statements for more information on income taxes. The Company is not able to reasonably estimate the amount by which the liability will increase or decrease over time; however, at this time, the Company does not expect any significant changes related to these obligations within the next twelve months.
Foreign Operations
TSYS operates internationally and is subject to the impact of adverse movements in foreign currency exchange rates. TSYS does not enter into foreign exchange forward contracts to reduce its exposure to foreign currency rate changes; however, the Company continues to analyze the potential use of hedging instruments to safeguard it from significant foreign currency translation risks.
TSYS maintains operating cash accounts outside the United States. Refer to Note 5 in the Consolidated Financial Statements for more information on cash and cash equivalents. TSYS has adopted the permanent reinvestment exception under GAAP with respect to future earnings of certain foreign subsidiaries. While some of the foreign cash is available to repay intercompany financing arrangements, remaining amounts are not presently available to fund domestic operations and obligations without paying a significant amount of taxes upon its repatriation. Demand on the Company’s cash has increased as a result of its strategic initiatives. TSYS funds these initiatives through a balance of internally generated cash, external sources of capital and, when advantageous, access to foreign cash in a tax efficient manner. Where local regulations limit an efficient intercompany transfer of amounts held outside of the U.S., TSYS will continue to utilize these funds for local liquidity needs. Under current law, balances available to be repatriated to the U.S. would be subject to U.S. federal income taxes, less applicable foreign tax credits. TSYS has provided for the U.S. federal tax liability on these amounts for financial statement purposes, except for foreign earnings that are considered permanently reinvested outside of the U.S. TSYS utilizes a variety of tax planning and financing strategies with the objective of having its worldwide cash available in the locations where it is needed.
37
Impact of Inflation
Although the impact of inflation on its operations cannot be precisely determined, the Company believes that by controlling its operating expenses and by taking advantage of more efficient computer hardware and software, it can minimize the impact of inflation.
Working Capital
TSYS may seek additional external sources of capital in the future. The form of any such financing will vary depending upon prevailing market and other conditions and may include short-term or long-term borrowings from financial institutions or the issuance of additional equity and/or debt securities such as industrial revenue bonds. However, there can be no assurance that funds will be available on terms acceptable to TSYS. Management expects that TSYS will continue to be able to fund a significant portion of its capital expenditure needs through internally generated cash in the future, as evidenced by TSYS’ current ratio of 2.6:1. As of December 31, 2015, TSYS had working capital of $543.7 million, compared to $394.0 million in 2014 and $356.7 million in 2013.
Legal Proceedings
Refer to Note 16 in the Consolidated Financial Statements for information regarding the Company’s commitments and contingencies including legal proceedings.
Forward-Looking Statements
Certain statements contained in this filing which are not statements of historical fact constitute forward-looking statements within the meaning of the Private Securities Litigation Reform Act (the Act). These forward-looking statements include, among others: (i) TSYS’ expectation that the loss of Bank of America as a merchant services client will not have a material adverse effect on TSYS’ business; (ii) TSYS’ expectation that the Durbin Amendment will not have a significant negative impact on TSYS’ business; (iii) TSYS’ expectation with respect to the effect of recent accounting pronouncements; (iv) TSYS’ expectation that it will be able to fund a significant portion of its capital expenditure needs through internally generated cash in the future; (v) TSYS’ earnings guidance for 2016 total revenues, revenues before reimbursable items, and adjusted EPS attributable to TSYS’ common shareholders from continuing operations; (vi) TSYS’ belief with respect to lawsuits, claims and other complaints; (vii) TSYS’ expectation with respect to certain tax matters; (viii) the Board’s intention to continue to pay cash dividends; (ix) statements regarding the pending Transfirst acquisition, and the assumptions underlying such statements. In addition, certain statements in future filings by TSYS with the Securities and Exchange Commission, in press releases, and in oral and written statements made by or with the approval of TSYS which are not statements of historical fact constitute forward-looking statements within the meaning of the Act. Examples of forward-looking statements include, but are not limited to: (i) projections of revenue, income or loss, earnings or loss per share, the payment or nonpayment of dividends, capital structure and other financial items; (ii) statements of plans and objectives of TSYS or its management or Board of Directors, including those relating to products or services; (iii) statements of future economic performance; and (iv) statements of assumptions underlying such statements. Words such as “believes,” “anticipates,” “expects,” “intends,” “targeted,” “estimates,” “projects,” “plans,” “may,” “could,” “should,” “would,” and similar expressions are intended to identify forward-looking statements but are not the exclusive means of identifying these statements.
These statements are based upon the current beliefs and expectations of TSYS’ management and are subject to significant risks and uncertainties. Actual results may differ materially from those contemplated by the forward-looking statements. A number of important factors could cause actual results to differ materially from those contemplated by the Company’s forward-looking statements. Many of these factors are beyond TSYS’ ability to control or predict. These factors include, but are not limited to:
| • | the material breach of security of any of TSYS’ systems; |
| • | TSYS incurs expenses associated with the signing of a significant client; |
38
| • | organic growth rates for TSYS’ existing clients are lower than anticipated whether as a result of unemployment rates, card delinquencies and charge off rates or otherwise or attrition rates of existing clients are higher than anticipated; |
| • | TSYS does not convert and deconvert clients’ portfolios as scheduled; |
| • | risks associated with foreign operations, including adverse developments with respect to foreign currency exchange rates; |
| • | adverse developments with respect to entering into contracts with new clients and retaining current clients; |
| • | consolidation in the financial services and other industries, including the merger of TSYS clients with entities that are not TSYS processing clients, the sale of portfolios by TSYS clients to entities that are not TSYS processing clients and financial institutions which are TSYS clients otherwise ceasing to exist; |
| • | the impact of the Dodd-Frank Wall Street Reform and Consumer Protection Act on TSYS and its clients; |
| • | adverse developments with respect to the payment card industry in general, including a decline in the use of cards as a payment mechanism; |
| • | the impact of potential and completed acquisitions, particularly the pending TransFirst acquisition, including the costs associated therewith, their being more difficult to integrate than anticipated, and the inability to achieve the anticipated growth opportunities and other benefits of the acquisitions; |
| • | the costs and effects of litigation, investigations or similar matters or adverse facts and developments relating thereto; |
| • | the impact of the application of and/or changes in accounting principles; |
| • | TSYS’ inability to timely, successfully and cost-effectively improve and implement processing systems to provide new products, increased functionality and increased efficiencies; |
| • | TSYS’ reliance on financial institution sponsors; |
| • | changes occur in laws, rules, regulations, credit card association rules, prepaid industry rules, or other industry standards affecting TSYS and its clients that may result in costly new compliance burdens on TSYS and its clients and lead to a decrease in the volume and/or number of transactions processed or limit the types and amounts of fees that can be charged to customers; |
| • | successfully managing the potential both for patent protection and patent liability in the context of rapidly developing legal framework for expansive patent protection; |
| • | one or more of the assumptions upon which TSYS’ earnings guidance for 2016 is based is inaccurate; |
| • | the effect of current domestic and worldwide economic and geopolitical conditions; |
| • | the impact on TSYS’ business, as well as on the risks set forth above, of various domestic or international military or terrorist activities or conflicts; |
| • | other risk factors described in the “Risk Factors” and other sections of TSYS’ Annual Report on Form 10-K for the fiscal year ended December 31, 2015 and other filings with the Securities and Exchange Commission; and |
| • | TSYS’ ability to manage the foregoing and other risks. |
These forward-looking statements speak only as of the date on which they are made and TSYS does not intend to update any forward-looking statement as a result of new information, future developments or otherwise.
39
Subsequent Events
Agreement to Acquire Capital Stock of TransFirst Holdings Corp.
On January 26, 2016, TSYS announced it entered into a definitive agreement with Vista Equity Partners Fund V, L.P. and certain related funds (collectively, “Vista”) to acquire TransFirst Holdings Corp. (“TransFirst”), a Vista portfolio company and leading U S. merchant solutions provider, in an all-cash transaction valued at approximately $2.35 billion. The Company intends to finance the TransFirst acquisition with cash on hand and approximately $2.4 billion of additional indebtedness. In connection with the transaction, the Company entered into a commitment letter with certain of its lenders to provide a $2.0 billion bridge term loan facility (the “Bridge Term Loan Facility”) to finance the TransFirst acquisition to the extent the Company has not obtained alternative financing before the closing of the transaction. The transaction is currently expected to close in the second quarter of 2016 and is subject to regulatory approvals and other customary closing conditions. For additional information regarding the transaction, see TSYS’ Current Reports on Form 8-K filed on January 26, 2016 and January 27, 2016, which include the press release announcing the transaction, the stock purchase agreement for the transaction and the commitment letter for the Bridge Term Loan Facility. There can be no assurance that the proposed acquisition will be completed, or if it is completed, that the expected benefits of the transaction will be realized.
Entry into Credit Agreement
On February 23, 2016, TSYS entered into a Credit Agreement (the “Credit Agreement”) with JPMorgan Chase Bank, N.A., as Administrative Agent and L/C Issuer, Bank of America, N.A., as Syndication Agent and L/C Issuer, The Bank of Tokyo-Mitsubishi UFJ, LTD., U.S. Bank National Association and Wells Fargo Bank, National Association, as Co-Documentation Agents, and the other lenders party thereto, with J.P. Morgan Securities LLC and Merrill Lynch, Pierce, Fenner & Smith Incorporated, The Bank of Tokyo-Mitsubishi UFJ, LTD., U.S. Bank National Association and Wells Fargo Securities, LLC as joint lead arrangers and joint bookrunners. The Credit Agreement provides TSYS with a $700 million five-year term loan facility broken consisting of (i) a $300 million term loan (the “Refinancing Term Loan”) funded upon entry into the Credit Agreement and (ii) a $400 million term loan (the “Delayed Draw Term Loan”). The Credit Agreement also provides TSYS with a $800 million unsecured revolving credit facility (the “Revolving Credit Facility”), which includes a $50 million sub-facility for the issuance of standby letters of credit.
The Refinancing Term Loan was used to repay in full TSYS’ outstanding loans and other obligations under that certain Credit Agreement, dated as of September 10, 2012, by and among the Company, the lenders party thereto and JPMorgan Chase Bank, N.A., as administrative agent thereunder, as amended, and that certain Credit Agreement, dated as of April 8, 2013, by and among the Company, the lenders party thereto and JPMorgan Chase Bank, N.A., as administrative agent thereunder, as amended. The Delayed Draw Term Loan will be available to be drawn to finance, in part, the TransFirst acquisition and related transactions, upon satisfaction of a limited set of conditions precedent. The Revolving Loan Facility will be available for draws for purposes of working capital and other general corporate purposes, including to finance, in part, the TransFirst acquisition and related transactions upon satisfaction of a limited set of conditions precedent.
Upon entering into the Credit Agreement, the total commitments under the Bridge Term Loan Facility were reduced from $2.0 billion to $1.15 billion by the amount of the Delayed Draw Term Loan commitment and the portion of the Revolving Loan Facility commitments in excess of $350 million.
For additional information regarding the Credit Agreement, see TSYS’ Current Report on Form 8-K filed on February 23, 2016.
Management performed an evaluation of the Company’s activity as of the date these audited financial statements were issued, and has concluded that, other than as set forth above, there are no significant subsequent events requiring disclosure.
40
Consolidated Balance Sheets
| December 31, | ||||||||
| (in thousands, except per share data) | 2015 | 2014 | ||||||
| Assets |
||||||||
| Current assets: |
||||||||
| Cash and cash equivalents (Note 5) |
$ | 389,328 | 289,183 | |||||
| Accounts receivable, net of allowances for doubtful accounts, billing adjustments and merchant losses of $4.0 million and $5.2 million as of 2015 and 2014, respectively (Note 4) |
314,705 | 283,203 | ||||||
| Deferred income tax assets (Note 15) |
24,670 | 15,190 | ||||||
| Prepaid expenses and other current assets (Note 6) |
154,199 | 98,974 | ||||||
| Current assets of discontinued operations (Note 2) |
— | 4,003 | ||||||
|
|
|
|
|
|||||
| Total current assets |
882,902 | 690,553 | ||||||
| Goodwill (Note 7) |
1,545,424 | 1,547,397 | ||||||
| Computer software, net of accumulated amortization of $680.6 million and $613.3 million as of 2015 and 2014, respectively (Note 9) |
405,070 | 366,148 | ||||||
| Other intangible assets, net of accumulated amortization of $257.1 million and $181.9 million as of 2015 and 2014, respectively (Note 8) |
328,320 | 404,107 | ||||||
| Property and equipment, net of accumulated depreciation and amortization of $457.3 million and $423.2 million as of 2015 and 2014, respectively (Note 10) |
289,898 | 290,585 | ||||||
| Contract acquisition costs, net of accumulated amortization of $287.9 million and $276.1 million as of 2015 and 2014, respectively (Note 11) |
247,811 | 236,305 | ||||||
| Equity investments, net (Note 12) |
106,118 | 100,468 | ||||||
| Deferred income tax assets (Note 15) |
5,598 | 7,002 | ||||||
| Other assets |
97,159 | 91,016 | ||||||
|
|
|
|
|
|||||
| Total assets |
$ | 3,908,300 | 3,733,581 | |||||
|
|
|
|
|
|||||
| Liabilities |
||||||||
| Current liabilities: |
||||||||
| Accrued salaries and employee benefits |
$ | 66,594 | 38,001 | |||||
| Accounts payable (Note 4) |
52,213 | 48,793 | ||||||
| Current portion of long-term borrowings (Note 13) |
50,364 | 43,784 | ||||||
| Current portion of obligations under capital leases (Note 13) |
3,468 | 7,127 | ||||||
| Other current liabilities (Note 14) |
166,579 | 154,805 | ||||||
| Current liabilities of discontinued operations (Note 2) |
— | 4,003 | ||||||
|
|
|
|
|
|||||
| Total current liabilities |
339,218 | 296,513 | ||||||
| Long-term borrowings, excluding current portion (Notes 4 and 13) |
1,379,971 | 1,398,132 | ||||||
| Deferred income tax liabilities (Note 15) |
216,470 | 211,820 | ||||||
| Obligations under capital leases, excluding current portion (Note 13) |
3,663 | 6,974 | ||||||
| Other long-term liabilities |
96,886 | 98,006 | ||||||
|
|
|
|
|
|||||
| Total liabilities |
2,036,208 | 2,011,445 | ||||||
|
|
|
|
|
|||||
| Redeemable noncontrolling interest in consolidated subsidiary |
23,410 | 22,492 | ||||||
|
|
|
|
|
|||||
| Commitments and contingencies (Note 16) |
||||||||
| Equity |
||||||||
| Shareholders’ equity: (Notes 18 ,19 ,20 and 21) |
||||||||
| Common stock — $0.10 par value. Authorized 600,000 shares; 202,769 and 202,775 issued as of 2015 and 2014, respectively; 182,781 and 184,939 outstanding as of 2015 and 2014, respectively |
20,277 | 20,278 | ||||||
| Additional paid-in capital |
241,891 | 171,270 | ||||||
| Accumulated other comprehensive income, net |
(33,544 | ) | (11,926 | ) | ||||
| Treasury stock, at cost (19,988 and 17,836 shares as of 2015 and 2014, respectively) |
(641,664 | ) | (453,230 | ) | ||||
| Retained earnings |
2,256,058 | 1,966,370 | ||||||
|
|
|
|
|
|||||
| Total shareholders’ equity |
1,843,018 | 1,692,762 | ||||||
|
|
|
|
|
|||||
| Noncontrolling interests in consolidated subsidiary |
5,664 | 6,882 | ||||||
|
|
|
|
|
|||||
| Total equity |
1,848,682 | 1,699,644 | ||||||
|
|
|
|
|
|||||
| Total liabilities and equity |
$ | 3,908,300 | 3,733,581 | |||||
|
|
|
|
|
|||||
See accompanying Notes to Consolidated Financial Statements
41
Consolidated Statements of Income
| Years Ended December 31, | ||||||||||||
| (in thousands, except per share data) | 2015 | 2014 | 2013 | |||||||||
| Total revenues (Notes 4 and 22) |
$ | 2,779,541 | 2,446,877 | 2,064,305 | ||||||||
|
|
|
|
|
|
|
|||||||
| Cost of services |
1,855,181 | 1,668,892 | 1,369,438 | |||||||||
| Selling, general and administrative expenses |
390,253 | 346,345 | 312,367 | |||||||||
|
|
|
|
|
|
|
|||||||
| Total operating expenses |
2,245,434 | 2,015,237 | 1,681,805 | |||||||||
|
|
|
|
|
|
|
|||||||
| Operating income |
534,107 | 431,640 | 382,500 | |||||||||
| Nonoperating expenses, net |
(37,219 | ) | (38,711 | ) | (30,024 | ) | ||||||
|
|
|
|
|
|
|
|||||||
| Income before income taxes and equity in income of equity investments |
496,888 | 392,929 | 352,476 | |||||||||
| Income taxes (Note 15) |
151,364 | 129,761 | 110,981 | |||||||||
|
|
|
|
|
|
|
|||||||
| Income before equity in income of equity investments |
345,524 | 263,168 | 241,495 | |||||||||
| Equity in income of equity investments, net of tax (Note 12) |
22,106 | 17,583 | 13,047 | |||||||||
|
|
|
|
|
|
|
|||||||
| Income from continuing operations, net of tax |
367,630 | 280,751 | 254,542 | |||||||||
| Income from discontinued operations, net of tax |
1,411 | 48,655 | 2,055 | |||||||||
|
|
|
|
|
|
|
|||||||
| Net income |
369,041 | 329,406 | 256,597 | |||||||||
| Net income attributable to noncontrolling interests |
(4,997 | ) | (6,534 | ) | (11,847 | ) | ||||||
|
|
|
|
|
|
|
|||||||
| Net income attributable to Total System Services, Inc. (TSYS) common shareholders |
$ | 364,044 | 322,872 | 244,750 | ||||||||
|
|
|
|
|
|
|
|||||||
| Basic earnings per share (EPS) attributable to TSYS common shareholders (Note 26) |
||||||||||||
| Income from continuing operations to TSYS common shareholders |
$ | 1.97 | 1.48 | 1.31 | ||||||||
| Gain (loss) from discontinued operations to TSYS common shareholders |
0.01 | 0.26 | (0.01 | ) | ||||||||
|
|
|
|
|
|
|
|||||||
| Net income attributable to TSYS common shareholders* |
$ | 1.98 | 1.73 | 1.30 | ||||||||
|
|
|
|
|
|
|
|||||||
| Diluted EPS attributable to TSYS common shareholders (Note 26) |
||||||||||||
| Income from continuing operations to TSYS common shareholders |
$ | 1.96 | 1.47 | 1.30 | ||||||||
| Gain (loss) from discontinued operations to TSYS common shareholders |
0.01 | 0.25 | (0.01 | ) | ||||||||
|
|
|
|
|
|
|
|||||||
| Net income attributable to TSYS common shareholders* |
$ | 1.97 | 1.72 | 1.29 | ||||||||
|
|
|
|
|
|
|
|||||||
| Amounts attributable to TSYS common shareholders: |
||||||||||||
| Income from continuing operations |
$ | 362,633 | 275,216 | 246,893 | ||||||||
| Gain (loss) from discontinued operations |
1,411 | 47,656 | (2,143 | ) | ||||||||
|
|
|
|
|
|
|
|||||||
| Net income |
$ | 364,044 | 322,872 | 244,750 | ||||||||
|
|
|
|
|
|
|
|||||||
| * | EPS amounts may not total due to rounding |
See accompanying Notes to Consolidated Financial Statements
42
Consolidated Statements of Comprehensive Income
| Years Ended December 31, | ||||||||||||
| (in thousands) | 2015 | 2014 | 2013 | |||||||||
| Net income |
$ | 369,041 | 329,406 | 256,597 | ||||||||
| Other comprehensive income (loss), net of tax: |
||||||||||||
| Foreign currency translation adjustments |
(21,719 | ) | (19,531 | ) | (4,081 | ) | ||||||
| Less reclassifications of foreign currency translation adjustments to net income |
— | 3,514 | — | |||||||||
|
|
|
|
|
|
|
|||||||
| Total foreign currency translation adjustments |
(21,719 | ) | (16,017 | ) | (4,081 | ) | ||||||
| Postretirement healthcare plan adjustments |
(1,567 | ) | 589 | 1,895 | ||||||||
| Unrealized gain (loss) on available-for-sale securities |
1,398 | (668 | ) | 1,773 | ||||||||
|
|
|
|
|
|
|
|||||||
| Other comprehensive loss |
(21,888 | ) | (16,096 | ) | (413 | ) | ||||||
|
|
|
|
|
|
|
|||||||
| Comprehensive income |
347,153 | 313,310 | 256,184 | |||||||||
| Comprehensive income attributable to noncontrolling interests |
(4,727 | ) | (6,113 | ) | (9,092 | ) | ||||||
|
|
|
|
|
|
|
|||||||
| Comprehensive income attributable to TSYS common shareholders |
$ | 342,426 | 307,197 | 247,092 | ||||||||
|
|
|
|
|
|
|
|||||||
See accompanying Notes to Consolidated Financial Statements
43
Consolidated Statements of Cash Flows
| Years Ended December 31, | ||||||||||||
| (in thousands) | 2015 | 2014 | 2013 | |||||||||
| Cash flows from operating activities: |
||||||||||||
| Net income |
$ | 369,041 | 329,406 | 256,597 | ||||||||
| Adjustments to reconcile net income to net cash provided by operating activities: |
||||||||||||
| Depreciation and amortization |
258,264 | 248,018 | 205,351 | |||||||||
| Share-based compensation |
41,549 | 30,790 | 28,933 | |||||||||
| Provisions for cardholder losses |
41,264 | 38,381 | 11,912 | |||||||||
| Dividends received from equity investments |
12,097 | 9,189 | 8,595 | |||||||||
| Charges for transaction processing provisions |
6,976 | 9,468 | 7,458 | |||||||||
| Provisions for bad debt expenses, billing adjustments and merchant losses |
4,495 | 2,823 | 2,000 | |||||||||
| Amortization of debt issuance costs |
1,841 | 1,817 | 7,269 | |||||||||
| Amortization of bond discount |
397 | 383 | 225 | |||||||||
| Loss on foreign currency |
388 | 999 | 1,027 | |||||||||
| Gain on disposals of equipment, net |
(397 | ) | (293 | ) | (79 | ) | ||||||
| Gain on disposal of subsidiaries |
(3,568 | ) | (86,961 | ) | — | |||||||
| Changes in value of private equity investments |
(4,038 | ) | (793 | ) | (966 | ) | ||||||
| Deferred income tax (benefit) expense |
(4,083 | ) | (8,963 | ) | 26,945 | |||||||
| Equity in income of equity investments |
(22,106 | ) | (17,583 | ) | (13,047 | ) | ||||||
| Excess tax benefit from share-based payment arrangements |
(24,357 | ) | (7,185 | ) | (3,528 | ) | ||||||
| Changes in operating assets and liabilities, net of effects of acquisition: |
||||||||||||
| Accounts receivable |
(39,218 | ) | (33,406 | ) | (8,667 | ) | ||||||
| Prepaid expenses, other current assets and other long-term assets |
(8,498 | ) | (10,525 | ) | (571 | ) | ||||||
| Accounts payable |
(3,987 | ) | 8,765 | (52,042 | ) | |||||||
| Accrued salaries and employee benefits |
29,168 | 414 | (403 | ) | ||||||||
| Other current liabilities and other long-term liabilities |
(55,034 | ) | 45,457 | (24,611 | ) | |||||||
|
|
|
|
|
|
|
|||||||
| Net cash provided by operating activities |
600,194 | 560,201 | 452,398 | |||||||||
|
|
|
|
|
|
|
|||||||
| Cash flows from investing activities: |
||||||||||||
| Additions to contract acquisition costs |
(58,728 | ) | (88,871 | ) | (55,965 | ) | ||||||
| Purchases of property and equipment |
(54,640 | ) | (75,913 | ) | (40,598 | ) | ||||||
| Additions to licensed computer software from vendors |
(50,729 | ) | (29,638 | ) | (63,635 | ) | ||||||
| Additions to internally developed computer software |
(39,219 | ) | (41,501 | ) | (33,600 | ) | ||||||
| Purchases of private equity investments |
(3,525 | ) | (3,291 | ) | (1,378 | ) | ||||||
| Cash used in acquisitions, net of cash acquired |
(750 | ) | (38,584 | ) | (1,314,660 | ) | ||||||
| Proceeds from insurance recovery for loss on disposal |
— | 6,212 | — | |||||||||
| Proceeds from sale of private equity investment |
1,839 | — | — | |||||||||
| Proceeds from dispositions, net of expenses paid and cash disposed |
3,568 | 44,979 | — | |||||||||
|
|
|
|
|
|
|
|||||||
| Net cash used in investing activities |
(202,184 | ) | (226,607 | ) | (1,509,836 | ) | ||||||
|
|
|
|
|
|
|
|||||||
| Cash flows from financing activities: |
||||||||||||
| Repurchases of common stock under plans and tax withholding |
(242,235 | ) | (170,516 | ) | (103,857 | ) | ||||||
| Dividends paid on common stock |
(73,677 | ) | (74,796 | ) | (56,510 | ) | ||||||
| Principal payments on long-term borrowings and capital lease obligations |
(54,719 | ) | (69,939 | ) | (166,805 | ) | ||||||
| Subsidiary dividends paid to noncontrolling shareholders |
(5,028 | ) | (7,172 | ) | (7,321 | ) | ||||||
| Purchase of noncontrolling interests |
— | (37,500 | ) | — | ||||||||
| Debt issuance costs |
— | — | (13,573 | ) | ||||||||
| Proceeds from long-term borrowings |
1,912 | 1,396 | 1,395,661 | |||||||||
| Excess tax benefit from share-based payment arrangements |
24,357 | 7,185 | 3,528 | |||||||||
| Proceeds from exercise of stock options |
58,636 | 34,869 | 40,691 | |||||||||
|
|
|
|
|
|
|
|||||||
| Net cash (used in) provided by financing activities |
(290,754 | ) | (316,473 | ) | 1,091,814 | |||||||
|
|
|
|
|
|
|
|||||||
| Cash and cash equivalents: |
||||||||||||
| Effect of exchange rate changes on cash and cash equivalents |
(7,111 | ) | (6,168 | ) | (3,758 | ) | ||||||
|
|
|
|
|
|
|
|||||||
| Net increase (decrease) in cash and cash equivalents |
100,145 | 10,953 | 30,618 | |||||||||
| Cash and cash equivalents at beginning of period |
289,183 | 278,230 | 247,612 | |||||||||
|
|
|
|
|
|
|
|||||||
| Cash and cash equivalents at end of period |
389,328 | 289,183 | 278,230 | |||||||||
| Less cash and cash equivalents of discontinued operations at end of period |
— | — | (30,530 | ) | ||||||||
|
|
|
|
|
|
|
|||||||
| Cash and cash equivalents of continued operations at end of period |
$ | 389,328 | 289,183 | 247,700 | ||||||||
|
|
|
|
|
|
|
|||||||
| Supplemental cash flow information: |
||||||||||||
| Interest paid |
$ | 40,425 | 40,969 | 23,157 | ||||||||
|
|
|
|
|
|
|
|||||||
| Income taxes paid, net |
$ | 171,455 | 135,770 | 80,033 | ||||||||
|
|
|
|
|
|
|
|||||||
See accompanying Notes to Consolidated Financial Statements
44
Consolidated Statements of Changes in Equity
| TSYS Shareholders | ||||||||||||||||||||||||||||||||||||
| Redeemable Noncontrolling Interests |
Common Stock | Additional Paid-In Capital |
Accumulated Other Comprehensive Income (Loss) |
Treasury Stock |
Retained Earnings |
Noncontrolling Interests |
Total Equity |
|||||||||||||||||||||||||||||
| (in thousands, except per share data) | Shares | Dollars | ||||||||||||||||||||||||||||||||||
| Balance as of December 31, 2012 |
$ | 39,505 | 202,471 | $ | 20,247 | 141,793 | 1,408 | (287,301 | ) | 1,549,063 | 19,725 | $ | 1,444,935 | |||||||||||||||||||||||
| Net income |
6,515 | — | — | — | — | — | 244,750 | 5,331 | 250,081 | |||||||||||||||||||||||||||
| Other comprehensive income (Note 21) |
— | — | — | — | 2,341 | — | — | (2,754 | ) | (413 | ) | |||||||||||||||||||||||||
| Replacement share-based awards issued in connection with acquisition (Note 19) |
— | — | — | (1,167 | ) | — | 16,723 | — | — | 15,556 | ||||||||||||||||||||||||||
| Common stock issued from treasury shares for exercise of stock options (Note 19) |
— | — | — | (700 | ) | — | 41,391 | — | — | 40,691 | ||||||||||||||||||||||||||
| Common stock issued for nonvested awards (Note 19) |
— | 319 | 32 | (32 | ) | — | — | — | — | — | ||||||||||||||||||||||||||
| Common stock issued from treasury shares for nonvested awards (Note 19) |
— | — | — | (5,747 | ) | — | 5,747 | — | — | — | ||||||||||||||||||||||||||
| Share-based compensation (Note 19) |
— | — | — | 28,972 | — | — | — | — | 28,972 | |||||||||||||||||||||||||||
| Common stock issued from treasury shares for dividend equivalents (Note 19) |
— | — | — | 36 | — | 301 | 161 | — | 498 | |||||||||||||||||||||||||||
| Cash dividends declared ($0.40 per share) |
— | — | — | — | — | — | (75,770 | ) | — | (75,770 | ) | |||||||||||||||||||||||||
| Purchase of treasury shares (Note 20) |
— | — | — | — | — | (103,857 | ) | — | — | (103,857 | ) | |||||||||||||||||||||||||
| Subsidiary dividends paid to noncontrolling interests |
(6,368 | ) | — | — | — | — | — | — | (953 | ) | (953 | ) | ||||||||||||||||||||||||
| Tax benefits associated with share-based compensation |
— | — | — | 2,686 | — | — | — | — | 2,686 | |||||||||||||||||||||||||||
|
|
|
|
|
|
|
|
|
|
|
|
|
|
|
|
|
|
|
|||||||||||||||||||
| Balance as of December 31, 2013 |
39,652 | 202,790 | 20,279 | 165,841 | 3,749 | (326,996 | ) | 1,718,204 | 21,349 | 1,602,426 | ||||||||||||||||||||||||||
| Net income |
4,650 | — | — | — | — | — | 322,872 | 1,884 | 324,756 | |||||||||||||||||||||||||||
| Other comprehensive income (Note 21) |
— | — | — | — | (15,675 | ) | — | — | (421 | ) | (16,096 | ) | ||||||||||||||||||||||||
| Common stock issued from treasury shares for exercise of stock options (Note 19) |
— | — | — | 1,955 | — | 32,914 | — | — | 34,869 | |||||||||||||||||||||||||||
| Common stock unissued due to forfeiture of nonvested awards |
— | (15 | ) | (1 | ) | 1 | — | — | — | — | — | |||||||||||||||||||||||||
| Common stock issued from treasury shares for nonvested awards (Note 19) |
— | — | — | (11,142 | ) | — | 11,142 | — | — | — | ||||||||||||||||||||||||||
| Share-based compensation (Note 19) |
— | — | — | 30,312 | — | — | — | — | 30,312 | |||||||||||||||||||||||||||
| Common stock issued from treasury shares for dividend equivalents (Note 19) |
— | — | — | 185 | — | 226 | — | — | 411 | |||||||||||||||||||||||||||
| Cash dividends declared ($0.40 per share) |
— | — | — | — | — | — | (74,706 | ) | — | (74,706 | ) | |||||||||||||||||||||||||
| Purchase of treasury shares (Note 20) |
— | — | — | — | — | (170,516 | ) | — | — | (170,516 | ) | |||||||||||||||||||||||||
| Subsidiary dividends paid to noncontrolling interests |
(6,732 | ) | — | — | — | — | — | — | (440 | ) | (440 | ) | ||||||||||||||||||||||||
| Fair value of noncontrolling interest |
(15,078 | ) | — | — | (22,422 | ) | — | — | — | — | (22,422 | ) | ||||||||||||||||||||||||
| Disposition of noncontrolling interest (Note 2) |
— | — | — | — | — | — | — | (15,490 | ) | (15,490 | ) | |||||||||||||||||||||||||
| Tax benefits associated with share-based compensation |
— | — | — | 6,540 | — | — | — | — | 6,540 | |||||||||||||||||||||||||||
|
|
|
|
|
|
|
|
|
|
|
|
|
|
|
|
|
|
|
|||||||||||||||||||
| Balance as of December 31, 2014 |
22,492 | 202,775 | 20,278 | 171,270 | (11,926 | ) | (453,230 | ) | 1,966,370 | 6,882 | 1,699,644 | |||||||||||||||||||||||||
| Net income |
5,945 | — | — | — | — | — | 364,044 | (948 | ) | 363,096 | ||||||||||||||||||||||||||
| Other comprehensive income (Note 21) |
— | — | — | — | (21,618 | ) | — | (270 | ) | (21,888 | ) | |||||||||||||||||||||||||
| Common stock issued from treasury shares for exercise of stock options (Note 19) |
— | — | — | 12,273 | — | 46,363 | — | — | 58,636 | |||||||||||||||||||||||||||
| Common stock unissued due to forfeiture of nonvested awards |
— | (6 | ) | (1 | ) | 702 | — | (701 | ) | — | — | — | ||||||||||||||||||||||||
| Common stock issued from treasury shares for nonvested awards (Note 19) |
— | — | — | (7,982 | ) | — | 7,982 | — | — | — | ||||||||||||||||||||||||||
| Share-based compensation (Note 19) |
— | — | — | 41,179 | — | — | — | — | 41,179 | |||||||||||||||||||||||||||
| Common stock issued from treasury shares for dividend equivalents (Note 19) |
— | — | — | 186 | — | 163 | — | — | 349 | |||||||||||||||||||||||||||
| Cash dividends declared ($0.40 per share) |
— | — | — | — | — | — | (74,356 | ) | — | (74,356 | ) | |||||||||||||||||||||||||
| Purchase of treasury shares (Note 20) |
— | — | — | 6 | — | (242,241 | ) | — | — | (242,235 | ) | |||||||||||||||||||||||||
| Subsidiary dividends paid to noncontrolling interests |
(5,027 | ) | — | — | — | — | — | — | — | — | ||||||||||||||||||||||||||
| Tax benefits associated with share-based compensation |
— | — | — | 24,257 | — | — | — | — | 24,257 | |||||||||||||||||||||||||||
|
|
|
|
|
|
|
|
|
|
|
|
|
|
|
|
|
|
|
|||||||||||||||||||
| Balance as of December 31, 2015 |
$ | 23,410 | 202,769 | $ | 20,277 | 241,891 | (33,544 | ) | (641,664 | ) | 2,256,058 | 5,664 | $ | 1,848,682 | ||||||||||||||||||||||
|
|
|
|
|
|
|
|
|
|
|
|
|
|
|
|
|
|
|
|||||||||||||||||||
See accompanying Notes to Consolidated Financial Statements
45
Notes to Consolidated Financial Statements
| Note 1: | Basis of Presentation and Summary of Significant Accounting Policies |
BUSINESS: Total System Services, Inc.’s (TSYS’ or the Company’s) revenues are derived from providing payment processing, merchant services and related payment services to financial and nonfinancial institutions, generally under long-term processing contracts. The Company also derives revenues by providing general-purpose reloadable (GPR) prepaid debit cards and payroll cards and alternative financial services to underbanked and other consumers. The Company’s services are provided through four operating segments: North America Services, International Services, Merchant Services and NetSpend.
Through the Company’s North America Services and International Services segments, TSYS processes information through its cardholder systems to financial and nonfinancial institutions throughout the United States and internationally. The Company’s North America Services segment provides these services to clients in the United States, Canada, Mexico and the Caribbean. The Company’s International Services segment provides services to clients in Europe, India, Middle East, Africa, Asia Pacific and Brazil. The Company’s Merchant Services segment provides merchant services to merchant acquirers and merchants mainly in the United States. The Company’s NetSpend segment provides services to consumers in the United States.
PRINCIPLES OF CONSOLIDATION AND BASIS OF PRESENTATION: The accompanying consolidated financial statements, which are prepared in accordance with generally accepted accounting principles (GAAP) include the accounts of TSYS and its wholly- and majority-owned subsidiaries. All significant intercompany accounts and transactions have been eliminated in consolidation. In addition, the Company evaluates its relationships with other entities to identify whether they are variable interest entities and to assess whether it is the primary beneficiary of such entities. If the determination is made that the Company is the primary beneficiary, then that entity is included in the consolidated financial statements.
RISKS AND UNCERTAINTIES AND USE OF ESTIMATES: Factors that could affect the Company’s future operating results and cause actual results to vary materially from expectations include, but are not limited to, lower than anticipated growth from existing clients, an inability to attract new clients and grow internationally, loss of a major customer or other significant client, loss of a major supplier, an inability to grow through acquisitions or successfully integrate acquisitions, an inability to control expenses, technology changes, the impact of the application of and/or changes in accounting principles, financial services consolidation, changes in regulatory requirements, a decline in the use of cards as a payment mechanism, disruption of the Company’s international operations, breach of the Company’s security systems, a decline in the financial stability of the Company’s clients and uncertain economic conditions. Negative developments in these or other risk factors could have a material adverse effect on the Company’s financial position, results of operations and cash flows.
The Company has prepared the accompanying consolidated financial statements in conformity with U.S. GAAP. The preparation of the consolidated financial statements requires management of the Company to make a number of estimates and assumptions relating to the reported amounts of assets and liabilities at the date of the consolidated financial statements and the reported amounts of revenues and expenses during the period. These estimates and assumptions are developed based upon all information available. Actual results could differ from estimated amounts.
ACQUISITIONS — PURCHASE PRICE ALLOCATION: TSYS’ purchase price allocation methodology requires the Company to make assumptions and to apply judgment to estimate the fair value of acquired assets and liabilities. TSYS estimates the fair value of assets and liabilities based upon appraised market values, the carrying value of the acquired assets and widely accepted valuation techniques, including discounted cash flows and market multiple analyses. Management determines the fair value of fixed assets and identifiable intangible assets such as developed technology or customer relationships, and any other significant assets or liabilities. TSYS adjusts the purchase price allocation, as necessary, up to one year after the acquisition closing date as TSYS obtains more information regarding asset valuations and liabilities assumed. Unanticipated events or circumstances may occur which could affect the accuracy of the Company’s fair value estimates, including assumptions regarding industry economic factors and business strategies, and result in an impairment or a new allocation of purchase price.
46
Given its history of acquisitions, TSYS may allocate part of the purchase price of future acquisitions to contingent consideration as required by GAAP for business combinations. The fair value calculation of contingent consideration will involve a number of assumptions that are subjective in nature and which may differ significantly from actual results. TSYS may experience volatility in its earnings to some degree in future reporting periods as a result of these fair value measurements.
CASH AND CASH EQUIVALENTS: Cash on hand and investments with a maturity of three months or less when purchased are considered to be cash equivalents.
ACCOUNTS RECEIVABLE: Accounts receivable balances are stated net of allowances for doubtful accounts, billing adjustments and merchant losses.
TSYS records an allowance for doubtful accounts when it is probable that the accounts receivable balance will not be collected. When estimating the allowance for doubtful accounts, the Company takes into consideration such factors as its day-to-day knowledge of the financial position of specific clients, the industry and size of its clients, the overall composition of its accounts receivable aging, prior history with specific customers of accounts receivable write-offs and prior experience of allowances in proportion to the overall receivable balance. This analysis includes an ongoing and continuous communication with its largest clients and those clients with past due balances. A financial decline of any one of the Company’s large clients could have a material adverse effect on collectability of receivables and thus the adequacy of the allowance for doubtful accounts.
Increases in the allowance for doubtful accounts are recorded as charges to bad debt expense and are reflected in selling, general and administrative expenses in the Company’s Consolidated Statements of Income. Write-offs of uncollectible accounts are charged against the allowance for doubtful accounts.
TSYS records an allowance for billing adjustments for actual and potential billing discrepancies. When estimating the allowance for billing adjustments, the Company considers its overall history of billing adjustments, as well as its history with specific clients and known disputes. Increases in the allowance for billing adjustments are recorded as a reduction of revenues in the Company’s Consolidated Statements of Income and actual adjustments to invoices are charged against the allowance for billing adjustments.
TSYS records a provision for merchant losses. When estimating the provision for merchant losses, the Company considers historical loss rates. Increases in the provision for merchant losses are charged to expense and are reflected in cost of services expenses in the Company’s Consolidated Statements of Income. Write-offs of uncollectible amounts are charged against the provision for merchant losses.
UP-FRONT DISTRIBUTOR PAYMENTS: The Company makes up-front contractual payments to third-party distribution partners. The Company assesses each up-front payment to determine whether it meets the criteria of an asset as defined by U.S. GAAP. If these criteria are met, the Company capitalizes the up-front payment and recognizes the capitalized amount as expense ratably over the benefit period, which is generally the contract period. If the contract requires the distributor to perform specific acts (i.e. achieve a sales goal) and no other conditions exist for the distributor to earn or retain the up-front payment, then the Company capitalizes the payment and recognizes it as an expense when the performance conditions have been met. Up-front distributor payments are classified on the Consolidated Balance Sheet as other non-current assets and recorded as a cost of services in the Consolidated Statements of Income.
PROPERTY AND EQUIPMENT: Property and equipment are stated at cost less accumulated depreciation and amortization. Depreciation and amortization are computed using the straight-line method over the estimated useful lives of the assets. Buildings and improvements are depreciated over estimated useful lives of 5-40 years, computer and other equipment over estimated useful lives of 2-5 years, and furniture and other equipment over estimated useful lives of 3-15 years. The Company evaluates impairment losses on long-lived assets used in operations in accordance with the provisions of GAAP. All ordinary repairs and maintenance costs are expensed as incurred. Maintenance costs that extend the asset life are capitalized and amortized over the remaining estimated life of the asset.
LICENSED COMPUTER SOFTWARE: The Company licenses software that is used in providing services to clients. Licensed software is obtained through perpetual licenses, term licenses, site licenses and through
47
agreements based on processing capacity. Perpetual and site licenses are amortized using the straight-line method over their estimated useful lives which range from three to ten years. Term licenses are amortized over the term of the agreement. Mainframe software that is licensed based on processing capacity is amortized using a units-of-production basis over the estimated useful life of the software, generally not to exceed ten years. At each balance sheet date, the Company evaluates impairment losses on long-lived assets used in operations in accordance with GAAP.
ACQUISITION TECHNOLOGY INTANGIBLES: These identifiable intangible assets are software technology assets resulting from acquisitions. These assets are amortized using the straight-line method over periods not exceeding their estimated useful lives, which range from five to nine years. GAAP requires that intangible assets with estimated useful lives be amortized over their respective estimated useful lives to their residual values, and reviewed for impairment. Acquisition technology intangibles’ net book values are included in computer software, net in the accompanying balance sheets. Amortization expenses are charged to cost of services in the Company’s Consolidated Statements of Income.
SOFTWARE DEVELOPMENT COSTS: Software development costs are capitalized once technological feasibility of the software product has been established. Costs incurred prior to establishing technological feasibility are expensed as incurred. Technological feasibility is established when the Company has completed a detailed program design and has determined that a product can be produced to meet its design specifications, including functions, features and technical performance requirements. Capitalization of costs ceases when the product is generally available to clients. At each balance sheet date, the Company evaluates the unamortized capitalized costs of software development as compared to the net realizable value of the software product which is determined by future undiscounted net cash flows. The amount by which the unamortized software development costs exceed the net realizable value is written off in the period that such determination is made. Software development costs are amortized using the straight-line method over its estimated useful life, which ranges from three to ten years.
The Company also develops software that is used internally. These software development costs are capitalized in accordance with GAAP. Internal-use software development costs are capitalized once: (1) the preliminary project stage is completed, (2) management authorizes and commits to funding a computer software project, and (3) it is probable that the project will be completed and the software will be used to perform the function intended. Costs incurred prior to meeting the qualifications are expensed as incurred. Capitalization of costs ceases when the project is substantially complete and ready for its intended use. Internal-use software development costs are amortized using the straight-line method over its estimated useful life which ranges from three to ten years.
Software development costs may become impaired in situations where development efforts are abandoned due to the viability of the planned project becoming doubtful or due to technological obsolescence of the planned software product.
CONTRACT ACQUISITION COSTS: The Company capitalizes contract acquisition costs related to signing or renewing long-term contracts and costs related to cash payments for rights to provide processing services. The Company capitalizes internal conversion costs in accordance with GAAP. All costs incurred prior to a signed agreement are expensed as incurred.
Contract acquisition costs are amortized using the straight-line method over the expected customer relationship (contract term) beginning when the client’s cardholder accounts are converted and producing revenues. The amortization of contract acquisition costs associated with cash payments for client incentives is included as a reduction of revenues in the Company’s Consolidated Statements of Income. The amortization of contract acquisition costs associated with conversion activity is recorded as cost of services in the Company’s Consolidated Statements of Income.
The Company evaluates the carrying value of contract acquisition costs associated with each customer for impairment on the basis of whether these costs are fully recoverable from either contractual minimum fees (contractual costs) or from expected undiscounted net operating cash flows of the related contract (cash incentives paid). The determination of expected undiscounted net operating cash flows requires management to make estimates. These costs may become impaired with the loss of a contract, the financial decline of a client, termination of conversion efforts after a contract is signed, diminished prospects for current clients or if the
48
Company’s actual results differ from its estimates of future cash flows. The amount of the impairment is written off in the period that such a determination is made.
EQUITY INVESTMENTS: TSYS’ 49% investment in Total System Services de México, S.A. de C.V. (TSYS de México), an electronic payment processing support operation located in Toluca, Mexico, is accounted for using the equity method of accounting, as is TSYS’ 44.56% investment in China UnionPay Data Co., Ltd. (CUP Data) headquartered in Shanghai, China. TSYS’ equity investments are recorded initially at cost and subsequently adjusted for equity in earnings, cash contributions and distributions, and foreign currency translation adjustments.
GOODWILL: Goodwill results from the excess of cost over the fair value of net assets of businesses acquired. Goodwill and intangible assets with indefinite useful lives are tested for impairment at least annually. Intangible assets with estimable useful lives are amortized over their respective estimated useful lives to their estimated residual values. Equity investment goodwill, which is not reported as goodwill in the Company’s Consolidated Balance Sheet, but is reported as a component of the equity investment, was $49.4 million as of December 31, 2015.
OTHER INTANGIBLE ASSETS: Identifiable intangible assets relate primarily to customer relationships, databases, channel relationships, covenants-not-to-compete, trade names and trade associations resulting from acquisitions. These identifiable intangible assets are amortized using the straight-line method over periods not exceeding the estimated useful lives, which range from three to ten years. Intangible assets with estimable useful lives are amortized over their respective estimated useful lives to their estimated residual values, and reviewed for impairment in accordance with GAAP. Amortization expenses are charged to selling, general and administrative expenses in the Company’s Consolidated Statements of Income.
FAIR VALUES OF FINANCIAL INSTRUMENTS: The Company uses financial instruments in the normal course of its business. The carrying values of cash equivalents, accounts receivable, accounts payable, accrued salaries and employee benefits, and other current liabilities approximate their fair value due to the short-term maturities of these assets and liabilities. The fair value of the Company’s long-term debt and obligations under capital leases is not significantly different from its carrying value.
Investments in equity investments are accounted for using the equity method of accounting and pertain to privately held companies for which fair value is not readily available. The Company believes the fair values of its investments in equity investments exceed their respective carrying values.
IMPAIRMENT OF LONG-LIVED ASSETS: The Company reviews long-lived assets, such as property and equipment and intangibles subject to amortization, including contract acquisition costs and certain computer software, for impairment whenever events or changes in circumstances indicate that the carrying amount of an asset may not be recoverable. Recoverability of assets to be held and used is measured by a comparison of the carrying amount of an asset to estimated undiscounted future cash flows expected to be generated by the asset. If upon a triggering event the Company determines that the carrying amount of an asset exceeds its estimated undiscounted future cash flows, an impairment charge is recognized by the amount by which the carrying amount of the asset exceeds the fair value of the asset. Assets to be disposed of would be separately presented in the balance sheet and reported at the lower of the carrying amount or fair value less costs to sell, and would no longer be depreciated. The assets and liabilities of a disposed group classified as held for sale would be presented separately in the appropriate asset and liability sections of the balance sheet.
TRANSACTION PROCESSING PROVISIONS: The Company has recorded an accrual for contract contingencies (performance penalties) and processing errors. A significant number of the Company’s contracts with large clients contain service level agreements which can result in TSYS incurring performance penalties if contractually required service levels are not met. When providing for these accruals, the Company takes into consideration such factors as the prior history of performance penalties and processing errors incurred, actual contractual penalties inherent in the Company’s contracts, progress towards milestones and known processing errors not covered by insurance. As of December 31, 2015, the Company had transaction processing provision of $6.5 million. These accruals are included in other current liabilities in the accompanying Consolidated Balance Sheets. Increases and decreases in transaction processing provisions are charged to cost of services in the Company’s Consolidated Statements of Income, and payments or credits for performance penalties and processing errors are charged against the accrual.
49
PROVISION FOR CARDHOLDER LOSSES: The Company is exposed to losses due to cardholder fraud, payment defaults and other forms of cardholder activity as well as losses due to non-performance of third parties who receive cardholder funds for transmittal to the Issuing Banks (banks that issue MasterCard International or Visa USA, Inc. branded cards to customers). The Company establishes a reserve for the losses it estimates will arise from processing customer transactions, debit card overdrafts, chargebacks for unauthorized card use and merchant-related chargebacks due to non-delivery of goods and services. These reserves are established based upon historical loss and recovery rates and cardholder activity for which specific losses can be identified. The provision for cardholder losses was approximately $9.4 million as of December 31, 2015. The charges to provisions for cardholder losses are included in cost of services in the Consolidated Statements of Income. The Company regularly updates its reserve estimate as new facts become known and events occur that may impact the settlement or recovery of losses.
PROVISION FOR MERCHANT LOSSES: The Company has potential liability for losses resulting from disputes between a cardholder and a merchant that arise as a result of, among other things, the cardholder’s dissatisfaction with merchandise quality or merchant services. Such disputes may not be resolved in the merchant’s favor. In these cases, the transaction is “charged back” to the merchant, which means the purchase price is refunded to the customer by the card-issuing bank and charged to the merchant. If the merchant is unable to fund the refund, TSYS must do so. TSYS also bears the risk of reject losses arising from the fact that TSYS collects fees from its merchants on the first day after the monthly billing period. If the merchant has gone out of business during such period, TSYS may be unable to collect such fees. TSYS maintains cash deposits or requires the pledge of a letter of credit from certain merchants, generally those with higher average transaction size where the card is not present when the charge is made or the product or service is delivered after the charge is made, in order to offset potential contingent liabilities such as chargebacks and reject losses that would arise if the merchant went out of business. Most chargeback and reject losses are charged to cost of services as they are incurred. However, the Company also maintains a provision against losses, including major fraud losses, which are both less predictable and involve larger amounts. The loss provision was established using historical loss rates, applied to recent bankcard processing volume. As of December 31, 2015, the Company had a merchant loss provision in the amount of $1.3 million.
REDEEMABLE NONCONTROLLING INTEREST: In connection with the acquisition of Central Payment Co., LLC (CPAY), the Company is party to call and put arrangements with respect to the membership units that represent the remaining noncontrolling interest of CPAY. The call arrangement is exercisable by TSYS and the put arrangement is exercisable by the seller. The put arrangement is outside the control of the Company by requiring the Company to purchase the seller’s entire equity interest in CPAY at a put price at fair value. The put arrangement is recorded on the balance sheet and is classified as redeemable noncontrolling interest outside of permanent equity.
FOREIGN CURRENCY TRANSLATION: The Company maintains several different foreign operations whose functional currency is their local currency. Foreign currency financial statements of the Company’s Mexican and Chinese equity investments, the Company’s wholly-owned subsidiaries and the Company’s majority-owned subsidiaries, as well as the Company’s division and branches in the United Kingdom and China, are translated into U.S. dollars at current exchange rates, except for revenues, costs and expenses, and net income which are translated at the average exchange rates for each reporting period. Net gains or losses resulting from the currency translation of assets and liabilities of the Company’s foreign operations, net of tax when applicable, are accumulated in a separate section of shareholders’ equity titled accumulated other comprehensive income (loss). Gains and losses on transactions denominated in currencies other than the functional currencies are included in determining net income for the period in which exchange rates change.
TREASURY STOCK: The Company uses the cost method when it purchases its own common stock as treasury shares or issues treasury stock upon option exercises and displays treasury stock as a reduction of shareholders’ equity.
REVENUE RECOGNITION: Revenue is recognized when it is realized or realizable and earned, which is deemed to occur when all of the following criteria are met: (1) persuasive evidence of an arrangement exists; (2) delivery has occurred or services have been performed; (3) the seller’s price to the buyer is fixed or determinable; and (4) collectability is reasonably assured. The Company accrues for rights of refund, processing errors or penalties, or other related allowances based on historical experience.
50
The Company’s North America and International Services revenues are derived from long-term processing contracts with financial and nonfinancial institutions and are generally recognized as the services are performed. Payment processing services revenues are generated primarily from charges based on the number of accounts on file, transactions and authorizations processed, statements mailed, cards embossed and mailed and other processing services for cardholder accounts on file. Most of these contracts have prescribed annual revenue minimums, penalties for early termination, and service level agreements which may impact contractual fees if certain service levels are not achieved.
Revenue is recognized as the services are performed, primarily on a per unit basis. Processing contracts generally range from three to ten years in length. When providing payment processing services, the Company frequently enters into customer arrangements to provide multiple services that may also include conversion or implementation services, business process outsourcing services such as call center services, web-based services, and other payment processing-related services. Revenue for these services is generally recognized as they are performed on a per unit basis each month or ratably over the term of the contract.
The Company’s Merchant Services revenues are partially derived from relationships with thousands of individual merchants. Additionally, part of the revenues are derived from long-term processing contracts with large financial institutions, other merchant acquirers and merchant organizations which generally range from three to eight years and provide for penalties for early termination. Merchant services revenue is generated primarily from processing all payment forms including credit, debit, electronic benefits transfer and check truncation for merchants of all sizes across a wide array of retail market segments. The products and services offered include authorization and capture of electronic transactions, clearing and settlement of electronic transactions, information reporting services related to electronic transactions, merchant billing services, and point-of-sale terminal services. Revenue is recognized for merchant services as those services are performed, primarily measured on a per unit basis. When providing merchant processing services, the Company frequently enters into customer arrangements to provide multiple services that may also include conversion or implementation services, business process outsourcing services such as call center services, terminal services, and other merchant processing-related services. Revenue for these services is generally recognized as they are performed on a per unit basis each month or ratably over the term of the contract. Revenues on point-of-sale terminal equipment are recognized upon the transfer of ownership and shipment of product.
When a sale involves multiple deliverables, revenue recognition is affected by the determination of the number of deliverables in an arrangement, whether those deliverables may be separated into multiple units of accounting, and the standalone selling price of each unit of accounting which affects the amount of revenue allocated to each unit. Pursuant to Accounting Standards Codification (ASC) 605 ”Revenue Recognition,” the Company uses vendor-specific objective evidence of the standalone selling price (VSOE) of its services when it exists to determine the amount of revenue to allocate to each unit of accounting. The Company establishes VSOE using the price charged when the same service is sold separately (on a standalone basis). In certain situations, the Company does not have sufficient VSOE. In these situations, TSYS considers whether sufficient third party evidence (TPE) of standalone selling price exists for the Company’s services. However, the Company typically is not able to determine TPE and has not used this measure of selling price due to the unique and proprietary nature of some of its services and the inability to reliably verify relevant standalone third party prices. When there is insufficient evidence of VSOE and TPE, the Company has made its best estimate of the standalone selling price (ESP) of that service for purposes of allocating revenue to each unit of accounting. When determining ESP, TSYS uses limited standalone sales data that do not meet the Company’s criteria to establish VSOE, management pricing strategies, residual selling price data when VSOE exists for a group of elements, the cost of providing the services and the related margin objectives. Consideration is also given to geographies in which the services are sold or delivered, customer classifications, and market conditions including competitor pricing strategies and benchmarking studies. Revenue is recognized when the revenue recognition criteria for each unit of accounting have been met.
As business and service offerings change in the future, the determination of the number of deliverables in an arrangement and related units of accounting and the future pricing practices may result in changes in the estimates of VSOE and ESP, which may change the ratio of fees allocated to each service or unit of accounting in a given customer arrangement. There were no material changes or impact to revenue for current contractual arrangements in the year ended December 31, 2015 due to any changes in the determination of the number of deliverables in an arrangement, units of accounting, or estimates of VSOE or ESP.
51
In many situations, the Company enters into arrangements with customers to provide conversion or implementation services in addition to processing services where the conversion or implementation services do not have standalone value. For these arrangements, conversion or implementation services that do not have standalone value, are recognized over the expected customer relationship (contract term) as the related processing services are performed.
The Company’s other services generally have standalone value and constitute separate units of accounting for revenue recognition purposes. Customer arrangements entered into prior to 2011 (prior to the adoption of Accounting Standards Update (ASU) 2009-13 “Multiple-Deliverable Revenue Arrangements,” an update to ASC Topic 605 “Revenue Recognition,” and formerly known as EITF 08-1, “Revenue Arrangements with Multiple Deliverables”) often included services for which sufficient objective and reliable evidence of fair value did not exist. In these situations, the deliverables were combined and recognized as a single unit of accounting based on the proportional performance for the combined unit. For pre-2011 arrangements that have not expired, have not been materially modified or amended, or terminated, the Company continues to recognize revenue in accordance with these policies in the accompanying financial statements. Beginning in 2011, services in new or materially modified arrangements of this nature were divided into separate units of accounting and revenue is now allocated to each unit of accounting based on the relative selling price method as disclosed above. As the services in the pre-2011 arrangements are generally delivered over the same term with consistent patterns of performance, there is no material difference in the timing or pattern of revenue recognition for each group of arrangements (pre-2011 arrangements and those new or materially modified thereafter).
The Company’s multiple element arrangements may include one or more elements that are subject to other topics including software revenue recognition and leasing guidance. The consideration for these multiple element arrangements is allocated to each group of deliverables — those subject to ASC 605-25 and those subject to other topics based on the revised guidance in ASU 2009-13. Arrangement revenue for each group of deliverables is then further separated, allocated, and recognized based on applicable guidance.
The Company’s NetSpend revenues principally consist of a portion of the service fees and interchange revenues received by the Issuing Banks in connection with the programs NetSpend manages. Revenue is recognized when there is persuasive evidence of an arrangement, the relevant services have been rendered, the price is fixed or determinable and collectability is reasonably assured.
Cardholders are charged fees in connection with NetSpend’s products and services as follows:
| • | Transactions — Cardholders are typically charged a fee for each PIN and signature-based purchase transaction made using their GPR cards, unless the cardholder is on a monthly or annual service plan, in which case the cardholder is instead charged a monthly or annual subscription fee, as applicable. Cardholders are also charged fees for ATM withdrawals and other transactions conducted at ATMs. |
| • | Customer Service and Maintenance — Cardholders are typically charged fees for balance inquiries made through NetSpend’s call centers. Cardholders are also charged a monthly maintenance fee after a specified period of inactivity. |
| • | Additional Products and Services — Cardholders are charged fees associated with additional products and services offered in connection with certain GPR cards, including the use of overdraft features, a variety of bill payment options, custom card designs and card-to-card transfers of funds initiated through the call centers. |
| • | Other — Cardholders are charged fees in connection with the acquisition and reloading of the GPR cards at retailers and the Company receives a portion of these amounts in some cases. |
Revenue resulting from the service fees charged to the cardholders described above is recognized when the fees are charged because the earnings process is substantially complete, except for revenue resulting from the initial activation of cards and annual subscription fees. Revenue resulting from the initial activation of cards is recognized ratably, net of commissions paid to distributors, over the average account life, which is approximately six months for GPR cards. Revenue resulting from annual subscription fees is recognized ratably over the annual period to which the fees relate.
Revenues also include fees charged in connection with program management and processing services the Company provides for private-label programs. Revenue resulting from these fees is recognized when the company has fulfilled its obligations under the underlying service agreements.
52
NetSpend derives revenue from a portion of the interchange fees remitted by merchants when cardholders make purchases using their GPR cards. Subject to applicable law, interchange fees are fixed by the card associations and network organizations (Networks). Interchange revenue is recognized net of sponsorship, licensing and processing fees charged by the Networks for services they provide in processing purchase transactions routed through them. Interchange revenue is recognized during the period that the purchase transactions occur. Also included in interchange revenue are fees earned from branding agreements with the Networks.
In regards to taxes assessed by a governmental authority imposed directly on a revenue producing transaction, the Company reports its revenues on a net basis.
REIMBURSABLE ITEMS: Reimbursable items consist of out-of-pocket expenses which are reimbursed by the Company’s clients. These expenses consist primarily of postage, access fees and third party software services.
SHARE-BASED COMPENSATION: GAAP establishes standards for the accounting for transactions in which an entity exchanges its equity instruments for goods or services. It also addresses transactions in which an entity incurs liabilities in exchange for goods or services that are based on the fair value of the entity’s equity instruments or that may be settled by the issuance of those equity instruments. A public entity must measure the cost of employee services received in exchange for an award of equity instruments based on the grant-date fair value of the award (with limited exceptions). That cost will be recognized over the period during which an employee is required to provide service in exchange for the award.
The Company estimates forfeitures when recognizing compensation cost. The estimate of forfeitures will be adjusted by the Company as actual forfeitures differ from its estimates, resulting in compensation cost only for those awards that actually vest. The effect of the change in estimated forfeitures is recognized as compensation costs in the period the change in estimate occurred. In estimating its forfeiture rate, the Company stratified its data based upon historical experience to determine separate forfeiture rates for the different award grants. The Company currently estimates a forfeiture rate for existing stock option grants to TSYS non-executive employees, and other TSYS share-based awards. Currently, TSYS estimates a forfeiture rate in the range of 0% to 8%.
The Company has issued its vested awards to directors and nonvested awards to certain employees. The market value of the common stock at the date of issuance is recognized as compensation expense immediately for vested awards and over the vesting period of the nonvested awards. For nonvested award grants that have pro rata vesting, the Company recognizes compensation expense using the straight-line method over the vesting period of the award.
LEASES: The Company is obligated under noncancelable leases for computer equipment, software and facilities. As these leases expire, they will be evaluated and renewed or replaced by similar leases based on need. A lease is an agreement conveying the right to use property, software or equipment (land and/or depreciable assets) usually for a stated period of time. For purposes of applying the accounting and reporting standards, leases are classified from the standpoint of the lessee as capital or operating leases.
Rental payments on operating leases are charged to expense over the lease term. If rental payments are not made on a straight-line basis, rental expense nevertheless shall be recognized on a straight-line basis unless another systematic and rational basis is more representative of the time pattern in which use benefit is derived from the leased property, in which case that basis shall be used.
Certain of the Company’s operating leases are for office space. The Company will make various alterations (leasehold improvements) to the office space and capitalize these costs as part of property and equipment. Leasehold improvements are amortized on a straight-line basis over the useful life of the improvement or the term of the lease, whichever is shorter.
ADVERTISING: Advertising costs are expensed as incurred or the first time the advertising takes place except for direct-response advertising and television advertising production costs. Direct-response advertising consists of commission paid to affiliate marketers for the new funded customer accounts generated by them. Direct-response advertising costs are capitalized and amortized over the average life of the new accounts, which is approximately one year. Television advertising production costs consist of the costs of developing and filming
53
television ads. Television advertising production costs are capitalized when the production services are received and expensed in the period when the advertising first takes place. Advertising expense for 2015, 2014 and 2013 was $9.6 million, $5.7 million and $1.3 million, respectively.
INCOME TAXES: Income taxes reflected in TSYS’ consolidated financial statements are computed based on the taxable income of TSYS and its affiliated subsidiaries. A consolidated U.S. federal income tax return is filed for TSYS and its majority-owned U.S. subsidiaries. Additionally, income tax returns are also filed in states where TSYS and its subsidiaries have filing obligations and in foreign jurisdictions where TSYS has a foreign affiliate.
The Company accounts for income taxes in accordance with the asset and liability method. Deferred income tax assets and liabilities are recognized for the future tax consequences attributable to differences between the financial statement carrying amounts of existing assets and liabilities and their respective tax basis and operating loss and tax credit carry forwards. Deferred tax assets and liabilities are measured using enacted tax rates expected to apply to taxable income in the years in which those temporary differences are expected to be recovered or settled. Reserves against the carrying value of a deferred tax asset are established when necessary to reflect the decreased likelihood of realization of a deferred asset in the future. The effect on deferred income tax assets and liabilities of a change in tax rates is recognized in income in the period that includes the enactment date.
Income tax provisions require the use of management judgments, which are subject to challenge by various taxing authorities. Contingency reserves are periodically established where the amount of the contingency can be reasonably determined and is likely to occur. Reductions in contingency reserves are recognized when tax disputes are settled or examination periods lapse.
Significant estimates used in accounting for income taxes relate to the determination of taxable income, the determination of temporary differences between book and tax basis, as well as estimates on the realizability of tax credits and net operating losses.
TSYS recognizes potential interest and penalties related to the underpayment of income taxes as income tax expense in the Consolidated Statements of Income.
NONCONTROLLING INTEREST: Noncontrolling interests in earnings of subsidiaries represents the minority shareholders’ share of the net income or loss of TSYS Managed Services EMEA Limited (EMEA) and CPAY. The noncontrolling interests in the Consolidated Balance Sheet reflects the original investment by these shareholders in EMEA and CPAY, their proportional share of the earnings or losses and their proportional share of net gains or losses resulting from the currency translation of assets and liabilities of EMEA and CPAY.
EARNINGS PER SHARE: Unvested share-based payment awards that contain nonforfeitable rights to dividends or dividend equivalents are “participating securities” as defined by GAAP, and therefore should be included in EPS using the two-class method.
The two-class method is an earnings allocation method for computing EPS when an entity’s capital structure includes two or more classes of common stock or common stock and participating securities. It determines EPS based on dividends declared on common stock and participating securities and participation rights of participating securities in any undistributed earnings.
Basic EPS is calculated by dividing net income by the weighted average number of common shares outstanding during the period. Diluted EPS is calculated to reflect the potential dilution that would occur if stock options or other contracts to issue common stock were exercised. Diluted EPS is calculated by dividing net income by weighted average common and common equivalent shares outstanding. Common equivalent shares are calculated using the treasury stock method.
RECLASSIFICATIONS: Certain reclassifications have been made to the 2014 and 2013 financial statements to conform to the presentation adopted in 2015.
54
Recent Accounting Pronouncements
In November 2015, the Financial Accounting Standards Board (FASB) issued ASU 2015-17 “Income Taxes (Topic 740), Balance Sheet Classification of Deferred Taxes,” which requires the classification of all deferred tax assets and liabilities as noncurrent on the balance sheet instead of separating deferred taxes into current and noncurrent amounts. Also, companies will no longer allocate valuation allowances between current and noncurrent deferred tax assets because those allowances also will be classified as noncurrent. The guidance is effective for public business entities for annual and interim periods in fiscal years beginning after December 15, 2016. Early adoption is permitted. Companies can adopt the guidance either prospectively or retrospectively. The Company does not expect the adoption of this ASU to have a material impact on the Company’s financial position, results of operations or cash flows.
In April 2015, the FASB issued ASU 2015-03 “Interest — Imputation of Interest (Subtopic 835-30), Simplifying the Presentation of Debt Issuance Cost.” The amendments in this update will require entities to present debt issuance costs in the balance sheet as a direct deduction from the carrying amount of the corresponding debt liability, consistent with debt discounts. The guidance is effective for annual periods and interim periods within those annual periods beginning after December 15, 2015. Early adoption is permitted. The guidance will be applied retrospectively. The Company does not expect the adoption of this guidance to have a material impact on the Company’s financial position, results of operations or cash flows.
In May 2014, the FASB issued ASU 2014-09 “Revenue from Contracts with Customers,” which requires an entity to recognize the amount of revenue to which it expects to be entitled for the transfer of promised goods or services to customers. The ASU will replace most existing revenue recognition guidance in U.S. GAAP when it becomes effective. The new standard is effective for the Company on January 1, 2018. Early application is not permitted. The standard permits the use of either the retrospective or cumulative effect transition method. The Company is evaluating the effect that ASU 2014-09 will have on its consolidated financial statements and related disclosures. The Company has not yet selected a transition method nor has it determined the effect on its ongoing financial reporting.
| Note 2 | Discontinued Operations |
In accordance with GAAP, the Company determined its Japan-based businesses became discontinued operations in the first quarter of 2014.
The Company sold all of its stock of GP Network Corporation (GP Net) (representing 54% ownership of the company) and all of its stock of TSYS Japan Godo Kaisha (TSYS Japan) (representing 100% ownership of the company) in April 2014. Both entities were part of the International Services segment. The sale of the Company’s stock in both of its operations in Japan was the result of management’s decision during the first quarter of 2014 to divest non-strategic businesses and focus resources on core products and services. In 2014, the Company had a gain of $48.6 million, net of tax, related to the sales of its operations in Japan. In 2015, the Company recorded an additional gain of $1.4 million, net of tax, related to the return of cash that was placed in escrow during closing and tax adjustments associated with the transaction.
GP Net and TSYS Japan were not significant components of TSYS’ consolidated results.
The following table presents the main classes of assets and liabilities held for sale as of December 31, 2014:
| (in thousands) | 2014 | |||
| Total assets |
$ | 4,003 | ||
| Total liabilities |
4,003 | |||
55
The following table presents the summarized results of discontinued operations for the years ended December 31, 2015, 2014 and 2013:
| (in thousands) | 2015 | 2014 | 2013 | |||||||||
| Total revenues |
$ | — | $ | 16,376 | 68,048 | |||||||
|
|
|
|
|
|
|
|||||||
| Income before taxes |
$ | — | $ | 1 | 3,443 | |||||||
|
|
|
|
|
|
|
|||||||
| Income tax (benefit) expense |
$ | — | $ | (39 | ) | 1,388 | ||||||
|
|
|
|
|
|
|
|||||||
| Income from operating activities of discontinued operations, net of tax |
$ | — | $ | 40 | 2,055 | |||||||
|
|
|
|
|
|
|
|||||||
| Gain on dispositions, net of tax |
$ | 1,411 | $ | 48,615 | — | |||||||
|
|
|
|
|
|
|
|||||||
| Income from discontinued operations, net of tax |
$ | 1,411 | $ | 48,655 | 2,055 | |||||||
|
|
|
|
|
|
|
|||||||
| Income from discontinued operations, net of tax, attributable to noncontrolling interest |
$ | — | $ | 999 | 4,198 | |||||||
|
|
|
|
|
|
|
|||||||
| Income (loss) from discontinued operations, net of tax, attributable to TSYS common shareholders |
$ | 1,411 | $ | 47,656 | (2,143 | ) | ||||||
|
|
|
|
|
|
|
|||||||
| Interest allocated to discontinued operations1 |
$ | — | $ | — | 281 | |||||||
|
|
|
|
|
|
|
|||||||
| 1 | Interest expense relates to borrowings directly for use by Japan-based operations. |
| Note 3 | Fair Value Measurement |
GAAP requires disclosure about how fair value is determined for assets and liabilities and establishes a hierarchy for which these assets and liabilities must be grouped, based on significant level of inputs. The three-tier fair value hierarchy, which prioritizes the inputs used in the valuation methodologies, is as follows:
Level 1 — Quoted prices for identical assets and liabilities in active markets.
Level 2 — Observable inputs other than quoted prices included in Level 1, such as quoted prices for similar assets and liabilities in active markets, quoted prices for identical or similar assets and liabilities in markets that are not active, or other inputs that are observable or can be corroborated by observable market data.
Level 3 — Unobservable inputs for the asset or liability.
The Company had no transfers between Level 1, Level 2, or Level 3 during the years ended December 31, 2015, 2014 or 2013. Goodwill is assessed annually for impairment in the second quarter of each year using fair value measurement techniques. Specifically, goodwill impairment is determined using a two-step test. The first step of the goodwill impairment test is used to identify potential impairment by comparing the fair value of a reporting unit (RU) with its book value, including goodwill. If the fair value of the RU exceeds its book value, goodwill is considered not impaired and the second step of the impairment test is unnecessary. If the book value of the RU exceeds its fair value, the second step of the goodwill impairment test is performed to measure the amount of impairment loss, if any. The second step of the goodwill impairment test compares the implied fair value of the RU’s goodwill with the book value of that goodwill. If the book value of the RU’s goodwill exceeds the implied fair value of that goodwill, an impairment loss is recognized in an amount equal to that excess. The fair value of the RU is allocated to all of the assets and liabilities of that unit as if the RU had been acquired in a business combination and the fair value of the RU was the purchase price paid to acquire the RU.
The estimate of fair value of the Company’s RUs is determined using various valuation techniques, including using an equally weighted combination of the market approach and the income approach. The market approach, which contains Level 2 inputs, utilizes readily available market valuation multiples to estimate fair value. The income approach is a valuation technique that utilizes the discounted cash flow (DCF) method, which includes Level 3 inputs. Under the DCF method, the fair value of the RU reflects the present value of the projected earnings that will be generated by each RU after taking into account the revenues and expenses associated with the asset, the relative risk that the cash flows will occur, the contribution of other assets, and an appropriate discount rate to reflect the value of the invested capital. Cash flows are estimated for future periods based upon historical data and projections by management.
56
As of December 31, 2015, the Company had recorded goodwill in the amount of $1.5 billion. The Company performed its annual impairment test of its goodwill balances as of May 31, 2015, and this test did not indicate any impairment. The fair value of the RUs substantially exceeds the carrying value. Refer to Note 7 for more information regarding goodwill.
The fair value of the Company’s long-term debt and obligations under capital leases is not significantly different from its carrying value.
| Note 4 | Relationships with Affiliated Companies |
TSYS has a note payable to Merchants Limited, which has a noncontrolling interest in EMEA. Refer to Note 13 for more information regarding this loan.
The Company provides miscellaneous services to Merchants Limited and to the Company’s equity investments, TSYS de México and CUP Data.
The foregoing related party arrangements and services are performed under contracts that are similar to its contracts with unrelated third party customers. The Company believes the terms and conditions of transactions between the Company and these related parties are comparable to those which could have been obtained in transactions with unaffiliated parties.
Through its related party transactions, TSYS generates accounts receivable and liability accounts with TSYS de México and CUP Data.
The Company had the following balances with related parties as of December 31, 2015 and 2014:
| (in thousands) | 2015 | 2014 | ||||||
| Accounts receivable |
$ | 19 | $ | 19 | ||||
| Account payable |
3,278 | 4,329 | ||||||
The table below details revenues and expenses derived from affiliated companies for the years ended December 31, 2015, 2014 and 2013:
| (in thousands) | 2015 | 2014 | 2013 | |||||||||
| Total revenues: |
||||||||||||
| CUP Data |
$ | 116 | 232 | 229 | ||||||||
| TSYS de México |
85 | 78 | 68 | |||||||||
|
|
|
|
|
|
|
|||||||
| Total revenues |
$ | 201 | 310 | 297 | ||||||||
|
|
|
|
|
|
|
|||||||
| Total operating expenses: |
||||||||||||
| Merchants Limited |
$ | 4,202 | 9,842 | 5,739 | ||||||||
| TSYS de México |
148 | 148 | 148 | |||||||||
|
|
|
|
|
|
|
|||||||
| Total operating expenses |
$ | 4,350 | 9,990 | 5,887 | ||||||||
|
|
|
|
|
|
|
|||||||
| Nonoperating expenses paid to Merchants Limited |
$ | 42 | — | — | ||||||||
|
|
|
|
|
|
|
|||||||
57
| Note 5 | Cash and Cash Equivalents |
Cash and cash equivalent balances as of December 31, 2015 and 2014 are summarized as follows:
| (in thousands) | 2015 | 2014 | ||||||
| Cash and cash equivalents in domestic accounts |
$ | 307,578 | 225,396 | |||||
| Cash and cash equivalents in foreign accounts |
81,750 | 63,787 | ||||||
|
|
|
|
|
|||||
| Total |
$ | 389,328 | 289,183 | |||||
|
|
|
|
|
|||||
The Company maintains operating accounts outside the United States denominated in currencies other than the U.S. dollar. All amounts in domestic accounts are denominated in U.S. dollars.
| NOTE 6 | Prepaid Expenses and Other Current Assets |
Significant components of prepaid expenses and other current assets as of December 31, 2015 and 2014 are summarized as follows:
| (in thousands) | 2015 | 2014 | ||||||
| Prepaid expenses |
$ | 37,961 | 35,334 | |||||
| Supplies inventory |
15,114 | 14,340 | ||||||
| Income taxes receivable |
51,322 | 259 | ||||||
| Other |
49,802 | 49,041 | ||||||
|
|
|
|
|
|||||
| Total |
$ | 154,199 | 98,974 | |||||
|
|
|
|
|
|||||
| NOTE 7 | Goodwill |
In 2013, the Company allocated $1.0 billion to goodwill due to the acquisition of NetSpend. In 2014, the Company adjusted the NetSpend purchase price allocation to add an additional $8.5 million for settlement of the dissenting shareholder lawsuit and adjustments to deferred taxes. In 2015, the Company adjusted the NetSpend goodwill allocation to include an additional $627,000 for an adjustment to a sales and use tax reserve associated with the acquisition.
The gross amount and accumulated impairment losses of goodwill as of December 31, 2015 and 2014 are as follows:
| 2015 | ||||||||||||||||||||
| (in thousands) | North America Services |
International Services |
Merchant Services |
NetSpend | Consolidated | |||||||||||||||
| Gross amount |
$ | 70,796 | 29,081 | 415,973 | 1,033,586 | $ | 1,549,436 | |||||||||||||
| Accumulated impairment losses |
(182 | ) | (1,605 | ) | (2,225 | ) | — | (4,012 | ) | |||||||||||
|
|
|
|
|
|
|
|
|
|
|
|||||||||||
| Goodwill, net |
$ | 70,614 | 27,476 | 413,748 | 1,033,586 | $ | 1,545,424 | |||||||||||||
|
|
|
|
|
|
|
|
|
|
|
|||||||||||
| 2014 | ||||||||||||||||||||
| North America Services |
International Services |
Merchant Services |
NetSpend | Consolidated | ||||||||||||||||
| Gross amount |
$ | 70,796 | 31,681 | 415,973 | 1,032,959 | $ | 1,551,409 | |||||||||||||
| Accumulated impairment losses |
(182 | ) | (1,605 | ) | (2,225 | ) | — | (4,012 | ) | |||||||||||
|
|
|
|
|
|
|
|
|
|
|
|||||||||||
| Goodwill, net |
$ | 70,614 | 30,076 | 413,748 | 1,032,959 | $ | 1,547,397 | |||||||||||||
|
|
|
|
|
|
|
|
|
|
|
|||||||||||
58
The changes in the carrying amount of goodwill as of December 31, 2015 and 2014 are as follows:
| (in thousands) | North America Services |
International Services |
Merchant Services |
NetSpend | Consolidated | |||||||||||||||
| Balance as of December 31, 2013 |
$ | 70,796 | 34,201 | 413,748 | 1,024,434 | $ | 1,543,179 | |||||||||||||
| Disposal of GP Net |
(182 | ) | (1,605 | ) | — | — | (1,787 | ) | ||||||||||||
| NetSpend purchase price allocation |
— | — | — | 8,525 | 8,525 | |||||||||||||||
| Currency translation adjustments |
— | (2,520 | ) | — | — | (2,520 | ) | |||||||||||||
|
|
|
|
|
|
|
|
|
|
|
|||||||||||
| Balance as of December 31, 2014 |
$ | 70,614 | 30,076 | 413,748 | 1,032,959 | $ | 1,547,397 | |||||||||||||
| NetSpend tax adjustment |
— | — | — | 627 | 627 | |||||||||||||||
| Currency translation adjustments |
— | (2,600 | ) | — | — | (2,600 | ) | |||||||||||||
|
|
|
|
|
|
|
|
|
|
|
|||||||||||
| Balance as of December 31, 2015 |
$ | 70,614 | $ | 27,476 | $ | 413,748 | $ | 1,033,586 | $ | 1,545,424 | ||||||||||
|
|
|
|
|
|
|
|
|
|
|
|||||||||||
Refer to Note 24 for more information on acquisitions.
| Note 8 | Other Intangible Assets, net |
In 2015, the changes related to other gross intangible assets were related to foreign currency translation and an acquisition of an acquisition technology intangible asset. Refer to Note 24 for more information on acquisitions.
Significant components of other intangible assets as of December 31, 2015 and 2014 are summarized as follows:
| 2015 | ||||||||||||
| (in thousands) | Gross | Accumulated Amortization |
Net | |||||||||
| Channel relationships |
$ | 318,600 | (99,909 | ) | $ | 218,691 | ||||||
| Customer relationships |
166,579 | (104,736 | ) | 61,843 | ||||||||
| Trade name |
46,422 | (24,422 | ) | 22,000 | ||||||||
| Database |
28,000 | (14,000 | ) | 14,000 | ||||||||
| Covenants-not-to-compete |
14,940 | (7,834 | ) | 7,106 | ||||||||
| Trade association |
10,000 | (5,750 | ) | 4,250 | ||||||||
| Favorable lease |
875 | (445 | ) | 430 | ||||||||
|
|
|
|
|
|
|
|||||||
| Total |
$ | 585,416 | (257,096 | ) | $ | 328,320 | ||||||
|
|
|
|
|
|
|
|||||||
| 2014 | ||||||||||||
| (in thousands) | Gross | Accumulated Amortization |
Net | |||||||||
| Channel relationships |
$ | 318,600 | (60,079 | ) | $ | 258,521 | ||||||
| Customer relationships |
167,140 | (87,201 | ) | 79,939 | ||||||||
| Trade name |
46,480 | (15,680 | ) | 30,800 | ||||||||
| Database |
28,000 | (8,400 | ) | 19,600 | ||||||||
| Covenants-not-to-compete |
14,940 | (5,551 | ) | 9,389 | ||||||||
| Trade association |
10,000 | (4,750 | ) | 5,250 | ||||||||
| Favorable lease |
875 | (267 | ) | 608 | ||||||||
|
|
|
|
|
|
|
|||||||
| Total |
$ | 586,035 | (181,928 | ) | $ | 404,107 | ||||||
|
|
|
|
|
|
|
|||||||
Amortization related to other intangible assets, which is recorded in selling, general and administrative expenses, was $75.8 million, $77.3 million and $50.0 million for 2015, 2014 and 2013, respectively.
59
The weighted average useful life for each component of other intangible assets, and in total, as of December 31, 2015 is as follows:
| Weighted Average Amortization Period (Yrs) |
||||
| Channel relationships |
8.0 | |||
| Customer relationships |
8.2 | |||
| Trade name |
4.9 | |||
| Database |
5.0 | |||
| Covenants-not-to-compete |
5.3 | |||
| Trade association |
10.0 | |||
| Favorable Lease |
4.9 | |||
|
|
|
|||
| Total |
7.6 | |||
|
|
|
|||
Estimated future amortization expense of other intangible assets as of December 31, 2015 for the next five years is:
| (in thousands) | ||||
| 2016 |
$ | 75,213 | ||
| 2017 |
74,823 | |||
| 2018 |
60,166 | |||
| 2019 |
47,870 | |||
| 2020 |
43,711 | |||
| Note 9 | Computer Software, net |
Computer software as of December 31, 2015 and 2014 is summarized as follows:
| (in thousands) | 2015 | 2014 | ||||||
| Licensed computer software |
$ | 513,443 | 435,701 | |||||
| Software development costs |
404,238 | 376,026 | ||||||
| Acquisition technology intangibles |
167,971 | 167,687 | ||||||
|
|
|
|
|
|||||
| Total computer software |
1,085,652 | 979,414 | ||||||
|
|
|
|
|
|||||
| Less accumulated amortization: |
||||||||
| Licensed computer software |
282,563 | 243,866 | ||||||
| Software development costs |
287,863 | 275,512 | ||||||
| Acquisition technology intangibles |
110,156 | 93,888 | ||||||
|
|
|
|
|
|||||
| Total accumulated amortization |
680,582 | 613,266 | ||||||
|
|
|
|
|
|||||
| Computer software, net |
$ | 405,070 | 366,148 | |||||
|
|
|
|
|
|||||
The Company held the following computer software under capital lease as of December 31, 2015 and 2014:
| (in thousands) | 2015 | 2014 | ||||||
| Licensed computer software |
$ | 18,206 | 17,625 | |||||
| Less accumulated amortization |
(8,175 | ) | (4,816 | ) | ||||
|
|
|
|
|
|||||
| Licensed computer software, net |
$ | 10,031 | 12,809 | |||||
|
|
|
|
|
|||||
60
Amortization expense includes amounts for computer software acquired under capital lease. The Company had the following amortization expense related to computer software for the years ended December 31, 2015, 2014 and 2013:
| (in thousands) | 2015 | 2014 | 2013 | |||||||||
| Amortization expense related to: |
||||||||||||
| Licensed computer software |
$ | 41,823 | 36,775 | 33,511 | ||||||||
| Software development costs |
22,740 | 25,248 | 21,430 | |||||||||
| Acquisition technology intangibles |
16,734 | 19,683 | 15,855 | |||||||||
The weighted average useful life for each component of computer software, and in total, as of December 31, 2015, is as follows:
| Weighted Average Amortization Period (Yrs) |
||||
| Licensed computer software |
5.4 | |||
| Software development costs |
6.1 | |||
| Acquisition technology intangibles |
6.8 | |||
|
|
|
|||
| Total |
5.9 | |||
|
|
|
|||
Estimated future amortization expense of licensed computer software, software development costs and acquisition technology intangibles as of December 31, 2015 for the next five years is:
| (in thousands) | Licensed Computer Software |
Software Development Costs |
Acquisition Technology Intangibles |
|||||||||
| 2016 |
$ | 36,207 | 27,312 | 15,352 | ||||||||
| 2017 |
31,034 | 21,608 | 13,868 | |||||||||
| 2018 |
25,345 | 16,041 | 11,393 | |||||||||
| 2019 |
13,617 | 9,916 | 11,393 | |||||||||
| 2020 |
8,899 | 7,343 | 5,734 | |||||||||
| Note 10 | Property and Equipment, net |
Property and equipment balances as of December 31, 2015 and 2014 are as follows:
| (in thousands) | 2015 | 2014 | ||||||
| Computer equipment |
$ | 346,387 | 317,862 | |||||
| Buildings and improvements |
244,938 | 243,211 | ||||||
| Furniture and other equipment |
138,727 | 135,741 | ||||||
| Land |
16,577 | 16,763 | ||||||
| Other |
597 | 204 | ||||||
|
|
|
|
|
|||||
| Total property and equipment |
747,226 | 713,781 | ||||||
| Less accumulated depreciation and amortization |
457,328 | 423,196 | ||||||
|
|
|
|
|
|||||
| Property and equipment, net |
$ | 289,898 | 290,585 | |||||
|
|
|
|
|
|||||
61
The Company has various types of equipment under capital lease arrangements. The Company has the following amounts of equipment under capital lease obligations as of December 31, 2015 and 2014:
| (in thousands) | 2015 | 2014 | ||||||
| Computer equipment |
$ | 55,450 | 49,118 | |||||
| Furniture and other equipment |
5,374 | 5,374 | ||||||
|
|
|
|
|
|||||
| Total equipment |
60,824 | 54,492 | ||||||
|
|
|
|
|
|||||
| Less accumulated depreciation: |
||||||||
| Computer and other equipment |
(36,134 | ) | (29,816 | ) | ||||
| Furniture and other equipment |
(2,731 | ) | (1,666 | ) | ||||
|
|
|
|
|
|||||
| Total accumulated depreciation |
(38,865 | ) | (31,482 | ) | ||||
|
|
|
|
|
|||||
| Total equipment, net |
$ | 21,959 | 23,010 | |||||
|
|
|
|
|
|||||
Depreciation and amortization expense includes amounts for computer equipment, furniture and other equipment acquired under capital lease. Depreciation and amortization expense related to property and equipment was $56.6 million, $53.5 million and $45.5 million for the years ended December 31, 2015, 2014 and 2013, respectively.
| Note 11 | Contract Acquisition Costs, net |
Significant components of contract acquisition costs as of December 31, 2015 and 2014 are summarized as follows:
| (in thousands) | 2015 | 2014 | ||||||
| Conversion costs, net |
$ | 159,000 | 159,339 | |||||
| Payments for processing rights, net |
88,811 | 76,966 | ||||||
|
|
|
|
|
|||||
| Total |
$ | 247,811 | 236,305 | |||||
|
|
|
|
|
|||||
Amortization expense related to contract acquisition cost for the years ended December 31, 2015, 2014 and 2013 are as follows:
| (in thousands) | 2015 | 2014 | 2013 | |||||||||
| Amortization expense related to: |
||||||||||||
| Conversion costs |
$ | 27,392 | 17,816 | 19,515 | ||||||||
| Payments for processing rights |
17,039 | 16,209 | 13,099 | |||||||||
The weighted average useful life for each component of contract acquisition costs, and in total, as of December 31, 2015 is as follows:
| Weighted Average Amortization Period (Yrs) |
||||
| Payments for processing rights |
14.7 | |||
| Conversion costs |
12.3 | |||
|
|
|
|||
| Total |
13.3 | |||
|
|
|
|||
62
Estimated future amortization expense of conversion costs and payments for processing rights as of December 31, 2015 for the next five years is:
| (in thousands) | Conversion Costs |
Payments for Processing Rights |
||||||
| 2016 |
$ | 32,122 | 17,394 | |||||
| 2017 |
29,148 | 15,978 | ||||||
| 2018 |
25,656 | 14,561 | ||||||
| 2019 |
21,149 | 12,277 | ||||||
| 2020 |
17,800 | 10,167 | ||||||
| Note 12 | Equity Investments |
The Company has an equity investment in TSYS de México and records its 49% ownership using the equity method of accounting. The operation prints statements and provides card-issuing support services to the equity investment clients and others.
The Company has an equity investment in CUP Data and records its 44.56% ownership using the equity method of accounting. CUP Data is sanctioned by the People’s Bank of China, China’s central bank, and has become one of the world’s largest and fastest-growing payments networks. CUP Data currently provides transaction processing, disaster recovery and other services for banks and bankcard issuers in China.
TSYS’ equity investments are recorded initially at cost and subsequently adjusted for equity in earnings, cash contributions and distributions, and foreign currency translation adjustments. TSYS believes the carrying value approximates the underlying assets of the equity investments.
TSYS’ equity in income of equity investments (net of tax) for the years ended December 31, 2015, 2014 and 2013 was $22.1 million, $17.6 million and $13.0 million, respectively.
A summary of TSYS’ equity investments as of December 31, 2015 and 2014 is as follows:
| (in thousands) | 2015 | 2014 | ||||||
| CUP Data |
$ | 98,518 | 92,738 | |||||
| TSYS de México |
7,600 | 7,730 | ||||||
|
|
|
|
|
|||||
| Total |
$ | 106,118 | 100,468 | |||||
|
|
|
|
|
|||||
63
| Note 13 | Long-term Borrowings and Capital Lease Obligations |
Long-term debt as of December 31, 2015 and 2014 consists of:
| (in thousands) | 2015 | 2014 | ||||||
| 2.375% Senior Notes due June 1, 2018 (5 year tranche), net of discount |
$ | 549,919 | 549,889 | |||||
| 3.75% Senior Notes due June 1, 2023 (10 year tranche), net of discount |
546,746 | 546,379 | ||||||
| LIBOR + 1.125%, unsecured term loan, due April 8, 2018, with quarterly principal and interest payments |
175,000 | 185,000 | ||||||
| LIBOR + 1.125%, unsecured term loan, due September 10, 2017, with quarterly principal and interest payments |
120,000 | 131,250 | ||||||
| 1.38% note payable due January 31, 2017, with monthly interest and principal payments |
30,000 | — | ||||||
| 1.50% note payable, due September 30, 2016, with monthly interest and principal payments |
5,132 | 11,886 | ||||||
| LIBOR + 2.0%, unsecured term loan, due December 7, 2017, with monthly interest payments and principal paid at maturity |
3,202 | 1,396 | ||||||
| 1.50% note payable, due January 31, 2016, with monthly interest and principal payments |
336 | 4,332 | ||||||
| 1.50% note payable, due December 31, 2015, with monthly interest and principal payments |
— | 10,075 | ||||||
| 1.50% note payable, due July 31, 2015, with monthly interest and principal payments |
— | 1,709 | ||||||
|
|
|
|
|
|||||
| Total debt |
1,430,335 | 1,441,916 | ||||||
| Less current portion |
50,364 | 43,784 | ||||||
|
|
|
|
|
|||||
| Noncurrent portion of long-term debt |
$ | 1,379,971 | 1,398,132 | |||||
|
|
|
|
|
|||||
During December 2014, EMEA obtained a £900,000, or approximately $1.4 million term loan. In September 2015, TSYS increased the loan by £1.3 million, or approximately $1.9 million. The loan bears interest at a rate of LIBOR plus two percent. The loan matures in December 2017, and has monthly interest payments. The lender in this transaction is Merchants Limited, who has a noncontrolling interest in EMEA. The balance as of December 31, 2015 was $3.2 million.
In December 2015, the Company entered into a $30.0 million financing agreement for perpetual software licenses. The balance as of December 31, 2015 was $30.0 million.
In September 2014, the Company entered into a $13.6 million financing agreement for perpetual software licenses. The balance as of December 31, 2015 was $5.1 million.
In December 2013, the Company entered into a $20.0 million financing arrangement to purchase additional software licenses. The financing arrangement was repaid in 2015.
TSYS acquired additional mainframe software licenses to increase capacity in 2012. The Company entered into an $8.6 million and an $11.9 million financing agreement in June and December of 2012, respectively, to purchase these additional software licenses. The balance as of December 31, 2015 for the $11.9 million financing agreement was $0.3 million. The $8.6 million financing agreement was repaid in 2015.
In addition, TSYS maintains an unsecured credit agreement with Columbus Bank and Trust. The credit agreement has a maximum available principal balance of $5.0 million, with interest at prime. TSYS did not use the credit facility during 2015, 2014 or 2013.
Acquisition-Related Borrowings
In April 2013, the Company entered into a Credit Agreement (the “Credit Agreement”) with JPMorgan Chase Bank, N.A., as Administrative Agent, The Bank of Tokyo-Mitsubishi UFJ, Ltd., as Syndication Agent, Regions Bank
64
and U.S. Bank National Association, as Documentation Agents, and other lenders party thereto, with J.P. Morgan Securities LLC, The Bank of Tokyo Mitsubishi UFJ, Ltd., Regions Capital Markets, and U.S. Bank National Association as joint lead arrangers and joint bookrunners. The Credit Agreement provides for a five-year term loan to the Company in the amount of $200.0 million (the “Term Loan”) and bears interest at LIBOR plus 1.125%, which are subject to adjustment based on changes in the Company’s credit ratings, with margins ranging from 1.00% to 1.75%. As of December 31, 2015, the outstanding balance on the Credit Agreement was $175.0 million.
Concurrently with entering into the Merger Agreement, TSYS obtained commitments for a $1.2 billion 364-day bridge term loan facility from JPMorgan Chase Bank, N.A., J.P. Morgan Securities LLC and The Bank of Tokyo-Mitsubishi UFJ, Ltd. Thereafter, JPMorgan Chase Bank, N.A. and The Bank of Tokyo-Mitsubishi UFJ, Ltd. assigned portions of their commitments to other bridge facility lenders. The Company paid fees in 2013 associated with the bridge term loan of approximately $5.9 million. The total commitments under the bridge term loan facility were eliminated in May 2013 after the issuance of the Notes described below.
In May 2013, the Company closed its issuance (the “Transaction”) of $550.0 million aggregate principal amount of 2.375% Senior Notes due 2018 and $550.0 million aggregate principal amount of 3.750% Senior Notes due 2023 (collectively, the “Notes”) pursuant to an Underwriting Agreement with J.P. Morgan Securities LLC, as representative of certain underwriters (the “Underwriters”), whereby the Company agreed to sell and the Underwriters agreed to purchase the Notes from the Company, subject to and upon the terms and conditions set forth in the Underwriting Agreement. The interest on the Notes are payable semiannually. The Company paid fees in 2013 associated with the issuance of these Notes of approximately $8.9 million and recorded discounts of approximately $4.3 million that are being amortized over the life of the Notes. The Company used the net proceeds of the Transaction to pay a portion of the $1.4 billion purchase price of the Company’s acquisition of NetSpend and related fees and expenses. The Notes were issued pursuant to an Indenture dated as of May 22, 2013 between the Company and Wells Fargo Bank, National Association, as trustee. The balance as of December 31, 2015 was $549.9 million net of discount for the Senior Notes due June 2018 and $546.7 million net of discount for the Senior Notes due June 2023.
The Notes also contain various affirmative and negative covenants, including those that create limitations on the Company’s:
| • | creation of liens; |
| • | merging or selling assets unless certain conditions are met; and |
| • | entering into sale/leaseback transactions. |
The Notes also contain a provision that requires the Company to repurchase all or any portion of a holder’s Notes, at the holder’s option, if a Change in Control Repurchase Event occurs.
Amendment to Existing Credit Agreement
In September 2012, the Company entered into a credit agreement with JPMorgan Chase Bank, N.A., as Administrative Agent, The Bank of Tokyo-Mitsubishi UFJ, Ltd., Regions Bank and U.S. Bank National Association, as Syndication Agents, and the other lenders named therein, with J.P. Morgan Securities LLC, The Bank of Tokyo-Mitsubishi UFJ, Ltd., Regions Capital Markets and U.S. Bank National Association, as joint lead arrangers and joint bookrunners (the “Existing Credit Agreement”). The Existing Credit Agreement provides for a $350.0 million five-year unsecured revolving credit facility (which may be increased by up to an additional $350.0 million under certain circumstances) and includes a $50.0 million subfacility for the issuance of standby letters of credit and a $50.0 million subfacility for swingline loans. The Existing Credit Agreement also provides for a $150 million five-year unsecured term loan, which was fully funded on the closing of the Existing Credit Agreement. As of December 31, 2015, the outstanding balance on the Existing Credit Agreement was $120.0 million.
In April 2013, the Company entered into the First Amendment to the Existing Credit Agreement (the “Revolver”) in order to conform certain provisions of the Existing Credit Agreement to the Credit Agreement for the Term Loan. On July 1, 2013, an additional $100.0 million was used as funding in the NetSpend Merger. As of December 31, 2015, there was no outstanding balance on the Revolver.
65
The Credit Agreement for the aforementioned loan provided for a $168.0 million unsecured five-year term loan to the Company, which was repaid in 2012 and a $252.0 million five year unsecured revolving credit facility. The principal balance of loans outstanding under the credit facility bears interest at a rate of LIBOR plus an applicable margin of 0.60%. The applicable margin could vary within a range from 0.27% to 0.725% depending on changes in the Company’s corporate credit rating. Interest was paid on the last date of each interest period; however, if the period exceeded three months, interest was paid every three months after the beginning of such interest period. In addition, the Company paid each lender a fee in respect of the amount of such lender’s commitment under the revolving credit facility (regardless of usage), ranging from 0.08% to 0.15% depending on the Company’s corporate credit rating.
The Company was able to prepay the revolving credit facility and the term loan in whole or in part at any time without premium or penalty, subject to reimbursement of the lenders’ customary breakage and redeployment costs in the case of prepayment of LIBOR borrowings. The Credit Agreement included covenants requiring the Company to maintain certain minimum financial ratios. The Company did not use the revolving credit facility in 2015.
Required annual principal payments on long-term debt for the five years subsequent to December 31, 2015 are summarized as follows:
| (in thousands) | ||||
| 2016 |
$ | 50,364 | ||
| 2017 |
143,305 | |||
| 2018 |
690,000 | |||
| 2019 |
— | |||
| 2020 |
— | |||
Capital lease obligations as of December 31, 2015 and 2014 consist of:
| (in thousands) | 2015 | 2014 | ||||||
| Capital lease obligations |
$ | 7,131 | 14,101 | |||||
| Less current portion |
3,468 | 7,127 | ||||||
|
|
|
|
|
|||||
| Noncurrent portion of capital leases |
$ | 3,663 | 6,974 | |||||
|
|
|
|
|
|||||
The Company acquires various computer equipment, software, machinery and equipment and furniture and fixtures under capital lease obligations. Refer to Notes 9, 10 and 23 for more information. The capital lease obligations have various payment terms for each capital lease obligation, including single payment leases, monthly, quarterly and annually. The lease terms for the equipment and software range from one to six years.
The future minimum lease payments under capital leases as of December 31, 2015 are summarized as follows:
| (in thousands) | ||||
| 2016 |
$ | 3,611 | ||
| 2017 |
2,687 | |||
| 2018 |
1,001 | |||
| 2019 |
63 | |||
| 2020 |
— | |||
|
|
|
|||
| Total minimum lease payments |
7,362 | |||
| Less amount representing interest |
(231 | ) | ||
|
|
|
|||
| Principal minimum lease payments |
$ | 7,131 | ||
|
|
|
|||
66
| Note 14 | Other Current Liabilities |
Significant components of other current liabilities as of December 31, 2015 and 2014 are summarized as follows:
| (in thousands) | 2015 | 2014 | ||||||
| Deferred revenues |
$ | 39,863 | 41,773 | |||||
| Accrued expenses |
26,017 | 23,617 | ||||||
| Dividends payable |
19,367 | 19,006 | ||||||
| Other |
81,332 | 70,409 | ||||||
|
|
|
|
|
|||||
| Total |
$ | 166,579 | 154,805 | |||||
|
|
|
|
|
|||||
| Note 15 | Income Taxes |
The provision for income taxes includes income taxes currently payable and those deferred because of temporary differences between the financial statement carrying amounts and tax bases of assets and liabilities.
The components of income tax expense included in the Consolidated Statements of Income were as follows:
| Years Ended December 31, | ||||||||||||
| (in thousands) | 2015 | 2014 | 2013 | |||||||||
| Current income tax expense: |
||||||||||||
| Federal |
$ | 139,228 | 126,203 | 74,327 | ||||||||
| State |
9,255 | 5,161 | 2,949 | |||||||||
| Foreign |
4,762 | 7,694 | 6,822 | |||||||||
|
|
|
|
|
|
|
|||||||
| Total current income tax expense |
153,245 | 139,058 | 84,098 | |||||||||
|
|
|
|
|
|
|
|||||||
| Deferred income tax expense (benefit): |
||||||||||||
| Federal |
(2,198 | ) | (3,623 | ) | 27,447 | |||||||
| State |
442 | (2,039 | ) | (55 | ) | |||||||
| Foreign |
(125 | ) | (3,635 | ) | (509 | ) | ||||||
|
|
|
|
|
|
|
|||||||
| Total deferred income tax expense (benefit) |
(1,881 | ) | (9,297 | ) | 26,883 | |||||||
|
|
|
|
|
|
|
|||||||
| Total income tax expense |
$ | 151,364 | 129,761 | 110,981 | ||||||||
|
|
|
|
|
|
|
|||||||
| Years Ended December 31, | ||||||||||||
| (in thousands) | 2015 | 2014 | 2013 | |||||||||
| Components of income before income tax expense: |
||||||||||||
| Domestic |
$ | 488,515 | 369,888 | 328,052 | ||||||||
| Foreign |
8,373 | 23,041 | 24,424 | |||||||||
|
|
|
|
|
|
|
|||||||
| Total income before income tax expense |
$ | 496,888 | 392,929 | 352,476 | ||||||||
|
|
|
|
|
|
|
|||||||
67
Income tax expense differed from the amounts computed by applying the statutory U.S. federal income tax rate of 35% to income before income taxes, noncontrolling interest and equity in income of equity investments as a result of the following:
| Years Ended December 31, | ||||||||||||
| (in thousands) | 2015 | 2014 | 2013 | |||||||||
| Computed “expected” income tax expense |
$ | 173,911 | 137,525 | 123,367 | ||||||||
| Increase (decrease) in income tax expense resulting from: |
||||||||||||
| International tax rate differential and equity income |
8,367 | 6,541 | 1,870 | |||||||||
| State income tax expense, net of federal income tax effect |
7,101 | 4,823 | 3,408 | |||||||||
| Increase (decrease) in valuation allowance |
(517 | ) | (4,550 | ) | 1,715 | |||||||
| Tax credits |
(28,831 | ) | (3,459 | ) | (6,141 | ) | ||||||
| Deduction for domestic production activities |
(11,550 | ) | (8,750 | ) | (8,225 | ) | ||||||
| Permanent differences and other, net |
2,883 | (2,369 | ) | (5,013 | ) | |||||||
|
|
|
|
|
|
|
|||||||
| Total income tax expense |
$ | 151,364 | 129,761 | 110,981 | ||||||||
|
|
|
|
|
|
|
|||||||
Temporary differences between the financial statement carrying amounts and tax bases of assets and liabilities that give rise to significant portions of the net deferred tax liability as of December 31, 2015 and 2014 relate to the following:
| As of December 31, | ||||||||
| (in thousands) | 2015 | 2014 | ||||||
| Deferred income tax assets: |
||||||||
| Net operating loss and income tax credit carryforwards |
$ | 29,522 | 31,978 | |||||
| Allowances for doubtful accounts and billing adjustments |
1,399 | 1,328 | ||||||
| Deferred revenue |
31,713 | 31,240 | ||||||
| Share-based compensation |
22,088 | 24,449 | ||||||
| Other, net |
34,673 | 24,743 | ||||||
|
|
|
|
|
|||||
| Total deferred income tax assets |
119,395 | 113,738 | ||||||
| Less valuation allowance for deferred income tax assets |
(18,446 | ) | (18,963 | ) | ||||
|
|
|
|
|
|||||
| Net deferred income tax assets |
100,949 | 94,775 | ||||||
|
|
|
|
|
|||||
| Deferred income tax liabilities: |
||||||||
| Excess tax over financial statement depreciation |
(61,161 | ) | (53,527 | ) | ||||
| Computer software development costs |
(82,835 | ) | (67,703 | ) | ||||
| Purchase accounting adjustments |
(114,171 | ) | (136,701 | ) | ||||
| Foreign currency translation |
(4,522 | ) | (7,642 | ) | ||||
| Other, net |
(24,462 | ) | (18,830 | ) | ||||
|
|
|
|
|
|||||
| Total deferred income tax liabilities |
(287,151 | ) | (284,403 | ) | ||||
|
|
|
|
|
|||||
| Net deferred income tax liabilities |
$ | (186,202 | ) | (189,628 | ) | |||
|
|
|
|
|
|||||
| Total net deferred tax assets (liabilities): |
||||||||
| Current |
$ | 24,670 | 15,190 | |||||
| Noncurrent |
(210,872 | ) | (204,818 | ) | ||||
|
|
|
|
|
|||||
| Net deferred income tax liability |
$ | (186,202 | ) | (189,628 | ) | |||
|
|
|
|
|
|||||
As of December 31, 2015, TSYS had recognized deferred tax assets from net operating losses and federal and state income tax credit carryforwards of $4.5 million and $25.0 million, respectively. As of December 31, 2014, TSYS had recognized deferred tax assets from net operating losses and federal and state income tax credit carryforwards of $5.9 million and $26.1 million, respectively
In assessing the realizability of deferred income tax assets, management considers whether it is more likely than not that some portion or all of the deferred income tax assets will not be realized. The ultimate realization of
68
deferred income tax assets is dependent upon the generation of future taxable income during the periods in which those temporary differences become deductible. Management considers the scheduled reversal of deferred tax liabilities, projected future taxable income and tax planning strategies in making this assessment.
Management believes it is more likely than not that TSYS will realize the benefits of these deductible differences, net of existing valuation allowances. The valuation allowance for deferred tax assets was $18.4 million and $19.0 million at December 31, 2015 and 2014, respectively. The decrease in the valuation allowance for deferred income tax assets was $0.5 million for 2015. The decrease relates to foreign and state losses which, more likely than not, will not be realized in later years.
TSYS has adopted the permanent reinvestment exception under GAAP, with respect to future earnings of certain foreign subsidiaries. As a result, TSYS considers foreign earnings related to these foreign operations to be permanently reinvested. No provision for U.S. federal and state incomes taxes has been made in the consolidated financial statements for those non-U.S. subsidiaries whose earnings are considered to be reinvested. The amount of undistributed earnings considered to be “reinvested” which may be subject to tax upon distribution was approximately $83.9 million as of December 31, 2015. Although TSYS does not intend to repatriate these earnings, a distribution of these non-U.S. earnings in the form of dividends, or otherwise, would subject the Company to both U.S. federal and state income taxes, as adjusted for non-U.S. tax credits, and withholding taxes payable to the various non-U.S. countries. Determination of the amount of any unrecognized deferred income tax liability on these undistributed earnings is not practicable.
TSYS is the parent of an affiliated group that files a consolidated U.S. federal income tax return and most state and foreign income tax returns on a separate entity basis. In the normal course of business, the Company is subject to examinations by these taxing authorities unless statutory examination periods lapse. TSYS is no longer subject to U.S. federal income tax examinations for years before 2011 and with few exceptions, the Company is no longer subject to income tax examinations from state and local or foreign tax authorities for years before 2005. There are currently federal income tax examinations in progress for the years 2009 through 2012 for a subsidiary which was acquired in 2013. Additionally, a number of tax examinations are in progress by the relevant state tax authorities. Although TSYS is unable to determine the ultimate outcome of these examinations, TSYS believes that its liability for uncertain tax positions relating to these jurisdictions for such years is adequate.
GAAP prescribes a recognition threshold and measurement attribute for the financial statement recognition, measurement and disclosure of a tax position taken or expected to be taken in a tax return. During the year ended December 31, 2015, TSYS increased its liability for prior year uncertain income tax positions as a discrete item by a net amount of approximately $6.4 million (net of the federal tax effect). The Company is not able to reasonably estimate the amount by which the liability will increase or decrease over time; however, at this time, the Company does not expect any significant changes related to these obligations within the next twelve months.
A reconciliation of the beginning and ending amount of unrecognized tax liabilities is as follows 1:
| (in millions) | Year Ended December 31, 2015 |
|||
| Beginning balance |
$ | 6.7 | ||
| Current activity: |
||||
| Additions based on tax positions related to current year |
2.3 | |||
| Additions for tax positions of prior years |
4.7 | |||
| Reductions for tax positions of prior years |
(0.6 | ) | ||
|
|
|
|||
| Net, current activity |
6.4 | |||
|
|
|
|||
| Ending balance |
$ | 13.1 | ||
|
|
|
|||
| 1 | Unrecognized state tax liabilities are not adjusted for the federal tax impact |
TSYS recognizes potential interest and penalties related to the underpayment of income taxes as income tax expense in the Consolidated Statements of Income. Gross accrued interest and penalties on unrecognized tax
69
benefits totaled $0.7 million and $0.3 million as of December 31, 2015 and December 31, 2014, respectively. The total amounts of unrecognized income tax benefits as of December 31, 2015 and December 31, 2014 that, if recognized, would affect the effective tax rates are $13.2 million and $6.5 million (net of the federal benefit on state tax issues), respectively, which includes interest and penalties of $0.5 million and $0.2 million, respectively.
| Note 16 | Commitments and Contingencies |
LEASE COMMITMENTS: TSYS is obligated under noncancelable operating leases for computer equipment, software and facilities.
The future minimum lease payments under noncancelable operating leases with remaining terms greater than one year for the next five years and thereafter and in the aggregate as of December 31, 2015, are as follows:
| (in thousands) | ||||
| 2016 |
$ | 121,892 | ||
| 2017 |
117,137 | |||
| 2018 |
101,413 | |||
| 2019 |
99,426 | |||
| 2020 |
30,733 | |||
| Thereafter |
22,716 | |||
|
|
|
|||
| Total future minimum lease payments |
$ | 493,317 | ||
|
|
|
|||
The majority of computer equipment lease commitments come with a renewal option or an option to terminate the lease. These lease commitments may be replaced with new leases which allow the Company to continually update its computer equipment. Total rental expense under all operating leases in 2015, 2014 and 2013 was $124.8 million, $105.2 million and $93.4 million, respectively.
CONTRACTUAL COMMITMENTS: In the normal course of its business, the Company maintains long-term processing contracts with its clients. These processing contracts contain commitments, including, but not limited to, minimum standards and time frames against which the Company’s performance is measured. In the event the Company does not meet its contractual commitments with its clients, the Company may incur penalties and certain clients may have the right to terminate their contracts with the Company. The Company does not believe that it will fail to meet its contractual commitments to an extent that will result in a material adverse effect on its financial position, results of operations or cash flows.
CONTINGENCIES:
Legal Proceedings — General
The Company is subject to various legal proceedings and claims and is also subject to information requests, inquiries and investigations arising out of the ordinary conduct of its business. The Company establishes reserves for litigation and similar matters when those matters present loss contingencies that TSYS determines to be both probable and reasonably estimable in accordance with GAAP. In the opinion of management, based on current knowledge and in part upon the advice of legal counsel, all matters not specifically discussed below are believed to be adequately covered by insurance, or, if not covered, the possibility of losses from such matters are believed to be remote or such matters are of such kind or involve such amounts that would not have a material adverse effect on the financial position, results of operations or cash flows of the Company if disposed of unfavorably.
Telexfree Matter
ProPay, Inc. (“ProPay”), a subsidiary of the Company, has been named as one of a number of defendants (including other merchant processors) in several purported class action lawsuits relating to the activities of Telexfree, Inc. and its affiliates and principals. Telexfree is a former merchant customer of ProPay. With regard to Telexfree, each purported class action lawsuit generally alleges that Telexfree engaged in an improper multi-tier marketing scheme involving voice-over Internet protocol telephone services. The plaintiffs in each of the
70
purported class action complaints generally allege that the various merchant processor defendants, including ProPay, aided and abetted the improper activities of Telexfree. Telexfree filed for bankruptcy protection in Nevada. The bankruptcy proceeding was subsequently transferred to the Massachusetts Bankruptcy Court.
Specifically, ProPay has been named as one of a number of defendants (including other merchant processors) in each of the following purported class action complaints relating to Telexfree: (i) Waldermara Martin, et al. v. TelexFree, Inc., et al. (Case No. BK-S-14-12524-ABL) filed on May 3, 2014 in the United States Bankruptcy Court District of Nevada, (ii) Anthony Cellucci, et al. v. TelexFree, Inc., et. al. (Case No. 4: 14-BK-40987) filed on May 15, 2014 in the United States Bankruptcy Court District of Massachusetts, (iii) Maduako C. Ferguson Sr., et al. v. Telexelectric, LLLP, et. al (Case No. 5: 14-CV-00316-D) filed on June 5, 2014 in the United States District Court of North Carolina, (iv) Todd Cook v. TelexElectric LLLP et al. (Case No. 2: 14-CV-00134), filed on June 24, 2014 in the United States District Court for the Northern District of Georgia, (v) Felicia Guevara v. James M. Merrill et al., CA No. 1: 14-cv-22405-DPG), filed on June 27, 2014 in the United State District Court for the Southern District of Florida, and (vi) Reverend Jeremiah Githere, et al. v. TelexElectric LLLP et al. (Case No. 1: 14-CV-12825-GAO), filed on June 30, 2014 in the United States District Court for the District of Massachusetts (together, the “Actions”). On October 21, 2014, the Judicial Panel on Multidistrict Litigation transferred and consolidated the Actions before the United States District Court for the District of Massachusetts (the “Consolidated Action”).
Following the Judicial Panel on Multidistrict Litigation’s October 21, 2014 order, four additional cases arising from the alleged TelexFree scheme were transferred to the United States District Court for the District of Massachusetts for coordinated or consolidated proceedings, including (i) Paulo Eduardo Ferrari et al. v. Telexfree, Inc. et al. (Case No. 14-04080); (ii) Magalhaes v. TelexFree, Inc., et al., No. 14-cv-12437 (D. Mass.); (iii) Griffith v. Merrill et al., No. 14-CV-12058 (D. Mass.); Abelgadir v. Telexelectric, LLP, No. 14-09857 (S.D.N.Y.) In addition, on September 23, 2015, a putative class action relating to TelexFree was filed in the United States District Court for the District of Arizona, styled Rita Dos Santos, Putative Class Representatives and those Similarly Situated v. TelexElectric, LLLP et al., 2: 15-cv-01906-NVW (the “Arizona Action”). The Arizona Action makes claims similar to those alleged in the consolidated action pending before the United States District Court for the District of Massachusetts. On September 29, 2015, a group of certain defendants to the Consolidated Action, including ProPay, filed a “tag along” notice with the Judicial Panel on Multidistrict Litigation, asking that the Arizona Action be transferred to the District of Massachusetts where it can be consolidated or coordinated with the Consolidated Action. On October 20, 2015, the Judicial Panel on Multidistrict Litigation transferred the Arizona Action to the District of Massachusetts.
The United States District Court for the District of Massachusetts appointed lead plaintiffs’ counsel on behalf of the putative class of plaintiffs in the Consolidated Action. On March 31, 2015, the plaintiffs filed a First Consolidated Amended Complaint (the “Consolidated Complaint”). The Consolidated Complaint purports to bring claims on behalf of all persons who purchased certain TelexFree “memberships” and suffered a “net loss” between January 1, 2012 and April 16, 2014. The Consolidated Complaint supersedes the complaints filed prior to consolidation of the Actions, and alleges that ProPay aided and abetted tortious acts committed by TelexFree, and that ProPay was unjustly enriched in the course of providing payment processing services to TelexFree. On April 30, 2015, the plaintiffs filed a Second Consolidated Amended Complaint (the “Second Amended Complaint”), which amends and supersedes the Consolidated Complaint. Like the Consolidated Complaint, the Second Amended Complaint generally alleges that ProPay aided and abetted tortious acts committed by TelexFree, and that ProPay was unjustly enriched in the course of providing payment processing services to TelexFree.
Several defendants, including ProPay, moved to dismiss the Second Amended Complaint on June 2, 2015. Briefing on those motions closed on October 16, 2015. The court held a hearing on the motions to dismiss on November 2, 2015. At present, pursuant to a court order, all discovery in the action is stayed pending the resolution of parallel criminal proceedings against certain former principals of TelexFree, Inc.
ProPay has also received various subpoenas, a seizure warrant and other inquiries requesting information regarding Telexfree from (i) the Commonwealth of Massachusetts, Securities Division, (ii) United States Securities and Exchange Commission, (iii) US Immigration and Customs Enforcement, and (iv) the bankruptcy Trustee of the Chapter 11 entities of Telexfree, Inc., Telexfree, LLC and Telexfree Financial, Inc. Pursuant to the seizure warrant served by the United States Attorney’s Office for the District of Massachusetts, ProPay delivered all funds
71
associated with Telexfree held for chargeback and other purposes by ProPay to US Immigration and Customs Enforcement. In addition, ProPay received a notice of potential claim from the bankruptcy Trustee as a result of the relationship of ProPay with Telexfree and its affiliates.
The above proceedings and actions are preliminary in nature. While the Company and ProPay intend to vigorously defend matters arising out of the relationship of ProPay with Telexfree and believe ProPay has substantial defenses related to these purported claims, the Company currently cannot reasonably estimate losses attributable to these matters.
GUARANTEES AND INDEMNIFICATIONS: The Company has entered into processing and licensing agreements with its clients that include intellectual property indemnification clauses. Under these clauses, the Company generally agrees to indemnify its clients, subject to certain exceptions, against legal claims that TSYS’ services or systems infringe on certain third party patents, copyrights or other proprietary rights. In the event of such a claim, the Company is generally obligated to hold the client harmless and pay for related losses, liabilities, costs and expenses, including, without limitation, court costs and reasonable attorney’s fees. The Company has not made any indemnification payments pursuant to these indemnification clauses.
A portion of the Company’s business is conducted through distributors that provide load and reload services to cardholders at their locations. Members of the Company’s distribution and reload network collect cardholder funds and remit them by electronic transfer to the Issuing Banks for deposit in the cardholder accounts. The Company’s Issuing Banks typically receive cardholders’ funds no earlier than three business days after they are collected by the distributor. If any distributor fails to remit cardholders’ funds to the Company’s Issuing Banks, the Company typically reimburses the Issuing Banks for the shortfall created thereby. The Company manages the risk associated with this process through a formalized set of credit standards, volume limits and deposit requirements for certain distributors and by typically maintaining the right to offset any settlement shortfall against the commissions payable to the relevant distributor. To date, the Company has not experienced any significant losses associated with settlement failures and the Company had not recorded a settlement guarantee liability as of December 31, 2015. As of December 31, 2015, the Company’s estimated gross settlement exposure was $9.9 million.
GPR cardholders can incur charges in excess of the funds available in their accounts and are liable for the resulting overdrawn account balance. Although the Company generally declines authorization attempts for amounts that exceed the available balance in a cardholder’s account, the application of the Networks’ rules and regulations, the timing of the settlement of transactions and the assessment of subscription, maintenance or other fees can, among other things, result in overdrawn card accounts. The Company also provides, as a courtesy and in its discretion, certain cardholders with a “cushion” that allows them to overdraw their card accounts by up to $10. In addition, eligible cardholders may enroll in the Issuing Banks’ overdraft protection programs and fund transactions that exceed the available balance in their accounts. The Company generally provides the funds used as part of these overdraft programs (one of the Company’s Issuing Banks will advance the first $1.0 million on behalf of its cardholders) and is responsible to the Issuing Banks for any losses associated with any overdrawn account balances. As of December 31, 2015 and 2014, cardholders’ overdrawn account balances totaled $17.9 million and $14.0 million, respectively. As of December 31, 2015 and 2014, the Company’s reserves for the losses it estimates will arise from processing customer transactions, debit card overdrafts, chargebacks for unauthorized card use and merchant-related chargebacks due to non-delivery of goods or services was $9.4 million and $6.3 million, respectively.
The Company has not recorded a liability for guarantees or indemnities in the accompanying consolidated balance sheet since the maximum amount of potential future payments under such guarantees and indemnities is not determinable.
PRIVATE EQUITY INVESTMENTS: The Company has entered into limited partnership agreements in connection with investing in two Atlanta-based venture capital funds focused exclusively on investing in technology-enabled financial services companies. Pursuant to each limited partnership agreement, the Company has committed to invest up to $20.0 million in each fund so long as its ownership interest in each fund does not exceed 50%. As of December 31, 2015 and 2014, the Company had made contributions to the funds of $15.0 million and $10.8 million, respectively. The Company had investments, including gains, totaling $17.6 million and
72
$11.9 million, respectively, as of December 31, 2015 and 2014. The Company recognized gains of $4.0 million, $0.8 million, and $1.0 million due to increases in fair value in the years ended December 31, 2015, 2014 and 2013, respectively.
| Note 17 | Employee Benefit Plans |
The Company provides benefits to its employees by offering employees participation in certain defined contribution plans. The employee benefit plans through which TSYS provided benefits to its employees during 2015 are described as follows:
RETIREMENT SAVINGS AND STOCK PURCHASE PLANS: TSYS maintains a single plan, the Retirement Savings Plan, which is designed to reward all team members of TSYS U.S.-based companies with a uniform employer contribution. The terms of the plan provide for the Company to match 100% of the employee contribution up to 4% of eligible compensation. The Company can make discretionary contributions up to another 4% based upon business conditions.
The Company also maintains a stock purchase plan for employees. The Company contributes 15% of employee contributions. The funds are used to purchase presently issued and outstanding shares of TSYS common stock on the open market at fair market value for the benefit of participants. The Company’s contributions to the plans charged to expense for the years ended December 31, 2015, 2014 and 2013 are as follows:
| (in thousands) | 2015 | 2014 | 2013 | |||||||||
| TSYS Retirement Savings Plan |
$ | 24,169 | 17,531 | 14,506 | ||||||||
| TSYS Stock Purchase Plan |
1,378 | 1,288 | 1,236 | |||||||||
POSTRETIREMENT MEDICAL BENEFITS PLAN: TSYS provides certain medical benefits to qualified retirees through a postretirement medical benefits plan, which is immaterial to the Company’s consolidated financial statements. The measurement of the benefit expense and accrual of benefit costs associated with the plan do not reflect the effects of the 2003 Medicare Act. Additionally, the benefit expense and accrued benefit cost associated with the plan, as well as any potential impact of the effects of the 2003 Medicare Act, are not significant to the Company’s consolidated financial statements.
| Note 18 | Equity |
DIVIDENDS: Dividends on common stock of $73.7 million were paid in 2015, compared to $74.8 million and $56.5 million in 2014 and 2013, respectively. The increase in dividends paid in 2014 compared to 2013 is due to the acceleration of payment of the fourth quarter 2012 dividend. The fourth quarter 2012 dividend payment was paid in December 2012, rather than January 2013, to allow shareholders to benefit from the lower dividend tax rate that was set to expire on December 31, 2012.
EQUITY COMPENSATION PLANS: The following table summarizes TSYS’ equity compensation plans by category as of December 31, 2015:
| (in thousands, except per share data) Plan Category |
(a) Number of securities to be issued upon exercise of outstanding options, warrants and rights |
(b) Weighted-average exercise price of outstanding options, warrants and rights |
(c) Number of securities remaining available for future issuance under equity compensation plans (excluding securities reflected in column (a)) |
|||||||||
| Equity compensation plans approved by security holders |
4,475 | $ | 28.07 | 1 | 8,550 | 2 | ||||||
|
|
|
|
|
|
|
|||||||
The Company does not have any equity compensation plans that were not approved by security holders.
| 1 | Weighted-average exercise price represents 2,887 thousand options only and does not include performance shares and other awards that have no exercise price. |
| 2 | Shares available for future grants under the Total System Services Inc. 2007 Omnibus Plan and 2012 Omnibus Plan, which could be in the form of options, nonvested awards and performance shares. |
73
| Note 19 | Share-Based Compensation |
General Description of Share-Based Compensation Plans
TSYS has various long-term incentive plans under which the Compensation Committee of the Board of Directors has the authority to grant share-based compensation to TSYS employees.
Stock options generally become exercisable in three equal annual installments on the anniversaries of the date of grant and expire ten years from the date of grant. The required service period for retirement eligible employees is typically 12 or 18 months. For retirement eligible employees who retire prior to completing this required service period, the options vest on a pro-rata basis based upon the number of months employed during the full service period. For retirement eligible employees who retire after the required 18-month service period, the options become fully vested upon retirement. For retirement eligible employees who retire after the required 12-month service period, the option holder is deemed to have continued employment through the end of the vesting period and the options continue to vest in accordance with their terms.
Long-Term Incentive Plans
TSYS maintains the Total System Services, Inc. 2012 Omnibus Plan, Total System Services, Inc. 2007 Omnibus Plan, Total System Services, Inc. 2002 Long-Term Incentive Plan, Total System Services, Inc. 2000 Long-Term Incentive Plan and the Amended and Restated NetSpend Holdings Inc. 2004 Equity Incentive Plan for Options and Restricted Shares Assumed by Total System Services, Inc. to advance the interests of TSYS and its shareholders through awards that give employees and directors a personal stake in TSYS’ growth, development and financial success. Awards under these plans are designed to motivate employees and directors to devote their best efforts to the business of TSYS. Awards will also help TSYS attract and retain the services of employees and directors who are in a position to make significant contributions to TSYS’ success.
The plans are administered by the Compensation Committee of the Company’s Board of Directors and enable the Company to grant nonqualified and incentive stock options, stock appreciation rights, restricted stock and restricted stock units, performance units or performance shares, cash-based awards and other stock-based awards.
All stock options must have a maximum life of no more than ten years from the date of grant. The exercise price will not be less than 100% of the fair market value of TSYS’ common stock at the time of grant. Any shares related to awards which terminate by expiration, forfeiture, cancellation or otherwise without the issuance of such shares, are settled in cash in lieu of shares, or are exchanged with the Committee’s permission, prior to the issuance of shares, for awards not involving shares, shall be available again for grant under the various plans. The aggregate number of shares of TSYS stock which may be granted to participants pursuant to awards granted under the various plans may not exceed the following: Total System Services, Inc. 2012 Omnibus Plan -17 million shares; Total System Services, Inc. 2007 Omnibus Plan -5 million shares; Total System Services, Inc. 2002 Long-Term Incentive Plan -9.4 million shares; and Total System Services, Inc. 2000 Long-Term Incentive Plan -2.4 million shares. Effective February 1, 2010 and March 5, 2012, no additional awards may be made from the Total System Services, Inc. 2000 and 2002 Long-Term Incentive Plans, respectively.
Share-Based Compensation
Share-based compensation costs are classified as selling, general and administrative expenses on the Company’s statements of income and corporate administration and other expenses for segment reporting purposes. TSYS does not include amounts associated with share-based compensation as costs capitalized as software development and contract acquisition costs as these awards are typically granted to individuals not involved in capitalizable activities. For the year ended December 31, 2015, share-based compensation was $41.5 million compared to $30.8 million and $28.9 million for the same periods in 2014 and 2013, respectively.
Nonvested Awards
The Company granted shares of TSYS common stock to certain key employees and non-management members of its Board of Directors. The grants to certain key employees were issued under nonvested stock bonus awards
74
and are typically for services to be provided in the future by such officers and employees. The grants to the Board of Directors were fully vested on the date of grant.
On July 1, 2013, the Company issued 870,361 shares of TSYS common stock as nonvested stock replacement awards with a market value of $21.5 million as part of the NetSpend acquisition. The nonvested stock bonus awards to employees of NetSpend are for services to be provided in the future and vest over varying periods. The NetSpend awards were converted into equivalent shares of Company’s common stock on the acquisition date. The value of the stock at the date of issuance is charged as compensation expense over the vesting periods of the awards.
On July 18, 2013, the Company issued 212,694 retention shares of TSYS common stock with a market value of $5.5 million to certain key employees of NetSpend. The nonvested stock bonus awards to certain key employees are for services to be provided in the future and vest over periods ranging from two to four years. The market value of the TSYS common stock at the date of issuance is charged as compensation expense over the vesting periods of the awards.
The following table summarizes the number of shares granted each year:
| 2015 | 2014 | 2013 | ||||||||||
| Number of shares |
388,211 | 672,724 | 1,667,246 | |||||||||
| Market value (in millions) |
$ | 14.9 | 20.6 | 41.3 | ||||||||
A summary of the status of TSYS’ nonvested shares as of December 31, 2015, 2014 and 2013 and the changes during the periods are presented below:
| 2015 | 2014 | 2013 | ||||||||||||||||||||||
| (in thousands, except per share data) Nonvested shares |
Shares | Weighted Average Grant-Date Fair Value |
Shares | Weighted Average Grant-Date Fair Value |
Shares | Weighted Average Grant-Date Fair Value |
||||||||||||||||||
| Outstanding at beginning of year |
1,769 | $ | 26.75 | 1,783 | $ | 24.19 | 554 | $ | 19.96 | |||||||||||||||
| Granted1 |
388 | 38.38 | 673 | 30.67 | 1,667 | 24.75 | ||||||||||||||||||
| Vested |
(930 | ) | 26.05 | (602 | ) | 23.74 | (328 | ) | 19.95 | |||||||||||||||
| Forfeited/canceled |
(81 | ) | 28.78 | (85 | ) | 25.47 | (110 | ) | 23.82 | |||||||||||||||
|
|
|
|
|
|
|
|
|
|
|
|
|
|||||||||||||
| Outstanding at end of year |
1,146 | $ | 31.11 | 1,769 | $ | 26.75 | 1,783 | $ | 24.19 | |||||||||||||||
|
|
|
|
|
|
|
|
|
|
|
|
|
|||||||||||||
| 1 | Includes the issuance of approximately 870,361 stock replacement awards in connection with the acquisition of NetSpend in 2013. These awards had a market value of $21.5 million. A portion of the expense associated with these options has been included as a component of the total purchase price of the NetSpend acquisition. Refer to Note 24. |
As of December 31, 2015, there was approximately $22.8 million of total unrecognized compensation cost related to nonvested share-based compensation arrangements. That cost is expected to be recognized over a remaining weighted average period of 1.9 years.
Performance- and Market-Based Awards
The Company granted performance- and market-based shares to certain key executives. The Company has also granted performance-based shares to certain key employees. The performance- and market-based goals are established by the Compensation Committee of the Board of Directors and will vest, up to a maximum of 200%. During 2015 and 2014, the Compensation Committee established performance goals based on adjusted EPS, revenue growth and revenues before reimbursable items and market goals based on Total Shareholder Return (TSR) as compared to the TSR of the companies in the S&P 500 over the performance period.
Compensation expense for performance shares is measured on the grant date based on the quoted market price of TSYS common stock. The Company estimates the probability of achieving the goals through the performance period and expenses the awards on a straight-line basis. The fair value of market-based awards is estimated on the grant date using a Monte Carlo simulation model. The Company expenses market-based awards on a
75
straight-line basis. Compensation costs related to performance- and market-based shares are recognized through the longer of the performance period or the vesting period. As of December 31, 2015, there was approximately $11.0 million of unrecognized compensation cost related to TSYS performance-based awards that is expected to be recognized through December 2018. As of December 31, 2015, there was approximately $1.5 million of unrecognized compensation cost related to TSYS market-based awards that is expected to be recognized through July 2018.
The following table summarizes the performance- and market-based awards granted during the years 2015, 2014 and 2013:
| Year Awarded |
Type of Award |
Performance Period Ending |
Performance Measure |
Number of Shares Granted |
Period Expensed Through | |||||||
| 2015 | Market | July 2016, 2017 and 2018 |
Total Shareholder Return | 25,000 | July 2018 | |||||||
| 2015 | Performance | December 2017 | Adjusted EPS | 135,289 | December 2017 | |||||||
| 2015 | Market | December 2017 | Total Shareholder Return | 57,982 | December 2017 | |||||||
| 2015 | Performance | December 2015 | Revenues before Reimbursable Items and Adjusted EPS | 165,543 | December 2018 | |||||||
| 2014 | Performance | December 2016 | Revenues before Reimbursable Items and Adjusted EPS | 211,593 | December 2016 | |||||||
| 2013 | Performance | December 2015 | NetSpend Revenues and NetSpend Operating Income | 87,356 | December 2015 | |||||||
| 2013 | Performance | December 2015 | Revenues before Reimbursable Items and Income from Continuing Operations | 237,679 | December 2015 | |||||||
In July 2013, TSYS issued 225,000 shares of TSYS common stock as a performance-based retention stock award to a certain key executive with a performance-based vesting schedule through 2015. This award was forfeited in July 2014. The Company reversed all previously recorded expense associated with this award.
A summary of the awards authorized in each year is below:
| Total Number of Shares Awarded |
Potential Number of Performance-and Market-Based Shares to be Vested |
|||||||||||
| 2015 |
383,814 | 526,879 | (2018 | ) | ||||||||
| 2014 |
211,593 | 211,593 | (2017 | ) | ||||||||
| 2013 |
563,803 | 400,539 | (2016 | ) | ||||||||
A summary of the status of TSYS’ performance- and market-based nonvested shares as of December 31, 2015, 2014 and 2013 and changes during those periods are presented below:
| 2015 | 2014 | 2013 | ||||||||||||||||||||||
| (in thousands, except per share data) Performance- and market-based Nonvested shares |
Shares | Weighted Average Grant Date Fair Value |
Shares | Weighted Average Grant Date Fair Value |
Shares | Weighted Average Grant Date Fair Value |
||||||||||||||||||
| Outstanding at beginning of year |
766 | $ | 25.86 | 1,049 | $ | 22.75 | 809 | $ | 18.76 | |||||||||||||||
| Granted1 |
384 | 36.84 | 211 | 30.89 | 564 | 24.88 | ||||||||||||||||||
| Vested |
(241 | ) | 22.92 | (258 | ) | 17.57 | (324 | ) | 15.93 | |||||||||||||||
| Forfeited/canceled/adjusted |
9 | 22.20 | (236 | ) | 25.62 | — | — | |||||||||||||||||
|
|
|
|
|
|
|
|
|
|
|
|
|
|||||||||||||
| Outstanding at end of year |
918 | $ | 31.19 | 766 | $ | 25.86 | 1,049 | $ | 22.75 | |||||||||||||||
|
|
|
|
|
|
|
|
|
|
|
|
|
|||||||||||||
| 1 | Includes the issuance of approximately 87,356 stock replacement awards in connection with the acquisition of NetSpend in 2013. These awards had a market value of $2.2 million. A portion of the expense associated with these awards has been included as a component of the total purchase price of the NetSpend acquisition. Refer to Note 24. |
76
Stock Option Awards
During 2015, 2014 and 2013, the Company granted stock options to key TSYS executive officers and non-management members of its Board of Directors. The grants to key TSYS executive officers were issued for services to be provided in the future and vest over a period of three years. The grants to the Board of Directors were fully vested on the date of grant. The average fair value of the options granted was estimated on the date of grant using the Black-Scholes-Merton option-pricing model.
On July 1, 2013, the Company issued 1,060,148 stock option replacement awards with a market value of $13.7 million as part of the NetSpend acquisition. The weighted average fair value of the options was $12.93 and was calculated on the date of grant using a conversion factor into equivalent shares of the Company’s common stock on the acquisition date. The grants vest over a period ranging from seven months to 45 months. The weighted average fair value of the option grants was estimated on the date of grant using the Black-Scholes-Merton option-pricing model with the following weighted average assumptions: exercise price of $11.68; risk-free interest rate of 1.31%; expected volatility of 29.22%; expected term of 4.7 years; and dividend yield of 1.63%.
The following table summarizes the weighted average assumptions, and the weighted average fair value of the options:
| 2015 | 2014 | 2013 | ||||||||||
| Number of options granted |
613,473 | 1,046,372 | 1,939,796 | |||||||||
| Weighted average exercise price |
$ | 39.01 | $ | 30.96 | $ | 17.42 | ||||||
| Risk-free interest rate |
1.73 | % | 2.01 | % | 1.31 | % | ||||||
| Expected volatility |
20.80 | % | 25.06 | % | 26.81 | % | ||||||
| Expected term (years) |
6.3 | 6.5 | 6.0 | |||||||||
| Dividend yield |
1.04 | % | 1.29 | % | 1.64 | % | ||||||
| Weighted average fair value |
$ | 8.27 | $ | 7.66 | $ | 9.48 | ||||||
A summary of TSYS’ stock option activity as of December 31, 2015, 2014 and 2013, and changes during the years ended on those dates is presented below:
| 2015 | 2014 | 2013 | ||||||||||||||||||||||
| (in thousands, except per share data) | Options | Weighted Average Exercise Price |
Options | Weighted Average Exercise Price |
Options | Weighted Average Exercise Price |
||||||||||||||||||
| Options: |
||||||||||||||||||||||||
| Outstanding at beginning of year |
4,892 | $ | 23.83 | 5,752 | $ | 20.96 | 6,065 | $ | 21.27 | |||||||||||||||
| Granted 1 |
613 | 39.01 | 1,046 | 30.96 | 1,940 | 17.42 | ||||||||||||||||||
| Exercised |
(2,586 | ) | 22.68 | (1,850 | ) | 18.79 | (2,177 | ) | 18.75 | |||||||||||||||
| Forfeited/canceled |
(32 | ) | 20.79 | (56 | ) | 28.88 | (76 | ) | 16.78 | |||||||||||||||
|
|
|
|
|
|
|
|
|
|
|
|
|
|||||||||||||
| Outstanding at end of year |
2,887 | $ | 28.07 | 4,892 | $ | 23.83 | 5,752 | $ | 20.96 | |||||||||||||||
|
|
|
|
|
|
|
|
|
|
|
|
|
|||||||||||||
| Options exercisable at year-end |
1,439 | $ | 25.17 | 2,781 | $ | 22.86 | 3,232 | $ | 23.02 | |||||||||||||||
|
|
|
|
|
|
|
|
|
|
|
|
|
|||||||||||||
| Weighted average fair value of options granted during the year |
$ | 8.27 | $ | 7.66 | $ | 9.48 | ||||||||||||||||||
|
|
|
|
|
|
|
|||||||||||||||||||
| 1 | Includes the issuance of approximately 1.1 million stock option replacement awards in connection with the acquisition of NetSpend in 2013. These awards had a market value of $13.7 million. A portion of the expense associated with these awards has been included as a component of the total purchase price of the NetSpend acquisition. Refer to Note 24. |
77
As of December 31, 2015 the average remaining contractual life and intrinsic value of TSYS’ outstanding and exercisable stock options were as follows:
| Outstanding | Exercisable | |||||||
| Average remaining contractual life (in years) |
7.8 | 7.2 | ||||||
| Aggregate intrinsic value (in thousands) |
$ | 62,738 | 35,434 | |||||
Shares Issued for Options Exercised
During 2015, 2014 and 2013, employees of the Company exercised options for shares of TSYS common stock that were issued from treasury. The table below summarizes these stock option exercises by year:
| (in thousands) | Options Exercised and Issued from Treasury |
Intrinsic Value | ||||||
| 2015 | 2,586 | $ | 67,702 | |||||
| 2014 |
1,850 | 22,883 | ||||||
| 2013 |
2,177 | 16,580 | ||||||
For awards granted before January 1, 2006 that were not fully vested on January 1, 2006, the Company will record the tax benefits from the exercise of stock options as increases to the “Additional paid-in capital” line item of the Consolidated Balance Sheets. If the Company does recognize tax benefits, the Company will record these tax benefits from share-based compensation costs as cash inflows in the financing section and cash outflows in the operating section in the Statement of Cash Flows. The Company has elected to use the short-cut method to calculate its historical pool of windfall tax benefits.
As of December 31, 2015, there was approximately $2.9 million of total unrecognized compensation cost related to TSYS stock options that is expected to be recognized over a remaining weighted average period of 1.5 years.
| Note 20 | Treasury Stock |
The following table summarizes shares held as treasury stock and their related carrying value as of December 31:
| (in thousands) | Number of Treasury Shares |
Treasury Shares Cost |
||||||
| 2015 | 19,988 | $ | 641,664 | |||||
| 2014 |
17,836 | 453,230 | ||||||
| 2013 |
15,073 | 326,996 | ||||||
Stock Repurchase Plan
In April 2010, TSYS announced a stock repurchase plan to purchase up to 10 million shares of TSYS stock. The shares may be purchased from time to time over the next two years at prices considered attractive to the Company. By January 2014, the TSYS Board had approved several increases in the number of shares that could be repurchased under its share repurchase plan to up to 28 million shares of TSYS stock. The expiration date of the plan was extended to April 30, 2015. On January 27, 2015, TSYS announced that its Board had approved a new stock repurchase plan to purchase up to 20 million shares of TSYS stock. The shares may be purchased from time to time at prices considered appropriate. There is no expiration date for the plan. The previous plan was terminated.
During 2015, the Company purchased 5.2 million shares for approximately $242.1 million, at an average price of $47.01. During 2014, the Company purchased 5.2 million shares for approximately $165.3 million, at an average price of $31.79. During 2013, the Company purchased 3.1 million shares for approximately $97.6 million, at an average price of $31.48.
78
The following table sets forth information regarding the Company’s purchases of its common stock on a monthly basis during the three months ended December 31, 2015:
| (in thousands, except per share data) | Total Number of Shares Purchased |
Average Price Paid per Share |
Total Number of Cumulative shares Purchased as Part of Publicly announced Plans or Programs |
Maximum Number of Shares That May Yet Be Purchased Under the Plans or Programs |
||||||||||||
| October 2015 |
— | $ | — | 2,150 | 17,850 | |||||||||||
| November 2015 |
3,000 | 52.85 | 5,150 | 14,850 | ||||||||||||
| December 2015 |
1 | 1 | 49.80 | 5,150 | 14,850 | |||||||||||
|
|
|
|
|
|||||||||||||
| Total |
3,001 | $ | 52.85 | |||||||||||||
|
|
|
|
|
|||||||||||||
| 1 | Consists of delivery of shares to TSYS on vesting of shares to pay taxes. |
Treasury Shares
In 2008, the Compensation Committee approved “share withholding for taxes” for all employee nonvested awards, and also for employee stock options under specified circumstances. The dollar amount of the income tax liability from each exercise is converted into TSYS shares and withheld at the statutory minimum. The shares are added to the treasury account and TSYS remits funds to the Internal Revenue Service to settle the tax liability. During 2015 and 2014, the Company acquired 3,344 shares for approximately $0.2 million and acquired 162,489 shares for approximately $5.2 million, respectively, as a result of share withholding for taxes.
| Note 21 | Other Comprehensive Income (Loss) |
Comprehensive income (loss) for TSYS consists of net income, cumulative foreign currency translation adjustments, unrealized gains on available for sale securities and the recognition of an overfunded or underfunded status of a defined benefit postretirement plan recorded as a component of shareholders’ equity. The income tax effects allocated to and the cumulative balance of each component of accumulated other comprehensive income (loss) are as follows:
| (in thousands) | Beginning Balance |
Pretax amount |
Tax effect |
Net-of-tax Amount |
Ending Balance |
|||||||||||||||
| As of December 31, 2012 |
$ | (445 | ) | 2,272 | 419 | 1,853 | $ | 1,408 | ||||||||||||
|
|
|
|
|
|
|
|
|
|
|
|||||||||||
| Foreign currency translation adjustments |
$ | 3,332 | (295 | ) | 1,033 | (1,328 | ) | $ | 2,004 | |||||||||||
| Transfer from NCI |
28 | — | — | — | 28 | |||||||||||||||
| Gain on available for sale securities |
— | 2,810 | 1,037 | 1,773 | 1,773 | |||||||||||||||
| Change in AOCI related to postretirement healthcare plans |
(1,952 | ) | 1,926 | 30 | 1,896 | (56 | ) | |||||||||||||
|
|
|
|
|
|
|
|
|
|
|
|||||||||||
| As of December 31, 2013 |
$ | 1,408 | 4,441 | 2,100 | 2,341 | $ | 3,749 | |||||||||||||
|
|
|
|
|
|
|
|
|
|
|
|||||||||||
| Foreign currency translation adjustments |
$ | 2,004 | (17,143 | ) | (1,547 | ) | (15,596 | ) | $ | (13,592 | ) | |||||||||
| Transfer from NCI |
28 | — | — | — | 28 | |||||||||||||||
| Gain on available for sale securities |
1,773 | (1,058 | ) | (390 | ) | (668 | ) | 1,105 | ||||||||||||
| Change in AOCI related to postretirement healthcare plans |
(56 | ) | 921 | 332 | 589 | 533 | ||||||||||||||
|
|
|
|
|
|
|
|
|
|
|
|||||||||||
| As of December 31, 2014 |
$ | 3,749 | (17,280 | ) | (1,605 | ) | (15,675 | ) | $ | (11,926 | ) | |||||||||
|
|
|
|
|
|
|
|
|
|
|
|||||||||||
| Foreign currency translation adjustments |
$ | (13,592 | ) | (22,997 | ) | (1,548 | ) | (21,449 | ) | $ | (35,041 | ) | ||||||||
| Transfer from NCI |
28 | — | — | — | 28 | |||||||||||||||
| Gain on available for sale securities |
1,105 | 2,177 | 779 | 1,398 | 2,503 | |||||||||||||||
| Change in AOCI related to postretirement healthcare plans |
533 | (2,449 | ) | (882 | ) | (1,567 | ) | (1,034 | ) | |||||||||||
|
|
|
|
|
|
|
|
|
|
|
|||||||||||
| As of December 31, 2015 |
$ | (11,926 | ) | (23,269 | ) | (1,651 | ) | (21,618 | ) | $ | (33,544 | ) | ||||||||
|
|
|
|
|
|
|
|
|
|
|
|||||||||||
79
Consistent with its overall strategy of pursuing international investment opportunities, TSYS adopted the permanent reinvestment exception under GAAP, with respect to future earnings of certain foreign subsidiaries. Its decision to permanently reinvest foreign earnings offshore means TSYS will no longer allocate taxes to foreign currency translation adjustments associated with these foreign subsidiaries accumulated in other comprehensive income.
| Note 22 | Segment Reporting, including Geographic Area Data and Major Customers |
TSYS provides global payment processing and other services to card-issuing and merchant acquiring institutions in the United States and internationally through online accounting and electronic payment processing systems. Corporate expenses, such as finance, legal, human resources, mergers and acquisitions and investor relations are categorized as Corporate Administration and Other.
In the first quarter of 2014, the Company’s Japan-based entities qualified for discontinued operations treatment.
In July 2013, TSYS completed its acquisition of all the outstanding stock of NetSpend, which previously operated as a publicly traded company. NetSpend’s financial results are included in the NetSpend segment.
Refer to Note 24 for more information on acquisitions.
North America Services includes electronic payment processing services and other services provided from within the North America region. International Services includes electronic payment processing and other services provided from outside the North America region. Merchant Services includes electronic processing and other services provided to merchants and merchant acquirers. The NetSpend segment provides GPR prepaid debit and payroll cards and alternative financial service solutions to the underbanked and other consumers in the United States.
At TSYS, the chief operating decision maker (CODM) is a group consisting of Senior Executive Management and above. In the first quarter of 2014, the CODM decided that all share-based compensation costs should be included in the category “Corporate Administration and Other” for purposes of segment disclosures. All prior periods were restated to reflect this change. This change is used to evaluate performance and assess resources starting in the first quarter of 2014. The information utilized by the CODM consists of the financial statements and the main metrics monitored are revenue growth and growth in profitability.
Upon completion of the NetSpend acquisition in 2013, the CODM implemented a new metric called adjusted segment operating income in order to analyze each segment’s results of operations. This new metric consists of operating income adjusted for amortization of acquisition related intangibles and corporate administrative and other costs. All periods presented have been adjusted to reflect this new measure. Depreciation and amortization for the segments changed as a result of this new metric removing amortization associated with intangible assets from the total for the segments.
The Company believes the terms and conditions of transactions between the segments are comparable to those which could have been obtained in transactions with unaffiliated parties. TSYS’ operating segments share certain resources, such as information technology support, that TSYS allocates asymmetrically.
80
| Years Ended December 31, |
||||||||||||
| (in thousands) | ||||||||||||
| Operating Segments | 2015 | 2014 | 2013 | |||||||||
| Revenues before reimbursable items |
||||||||||||
| North America Services |
$ | 1,147,254 | 954,082 | 860,645 | ||||||||
| International Services |
331,159 | 341,785 | 321,484 | |||||||||
| Merchant Services |
474,040 | 435,649 | 446,277 | |||||||||
| NetSpend |
580,377 | 482,686 | 207,851 | |||||||||
| Intersegment revenues |
(33,481 | ) | (21,224 | ) | (12,549 | ) | ||||||
|
|
|
|
|
|
|
|||||||
| Revenues before reimbursable items from external customers |
$ | 2,499,349 | 2,192,978 | 1,823,708 | ||||||||
|
|
|
|
|
|
|
|||||||
| Total revenues |
||||||||||||
| North America Services |
$ | 1,334,258 | 1,117,764 | 1,000,073 | ||||||||
| International Services |
354,725 | 363,359 | 341,549 | |||||||||
| Merchant Services |
549,369 | 510,120 | 533,050 | |||||||||
| NetSpend |
580,377 | 482,686 | 207,851 | |||||||||
| Intersegment revenues |
(39,188 | ) | (27,052 | ) | (18,218 | ) | ||||||
|
|
|
|
|
|
|
|||||||
| Revenues from external customers |
$ | 2,779,541 | 2,446,877 | 2,064,305 | ||||||||
|
|
|
|
|
|
|
|||||||
| Depreciation and amortization |
||||||||||||
| North America Services |
$ | 99,544 | 86,513 | 74,480 | ||||||||
| International Services |
34,892 | 38,909 | 41,708 | |||||||||
| Merchant Services |
18,268 | 14,571 | 12,034 | |||||||||
| NetSpend |
10,686 | 7,509 | 3,121 | |||||||||
|
|
|
|
|
|
|
|||||||
| Segment depreciation and amortization |
163,390 | 147,502 | 131,343 | |||||||||
| Acquisition intangible amortization |
92,522 | 96,971 | 65,893 | |||||||||
| Corporate Administration and Other |
2,352 | 2,147 | 1,790 | |||||||||
|
|
|
|
|
|
|
|||||||
| Total depreciation and amortization |
$ | 258,264 | 246,620 | 199,026 | ||||||||
|
|
|
|
|
|
|
|||||||
| Adjusted segment operating income |
||||||||||||
| North America Services |
$ | 429,064 | 351,512 | 321,619 | ||||||||
| International Services |
60,087 | 55,123 | 42,068 | |||||||||
| Merchant Services |
150,225 | 134,872 | 155,643 | |||||||||
| NetSpend |
137,837 | 128,285 | 66,353 | |||||||||
|
|
|
|
|
|
|
|||||||
| Total adjusted segment operating income |
777,213 | 669,792 | 585,683 | |||||||||
| Acquisition intangible amortization |
(92,522 | ) | (96,971 | ) | (65,893 | ) | ||||||
| NetSpend merger and acquisition operating expenses |
— | (3,217 | ) | (14,220 | ) | |||||||
| Share-based compensation |
(41,549 | ) | (30,790 | ) | (28,933 | ) | ||||||
| Corporate Administration and Other |
(109,035 | ) | (107,174 | ) | (94,137 | ) | ||||||
|
|
|
|
|
|
|
|||||||
| Operating income |
$ | 534,107 | 431,640 | 382,500 | ||||||||
|
|
|
|
|
|
|
|||||||
| As of December 31, | 2015 | 2014 | ||||||||||
| Total assets |
||||||||||||
| North America Services |
$ | 3,516,328 | 3,327,160 | |||||||||
| International Services |
348,714 | 356,590 | ||||||||||
| Merchant Services |
689,781 | 695,744 | ||||||||||
| NetSpend |
1,504,740 | 1,556,369 | ||||||||||
| Intersegment assets |
(2,151,263 | ) | (2,202,282 | ) | ||||||||
|
|
|
|
|
|||||||||
| Total assets |
$ | 3,908,300 | 3,733,581 | |||||||||
|
|
|
|
|
|||||||||
81
GEOGRAPHIC AREA DATA: The Company maintains property and equipment, net of accumulated depreciation and amortization, in the following geographic areas:
| As of December 31, | ||||||||
| (in thousands) | 2015 | 2014 | ||||||
| United States |
$ | 241,814 | 237,865 | |||||
| Europe |
41,953 | 45,503 | ||||||
| Other |
6,131 | 7,217 | ||||||
|
|
|
|
|
|||||
| Totals |
$ | 289,898 | 290,585 | |||||
|
|
|
|
|
|||||
GEOGRAPHIC AREA REVENUE BY OPERATING SEGMENT: The following tables reconcile segment external revenue to revenues by geography for the years ended December 31:
| 2015 | ||||||||||||||||||||||||
| (in thousands) | North America Services |
International Services |
Merchant Services |
NetSpend | Total | % | ||||||||||||||||||
| United States |
$ | 981,588 | — | 548,079 | 580,377 | $ | 2,110,044 | 75.9 | ||||||||||||||||
| Europe1 |
796 | 303,832 | 22 | — | 304,650 | 11.0 | ||||||||||||||||||
| Canada1 |
288,728 | — | 355 | — | 289,083 | 10.4 | ||||||||||||||||||
| Mexico |
16,558 | — | — | — | 16,558 | 0.6 | ||||||||||||||||||
| Other1 |
18,329 | 40,198 | 679 | — | 59,206 | 2.1 | ||||||||||||||||||
|
|
|
|
|
|
|
|
|
|
|
|
|
|||||||||||||
| Total |
$ | 1,305,999 | 344,030 | 549,135 | 580,377 | $ | 2,779,541 | 100.0 | ||||||||||||||||
|
|
|
|
|
|
|
|
|
|
|
|
|
|||||||||||||
| 2014 | ||||||||||||||||||||||||
| (in thousands) | North America Services |
International Services |
Merchant Services |
NetSpend | Total | % | ||||||||||||||||||
| United States |
$ | 778,766 | — | 508,747 | 482,686 | $ | 1,770,199 | 72.3 | ||||||||||||||||
| Europe1 |
781 | 304,308 | — | — | 305,089 | 12.5 | ||||||||||||||||||
| Canada |
290,248 | — | 248 | — | 290,496 | 11.9 | ||||||||||||||||||
| Mexico |
16,216 | — | — | — | 16,216 | 0.7 | ||||||||||||||||||
| Other1 |
16,305 | 47,888 | 684 | — | 64,877 | 2.7 | ||||||||||||||||||
|
|
|
|
|
|
|
|
|
|
|
|
|
|||||||||||||
| Total |
$ | 1,102,316 | 352,196 | 509,679 | 482,686 | $ | 2,446,877 | 100.0 | ||||||||||||||||
|
|
|
|
|
|
|
|
|
|
|
|
|
|||||||||||||
| 2013 | ||||||||||||||||||||||||
| (in thousands) | North America Services |
International Services |
Merchant Services |
NetSpend | Total | % | ||||||||||||||||||
| United States |
$ | 712,252 | — | 533,939 | 207,851 | $ | 1,454,042 | 70.4 | ||||||||||||||||
| Europe1 |
774 | 293,803 | — | — | 294,577 | 14.3 | ||||||||||||||||||
| Canada |
242,975 | — | 178 | — | 243,153 | 11.8 | ||||||||||||||||||
| Mexico |
16,513 | — | — | — | 16,513 | 0.8 | ||||||||||||||||||
| Other1 |
14,492 | 40,962 | 566 | — | 56,020 | 2.7 | ||||||||||||||||||
|
|
|
|
|
|
|
|
|
|
|
|
|
|||||||||||||
| Total |
$ | 987,006 | 334,764 | 534,683 | 207,851 | $ | 2,064,305 | 100.0 | ||||||||||||||||
|
|
|
|
|
|
|
|
|
|
|
|
|
|||||||||||||
| 1 | Revenues are impacted by movements in foreign currency exchange rates |
MAJOR CUSTOMER: For the years ended December 31, 2015, 2014 and 2013, the Company had no major customers.
82
| Note 23 | Supplemental Cash Flow Information |
Nonvested Share Awards
The Company has issued shares of TSYS common stock to certain key employees and non-management members of its Board of Directors. The grants to certain key employees were issued in the form of nonvested stock bonus awards for services to be provided in the future by such officers and employees. The grants to the Board of Directors were fully vested on the date of grant. Refer to Note 18 for more information on nonvested share awards.
Equipment and Software Acquired Under Capital Lease Obligations
The Company acquired computer equipment and software under capital leases in the amount of $4.1 million, $17.9 million and $14.8 million in 2015, 2014 and 2013, respectively.
Software Acquired Under Direct Financing
The Company acquired software under direct financing in the amount of $30.0 million in 2015. The Company acquired software under direct financing in the amount of $13.6 million in 2014. The Company did not acquire any software under direct financing in 2013. Refer to Note 13 for more information.
| Note 24 | Acquisitions |
2015
In September 2015, TSYS purchased certain assets for its NetSpend segment for $750,000. The purchase qualifies as a business combination in accordance with GAAP. The Company recorded an acquisition technology intangible asset for the amount of the purchase price. This acquisition intangible asset represents software and is being amortized over a five year life. There were no other material assets included in the purchase. The acquisition included the employment of certain key employees which resulted in the transaction qualifying as a business combination.
2014
In February 2014, the Company acquired an additional 15% equity interest in CPAY from its privately held owner for $37.5 million, which increased its equity interest in CPAY from 60% to 75%. This purchase reduced the remaining redeemable noncontrolling interest in CPAY to 25% of its total outstanding equity.
2013
On July 1, 2013, TSYS acquired all the outstanding stock of NetSpend, which previously operated as a publicly traded company and is a leading provider of GPR prepaid debit and payroll cards and related financial services to underbanked and other consumers in the U.S. The acquisition complements the Company’s existing presence in the prepaid processing space. The results of the newly acquired business are being reported by TSYS as a new operating segment titled NetSpend.
Under the terms of the Merger Agreement, TSYS acquired 100 percent ownership of NetSpend for approximately $1.4 billion, including $1.2 billion of cash to shareholders, $70.7 million of cash for payment to holders of vested stock options and awards, $58.3 million of cash for repayment of NetSpend’s revolving credit facility and $15.6 million in replacement stock options and awards. NetSpend shareholders received $16.00 in cash for each share of NetSpend common stock. There were 1.6 million NetSpend shares held by five shareholders who asserted appraisal (or dissenters’) rights with respect to their NetSpend shares, for a preliminary value of $25.7 million at $16.00 per share that were not funded at the closing of the acquisition. During 2014, TSYS paid $38.6 million to dissenting shareholders to settle the lawsuit.
83
Under the terms of the Merger Agreement, the Company replaced unvested share-based awards for certain current employees of NetSpend. The following table provides a list of all replacement awards and the estimated fair value of those awards issued in conjunction with the acquisition of NetSpend:
| Number of Shares and Options Issued |
Fair Value (in millions) |
|||||||
| Time-based restricted stock |
870,361 | $ | 21.5 | |||||
| Non-qualified stock options |
530,696 | 8.4 | ||||||
| Incentive stock options |
529,452 | 5.3 | ||||||
| Performance-based restricted stock |
87,356 | 2.2 | ||||||
|
|
|
|
|
|||||
| Total |
2,017,865 | $ | 37.4 | |||||
|
|
|
|
|
|||||
The portion of the fair value of the replacement awards related to services provided prior to the business combination was included in the total purchase price. The portion of the fair value associated with future service is recognized as expense over the future service period, which varies by award. The Company determined that $15.6 million ($11.1 million net of tax) of the replacement awards was related to services rendered prior to the business combination.
The goodwill amount of $1.0 billion arising from the acquisition consists largely of expansion of customer base, differentiation in market opportunity and economies of scale expected from combining the operations of TSYS and NetSpend. All of the goodwill was assigned to TSYS’ new NetSpend segment. The goodwill recognized is not expected to be deductible for income tax purposes.
The following table summarizes the consideration paid for NetSpend and the initially recognized amounts of the identifiable assets acquired and liabilities assumed on July 1, 2013 (the acquisition date).
| (in thousands) | ||||
| Consideration |
||||
| Cash |
$ | 1,355,270 | ||
| Equity instruments |
15,557 | |||
| Dissenting shareholder liability* |
25,723 | |||
|
|
|
|||
| Fair value of total consideration transferred |
$ | 1,396,550 | ||
|
|
|
|||
| Recognized amounts of identifiable assets acquired and liabilities assumed: |
||||
| Cash |
$ | 40,610 | ||
| Accounts receivable |
11,335 | |||
| Property equipment and software |
11,657 | |||
| Identifiable intangible assets |
480,086 | |||
| Deferred tax asset |
10,165 | |||
| Other assets |
36,660 | |||
| Deferred tax liability |
(155,945 | ) | ||
| Financial liabilities |
(62,452 | ) | ||
|
|
|
|||
| Total identifiable net assets |
372,116 | |||
| Goodwill |
1,024,434 | |||
|
|
|
|||
| $ | 1,396,550 | |||
|
|
|
|||
| * | Represents 1.6 million NetSpend shares held by dissenting shareholders |
In 2015, the Company adjusted goodwill for NetSpend to include an additional $627,000 for a change in a sales and use tax reserve associated with the acquisition. As of December 31, 2014, goodwill related to NetSpend increased $8.5 million due to changes during the measurement period. For more information, refer to Note 7.
Identifiable intangible assets acquired in the NetSpend acquisition include channel relationships, current technology, a prospect database, the NetSpend trade name and non-compete agreements.
84
The identifiable intangible assets had no significant estimated residual value. These intangible assets are being amortized over their estimated useful lives of five to eight years based on the pattern of expected future economic benefit, which approximates a straight-line basis over the useful lives of the assets. The fair value of the acquired identifiable intangible assets of $480.1 million was estimated using the income approach (discounted cash flow and relief from royalty methods) and cost approach. The fair values and useful lives of the identified intangible assets were primarily determined using forecasted cash flows, which included estimates for certain assumptions such as revenues, expenses, attrition rates and royalty rates.
The estimated fair value of identifiable intangible assets acquired in the acquisitions and the related estimated weighted average useful lives are as follows:
| (in thousands) | Fair Value | Weighted Average Useful Life (in years) |
||||||
| Channel relationships |
$ | 317,000 | 8.0 | |||||
| Current technology |
78,711 | 7.0 | ||||||
| Trade name |
44,000 | 5.0 | ||||||
| Database |
28,000 | 5.0 | ||||||
| Covenants-not-to-compete |
11,500 | 6.0 | ||||||
| Favorable lease |
875 | 4.9 | ||||||
|
|
|
|
|
|||||
| Total acquired identifiable intangible assets |
$ | 480,086 | 7.3 | |||||
|
|
|
|
|
|||||
The fair value measurement of the identifiable intangible assets represents Level 2 and Level 3 measurements. Key assumptions include (a) cash flow projections based on market participant and internal data, (b) a discount rate of 11%, (c) a pre-tax royalty rate range of 2.5-7.0%, (d) attrition rates of 5%-40%, (e) an effective tax rate of 40%, and (f) a terminal value based on a long-term sustainable growth rate of 3%.
In connection with the acquisition, TSYS incurred $3.2 million and $14.2 million in acquisition-related costs primarily related to professional legal, finance, and accounting costs for the years ended December 31, 2014 and 2013, respectively. These costs were expensed as incurred and are included in selling, general and administrative expenses on the income statement.
85
Pro Forma Results of Operations
The amounts of NetSpend revenue and earnings included in TSYS’ consolidated income statement for the year ended December 31, 2013, and the pro forma revenue and earnings of the combined entity had the acquisition date been January 1, 2013 are:
| Actual | Supplemental pro forma |
|||||||
| Year Ended December 31 ,2013 |
Year Ended December 31, 2013 |
|||||||
| (in thousands, except per share data) | ||||||||
| Revenue |
$ | 2,064,305 | 2,286,348 | |||||
|
|
|
|
|
|||||
| Net income attributable to TSYS common shareholders |
$ | 244,750 | 239,775 | |||||
|
|
|
|
|
|||||
| Basic EPS attributable to TSYS common shareholders |
$ | 1.30 | 1.28 | |||||
|
|
|
|
|
|||||
| Diluted EPS attributable to TSYS common shareholders |
$ | 1.29 | 1.27 | |||||
|
|
|
|
|
|||||
The unaudited pro forma financial information presented above does not purport to represent what the actual results of operations would have been if the acquisition of NetSpend’s operations had occurred prior to January 1, 2013, nor is it indicative of the future operating results of TSYS. The unaudited pro forma financial information does not reflect the impact of future events that may occur after the acquisition, including, but not limited to, anticipated cost savings from operating synergies.
The unaudited pro forma financial information presented in the table above has been adjusted to give effect to adjustments that are (1) directly related to the business combination; (2) factually supportable; and (3) expected to have a continuing impact. These adjustments include, but are not limited to, the application of accounting policies; and depreciation and amortization related to fair value adjustments to property, plant and equipment and intangible assets.
The pro forma adjustments do not reflect the following material items that result directly from the acquisition and which impacted the statement of operations following the acquisition:
| • | Acquisition and related financing transactions costs relating to fees to investment bankers, attorneys, accountants, and other professional advisors, and other transaction-related costs that were not capitalized as deferred financing costs; and |
| • | The effect of anticipated cost savings or operating efficiencies expected to be realized and related restructuring charges such as technology and infrastructure integration expenses, and other costs related to the integration of NetSpend into TSYS. |
Redeemable Noncontrolling Interest
The fair value of the noncontrolling interest in CPAY, owned by a private company, was based on the actual purchase price paid for the controlling interest in CPAY. Next, adjustments were made for lack of control and lack of marketability that market participants would consider when estimating the fair value of the noncontrolling, non-marketable interest in CPAY.
In connection with the acquisition of CPAY, the Company is party to call and put arrangements with respect to the membership units that represent the remaining noncontrolling interest of CPAY. The call arrangement is exercisable by TSYS and the put arrangement is exercisable by the Seller. The put arrangement is outside the control of the Company by requiring the Company to purchase the Seller’s entire equity interest in CPAY at a put price at fair market value. At the time of the original acquisition, the redemption of the put option was considered probable based upon the passage of time of the second anniversary date. The put arrangement is recorded on the balance sheet and is classified as redeemable noncontrolling interest outside of permanent equity.
86
In February 2014, the Company purchased an additional 15% equity interest in CPAY for $37.5 million, reducing its redeemable noncontrolling interest in CPAY to 25%. As a result of this transaction, the call and put arrangements for CPAY, representing 25% of its total outstanding equity interests, were extended and may now be exercised at the discretion of TSYS or the Seller on the third anniversary of the closing of the additional purchase and upon the recurrence of certain other specified events.
The put option is not currently redeemable, but redemption is considered probable based upon the passage of time of the third anniversary date of the 2014 purchase of additional equity. As such, the Company has adopted the accounting policy to accrete changes in the redemption value over the period from the date of issuance to the earliest redemption date, which the Company believes to be in 2017. If the put option was redeemable as of December 31, 2015, the redemption value was estimated to be approximately $23.4 million. The Company did not accrete any changes to the redemption value as the balance as of December 31, 2015 exceeded the accretion fair value amount.
Pro forma Results of Operations
The pro forma revenue and earnings of TSYS’ acquisitions other than NetSpend are not material to the consolidated financial statements.
| Note 25 | Collaborative Arrangement |
TSYS has a 45% ownership interest in an enterprise jointly owned with two other entities which operates aircraft for the owners’ internal use. The arrangement allows each entity access to the aircraft and each entity pays for its usage of the aircraft. Each quarter, the net operating costs of the enterprise are shared among the owners based on their respective ownership percentage.
TSYS records its usage of the aircraft and its share of net operating costs of the enterprise in selling, general and administrative expenses.
87
| Note 26 | Earnings Per Share |
The following table illustrates basic and diluted EPS under the guidance of GAAP for the years ended December 31, 2015, 2014 and 2013:
| 2015 | 2014 | 2013 | ||||||||||||||||||||||
| (in thousands, except per share data) | Common Stock |
Participating Securities |
Common Stock |
Participating Securities |
Common Stock |
Participating Securities |
||||||||||||||||||
| Basic EPS: |
||||||||||||||||||||||||
| Net income |
$ | 364,044 | $ | 322,872 | $ | 244,750 | ||||||||||||||||||
| Less income allocated to nonvested awards |
(3,164 | ) | 3,164 | (3,308 | ) | 3,308 | (1,595 | ) | 1,595 | |||||||||||||||
|
|
|
|
|
|
|
|
|
|
|
|
|
|||||||||||||
| Net income allocated to common stock for EPS calculation(a) |
$ | 360,880 | 3,164 | $ | 319,564 | 3,308 | $ | 243,155 | 1,595 | |||||||||||||||
|
|
|
|
|
|
|
|
|
|
|
|
|
|||||||||||||
| Average common shares outstanding(b) |
182,465 | 1,617 | 184,297 | 1,925 | 187,145 | 1,246 | ||||||||||||||||||
|
|
|
|
|
|
|
|
|
|
|
|
|
|||||||||||||
| Basic EPS(a)/(b) |
$ | 1.98 | 1.96 | $ | 1.73 | 1.72 | $ | 1.30 | 1.28 | |||||||||||||||
|
|
|
|
|
|
|
|
|
|
|
|
|
|||||||||||||
| Diluted EPS: |
||||||||||||||||||||||||
| Net income |
$ | 364,044 | $ | 322,872 | $ | 244,750 | ||||||||||||||||||
| Less income allocated to nonvested awards |
(3,148 | ) | 3,148 | (3,288 | ) | 3,288 | (1,585 | ) | 1,585 | |||||||||||||||
|
|
|
|
|
|
|
|
|
|
|
|
|
|||||||||||||
| Net income allocated to common stock for EPS calculation(c) |
$ | 360,896 | 3,148 | $ | 319,584 | 3,288 | $ | 243,165 | 1,585 | |||||||||||||||
|
|
|
|
|
|
|
|
|
|
|
|
|
|||||||||||||
| Average common shares outstanding |
182,465 | 1,617 | 184,297 | 1,925 | 187,145 | 1,246 | ||||||||||||||||||
| Increase due to assumed issuance of shares related to common equivalent shares outstanding |
1,157 | 1,459 | 1,648 | |||||||||||||||||||||
|
|
|
|
|
|
|
|
|
|
|
|
|
|||||||||||||
| Average common and common equivalent shares outstanding(d) |
183,622 | 1,617 | 185,756 | 1,925 | 188,793 | 1,246 | ||||||||||||||||||
|
|
|
|
|
|
|
|
|
|
|
|
|
|||||||||||||
| Diluted EPS(c)/(d) |
$ | 1.97 | 1.95 | $ | 1.72 | 1.71 | $ | 1.29 | 1.27 | |||||||||||||||
|
|
|
|
|
|
|
|
|
|
|
|
|
|||||||||||||
The diluted EPS calculation excludes stock options and nonvested awards that are convertible into 0.6 million, 1.1 million and 2.9 million common shares for the years ended December 31, 2015, 2014 and 2013, respectively, because their inclusion would have been anti-dilutive.
88
| Note 27 | Subsequent Events |
Agreement to Acquire Capital Stock of TransFirst Holdings Corp.
On January 26, 2016, TSYS announced it entered into a definitive agreement with Vista Equity Partners Fund V, L.P. and certain related funds (collectively, “Vista”) to acquire TransFirst Holdings Corp. (“TransFirst”), a Vista portfolio company and leading U S. merchant solutions provider, in an all-cash transaction valued at approximately $2.35 billion. The Company intends to finance the TransFirst acquisition with cash on hand and approximately $2.4 billion of additional indebtedness. In connection with the transaction, the Company entered into a commitment letter with certain of its lenders to provide a $2.0 billion bridge term loan facility (the “Bridge Term Loan Facility”) to finance the TransFirst acquisition to the extent the Company has not obtained alternative financing before the closing of the transaction. The transaction is currently expected to close in the second quarter of 2016 and is subject to regulatory approvals and other customary closing conditions. For additional information regarding the transaction, see TSYS’ Current Reports on Form 8-K filed on January 26, 2016 and January 27, 2016, which include the press release announcing the transaction, the stock purchase agreement for the transaction and the commitment letter for the Bridge Term Loan Facility. There can be no assurance that the proposed acquisition will be completed, or if it is completed, that the expected benefits of the transaction will be realized.
Entry into Credit Agreement
On February 23, 2016, TSYS entered into a Credit Agreement (the “Credit Agreement”) with JPMorgan Chase Bank, N.A., as Administrative Agent and L/C Issuer, Bank of America, N.A., as Syndication Agent and L/C Issuer, The Bank of Tokyo-Mitsubishi UFJ, LTD., U.S. Bank National Association and Wells Fargo Bank, National Association, as Co-Documentation Agents, and the other lenders party thereto, with J.P. Morgan Securities LLC and Merrill Lynch, Pierce, Fenner & Smith Incorporated, The Bank of Tokyo-Mitsubishi UFJ, LTD., U.S. Bank National Association and Wells Fargo Securities, LLC as joint lead arrangers and joint bookrunners. The Credit Agreement provides TSYS with a $700 million five-year term loan facility broken consisting of (i) a $300 million term loan (the “Refinancing Term Loan”) funded upon entry into the Credit Agreement and (ii) a $400 million term loan (the “Delayed Draw Term Loan”). The Credit Agreement also provides TSYS with a $800 million unsecured revolving credit facility (the “Revolving Credit Facility”), which includes a $50 million sub-facility for the issuance of standby letters of credit.
The Refinancing Term Loan was used to repay in full TSYS’ outstanding loans and other obligations under that certain Credit Agreement, dated as of September 10, 2012, by and among the Company, the lenders party thereto and JPMorgan Chase Bank, N.A., as administrative agent thereunder, as amended, and that certain Credit Agreement, dated as of April 8, 2013, by and among the Company, the lenders party thereto and JPMorgan Chase Bank, N.A., as administrative agent thereunder, as amended. The Delayed Draw Term Loan will be available to be drawn to finance, in part, the TransFirst acquisition and related transactions, upon satisfaction of a limited set of conditions precedent. The Revolving Loan Facility will be available for draws for purposes of working capital and other general corporate purposes, including to finance, in part, the TransFirst acquisition and related transactions upon satisfaction of a limited set of conditions precedent.
Upon entering into the Credit Agreement, the total commitments under the Bridge Term Loan Facility were reduced from $2.0 billion to $1.15 billion by the amount of the Delayed Draw Term Loan commitment and the portion of the Revolving Loan Facility commitments in excess of $350 million.
For additional information regarding the Credit Agreement, see TSYS’ Current Report on Form 8-K filed on February 23, 2016.
Management performed an evaluation of the Company’s activity as of the date these audited financial statements were issued, and has concluded that, other than as set forth above, there are no significant subsequent events requiring disclosure.
89
Report of Independent Registered Public Accounting Firm
The Board of Directors
Total System Services, Inc.:
We have audited the accompanying consolidated balance sheets of Total System Services, Inc. and subsidiaries (the Company) as of December 31, 2015 and 2014, and the related consolidated statements of income, comprehensive income, cash flows and changes in equity for each of the years in the three-year period ended December 31, 2015. We also have audited the Company’s internal control over financial reporting as of December 31, 2015, based on criteria established in Internal Control — Integrated Framework (2013) issued by the Committee of Sponsoring Organizations of the Treadway Commission (COSO). The Company’s management is responsible for these consolidated financial statements, for maintaining effective internal control over financial reporting, and for its assessment of the effectiveness of internal control over financial reporting, included in the accompanying Management’s Report on Internal Control Over Financial Reporting. Our responsibility is to express an opinion on these consolidated financial statements and an opinion on the Company’s internal control over financial reporting based on our audits.
We conducted our audits in accordance with the standards of the Public Company Accounting Oversight Board (United States). Those standards require that we plan and perform the audits to obtain reasonable assurance about whether the financial statements are free of material misstatement and whether effective internal control over financial reporting was maintained in all material respects. Our audits of the consolidated financial statements included examining, on a test basis, evidence supporting the amounts and disclosures in the financial statements, assessing the accounting principles used and significant estimates made by management, and evaluating the overall financial statement presentation. Our audit of internal control over financial reporting included obtaining an understanding of internal control over financial reporting, assessing the risk that a material weakness exists, and testing and evaluating the design and operating effectiveness of internal control based on the assessed risk. Our audits also included performing such other procedures as we considered necessary in the circumstances. We believe that our audits provide a reasonable basis for our opinions.
A company’s internal control over financial reporting is a process designed to provide reasonable assurance regarding the reliability of financial reporting and the preparation of financial statements for external purposes in accordance with generally accepted accounting principles. A company’s internal control over financial reporting includes those policies and procedures that (1) pertain to the maintenance of records that, in reasonable detail, accurately and fairly reflect the transactions and dispositions of the assets of the company; (2) provide reasonable assurance that transactions are recorded as necessary to permit preparation of financial statements in accordance with generally accepted accounting principles, and that receipts and expenditures of the company are being made only in accordance with authorizations of management and directors of the company; and (3) provide reasonable assurance regarding prevention or timely detection of unauthorized acquisition, use, or disposition of the company’s assets that could have a material effect on the financial statements.
Because of its inherent limitations, internal control over financial reporting may not prevent or detect misstatements. Also, projections of any evaluation of effectiveness to future periods are subject to the risk that controls may become inadequate because of changes in conditions, or that the degree of compliance with the policies or procedures may deteriorate.
In our opinion, the consolidated financial statements referred to above present fairly, in all material respects, the financial position of Total System Services, Inc. and subsidiaries as of December 31, 2015 and 2014, and the results of their operations and their cash flows for each of the years in the three-year period ended December 31, 2015, in conformity with U.S. generally accepted accounting principles. Also in our opinion, Total System Services, Inc. maintained, in all material respects, effective internal control over financial reporting as of December 31, 2015, based on criteria established in Internal Control — Integrated Framework (2013) issued by the Committee of Sponsoring Organizations of the Treadway Commission (COSO).

Atlanta, Georgia
February 24, 2016
90
Management’s Report on Internal Control Over Financial Reporting
The management of Total System Services, Inc. (the Company) is responsible for establishing and maintaining adequate internal control over financial reporting as defined in Rule 13a-15(f) under the Securities Exchange Act of 1934. The Company maintains accounting and internal control systems which are intended to provide reasonable assurance that assets are safeguarded against loss from unauthorized use or disposition, transactions are executed in accordance with management’s authorization and accounting records are reliable for preparing financial statements in accordance with accounting principles generally accepted in the United States.
Internal control over financial reporting cannot provide absolute assurance of achieving financial reporting objectives because of its inherent limitations. Internal control over financial reporting is a process that involves human diligence and compliance and is subject to lapses in judgment and breakdowns resulting from human failures. Internal control over financial reporting also can be circumvented by collusion or improper management override. Because of such limitations, there is a risk that material misstatements may not be prevented or detected on a timely basis by internal control over financial reporting. However, these inherent limitations are known features of the financial reporting process. Therefore, it is possible to design into the process safeguards to reduce, though not eliminate, risk.
The Company’s management assessed the effectiveness of the Company’s internal control over financial reporting as of December 31, 2015. In making this assessment, management used the criteria set forth by the Committee of Sponsoring Organizations (COSO) of the Treadway Commission in Internal Control — Integrated Framework 2013.
Based on our assessment, management believes that, as of December 31, 2015, the Company’s internal control over financial reporting is effective based on those criteria.
KPMG LLP, the independent registered public accounting firm who audited the Company’s consolidated financial statements, has issued an attestation report on the effectiveness of internal control over financial reporting as of December 31, 2015 that appears on the preceding page.
|
|
| |||
| M. Troy Woods Chairman, President & Chief Executive Officer |
Paul M. Todd Senior Executive Vice President & Chief Financial Officer | |||


91
Quarterly Financial Data (Unaudited), Stock Price, Dividend Information
TSYS’ common stock trades on the New York Stock Exchange (NYSE) under the symbol “TSS.” Price and volume information appears under the abbreviation “TotlSysSvc” in NYSE daily stock quotation listings. As of February 19, 2016, there were 20,477 holders of record of TSYS common stock, some of whom are holders in nominee name for the benefit of different shareholders.
The 2015 fourth quarter dividend of $0.10 per share was declared on December 2, 2015, and was paid January 4, 2016, to shareholders of record on December 17, 2015. The 2014 fourth quarter dividend of $0.10 per share was declared on December 2, 2014, and was paid January 2, 2015, to shareholders of record on December 19, 2014. Total dividends declared in 2015 and in 2014 amounted to $73.7 million and $74.8 million, respectively. It is the present intention of the Board of Directors of TSYS to continue to pay cash dividends on its common stock.
Presented here is a summary of the unaudited quarterly financial data for the years ended December 31, 2015 and 2014.
| (in thousands, except per share data) |
First Quarter |
Second Quarter |
Third Quarter |
Fourth Quarter |
||||||||||||||
| 2015 | Revenues |
$ | 662,156 | 692,652 | 707,890 | 716,843 | ||||||||||||
| Operating income |
122,496 | 130,602 | 163,104 | 117,905 | ||||||||||||||
| Net income attributable to TSYS common shareholders |
77,755 | 82,839 | 120,622 | 82,828 | ||||||||||||||
| Basic earnings per share attributable to TSYS common shareholders |
0.42 | 0.45 | 0.66 | 0.45 | ||||||||||||||
| Diluted earnings per share attributable to TSYS common shareholders |
0.42 | 0.45 | 0.65 | 0.45 | ||||||||||||||
| Cash dividends declared |
0.10 | 0.10 | 0.10 | 0.10 | ||||||||||||||
| Stock prices: |
||||||||||||||||||
| High |
39.02 | 42.72 | 48.64 | 56.37 | ||||||||||||||
| Low |
33.27 | 37.89 | 41.52 | 45.82 | ||||||||||||||
| Close |
38.15 | 41.77 | 45.43 | 49.80 | ||||||||||||||
| 2014 | Revenues |
$ | 592,848 | 602,036 | 616,891 | 635,104 | ||||||||||||
| Operating income |
80,697 | 98,763 | 129,407 | 122,773 | ||||||||||||||
| Net income attributable to TSYS common shareholders |
49,303 | 109,904 | 83,805 | 79,860 | ||||||||||||||
| Basic earnings per share attributable to TSYS common shareholders |
0.26 | 0.59 | 0.45 | 0.43 | ||||||||||||||
| Diluted earnings per share attributable to TSYS common shareholders |
0.26 | 0.58 | 0.45 | 0.43 | ||||||||||||||
| Cash dividends declared |
0.10 | 0.10 | 0.10 | 0.10 | ||||||||||||||
| Stock prices: |
||||||||||||||||||
| High |
33.28 | 32.70 | 32.41 | 34.41 | ||||||||||||||
| Low |
28.71 | 28.70 | 30.63 | 28.83 | ||||||||||||||
| Close |
30.41 | 31.41 | 30.96 | 33.96 | ||||||||||||||
92
STOCK PERFORMANCE GRAPH
The following graph compares the yearly percentage change in cumulative shareholder return on TSYS stock with the cumulative total return of the Standard & Poor’s 500 Index and the Standard & Poor’s Systems Software Index for the last five fiscal years (assuming a $100 investment on December 31, 2010 and reinvestment of all dividends).
COMPARISON OF 5 YEAR CUMULATIVE TOTAL RETURN
Among TSYS, the S&P 500 Index, and the S&P Systems Software Index
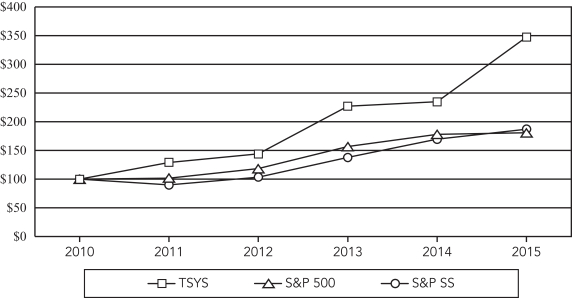
| 2010 | 2011 | 2012 | 2013 | 2014 | 2015 | |||||||||||||||||||
| TSYS |
$ | 100.00 | $ | 129.35 | $ | 144.12 | $ | 227.30 | $ | 234.93 | $ | 347.59 | ||||||||||||
| S&P 500 |
$ | 100.00 | $ | 102.11 | $ | 118.45 | $ | 156.82 | $ | 178.29 | $ | 180.75 | ||||||||||||
| S&P SS |
$ | 100.00 | $ | 90.05 | $ | 103.76 | $ | 137.89 | $ | 169.62 | $ | 187.38 | ||||||||||||
93