Attached files
| file | filename |
|---|---|
| 8-K - 8-K - NEWFIELD EXPLORATION CO /DE/ | a16-4275_28k.htm |
| EX-99.2 - EX-99.2 - NEWFIELD EXPLORATION CO /DE/ | a16-4275_2ex99d2.htm |
| EX-99.1 - EX-99.1 - NEWFIELD EXPLORATION CO /DE/ | a16-4275_2ex99d1.htm |
Exhibit 99.3
@NFX – YE15 Update and 2016 Outlook February 24, 2016
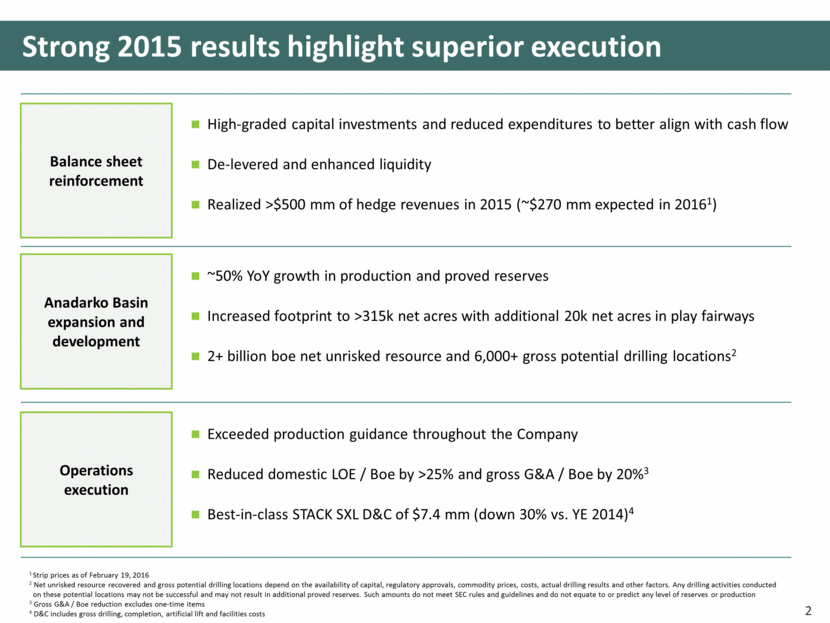
~50% YoY growth in production and proved reserves Increased footprint to >315k net acres with additional 20k net acres in play fairways 2+ billion boe net unrisked resource and 6,000+ gross potential drilling locations2 Strong 2015 results highlight superior execution Anadarko Basin expansion and development Operations execution Exceeded production guidance throughout the Company Reduced domestic LOE / Boe by >25% and gross G&A / Boe by 20%3 Best-in-class STACK SXL D&C of $7.4 mm (down 30% vs. YE 2014)4 2 1 Strip prices as of February 19, 2016 2 Net unrisked resource recovered and gross potential drilling locations depend on the availability of capital, regulatory approvals, commodity prices, costs, actual drilling results and other factors. Any drilling activities conducted on these potential locations may not be successful and may not result in additional proved reserves. Such amounts do not meet SEC rules and guidelines and do not equate to or predict any level of reserves or production 3 Gross G&A / Boe reduction excludes one-time items 4 D&C includes gross drilling, completion, artificial lift and facilities costs Balance sheet reinforcement High-graded capital investments and reduced expenditures to better align with cash flow De-levered and enhanced liquidity Realized >$500 mm of hedge revenues in 2015 (~$270 mm expected in 20161)
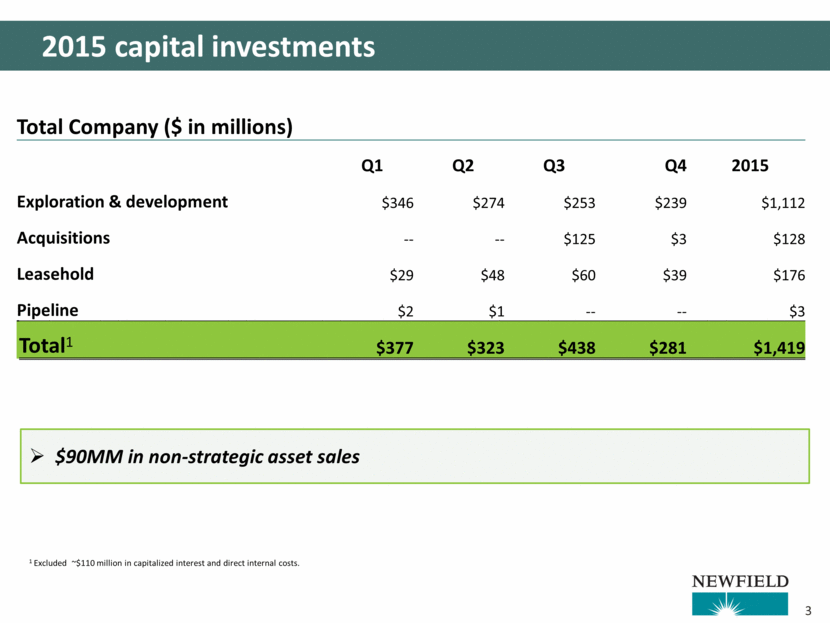
2015 capital investments Total Company ($ in millions) Q1 Q2 Q3 Q4 2015 Exploration & development $346 $274 $253 $239 $1,112 Acquisitions -- -- $125 $3 $128 Leasehold $29 $48 $60 $39 $176 Pipeline $2 $1 -- -- $3 Total1 $377 $323 $438 $281 $1,419 $90MM in non-strategic asset sales 1 Excluded ~$110 million in capitalized interest and direct internal costs. 3
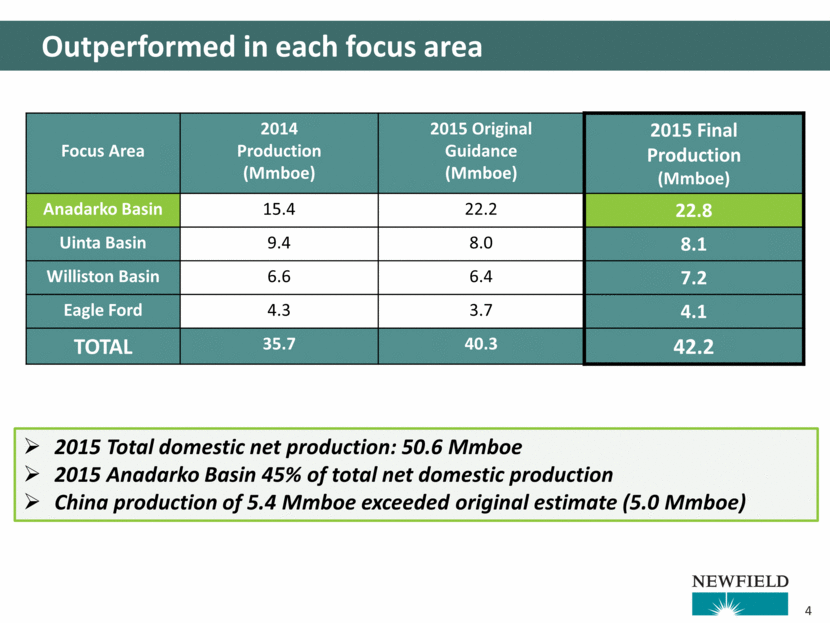
Outperformed in each focus area Focus Area 2014 Production (Mmboe) 2015 Original Guidance (Mmboe) 2015 Final Production (Mmboe) Anadarko Basin 15.4 22.2 22.8 Uinta Basin 9.4 8.0 8.1 Williston Basin 6.6 6.4 7.2 Eagle Ford 4.3 3.7 4.1 TOTAL 35.7 40.3 42.2 2015 Total domestic net production: 50.6 Mmboe 2015 Anadarko Basin 45% of total net domestic production China production of 5.4 Mmboe exceeded original estimate (5.0 Mmboe) 4
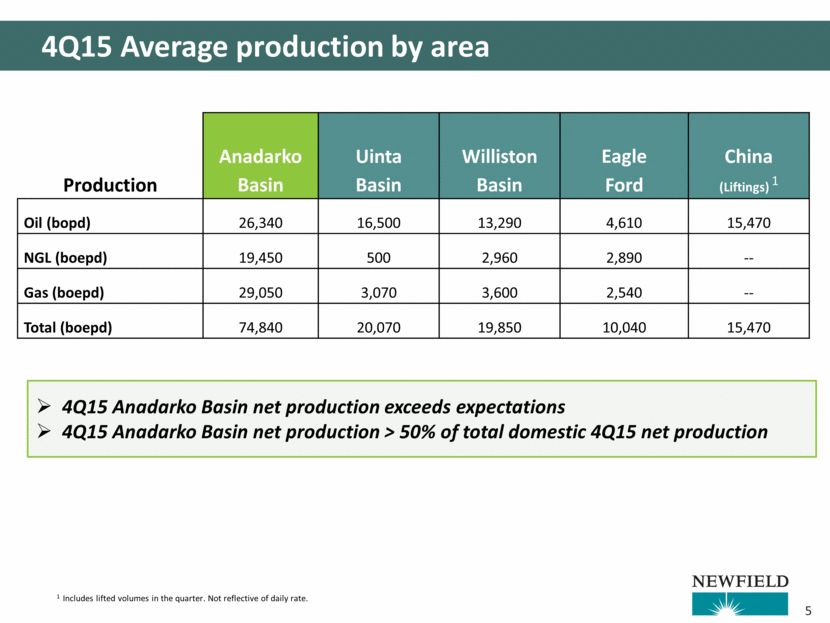
4Q15 Average production by area Production Anadarko Basin Uinta Basin Williston Basin Eagle Ford China (Liftings) 1 Oil (bopd) 26,340 16,500 13,290 4,610 15,470 NGL (boepd) 19,450 500 2,960 2,890 -- Gas (boepd) 29,050 3,070 3,600 2,540 -- Total (boepd) 74,840 20,070 19,850 10,040 15,470 1 Includes lifted volumes in the quarter. Not reflective of daily rate. 4Q15 Anadarko Basin net production exceeds expectations 4Q15 Anadarko Basin net production > 50% of total domestic 4Q15 net production 5
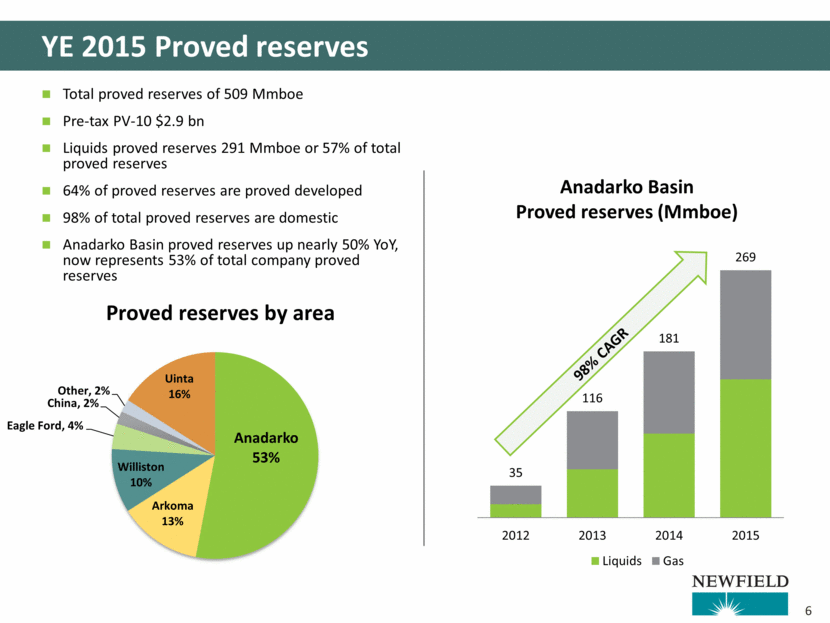
YE 2015 Proved reserves Total proved reserves of 509 Mmboe Pre-tax PV-10 $2.9 bn Liquids proved reserves 291 Mmboe or 57% of total proved reserves 64% of proved reserves are proved developed 98% of total proved reserves are domestic Anadarko Basin proved reserves up nearly 50% YoY, now represents 53% of total company proved reserves Proved reserves by area Anadarko Basin Proved reserves (Mmboe) 98% CAGR 6 Anadarko 53% Arkoma 13% Williston 10% Eagle Ford , 4% China , 2% Other , 2% Uinta 16% 35 116 181 269 2012 2013 2014 2015 Liquids Gas
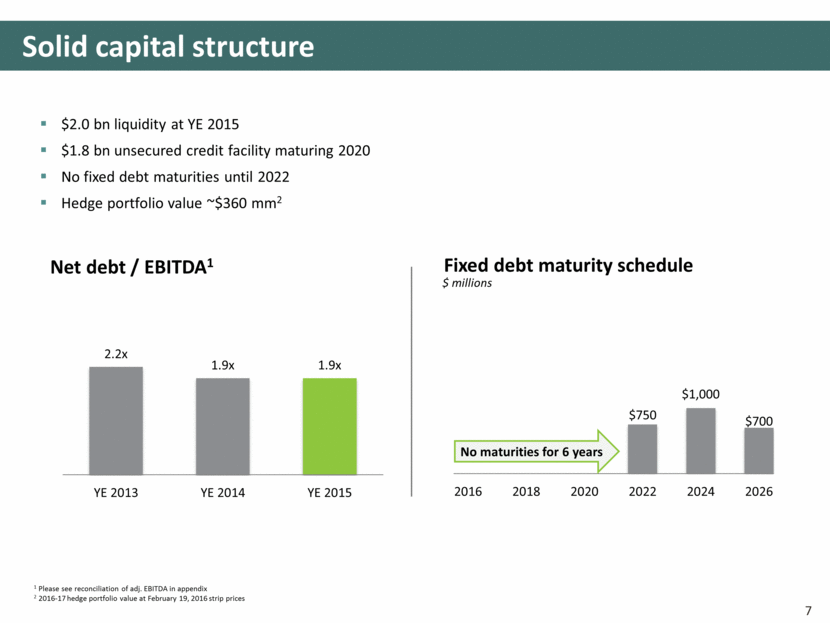
Solid capital structure $2.0 bn liquidity at YE 2015 $1.8 bn unsecured credit facility maturing 2020 No fixed debt maturities until 2022 Hedge portfolio value ~$360 mm2 1 Please see reconciliation of adj. EBITDA in appendix 2 2016-17 hedge portfolio value at February 19, 2016 strip prices Net debt / EBITDA1 Fixed debt maturity schedule $ millions 7 No maturities for 6 years $750 $ 1,000 $700 2016 2018 2020 2022 2024 2026 2.2x 1.9x 1.9x YE 2013 YE 2014 YE 2015
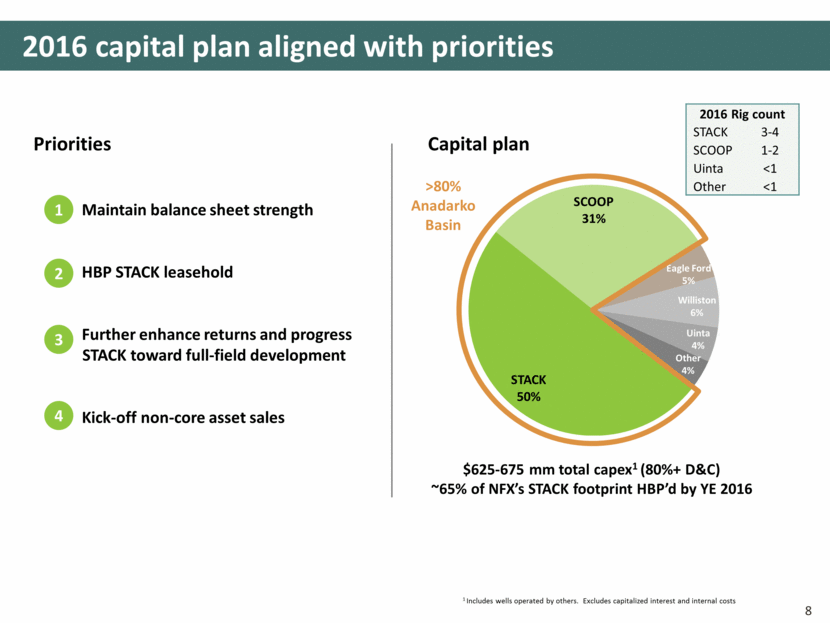
Capital plan $625-675 mm total capex1 (80%+ D&C) ~65% of NFX’s STACK footprint HBP’d by YE 2016 Maintain balance sheet strength HBP STACK leasehold Further enhance returns and progress STACK toward full-field development Kick-off non-core asset sales 2016 capital plan aligned with priorities 1 2 3 >80% Anadarko Basin 8 1 Includes wells operated by others. Excludes capitalized interest and internal costs Priorities 2016 Rig count STACK 3-4 SCOOP 1-2 Uinta <1 Other <1 4 STACK 50% SCOOP 31% Eagle Ford 5% Williston 6% Uinta 4% Other 4%
Anadarko Basin
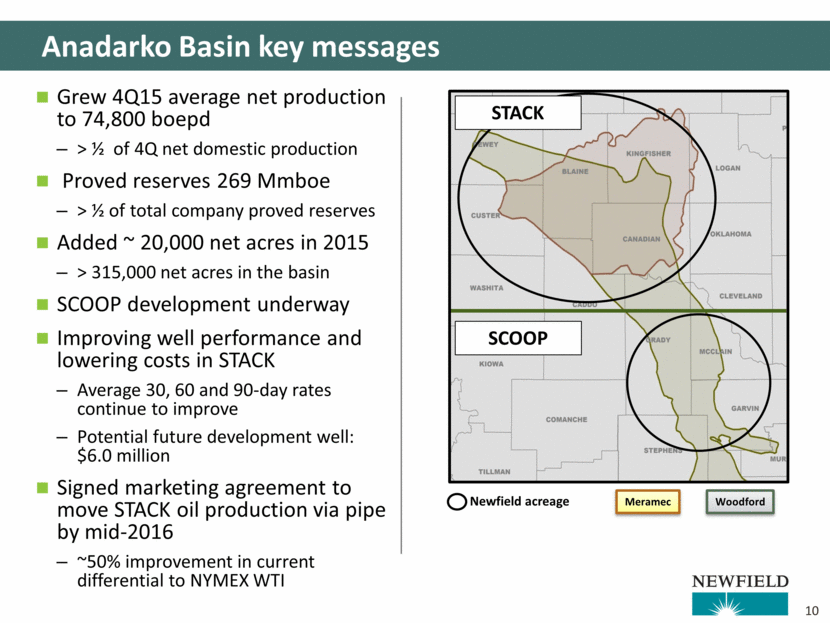
Anadarko Basin key messages Newfield acreage Meramec Woodford SCOOP STACK Grew 4Q15 average net production to 74,800 boepd > ½ of 4Q net domestic production Proved reserves 269 Mmboe > ½ of total company proved reserves Added ~ 20,000 net acres in 2015 > 315,000 net acres in the basin SCOOP development underway Improving well performance and lowering costs in STACK Average 30, 60 and 90-day rates continue to improve Potential future development well: $6.0 million Signed marketing agreement to move STACK oil production via pipe by mid-2016 ~50% improvement in current differential to NYMEX WTI 10
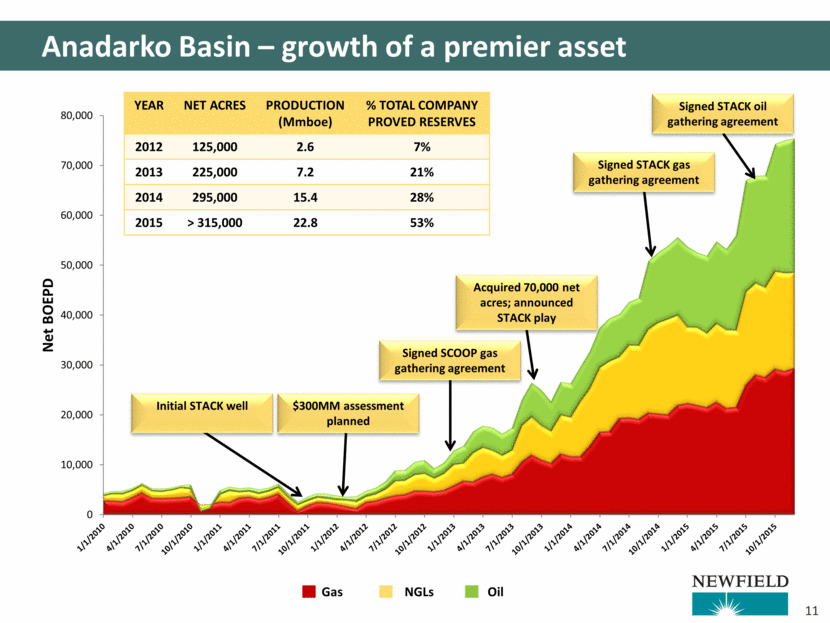
Anadarko Basin – growth of a premier asset Initial STACK well $300MM assessment planned Signed SCOOP gas gathering agreement Acquired 70,000 net acres; announced STACK play YEAR NET ACRES PRODUCTION (Mmboe) % TOTAL COMPANY PROVED RESERVES 2012 125,000 2.6 7% 2013 225,000 7.2 21% 2014 295,000 15.4 28% 2015 > 315,000 22.8 53% Signed STACK gas gathering agreement Signed STACK oil gathering agreement Gas NGLs Oil 11 0 10,000 20,000 30,000 40,000 50,000 60,000 70,000 80,000 Net BOEPD
2015 Anadarko Basin SXL well results (3-stream) Well Type # Wells Avg. Lateral Length Avg. Gross 30-Day Rate Avg. 30-Day Oil % Avg. 30-Day Liquids % Avg. Gross 60-Day Rate Avg. 60-Day Oil % Avg. 60-Day Liquids % Avg. Gross 90-Day Rate Avg. 90-Day Oil % Avg. 90-Day Liquids % SCOOP Wet Gas1 9 8,521’ 2,231 boepd 27% 61% 2,126 boepd 21% 55% 1,984 boepd 20% 54% SCOOP Oil2 26 9,444’ 1,638 boepd 49% 76% 1,500 boepd 45% 73% 1,387 boepd 43% 72% STACK3 54 9,944’ 1,122 boepd 68% 83% 1,039 boepd 64% 80% 960 boepd 61% 79% 3-stream 30-day average from 54 STACK SXL wells: 1,122 boepd (68% oil & 83% liquids) 1 Includes only 5 wells for 60 and 90-day rate. 2 Includes only 20 wells for 60 and 90-day rates. 3 Includes only 46 and 42 wells for 60 and 90-day rates, respectively. 12
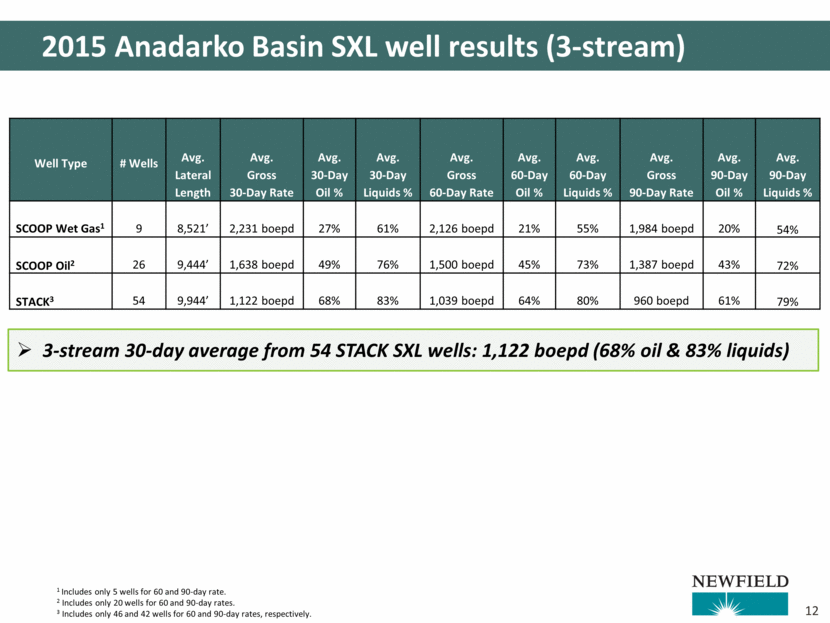
Peoples 1-29H (4,768’) IP30: 1,758 boepd (48% oil) Cimarex Vessels 1H-3526X (9,937’) IP30: 2,238 boepd (45% oil) Cimarex Ludwig 1-22-15XH (9,711’) IP24: 2,782 boepd (76% oil) Continental Olive Lee 1H-22 (4,594’) IP30: 1,798 boepd (17% oil) Devon Stiles 1407 2-4MH (5,019’) IP30*: 1,860 boepd Payrock Deep River 30-1MH (4,929’) IP30: 956 boepd (68% oil) Gastar Hansens 1607 1-12MH (4,880’) IP30: 1,430 boepd (60% oil) Payrock Clayton 1H-0904X (9,864’) IP30*: 3,180 boepd (15% oil) Cimarex Robinson-Payday16-1H (4,249’) IP24: 910 boepd (55% oil) Carrera Showboat 1003 1AH (9,756’) IP30*: 1,750 boepd Devon Post Brothers 1H-27X (10,066’) IP30*: 1,701 boepd (51% oil) Newfield Hornsilver 0334-4H (10,155’) IP30: 1,015 boepd (66% oil) Devon Scheffler 1H-9X (10,150’) IP30*: 1,843 boepd (77% oil) Newfield Morning Thunder 36-1H (4,721’) IP30*: 1,980 boepd Devon Peters 1H-15X (10,190’) IP30*: 1,040 boepd (82% oil) Newfield Vinnie 1-15H (4,732’) IP30*: 2,430 boepd Cimarex Source: IHS, investor presentations and public market data Note: IP* denotes three stream rate (oil / gas / NGLs) Horizontal STACK play being rapidly delineated across ~3,000+ square mile area with significant vertical well control ~30 rigs currently operating in STACK with ~350 wells spud and an additional ~100 wells permitted since January 2015 ~50% of DVN’S recent Felix acquisition overlaps NFX acreage (~$20,000/acre purchase price) Significant upside from downspacing and additional horizons NFX operated Industry hz wells (2014+) Industry hz spuds/permits Vertical STACK penetrations OBO NFX STACK footprint ~225k net acres, ~65% HBP (YE16) Redhead 1H-9XX (11,787’) IP30*: 1,287 boepd (80% oil) Newfield Haley pad avg (4,628’) IP30*: 1,850 boepd (18% oil) Devon Eve 1506 1-17MH (4,930’) IP30: 948 boepd (86% oil) Payrock James 1H-2X (9,993’) IP30*: 2,166 boepd (69% oil) Newfield Gruntmeir 1H-18X (10,187’) IP30*: 1,202 boepd (71% oil) Newfield Laura 1H-17X (10,073’) IP30*: 1,326 boepd (66% oil) Newfield FSB 1H-26X (9,857’) IP30*: 1,608 boepd (69% oil) Newfield 13 Large, delineated STACK acreage footprint
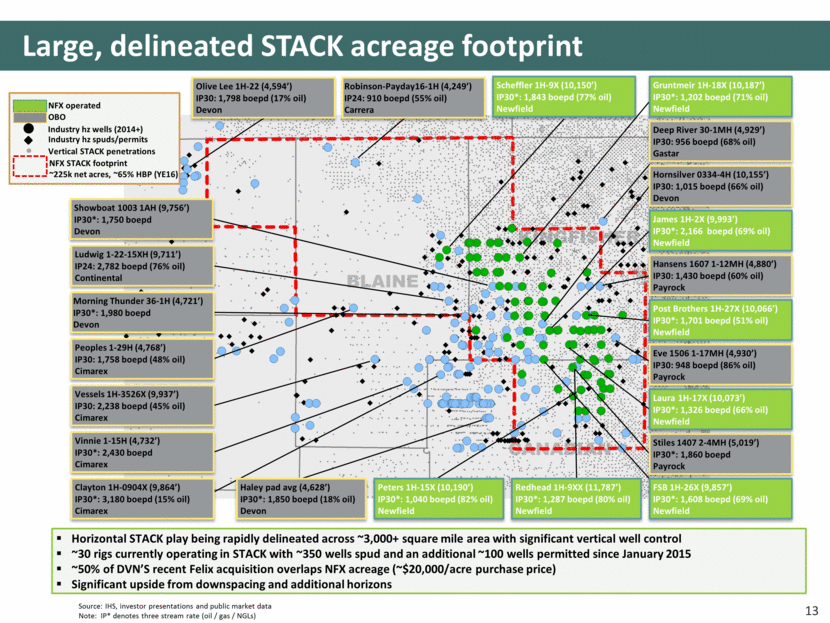
Delivering solid STACK well productivity 14 Improved results driven by: Increased fracture stages Tighter cluster spacing Higher proppant volumes Additional future upside: Lateral placement within vertical section Emerging stimulation technologies (diverters, etc) 5k vs. 10k optimization Flow-back procedures 2015 2014 2012-13 STACK SXL actual daily production vs 950 Mboe type curve1 Boepd 950 Mboe1 Days online Average daily production (Boepd) 2015 30 days 60 days 90 days 1,122 1,039 960 2014 775 768 733 2012-13 785 727 674 Note: 77 wells with at least 7,500’ of gross perforated interval and at least 30 days of production in the respective calendar year 1 EUR refers to potential recoverable oil and natural gas hydrocarbon quantities with ethane processing and may not be reflective of proved reserves. Actual quantities that may be recovered could vary significantly 0 200 400 600 800 1,000 1,200 1,400 0 50 100 150 200 250 300 350 400 450 500
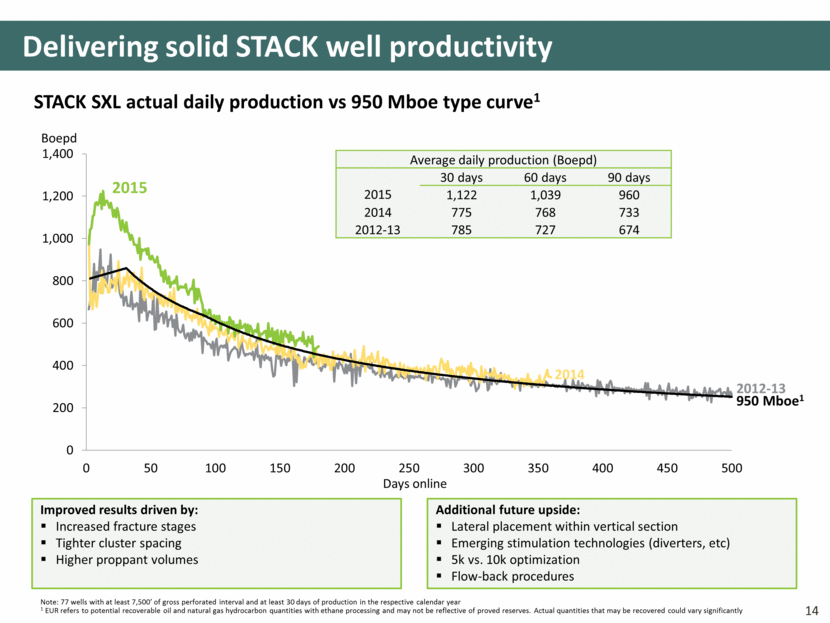
2015 Avg 2015 Best-in-class 2016E Development CWC ($ mm) $8.6 $7.4 $7.32 $6.0 Avg GPI (ft) 9,944 9,897 10,000 10,000 # Wells 60 1 30 Cost benefits in development Preset operations Well design Completion design Pad operations Fluids & disposal Common facilities $867 $748 $700 – $750 $600 Driving toward full-field STACK development 15 Facilities Completion Drilling 1 Gross completed well cost includes gross drilling, completion, artificial lift and facilities costs. Includes wells drilled to total depth with at least 7,500' of gross perforated interval in each respective period 2 Midpoint of 2016E guidance Facilities Completion Drilling Facilities Completion Drilling Facilities Completion Drilling STACK SXL gross well cost per gross perforated interval ($ / GPI ft)1
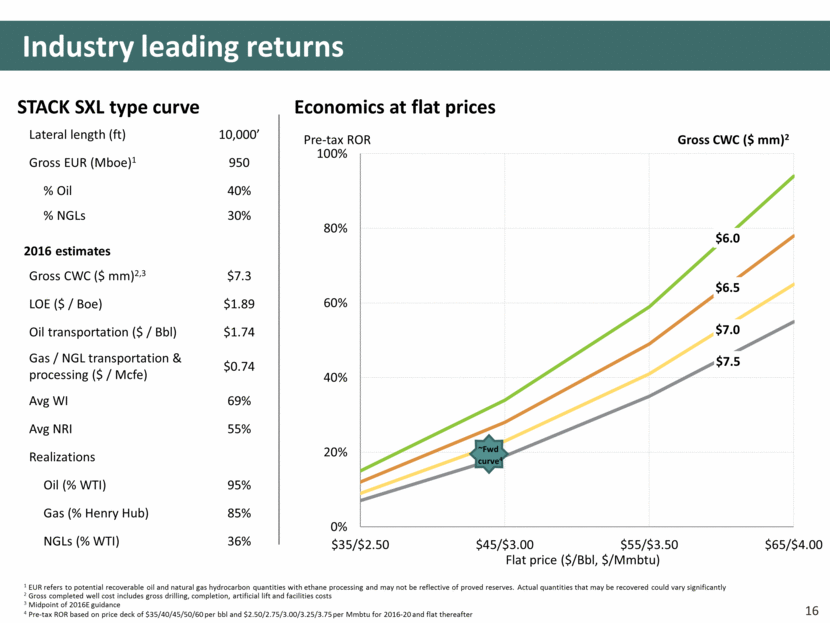
Lateral length (ft) 10,000’ Gross EUR (Mboe)1 950 % Oil 40% % NGLs 30% 2016 estimates Gross CWC ($ mm)2,3 $7.3 LOE ($ / Boe) $1.89 Oil transportation ($ / Bbl) $1.74 Gas / NGL transportation & processing ($ / Mcfe) $0.74 Avg WI 69% Avg NRI 55% Realizations Oil (% WTI) 95% Gas (% Henry Hub) 85% NGLs (% WTI) 36% 16 Industry leading returns STACK SXL type curve 1 EUR refers to potential recoverable oil and natural gas hydrocarbon quantities with ethane processing and may not be reflective of proved reserves. Actual quantities that may be recovered could vary significantly 2 Gross completed well cost includes gross drilling, completion, artificial lift and facilities costs 3 Midpoint of 2016E guidance 4 Pre-tax ROR based on price deck of $35/40/45/50/60 per bbl and $2.50/2.75/3.00/3.25/3.75 per Mmbtu for 2016-20 and flat thereafter Pre-tax ROR Economics at flat prices $6.0 Gross CWC ($ mm)2 $6.5 $7.0 $7.5 ~Fwd Flat price ($/Bbl, $/Mmbtu) curve4 0% 20% 40% 60% 80% 100% $35/$2.50 $45/$3.00 $55/$3.50 $65/$4.00
Appendix
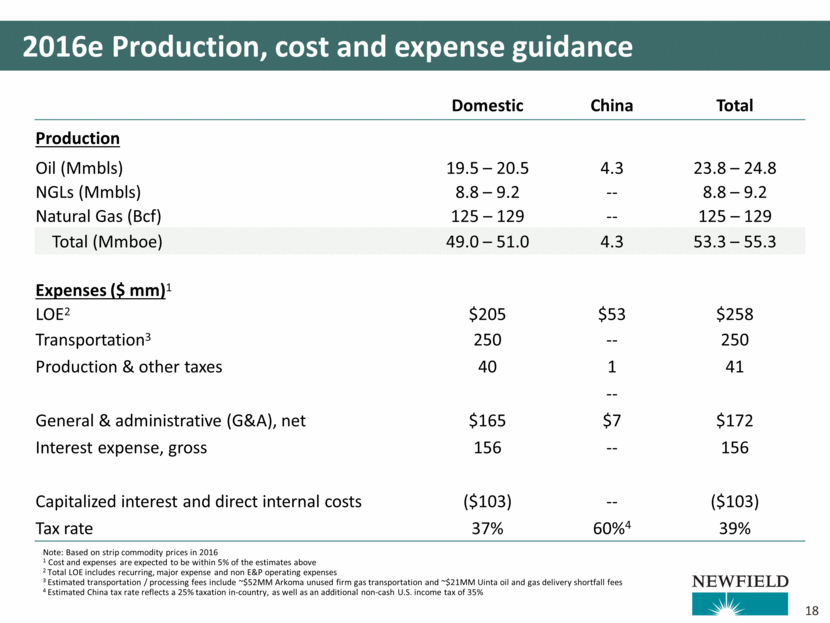
2016e Production, cost and expense guidance Domestic China Total Production Oil (Mmbls) 19.5 – 20.5 4.3 23.8 – 24.8 NGLs (Mmbls) 8.8 – 9.2 -- 8.8 – 9.2 Natural Gas (Bcf) 125 – 129 -- 125 – 129 Total (Mmboe) 49.0 – 51.0 4.3 53.3 – 55.3 Expenses ($ mm)1 LOE2 $205 $53 $258 Transportation3 250 -- 250 Production & other taxes 40 1 41 -- General & administrative (G&A), net $165 $7 $172 Interest expense, gross 156 -- 156 Capitalized interest and direct internal costs ($103) -- ($103) Tax rate 37% 60%4 39% Note: Based on strip commodity prices in 2016 1 Cost and expenses are expected to be within 5% of the estimates above 2 Total LOE includes recurring, major expense and non E&P operating expenses 3 Estimated transportation / processing fees include ~$52MM Arkoma unused firm gas transportation and ~$21MM Uinta oil and gas delivery shortfall fees 4 Estimated China tax rate reflects a 25% taxation in-country, as well as an additional non-cash U.S. income tax of 35% 18
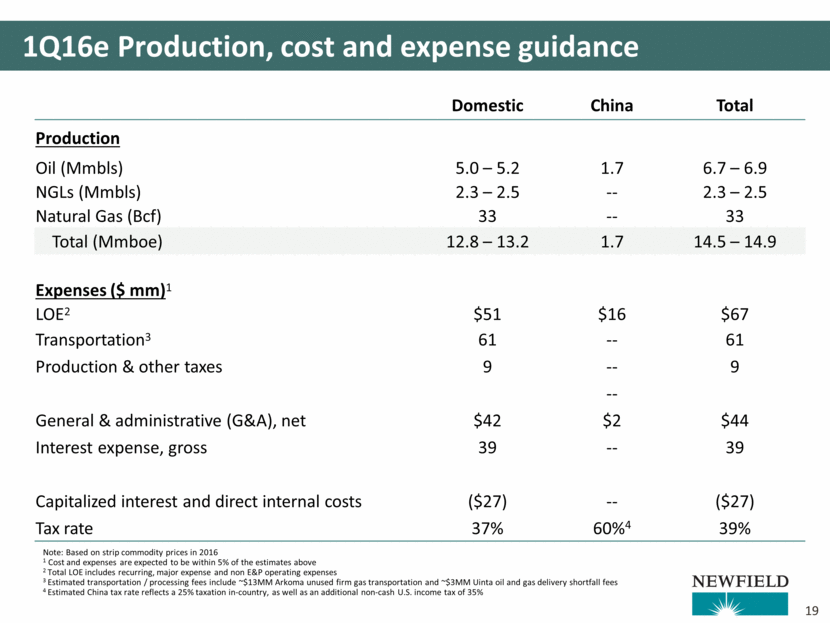
1Q16e Production, cost and expense guidance Domestic China Total Production Oil (Mmbls) 5.0 – 5.2 1.7 6.7 – 6.9 NGLs (Mmbls) 2.3 – 2.5 -- 2.3 – 2.5 Natural Gas (Bcf) 33 -- 33 Total (Mmboe) 12.8 – 13.2 1.7 14.5 – 14.9 Expenses ($ mm)1 LOE2 $51 $16 $67 Transportation3 61 -- 61 Production & other taxes 9 -- 9 -- General & administrative (G&A), net $42 $2 $44 Interest expense, gross 39 -- 39 Capitalized interest and direct internal costs ($27) -- ($27) Tax rate 37% 60%4 39% Note: Based on strip commodity prices in 2016 1 Cost and expenses are expected to be within 5% of the estimates above 2 Total LOE includes recurring, major expense and non E&P operating expenses 3 Estimated transportation / processing fees include ~$13MM Arkoma unused firm gas transportation and ~$3MM Uinta oil and gas delivery shortfall fees 4 Estimated China tax rate reflects a 25% taxation in-country, as well as an additional non-cash U.S. income tax of 35% 19
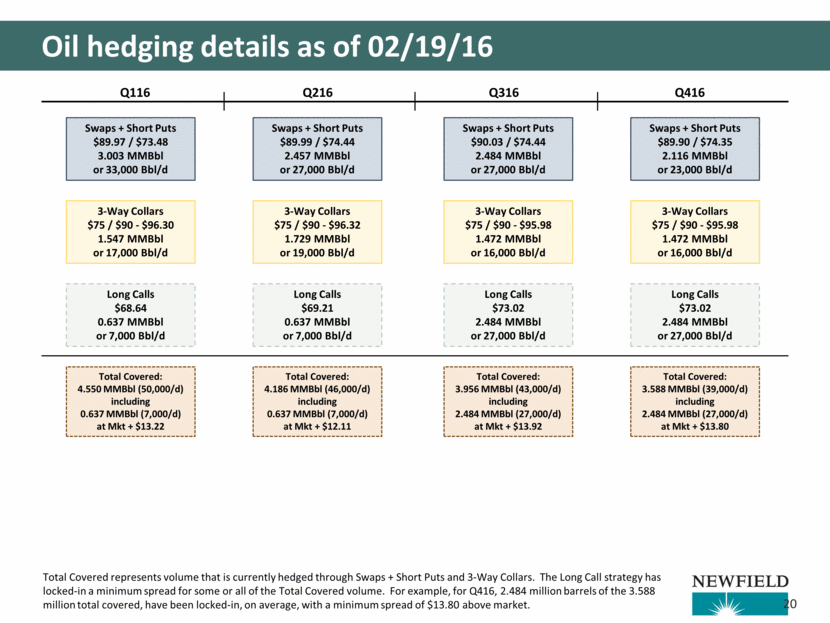
Oil hedging details as of 02/19/16 20 Q116 Q216 Q316 Q416 Swaps + Short Puts $89.90 / $74.35 2.116 MMBbl or 23,000 Bbl/d 3-Way Collars $75 / $90 - $95.98 1.472 MMBbl or 16,000 Bbl/d Long Calls $73.02 2.484 MMBbl or 27,000 Bbl/d Total Covered: 3.588 MMBbl (39,000/d) including 2.484 MMBbl (27,000/d) at Mkt + $13.80 Swaps + Short Puts $90.03 / $74.44 2.484 MMBbl or 27,000 Bbl/d 3-Way Collars $75 / $90 - $95.98 1.472 MMBbl or 16,000 Bbl/d Long Calls $73.02 2.484 MMBbl or 27,000 Bbl/d Total Covered: 3.956 MMBbl (43,000/d) including 2.484 MMBbl (27,000/d) at Mkt + $13.92 Swaps + Short Puts $89.99 / $74.44 2.457 MMBbl or 27,000 Bbl/d 3-Way Collars $75 / $90 - $96.32 1.729 MMBbl or 19,000 Bbl/d Long Calls $69.21 0.637 MMBbl or 7,000 Bbl/d Total Covered: 4.186 MMBbl (46,000/d) including 0.637 MMBbl (7,000/d) at Mkt + $12.11 Swaps + Short Puts $89.97 / $73.48 3.003 MMBbl or 33,000 Bbl/d 3-Way Collars $75 / $90 - $96.30 1.547 MMBbl or 17,000 Bbl/d Long Calls $68.64 0.637 MMBbl or 7,000 Bbl/d Total Covered: 4.550 MMBbl (50,000/d) including 0.637 MMBbl (7,000/d) at Mkt + $13.22 Total Covered represents volume that is currently hedged through Swaps + Short Puts and 3-Way Collars. The Long Call strategy has locked-in a minimum spread for some or all of the Total Covered volume. For example, for Q416, 2.484 million barrels of the 3.588 million total covered, have been locked-in, on average, with a minimum spread of $13.80 above market.
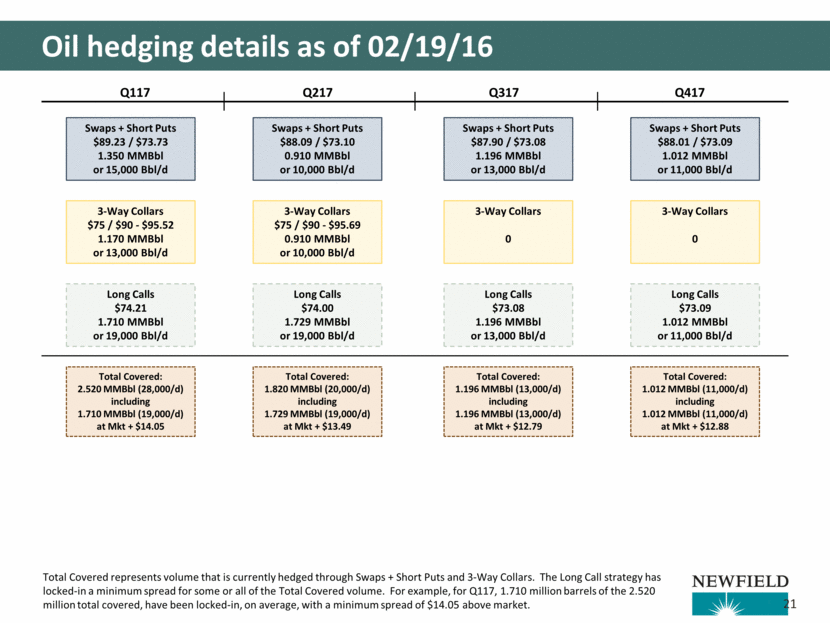
Oil hedging details as of 02/19/16 21 Q117 Q217 Q317 Q417 Swaps + Short Puts $88.01 / $73.09 1.012 MMBbl or 11,000 Bbl/d 3-Way Collars 0 Long Calls $73.09 1.012 MMBbl or 11,000 Bbl/d Total Covered: 1.012 MMBbl (11,000/d) including 1.012 MMBbl (11,000/d) at Mkt + $12.88 Swaps + Short Puts $87.90 / $73.08 1.196 MMBbl or 13,000 Bbl/d 3-Way Collars 0 Long Calls $73.08 1.196 MMBbl or 13,000 Bbl/d Total Covered: 1.196 MMBbl (13,000/d) including 1.196 MMBbl (13,000/d) at Mkt + $12.79 Swaps + Short Puts $88.09 / $73.10 0.910 MMBbl or 10,000 Bbl/d 3-Way Collars $75 / $90 - $95.69 0.910 MMBbl or 10,000 Bbl/d Long Calls $74.00 1.729 MMBbl or 19,000 Bbl/d Total Covered: 1.820 MMBbl (20,000/d) including 1.729 MMBbl (19,000/d) at Mkt + $13.49 Swaps + Short Puts $89.23 / $73.73 1.350 MMBbl or 15,000 Bbl/d 3-Way Collars $75 / $90 - $95.52 1.170 MMBbl or 13,000 Bbl/d Long Calls $74.21 1.710 MMBbl or 19,000 Bbl/d Total Covered: 2.520 MMBbl (28,000/d) including 1.710 MMBbl (19,000/d) at Mkt + $14.05 Total Covered represents volume that is currently hedged through Swaps + Short Puts and 3-Way Collars. The Long Call strategy has locked-in a minimum spread for some or all of the Total Covered volume. For example, for Q117, 1.710 million barrels of the 2.520 million total covered, have been locked-in, on average, with a minimum spread of $14.05 above market.
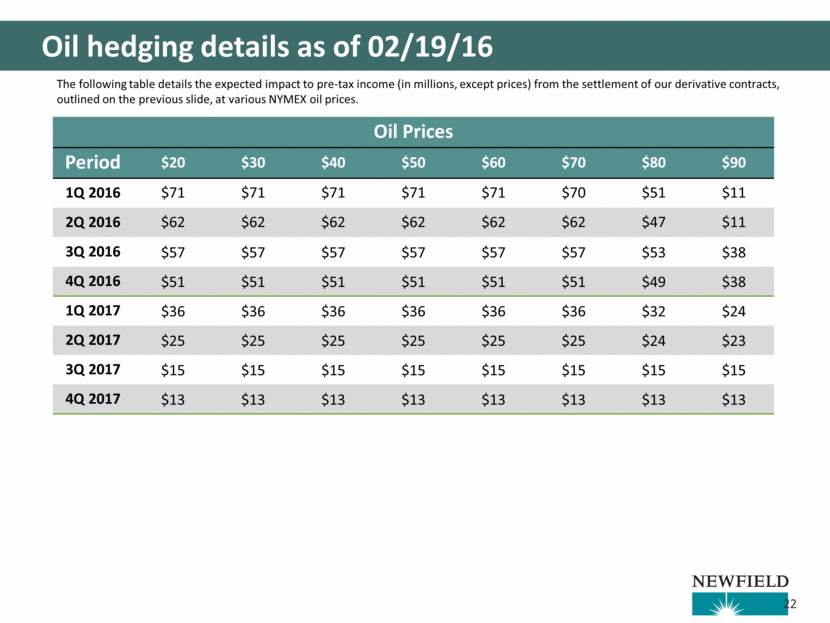
Oil hedging details as of 02/19/16 Oil Prices Period $20 $30 $40 $50 $60 $70 $80 $90 1Q 2016 $71 $71 $71 $71 $71 $70 $51 $11 2Q 2016 $62 $62 $62 $62 $62 $62 $47 $11 3Q 2016 $57 $57 $57 $57 $57 $57 $53 $38 4Q 2016 $51 $51 $51 $51 $51 $51 $49 $38 1Q 2017 $36 $36 $36 $36 $36 $36 $32 $24 2Q 2017 $25 $25 $25 $25 $25 $25 $24 $23 3Q 2017 $15 $15 $15 $15 $15 $15 $15 $15 4Q 2017 $13 $13 $13 $13 $13 $13 $13 $13 The following table details the expected impact to pre-tax income (in millions, except prices) from the settlement of our derivative contracts, outlined on the previous slide, at various NYMEX oil prices. 22
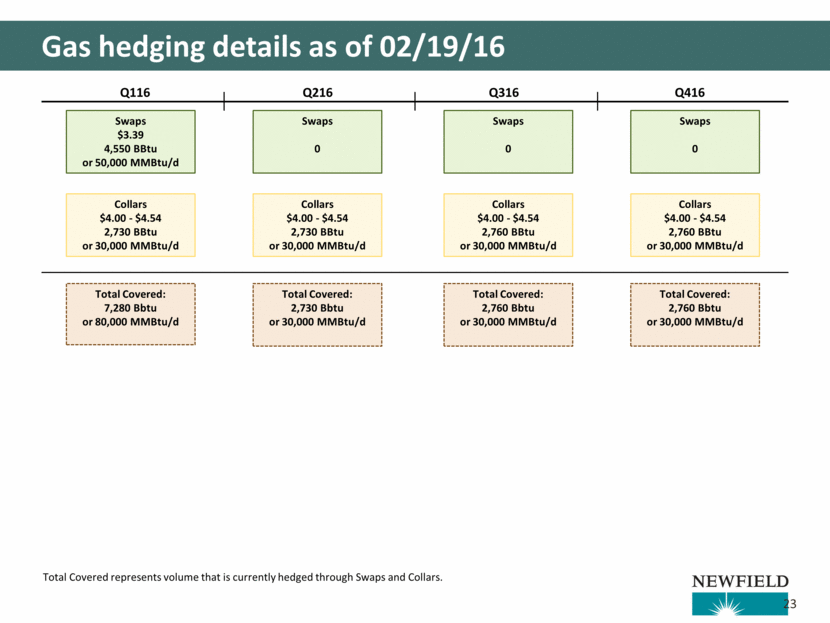
Gas hedging details as of 02/19/16 23 Q116 Q216 Q316 Q416 Collars $4.00 - $4.54 2,760 BBtu or 30,000 MMBtu/d Total Covered: 2,760 Bbtu or 30,000 MMBtu/d Swaps $3.39 4,550 BBtu or 50,000 MMBtu/d Swaps 0 Swaps 0 Swaps 0 Collars $4.00 - $4.54 2,760 BBtu or 30,000 MMBtu/d Total Covered: 2,760 Bbtu or 30,000 MMBtu/d Collars $4.00 - $4.54 2,730 BBtu or 30,000 MMBtu/d Total Covered: 2,730 Bbtu or 30,000 MMBtu/d Collars $4.00 - $4.54 2,730 BBtu or 30,000 MMBtu/d Total Covered: 7,280 Bbtu or 80,000 MMBtu/d Total Covered represents volume that is currently hedged through Swaps and Collars.
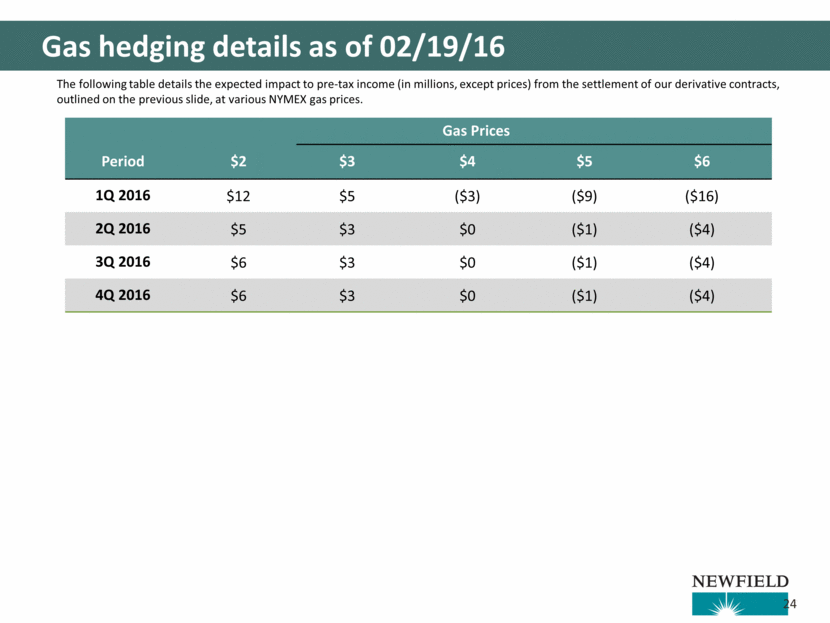
Gas hedging details as of 02/19/16 Gas Prices Period $2 $3 $4 $5 $6 1Q 2016 $12 $5 ($3) ($9) ($16) 2Q 2016 $5 $3 $0 ($1) ($4) 3Q 2016 $6 $3 $0 ($1) ($4) 4Q 2016 $6 $3 $0 ($1) ($4) The following table details the expected impact to pre-tax income (in millions, except prices) from the settlement of our derivative contracts, outlined on the previous slide, at various NYMEX gas prices. 24
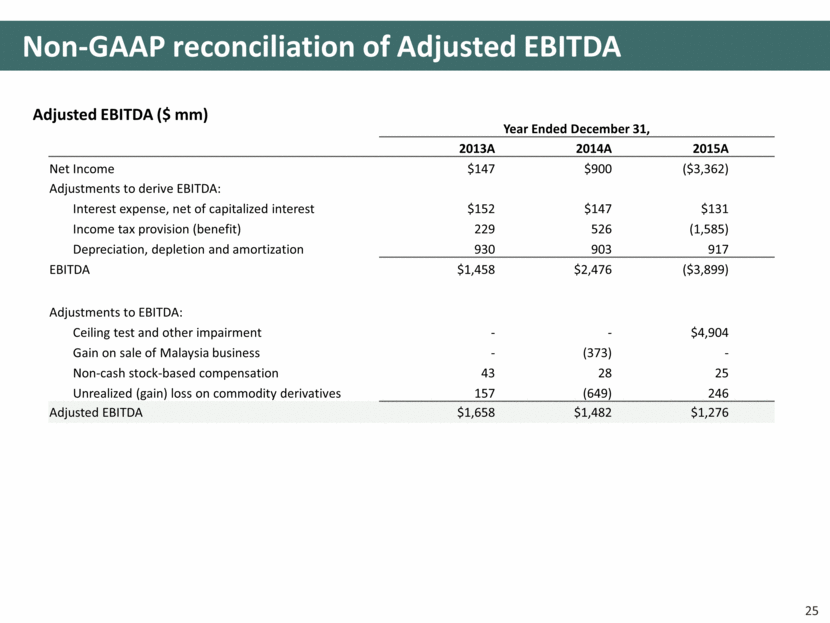
Non-GAAP reconciliation of Adjusted EBITDA Adjusted EBITDA ($ mm) Year Ended December 31, 2013A 2014A 2015A Net Income $147 $900 ($3,362) Adjustments to derive EBITDA: Interest expense, net of capitalized interest $152 $147 $131 Income tax provision (benefit) 229 526 (1,585) Depreciation, depletion and amortization 930 903 917 EBITDA $1,458 $2,476 ($3,899) Adjustments to EBITDA: Ceiling test and other impairment - - $4,904 Gain on sale of Malaysia business - (373) - Non-cash stock-based compensation 43 28 25 Unrealized (gain) loss on commodity derivatives 157 (649) 246 Adjusted EBITDA $1,658 $1,482 $1,276 25
Forward looking statements and related matters This presentation contains forward-looking statements within the meaning of Section 27A of the Securities Act of 1933, as amended, and Section 21E of the Securities Exchange Act of 1934, as amended. The words “believe”, “intend”, “plan”, “expect”, “guidance”, “potential” or other similar expressions are intended to identify forward-looking statements. Other than historical facts included in this presentation, all information and statements, such as information regarding planned capital expenditures, estimated reserves, estimated production targets, drilling and development plans, the timing of production, planned capital expenditures, and other plans and objectives for future operations, are forward-looking statements. Although as of the date of this presentation Newfield believes that these expectations are reasonable, this information is based upon assumptions and anticipated results that are subject to numerous uncertainties and risks. Actual results may vary significantly from those anticipated due to many factors, including drilling results, commodity prices, industry conditions, the prices of goods and services, the availability of drilling rigs and other support services, our liquidity and the availability of capital resources, labor conditions, severe weather conditions, China and U.S. governmental regulations and other operating risks. Please see Newfield’s Annual Report on Form 10-K and subsequent quarterly and current reports filed with the U.S. Securities and Exchange Commission (SEC) for a discussion of other factors that may cause actual results to vary. Unpredictable or unknown factors not discussed herein or in Newfield’s SEC filings could also have material adverse effects actual results. Readers are cautioned not to place undo reliance on forward-looking statements, which speak only as of the date of this presentation. Unless legally required, Newfield undertakes no obligation to publicly update or revise any forward-looking statements. Cautionary Note to Investors – Effective January 1, 2010, the SEC permits oil and gas companies, in their filings with the SEC, to disclose only proved, probable and possible reserves that meet the SEC’s definitions for such terms. Actual quantities that may be ultimately recovered from Newfield’s interests may differ substantially from the estimates in this presentation. Factors affecting ultimate recovery include the scope of Newfield’s ongoing drilling program, which will be directly affected by commodity prices, the availability of capital, drilling and production costs, availability of drilling services and equipment, drilling results, lease expirations, transportation constraints, regulatory approvals and other factors; and actual drilling results, including geological and mechanical factors affecting recovery rates. Newfield may use terms in this presentation, such as “resources”, “net resources”, “net discovered resources”, “net unrisked drilling resource”, “net lower-risked captured resources”, “net risked captured resources”, “gross resources”, “gross resource potential”, “gross unrisked resource potential”, “gross unrisked resources”, and similar terms that the SEC’s guidelines strictly prohibit in SEC filings. These terms include reserves with substantially less certainty than proved reserves, and no discount or other adjustment is included in the presentation of such reserve numbers. Investors are urged to consider closely the oil and gas disclosures in Newfield’s Annual Report on Form 10-K, available at www.newfield.com, www.sec.gov or by writing Newfield at 4 Waterway Square Place, Suite 100, The Woodlands, Texas 77380 Attn: Investor Relations. 26
