Attached files
| file | filename |
|---|---|
| 8-K - 8-K - Matador Resources Co | mtdr-20160224x8xk.htm |
| EX-3.1 - EXHIBIT 3.1 - Matador Resources Co | mrcamendedandrestatedbylaw.htm |
| EX-99.1 - EXHIBIT 99.1 - Matador Resources Co | mtdr-201512312015x8kxexhib.htm |
February 24, 2016 Year-End and Fourth Quarter 2015 Earnings Release NYSE: MTDR Exhibit 99.2
2 Disclosure Statements Safe Harbor Statement – This presentation and statements made by representatives of Matador Resources Company (“Matador” or the “Company”) during the course of this presentation include “forward-looking statements” within the meaning of Section 27A of the Securities Act of 1933, as amended, and Section 21E of the Securities Exchange Act of 1934, as amended. “Forward-looking statements” are statements related to future, not past, events. Forward-looking statements are based on current expectations and include any statement that does not directly relate to a current or historical fact. In this context, forward-looking statements often address expected future business and financial performance, and often contain words such as “could,” “believe,” “would,” “anticipate,” “intend,” “estimate,” “expect,” “may,” “should,” “continue,” “plan,” “predict,” “potential,” “project,” “hypothetical,” “forecasted,” and similar expressions that are intended to identify forward-looking statements, although not all forward-looking statements contain such identifying words. Actual results and future events could differ materially from those anticipated in such statements, and such forward-looking statements may not prove to be accurate. These forward-looking statements involve certain risks and uncertainties, including, but not limited to, the following risks related to Matador’s financial and operational performance: general economic conditions; Matador’s ability to execute its business plan, including whether Matador’s drilling program is successful; changes in oil, natural gas and natural gas liquids prices and the demand for oil, natural gas and natural gas liquids; Matador’s ability to replace reserves and efficiently develop its current reserves; Matador’s costs of operations, delays and other difficulties related to producing oil, natural gas and natural gas liquids; Matador’s ability to integrate the assets, employees and operations of Harvey E. Yates Company following its merger with one of Matador’s wholly-owned subsidiaries on February 27, 2015; Matador’s ability to make other acquisitions on economically acceptable terms; availability of sufficient capital to execute Matador’s business plan, including from its future cash flows, increases in Matador’s borrowing base and otherwise; weather and environmental conditions; and other important factors which could cause actual results to differ materially from those anticipated or implied in the forward-looking statements. For further discussions of risks and uncertainties, you should refer to Matador’s SEC filings, including the “Risk Factors” section of Matador’s most recent Annual Report on Form 10-K and any subsequent Quarterly Reports on Form 10-Q. Matador undertakes no obligation and does not intend to update these forward-looking statements to reflect events or circumstances occurring after the date of this presentation, except as required by law, including the securities laws of the United States and the rules and regulations of the SEC. You are cautioned not to place undue reliance on these forward-looking statements, which speak only as of the date of this presentation. All forward-looking statements are qualified in their entirety by this cautionary statement. Cautionary Note – The Securities and Exchange Commission (SEC) permits oil and gas companies, in their filings with the SEC, to disclose only proved, probable and possible reserves. Potential resources are not proved, probable or possible reserves. The SEC’s guidelines prohibit Matador from including such information in filings with the SEC. Definitions – Proved oil and natural gas reserves are the estimated quantities of oil and natural gas that geological and engineering data demonstrate with reasonable certainty to be recoverable in future years from known reservoirs under existing economic and operating conditions. Matador’s production and proved reserves are reported in two streams: oil and natural gas, including both dry and liquids-rich natural gas. Where Matador produces liquids-rich natural gas, the economic value of the natural gas liquids associated with the natural gas is included in the estimated wellhead natural gas price on those properties where the natural gas liquids are extracted and sold. Estimated ultimate recovery (EUR) is a measure that by its nature is more speculative than estimates of proved reserves prepared in accordance with SEC definitions and guidelines and is accordingly less certain. Type curves shown in this presentation are used to compare actual well performance to a range of potential production results calculated without regard to economic conditions; actual recoveries may vary from these type curves based on individual well performance and economic conditions.
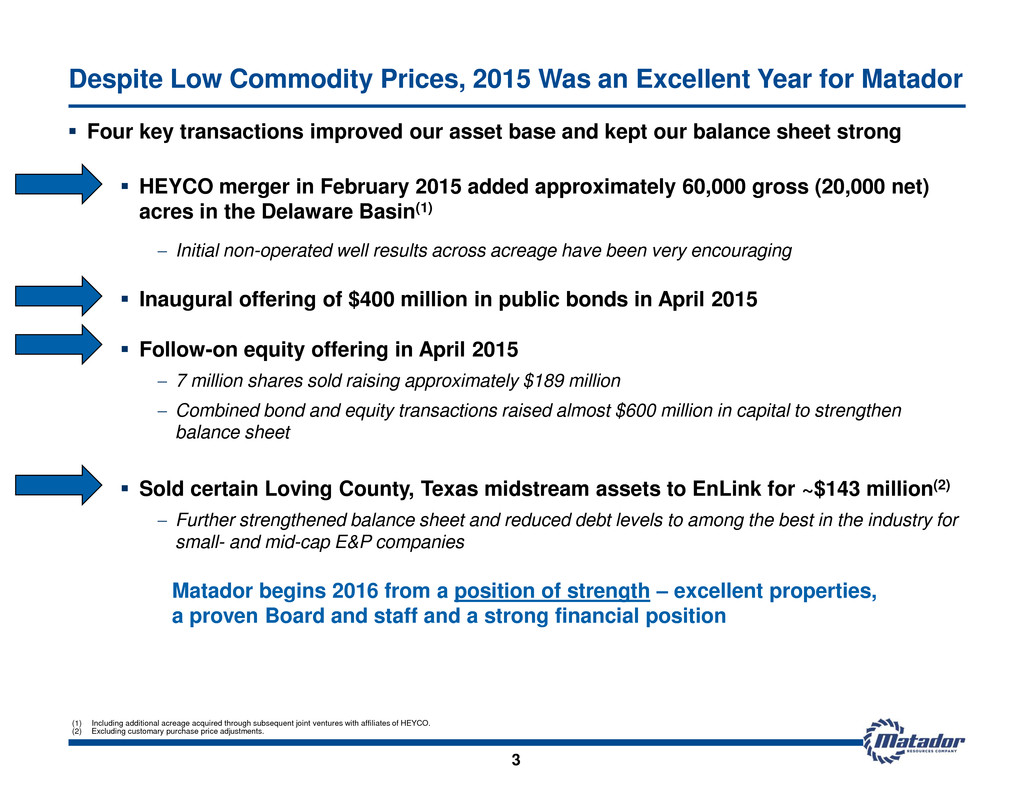
Despite Low Commodity Prices, 2015 Was an Excellent Year for Matador 3 Four key transactions improved our asset base and kept our balance sheet strong HEYCO merger in February 2015 added approximately 60,000 gross (20,000 net) acres in the Delaware Basin(1) Initial non-operated well results across acreage have been very encouraging Inaugural offering of $400 million in public bonds in April 2015 Follow-on equity offering in April 2015 7 million shares sold raising approximately $189 million Combined bond and equity transactions raised almost $600 million in capital to strengthen balance sheet Sold certain Loving County, Texas midstream assets to EnLink for ~$143 million(2) Further strengthened balance sheet and reduced debt levels to among the best in the industry for small- and mid-cap E&P companies Matador begins 2016 from a position of strength – excellent properties, a proven Board and staff and a strong financial position (1) Including additional acreage acquired through subsequent joint ventures with affiliates of HEYCO. (2) Excluding customary purchase price adjustments.
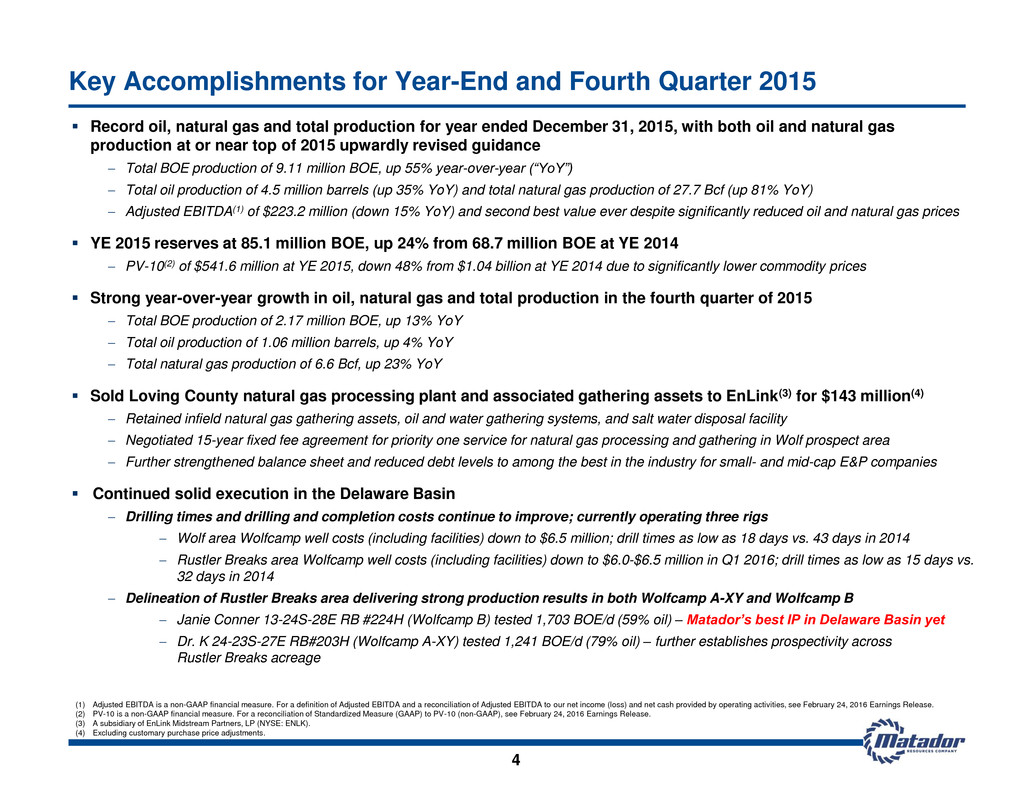
4 Record oil, natural gas and total production for year ended December 31, 2015, with both oil and natural gas production at or near top of 2015 upwardly revised guidance Total BOE production of 9.11 million BOE, up 55% year-over-year (“YoY”) Total oil production of 4.5 million barrels (up 35% YoY) and total natural gas production of 27.7 Bcf (up 81% YoY) Adjusted EBITDA(1) of $223.2 million (down 15% YoY) and second best value ever despite significantly reduced oil and natural gas prices YE 2015 reserves at 85.1 million BOE, up 24% from 68.7 million BOE at YE 2014 PV-10(2) of $541.6 million at YE 2015, down 48% from $1.04 billion at YE 2014 due to significantly lower commodity prices Strong year-over-year growth in oil, natural gas and total production in the fourth quarter of 2015 Total BOE production of 2.17 million BOE, up 13% YoY Total oil production of 1.06 million barrels, up 4% YoY Total natural gas production of 6.6 Bcf, up 23% YoY Sold Loving County natural gas processing plant and associated gathering assets to EnLink(3) for $143 million(4) Retained infield natural gas gathering assets, oil and water gathering systems, and salt water disposal facility Negotiated 15-year fixed fee agreement for priority one service for natural gas processing and gathering in Wolf prospect area Further strengthened balance sheet and reduced debt levels to among the best in the industry for small- and mid-cap E&P companies Continued solid execution in the Delaware Basin Drilling times and drilling and completion costs continue to improve; currently operating three rigs Wolf area Wolfcamp well costs (including facilities) down to $6.5 million; drill times as low as 18 days vs. 43 days in 2014 Rustler Breaks area Wolfcamp well costs (including facilities) down to $6.0-$6.5 million in Q1 2016; drill times as low as 15 days vs. 32 days in 2014 Delineation of Rustler Breaks area delivering strong production results in both Wolfcamp A-XY and Wolfcamp B Janie Conner 13-24S-28E RB #224H (Wolfcamp B) tested 1,703 BOE/d (59% oil) – Matador’s best IP in Delaware Basin yet Dr. K 24-23S-27E RB#203H (Wolfcamp A-XY) tested 1,241 BOE/d (79% oil) – further establishes prospectivity across Rustler Breaks acreage (1) Adjusted EBITDA is a non-GAAP financial measure. For a definition of Adjusted EBITDA and a reconciliation of Adjusted EBITDA to our net income (loss) and net cash provided by operating activities, see February 24, 2016 Earnings Release. (2) PV-10 is a non-GAAP financial measure. For a reconciliation of Standardized Measure (GAAP) to PV-10 (non-GAAP), see February 24, 2016 Earnings Release. (3) A subsidiary of EnLink Midstream Partners, LP (NYSE: ENLK). (4) Excluding customary purchase price adjustments. Key Accomplishments for Year-End and Fourth Quarter 2015
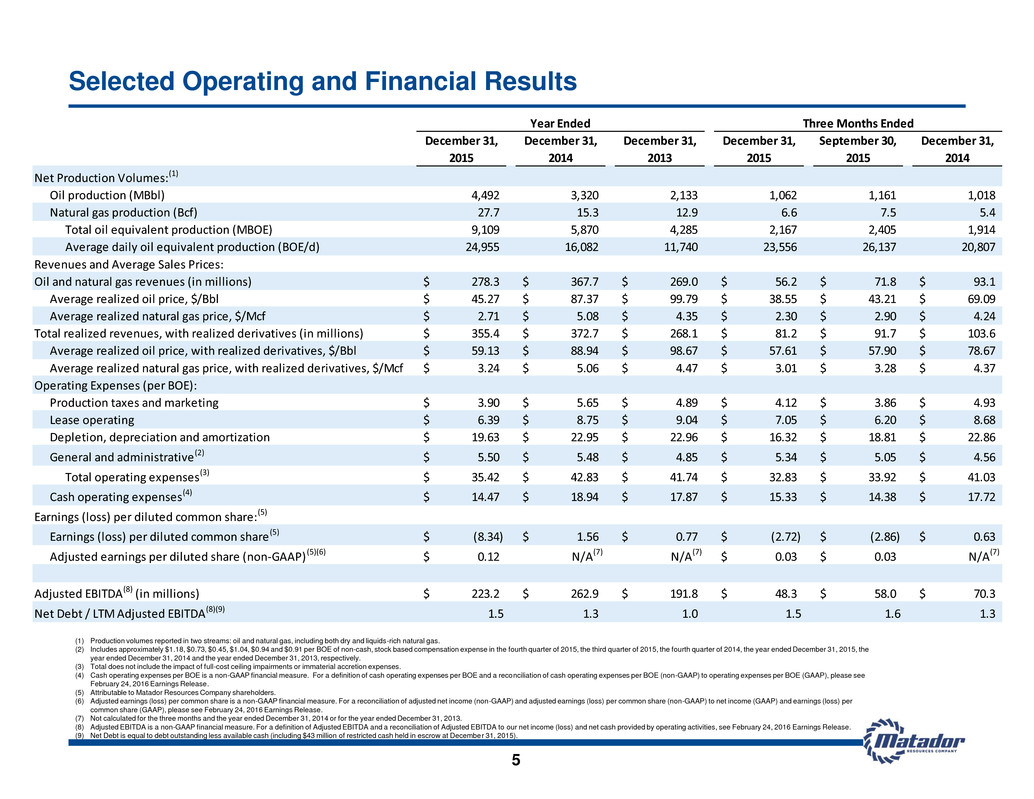
Selected Operating and Financial Results 5 (1) Production volumes reported in two streams: oil and natural gas, including both dry and liquids-rich natural gas. (2) Includes approximately $1.18, $0.73, $0.45, $1.04, $0.94 and $0.91 per BOE of non-cash, stock based compensation expense in the fourth quarter of 2015, the third quarter of 2015, the fourth quarter of 2014, the year ended December 31, 2015, the year ended December 31, 2014 and the year ended December 31, 2013, respectively. (3) Total does not include the impact of full-cost ceiling impairments or immaterial accretion expenses. (4) Cash operating expenses per BOE is a non-GAAP financial measure. For a definition of cash operating expenses per BOE and a reconciliation of cash operating expenses per BOE (non-GAAP) to operating expenses per BOE (GAAP), please see February 24, 2016 Earnings Release. (5) Attributable to Matador Resources Company shareholders. (6) Adjusted earnings (loss) per common share is a non-GAAP financial measure. For a reconciliation of adjusted net income (non-GAAP) and adjusted earnings (loss) per common share (non-GAAP) to net income (GAAP) and earnings (loss) per common share (GAAP), please see February 24, 2016 Earnings Release. (7) Not calculated for the three months and the year ended December 31, 2014 or for the year ended December 31, 2013. (8) Adjusted EBITDA is a non-GAAP financial measure. For a definition of Adjusted EBITDA and a reconciliation of Adjusted EBITDA to our net income (loss) and net cash provided by operating activities, see February 24, 2016 Earnings Release. (9) Net Debt is equal to debt outstanding less available cash (including $43 million of restricted cash held in escrow at December 31, 2015). December 31, December 31, December 31, December 31, September 30, December 31, 2015 2014 2013 2015 2015 2014 Net Production Volumes:(1) Oil production (MBbl) 4,492 3,320 2,133 1,062 1,161 1,018 Natural gas production (Bcf) 27.7 15.3 12.9 6.6 7.5 5.4 Total oil equivalent production (MBOE) 9,109 5,870 4,285 2,167 2,405 1,914 Average daily oil equivalent production (BOE/d) 24,955 16,082 11,740 23,556 26,137 20,807 Revenues and Average Sales Prices: Oil and natural gas revenues (in millions) 278.3$ 367.7$ 269.0$ 56.2$ 71.8$ 93.1$ Average realized oil price, $/Bbl 45.27$ 87.37$ 99.79$ 38.55$ 43.21$ 69.09$ Average realized natural gas price, $/Mcf 2.71$ 5.08$ 4.35$ 2.30$ 2.90$ 4.24$ Total realized revenues, with realized derivatives (in millions) 355.4$ 372.7$ 268.1$ 81.2$ 91.7$ 103.6$ Average realized oil price, with realized derivatives, $/Bbl 59.13$ 88.94$ 98.67$ 57.61$ 57.90$ 78.67$ Average realized natural gas price, with realized derivatives, $/Mcf 3.24$ 5.06$ 4.47$ 3.01$ 3.28$ 4.37$ Operating Expenses (per BOE): Production taxes and marketing 3.90$ 5.65$ 4.89$ 4.12$ 3.86$ 4.93$ Lease operating 6.39$ 8.75$ 9.04$ 7.05$ 6.20$ 8.68$ Depletion, depreciation and amortization 19.63$ 22.95$ 22.96$ 16.32$ 18.81$ 22.86$ General and administrative(2) 5.50$ 5.48$ 4.85$ 5.34$ 5.05$ 4.56$ Total operating expenses(3) 35.42$ 42.83$ 41.74$ 32.83$ 33.92$ 41.03$ Cash operating expenses(4) 14.47$ 18.94$ 17.87$ 15.33$ 14.38$ 17.72$ Earnings (loss) per diluted common share:(5) Earnings (loss) per diluted common share (5) (8.34)$ 1.56$ 0.77$ (2.72)$ (2.86)$ 0.63$ Adjusted earnings per diluted share (non-GAAP) (5)(6) 0.12$ N/A(7) N/A(7) 0.03$ 0.03$ N/A(7) Adjusted EBITDA(8) (in millions) 223.2$ 262.9$ 191.8$ 48.3$ 58.0$ 70.3$ Net Debt / LTM Adjusted EBITDA(8)(9) 1.5 1.3 1.0 1.5 1.6 1.3 Three Months EndedYear Ended
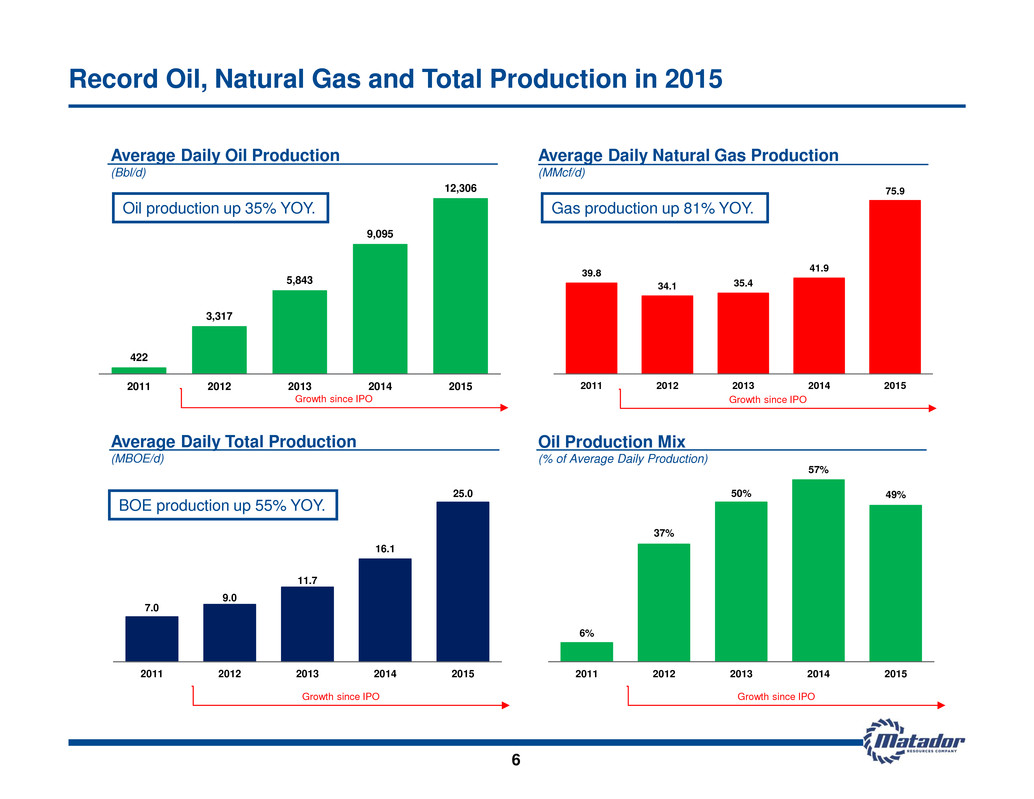
39.8 34.1 35.4 41.9 75.9 2011 2012 2013 2014 2015 422 3,317 5,843 9,095 12,306 2011 2012 3 2014 2015 Average Daily Oil Production (Bbl/d) Average Daily Natural Gas Production (MMcf/d) Average Daily Total Production (MBOE/d) Oil Production Mix (% of Average Daily Production) 6 Growth since IPO Growth since IPO Growth since IPO Growth since IPO Oil production up 35% YOY. Gas production up 81% YOY. BOE production up 55% YOY. Record Oil, Natural Gas and Total Production in 2015 6% 37% 50% 57% 49% 2011 2012 2013 2014 2015 7.0 9.0 11.7 16.1 25.0 2011 2012 2013 4 5
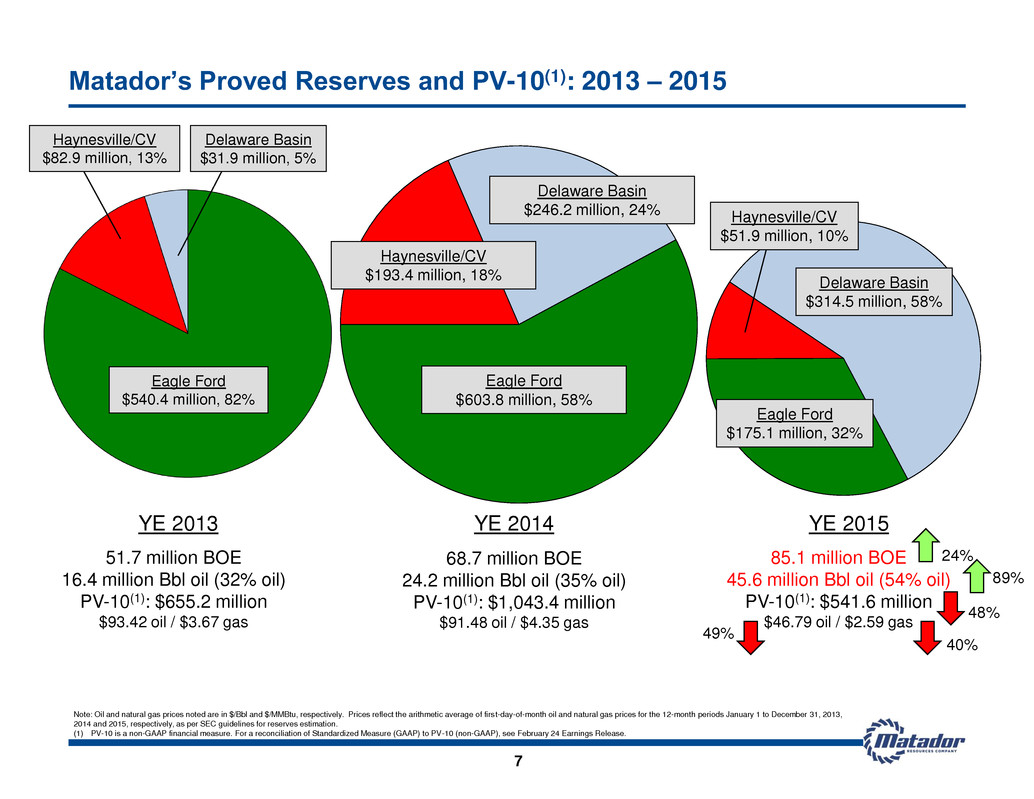
7 Matador’s Proved Reserves and PV-10(1): 2013 – 2015 Eagle Ford $540.4 million, 82% Haynesville/CV $82.9 million, 13% Delaware Basin $31.9 million, 5% YE 2013 51.7 million BOE 16.4 million Bbl oil (32% oil) PV-10(1): $655.2 million $93.42 oil / $3.67 gas 68.7 million BOE 24.2 million Bbl oil (35% oil) PV-10(1): $1,043.4 million $91.48 oil / $4.35 gas YE 2014 85.1 million BOE 45.6 million Bbl oil (54% oil) PV-10(1): $541.6 million $46.79 oil / $2.59 gas YE 2015 24% 89% 40% 49% 48% Eagle Ford $603.8 million, 58% Haynesville/CV $193.4 million, 18% Delaware Basin $246.2 million, 24% Eagle Ford $175.1 million, 32% Haynesville/CV $51.9 million, 10% Delaware Basin $314.5 million, 58% Note: Oil and natural gas prices noted are in $/Bbl and $/MMBtu, respectively. Prices reflect the arithmetic average of first-day-of-month oil and natural gas prices for the 12-month periods January 1 to December 31, 2013, 2014 and 2015, respectively, as per SEC guidelines for reserves estimation. (1) PV-10 is a non-GAAP financial measure. For a reconciliation of Standardized Measure (GAAP) to PV-10 (non-GAAP), see February 24 Earnings Release.
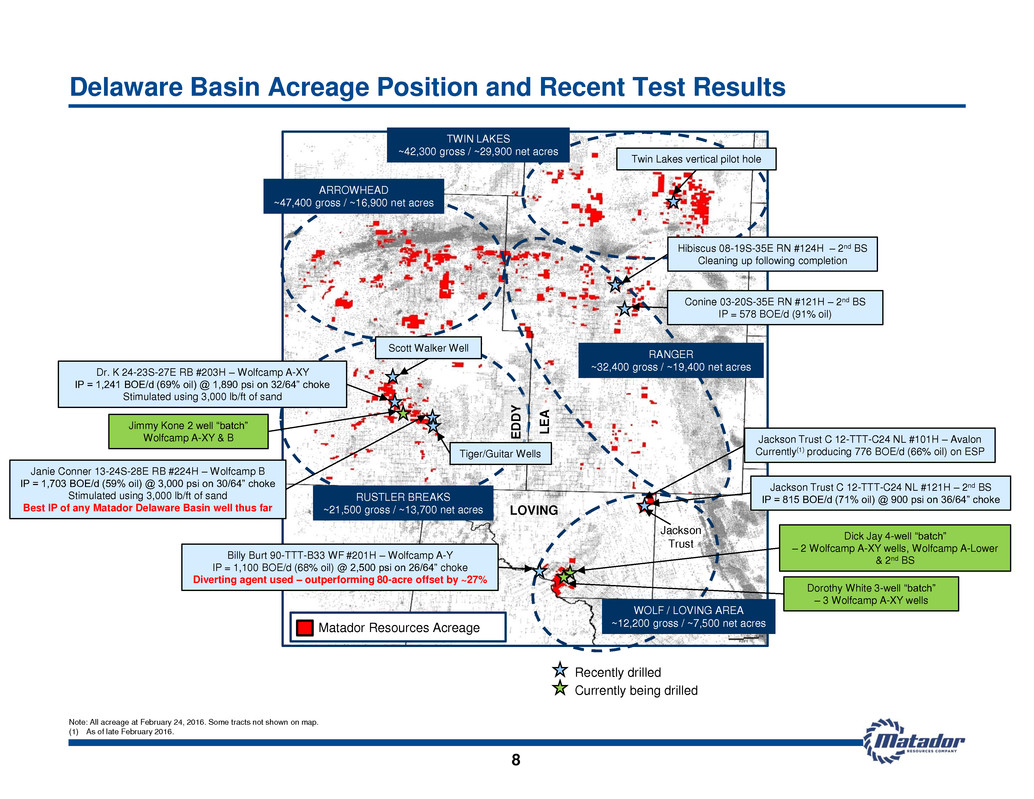
Delaware Basin Acreage Position and Recent Test Results 8 L E A LOVING WARD Matador Resources Acreage TWIN LAKES ~42,300 gross / ~29,900 net acres WOLF / LOVING AREA ~12,200 gross / ~7,500 net acres Jackson Trust RANGER ~32,400 gross / ~19,400 net acres ARROWHEAD ~47,400 gross / ~16,900 net acres E D D Y RUSTLER BREAKS ~21,500 gross / ~13,700 net acres Tiger/Guitar Wells Jackson Trust C 12-TTT-C24 NL #101H – Avalon Currently(1) producing 776 BOE/d (66% oil) on ESP Hibiscus 08-19S-35E RN #124H – 2nd BS Cleaning up following completion Conine 03-20S-35E RN #121H – 2nd BS IP = 578 BOE/d (91% oil) Recently drilled Currently being drilled Significant non-op wells 1 2 3 4 5 6 7 8 9 10 11 12 13 14 15 16 19 20 17 18 Scott Walker Well Janie Conner 13-24S-28E RB #224H – Wolfcamp B IP = 1,703 BOE/d (59% oil) @ 3,000 psi on 30/64” choke Stimulated using 3,000 lb/ft of sand Best IP of any Matador Delaware Basin well thus far Billy Burt 90-TTT-B33 WF #201H – Wolfcamp A-Y IP = 1,100 BOE/d (68% oil) @ 2,500 psi on 26/64” choke Diverting agent used – outperforming 80-acre offset by ~27% Dick Jay 4-well “batch” – 2 Wolfcamp A-XY wells, Wolfcamp A-Lower & 2nd BS Twin Lakes vertical pilot hole Dr. K 24-23S-27E RB #203H – Wolfcamp A-XY IP = 1,241 BOE/d (69% oil) @ 1,890 psi on 32/64” choke Stimulated using 3,000 lb/ft of sand Jimmy Kone 2 well “batch” Wolfcamp A-XY & B Jackson Trust C 12-TTT-C24 NL #121H – 2nd BS IP = 815 BOE/d (71% oil) @ 900 psi on 36/64” choke Dorothy White 3-well “batch” – 3 Wolfcamp A-XY wells Note: All acreage at February 24, 2016. Some tracts not shown on map. (1) As of late February 2016.
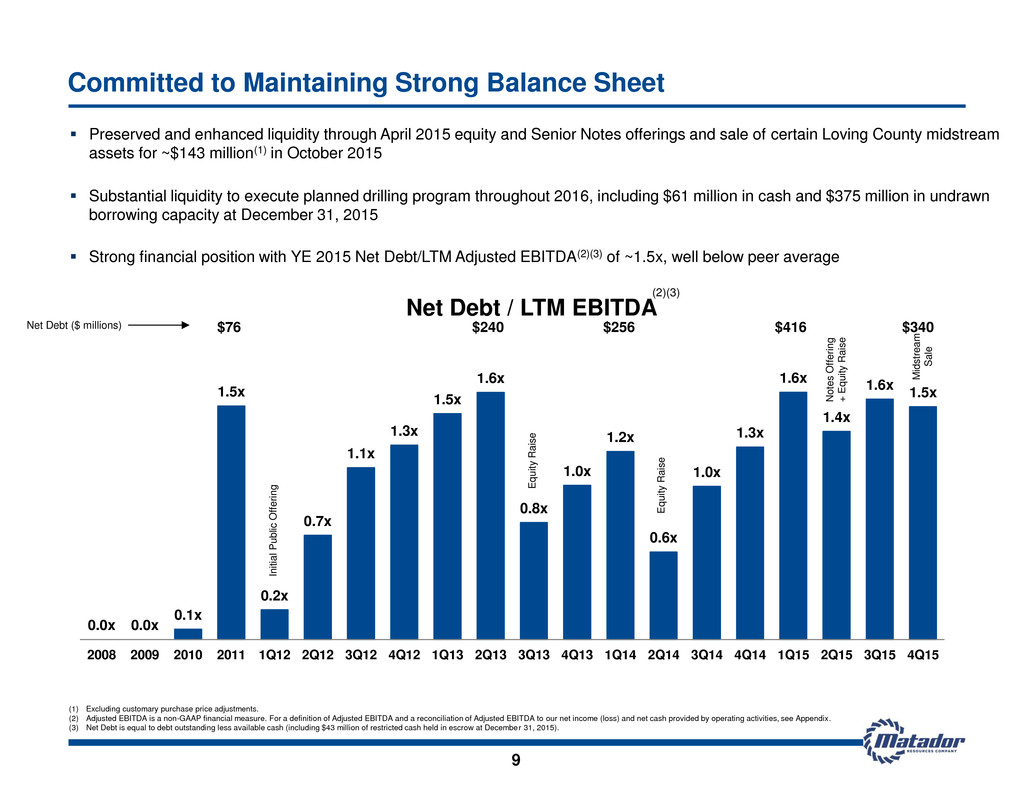
0.0x 0.0x 0.1x 1.5x 0.2x 0.7x 1.1x 1.3x 1.5x 1.6x 0.8x 1.0x 1.2x 0.6x 1.0x 1.3x 1.6x 1.4x 1.6x 1.5x 2008 2009 2010 2011 1Q12 2Q12 3Q12 4Q12 1Q13 2Q13 3Q13 4Q13 1Q14 2Q14 3Q14 4Q14 1Q15 2Q15 3Q15 4Q15 Net Debt / LTM EBITDA $76 $240 $256 $416 $340 In it ia l P u b lic O ff e ri n g Preserved and enhanced liquidity through April 2015 equity and Senior Notes offerings and sale of certain Loving County midstream assets for ~$143 million(1) in October 2015 Substantial liquidity to execute planned drilling program throughout 2016, including $61 million in cash and $375 million in undrawn borrowing capacity at December 31, 2015 Strong financial position with YE 2015 Net Debt/LTM Adjusted EBITDA(2)(3) of ~1.5x, well below peer average Committed to Maintaining Strong Balance Sheet 9 E q u it y R a is e E q u it y R a is e N o te s O ff e ri n g + E q u it y R a is e (2)(3) Net Debt ($ millions) M id s tr e a m S a le (1) Excluding customary purchase price adjustments. (2) Adjusted EBITDA is a non-GAAP financial measure. For a definition of Adjusted EBITDA and a reconciliation of Adjusted EBITDA to our net income (loss) and net cash provided by operating activities, see Appendix. (3) Net Debt is equal to debt outstanding less available cash (including $43 million of restricted cash held in escrow at December 31, 2015).
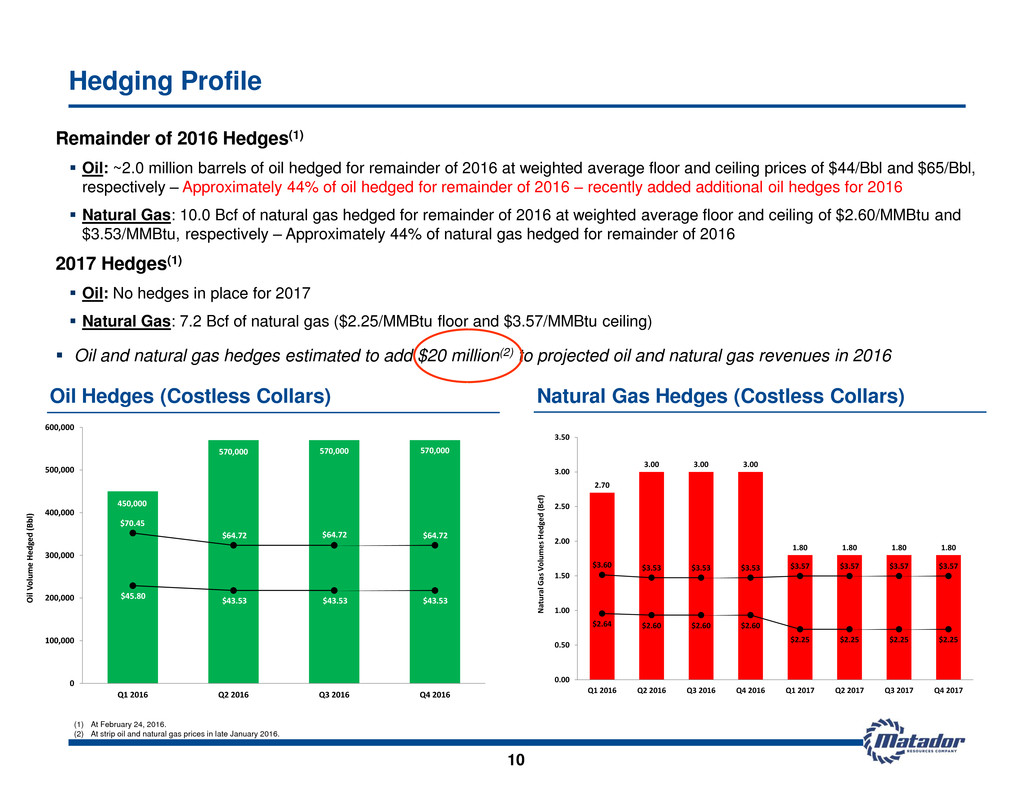
450,000 570,000 570,000 570,000 $70.45 $64.72 $64.72 $64.72 $45.80 $43.53 $43.53 $43.53 $0 $20 $40 $60 $80 $100 $120 0 100,000 200,000 300,000 400,000 500,000 600,000 Q1 2016 Q2 2016 Q3 2016 Q4 2016 Oil Vol ume He dg ed (B bl) 2.70 3.00 3.00 3.00 1.80 1.80 1.80 1.80 $3.60 $3.53 $3.53 $3.53 $3.57 $3.57 $3.57 $3.57 $2.64 $2.60 $2.60 $2.60 $2.25 $2.25 $2.25 $2.25 $1.00 $2.00 $3.00 $4.00 $5.00 $6.00 $7.00 0.00 0.50 1.00 1.50 2.00 2.50 3.00 3.50 Q1 2016 Q2 2016 3 Q4 2016 1 17 Q2 2017 Q3 2017 Q4 2017 Na tu ra l G as Vol umes He dg ed (B cf) Hedging Profile Remainder of 2016 Hedges(1) Oil: ~2.0 million barrels of oil hedged for remainder of 2016 at weighted average floor and ceiling prices of $44/Bbl and $65/Bbl, respectively – Approximately 44% of oil hedged for remainder of 2016 – recently added additional oil hedges for 2016 Natural Gas: 10.0 Bcf of natural gas hedged for remainder of 2016 at weighted average floor and ceiling of $2.60/MMBtu and $3.53/MMBtu, respectively – Approximately 44% of natural gas hedged for remainder of 2016 2017 Hedges(1) Oil: No hedges in place for 2017 Natural Gas: 7.2 Bcf of natural gas ($2.25/MMBtu floor and $3.57/MMBtu ceiling) Oil and natural gas hedges estimated to add $20 million(2) to projected oil and natural gas revenues in 2016 10 Oil Hedges (Costless Collars) Natural Gas Hedges (Costless Collars) (1) At February 24, 2016. (2) At strip oil and natural gas prices in late January 2016.
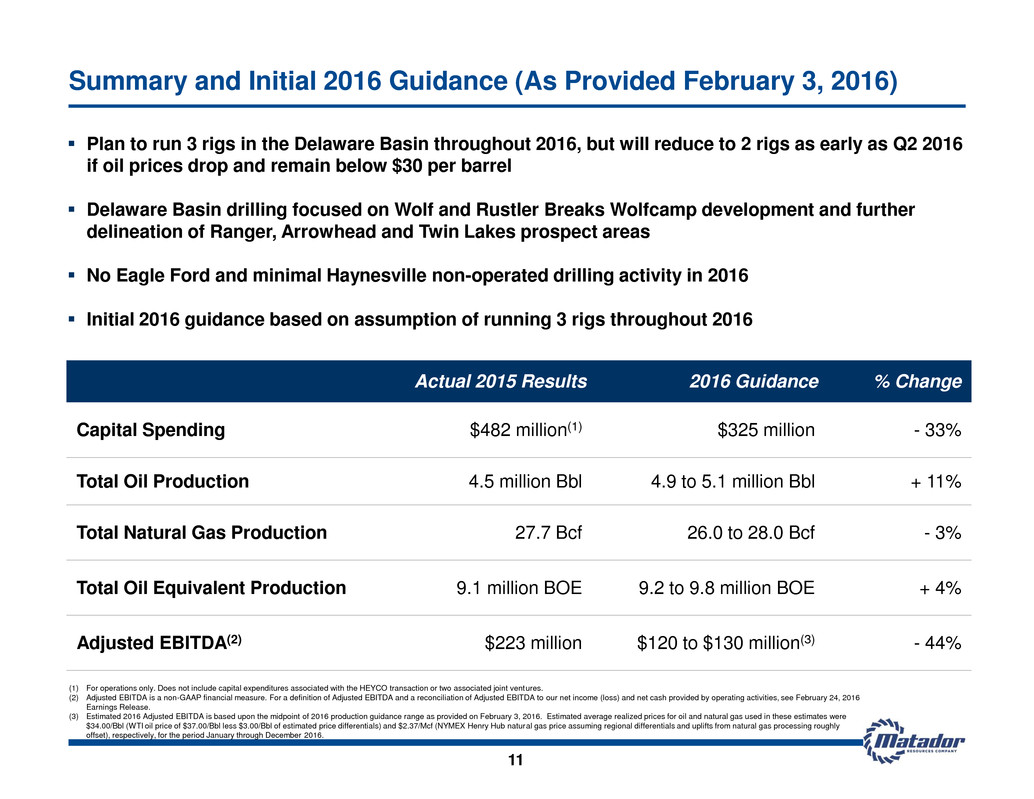
11 Summary and Initial 2016 Guidance (As Provided February 3, 2016) (1) For operations only. Does not include capital expenditures associated with the HEYCO transaction or two associated joint ventures. (2) Adjusted EBITDA is a non-GAAP financial measure. For a definition of Adjusted EBITDA and a reconciliation of Adjusted EBITDA to our net income (loss) and net cash provided by operating activities, see February 24, 2016 Earnings Release. (3) Estimated 2016 Adjusted EBITDA is based upon the midpoint of 2016 production guidance range as provided on February 3, 2016. Estimated average realized prices for oil and natural gas used in these estimates were $34.00/Bbl (WTI oil price of $37.00/Bbl less $3.00/Bbl of estimated price differentials) and $2.37/Mcf (NYMEX Henry Hub natural gas price assuming regional differentials and uplifts from natural gas processing roughly offset), respectively, for the period January through December 2016. Plan to run 3 rigs in the Delaware Basin throughout 2016, but will reduce to 2 rigs as early as Q2 2016 if oil prices drop and remain below $30 per barrel Delaware Basin drilling focused on Wolf and Rustler Breaks Wolfcamp development and further delineation of Ranger, Arrowhead and Twin Lakes prospect areas No Eagle Ford and minimal Haynesville non-operated drilling activity in 2016 Initial 2016 guidance based on assumption of running 3 rigs throughout 2016 Actual 2015 Results 2016 Guidance % Change Capital Spending $482 million(1) $325 million - 33% Total Oil Production 4.5 million Bbl 4.9 to 5.1 million Bbl + 11% Total Natural Gas Production 27.7 Bcf 26.0 to 28.0 Bcf - 3% Total Oil Equivalent Production 9.1 million BOE 9.2 to 9.8 million BOE + 4% Adjusted EBITDA(2) $223 million $120 to $130 million(3) - 44%
