Attached files
| file | filename |
|---|---|
| 8-K - 8-K - Shutterstock, Inc. | a20151231_8-kdocument.htm |
| EX-99.1 - EXHIBIT 99.1 - Shutterstock, Inc. | a20151231_ex-991.htm |

Fourth Quarter & Full Year 2015 Summary February 24, 2016

2 This presentation contains “forward-looking” statements within the meaning of the Private Securities Litigation Reform Act of 1995 that are based on our management’s beliefs and assumptions and on information currently available to management. Forward-looking statements include information concerning our possible or assumed future results of operations, business strategies, financing plans, competitive position, industry environment, potential growth opportunities, potential market opportunities and the effects of competition. Forward-looking statements include all statements that are not historical facts and can be identified by terms such as “anticipates,” “believes,” “could,” “seeks,” “estimates,” “intends,” “may,” “plans,” “potential,” “predicts,” “projects,” “should,” “will,” “would” or similar expressions and the negatives of those terms. Forward-looking statements involve known and unknown risks, uncertainties and other factors that may cause our actual results, performance or achievements to be materially different from any future results, performance or achievements expressed or implied by the forward-looking statements. Forward-looking statements represent our management’s beliefs and assumptions only as of the date of our most recent public filings. You should read our public filings, including the Risk Factors set forth therein and the documents that we have filed as exhibits to those filings, completely and with the understanding that our actual future results may be materially different from what we currently expect. Except as required by law, we assume no obligation to update these forward-looking statements publicly, or to update the reasons actual results could differ materially from those anticipated in the forward-looking statements, even if new information becomes available in the future. In addition, as we refer to earnings, we will also refer to adjusted EBITDA, non-GAAP net income and free cash flow, which we consider to be important financial indicators of the Company’s operational strength and the performance of its business. Shutterstock defines adjusted EBITDA as net income adjusted for other (expense)/income, income taxes, depreciation, amortization, disposals and non-cash equity-based compensation; non-GAAP net income as net income excluding the after tax impact of non-cash equity-based compensation, the amortization of acquisition-related intangible assets and changes in fair value of contingent consideration related to acquisitions; and free cash flow as cash provided by/(used in) operating activities adjusted for capital expenditures and content acquisition. These figures are non-GAAP financial measures and should be considered in addition to results prepared in accordance with generally accepted accounting principles (GAAP), and should not be considered as a substitute for, or superior to, GAAP results. Safe Harbor Statement

3 The Leading Global Marketplace for Stock Content Contributors Photographers Illustrators Videographers Musicians Customers Designers Businesses Marketing Agencies Media Organizations

4 - Revenue increased 27% to $116.0 million - Revenue increased approximately 24% excluding the impact of currency and contributions from acquired businesses primarily driven by new customers, increased paid downloads and higher revenue per download - Adjusted EBITDA increased 14% to $25.6 million - Adjusted EBITDA increased approximately 25% excluding the impact of currency, contributions from acquired businesses and severance costs for certain executives; revenue growth was partially offset by higher operating expenses due primarily to royalty costs associated with the increase in paid downloads as well as higher personnel and marketing costs - Net Income available to common stockholders decreased slightly to $6.9 million - Non-GAAP net income per diluted share increased 6% to $0.38; excludes non-cash equity-based compensation, amortization of acquisition related intangible assets and changes in the fair value of contingent consideration - Generated $21.0 million of free cash flow - Repurchased $15.6 million of stock under the $100 million share repurchase program Q4’15 Financial Highlights

5 - Revenue increased 30% to $425.1 million - Revenue increased approximately 27% excluding the impact of currency and contributions from acquired businesses primarily driven by new customers, increased paid downloads and higher revenue per download - Reported Adjusted EBITDA increased 19% to $84.7 million - Adjusted EBITDA increased approximately 31% excluding the impact of currency, contributions from acquired businesses and severance costs associated with executive managmenet; revenue growth was partially offset by higher operating expenses due primarily to royalty costs associated with the increase in paid downloads as well as higher personnel and marketing costs - Net Income available to common stockholders decreased 11% to $19.6 million - Non-GAAP net income per diluted share increased 14% to $1.22; excludes non-cash equity- based compensation, amortization of acquisition related intangible assets and changes in the fair value of contingent consideration - Generated $68.3 million of free cash flow, an increase of 6% versus FY’14 - Repurchased $15.6 million of stock under the $100 million share repurchase program FY’15 Financial Highlights

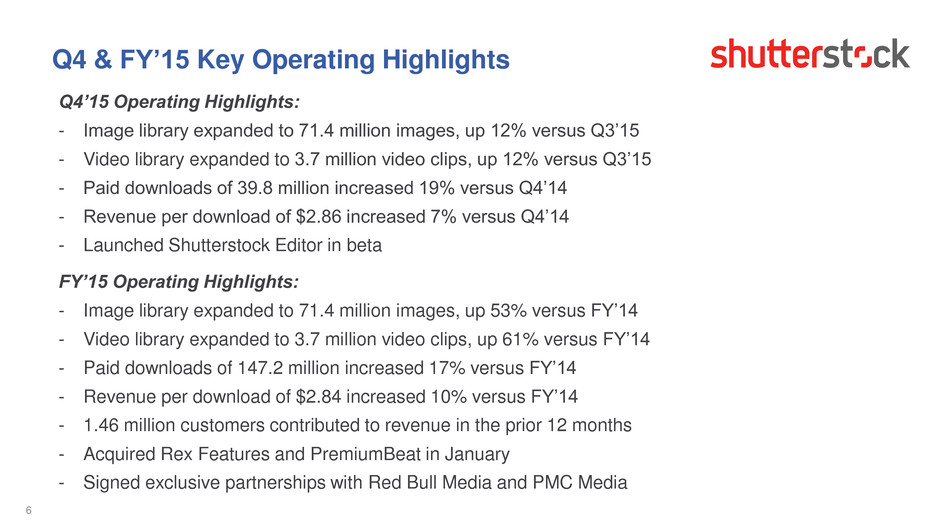
6 Q4’15 Operating Highlights: - Image library expanded to 71.4 million images, up 12% versus Q3’15 - Video library expanded to 3.7 million video clips, up 12% versus Q3’15 - Paid downloads of 39.8 million increased 19% versus Q4’14 - Revenue per download of $2.86 increased 7% versus Q4’14 - Launched Shutterstock Editor in beta FY’15 Operating Highlights: - Image library expanded to 71.4 million images, up 53% versus FY’14 - Video library expanded to 3.7 million video clips, up 61% versus FY’14 - Paid downloads of 147.2 million increased 17% versus FY’14 - Revenue per download of $2.84 increased 10% versus FY’14 - 1.46 million customers contributed to revenue in the prior 12 months - Acquired Rex Features and PremiumBeat in January - Signed exclusive partnerships with Red Bull Media and PMC Media Q4 & FY’15 Key Operating Highlights

Consolidated Financial Results ($ in millions) Three Months Ended December 31, Twelve Months Ended December 31, 2015 2014 % 2015 2014 % Revenues $116.0 $91.2 27% $425.1 $328.0 30% Operating Expenses 101.0 78.9 28% 384.1 288.9 33% Income from Operations 15.0 12.3 22% 41.0 39.0 5% Add: Dep. & Amort. 4.5 2.2 105% 14.8 7.9 87% Add: Stock Based Comp. 6.1 8.0 (24%) 28.9 23.8 21% Add: Other Adjustments -- -- -- -- 0.4 -- Adjusted EBITDA $25.6 $22.5 14% $84.7 $71.1 19% Adjusted EBITDA Margin 22.1% 24.7% 19.9% 21.7% Add: Executive Severance 0.3 -- -- 1.0 -- -- $25.9 $22.5 15% $85.7 $71.1 20% 7 Note: “Other Adjustments” includes write-off of property & equipment in Q1’14. Note: Totals may not sum exactly due to rounding.

Key Financial Results Q4 2015 Y/Y Change 2015 Y/Y Change Reported Adjusted Reported Adjusted Revenue Growth 27% 24% 30% 27% Adjusted EBITDA Growth 14% 25% 19% 31% Revenue per Download Growth 7% 11% 10% 15% Adjusted EBITDA Margin 22.1% 26.3% 19.9% 23.4% Note: Adjusted growth excludes the impact of foreign currency, contributions from PremiumBeat & Rex which were acquired in Jan’15 and severance for executive management. 8

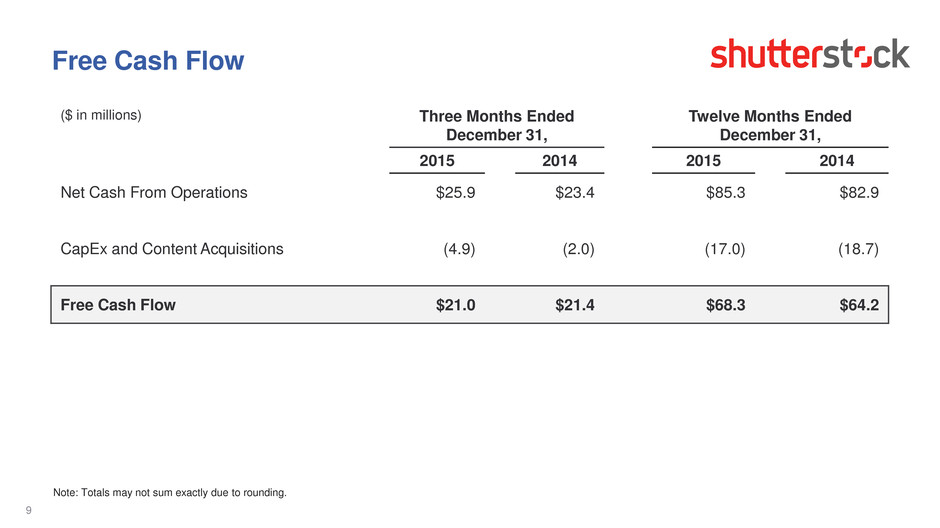
Free Cash Flow 9 ($ in millions) Three Months Ended December 31, Twelve Months Ended December 31, 2015 2014 2015 2014 Net Cash From Operations $25.9 $23.4 $85.3 $82.9 CapEx and Content Acquisitions (4.9) (2.0) (17.0) (18.7) Free Cash Flow $21.0 $21.4 $68.3 $64.2 Note: Totals may not sum exactly due to rounding.

Non-GAAP Net Income 10 ($ in millions) Three Months Ended December 31, Twelve Months Ended December 31, 2015 2014 2015 2014 GAAP Net Income $6.9 $7.0 $19.6 $22.1 Add: Non-Cash Equity-Based Comp 4.1 5.5 18.7 16.0 Add: Acquisition-Related Amortization 0.8 0.1 2.9 0.3 Add: Change in Fair Value of Contingent Consideration 2.1 0.1 3.1 0.2 Non-GAAP Net Income $13.8 $12.8 $44.2 $38.6 Non-GAAP Net Income / Diluted Share $0.38 $0.36 $1.22 $1.07 Note: Adjustments net of tax effect. Totals may not sum exactly due to rounding.

Share Repurchase Activity 11 Note: Share repurchase plan implemented in Nov’15. To date activity through 2/22/16. Note: % of shares acquired calculated as % of shares outstanding at beginning of period. Three Months Ended 12/31/15 2016 Year To Date Total Repurchase Activity Share Repurchase Activity $15,630,734 $17,173,146 $32,803,880 Shares Repurchased 459,602 578,472 1,038,074 Average Repurchase Price $34.01 $29.69 $31.60 Percentage of Outstanding Shares Acquired 1.2% 1.6% 2.8%

2016 Guidance 2016 Guidance Implied Y/Y Growth Revenue $495 - $510 million 17% - 20% Adjusted EBITDA $95 - $100 million 12% - 18% Non-Cash Equity Based Comp. $35 million Capital Expenditures $25 million 12 2016 Guidance Numbers Assume Current FX Rates Throughout the Period
