Attached files
| file | filename |
|---|---|
| 8-K - REALPAGE, INC. 8-K - RealPage, Inc. | a51285319.htm |
| EX-99.2 - EXHIBIT 99.2 - RealPage, Inc. | a51285319_ex992.htm |
| EX-99.1 - EXHIBIT 99.1 - RealPage, Inc. | a51285319_ex991.htm |
Exhibit 99.3

Q4 & FY 2015 EARNINGS FEBRUARY 2016
FORWARD-LOOKING STATEMENTS This presentation contains “forward-looking” statements relating to RealPage, Inc.’s expected, possible or assumed future results; its pending acquisition of NWP Services Corporation and the benefits to be derived from such acquisition, including the opportunity to expand its footprint and introduce new solutions with greater speed and scale, and the potential contribution to the company’s total revenue growth rate; its focus on driving revenue growth and margin expansion; its focus on disciplined capital allocation and cross-selling solutions; its expenses to be incurred in connection with its headquarters move and data center expansion; and its expected future capital expenditure levels. These forward-looking statements are based on management's beliefs and assumptions and on information currently available to management. Forward-looking statements include all statements that are not historical facts and may be identified by terms such as “expects,” “believes,” “plans,” or similar expressions and the negatives of those terms. Those forward-looking statements involve known and unknown risks, uncertainties and other factors that may cause actual results, performance or achievements to be materially different from any future results, performance or achievements expressed or implied by the forward-looking statements. The company may be required to revise its results upon finalizing its review of quarterly and full year results, which could cause or contribute to such differences. Additional factors that could cause or contribute to such differences include, but are not limited to, the following: (a) the possibility that general economic conditions, including leasing velocity or uncertainty, could cause information technology spending, particularly in the rental housing industry, to be reduced or purchasing decisions to be delayed; (b) an increase in insurance claims; (c) an increase in customer cancellations; (d) the inability to increase sales to existing customers and to attract new customers; (e) RealPage, Inc.’s failure to consummate pending acquisitions or to integrate acquired businesses and any future acquisitions successfully; (f) the timing and success of new product introductions by RealPage, Inc. or its competitors; (g) changes in RealPage, Inc.'s pricing policies or those of its competitors; (h) legal or regulatory proceedings; (i) the inability to achieve revenue growth or to enable margin expansion; and (j) such other risks and uncertainties described more fully in documents filed with or furnished to the Securities and Exchange Commission (“SEC”) by RealPage Inc., including its Quarterly Report on Form 10-Q previously filed with the SEC on November 5, 2015 and its Annual Report on Form 10-K previously filed with the SEC on March 2, 2015. All information provided in this release is as of the date hereof and RealPage Inc. undertakes no duty to update this information except as required by law. In addition to U.S. GAAP financials, this presentation includes certain non-GAAP financial measures. These historical non-GAAP measures are in addition to, not a substitute for or superior to, measures of financial performance prepared in accordance with GAAP. A reconciliation between GAAP and non-GAAP measures is included in the appendix to this presentation and is available on the Investor Relations portion of the website www.realpage.com. This presentation should also be used in conjunction with the company’s IR Fact Sheet and explanation of Non-GAAP Financial Measures, both previously furnished to the SEC by Form 8-K filed on February 23, 2016. RealPage is a registered trademark of RealPage, Inc. This presentation also contains additional trademarks and service marks of ours and of other companies. We do not intend our use or display of other companies’ trademarks or service marks to imply a relationship with, or endorsement or sponsorship of us by, these other companies. 2

STEVE WINN CHAIRMAN & CEO
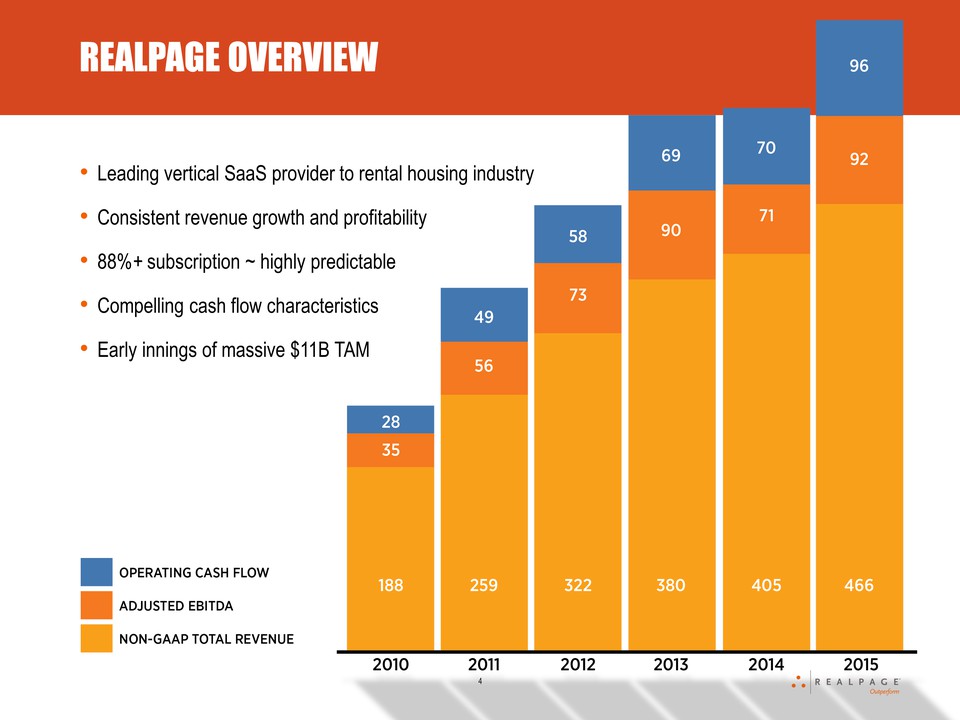
REALPAGE OVERVIEW •Leading vertical SaaS provider to rental housing industry •Consistent revenue growth and profitability •88%+ subscription ~ highly predictable •Compelling cash flow characteristics •Early innings of massive $11B TAM 4 As of the fourth quarter and year ended December 31, 2015. Please read in conjunction with our explanation of Non-GAAP Financial Measures, posted on the Investor Relations section of www.realpage.com, and previously furnished to the SEC on Form 8-K filed on February 23, 2016. 95.9% 85% 90% 95% 100% 1Q00 3Q00 1Q01 3Q01 1Q02 3Q02 1Q03 3Q03 1Q04 3Q04 1Q05 3Q05 1Q06 3Q06 1Q07 3Q07 1Q08 3Q08 1Q09 3Q09 1Q10 3Q10 1Q11 3Q11 1Q12 3Q12 1Q13 3Q13 1Q14 3Q14 1Q15 3Q15 4.9% -6% -4% -2% 0% 2% 4% 6% 8% 10% 12% 1Q00 3Q00 1Q01 3Q01 1Q02 3Q02 1Q03 3Q03 1Q04 3Q04 1Q05 3Q05 1Q06 3Q06 1Q07 3Q07 1Q08 3Q08 1Q09 3Q09 1Q10 3Q10 1Q11 3Q11 1Q12 3Q12 1Q13 3Q13 1Q14 3Q14 1Q15 3Q15
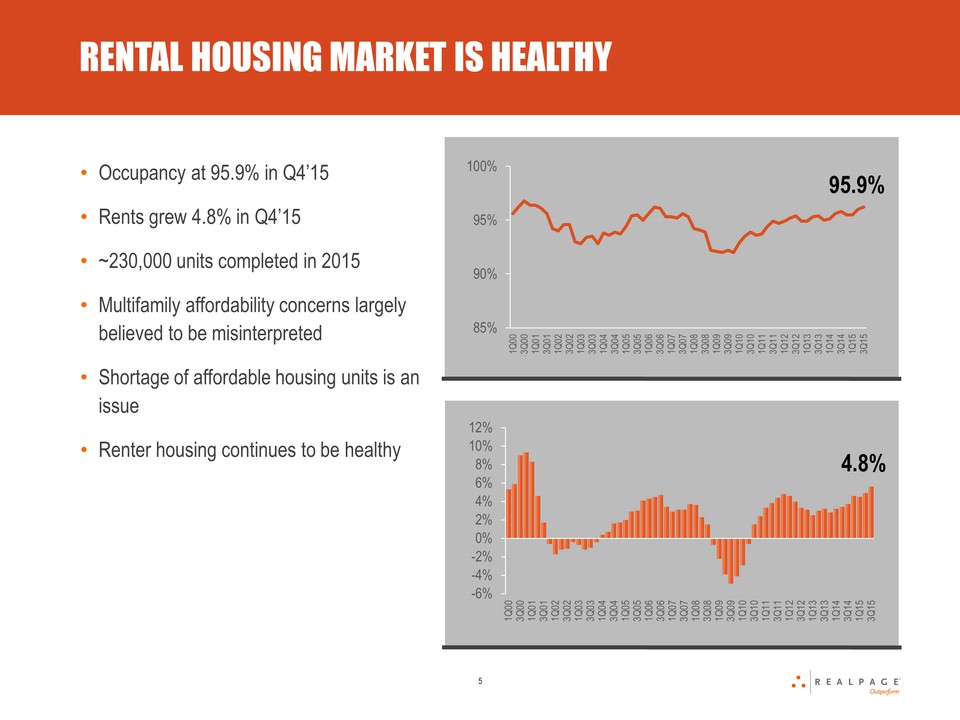
RENTAL HOUSING MARKET IS HEALTHY 5 •Occupancy at 95.9% •Rents grew 4.9% •~230,000 units completed in 2015 •Affordability concerns largely believed to be misinterpreted – AFFORDABLE HOUSING IS AN ISSUE •Renter housing continues to be healthy $0b $50b $100b $150b $200b $250b 4Q 01 2Q 02 4Q 02 2Q 03 4Q 03 2Q 04 4Q 04 2Q 05 4Q 05 2Q 06 4Q 06 2Q 07 4Q 07 2Q 08 4Q 08 2Q 09 4Q 09 2Q 10 4Q 10 2Q 11 4Q 11 2Q 12 4Q 12 2Q 13 4Q 13 2Q 14 4Q 14 2Q 15 4Q 15 Office Sales (T-12) Apartment Sales (T-12) Source: RCA. Includes only properties sold for more than $2.5 million.
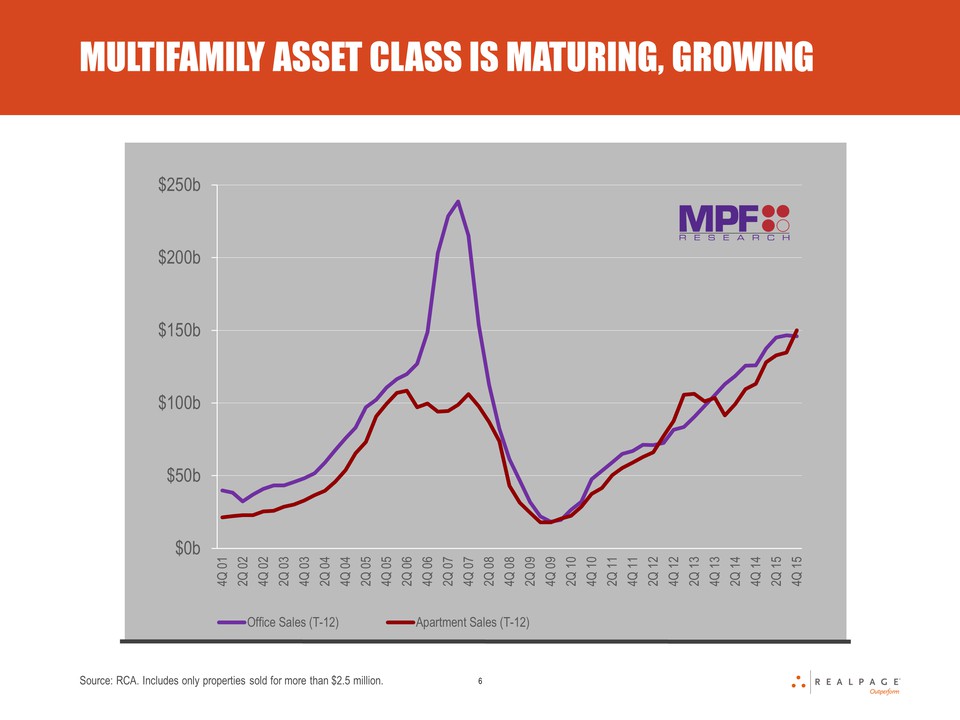
MULTIFAMILY ASSET CLASS IS MATURING, GROWING 6 Sources: MPF Research, RCA, Federal Reserve. Includes only properties sold for more than $2.5 million.
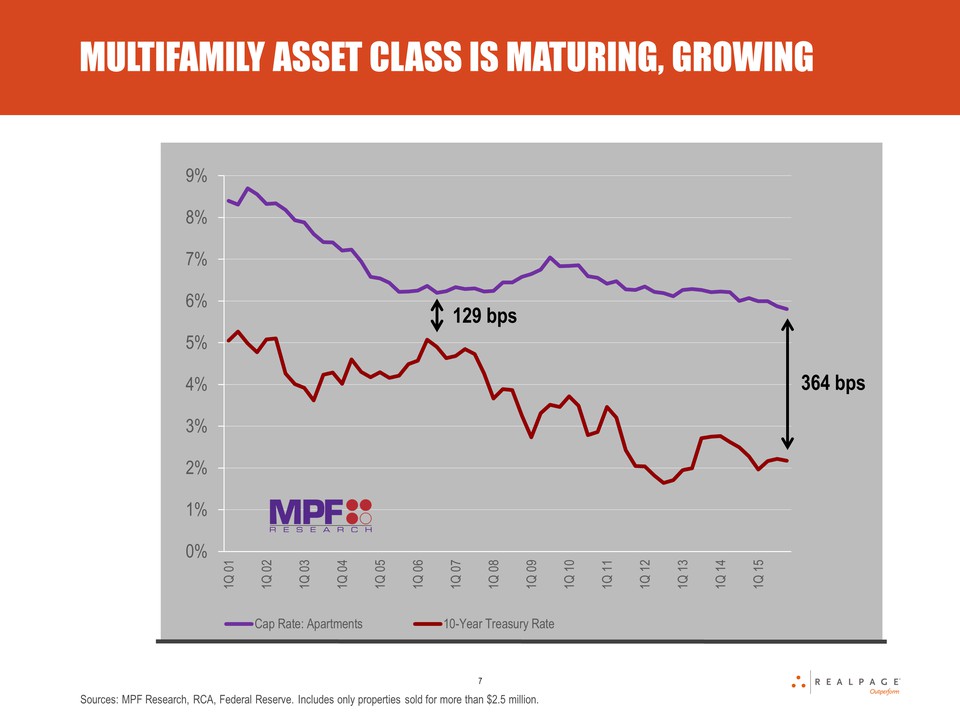
MULTIFAMILY ASSET CLASS IS MATURING, GROWING 0% 1% 2% 3% 4% 5% 6% 7% 8% 9% 1Q 01 1Q 02 1Q 03 1Q 04 1Q 05 1Q 06 1Q 07 1Q 08 1Q 09 1Q 10 1Q 11 1Q 12 1Q 13 1Q 14 1Q 15 Cap Rate: Apartments 10-Year Treasury Rate 129 bps 364 bps 7
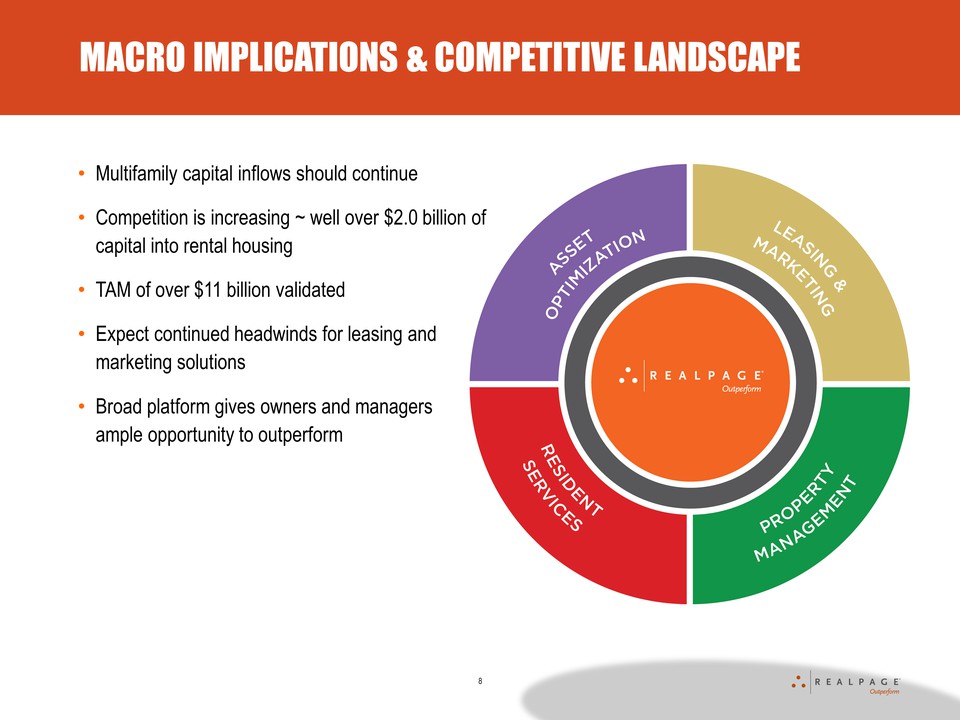
MACRO IMPLICATIONS & COMPETITIVE LANDSCAPE 8 •Multifamily capital inflows should continue •Competition is increasing ~ well over $1.0 billion of capital into rental housing •TAM of over $11 billion validated •Expect continued headwinds for leasing and marketing solutions •Broad platform gives owners and managers ample opportunity to outperform
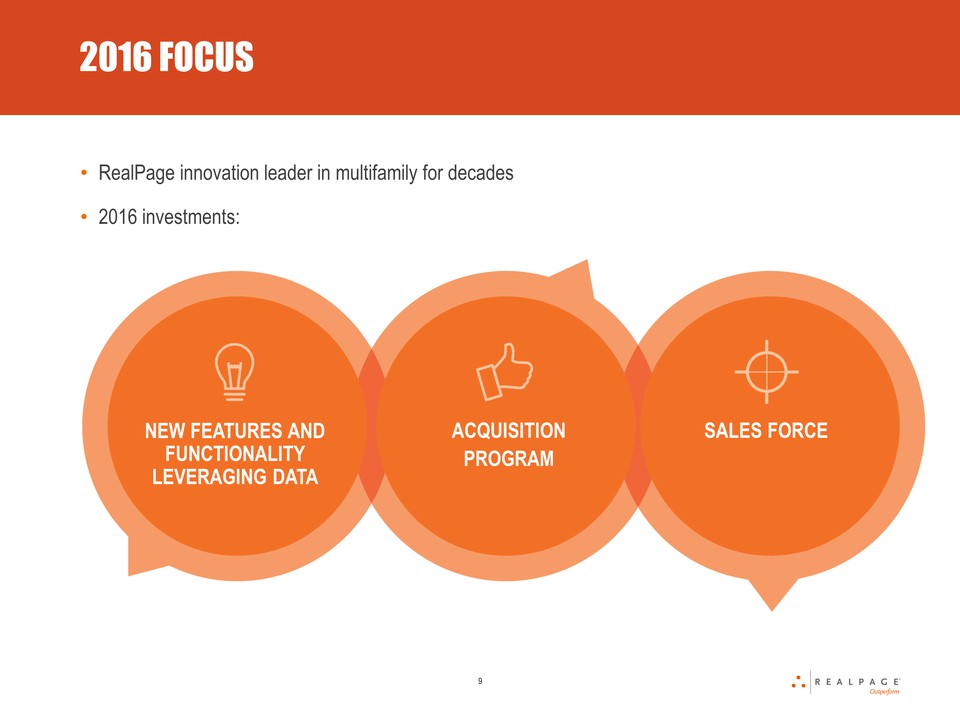
2016 FOCUS 9 •RealPage innovation leader in multifamily for decades •2016 investments: ACQUITSION PROGRAM SALES FORCE NEW FEATURES AND FUNCTIONALITY LEVERAGING DATA
ADDITIONAL FEATURES AND FUNCTIONALITY GENERAL 10 •Real-time lease-transaction data is foundation •Data science team focused on unlocking insights from resident data •Our data is our competitive advantage
ADDITIONAL FEATURES AND FUNCTIONALITY LEASING & MARKETING 11 •Optimize asset yields, reduce advertising spend and lower leasing agent labor costs •Leverage leading live agent platform in rental housing •Efficient marketing spend •Lead scoring and lifetime value of lease •ILS models outdated •Higher quality leads
ADDITIONAL FEATURES AND FUNCTIONALITY PROPERTY MANAGEMENT 12 •Accounting has experienced significant growth •Improve •International Accounting •Asset Management •Institutional BI Capabilities •Platform flexibility, forecasting and advanced analytics across all asset classes – all based on actual data
ADDITIONAL FEATURES AND FUNCTIONALITY ASSET OPTIMIZATION 13 •Focusing on transaction side •2/3 of total return •RealPage Investment Analytics has been a success •Expand platform •Deep data – Houston market •Expand YieldStar® data set

ACQUISITION PROGRAM INVESTMENTS RESIDENT SERVICES 14 •Acquiring NWP for $70 million, subject to adjustments •Post integration, combined offering expected to be leading resident billing, energy management and back-office services platform •Compelling synergies •Adds approximately 200,000 unique units, total RP units now 10.8 million units

SALES FORCE 15 •Continue to invest in Sales Force •Focus on vacation, senior and student living •Expect leverage from line item in 2016 •Focus on productivity in multifamily team •Sales team evolution •Focus on multi-solution, multi-year deals •Continue to invest in demand generation
SUMMARY 16 •Invest in features and functionality leveraging massive repository of data •Invest in acquisition program •Invest in sales force •Goal by 2020: •$1 billion in revenue •30% adjusted EBITDA margins •Balanced capital allocation •We have the right strategy

BRYAN HILL CFO & TREASURER
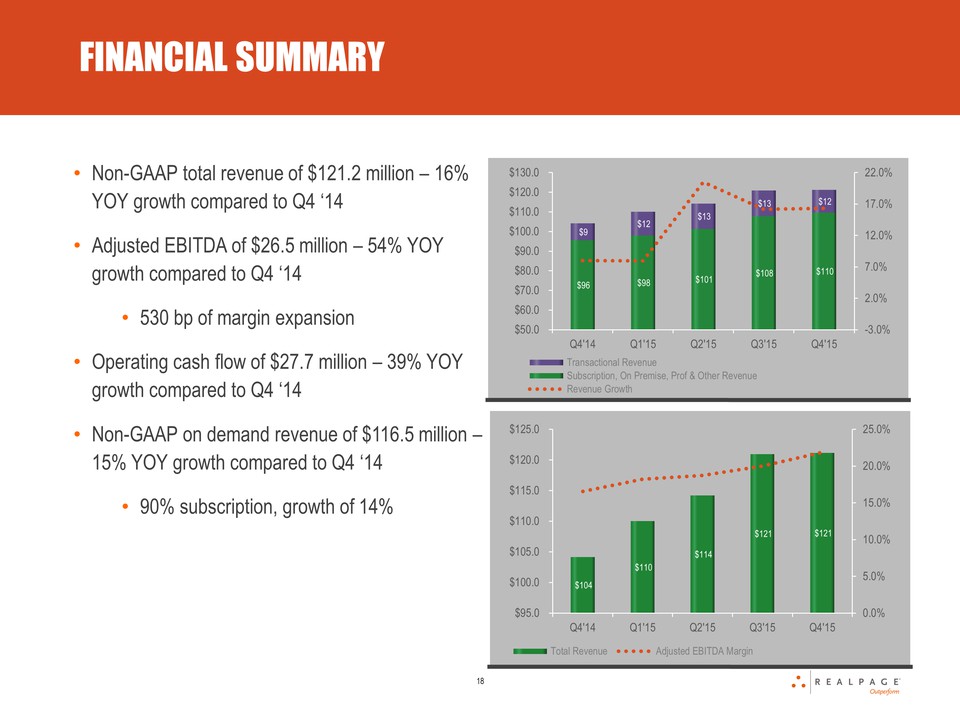
FINANCIAL SUMMARY 18 •Non-GAAP total revenue of $121.2 million – 16% YOY growth compared to Q4 ‘14 •Adjusted EBITDA of $26.5 million – 54% YOY growth compared to Q4 ‘14 •530 BP of margin expansion •Operating cash flow of $27.7 million – 39% YOY growth compared to Q4 ‘14 •Non-GAAP on demand revenue of $116.5 million – 15% YOY growth compared to Q4 ‘14 •90% subscription, growth of 14% 0.0% 5.0% 10.0% 15.0% 20.0% 25.0% $- $20.0 $40.0 $60.0 $80.0 $100.0 $120.0 $140.0 Q4'14 Q1'15 Q2'15 Q3'15 Q4'15 Transactional Revenue Subscription, On Premise, Prof & Other Revenue Revenue Growth 0.0% 5.0% 10.0% 15.0% 20.0% 25.0% $95.0 $100.0 $105.0 $110.0 $115.0 $120.0 $125.0 Q4'14 Q1'15 Q2'15 Q3'15 Q4'15 Total Revenue Adjusted EBITDA Margin $- $50.0 $100.0 $150.0 $200.0 $250.0 $300.0 $350.0 $400.0 $450.0 $500.0 2012 2013 2014 2015 Below 5,000 Units 5,000 - 20,000 Units 20,000 Units+
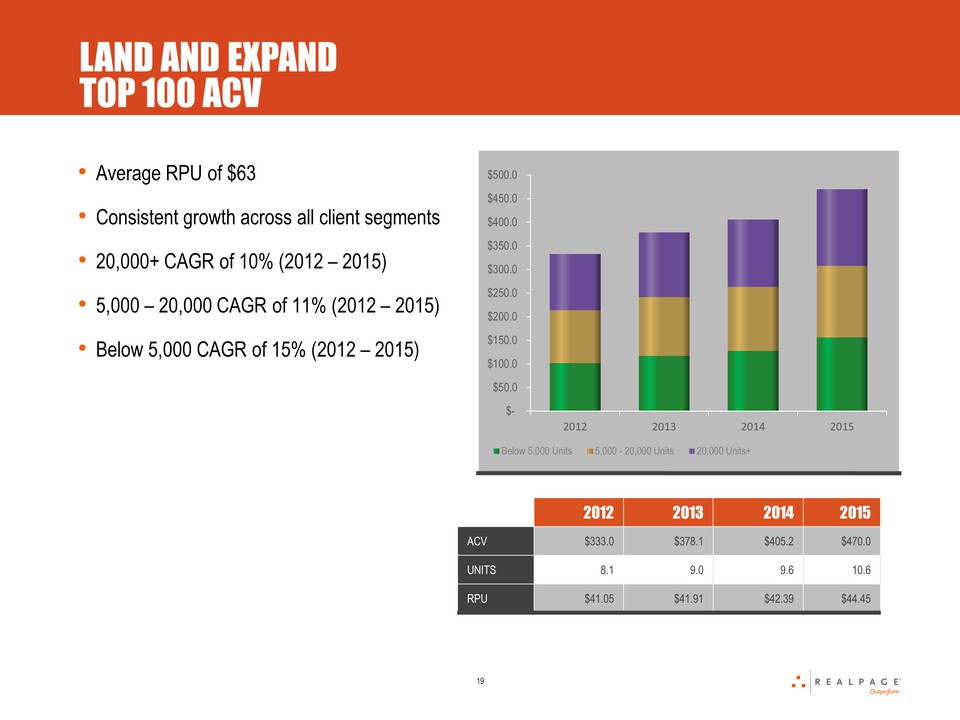
LAND AND EXPAND TOP 100 ACV •Average RPU of $63 •Consistent growth across all client segments •20,000+ CAGR of 10% (2012 – 2015) •5,000 – 20,000 CAGR of 11% (2012 – 2015) •Below 5,000 CAGR of 15% (2012 – 2015) 2012 2013 2014 2015 ACV $333.0 $378.1 $405.2 $470.0 UNITS 8.1 9.0 9.6 10.6 RPU $41.05 $41.91 $42.39 $44.45 19 TOP 50 RPU
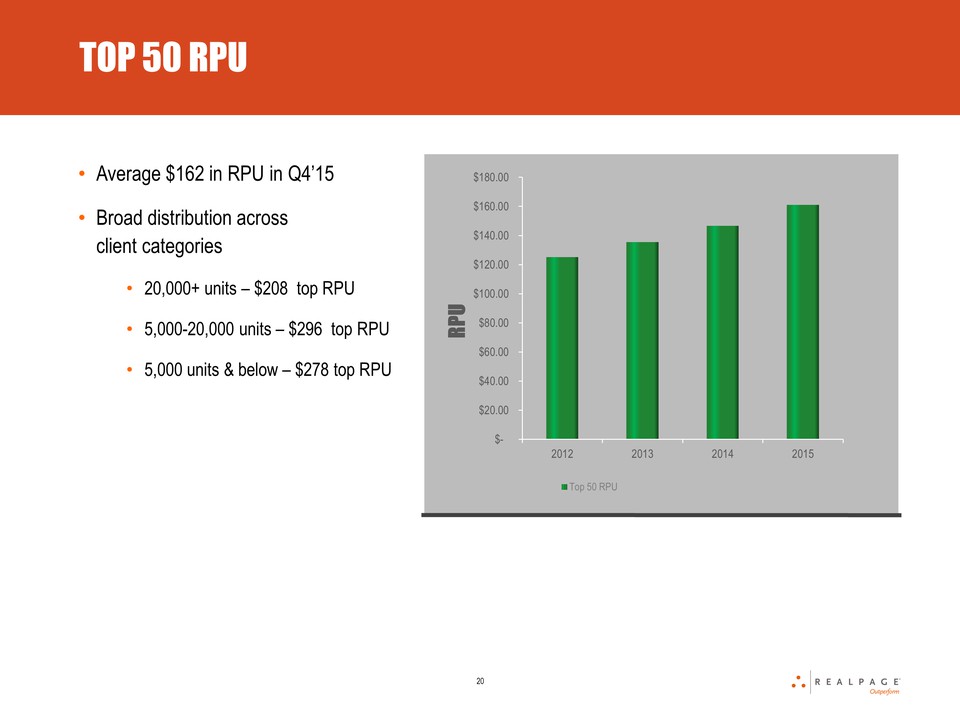
Top 50 RPU RPU 20 •Average $162 in RPU in Q4’15 •Relatively even distribution across client categories •20,000+ units – $208 RPU •5,000-20,000 units – $296 RPU •5,000 units & below – $278 RPU $- $20.00 $40.00 $60.00 $80.00 $100.00 $120.00 $140.00 $160.00 $180.00 2012 2013 2014 2015
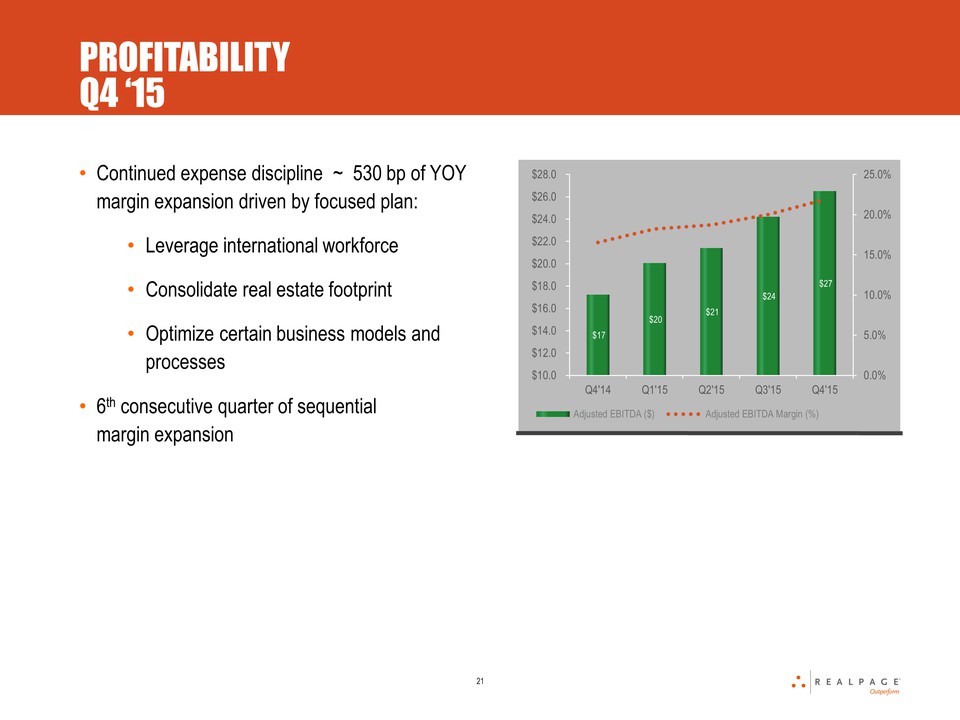
PROFITABILITY Q4 ‘15 •Continued expense discipline (530 bp of YOY margin expansion) driven by focused plan: •Leverage international workforce •Consolidate real estate footprint •Optimize certain business models and processes •6th consecutive quarter of sequential margin expansion 21 0.0% 5.0% 10.0% 15.0% 20.0% 25.0% $95.0 $100.0 $105.0 $110.0 $115.0 $120.0 $125.0 Q4'14 Q1'15 Q2'15 Q3'15 Q4'15 Total Revenue Adjusted EBITDA Margin
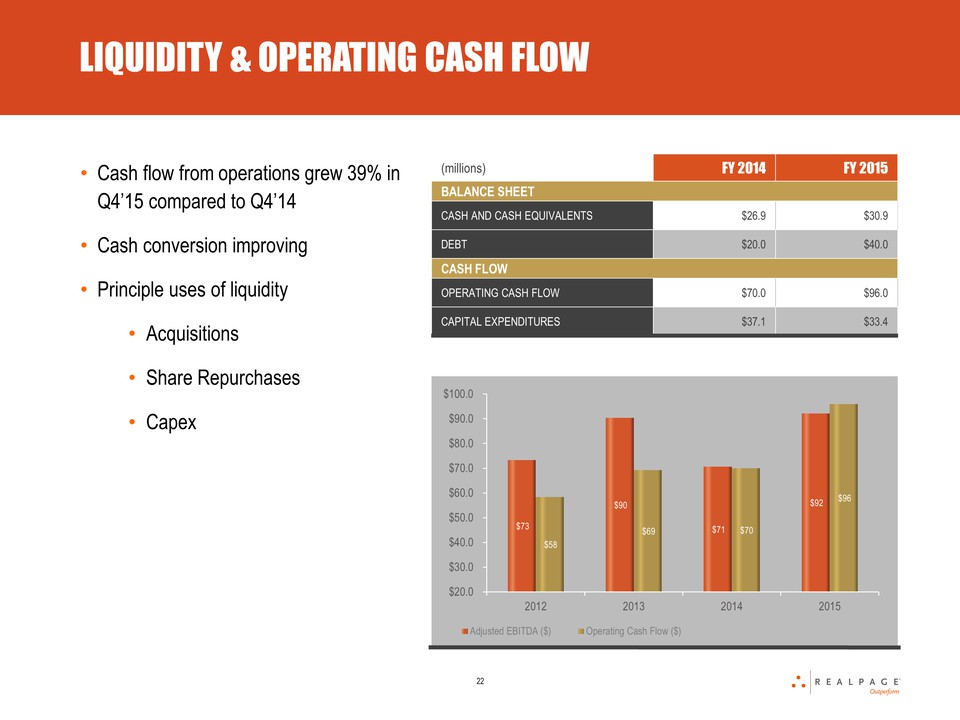
LIQUIDITY & OPERATING CASH FLOW •Cash flow from operations grew 39% compared to 2014 •Quality of earnings improving •Principle uses of liquidity •Acquisitions •Share Repurchases •CAPEX $- $10.0 $20.0 $30.0 $40.0 $50.0 $60.0 $70.0 $80.0 $90.0 $100.0 2012 2013 2014 2015 Adjusted EBITDA ($) Operating Cash Flow ($) (millions) FY 2015 FY 2014 BALANCE SHEET CASH AND CASH EQUIVALENTS $30.9 $26.9 DEBT $40.0 $20.0 CASH FLOW OPERATING CASH FLOW $96.0 $70.0 CAPITAL EXPENDITURES $33.4 $37.1 22
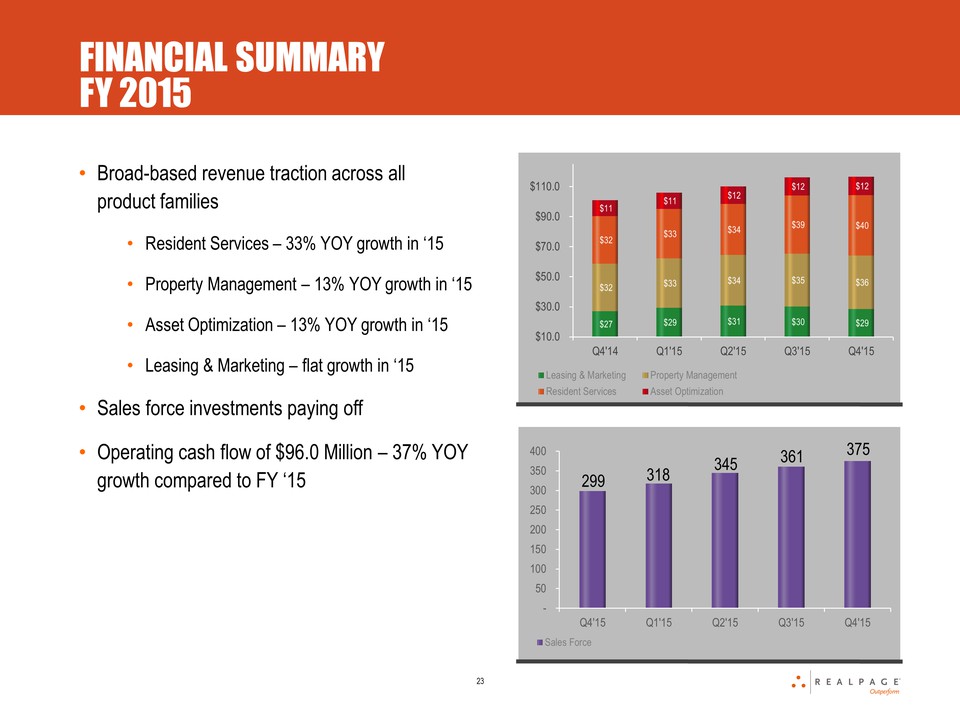
FINANCIAL SUMMARY FY 2015 •Broad-based revenue traction across all product families •Resident Services – 33% YOY growth in ‘15 •Property Management – 13% YOY growth in ‘15 •Asset Optimization – 13% YOY growth in ‘15 •Leasing & Marketing – flattish growth in ‘15 •Sales force investments paying off •Operating cash flow of $96.0 Million – 37% YOY growth compared to FY ‘15 23 299 318 345 361 375 - 50 100 150 200 250 300 350 400 Q4'15 Q1'15 Q2'15 Q3'15 Q4'15 Sales Force $- $20.0 $40.0 $60.0 $80.0 $100.0 $120.0 Q4'14 Q1'15 Q2'15 Q3'15 Q4'15 Leasing & Marketing Property Management Resident Services Asset Optimization
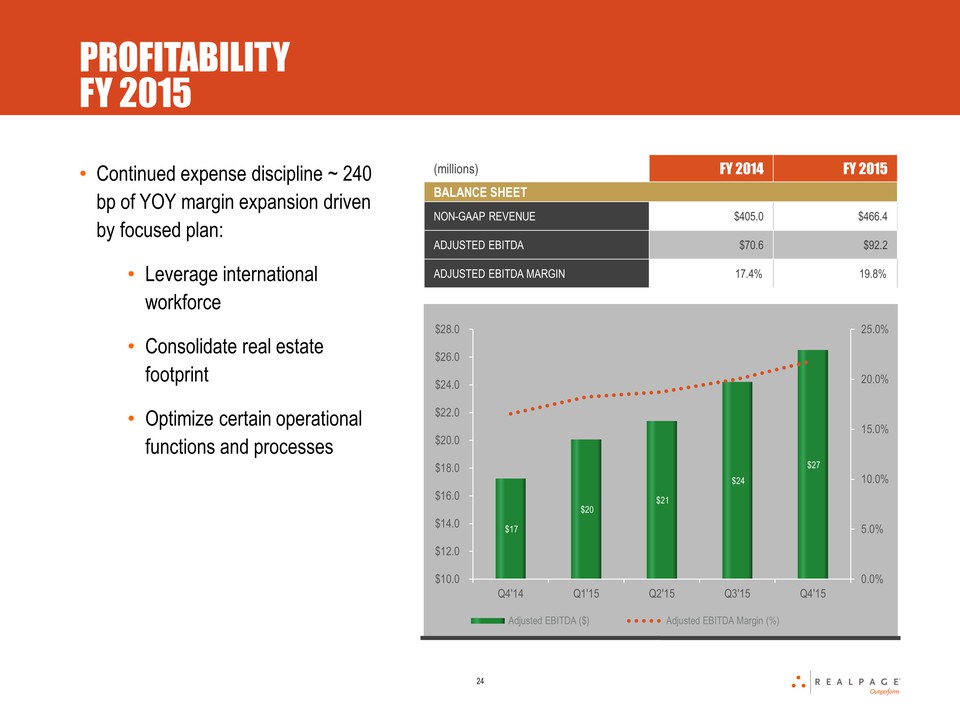
PROFITABILITY FY 2015 •Continued expense discipline ~ over 240 bps of YOY margin expansion driven by focused plan: •Leverage international workforce •Consolidate real estate footprint •Optimize certain business models and processes •Leverage lines •GM – nearly 100 basis points of leverage – revenue mix •R&D – over 100 basis points of leverage – 60% of head count international – below peers 0.0% 5.0% 10.0% 15.0% 20.0% 25.0% $- $10.0 $20.0 $30.0 $40.0 $50.0 $60.0 $70.0 $80.0 $90.0 $100.0 2012 2013 2014 2015 Adjusted EBITDA ($) Adjusted EBITDA Margin (%) 24
2016 FOCUS 25 •RealPage innovation leader in multifamily for decades •2016 investments: •New features & functionality leveraging repository of resident data •Acquisition of NWP •Sales Force •200 bps of organic margin expansion
2016 EXPECTATIONS •FY ‘16 Non-GAAP total revenue of $565 million to $575 million •Includes ~$45 million from NWP •Adjusted EBITDA of $118 million to $123 million •Includes ~$5 million from NWP •Excludes ~$5 million of duplicative rent & other costs 27

APPENDIX
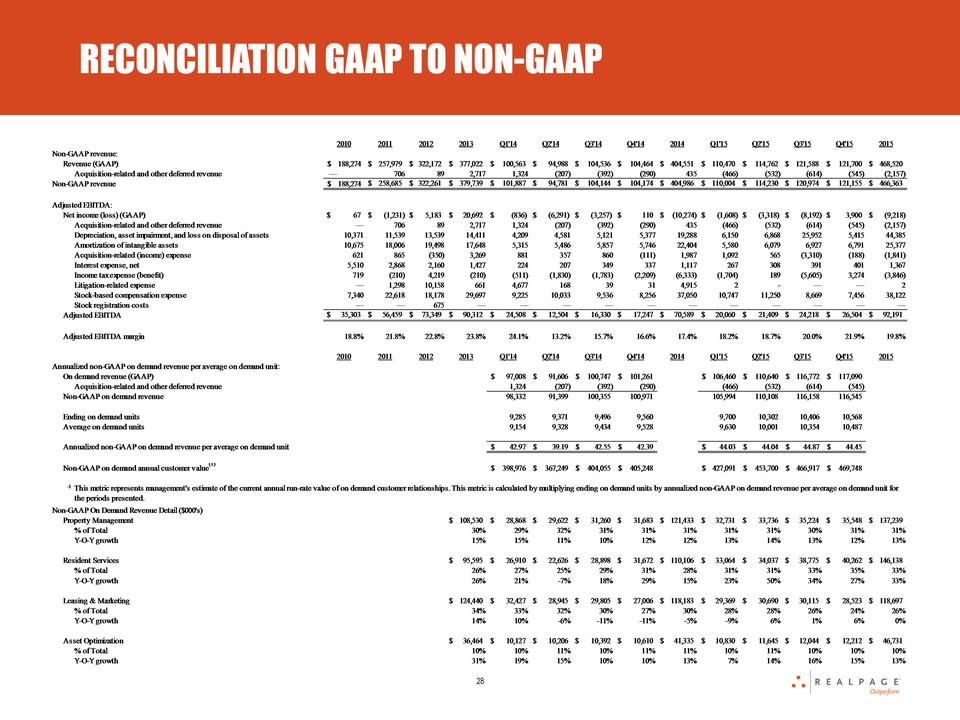
29 2010 2011 2012 2013 Q1'14 Q2'14 Q3'14 Q4'14 2014 Q1'15 Q2'15 Q3'15 Q4'15 2015 Non-GAAP revenue: Revenue (GAAP) $ 188,274 $ 257,979 $ 322,172 $ 377,022 $ 100,563 $ 94,988 $ 104,536 $ 104,464 $ 404,551 $ 110,470 $ 114,762 $ 121,588 $ 121,700 $ 468,520 Acquisition-related and other deferred revenue — 706 89 2,717 1,324 (207) (392) (290) 435 (466) (532) (614) (545) (2,157) Non-GAAP revenue $ 188,274 $ 258,685 $ 322,261 $ 379,739 $ 101,887 $ 94,781 $ 104,144 $ 104,174 $ 404,986 $ 110,004 $ 114,230 $ 120,974 $ 121,155 $ 466,363 Adjusted EBITDA: Net income (loss) (GAAP) $ 67 $ (1,231) $ 5,183 $ 20,692 $ (836) $ (6,291) $ (3,257) $ 110 $ (10,274) $ (1,608) $ (3,318) $ (8,192) $ 3,900 $ (9,218) Acquisition-related and other deferred revenue — 706 89 2,717 1,324 (207) (392) (290) 435 (466) (532) (614) (545) (2,157) Depreciation, asset impairment, and loss on disposal of assets 10,371 11,539 13,539 14,411 4,209 4,581 5,121 5,377 19,288 6,150 6,868 25,952 5,415 44,385 Amortization of intangible assets 10,675 18,006 19,498 17,648 5,315 5,486 5,857 5,746 22,404 5,580 6,079 6,927 6,791 25,377 Acquisition-related (income) expense 621 865 (350) 3,269 224 207 860 (111) 1,987 267 308 (3,310) (188) (1,841) Interest expense, net 5,510 2,868 2,160 1,427 (511) (1,830) 349 337 1,117 (1,704) 189 391 401 1,367 Income tax expense (benefit) 719 (210) 4,219 (210) 4,677 168 (1,783) (2,209) (6,333) 2 — (5,605) 3,274 (3,846) Litigation-related expense — 1,298 10,158 661 9,225 10,033 39 31 4,915 10,747 11,250 — — 2 Stock-based compensation expense 7,340 22,618 18,178 29,697 881 357 9,536 8,256 37,050 1,092 565 8,669 7,456 38,122 Stock registration costs — — 675 — — — — — — — — — — — Adjusted EBITDA $ 35,303 $ 56,459 $ 73,349 $ 90,312 $ 24,508 $ 12,504 $ 16,330 $ 17,247 $ 70,589 $ 20,060 $ 21,409 $ 24,218 $ 26,504 $ 92,191 Adjusted EBITDA margin 18.8 % 21.8 % 22.8 % 23.8 % 24.1 % 13.2 % 15.7 % 16.6 % 17.4 % 18.2 % 18.7 % 20.0 % 21.9 % 19.8 % Annualized non-GAAP on demand revenue per average on demand unit: On demand revenue (GAAP) $ 97,008 $ 91,606 $ 100,747 $ 101,261 $ 106,460 $ 110,640 $ 116,772 $ 117,090 Acquisition-related and other deferred revenue 1,324 (207) (392) (290) (466) (532) (614) (545) Non-GAAP on demand revenue 98,332 91,399 100,355 100,971 105,994 110,108 116,158 116,545 Ending on demand units 9,285 9,371 9,496 9,560 9,700 10,302 10,406 10,568 Average on demand units 9,154 9,328 9,434 9,528 9,630 10,001 10,354 10,487 Annualized non-GAAP on demand revenue per average on demand unit $ 42.97 $ 39.19 $ 42.55 $ 42.39 $ 44.03 $ 44.04 $ 44.87 $ 44.45 Non-GAAP on demand annual customer value(1) $ 398,976 $ 367,249 $ 404,055 $ 405,248 $ 427,091 $ 453,700 $ 466,917 $ 469,748 (1) This metric represents management's estimate of the current annual run-rate value of on demand customer relationships. This metric is calculated by multiplying ending on demand units by annualized non-GAAP on demand revenue per average on demand unit for the periods presented. Non-GAAP On Demand Revenue Detail ($000's) Property Management $ 28,868 $ 29,622 $ 31,260 $ 31,683 $ 121,433 $ 32,731 $ 33,736 $ 35,224 $ 35,548 $ 137,239 % of Total 29.4 % 32.4 % 31.1 % 31.4 % 31.1 % 30.9 % 30.6 % 30.3 % 30.5 % 30.6 % Y-O-Y growth 14.6 % 11.3 % 10.2 % 11.8 % 11.9 % 13.4 % 13.9 % 12.7 % 12.2 % 13.0 % Resident Services $ 26,910 $ 22,626 $ 28,898 $ 31,672 $ 110,106 $ 33,064 $ 34,037 $ 38,775 $ 40,262 $ 146,138 % of Total 27.4 % 24.8 % 28.8 % 31.4 % 28.2 % 31.2 % 30.9 % 33.4 % 34.5 % 32.6 % Y-O-Y growth 21.5 % (7.5)% 18.1 % 29.2 % 15.2 % 22.9 % 50.4 % 34.2 % 27.1 % 32.7 % Leasing & Marketing $ 32,427 $ 28,945 $ 29,805 $ 27,006 $ 118,183 $ 29,369 $ 30,690 $ 30,115 $ 28,523 $ 118,697 % of Total 33.0 % 31.7 % 29.7 % 26.7 % 30.2 % 27.7 % 27.9 % 25.9 % 24.5 % 26.4 % Y-O-Y growth 9.9 % (6.2)% (11.3)% (11.4)% (5.0)% (9.4)% 6.0 % 1.0 % 5.6 % 0.4 % Asset Optimization $ 10,127 $ 10,206 $ 10,392 $ 10,610 $ 41,335 $ 10,830 $ 11,645 $ 12,044 $ 12,212 $ 46,731 % of Total 10.3 % 11.2 % 10.4 % 10.5 % 10.6 % 10.2 % 10.6 % 10.4 % 10.5 % 10.4 % Y-O-Y growth 19.4 % 14.8 % 10.3 % 9.7 % 13.4 % 6.9 % 14.1 % 15.9 % 15.1 % 13.1 % RECONCILIATION GAAP TO NON-GAAP