Attached files
| file | filename |
|---|---|
| EX-31.1 - EXHIBIT 31.1 - Recon Technology, Ltd | v430481_ex31-1.htm |
| EX-31.2 - EXHIBIT 31.2 - Recon Technology, Ltd | v430481_ex31-2.htm |
| EX-32.2 - EXHIBIT 32.2 - Recon Technology, Ltd | v430481_ex32-2.htm |
| EX-32.1 - EXHIBIT 32.1 - Recon Technology, Ltd | v430481_ex32-1.htm |
U. S. SECURITIES AND EXCHANGE COMMISSION
WASHINGTON, DC 20549
FORM 10-Q
| x | Quarterly report pursuant to Section 13 or 15(d) of the Securities Exchange Act of 1934 |
For the quarterly period ended December 31, 2015
| ¨ | Transition report pursuant to Section 13 or 15(d) of the Securities Exchange Act of 1934 |
For the transition period from to .
Commission File Number 001-34409
RECON TECHNOLOGY, LTD
(Exact name of registrant as specified in its charter)
| Cayman Islands | Not Applicable | |
|
(State or other jurisdiction of incorporation or organization) |
(I.R.S. employer identification number) |
1902 Building C, King Long International Mansion
No. 9 Fulin Road
Beijing 100107 China
(Address of principal executive offices and zip code)
+86 (10) 8494-5799
(Registrant’s telephone number, including area code)
Indicate by check mark whether the registrant (1) has filed all reports required to be filed by Section 13 or 15(d) of the Securities Exchange Act of 1934 during the preceding 12 months (or for such shorter period that the registrant was required to file such reports) and (2) has been subject to such filing requirements for the past 90 days. Yes x No ¨
Indicate by check mark whether the registrant has submitted electronically and posted on its corporate Web site, if any, every Interactive Data File required to be submitted and posted pursuant to Rule 405 of Regulation S-T (§232.405 of this chapter) during the preceding 12 months (or for such shorter period that the registrant was required to submit and post such files). Yes x No ¨
Indicate by check mark whether the registrant is a large accelerated filer, an accelerated filer, a non-accelerated filer, or a smaller reporting company.
| Large accelerated filer | ¨ | Accelerated filer | ¨ | |||
| Non-accelerated filer | ¨ (Do not check if a smaller reporting company) | Smaller reporting company | x |
Indicate by check mark whether the registrant is a shell company (as defined in Rule 12b-2 of the Exchange Act). Yes ¨ Nox
Indicate the number of shares outstanding of each of the issuer’s classes of ordinary shares, as of the latest practicable date. The Company is authorized to issue 100,000,000 ordinary shares. As of February 16, 2016, the Company has issued and outstanding 5,804,005 shares.
RECON TECHNOLOGY, LTD
FORM 10-Q
INDEX
| Special Note Regarding Forward-Looking Statements | ii | |
| Part I Financial Information | 3 | |
| Item 1. | Financial Statements (Unaudited) | 3 |
| Item 2. | Management’s Discussion and Analysis of Financial Condition and Results of Operations | 3 |
| Item 3. | Quantitative and Qualitative Disclosures about Market Risk | 23 |
| Item 4. | Controls and Procedures | 23 |
| Part II Other Information | 24 | |
| Item 1. | Legal Proceedings | 24 |
| Item 1A. | Risk Factors | 24 |
| Item 2. | Unregistered Sales of Equity Securities and Use of Proceeds | 24 |
| Item 3. | Defaults upon Senior Securities | 24 |
| Item 4. | Mine Safety Disclosures | 24 |
| Item 5. | Other Information | 24 |
| Item 6. | Exhibits | 25 |
i
Special Note Regarding Forward-Looking Statements
This document contains certain statements of a forward-looking nature. Such forward-looking statements, including but not limited to projected growth, trends and strategies, future operating and financial results, financial expectations and current business indicators are based upon current information and expectations and are subject to change based on factors beyond the control of the Company. Forward-looking statements typically are identified by the use of terms such as “look,” “may,” “should,” “might,” “believe,” “plan,” “expect,” “anticipate,” “estimate” and similar words, although some forward-looking statements are expressed differently. The accuracy of such statements may be influenced by a number of business risks and uncertainties that could cause actual results to differ materially from those projected or anticipated, including but not limited to the following:
| • | the timing of the development of future products; |
| • | projections of revenue, earnings, capital structure and other financial items; |
| • | statements of our plans and objectives; |
| • | statements regarding the capabilities of our business operations; |
| • | statements of expected future economic performance; |
| • | statements regarding competition in our market; and |
| • | assumptions underlying statements regarding us or our business. |
Readers are cautioned not to place undue reliance on these forward-looking statements, which speak only as of the date of this report. The Company undertakes no obligation to update this forward-looking information. Nonetheless, the Company reserves the right to make such updates from time to time by press release, periodic report or other method of public disclosure without the need for specific reference to this report. No such update shall be deemed to indicate that other statements not addressed by such update remain correct or create an obligation to provide any other updates.
ii
| Item 1 | Financial Statements. |
See the unaudited condensed consolidated financial statements following the signature page of this report, which are incorporated herein by reference.
| Item 2 | Management’s Discussion and Analysis of Financial Condition and Results of Operations. |
The following discussion and analysis of our company’s financial condition and results of operations should be read in conjunction with our unaudited condensed consolidated financial statements and the related notes included elsewhere in this report. This discussion contains certain forward-looking statements that involve risks and uncertainties. Actual results and the timing of selected events could differ materially from those anticipated in these forward-looking statements as a result of various factors.
Overview
We are a company with limited liability incorporated in 2007 under the laws of the Cayman Islands. Headquartered in Beijing, we provide products and services to oil and gas companies and their affiliates through Nanjing Recon Technology Co. Ltd (“Nanjing Recon”) and Beijing BHD Petroleum Technology Co, Ltd (“BHD”), hereafter referred to as our domestic companies (the “Domestic Companies”), which are established as variable interest entities (“VIEs”) under the laws of the People’s Republic of China (“PRC”). As the Company contractually controls the Domestic Companies, we are the center of strategic management, financial control and human resources allocation.
Through Nanjing Recon and BHD, our business is mainly focused on the upstream sectors of the oil and gas industry. We derive our revenues from the sales and provision of (1) hardware products, (2) software products and (3) services. Our products and services involve most of the key procedures of the extraction and production of oil and gas, and include automation systems, equipment, tools and on-site technical services.
Our Domestic Companies provide the oil and gas industry with equipment, production technologies, automation and services.
| · | Nanjing Recon: Nanjing Recon is a high-tech company that specializes in automation services for oilfield companies. It mainly focuses on providing automation solutions to the oil exploration industry, including monitoring wells, automatic metering to the joint station production, process monitor, and a variety of oilfield equipment and control systems. |
| · | BHD: BHD is a high-tech company that specializes in transportation equipment and stimulation productions and services. Possessing proprietary patents and substantial industry experience, BHD has built up stable and strong working relationships with the major oilfields in China. |
Recent Developments
On September 22, 2015, the Company entered into an amendment to the Company’s letter agreement (the “Agreement”) with Maxim Group LLC, dated January 28, 2015, pursuant to which Maxim would serve as the Company’s exclusive agent in connection with a proposed at-the-market offering program by the Company of up to $10,000,000. The amendment extends the term of the Agreement for an additional six months, or until February 29, 2016. As of February 16, 2016, no shares have been issued under the amended Agreement.
On December 1, 2015, the Company entered into a share purchase agreement to acquire a 100% interest in Qinghai Huayou Downhole Technologies Co., Ltd. ( “QHHY”), a PRC corporation and oilfield service provider in Qinghai province. This transaction is subject to shareholders approval.
3
Products and Services
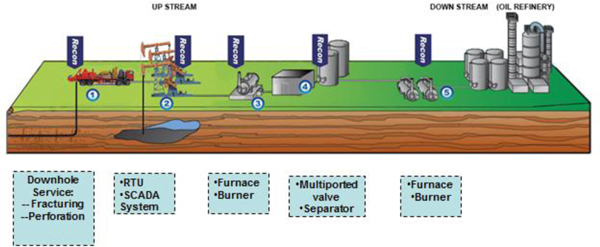
We currently provide products and services to oil and gas field companies focused on the development and production of oil and natural gas. Our products and services described below correlate to the numbered stages of the oilfield production system graphical expression shown below.
Our products and services include:
Equipment for Oil and Gas Production and Transportation
High-Efficiency Heating Furnaces (as shown above). Crude petroleum contains certain impurities that must be removed before it can be sold, including water and natural gas. To remove the impurities and to prevent solidification and blockage in transport pipes, companies employ heating furnaces. BHD researched, developed and implemented a new oilfield furnace that is advanced, highly automated, reliable, easy to operate, safe and highly heat-efficient (90% efficiency).
Burner (as shown above). We serve as an agent for the Unigas Burner, which is designed and manufactured by UNIGAS, a European burning equipment production company. The burner we provide has the following characteristics: high degree of automation, energy conservation, high turn-down ratio, high security and environmental safety.
Oil and Gas Production Improvement Techniques
Packers of Fracturing. This utility model is used in concert with the security joint, hydraulic anchor, and slide brushing of sand spray in the well. It is used for easy seat sealing and sand uptake prevention. The utility model reduces desilting volume and prevents sand-up, which makes the deblocking processes easier to realize. The back flushing is sand-stick proof.
Production Packer. At varying withdrawal points, the production packer separates different oil layers and protects the oil pipe from sand and permeation, promoting the recovery ratio.
Sand Prevention in Oil and Water Well. This technique processes additives that are resistant to elevated temperatures into “resin sand” which is transported to the bottom of the well via carrying fluid. The resin sand goes through the borehole, piling up and compacting at the borehole and oil vacancy layer. An artificial borehole wall is then formed, functioning as a means of sand prevention. This sand prevention technique has been adapted to more than 100 wells, including heavy oil wells, light oil wells, water wells and gas wells, with a 100% success rate and a 98% effective rate.
4
Water Locating and Plugging Technique. High water cut affects the normal production of oilfields. Previously, there was no sophisticated method for water locating and tubular column plugging in China. The mechanical water locating and tubular column plugging technique we have developed resolves the problem of high water cut wells. This technique conducts a self-sealing test during multi-stage usage and is reliable to separate different production sets effectively. The water location switch forms a complete set by which the water locating and plugging can be finished in one trip. The tubular column is adaptable to several oil drilling methods and is available for water locating and plugging in second and third class layers.
Fissure Shaper. This is our proprietary product that is used along with a perforating gun to effectively increase perforation depth by between 46% and 80%, shape stratum fissures, improve stratum diversion capability and, as a result, improve our ability to locate oilfields and increase the output of oil wells.
Fracture Acidizing. We inject acid to layers under pressure, which can form or expand fissures. The treatment process of the acid is defined as fracture acidizing. The technique is mainly adapted to oil and gas wells that are blocked up relatively deeply, or oil and gas wells in low permeability zones.
Electronic Break-Down Service. This service resolves block-up and freezing problems by generating heat from the electric resistivity of the drive pipe and utilizing a loop tank composed of an oil pipe and a drive pipe. This technique saves energy and is environmentally friendly. It can increase the production of oilfields that are in the middle and later periods.
Automation System and Services
Pumping Unit Controller. This controller functions as a monitor to the pumping unit and also collects data for load, pressure, voltage, and startup and shutdown control.
RTU Monitor. This monitor collects gas well pressure data.
Wireless Dynamometer and Wireless Pressure Gauge. These products replace wired technology with cordless displacement sensor technology. They are easy to install and significantly reduce the work load associated with cable laying.
Electric Multi-way Valve for Oilfield Metering Station Flow Control. This multi-way valve is used before the test separator to replace the existing three valve manifolds. It facilitates the electronic control of the connection of the oil lead pipeline with the separator.
Natural Gas Flow Computer System. The flow computer system is used in natural gas stations and gas distribution stations to measure flow.
Recon Supervisory Control and Data Acquisition System (“SCADA”). Recon SCADA is a system which applies to the oil well, measurement station and the union station for supervision and data collection.
EPC Service of Pipeline SCADA System. This service technique is used for pipeline monitoring and data acquisition after crude oil transmission.
EPC Service of Oil and Gas Wells SCADA System. This service technique is used for monitoring and data acquisition of oil wells and natural gas wells.
EPC Service of Oilfield Video Surveillance and Control System. This video surveillance technique is used for controlling the oil and gas wellhead area and the measurement station area.
Technique Service for “Digital oilfield” Transformation. This service includes engineering technique services such as oil and gas SCADA systems, video surveillance and control systems and communication systems.
5
Factors Affecting Our Business
Business Outlook
The oilfield engineering and technical service industry is generally divided into five sections: (1) exploration, (2) drilling and completion, (3) testing and logging, (4) production and (5) oilfield construction. Thus far our businesses have been involved in the completion, production and construction processes. Our management still believes we need to expand our core business, move into new markets and develop new businesses quickly for the coming years. Management anticipates there will be opportunities in new markets and our existing markets. We also believe that many existing wells and oilfields need to improve or renew their equipment and service to maintain production and techniques and services like ours will be needed as new oil and gas fields are developed. In the next three years, we plan to focus on:
Measuring Equipment and Service. Digital oil field technology and the management of oil companies are highly regarded in the industry. We believe our oilfield SCADA and related technical support services will address the needs of the oil well automation system market, for which we believe there will be increasing demand over the short term and strong needs in the long term.
Gathering and Transferring Equipment. With more new wells developed, our management anticipates that demand for our furnaces and burners will grow as compared to last year, especially in the Jilin Oilfield and Xinjiiang Oilfield.
Fracturing service. We expect demand for fracturing will increase in China and we are focused on the development and upgrade of current down-hole tools which can be used in this sector.
New business. We are in the process of expanding our business through the acquisition of a down-hole service company. We also have developed new products for oilfield wastewater treatment and achieved preliminary business on this segment. Our management anticipates expanding the new business more rapidly in the coming year.
Growth Strategy
As a smaller China-focused company, it is our basic strategy to focus on developing our onshore oilfield business in the upstream sector of the industry. Due to the remote location and difficult environments of China’s oil and gas fields, historically foreign competitors have rarely entered those areas directly.
Large domestic oil companies have historically focused on their exploration and development businesses to earn higher margins and maintain their competitive advantage. With regard to private oilfield service companies, we estimate that approximately 90% specialize in the manufacture of drilling and production equipment. Thus, the market for technical support and project service is still in its early stage. Our management is focused on providing high quality products and service in oilfields in which we have a geographical advantage. This helps us to avoid conflicts of interest with bigger suppliers of drilling equipment while protecting our position within this market segment. Our mission is to increase the automation and safety levels of industrial petroleum production in China and improve the underdeveloped working process and management mode used by many companies by providing advanced technologies. At the same time, we are always looking to improve our business and to increase our earning capability.
Recent Industry Developments
Despite uncertainty in the energy sector related to such matters as fluctuating prices and future opportunities for oil companies, our management believes there are still many factors to support our long-term development:
(1) The opening of the Chinese oil industry to participation by non-state owned service providers and vendors has played an increasingly important role in the high-end oilfield service segment to allow competition based on efficiency and price. As oil and gas fields are depleted, it becomes more challenging to find and convert reserves into usable energy sources. As the industry has permitted competition by private companies and oil companies have formed separate service companies, high-tech service has gradually opened up to private companies.
6
(2) As worldwide oil and gas prices decreased, development transformed and strict management has been a frequent subject of domestic oil companies. Technology reforms have been their first choice to achieve their goals about quality and efficiency upgrades. Furthermore, the construction of digital oilfields is a long-term development strategy for many domestic oil companies. Even though total capital expenditure is expected to be reduced, we believe investment in technology reform will remain at a high level. We believe the Company will benefit from this trend.
Management is focused on these factors and will seek to extend our business on the industrial chain, such as through providing more integrated services, incremental measures and growing our business from a predominantly up-ground business to include some down-hole services as well.
Factors Affecting Our Results of Operations
Our operating results in any period are subject to general conditions typically affecting the Chinese oilfield service industry including:
| • | Oil and gas price; |
| • | the amount of spending by our customers, primarily those in the oil and gas industry; |
| • | growing demand from large corporations for improved management and software designed to achieve such corporate performance; |
| • | the procurement processes of our customers, especially those in the oil and gas industry; |
| • | competition and related pricing pressure from other oilfield service solution providers, especially those targeting the Chinese oil and gas industry; |
| • | the ongoing development of the oilfield service market in China; and |
| • | inflation and other macroeconomic factors. |
Unfavorable changes in any of these general conditions could negatively affect the number and size of the projects we undertake, the number of products we sell, the amount of services we provide, the price of our products and services, and otherwise affect our results of operations.
Our operating results in any period are more directly affected by company-specific factors including:
| • | our revenue growth, in terms of the proportion of our business dedicated to large companies and our ability to successfully develop, introduce and market new solutions and services; |
| • | our ability to increase our revenues from both old and new customers in the oil and gas industry in China; |
| • | our ability to effectively manage our operating costs and expenses; and |
| • | our ability to effectively implement any targeted acquisitions and/or strategic alliances so as to provide efficient access to markets and industries in the oil and gas industry in China. |
Critical Accounting Policies and Estimates
Estimates and Assumptions
We prepare our unaudited condensed consolidated financial statements in conformity with accounting principles generally accepted in the United States of America (“US GAAP”), which require us to make judgments, estimates and assumptions. We continually evaluate these estimates and assumptions based on the most recently available information, our own historical experience and various other assumptions that we believe to be reasonable under the circumstances. Since the use of estimates is an integral component of the financial reporting process, actual results could differ from those estimates. An accounting policy is considered critical if it requires an accounting estimate to be made based on assumptions about matters that are highly uncertain at the time such estimate is made, and if different accounting estimates that reasonably could have been used, or changes in the accounting estimates that are reasonably likely to occur periodically, could materially impact the consolidated financial statements. We believe that the following policies involve a higher degree of judgment and complexity in their application and require us to make significant accounting estimates. The following descriptions of critical accounting policies, judgments and estimates should be read in conjunction with our consolidated financial statements and other disclosures included in this quarterly report. Significant accounting estimates reflected in our Company’s consolidated financial statements include revenue recognition, allowance for doubtful accounts, inventory valuation, warrants liability, fair value of share based payments, and useful lives of property and equipment.
7
Consolidation of VIEs
We recognize an entity as a VIE if it either (i) has insufficient equity to permit the entity to finance its activities without additional subordinated financial support or (ii) has equity investors who lack the characteristics of a controlling financial interest. We consolidate a VIE as our primary beneficiary when we have both the power to direct the activities that most significantly impact the entity’s economic performance and the obligation to absorb losses or the right to receive benefits from the entity that could potentially be significant to the VIE. We perform ongoing assessments to determine whether an entity should be considered a VIE and whether an entity previously identified as a VIE continues to be a VIE and whether we continue to be the primary beneficiary.
Assets recognized as a result of consolidating VIEs do not represent additional assets that could be used to satisfy claims against our general assets. Conversely, liabilities recognized as a result of consolidating these VIEs do not represent additional claims on our general assets; rather, they represent claims against the specific assets of the consolidated VIEs.
Revenue Recognition
We recognize revenue when the following four criteria are met: (1) persuasive evidence of an arrangement exists, (2) delivery has occurred or services have been provided, (3) the sales price is fixed or determinable, and (4) collectability is reasonably assured. Delivery does not occur until products have been shipped or services have been provided to the customers and the customers have signed a completion and acceptance report, risk of loss has transferred to the customer, customer acceptance provisions have lapsed, or the Company has objective evidence that the criteria specified in a customer’s acceptance provisions have been satisfied. The sales price is not considered to be fixed or determinable until all contingencies related to the sale have been resolved.
Hardware
Revenue from hardware sales is generally recognized when the product is shipped to the customer and when there are no unfulfilled company obligations that affect the customer’s final acceptance of the arrangement.
Software
The Company sells self-developed software. For software sales, the Company recognizes revenues in accordance with the provisions of Accounting Standards Codification, Topic 985-605, “Software Revenue Recognition,” and related interpretations. Revenue from software is recognized according to project contracts. Contract costs are accumulated during the periods of installation and testing or commissioning. Usually this is short term. Revenue is not recognized until completion of the contracts and receipt of acceptance statements.
Services
The Company provides services to improve software functions and system requirements on separated fixed-price contracts. Revenue is recognized when services are completed and acceptance is determined by a completion report signed by the customer.
Deferred income represents unearned amounts billed to customers related to sales contracts.
8
Cost of Revenues
When the criteria for revenue recognition have been met, costs incurred are recognized as cost of revenue. Cost of revenues includes wages, materials, handling charges, the cost of purchased equipment and pipes, other expenses associated with manufactured products and services provided to customers, and inventory reserve. We expect cost of revenues to grow as our revenues grow. It is possible that we could incur development costs with little revenue recognition, but based upon our past history, we expect our revenues to grow.
Fair Values of Financial Instruments
The US GAAP accounting standards regarding fair value of financial instruments and related fair value measurements define fair value, establish a three-level valuation hierarchy that requires an entity to maximize the use of observable inputs and minimize the use of unobservable inputs when measuring fair value.
The three levels of inputs are defined as follows:
Level 1 inputs to the valuation methodology are quoted prices (unadjusted) for identical assets or liabilities in active markets.
Level 2 inputs to the valuation methodology include quoted prices for similar assets and liabilities in active markets, and inputs that are observable for the asset or liability, either directly or indirectly, for substantially the full term of the financial instrument.
Level 3 inputs to the valuation methodology are unobservable.
The carrying amounts reported in the consolidated balance sheets for trade accounts receivable, other receivables, advances to suppliers, trade accounts payable, accrued liabilities, advances from customers and notes payable approximate fair value because of the immediate or short-term maturity of these financial instruments. Long-term receivables and borrowings approximate fair value because their interest rates charged approximate the market rates for financial instruments with similar terms. The fair value of the warrants liability was determined using the Black-Scholes Model, as Level 2 inputs (See Note 13). Any changes in the assumptions that are used in the Black-Scholes Model may increase or decrease the warrants liability from quarter to quarter. Any change in the estimate of the fair value of the warrants liability would be charged to operations.
Receivables
Trade receivables are carried at the original invoiced amount less a provision for any potential uncollectible amounts. Provisions are applied to trade receivables where events or changes in circumstances indicate that the balance may not be collectible. The identification of doubtful accounts requires the use of judgment and estimates of management. Our management must make estimates of the collectability of our accounts receivable. Management specifically analyzes accounts receivable, historical bad debts, customer creditworthiness, current economic trends and changes in our customer payment terms when evaluating the adequacy of the allowance for doubtful accounts. Increases in our allowance for doubtful accounts would lower our net income and earnings per share.
Deferred Tax Estimates
As part of the process of preparing our consolidated financial statements, we are required to estimate our income taxes in each of the tax jurisdictions in which we operate. This process involves using an asset and liability approach whereby deferred tax assets and liabilities are recorded for differences in the financial reporting bases and tax bases of our assets and liabilities. Deferred tax accounting requires that we evaluate net deferred tax assets by jurisdiction to determine if these assets will more likely than not be realized. This analysis requires considerable judgment and is subject to change to reflect future events and changes in the tax laws. If an allowance is established against our deferred tax assets because they may not be fully realizable in the future, our net income and earnings per share would decrease.
9
Valuation of Long-Lived Assets
We review the carrying values of our long-lived assets for impairment whenever events or changes in circumstances indicate that they may not be recoverable. When such an event occurs, we project undiscounted cash flows to be generated from the use of the asset and its eventual disposition over the remaining life of the asset. If projections indicate that the carrying value of the long-lived asset will not be recovered, we reduce the carrying value of the long-lived asset by the estimated excess of the carrying value over the projected discounted cash flows. In the past, we have not had to make significant adjustments to the carrying values of our long-lived assets, and we do not anticipate a need to do so in the future. However, circumstances could cause us to have to reduce the value of our capitalized assets more rapidly than we have in the past if our revenues were to significantly decline. Estimated cash flows from the use of the long-lived assets are highly uncertain and therefore the estimation of the need to impair these assets is reasonably likely to change in the future. Should the economy or acceptance of our assets change in the future, it is likely that our estimate of the future cash flows from the use of these assets will change by a material amount. There were no impairments at June 30, 2015 and December 31, 2015. However, if impairment were required, our net income and earnings per share would decrease accordingly.
Share-Based Compensation
The Company accounts for share-based compensation in accordance with ASC Topic 718, Share-Based Payment. Under the fair value recognition provisions of this topic, share-based compensation cost is measured at the grant date based on the fair value of the award and is recognized as expense with graded vesting on a straight–line basis over the requisite service period for the entire award. The Company has elected mainly utilize the Black-Scholes valuation model to estimate an award’s fair value.
Recently enacted accounting pronouncements
In August 2015, the FASB issued Accounting Standards Update (ASU) No. 2015-15, Interest - Imputation of Interest (Subtopic 835-30): Presentation and Subsequent Measurement of Debt Issuance Costs Associated with Line-of-Credit Arrangements - Amendments to SEC Paragraphs Pursuant to Staff Announcement at the June 18, 2015 EITF Meeting. This ASU adds additional paragraphs pursuant to the SEC Staff Announcement at the June 18, 2015 Emerging Issues Task Force meeting about the presentation and subsequent measurement of debt issuance costs associated with line-of-credit arrangements. Given the absence of authoritative guidance within ASU 2015-03 for debt issuance costs related to line-of-credit arrangements, the SEC staff would not object to an entity deferring and presenting debt issuance costs as an asset and subsequently amortizing the deferred debt issuance costs ratably over the term of the line-of-credit arrangement, regardless of whether there are any outstanding borrowings on the line-of-credit arrangement. The Company does not expect this update will have a material impact on the presentation of the Company's condensed consolidated financial statements.
In September 2015, the FASB issued ASU 2015-16, Business Combinations (Topic 805): Simplifying the Accounting for Measurement-Period Adjustments, which eliminates the requirement to retrospectively account for changes to provisional amounts initially recorded in a business acquisition opening balance sheet. Prior to the issuance of ASU 2015-16, an acquirer was required to restate prior period financial statements as of the acquisition date for adjustments to provisional amounts. This guidance is effective for fiscal years beginning after December 15, 2015, including interim periods within fiscal years. The Company does not expect this update will have a material impact on the presentation of the Company's condensed consolidated financial statements.
In November 2015, the FASB issued Accounting Standards Update (ASU) No. 2015-17, Income Taxes (Topic 740): Balance Sheet Classification of Deferred Taxes, which changes how deferred taxes are classified on organizations’ balance sheets. The ASU eliminates the current requirement for organizations to present deferred tax liabilities and assets as current and noncurrent in a classified balance sheet. Instead, organizations will be required to classify all deferred tax assets and liabilities as noncurrent. The amendments apply to all organizations that present a classified balance sheet. For public companies, the amendments are effective for financial statements issued for annual periods beginning after December 15, 2016, and interim periods within those annual periods. The Company does not expect this update will have a material impact on the presentation of the Company's consolidated financial position, results of operations and cash flows.
10
In January 2016, the FASB issued Accounting Standards Update (ASU) No. 2016-01, Financial Instruments – Overall (Subtopic 825-10): Recognition and Measurement of Financial Assets and Financial Liabilities. The new guidance makes targeted improvements to existing U.S. GAAP by: (1) requiring equity investments to be measured at fair value with changes in fair value recognized in net income; (2) requiring separate presentation of financial assets and financial liabilities by measurement category and form of financial asset on the balance sheet or the accompanying notes to the financial statements; (3) eliminating the requirement for public business entities to disclose the method(s) and significant assumptions used to estimate the fair value that is required to be disclosed for financial instruments measured at amortized cost on the balance sheet; and (4) requiring a reporting organization to present separately in other comprehensive income the portion of the total change in the fair value of a liability resulting from a change in the instrument-specific credit risk. The new guidance is effective for public companies for fiscal years beginning after December 15, 2017, including interim periods within those fiscal years. The Company does not expect this update will have a material impact on the presentation of the Company's consolidated financial position, results of operations and cash flows.
11
Results of Operations
The following consolidated results of operations include the results of operations of the Company and its variable interest entities (“VIEs”), BHD and Nanjing Recon.
Our historical reporting results are not necessarily indicative of the results to be expected for any future period.
Three Months Ended December 31, 2015 Compared to Three Months Ended December 31, 2014
Revenues
| For the Three Months Ended | ||||||||||||||||
| December 31, | ||||||||||||||||
| Increase/ | Percentage | |||||||||||||||
| 2014 | 2015 | (Decrease) | Change | |||||||||||||
| Hardware - non-related parties | ¥ | 19,689,503 | ¥ | 27,857,380 | ¥ | 8,167,877 | 41.5 | % | ||||||||
| Hardware - related parties | 524,528 | - | (524,528 | ) | (100.0 | ) | ||||||||||
| Service | 45,283 | 985,050 | 939,767 | 2,075.3 | % | |||||||||||
| Software - non-related parties | 826,068 | - | (826,068 | ) | (100.0 | )% | ||||||||||
| Software - related parties | 243,590 | - | (243,590 | ) | (100.0 | )% | ||||||||||
| Total revenues | ¥ | 21,328,972 | ¥ | 28,842,430 | ¥ | 7,513,458 | 35.2 | % | ||||||||
Our total revenues for the three months ended December 31, 2015 were approximately ¥28.8 million ($4.4 million), an increase of approximately ¥7.5 million or 35.2% from ¥21.3 million for the three months ended December 31, 2014. This was mainly caused by an increase of sales of automation products.
Cost and Margin
| For the Three Months Ended | ||||||||||||||||
| December 31, | ||||||||||||||||
| Increase / | Percentage | |||||||||||||||
| 2014 | 2015 | (Decrease) | Change | |||||||||||||
| Total revenues | ¥ | 21,328,972 | ¥ | 28,842,430 | ¥ | 7,513,458 | 35.2 | % | ||||||||
| Cost of revenues | 12,351,041 | 23,079,751 | 10,728,710 | 86.9 | % | |||||||||||
| Gross profit | ¥ | 8,977,931 | ¥ | 5,762,679 | ¥ | (3,215,252 | ) | (35.8 | )% | |||||||
| Margin % | 42.1 | % | 20.0 | % | (22.1 | )% | — | |||||||||
Cost of revenues. Our cost of revenues includes raw materials and costs related to design, implementation, delivery and maintenance of products and services. All materials and components we need can be purchased or manufactured by subcontracts. Usually the prices of electronic components do not fluctuate dramatically due to market competition and will not significantly affect our cost of revenues. However, specialized equipment and incentive chemical products may be directly influenced by metal and oil price fluctuations. Additionally, the prices of some imported accessories mandated by our customers can also impact our cost. Inventory reserve for changes in price level, impairment of inventory, slow moving or other causes will also affect our cost..
12
Our cost of revenues increased from approximately ¥12.3 million in the three months ended December 31, 2014 to approximately ¥23.1 million ($3.6 million) for the same period in 2015, an increase of approximately ¥10.7 million ($1.65 million), or 86.9%. This increase was mainly caused by higher revenue during the three months ended December 31, 2015 compared to the same period of 2014. As a percentage of revenues, our cost of revenues increased from 57.9% in 2014 to 80.0% in 2015, due to the increase of sale of hardware products, the cost of which is higher than the software and service revenues and the increase in the cost of goods sold.
Gross profit. Our gross profit decreased to approximately ¥5.8 million ($0.9 million) for the three months ended December 31, 2015 from approximately ¥9.0 million for the same period in 2014. Our gross profit as a percentage of revenue decreased to 20.0% for the three months ended December 31, 2015 from 42.1% for the same period in 2014. This was mainly due to the decrease of software sales with higher margins compared with the hardware revenues.
Our software and hardware revenues are detailed as below:
| For the Three Months Ended | ||||||||||||||||
| December 31, | ||||||||||||||||
| Increase/ | Percentage | |||||||||||||||
| 2014 | 2015 | (Decrease) | Change | |||||||||||||
| Total revenues-hardware and software- non related parties | ¥ | 20,515,571 | ¥ | 27,857,380 | ¥ | 7,341,809 | 35.8 | % | ||||||||
| Cost of revenues -hardware and software- non related parties | 12,334,279 | 22,402,781 | 10,068,502 | 81.6 | % | |||||||||||
| Gross profit | ¥ | 8,181,292 | ¥ | 5,454,599 | ¥ | (2,726,693 | ) | (33.3 | )% | |||||||
| Margin % | 39.9 | % | 19.6 | % | (20.3 | )% | - | |||||||||
Revenue from hardware and software to non-related parties increased by approximately ¥7.3 million mainly due to the increase of hardware products sold in the three months ended December 31, 2015. The gross profit from hardware and software sales to non-related parties decreased ¥2.7 million ($0.4 million) compared to the same period of last year.
| For the Three Months Ended | ||||||||||||||||
| December 31, | ||||||||||||||||
| Increase/ | Percentage | |||||||||||||||
| 2014 | 2015 | (Decrease) | Change | |||||||||||||
| Total revenues-hardware and software-related parties | ¥ | 768,118 | ¥ | - | ¥ | (768,118 | ) | (100 | )% | |||||||
| Cost of revenues -hardware and software- related parties | 16,762 | - | (16,762 | ) | (100 | )% | ||||||||||
| Gross profit | ¥ | 751,356 | ¥ | - | ¥ | (751,356 | ) | (100 | )% | |||||||
| Margin % | 97.8 | % | - | (97.8 | %) | - | ||||||||||
13
Revenue from related parties decreased as we developed business directly with oilfield, rather than cooperation with some local agency, which used to be our related parties.
| For the Three Months Ended | ||||||||||||||||
| December 31, | ||||||||||||||||
| Increase / | Percentage | |||||||||||||||
| 2014 | 2015 | (Decrease) | Change | |||||||||||||
| Total revenues-service | ¥ | 45,283 | ¥ | 985,050 | ¥ | 939,767 | 2,075.3 | % | ||||||||
| Cost of revenues-service | - | 676,970 | 676,970 | - | % | |||||||||||
| Gross profit | ¥ | 45,283 | ¥ | 308,080 | ¥ | 262,797 | 580.3 | % | ||||||||
| Margin % | 100.0 | % | 31.3 | % | (68.7 | )% | - | |||||||||
Service revenue for the three months ended December 31, 2014 and 2015 consisted mainly of minor maintenance services, which were provided upon request by customers. The cost of services revenues increased, since the increase in the labor cost for the increased services performed for the three months ended December 31, 2015.
Operating Expenses
| For the Three Months Ended | ||||||||||||||||
| December 31, | ||||||||||||||||
| Increase/ | Percentage | |||||||||||||||
| 2014 | 2015 | (Decrease) | Change | |||||||||||||
| Selling and distribution expenses | 1,254,470 | 1,511,678 | 257,208 | 20.5 | % | |||||||||||
| % of revenue | 5.9 | % | 5.2 | % | (0.7 | )% | — | |||||||||
| General and administrative expenses | 4,093,440 | 4,789,637 | 696,197 | 17.0 | % | |||||||||||
| % of revenue | 19.2 | % | 16.6 | % | (2.6 | )% | — | |||||||||
| Research and development expenses | 1,243,228 | 2,736,039 | 1,492,811 | 120.1 | % | |||||||||||
| % of revenue | 5.8 | % | 9.5 | % | 3.7 | % | — | |||||||||
| Operating expenses | ¥ | 6,591,138 | ¥ | 9,037,354 | ¥ | 2,446,216 | 37.1 | % | ||||||||
Selling and distribution expenses. Selling and distribution expenses consist primarily of salaries and related expenditures of our sales and marketing organization, sales commissions, costs of our marketing programs including travelling charges, advertising and trade shows, and an allocation of our facilities, depreciation expenses and rental expense, as well as shipping charges and related expenses. Selling expenses increased 20.5% or ¥0.3 million ($40.0 thousand), from approximately ¥1.3 million in the three months ended December 31, 2014 to approximately ¥1.5 million ($0.2 million) in the same period of 2015. This increase was primarily due to an increase in travelling expense and rental expense. Selling expenses were 5.9% of total revenues in the three months ended December 31, 2014 and 5.2% of total revenues in the same period of 2015.
14
General and administrative expenses. General and administrative expenses consist primarily of costs in human resources, facilities costs, depreciation expenses, professional advisor fees, audit fees, option expenses stock based comprehensive expense, bad debts allowance and other miscellaneous expenses incurred in connection with general operations. General and administrative expenses increased by 17.0% or ¥0.7 million ($0.1 million), from approximately ¥4.1 million in the three months ended December 31, 2014 to approximately ¥4.8 million ($0.7 million) in the same period of 2015. General and administrative expenses were 19.2% of total revenues in the three months ended December 31, 2014 and 16.6% of total revenues in the same period of 2015. The increase in general and administrative expenses was mainly due to an increase in share-based compensation and salaries.
Research and development (“R&D”) expenses. Research and development expenses consist primarily of salaries and related expenditures of our research and development projects. Research and development expenses increased from approximately ¥1.2 million for the three months ended December 31, 2014 to approximately ¥2.7 million ($0.4 million) for the same period of 2015. This increase was primarily due to more research and development expense on downhole service tools.
Net Income
| For the Three Months Ended | ||||||||||||||||
| December 31, | ||||||||||||||||
| Increase / | Percentage | |||||||||||||||
| 2014 | 2015 | (Decrease) | Change | |||||||||||||
| Income (loss) from operations | ¥ | 2,386,793 | ¥ | (3,274,675 | ) | ¥ | (5,661,468 | ) | (237.2 | )% | ||||||
| Interest and other income (expense) | 3,991,943 | (96,217 | ) | (4,088,160 | ) | (102.4 | )% | |||||||||
| Income (loss) before income tax | 6,378,736 | (3,370,892 | ) | (9,749,628 | ) | (152.8 | )% | |||||||||
| Provision (benefit) for income tax | 618,687 | (851,716 | ) | (1,470,403 | ) | (237.7 | )% | |||||||||
| Net income (loss) | 5,760,049 | (2,519,176 | ) | (8,279,225 | ) | (143.7 | )% | |||||||||
| Less: Net income attributable to non-controlling interest | 434,673 | - | (434,673 | ) | (100.0 | )% | ||||||||||
| Net income (loss) attributable to Recon Technology, Ltd | ¥ | 5,325,376 | ¥ | (2,519,176 | ) | ¥ | (7,844,552 | ) | (147.3 | )% | ||||||
Loss from operations. Loss from operations was approximately ¥3.3 million ($0.5 million) for the three months ended December 31, 2015, compared to an income of ¥2.4 million for the same period of 2014. This decrease in income from operations was primary due to a decrease in revenues and increased research and development expenses.
Interest and other income (expense). Interest and other expense was approximately ¥0.1 million ($14.8 thousand) for the three months ended December 31, 2015, compared to interest and other income of ¥4.0 million for the same period of 2014. The ¥4.1 million ($0.6 million) decrease in interest and other income was primarily due to the decreased gain of change in fair value of warrants liability.
Provision (benefit) for income tax. Provision for income tax for the three months ended December 31, 2014 was approximately ¥0.6 million. Benefit for income tax was ¥0.9 million ($0.1 million) for the three months ended December 31, 2015. This increase in benefit for income tax was mainly due to deferred tax assets recorded and income tax payable true up during the three months ended December 31, 2015.
Net income (loss). As a result of the factors described above, net loss was approximately ¥2.5 million ($0.4 million) for the three months ended December 31, 2015, a decrease of approximately ¥8.3 million ($1.3 million) from net income of ¥5.8 million for the same period of 2014.
15
Net income (loss) attributable to Recon Technology, Ltd. As a result of the factors described above, net loss attributable to ordinary shareholders was approximately ¥2.5 million ($0.4 million) for the three months ended December 31, 2015, .Net income attributable to ordinary shareholders decreased for approximately ¥7.8 million ($1.2 million) from net income attributable to ordinary shareholders of approximately ¥5.3 million for same period of 2014.
Six Months Ended December 31, 2014 Compared to Six Months Ended December 31, 2015
Revenues
| For the Six Months Ended | ||||||||||||||||
| December 31, | ||||||||||||||||
| Increase/ | Percentage | |||||||||||||||
| 2014 | 2015 | (Decrease) | Change | |||||||||||||
| Hardware - non-related parties | ¥ | 22,709,371 | ¥ | 31,338,132 | ¥ | 8,628,761 | 38.0 | % | ||||||||
| Hardware - related parties | 524,528 | - | (524,528 | ) | (100.0 | )% | ||||||||||
| Service | 103,774 | 1,098,258 | 994,484 | 958.3 | % | |||||||||||
| Software - non-related parties | 2,051,709 | - | (2,051,709 | ) | (100.0 | )% | ||||||||||
| Software - related parties | 243,590 | - | (243,590 | ) | (100.0 | )% | ||||||||||
| Total revenues | ¥ | 25,632,972 | ¥ | 32,436,390 | ¥ | 6,803,418 | 26.5 | % | ||||||||
Our total revenues for the six months ended December 31, 2015 were approximately ¥32.4 million ($5.0 million), an increase of approximately ¥6.8 million or 26.5% from ¥25.6 million for the six months ended December 31, 2014. This was mainly caused by an increase of sale of hardware products.
Cost and Margin
| For the Six Months Ended | ||||||||||||||||
| December 31, | ||||||||||||||||
| Increase / | Percentage | |||||||||||||||
| 2014 | 2015 | (Decrease) | Change | |||||||||||||
| Total revenues | ¥ | 25,632,972 | ¥ | 32,436,390 | ¥ | 6,803,418 | 26.5 | % | ||||||||
| Cost of revenues | 16,039,727 | 26,272,046 | 10,232,319 | 63.8 | % | |||||||||||
| Gross profit | ¥ | 9,593,245 | ¥ | 6,164,344 | ¥ | (3,428,901 | ) | (35.7 | )% | |||||||
| Margin % | 37.4 | % | 19.0 | % | (18.4 | )% | — | |||||||||
Cost of revenues. Our cost of revenues includes raw materials and costs related to design, implementation, delivery and maintenance of products and services. All materials and components we need can be purchased or manufactured by subcontracts. Usually the prices of electronic components do not fluctuate dramatically due to market competition and will not significantly affect our cost of revenues. However, specialized equipment and incentive chemical products may be directly influenced by metal and oil price fluctuations. Additionally, the prices of some imported accessories mandated by our customers can also affect our cost. Inventory reserve for changes in price level, impairment of inventory, slow moving or other causes will also affect our cost.
16
Our cost of revenues increased from approximately ¥16.0 million in the six months ended December 31 2014 to approximately ¥26.3 million ($4.0 million) for the same period in 2015, an increase of approximately ¥10.2 million ($1.6 million), or 63.8%. This increase was mainly caused by higher revenue during the six months ended December 31, 2015 compared to the same period of 2014. As a percentage of revenues, our cost of revenues increased from 62.6% in 2014 to 81.0% in 2015, mainly due to the increase of sale of hardware products, the cost of which is higher than the software and service revenues.
Gross profit. Our gross profit decreased to approximately ¥6.2 million ($0.9 million) for the six months ended December 31, 2015 from approximately ¥9.6 million for the same period in 2014. Our gross profit as a percentage of revenue decreased to 19.0% for the six months ended December 31, 2015 from 37.4% for the same period in 2014. This was mainly due to the decrease of software sales with higher margins compared with the hardware revenues.
In more detail:
| For the Six Months Ended | ||||||||||||||||
| December 31, | ||||||||||||||||
| Increase / | Percentage | |||||||||||||||
| 2014 | 2015 | (Decrease) | Change | |||||||||||||
| Total revenues-hardware and software- non related parties | ¥ | 24,761,080 | ¥ | 31,338,132 | ¥ | 6,577,052 | 26.6 | % | ||||||||
| Cost of revenues -hardware and software- non related parties | 16,022,965 | 25,595,076 | 9,572,111 | 59.7 | % | |||||||||||
| Gross profit | ¥ | 8,738,115 | ¥ | 5,743,056 | ¥ | (2,995,059 | ) | (34.3 | )% | |||||||
| Margin % | 35.3 | % | 18.3 | % | (17.0 | )% | — | |||||||||
Revenue from hardware and software to non-related parties increased by approximately ¥6.6 million mainly due to the increase of hardware products sold in the six months ended December 31, 2015. The gross profit from hardware and software sales to non-related parties decreased ¥3 million ($0.46 million) compared to the same period of last year.
| For the Six Months Ended | ||||||||||||||||
| December 31, | ||||||||||||||||
| Increase / | Percentage | |||||||||||||||
| 2014 | 2015 | (Decrease) | Change | |||||||||||||
| Total revenues-hardware and software-related parties | ¥ | 768,118 | ¥ | - | ¥ | (768,118 | ) | (100.0 | )% | |||||||
| Cost of revenues -hardware and software- related parties | 16,762 | - | (16,762 | ) | (100.0 | )% | ||||||||||
| Gross profit | ¥ | 751,356 | ¥ | - | ¥ | (751,356 | ) | (100.0 | )% | |||||||
| Margin % | 97.8 | % | - | (97.8 | )% | — | ||||||||||
After we achieved business entrance certification in the name of Recon and could cooperate with oilfield customers directly two years ago, we no longer required the services of a related party with such certification and, accordingly, revenue from related-parties decreased. As of result, there was no revenue or cost of hardware and software from related parties, since we developed business directly with oilfield, rather than cooperation with some local agency, which used to be our related parties.
17
| For the Six Months Ended | ||||||||||||||||
| December 31, | ||||||||||||||||
| Increase / | Percentage | |||||||||||||||
| 2014 | 2015 | (Decrease) | Change | |||||||||||||
| Total revenues-service | ¥ | 103,774 | ¥ | 1,098,258 | ¥ | 994,484 | 958.3 | % | ||||||||
| Cost of revenues -service | - | 676,970 | 676,970 | - | % | |||||||||||
| Gross profit | ¥ | 103,774 | ¥ | 421,288 | ¥ | 317,514 | 306.0 | % | ||||||||
| Margin % | 100.0 | % | 38.4 | % | (61.6 | %) | — | |||||||||
Service revenue for the six months ended December 31, 2014 and 2015 consisted mainly of minor maintenance services, which were provided upon request by customers. The cost of revenues-services increased, since we reclassify the human cost of services out from cost of revenues-hardware and software for the six months ended December 31, 2015.
Operating Expenses
| For the Six Months Ended | ||||||||||||||||
| December 31, | ||||||||||||||||
| Increase / | Percentage | |||||||||||||||
| 2014 | 2015 | (Decrease) | Change | |||||||||||||
| Selling and distribution expenses | ¥ | 1,955,260 | 2,624,348 | ¥ | 669,088 | 34.2 | % | |||||||||
| % of revenue | 7.6 | % | 8.1 | % | 0.5 | % | — | |||||||||
| General and administrative expenses | 7,796,731 | 10,966,782 | 3,170,051 | 40.7 | % | |||||||||||
| % of revenue | 30.4 | % | 33.8 | % | 3.4 | % | — | |||||||||
| Research and development expenses | 1,899,957 | 4,529,036 | 2,629,079 | 138.4 | % | |||||||||||
| % of revenue | 7.4 | % | 14.0 | % | 6.6 | % | — | |||||||||
| Operating expenses | ¥ | 11,651,948 | ¥ | 18,120,166 | ¥ | 6,468,218 | 55.5 | % | ||||||||
Selling and distribution expenses. Selling and distribution expenses consist primarily of salaries and related expenditures of our sales and marketing organization, sales commissions, costs of our marketing programs including travelling charges, advertising and trade shows, and an allocation of our facilities, depreciation expenses and rental expense, as well as shipping charges and so on. Selling expenses increased approximately ¥0.7 million for the six months ended December 31, 2015 compared to the same period in 2014. This increase was primarily due to an increase in traveling expense and maintenances. Selling expenses were 7.6% of total revenues in the six months ended December 31, 2014 and 8.1% of total revenues in the same period of 2015.
18
General and administrative expenses. General and administrative expenses consist primarily of costs in human resources, facilities costs, depreciation expenses, professional advisor fees, audit fees, option expenses stock based comprehensive expense, bad debts allowance and other miscellaneous expenses incurred in connection with general operations. General and administrative expenses increased by 40.7% or ¥3.2 million ($0.5 million), from approximately ¥7.8 million in the six months ended December 31, 2014 to approximately ¥11.0 million ($1.7 million) in the same period of 2015. General and administrative expenses were 30.4% of total revenues in the six months ended December 31, 2014 and 33.8% of total revenues in the same period of 2015. The increase in general and administrative expenses was mainly due to an increase in bad debts allowance and share-based compensation, offset by a decrease in consulting fees.
Research and development (“R&D”) expenses. Research and development expenses consist primarily of salaries and related expenditures of our research and development projects. Research and development expenses increased from approximately ¥1.9 million for the six months ended December 31, 2014 to approximately ¥4.5 million ($0.7 million) for the same period of 2015. This increase was primarily due to more research and development expense on downhole service tools.
Net Income
| For the Six Months Ended | ||||||||||||||||
| December 31, | ||||||||||||||||
| Increase / | Percentage | |||||||||||||||
| 2014 | 2015 | (Decrease) | Change | |||||||||||||
| Loss from operations | ¥ | (2,058,703 | ) | ¥ | (11,955,822 | ) | ¥ | (9,897,119 | ) | (480.7 | )% | |||||
| Interest and other income (expense) | 4,306,139 | (280,133 | ) | (4,586,272 | ) | (106.5 | )% | |||||||||
| Income (loss) before income tax | 2,247,436 | (12,235,955 | ) | (14,483,391 | ) | (644.4 | )% | |||||||||
| Provision (benefit) for income tax | 648,932 | (868,173 | ) | (1,517,105 | ) | (233.8 | )% | |||||||||
| Net income (loss) | 1,598,504 | (11,367,782 | ) | (12,966,286 | ) | (811.2 | )% | |||||||||
| Less: Net income attributable to non-controlling interest | 434,673 | - | (434,673 | ) | (100.0 | )% | ||||||||||
| Net income (loss) attributable to Recon Technology, Ltd | ¥ | 1,163,831 | ¥ | (11,367,782 | ) | ¥ | (12,531,613 | ) | (1,076.8 | )% | ||||||
Loss from operations. Loss from operations was approximately ¥12.0 million ($1.8 million) for the six months ended December 31, 2015, compared to a loss of ¥2.1 million for the same period of 2014. This increase in loss from operations was primary due to a decrease in gross profit, an increase in R&D expenses and increase in stock based compensation.
Interest and other income (expense). Interest and other expense was approximately ¥0.3 million ($0.04 million) for the six months ended December 31, 2015, compared to interest and other income of ¥4.3 million for the same period of 2014. The ¥4.6 million ($0.7 million) decrease in interest and other income was primarily due to the decreased gain of change in fair value of warrants liability while there was no such gain for the current period.
Provision (benefit) for income tax. Provision for income tax for the six months ended December 31, 2014 was approximately ¥0.7 million. Benefit for income tax was ¥0.9 million ($0.1 million) for the six months ended December 31, 2015. This increase in benefit for income tax was mainly due to the increased deferred tax assets, because of increase in allowances for doubtful accounts during the six months ended December 31, 2015.
Net income (loss). As a result of the factors described above, net loss was approximately ¥11.4 million ($1.8 million) for the six months ended December 31, 2015, a decrease of approximately ¥13.0 million ($2.0 million) from net income of ¥1.6 million for the same period of 2014.
19
Net loss attributable to Recon Technology, Ltd. As a result of the factors described above, net loss attributable to ordinary shareholders was approximately ¥11.4 million ($1.8 million) for the six months ended December 31, 2015, a change of approximately ¥12.5 million ($1.9 million) from net income attributable to ordinary shareholders of approximately ¥1.2 million for same period of 2014.
Adjusted EBITDA
Adjusted EBITDA. We define adjusted EBITDA as net loss adjusted for income tax expense (benefit), interest expense, change in fair value of warrants liability, non-cash stock compensation expense, depreciation and amortization. We think it is useful to an equity investor in evaluating our operating performance because: (1) it is widely used by investors in our industry to measure a company’s operating performance without regard to items such as interest expense, depreciation and amortization, which can vary substantially from company to company depending upon accounting methods and book value of assets, capital structure and the method by which the assets were acquired; and (2) it helps investors more meaningfully evaluate and compare the results of our operations from period to period by removing the impact of our capital structure and asset base from our operating results.
| For the Six Months Ended | ||||||||||||||||||||
| December 31, | ||||||||||||||||||||
| 2014 | 2015 | 2015 | Increase / | Percentage | ||||||||||||||||
| RMB | RMB | USD | (Decrease) | Change | ||||||||||||||||
| Reconciliation of Adjusted EBITDA | ||||||||||||||||||||
| to Net Loss | ||||||||||||||||||||
| Net income (loss) | ¥ | 1,598,504 | ¥ | (11,367,782 | ) | $ | (1,751,395 | ) | ¥ | (12,966,286 | ) | (811.2 | )% | |||||||
| Provision for income taxes (benefit) | 648,932 | (868,173 | ) | (133,756 | ) | (1,517,105 | ) | (233.8 | )% | |||||||||||
| Interest expense and foreign currency adjustment | 489,836 | 474,402 | 73,089 | (15,434 | ) | (3.2 | )% | |||||||||||||
| Change in fair value of warrants liability | (4,077,517 | ) | - | - | 4,077,517 | (100.0 | )% | |||||||||||||
| Restricted shares issued for consulting services | 1,171,331 | 566,361 | 87,257 | (604,970 | ) | (51.6 | )% | |||||||||||||
| Stock compensation expense | 1,115,030 | 2,573,575 | 396,502 | 1,458,545 | 130.8 | % | ||||||||||||||
| Depreciation and amortization | 274,511 | 496,070 | 76,428 | 221,559 | 80.7 | % | ||||||||||||||
| Adjusted EBITDA | ¥ | 1,220,627 | ¥ | (8,125,547 | ) | $ | (1,251,875 | ) | ¥ | (9,346,174 | ) | (765.7 | )% | |||||||
Adjusted EBITDA decreased by approximately ¥9.3 million ($1.4 million) to loss of approximately ¥8.1 million ($1.3 million) for the six months ended December 31, 2015 compared to approximately ¥1.2 million income for the same period in 2014. This was mainly due to decreased gross profit, increased research and development expenses and increased bad debt allowances.
20
Adjusted Net Income and Adjusted Loss Per Share
| For the Six Months Ended | ||||||||||||
| December 31, | ||||||||||||
| 2014 | 2015 | 2015 | ||||||||||
| RMB | RMB | USD | ||||||||||
| Reconciliation of Net Loss attributable to Recon Technology, Ltd to Adjusted Net Loss attributable to Recon Technology, Ltd | ||||||||||||
| Net loss attributable to Recon Technology, Ltd | ¥ | 1,163,831 | ¥ | (11,367,782 | ) | $ | (1,751,395 | ) | ||||
| Noncash items (A): | ||||||||||||
| Change in fair value of warrants liability | (4,077,517 | ) | - | - | ||||||||
| Restricted shares issued for consulting services | 1,171,331 | 566,361 | 87,257 | |||||||||
| Stock compensation expense | 1,115,030 | 2,573,575 | 396,502 | |||||||||
| Adjusted net loss attributable to Recon Technology, Ltd | ¥ | (627,325 | ) | ¥ | (8,227,846 | ) | $ | (1,267,636 | ) | |||
| Reconciliation of U.S. GAAP Earnings (Loss) Per Share to Non U.S. GAAP Adjusted Earnings Per Share | ||||||||||||
| U.S. GAAP earnings (loss) per share | ¥ | 0.24 | ¥ | (2.07 | ) | $ | (0.32 | ) | ||||
| Impact of noncash items on earnings per share | (0.37 | ) | 0.57 | 0.09 | ||||||||
| Non U.S. GAAP adjusted earnings per share | ¥ | (0.13 | ) | ¥ | (1.49 | ) | $ | (0.23 | ) | |||
| Weighted - average shares -diluted | 4,846,270 | 5,503,932 | 5,503,932 | |||||||||
(A) Noncash items are certain non-cash expenses that are included in our U.S. GAAP reported results. The non-GAAP financial measures are provided to enhance investors' overall understanding of Recon's current financial performance.
Liquidity and Capital Resources
Cash and Cash Equivalents. Cash and cash equivalents are comprised of cash on hand, demand deposits and highly liquid short-term debt investments with stated maturities of no more than six months. As of December 31, 2015, we had cash and cash equivalents in the amount of approximately ¥3.1 million ($0.5 million). As of June 30, 2015, we had cash and cash equivalents in the amount of approximately ¥12.3 million.
Indebtedness. As of December 31, 2015, except for approximately ¥7.2 million ($1.1 million) of short-term borrowings from related parties, and ¥6.5 million ($1.0 million) in commercial loans from local banks, we did not have any finance leases or purchase commitments, guarantees or other material contingent liabilities.
Holding Company Structure. We are a holding company with no operations of our own. All of our operations are conducted through our Domestic Companies. As a result, our ability to pay dividends and to finance any debt that we may incur is dependent upon the receipt of dividends and other distributions from the Domestic Companies. In addition, Chinese legal restrictions permit payment of dividends to us by our Domestic Companies only out of their respective accumulated net profits, if any, determined in accordance with Chinese accounting standards and regulations. Under Chinese law, our Domestic Companies are required to set aside a portion (at least 10%) of their after-tax net income (after discharging all cumulated loss), if any, each year for compulsory statutory reserve until the amount of the reserve reaches 50% of our Domestic Companies’ registered capital. These funds may be distributed to shareholders at the time of each Domestic Company’s wind up.
21
Off-Balance Sheet Arrangements. We have not entered into any financial guarantees or other commitments to guarantee the payment obligations of any third parties. In addition, we have not entered into any derivative contracts that are indexed to our own shares and classified as shareholders’ equity, or that are not reflected in our financial statements. Furthermore, we do not have any retained or contingent interest in assets transferred to an unconsolidated entity that serves as credit, liquidity or market risk support to such entity. Moreover, we do not have any variable interest in an unconsolidated entity that provides financing, liquidity, market risk or credit support to us or engages in leasing, hedging or research and development services with us.
Capital Resources. To date we have financed our operations primarily through cash flows from operations, bank loans and short-term borrowings and loans from related parties. As of December 31, 2015, we had total assets of approximately ¥123.5 million ($19.0 million), which includes cash of approximately ¥3.1 million ($0.5 million), net accounts receivable due from third parties of approximately ¥67.0 million ($10.3 million), working capital amounted to approximately ¥68.6 million ($10.6 million), and shareholders’ equity amounted to approximately ¥67.8 million ($10.4 million).
Cash from Operating Activities. Net cash provided by operating activities was approximately ¥1.0 million ($0.2 million) for the six months ended December 31, 2015. This was an increase of approximately ¥16.4 million ($2.5 million) compared to net cash used in operating activities of approximately ¥15.4 million for the six months ended December 31, 2014. The increase in net cash provided by operating activities for the six months ended December 31, 2015, was primarily attributable to the ¥11.0 million ($1.6 million) change in accounts payable and ¥8.0 million ($1.2 million) change in inventories. We purchased a larger number of inventory to implement our Jidong Oil Field project in prior period, which have been used in this period.
Cash from Investing Activities. Net cash used in investing activities was approximately ¥0.5 million ($76.8 thousand) for the six months ended December 31, 2015, increased approximately ¥0.3 million compared to the same period in 2014, which is due to the decrease in proceeds from disposal of equipment.
Cash from Financing Activities. Net cash used in financing activities amounted to ¥9.9 million ($1.5 million) for the six months ended December 31, 2015, as compared to net cash provided by financing activities of 2.4 million for the same period in 2014. During the six months ended December 31, 2015, we repaid ¥15.5 million ($2.4 million) short-term borrowings to two related parties and repaid ¥0.5 million ($0.1 million) short-term bank loans, but we received ¥6.0 million ($0.9 million) from one related party.
Working Capital. Total working capital as of December 31, 2015 amounted to approximately ¥68.6 million ($10.6 million), compared to approximately ¥72.4 million as of June 30, 2015. Total current assets as of December 31, 2015 amounted to approximately ¥116.1 million ($17.9 million), a decrease of approximately ¥8.4 million ($1.3 million) compared to approximately ¥124.5 million at June 30, 2015. The decrease in total current assets at December 31, 2015 compared to June 30, 2015 was mainly due to decreases in cash and cash equivalents and purchase advances.
Current liabilities amounted to approximately ¥47.5 million ($7.3 million) at December 31, 2015, in comparison to approximately ¥52.1 million at June 30, 2015. This decrease of liabilities was attributable mainly to a decrease in short-term borrowings-related parties and other payable-related parties, offset by an increase in trade accounts payable.
Capital Needs. Our management believes that our current operations can satisfy our daily working capital needs. We may also raise capital through public offering or private placement to finance our development of our business and to consummate any merger and acquisition, if necessary.
22
| Item 3. | Quantitative and Qualitative Disclosures about Market Risk. |
Not applicable.
| Item 4. | Controls and Procedures. |
Disclosure Controls and Procedures
As of December 31, 2015, the company carried out an evaluation, under the supervision of and with the participation of management, including our Company’s chief executive officer and chief financial officer, of the effectiveness of the design and operation of our Company’s disclosure controls and procedures under the 2013 COSO framework. Based on the foregoing, the chief executive officer and chief financial officer concluded that our Company’s disclosure controls and procedures (as defined in Rules 13a-15(e) and 15d-15(e) under the Securities Exchange Act of 1934) were ineffective in timely alerting them to information required to be included in the Company’s periodic Securities and Exchange Commission filings.
Changes in Internal Control over Financial Reporting
Management continues to focus on internal control over financial reporting. As of December 31, 2015, the Company intends to further implement the following remedial initiatives:
| · | Improve the design and documentation related to multiple levels of review over financial statements included in our SEC filings; |
| · | Expand the design and assessment test work over the monitoring function of entity level controls; |
| · | Enhance documentation retention policies over test work related to continuous management assessments of internal control effectiveness; and |
| · | Expand documentation practices and policies related to various key controls to provide support and audit trials for both internal management assessment as well as external auditor testing. |
There were no changes in the Company’s internal control over financial reporting (as defined in Rule 13a-15(f) of the Securities Exchange Act of 1934) during the six months ended December 31, 2015 that have materially affected, or are reasonably likely to materially affect, the Company’s internal control over financial reporting, except as disclosed above.
23
| Item 1. | Legal Proceedings. |
None.
| Item 1A. | Risk Factors. |
Not applicable.
| Item 2. | Unregistered Sales of Equity Securities and Use of Proceeds. |
| (a) | None |
| (b) | None |
| (c) | None |
| Item 3. | Defaults upon Senior Securities. |
None.
| Item 4. | Mine Safety Disclosures. |
Not applicable.
| Item 5. | Other Information. |
None.
24
| Item 6. | Exhibits. |
The following exhibits are filed herewith:
|
Exhibit Number |
Document | |
| 3.1 | Amended and Restated Articles of Association of the Registrant (1) | |
| 3.2 | Amended and Restated Memorandum of Association of the Registrant (1) | |
| 4.1 | Specimen Share Certificate (1) | |
| 10.1 | Translation of Exclusive Technical Consulting Service Agreement between Recon Technology (Jining) Co., Ltd. and Beijing BHD Petroleum Technology Co., Ltd. (1) | |
| 10.2 | Translation of Power of Attorney for rights of Chen Guangqiang in Beijing BHD Petroleum Technology Co., Ltd. (1) | |
| 10.3 | Translation of Power of Attorney for rights of Yin Shenping in Beijing BHD Petroleum Technology Co., Ltd. (1) | |
| 10.4 | Translation of Power of Attorney for rights of Li Hongqi in Beijing BHD Petroleum Technology Co., Ltd. (1) | |
| 10.5 | Translation of Exclusive Equity Interest Purchase Agreement between Recon Technology (Jining) Co. Ltd., Chen Guangqiang and Beijing BHD Petroleum Technology Co., Ltd. (1) | |
| 10.6 | Translation of Exclusive Equity Interest Purchase Agreement between Recon Technology (Jining) Co. Ltd., Yin Shenping and Beijing BHD Petroleum Technology Co., Ltd. (1) | |
| 10.7 | Translation of Exclusive Equity Interest Purchase Agreement between Recon Technology (Jining) Co. Ltd., Li Hongqi and Beijing BHD Petroleum Technology Co., Ltd. (1) | |
| 10.8 | Translation of Equity Interest Pledge Agreement between Recon Technology (Jining) Co., Ltd., Chen Guangqiang and Beijing BHD Petroleum Technology Co., Ltd. (1) | |
| 10.9 | Translation of Equity Interest Pledge Agreement between Recon Technology (Jining) Co., Ltd., Yin Shenping and Beijing BHD Petroleum Technology Co., Ltd. (1) | |
| 10.10 | Translation of Equity Interest Pledge Agreement between Recon Technology (Jining) Co., Ltd., Li Hongqi and Beijing BHD Petroleum Technology Co., Ltd. (1) | |
| 10.11 | Translation of Exclusive Technical Consulting Service Agreement between Recon Technology (Jining) Co., Ltd. and Jining ENI Energy Technology Co., Ltd. (1) | |
| 10.12 | Translation of Power of Attorney for rights of Chen Guangqiang in Jining ENI Energy Technology Co., Ltd. (1) | |
| 10.13 | Translation of Power of Attorney for rights of Yin Shenping in Jining ENI Energy Technology Co., Ltd. (1) | |
| 10.14 | Translation of Power of Attorney for rights of Li Hongqi in Jining ENI Energy Technology Co., Ltd. (1) | |
25
| 10.15 | Translation of Exclusive Equity Interest Purchase Agreement between Recon Technology (Jining) Co. Ltd., Chen Guangqiang and Jining ENI Energy Technology Co., Ltd. (1) | |
| 10.16 | Translation of Exclusive Equity Interest Purchase Agreement between Recon Technology (Jining) Co. Ltd., Yin Shenping and Jining ENI Energy Technology Co., Ltd. (1) | |
| 10.17 | Translation of Exclusive Equity Interest Purchase Agreement between Recon Technology (Jining) Co. Ltd., Li Hongqi and Jining ENI Energy Technology Co., Ltd. (1) | |
| 10.18 | Translation of Equity Interest Pledge Agreement between Recon Technology (Jining) Co., Ltd., Chen Guangqiang and Jining ENI Energy Technology Co., Ltd. (1) | |
| 10.19 | Translation of Equity Interest Pledge Agreement between Recon Technology (Jining) Co., Ltd., Yin Shenping and Jining ENI Energy Technology Co., Ltd. (1) | |
| 10.20 | Translation of Equity Interest Pledge Agreement between Recon Technology (Jining) Co., Ltd., Li Hongqi and Jining ENI Energy Technology Co., Ltd. (1) | |
| 10.21 | Translation of Exclusive Technical Consulting Service Agreement between Recon Technology (Jining) Co., Ltd. and Nanjing Recon Technology Co., Ltd. (1) | |
| 10.22 | Translation of Power of Attorney for rights of Chen Guangqiang in Nanjing Recon Technology Co., Ltd. (1) | |
| 10.23 | Translation of Power of Attorney for rights of Yin Shenping in Nanjing Recon Technology Co., Ltd. (1) | |
| 10.24 | Translation of Power of Attorney for rights of Li Hongqi in Nanjing Recon Technology Co., Ltd. (1) | |
| 10.25 | Translation of Exclusive Equity Interest Purchase Agreement between Recon Technology (Jining) Co. Ltd., Chen Guangqiang and Nanjing Recon Technology Co., Ltd. (1) | |
| 10.26 | Translation of Exclusive Equity Interest Purchase Agreement between Recon Technology (Jining) Co. Ltd., Yin Shenping and Nanjing Recon Technology Co., Ltd. (1) | |
| 10.27 | Translation of Exclusive Equity Interest Purchase Agreement between Recon Technology (Jining) Co. Ltd., Li Hongqi and Nanjing Recon Technology Co., Ltd. (1) | |
| 10.28 | Translation of Equity Interest Pledge Agreement between Recon Technology (Jining) Co., Ltd., Chen Guangqiang and Nanjing Recon Technology Co., Ltd. (1) | |
| 10.29 | Translation of Equity Interest Pledge Agreement between Recon Technology (Jining) Co., Ltd., Yin Shenping and Nanjing Recon Technology Co., Ltd. (1) | |
| 10.30 | Translation of Equity Interest Pledge Agreement between Recon Technology (Jining) Co., Ltd., Li Hongqi and Nanjing Recon Technology Co., Ltd. (1) | |
| 10.33 | Employment Agreement between Recon Technology (Jining) Co., Ltd. and Mr. Yin Shenping (1) | |
| 10.34 | Employment Agreement between Recon Technology (Jining) Co., Ltd. and Mr. Chen Guangqiang (1) | |
| 10.35 | Employment Agreement between Recon Technology (Jining) Co., Ltd. and Mr. Li Hongqi (1) | |
| 10.36 | Operating Agreement among Recon Technology (Jining) Co. Ltd., Nanjing Recon Technology Co., Ltd. and Mr. Yin Shenping, Mr. Chen Guangqiang and Mr. Li Hongqi (1) | |
| 10.37 | Operating Agreement among Recon Technology (Jining) Co. Ltd., Jining ENI Energy Technology Co., Ltd., and Mr. Yin Shenping, Mr. Chen Guangqiang and Mr. Li Hongqi (1) | |
26
| 10.38 | Operating Agreement among Recon Technology (Jining) Co. Ltd., Beijing BHD and Mr. Yin Shenping, Mr. Chen Guangqiang and Mr. Li Hongqi (1) | |
| 10.39 | Share Purchase Agreement, dated as of December 1, 2015, by and between Recon Technology Ltd., Recon Hengda Technology (Beijing) Co., Ltd., Qinghai Hua You Downhole Technologies Co., Ltd. and its shareholders.(3) | |
| 10.40 | Exclusive Equity Interest Purchase Agreement, dated as of December 1, 2015, by and between Recon Hengda Technology (Beijing) Co., Ltd., Haung Baokun, Shi Jing and Li Suzhen.(3) | |
| 10.41 | Equity Pledge Agreement, dated as of December 1, 2015, by and among Recon Hengda Technology (Beijing) Co., Ltd., Huang Boakun, Shi Jing and Li Suzhen.(3) | |
| 10.42 | Power of Attorney of Huang Baokun.(3) | |
| 10.43 | Power of Attorney of Shi Jing.(3) | |
| 10.44 | Power of Attorney of Li Suzhen.(3) | |
| 10.45 | Exclusive Technical Consulting and Service Agreement, dated as of December 1, 2015, between Recon Hengda Technology (Beijing) Co., Ltd. and Qinghai Hua You Downhole Technologies Co., Ltd.(3) | |
| 21.1 | Subsidiaries of the Registrant (2) | |
| 99.1 | Stock Option Plan (1) | |
| 99.2 | Code of Business Conduct and Ethics (1) | |
| 31.1 | Certifications pursuant to Rule 13a-14(a) or 15d-14(a) under the Securities Exchange Act of 1934, as amended, as adopted pursuant to Section 302 of the Sarbanes-Oxley Act of 2002. (4) | |
| 31.2 | Certifications pursuant to Rule 13a-14(a) or 15d-14(a) under the Securities Exchange Act of 1934, as amended, as adopted pursuant to Section 302 of the Sarbanes-Oxley Act of 2002. (4) | |
| 32.1 | Certifications pursuant to 18 U.S.C. Section 1350, as adopted pursuant to Section 906 of the Sarbanes-Oxley Act of 2002. (4) | |
| 32.2 | Certifications pursuant to 18 U.S.C. Section 1350, as adopted pursuant to Section 906 of the Sarbanes-Oxley Act of 2002. (4) | |
| 101.INS | XBRL Instance Document (4) | |
| 101.SCH | XBRL Taxonomy Extension Schema Document (4) | |
| 101.CAL | XBRL Taxonomy Extension Calculation Linkbase Document (4) | |
| 101.LAB | XBRL Taxonomy Extension Label Linkbase Document (4) | |
| 101.PRE | XBRL Taxonomy Extension Presentation Linkbase Document (4) | |
| 101.DEF | XBRL Taxonomy Extension Definition Linkbase Document (4) |
| (1) | Incorporated by reference to the Company’s Registration Statement on Form S-1, Registration No. 333-152964. |
| (2) | Incorporated by reference to the Company’s Quarterly Report on Form 10-Q/A, filed on January 31, 2012. |
| (3) | Incorporated by reference to the Company’s Current Reprot on Form 8-K filed on December 7, 2015. |
| (4) | Filed herewith. |
27
SIGNATURES
In accordance with the requirements of the Exchange Act, the Company caused this report to be signed on its behalf by the undersigned, thereunto duly authorized.
| RECON TECHNOLOGY, LTD | ||||
| February 16, 2016 | By: | /s/ Liu Jia | ||
| Liu Jia | ||||
| Chief Financial Officer | ||||
| (Principal Financial and Accounting Officer) | ||||
SIGNATURES
In accordance with the requirements of the Exchange Act, the Company caused this report to be signed on its behalf by the undersigned, thereunto duly authorized.
| RECON TECHNOLOGY, LTD | ||||
| February 16, 2016 | By: | /s/ Yin Shen ping | ||
| Yin Shen ping | ||||
| Chief Executive Officer | ||||
RECON TECHNOLOGY, LTD
| F-1 |
CONDENSED CONSOLIDATED BALANCE SHEETS
(UNAUDITED)
| As of Jun 30, | As of Dec 31, | As of Dec 31, | ||||||||||
| 2015 | 2015 | 2015 | ||||||||||
| RMB | RMB | U.S. Dollars | ||||||||||
| ASSETS | ||||||||||||
| Current assets | ||||||||||||
| Cash and cash equivalents | ¥ | 12,344,929 | ¥ | 3,108,330 | $ | 478,890 | ||||||
| Notes receivable | 4,205,530 | 3,026,820 | 466,332 | |||||||||
| Trade accounts receivable, net | 52,186,397 | 66,958,781 | 10,316,111 | |||||||||
| Trade accounts receivable- related parties, net | 4,769,800 | - | - | |||||||||
| Inventories, net | 10,845,007 | 7,780,702 | 1,198,746 | |||||||||
| Other receivables, net | 18,064,568 | 19,717,394 | 3,037,792 | |||||||||
| Other receivables- related parties | 91,021 | - | - | |||||||||
| Purchase advances, net | 18,622,538 | 12,018,393 | 1,851,633 | |||||||||
| Purchase advances- related parties | 394,034 | - | - | |||||||||
| Prepaid expenses | 826,314 | 1,926,018 | 296,736 | |||||||||
| Prepaid expenses - related parties | 420,000 | - | - | |||||||||
| Deferred tax asset | 1,742,098 | 1,554,284 | 239,463 | |||||||||
| Total current assets | 124,512,236 | 116,090,722 | 17,885,703 | |||||||||
| Property and equipment, net | 2,666,953 | 2,658,759 | 409,626 | |||||||||
| Long-term trade accounts receivable, net | 4,440,665 | 3,358,357 | 517,410 | |||||||||
| Long-term other receivable | 2,729,033 | 1,377,896 | 212,288 | |||||||||
| Total Assets | ¥ | 134,348,887 | ¥ | 123,485,734 | $ | 19,025,027 | ||||||
| LIABILITIES AND EQUITY | ||||||||||||
| Current liabilities | ||||||||||||
| Short-term bank loans | ¥ | 7,000,000 | ¥ | 6,500,000 | $ | 1,001,433 | ||||||
| Trade accounts payable | 13,627,088 | 24,533,458 | 3,779,786 | |||||||||
| Trade accounts payable- related parties | 3,528,705 | 2,736,879 | 421,662 | |||||||||
| Other payables | 2,103,057 | 1,930,626 | 297,445 | |||||||||
| Other payable- related parties | 4,309,702 | 1,472,166 | 226,812 | |||||||||
| Deferred revenue | 2,285,529 | 451,180 | 69,512 | |||||||||
| Advances from customers | 529,700 | 322,449 | 49,679 | |||||||||
| Accrued payroll and employees' welfare | 246,789 | 470,822 | 72,538 | |||||||||
| Accrued expenses | 199,166 | 202,969 | 31,271 | |||||||||
| Taxes payable | 1,153,216 | 1,424,445 | 219,459 | |||||||||
| Short-term borrowings - related parties | 16,916,905 | 7,225,775 | 1,113,250 | |||||||||
| Deferred tax liability | 180,186 | 180,186 | 27,761 | |||||||||
| Total current liabilities | 52,080,043 | 47,450,955 | 7,310,608 | |||||||||
| Equity | ||||||||||||
| Common stock, ($ 0.0185 U.S. dollar par value, 100,000,000 shares authorized; 5,427,946 and 5,804,005 shares issued and outstanding as of June 30, 2015 and December 31, 2015, respectively) | 697,217 | 741,467 | 114,235 | |||||||||
| Additional paid-in capital | 92,541,687 | 97,494,721 | 15,020,679 | |||||||||
| Appropriated retained earnings | 4,148,929 | 4,148,929 | 639,211 | |||||||||
| Unappropriated retained earnings | (23,024,935 | ) | (34,392,717 | ) | (5,298,769 | ) | ||||||
| Accumulated other comprehensive loss | (317,551 | ) | (194,761 | ) | (30,005 | ) | ||||||
| Total shareholders’ equity | 74,045,347 | 67,797,639 | 10,445,351 | |||||||||
| Non-controlling interest | 8,223,497 | 8,237,140 | 1,269,068 | |||||||||
| Total equity | 82,268,844 | 76,034,779 | 11,714,419 | |||||||||
| Total Liabilities and Equity | ¥ | 134,348,887 | ¥ | 123,485,734 | $ | 19,025,027 | ||||||
The accompanying notes are an integral part of these unaudited condensed consolidated financial statements
| F-2 |
CONDENSED CONSOLIDATED STATEMENTS OF OPERATIONS AND COMPREHENSIVE LOSS
(UNAUDITED)
| For the six months ended | For the three months ended | |||||||||||||||||||||||
| Dec 31, | Dec 31, | |||||||||||||||||||||||
| 2014 | 2015 | 2015 | 2014 | 2015 | 2015 | |||||||||||||||||||
| RMB | RMB | USD | RMB | RMB | USD | |||||||||||||||||||
| Revenues | ||||||||||||||||||||||||
| Hardware and software | ¥ | 24,761,080 | ¥ | 31,338,132 | $ | 4,828,159 | ¥ | 20,515,571 | ¥ | 27,857,380 | $ | 4,291,891 | ||||||||||||
| Service | 103,774 | 1,098,258 | 169,205 | 45,283 | 985,050 | 151,763 | ||||||||||||||||||
| Hardware and software - related parties | 768,118 | - | - | 768,118 | - | - | ||||||||||||||||||
| Total revenues | 25,632,972 | 32,436,390 | 4,997,364 | 21,328,972 | 28,842,430 | 4,443,654 | ||||||||||||||||||
| Cost of revenues | ||||||||||||||||||||||||
| Hardware and software | ¥ | 16,022,965 | ¥ | 25,595,076 | $ | 3,943,346 | ¥ | 12,334,279 | ¥ | 22,402,781 | $ | 3,451,520 | ||||||||||||
| Service | - | 676,970 | 104,298 | - | 676,970 | 104,298 | ||||||||||||||||||
| Hardware and software - related parties | 16,762 | - | - | 16,762 | - | - | ||||||||||||||||||
| Total cost of revenues | 16,039,727 | 26,272,046 | 4,047,644 | 12,351,041 | 23,079,751 | 3,555,818 | ||||||||||||||||||
| Gross profit | 9,593,245 | 6,164,344 | 949,720 | 8,977,931 | 5,762,679 | 887,836 | ||||||||||||||||||
| Selling and distribution expenses | 1,955,260 | 2,624,348 | 404,324 | 1,254,470 | 1,511,678 | 232,899 | ||||||||||||||||||
| General and administrative expenses | 7,796,731 | 10,966,782 | 1,689,615 | 4,093,440 | 4,789,637 | 737,923 | ||||||||||||||||||
| Research and development expenses | 1,899,957 | 4,529,036 | 697,773 | 1,243,228 | 2,736,039 | 421,532 | ||||||||||||||||||
| Operating expenses | 11,651,948 | 18,120,166 | 2,791,712 | 6,591,138 | 9,037,354 | 1,392,354 | ||||||||||||||||||
| Income (loss) from operations | (2,058,703 | ) | (11,955,822 | ) | (1,841,992 | ) | 2,386,793 | (3,274,675 | ) | (504,518 | ) | |||||||||||||
| Other income (expenses) | ||||||||||||||||||||||||
| Subsidy income | 484,318 | 124,720 | 19,215 | 269,615 | 75,720 | 11,666 | ||||||||||||||||||
| Interest income | 157,468 | 104,719 | 16,134 | 74,436 | 49,209 | 7,581 | ||||||||||||||||||
| Interest expense | (468,956 | ) | (474,200 | ) | (73,058 | ) | (227,112 | ) | (196,376 | ) | (30,255 | ) | ||||||||||||
| Change in fair value of warrants liability | 4,077,517 | - | - | 3,803,118 | - | - | ||||||||||||||||||
| Loss from foreign currency exchange | (20,880 | ) | (202 | ) | (31 | ) | (18,806 | ) | 736 | 113 | ||||||||||||||
| Other income (expense) | 76,672 | (35,170 | ) | (5,419 | ) | 90,692 | (25,506 | ) | (3,930 | ) | ||||||||||||||
| Other income (expense) | 4,306,139 | (280,133 | ) | (43,159 | ) | 3,991,943 | (96,217 | ) | (14,825 | ) | ||||||||||||||
| Income (loss) before income tax | 2,247,436 | (12,235,955 | ) | (1,885,151 | ) | 6,378,736 | (3,370,892 | ) | (519,343 | ) | ||||||||||||||
| Provision (benefit) for income tax | 648,932 | (868,173 | ) | (133,756 | ) | 618,687 | (851,716 | ) | (131,221 | ) | ||||||||||||||
| Net Income (loss) | 1,598,504 | (11,367,782 | ) | (1,751,395 | ) | 5,760,049 | (2,519,176 | ) | (388,122 | ) | ||||||||||||||
| Less: Net income attributable to non-controlling interest | 434,673 | - | - | 434,673 | - | - | ||||||||||||||||||
| Net Income (loss) attributable to Recon Technology, Ltd | ¥ | 1,163,831 | ¥ | (11,367,782 | ) | $ | (1,751,395 | ) | ¥ | 5,325,376 | ¥ | (2,519,176 | ) | $ | (388,122 | ) | ||||||||
| Comprehensive income (loss) | ||||||||||||||||||||||||
| Net income (loss) | 1,598,504 | (11,367,782 | ) | (1,751,395 | ) | 5,760,049 | (2,519,176 | ) | (388,122 | ) | ||||||||||||||
| Foreign currency translation adjustment | 4,726 | 122,790 | 18,918 | 5,528 | (1,428 | ) | (220 | ) | ||||||||||||||||
| Comprehensive income (loss) | 1,603,230 | (11,244,992 | ) | (1,732,477 | ) | 5,765,577 | (2,520,604 | ) | (388,342 | ) | ||||||||||||||
| Less: Comprehensive income attributable to non-controlling interest | 434,920 | 13,643 | 2,102 | 434,961 | (2,977 | ) | (459 | ) | ||||||||||||||||
| Comprehensive income (loss) attributable to Recon Technology, Ltd | ¥ | 1,168,310 | ¥ | (11,258,635 | ) | $ | (1,734,579 | ) | ¥ | 5,330,616 | ¥ | (2,517,627 | ) | $ | (387,883 | ) | ||||||||
| Earnings (loss) per common share - basic | ¥ | 0.25 | ¥ | (2.07 | ) | $ | (0.32 | ) | ¥ | 1.13 | ¥ | (0.45 | ) | $ | (0.07 | ) | ||||||||
| Earnings (loss) per common share - diluted | ¥ | 0.24 | ¥ | (2.07 | ) | $ | (0.32 | ) | ¥ | 1.10 | ¥ | (0.45 | ) | $ | (0.07 | ) | ||||||||
| Weighted - average shares -basic | 4,741,911 | 5,503,932 | 5,503,932 | 4,726,711 | 5,569,102 | 5,569,102 | ||||||||||||||||||
| Weighted - average shares -diluted | 4,846,270 | 5,503,932 | 5,503,932 | 4,820,817 | 5,569,102 | 5,569,102 | ||||||||||||||||||
The accompanying notes are an integral part of these unaudited condensed consolidated financial statements
| F-3 |
CONDENSED CONSOLIDATED STATEMENTS OF CASH FLOWS
(UNAUDITED)
| For the six months ended December 31, | ||||||||||||
| 2014 | 2015 | 2015 | ||||||||||
| RMB | RMB | U.S. Dollars | ||||||||||
| Cash flows from operating activities: | ||||||||||||
| Net income (loss) | ¥ | 1,598,504 | ¥ | (11,367,782 | ) | $ | (1,751,395 | ) | ||||
| Adjustments to reconcile net income (loss) to net cash provided by (used in) operating activities: | ||||||||||||
| Depreciation | 274,511 | 496,070 | 76,428 | |||||||||
| Loss (Gain) from disposal of equipment | (149,480 | ) | 10,594 | 1,632 | ||||||||
| Provision for doubtful accounts | 104,589 | 2,153,337 | 331,757 | |||||||||
| Provision for slow moving inventories | - | (87,558 | ) | (13,490 | ) | |||||||
| Share based compensation | 1,115,030 | 2,573,575 | 396,502 | |||||||||
| Deferred tax benefit (provision) | (27,977 | ) | 187,814 | 28,936 | ||||||||
| Change in fair value of warrants liability | (4,077,517 | ) | - | - | ||||||||
| Restricted shares issued for services | 1,171,331 | 566,361 | 87,257 | |||||||||
| Changes in operating assets and liabilities: | ||||||||||||
| Notes receivable | (2,977,565 | ) | 1,178,710 | 181,600 | ||||||||
| Trade accounts receivable | (8,572,529 | ) | (13,793,992 | ) | (2,125,193 | ) | ||||||
| Trade accounts receivable-related parties | 6,104,734 | 4,569,800 | 704,053 | |||||||||
| Inventories | (4,833,407 | ) | 3,151,863 | 485,597 | ||||||||
| Other receivable, net | (7,635,508 | ) | (314,689 | ) | (48,483 | ) | ||||||
| Other receivables related parties, net | 1,414,433 | 91,021 | 14,023 | |||||||||
| Purchase advance, net | 2,641,583 | 4,567,724 | 703,734 | |||||||||
| Purchase advance-related party, net | - | 394,034 | 60,707 | |||||||||
| Prepaid expense | (2,127,821 | ) | 599,377 | 92,344 | ||||||||
| Prepaid expense - related party, net | 230,000 | 420,000 | 64,708 | |||||||||
| Trade accounts payable | 1,188,511 | 10,906,370 | 1,680,307 | |||||||||
| Trade accounts payable-related parties | - | (791,826 | ) | (121,994 | ) | |||||||
| Other payables | (137,403 | ) | (172,431 | ) | (26,566 | ) | ||||||
| Other payables-related parties | 290,738 | (2,837,536 | ) | (437,169 | ) | |||||||
| Deferred income | (1,223,397 | ) | (1,834,349 | ) | (282,612 | ) | ||||||
| Advances from customers | (417,185 | ) | (207,251 | ) | (31,930 | ) | ||||||
| Accrued payroll and employees' welfare | (132,687 | ) | 224,033 | 34,516 | ||||||||
| Accrued expenses | 9,327 | 35,292 | 5,437 | |||||||||
| Taxes payable | 779,567 | 271,229 | 41,787 | |||||||||
| Net cash provided by (used in) operating activities | (15,389,618 | ) | 989,790 | 152,493 | ||||||||
| Cash flows from investing activities: | ||||||||||||
| Purchase of property and equipment | (514,009 | ) | (498,470 | ) | (76,798 | ) | ||||||
| Proceeds from disposal of equipment | 341,880 | - | - | |||||||||
| Net cash used in investing activities | (172,129 | ) | (498,470 | ) | (76,798 | ) | ||||||
| Cash flows from financing activities: | ||||||||||||
| Repayments of short-term bank loans | (2,000,000 | ) | (500,000 | ) | (77,033 | ) | ||||||
| Proceeds from short-term borrowings-related parties | 9,400,000 | 6,000,000 | 924,400 | |||||||||
| Repayment of short-term borrowings-related parties | (5,000,000 | ) | (15,522,619 | ) | (2,391,517 | ) | ||||||
| Proceeds from sale of common stock, net of issuance costs | - | 169,398 | 26,098 | |||||||||
| Net cash provided by (used in) financing activities | 2,400,000 | (9,853,221 | ) | (1,518,052 | ) | |||||||
| Effect of exchange rate fluctuation on cash and cash equivalents | 15,125 | 125,302 | 19,306 | |||||||||
| Net decrease in cash and cash equivalents | (13,146,622 | ) | (9,236,599 | ) | (1,423,051 | ) | ||||||
| Cash and cash equivalents at beginning of period | 18,094,586 | 12,344,929 | 1,901,941 | |||||||||
| Cash and cash equivalents at end of period | ¥ | 4,947,964 | ¥ | 3,108,330 | $ | 478,890 | ||||||
| Supplemental cash flow information | ||||||||||||
| Cash paid during the period for interest | ¥ | 510,956 | ¥ | 474,200 | $ | 73,058 | ||||||
| Cash paid during the period for taxes | ¥ | 203,073 | ¥ | 72,217 | $ | 11,126 | ||||||
| Non-cash investing and financing activities | ||||||||||||
| Issuance of common stock to prepay professional services | ¥ | 1,002,721 | ¥ | 2,265,442 | $ | 349,029 | ||||||
| Non-cash transaction for AR and loan payable offset | - | 200,000 | 30,813 | |||||||||
The accompanying notes are an integral part of these unaudited condensed consolidated financial statements.
| F-4 |
NOTES TO THE UNAUDITED CONDENSED CONSOLIDATED FINANCIAL STATEMENTS
NOTE 1. ORGANIZATION AND NATURE OF OPERATIONS
Organization – Recon Technology, Ltd (the “Company”) was incorporated under the laws of the Cayman Islands on August 21, 2007 by Mr. Yin Shenping, Mr. Chen Guangqiang and Mr. Li Hongqi (the “Founders”) as a limited liability company. The Company provides specialized oilfield equipment, automation systems, tools, chemicals and field services to petroleum companies mainly in the People’s Republic of China (the “PRC”). Its wholly owned subsidiary, Recon Technology Co., Limited (“Recon-HK”) was incorporated on September 6, 2007 in Hong Kong. Other than the equity interest in Recon-HK, the Company does not own any assets or conduct any operations. On November 15, 2007, Recon-HK established one wholly owned subsidiary, Jining Recon Technology Ltd. (“Recon-JN”) under the laws of the PRC. Other than the equity interest in Recon-JN, Recon-HK does not own any assets or conduct any operations. On November 19, 2010 , Recon-CI established one wholly owned subsidiary, Recon Investment Ltd. (“Recon-IN”) under the laws of HK. Other than the equity interest in Recon-IN, Recon-CI does not own any assets or conduct any operations. On January 18, 2014, Recon-IN established one wholly owned subsidiary, Recon Hengda Technology (Beijing) Co., Ltd. (“Recon-BJ”) under the laws of the PRC. Other than the equity interest in Recon-BJ, Recon-IN does not own any assets or conduct any operations.
The Company conducts its business through the following PRC legal entities that are consolidated as variable interest entities (“VIEs”) and operate in the Chinese oilfield equipment & service industry:
1. Beijing BHD Petroleum Technology Co., Ltd. (“BHD”), and
2. Nanjing Recon Technology Co., Ltd. (“Nanjing Recon”).
On January 29, 2015, the Company increased its authorized shares from 25,000,000 to 100,000,000 ordinary shares.
Chinese laws and regulations currently do not prohibit or restrict foreign ownership in petroleum businesses. However, Chinese laws and regulations do prevent direct foreign investment in certain industries. However, on January 1, 2008, to protect the Company’s shareholders from possible future foreign ownership restrictions, the Founders, who also held the controlling interest of BHD and Nanjing Recon, reorganized the corporate and shareholding structure of these entities by entering into certain exclusive agreements with Recon-JN, entitling Recon-JN to receive a majority of the residual returns. On May 29, 2009 Recon-JN, BHD and Nanjing Recon entered into an operating agreement to provide full guarantee for the performance of such contracts, agreements or transactions entered into by BHD and Nanjing Recon. As a result of the new agreement, Recon-JN absorbs 100% of the expected losses and receives 90% of the expected gains of BHD and Nanjing Recon, which resulted in Recon-JN being the primary beneficiary of these Companies.
Recon-JN also entered into Share Pledge Agreements with the Founders, who pledged all their equity interest in these entities to Recon-JN. The Share Pledge Agreements, which were entered into by each Founder, pledged each of the Founders’ equity interest in BHD and Nanjing Recon as a guarantee for the service payment under the Service Agreement.
The Service Agreement, entered into on January 1, 2008, between Recon-JN and BHD and Nanjing Recon, states that Recon-JN will provide technical consulting services to BHD and Nanjing Recon in exchange for 90% of their annual net profits as a service fee, which is to be paid quarterly.
In addition, Recon-HK entered into Option Agreements to allow Recon-HK to acquire the Founders’ interest in these entities if or when permitted by the PRC laws.
Based on these exclusive agreements, the Company consolidated BHD and Nanjing Recon as VIEs as required by Accounting Standards Codification (“ASC”) Topic 810, Consolidation because the Company was the primary beneficiary of the VIEs. Management makes ongoing reassessment of whether Recon-JN is the primary beneficiary of BHD and Nanjing Recon.
| F-5 |
RECON TECHNOLOGY, LTD
NOTES TO THE UNAUDITED CONDENSED CONSOLIDATED FINANCIAL STATEMENTS
On August 28, 2000, a Founder of the Company purchased a controlling interest in BHD which was organized under the laws of the PRC on June 29, 1999. Through December 15, 2010, the Founders held a 67.5% ownership interest in BHD. From December 16, 2010 to June 30, 2012, Messers. Yin and Chen held an 86.24% ownership interest of BHD. BHD was combined with the Company through the date of the exclusive agreements, and has been consolidated following January 1, 2008, the date of the agreements based on ASC Topic 810. The Company allocates profits and losses of 90% and 100%, respectively, based upon the control agreements. Profits allocated to the minority interest are the remaining amount (10%).
On July 4, 2003, Nanjing Recon was organized under the laws of the PRC. On August 27, 2007, the Founders of the Company purchased a majority ownership of Nanjing Recon from a related party who was a majority owner of Nanjing Recon. Through December 15, 2010, the Founders held an 80% ownership interest in Nanjing Recon. From December 16, 2010 to June 30, 2012, Messers. Yin Shenping and Chen Guangqiang held an 80% ownership interest in Nanjing Recon. Nanjing Recon is combined with the Company through the date of the exclusive agreements, and is consolidated following January 1, 2008, the date of the agreements based on ASC Topic 810. The Company allocates profits and losses 90% and 100%, respectively, based upon the control agreements. Profits allocated to the non-controlling interest are the remaining amount (10%).
On December 1, 2015, the Company entered into a share purchase agreement (the “SPA”) by and among Qinghai Hua You Downhole Technology Co., Ltd. (“QHHY”), a P.R. China limited liability company, providing oilfield service in Qinghai province, the shareholders of QHHY, and Recon Hengda Technology (Beijing) Co., Ltd., our wholly owned P.R. China subsidiary (“Recon BJ”). In conjunction with the SPA, Recon BJ entered into a series of control agreements with QHHY and its shareholders related to the transfer of ownership in QHHY to Recon BJ. The Control Agreements granting Recon BJ the right to provide exclusive technical consulting services to QHHY in exchange for 100% of QHHY’s quarterly profit, among other things. The Control Agreements will not become effective until after the Company obtains shareholder approval of the transaction.
Nature of Operations –The Company engaged in (1) providing equipment, tools and other hardware related to oilfield production and management, including simple installations in connection with some projects; (2) service to improve production and efficiency of exploited oil wells, and (3) developing and selling its own specialized industrial automation control and information solutions. The products and services provided by the Company include:
High-Efficiency Heating Furnaces - High-Efficiency Heating Furnaces are designed to remove the impurities and to prevent solidification blockage in transport pipes carrying crude petroleum. Crude petroleum contains certain impurities including water and natural gas, which must be removed before the petroleum can be sold.
Multi-Purpose Fissure Shaper - Multipurpose fissure shapers improve the extractors’ ability to test for and extract petroleum which requires perforation into the earth before any petroleum extractor can test for the presence of oil.
Horizontal Multistage Fracturing related Service - The Company mainly uses Baker Hughes FracPoint™ system and provides related service to oilfield companies. The Baker Hughes FracPoint™ system provided a completion method using packers to isolate sections of the wellbore (stages) and frac sleeves to direct the frac treatment to the desired stage. The use of this type of completion eliminated the need for cementing the liner, coiled tubing operations, and wireline operations, while significantly reducing overall pumping time.
Supervisory Control and Data Acquisition System (“SCADA”) - SCADA is an industrial computerized process control system for monitoring, managing and controlling petroleum extraction. SCADA integrates underground and aboveground activities of the petroleum extraction industry. This system can help to manage the oil extraction process in real-time to reduce the costs associated with extraction.
| F-6 |
RECON TECHNOLOGY, LTD
NOTES TO THE UNAUDITED CONDENSED CONSOLIDATED FINANCIAL STATEMENTS
NOTE 2. SIGNIFICANT ACCOUNTING POLICIES
Basis of presentation - The accompanying unaudited condensed consolidated financial statements have been prepared in conformity with accounting principles generally accepted in the United States of America for interim financial information pursuant to the rules of the SEC and have been consistently applied. In the opinion of management, all adjustments (consisting of normal recurring accruals) considered necessary for a fair presentation have been included. These financial statements should be read in conjunction with the audited financial statements and notes thereto included in the Company’s Form 10-K for the fiscal year ended June 30, 2015. The results of operations for the interim periods presented may not be indicative of the operating results to be expected for the Company’s fiscal year ending June 30, 2016.
Principles of Consolidation – The unaudited condensed consolidated financial statements include the accounts of the Company, all the subsidiaries and VIEs of the Company. All transactions and balances between the Company and its subsidiaries and VIEs have been eliminated upon consolidation.
Variable Interest Entities - A VIE is an entity that either (i) has insufficient equity to permit the entity to finance its activities without additional subordinated financial support or (ii) has equity investors who lack the characteristics of a controlling financial interest. A VIE is consolidated by its primary beneficiary. The primary beneficiary has both the power to direct the activities that most significantly impact the entity’s economic performance and the obligation to absorb losses or the right to receive benefits from the entity that could potentially be significant to the VIE. The Company performs ongoing assessments to determine whether an entity should be considered a VIE and whether an entity previously identified as a VIE continues to be a VIE and whether the Company continues to be the primary beneficiary.
Assets recognized as a result of consolidating VIEs do not represent additional assets that could be used to satisfy claims against the Company’s general assets. Conversely, liabilities recognized as a result of consolidating these VIEs do not represent additional claims on the Company’s general assets; rather, they represent claims against the specific assets of the consolidated VIEs.
Currency Translation - The Company’s functional currency is the Chinese Yuan (“RMB”) and the accompanying unaudited condensed consolidated financial statements have been expressed in Chinese Yuan. The unaudited condensed consolidated financial statements as of and for the three months ended December 31, 2015 have been translated into United States dollars (“U.S. dollars”) solely for the convenience of the readers. The translation has been made at the rate of ¥6.4907 = US$1.00, the approximate exchange rate prevailing on December 31, 2015. These translated U.S. dollar amounts should not be construed as representing Chinese Yuan amounts or that the Chinese Yuan amounts have been or could be converted into U.S. dollars.
Estimates and assumptions - The preparation of the consolidated financial statements in conformity with U.S. GAAP requires that management make estimates and assumptions that affect the reported amounts of assets and liabilities and disclosure of contingent assets and liabilities at the dates of the financial statements and the reported amounts of revenues and expenses during the reporting periods. Estimates are adjusted to reflect actual experience when necessary. Significant accounting estimates reflected in the Company’s consolidated financial statements include revenue recognition, allowance for doubtful accounts, allowance for inventory, deferred taxes, warrants liabilities, the useful lives of property and equipment and the fair value of share- based payments. Since the use of estimates is an integral component of the financial reporting process, actual results could differ from those estimates.
Fair Values of Financial Instruments - The US GAAP accounting standards regarding fair value of financial instruments and related fair value measurements define fair value, establish a three-level valuation hierarchy that requires an entity to maximize the use of observable inputs and minimize the use of unobservable inputs when measuring fair value.
The three levels of inputs are defined as follows:
Level 1 inputs to the valuation methodology are quoted prices (unadjusted) for identical assets or liabilities in active markets.
Level 2 inputs to the valuation methodology include quoted prices for similar assets and liabilities in active markets, and inputs that are observable for the asset or liability, either directly or indirectly, for substantially the full term of the financial instrument.
| F-7 |
RECON TECHNOLOGY, LTD
NOTES TO THE UNAUDITED CONDENSED CONSOLIDATED FINANCIAL STATEMENTS
Level 3 inputs to the valuation methodology are unobservable.
The carrying amounts reported in the consolidated balance sheets for trade accounts receivable, other receivables, purchase advances, trade accounts payable, accrued liabilities, advances from customers, short-term bank loan and short-term borrowings approximate fair value because of the immediate or short-term maturity of these financial instruments. It was impracticable to estimate the fair value of long-term other receivables, because this is due from the Company’s former VIE and there are no comparable markets for receivables with similar terms. Long-term investment is measured at fair value which was determined to be zero during the six months ended December 31, 2015 using level 1 inputs. (See Note 8.)
The fair value of the warrants liability was determined using the Black-Scholes Model, as Level 2 inputs (See Note 13).
Cash and Cash Equivalents - Cash and cash equivalents are comprised of cash on hand, demand deposits and highly liquid short-term debt investments with stated original maturities of no more than six months. Since a majority of the bank accounts are located in the PRC, those bank balances are uninsured.
Trade Accounts and Other Receivables - Accounts receivable are carried at original invoiced amount less a provision for any potential uncollectible amounts. Accounts are considered past due when the related receivables are more than a year old. Provision is made against trade accounts and other receivables to the extent they are considered to be doubtful. Accounts are written off after extensive efforts at collection. Other receivables arise from transactions with non-trade customers.
Purchase Advances - Purchase advances are the amounts prepaid to suppliers for purchases of inventory and are recognized as inventory when the final amount is paid to the suppliers and the inventory is delivered.
Inventories - Inventories are stated at the lower of cost or market value, on a weighted average basis for BHD. Inventories are stated at the lower of cost or market value, on a first-in-first-out basis for Nanjing Recon. The methods of determining inventory costs are used consistently from year to year. Allowance for inventory obsolescence is provided when the market value of certain inventory items are lower than the cost.
Property and Equipment - Property and equipment are stated at cost. Depreciation on motor vehicles and office equipment is computed using the straight-line method over the estimated useful lives of the assets, which range from two to ten years. Leasehold improvements are amortized over the shorter of the lease term or the estimated useful life of the assets.
| Items | Useful life | |
| Motor vehicles | 5-10 years | |
| Office equipment | 2-5 years | |
| Leasehold improvement | 5 years |
Long-term investment – Long-term investment in equity over which the Company has the ability to exercise significant influence but not control, and that, in general, are 20-50 percent owned, are stated at cost plus equity in undistributed net income (loss) of the investee. These investments are evaluated for impairment, in which an impairment loss would be recorded whenever a decline in the value of an equity investment below its carrying amount is determined to be “other than temporary.” In judging “other than temporary,” the Company would consider the length of time and extent to which the fair value of the investment has been less than the carrying amount of the investment, the near-term and longer-term operating and financial prospects of the investee, and the Company’s longer-term intent of retaining the investment in the investee.
| F-8 |
RECON TECHNOLOGY, LTD
NOTES TO THE UNAUDITED CONDENSED CONSOLIDATED FINANCIAL STATEMENTS
Long-Lived Assets - The Company applies the ASC Topic 360 “Property, plant and equipment.” ASC Topic 360 requires that long-lived assets, such as property and equipment be reviewed for impairment whenever events or changes in circumstances indicate that the carrying amount of an asset or asset group may not be recoverable. Recoverability of assets to be held and used is measured by a comparison of the carrying amount of an asset to estimated undiscounted future cash flows expected to be generated by the asset. If the carrying amount of an asset exceeds its estimated undiscounted future cash flows, an impairment charge is recognized for the amount by which the carrying amount of the asset exceeds the fair value of the asset. Fair value is determined based on the estimated discounted future cash flows expected to be generated by the asset. There were no impairments at June 30, 2015 and December 31, 2015.
Revenue Recognition - The Company recognizes revenue when the following four criteria are met: (1) persuasive evidence of an arrangement, (2) delivery has occurred or services have been provided, (3) the sales price is fixed or determinable, and (4) collectability is reasonably assured. Delivery does not occur until products have been shipped or services have been provided to the customers and the customers have signed a completion and acceptance report, risk of loss has transferred to the customers, customers’ acceptance provisions have lapsed, or the Company has objective evidence that the criteria specified in customers’ acceptance provisions have been satisfied. The sales price is not considered to be fixed or determinable until all contingencies related to the sale have been resolved.
Hardware:
Revenue from hardware sales is generally recognized when the product is shipped to the customer and when there are no unfulfilled company obligations that affect the customer’s final acceptance of the arrangement.
Software:
The Company sells self-developed software. For software sales, the Company recognizes revenues in accordance with ASC Topic 985 - 605 “Software Revenue Recognition.” Revenue from software is recognized according to project contracts. Contract costs are accumulated during the periods of installation and testing or commissioning. Usually this is short term. Revenue is not recognized until completion of the contracts and receipt of acceptance statements.
Service:
The Company provides services to improve software function and system operation on separated fixed-price contracts. Revenue is recognized on the completed contract method when acceptance is determined by a completion report signed by the customer.
Deferred revenue represents unearned amounts billed to customers related to sales contracts.
Subsidy Income - Grants are given by the government to support local software companies’ operation and research and development. Grants related to research and development projects are recognized as subsidy income in the unaudited condensed consolidated statements of operations when received. Grants in the form of value-added-tax refund for software products are recognized when received.
Share-Based Compensation - The Company accounts for share-based compensation in accordance with ASC Topic 718, Share-Based Payment. Under the fair value recognition provisions of this topic, share-based compensation cost is measured at the grant date based on the fair value of the award and is recognized as expense with graded vesting on a straight–line basis over the requisite service period for the entire award. The Company has elected to recognize compensation expenses using the Binomial Lattice valuation model estimated at the grant date based on the award’s fair value.
| F-9 |
RECON TECHNOLOGY, LTD
NOTES TO THE UNAUDITED CONDENSED CONSOLIDATED FINANCIAL STATEMENTS
Income Taxes - Income taxes are provided based upon the liability method of accounting pursuant to ASC Topic 740, Accounting for Income Taxes. Provisions for income taxes are based on taxes payable or refundable for the current year and deferred taxes. Deferred taxes are provided on differences between the tax bases of assets and liabilities and their reported amounts in the financial statements, and tax carry forwards. Deferred tax assets and liabilities are included in the financial statements at currently enacted income tax rates applicable to the period in which the deferred tax assets and liabilities are expected to be realized or settled. As changes in tax laws or rates are enacted, deferred tax assets and liabilities are adjusted through the provision for income taxes. The Company has not been subject to any income taxes in the United States or the Cayman Islands.
Under ASC Topic 740, the Company may recognize the tax benefit from an uncertain tax position only if it is more likely than not that the tax position will be sustained on examination by the taxing authorities, based on the technical merits of the position. The tax benefits recognized in the financial statements from such a position would be measured based on the largest benefit that has a greater than fifty percent likelihood of being realized upon ultimate settlement. Income tax returns for the year prior to 2010 are no longer subject to examination by tax authorities.
Earnings (loss) per Share (“EPS”) - Basic EPS is computed by dividing net income (loss) by the weighted average number of ordinary shares outstanding. Diluted EPS are computed by dividing net income (loss) by the weighted-average number of ordinary shares and dilutive potential ordinary share equivalents outstanding.
Potentially dilutive ordinary shares consist of ordinary shares issuable upon the conversion of ordinary stock options, restricted shares and warrants (using the treasury stock method). The effect from options, restricted shares and warrants would have been anti-dilutive due to the fact that we incurred a net loss during the three months and six months ended December 31, 2014 and 2015.
Recently Issued Accounting Pronouncements -
In August 2015, the FASB issued Accounting Standards Update No. 2015-14, Revenue from Contracts with Customers (Topic 606): Deferral of the Effective Date, or ASU 2015-14. This amendment defers the effective date of the previously issued Accounting Standards Update No. 2014-09, Revenue from Contracts with Customers (Topic 606), or ASU 2014-09, until the interim and annual reporting periods beginning after December 15, 2017. Earlier application is permitted for interim and annual reporting periods beginning after December 15, 2016. The Company is evaluating the effect of this standard on the Company's consolidated financial position, results of operations and cash flows.
In August 2015, the FASB issued Accounting Standards Update (ASU) No. 2015-15, Interest - Imputation of Interest (Subtopic 835-30): Presentation and Subsequent Measurement of Debt Issuance Costs Associated with Line-of-Credit Arrangements - Amendments to SEC Paragraphs Pursuant to Staff Announcement at June 18, 2015 EITF Meeting. This ASU adds SEC paragraphs pursuant to the SEC Staff Announcement at the June 18, 2015, Emerging Issues Task Force meeting about the presentation and subsequent measurement of debt issuance costs associated with line-of-credit arrangements. Given the absence of authoritative guidance within ASU 2015-03 for debt issuance costs related to line-of-credit arrangements, the SEC staff would not object to an entity deferring and presenting debt issuance costs as an asset and subsequently amortizing the deferred debt issuance costs ratably over the term of the line-of-credit arrangement, regardless of whether there are any outstanding borrowings on the line-of-credit arrangement. The Company does not expect this update will have a material impact on the Company's consolidated financial position, results of operations and cash flows. In September 2015, the FASB issued ASU 2015-16, Business Combinations (Topic 805): Simplifying the Accounting for Measurement-Period Adjustments, which eliminates the requirement to retrospectively account for changes to provisional amounts initially recorded in a business acquisition opening balance sheet. Prior to the issuance of ASU 2015-16, an acquirer was required to restate prior period financial statements as of the acquisition date for adjustments to provisional amounts. This guidance is effective for fiscal years beginning after December 15, 2015, including interim periods within fiscal years. The Company does not expect this update will have a material impact on the Company's consolidated financial position, results of operations and cash flows.
| F-10 |
RECON TECHNOLOGY, LTD
NOTES TO THE UNAUDITED CONDENSED CONSOLIDATED FINANCIAL STATEMENTS
In September 2015, the FASB issued ASU 2015-16, Business Combinations (Topic 805): Simplifying the Accounting for Measurement-Period Adjustments, which eliminates the requirement to retrospectively account for changes to provisional amounts initially recorded in a business acquisition opening balance sheet. Prior to the issuance of ASU 2015-16, an acquirer was required to restate prior period financial statements as of the acquisition date for adjustments to provisional amounts. This guidance is effective for fiscal years beginning after December 15, 2015, including interim periods within fiscal years. The Company does not expect this update will have a material impact on the presentation of the Company's consolidated financial position, results of operations and cash flows.
In November 2015, the FASB issued Accounting Standards Update (ASU) No. 2015-17, Income Taxes (Topic 740): Balance Sheet Classification of Deferred Taxes, which changes how deferred taxes are classified on organizations’ balance sheets. The ASU eliminates the current requirement for organizations to present deferred tax liabilities and assets as current and noncurrent in a classified balance sheet. Instead, organizations will be required to classify all deferred tax assets and liabilities as noncurrent. The amendments apply to all organizations that present a classified balance sheet. For public companies, the amendments are effective for financial statements issued for annual periods beginning after December 15, 2016, and interim periods within those annual periods. The Company does not expect this update will have a material impact on the presentation of the Company's consolidated financial position, results of operations and cash flows.
In January 2016, the FASB issued Accounting Standards Update (ASU) No. 2016-01, Financial Instruments – Overall (Subtopic 825-10): Recognition and Measurement of Financial Assets and Financial Liabilities. The new guidance makes targeted improvements to existing U.S. GAAP by: (1) Requiring equity investments to be measured at fair value with changes in fair value recognized in net income; (2) Requiring separate presentation of financial assets and financial liabilities by measurement category and form of financial asset on the balance sheet or the accompanying notes to the financial statements; (3) Eliminating the requirement for public business entities to disclose the method(s) and significant assumptions used to estimate the fair value that is required to be disclosed for financial instruments measured at amortized cost on the balance sheet; and. (4) Requiring a reporting organization to present separately in other comprehensive income the portion of the total change in the fair value of a liability resulting from a change in the instrument-specific credit risk. The new guidance is effective for public companies for fiscal years beginning after December 15, 2017, including interim periods within those fiscal years. The Company does not expect this update will have a material impact on the presentation of the Company's consolidated financial position, results of operations and cash flows.
| F-11 |
RECON TECHNOLOGY, LTD
NOTES TO THE UNAUDITED CONDENSED CONSOLIDATED FINANCIAL STATEMENTS
NOTE 3. TRADE ACCOUNTS RECEIVABLE, NET
Accounts receivable consisted of the following:
| June 30, 2015 | December 31, 2015 | December 31, 2015 | ||||||||||
| Third Party | RMB | RMB | U.S. Dollars | |||||||||
| Trade accounts receivable | ¥ | 58,049,462 | ¥ | 69,853,378 | $ | 10,762,072 | ||||||
| Allowance for doubtful accounts | (5,863,065 | ) | (2,894,597 | ) | (445,961 | ) | ||||||
| Total - third- party, net | ¥ | 52,186,397 | ¥ | 66,958,781 | $ | 10,316,111 | ||||||
| June 30, 2015 | December 31, 2015 | December 31, 2015 | ||||||||||
| Related Party | RMB | RMB | U.S. Dollars | |||||||||
| Beijing Langchen Construction Company | 726,800 | ¥ | - | $ | - | |||||||
| Xiamen Huangsheng Hitek Computer Network Co.Ltd. | 980,000 | - | - | |||||||||
| Xiamen Henda Hitek Computer Network Co. Ltd. | 3,063,000 | - | - | |||||||||
| Total - related-parties, net | ¥ | 4,769,800 | ¥ | - | $ | - | ||||||
| June 30, 2015 | December 31, 2015 | December 31, 2015 | ||||||||||
| Third Party – long-term | RMB | RMB | U.S. Dollars | |||||||||
| Beijing Yabei Nuoda Science and Technology Co. Ltd. * | ¥ | 4,934,072 | ¥ | 3,731,508 | $ | 574,901 | ||||||
| Allowance for doubtful accounts | (493,407 | ) | (373,151 | ) | (57,491 | ) | ||||||
| Total - long-term trade accounts receivable, net | ¥ | 4,440,665 | ¥ | 3,358,357 | $ | 517,410 | ||||||
* The receivable from Yabei Nuoda was recognized primarily from the sale of automation system and services based on written contracts. Based on the repayment agreement signed on September 2, 2015, the outstanding balance will be collected in two years beginning 2017, with each installment of ¥2,467,036 ($380,000).
| F-12 |
RECON TECHNOLOGY, LTD
NOTES TO THE UNAUDITED CONDENSED CONSOLIDATED FINANCIAL STATEMENTS
NOTE 4. OTHER RECEIVABLES, NET
Other receivables consisted of the following:
| Third Party | June 30, 2015 | December 31, 2015 | December 31, 2015 | |||||||||
| Current Portion | RMB | RMB | U.S. Dollars | |||||||||
| Due from ENI (A) | ¥ | 2,624,071 | ¥ | 3,375,185 | $ | 520,003 | ||||||
| Loans to third parties (B) | 11,154,344 | 11,583,104 | 1,784,569 | |||||||||
| Business advance to staff (C) | 3,927,238 | 4,517,706 | 696,028 | |||||||||
| Deposits for projects | 543,800 | 853,492 | 131,495 | |||||||||
| Others | 637,348 | 223,140 | 34,378 | |||||||||
| Allowance for doubtful accounts | (822,233 | ) | (835,233 | ) | (128,681 | ) | ||||||
| Total | ¥ | 18,064,568 | ¥ | 19,717,394 | $ | 3,037,792 | ||||||
| Third Party | June 30, 2015 | December 31, 2015 | December 31, 2015 | |||||||||
| Non-Current Portion | RMB | RMB | U.S. Dollars | |||||||||
| Due from ENI (A) | ¥ | 2,729,033 | ¥ | 1,377,896 | $ | 212,288 | ||||||
| Total | ¥ | 2,729,033 | ¥ | 1,377,896 | $ | 212,288 | ||||||
| (A) | After ENI ceased to be a VIE of the Company, ENI in January 2012 agreed to repay the loan on a payment schedule, with interest accrued during the period at an annual rate of 4%. In accordance with the payment schedule, the principal plus accrued interest is required to be repaid over approximately three years on a quarterly basis beginning March 2012. The first four payments were RMB 1.2 million each. In March, June, September and December of 2012, the Company received RMB 4.8 million. Starting March 2013, installments for each quarter would be ¥1,777,653. The Company received the payments on time in March and June, 2013. On September 30, 2013, ENI proposed to extend the payment period and signed a new contract with the Company. According to the new arrangement, the remaining part of this loan will be repaid over four years with quarterly installments of ¥699,147. The Company has continued to receive the payments under the agreement. |
| (B) | Loans to third-parties are mainly used for short-term funding to support cooperative companies. These loans are due on demand bearing no interest. |
| (C) | Business advance to staff represents advances for business travel and sundry expenses related to oilfield or on-site installation and inspection of products through customer approval and acceptance. |
| F-13 |
RECON TECHNOLOGY, LTD
NOTES TO THE UNAUDITED CONDENSED CONSOLIDATED FINANCIAL STATEMENTS
NOTE 5. PURCHASE ADVANCES
The Company purchased products and services from a third party and a related party during the normal course of business. Purchase advances consisted of the following:
| June 30, 2015 | December 31, 2015 | December 31, 2015 | ||||||||||
| Third Party | RMB | RMB | U.S. Dollars | |||||||||
| Prepayment for inventory purchase | ¥ | 22,845,030 | ¥ | 18,277,305 | $ | 2,815,922 | ||||||
| Allowance for doubtful accounts | (4,222,492 | ) | (6,258,912 | ) | (964,289 | ) | ||||||
| Total | ¥ | 18,622,538 | ¥ | 12,018,393 | $ | 1,851,633 | ||||||
NOTE 6. INVENTORIES
Inventories consisted of the following:
| June 30, 2015 | December 31, 2015 | December 31, 2015 | ||||||||||
| RMB | RMB | U.S. Dollars | ||||||||||
| Small component parts | ¥ | 55,332 | ¥ | 55,332 | $ | 8,525 | ||||||
| Purchased goods and raw materials | 244,667 | 285,275 | 43,951 | |||||||||
| Work in process and goods on site | 3,552,771 | 334,582 | 51,548 | |||||||||
| Finished goods | 14,693,073 | 9,987,846 | 1,538,793 | |||||||||
| Allowance for slow moving inventory | (7,700,836 | ) | (2,882,333 | ) | (444,071 | ) | ||||||
| Total inventories, net | ¥ | 10,845,007 | ¥ | 7,780,702 | $ | 1,198,746 | ||||||
The provision for slow moving inventory was ¥ 87,558 ($13,490) for the six months ended December 31, 2015.
NOTE 7. PROPERTY AND EQUIPMENT, NET
Property and equipment consisted of the following:
| June 30, 2015 | December 31, 2015 | December 31, 2015 | ||||||||||
| RMB | RMB | U.S. Dollars | ||||||||||
| Motor vehicles | ¥ | 3,790,474 | ¥ | 3,871,567 | $ | 596,479 | ||||||
| Office equipment and fixtures | 797,791 | 825,996 | 127,258 | |||||||||
| Leasehold improvement | - | 210,299 | 32,400 | |||||||||
| Total property and equipment | 4,588,265 | 4,907,862 | 756,137 | |||||||||
| Less: Accumulated depreciation | (1,921,312 | ) | (2,249,103 | ) | (346,511 | ) | ||||||
| Property and equipment, net | ¥ | 2,666,953 | ¥ | 2,658,759 | $ | 409,626 | ||||||
Depreciation expense was ¥153,164 and ¥236,303($36,406) for the three months ended December 31, 2014 and 2015, respectively.
| F-14 |
RECON TECHNOLOGY, LTD
NOTES TO THE UNAUDITED CONDENSED CONSOLIDATED FINANCIAL STATEMENTS
Depreciation expense was ¥274,511 and ¥496,070 ($76,428) for the six months ended December 31, 2014 and 2015, respectively.
NOTE 8. LONG-TERM INVESTMENT
On June 28, 2013, the Company purchased 2,800,000 restricted shares of Avalon Oil and Gas, Inc. ("Avalon") for $0.089 per share, or approximately ¥1.5 million ($250,000). Since the restriction for the shares is for two years, the Company was able to acquire the shares at 50% of the market value. The investment was accounted for using the equity method and no gain or loss from equity investment was recorded for the year ended June 30, 2013 due to immateriality. As of June 30, 2015 and December 31, 2015, Recon owned 16.92% and 16.00% of Avalon’s outstanding shares, respectively. Avalon is an independent US domestic oil and natural gas producer listed on the OTCBB under the ticker symbol AOGN. Avalon engages in the acquisition, exploration and development of oil and gas producing properties in the US. Based on the available information and discussion with the management team of Avalon, the Company believes Avalon’s operating loss would not be recovered in the foreseeable future, therefore, the Company considered the investment to be impaired and recorded an investment loss of ¥1,535,250 ($250,000) for the year ended June 30, 2014 to write its investment down to zero.
On April 13, 2015, BHD reached an agreement to invest RMB 80 million in Huanghua Heng Da Xiang Tong Manufacture Ltd (“HHBHD”) for a 54.05% ownership interest. BHD’s board of Directors and shareholders approved the transaction to invest in HHBHD. The investment is to enhance cooperation with HHBHD and protect BHD’s design copyright. Based on mutual agreements, BHD shall not enjoy voting right until the payment of investment is on position. As of February 16, 2016, no payment was made to HHBHD for this investment and BHD did not have control or significant influence over HHBHD.
| F-15 |
RECON TECHNOLOGY, LTD
NOTES TO THE UNAUDITED CONDENSED CONSOLIDATED FINANCIAL STATEMENTS
NOTE 9. OTHER PAYABLES
Other payables consisted of the following:
| June 30, 2015 | December 31, 2015 | December 31, 2015 | ||||||||||
| Third Party | RMB | RMB | U.S. Dollars | |||||||||
| Consulting services | ¥ | 1,628,508 | ¥ | 857,004 | $ | 132,036 | ||||||
| Distributors and employees | 413,703 | 124,840 | 19,234 | |||||||||
| Funds collected on behalf of others | - | 895,022 | 137,893 | |||||||||
| Others | 60,846 | 53,760 | 8,282 | |||||||||
| Total | ¥ | 2,103,057 | ¥ | 1,930,626 | $ | 297,445 | ||||||
| June 30, 2015 | December 31, 2015 | December 31, 2015 | ||||||||||
| Related Party | RMB | RMB | U.S. Dollars | |||||||||
| Due to related parties | ¥ | 2,499,347 | ¥ | - | $ | - | ||||||
| Expenses paid by the major shareholders | 1,558,738 | 1,220,503 | 188,039 | |||||||||
| Due to management staff for costs incurred on behalf of Recon | 251,617 | 251,663 | 38,773 | |||||||||
| Total | ¥ | 4,309,702 | ¥ | 1,472,166 | $ | 226,812 | ||||||
NOTE 10. TAXES PAYABLE
Taxes payable consisted of the following:
| June 30, 2015 | December 31, 2015 | December 31, 2015 | ||||||||||
| RMB | RMB | U.S. Dollars | ||||||||||
| VAT payable | ¥ | 23,885 | ¥ | 1,168,537 | $ | 180,033 | ||||||
| Enterprise income tax payable | 1,127,131 | 210,525 | 32,435 | |||||||||
| Other taxes payable | 2,200 | 45,383 | 6,991 | |||||||||
| Total taxes payable | ¥ | 1,153,216 | ¥ | 1,424,445 | $ | 219,459 | ||||||
| F-16 |
RECON TECHNOLOGY, LTD
NOTES TO THE UNAUDITED CONDENSED CONSOLIDATED FINANCIAL STATEMENTS
NOTE 11. SHORT-TERM BANK LOAN
Short-term bank loans consisted of the following:
| June 30, 2015 | December 31, 2015 | December 31, 2015 | ||||||||||
| RMB | RMB | U.S. Dollars | ||||||||||
| Industrial and Commercial Bank, floating interest rate at 6.12 %, due on June 19, 2016 | ¥ | 7,000,000 | ¥ | 6,500,000 | $ | 1,001,433 | ||||||
| Total short-term bank loans | ¥ | 7,000,000 | ¥ | 6,500,000 | $ | 1,001,433 | ||||||
Interest expense for the short-term bank loan was ¥80,667 and ¥106,242 ($16,368) for the three months ended December 31, 2014 and 2015, respectively.
Interest expense for the short-term bank loan was ¥238,178 and ¥214,649 ($33,070) for the six months ended December 31, 2014 and 2015, respectively.
NOTE 12. SHORT-TERM BORROWINGS DUE TO RELATED PARTIES
| June 30, 2015 | December 31, 2015 | December 31, 2015 | ||||||||||
| Short-term borrowings due to related parties: | RMB | RMB | U.S. Dollars | |||||||||
| Short-term borrowing from a Founder, 7.2% annual interest, due on October 20, 2015 | ¥ | 6,013,200 | ¥ | - | $ | - | ||||||
| Short-term borrowing from a Founder, 6.06% annual interest, due on October 2, 2015 | 3,403,431 | - | - | |||||||||
| Short-term borrowing from a Founder, 5.13% annual interest, due on October 12, 2015 | 1,600,274 | - | - | |||||||||
| Short-term borrowing from a Founder's family member, no interest, due on various dates | 5,700,000 | 1,200,000 | 184,880 | |||||||||
| Short-term borrowing from a Founder, 5.75% annual interest, due on September 25, 2016 | - | 1,808,913 | 278,693 | |||||||||
| Short-term borrowings from Xiamen Huasheng Haitian Computer Network Co. Ltd., no interest, due on November 14, 2015 | 200,000 | - | - | |||||||||
| Short-term borrowing from a Founder, 5.75% annual interest,due on October 10, 2016 | - | 2,409,250 | 371,185 | |||||||||
| Short-term borrowing from a Founder, 5.43% annual interest,due on November 4, 2016 | - | 1,807,612 | 278,492 | |||||||||
| Total short-term borrowings due to related parties | ¥ | 16,916,905 | ¥ | 7,225,775 | $ | 1,113,250 | ||||||
| F-17 |
RECON TECHNOLOGY, LTD
NOTES TO THE UNAUDITED CONDENSED CONSOLIDATED FINANCIAL STATEMENTS
Interest expense for short-term borrowings due to related parties was ¥146,445 and ¥86,071 ($13,261) for the three months ended December 31, 2014 and 2015, respectively.
Interest expense for short-term borrowings due to related parties was ¥230,778 and ¥257,519 ($39,675) for the six months ended December 31, 2014 and 2015, respectively.
NOTE 13. SHAREHOLDERS’ EQUITY
Stock offering – During the six months ended December 31, 2015, the Company offered 15,874 ordinary shares under the same purchase agreement from June 2015. The net cash proceeds received from the stock offering were ¥169,398 ($26,098).
Appropriated Retained Earnings - According to the Memorandum and Articles of Association, the Company is required to transfer a certain portion of its net profit, as determined under PRC accounting regulations, from current net income to the statutory reserve fund. In accordance with the PRC Company Law, companies are required to transfer 10% of their profit after tax, as determined in accordance with PRC accounting standards and regulations, to the statutory reserves until such reserves reach 50% of the registered capital or paid-in capital of the companies. As of June 30, 2015 and December 31, 2015, the balance of total statutory reserves was ¥4,148,929 and ¥4,148,929 ($639,211), respectively.
| F-18 |
RECON TECHNOLOGY, LTD
NOTES TO THE UNAUDITED CONDENSED CONSOLIDATED FINANCIAL STATEMENTS
NOTE 14. STOCK-BASED COMPENSATION
Stock-Based Awards Plan
The following is a summary of the status of options outstanding and exercisable at December 31, 2015:
| Outstanding Options | Exercisable Options | |||||||||||||||||||||
| Average Exercise Price | Number | Average Remaining Contractual life (Years) | Average Exercise Price | Number | Average Remaining Contractual life (Years) | |||||||||||||||||
| $ | 6.00 | 193,000 | 3.58 | $ | 6.00 | 193,000 | 3.58 | |||||||||||||||
| $ | 2.96 | 222,600 | 6.24 | $ | 2.96 | 74,200 | 6.24 | |||||||||||||||
| $ | 1.65 | 400,000 | 9.09 | - | - | - | ||||||||||||||||
| 815,600 | ||||||||||||||||||||||
Restricted Shares
As of December 31, 2015, the Company has granted restricted shares of common stock, which are still vesting, to senior management and consultants. During the six months ended December 31, 2015, the following grants were made:
| · | On October 18, 2015, the Company agreed to issue a total of 800,000 restricted shares to its employees and non-employee director as compensation cost for awards. The fair value of the restricted shares was $704,000 based on the closing stock price $0.88 at October 18, 2015. |
| · | On November 16, 2015, the Company agreed to issue a total of 100,000 restricted shares to two investor relations firms in exchange for services. The fair value of the restricted shares was $108,400 based on the closing stock price $1.08 at November 16, 2015. |
| · | On November 19, 2015, the Company issued 260,185 restricted shares to Bei Jing Tian Hong Tong Xin Technology Co. Ltd. (“BJTH”) for certain mold and software development services. The fair value of the restricted shares was $247,176 based on the closing stock price $0.95 at November 19, 2015. |
The Share-based compensation expense recorded for stock options granted were ¥409,418 and ¥1,029,822 ($158,661) for the six months ended December 31, 2014 and 2015, respectively. The Share-based compensation expense recorded for stock options granted were ¥162,277 and ¥520,294 ($80,160) for the three months ended December 31, 2014 and 2015, respectively. The total unrecognized share-based compensation expense for stock options as of December 31, 2015 was approximately ¥3.8 million ($0.59 million), which is expected to be recognized over a weighted average period of approximately 1.90 years.
The Share-based compensation expense recorded for restricted shares granted were ¥705,612 and ¥1,543,756 ($237,841) for the six months ended December 31, 2014 and 2015, respectively. The Share-based compensation expense recorded for restricted shares granted were ¥352,175 and ¥926,732 ($142,778) for the three months ended December 31, 2014 and 2015, respectively. The total unrecognized share-based compensation expense for restricted shares granted as of December 31, 2015 was approximately ¥7.92 million ($1.22 million), which is expected to be recognized over a weighted average period of approximately 2.27 years.
| F-19 |
RECON TECHNOLOGY, LTD
NOTES TO THE UNAUDITED CONDENSED CONSOLIDATED FINANCIAL STATEMENTS
Following is a summary of the restricted stock grants:
| Restricted stock grants | Shares | |||
| Non-vested as of June 30, 2015 | 453,575 | |||
| Granted | 1,160,185 | |||
| Non-vested adjustment | - | |||
| Cancelled | - | |||
| Vested | 76,787 | |||
| Non-vested as of December 31, 2015 | 1,536,973 | |||
NOTE 15. INCOME TAX
The Company is not subject to any income taxes in the United States or the Cayman Islands and had minimal operations in jurisdictions other than the PRC. BHD and Nanjing Recon are subject to PRC’s income taxes as PRC domestic companies. The Company follows Implementing Rules for the Enterprise Income Tax Law (“Implementing Rules”), which took effect on January 1, 2008 and unified the income tax rate for domestic-invested and foreign-invested enterprises at 25%.
The Company reapplied for high-technology enterprise approval and has passed all relevant reviews. Thus, for the calendar years 2014 and 2015, Nanjing Recon is subject to an income tax rate of 15%.
As approved by the domestic tax authority in the PRC, BHD was recognized as a government-certified high technology company on November 25, 2009 and is subject to an income tax rate of 15% through November 2015. BHD reapplied for high-technology enterprise approval and successfully got the approval on November 25, 2015. Thus, the valid date of BHD’s high-technology enterprise certificate is extended to November 25, 2018.
Deferred tax asset is comprised of the following:
| June 30, 2015 | December 31, 2015 | December 31, 2015 | ||||||||||
| RMB | RMB | U.S. Dollars | ||||||||||
| Allowance for doubtful receivables | ¥ | 1,072,279 | ¥ | 1,554,284 | $ | 239,463 | ||||||
| Net operating loss carry forward | 669,819 | - | - | |||||||||
| Total deferred income tax assets | ¥ | 1,742,098 | ¥ | 1,554,284 | $ | 239,463 | ||||||
Deferred tax liability is comprised of the following:
| June 30, 2015 | December 31, 2015 | December 31, 2015 | ||||||||||
| RMB | RMB | U.S. Dollars | ||||||||||
| Income tax cost due to unpayable accounts | ¥ | 180,186 | ¥ | 180,186 | $ | 27,761 | ||||||
| Total deferred income tax liability | ¥ | 180,186 | ¥ | 180,186 | $ | 27,761 | ||||||
| F-20 |
RECON TECHNOLOGY, LTD
NOTES TO THE UNAUDITED CONDENSED CONSOLIDATED FINANCIAL STATEMENTS
The Company’s tax provision is comprised of the following:
| For the three months ended December 31, | ||||||||||||
| 2014 | 2015 | 2015 | ||||||||||
| RMB | RMB | U.S. Dollars | ||||||||||
| Current income tax provision | ¥ | 644,630 | ¥ | - | $ | - | ||||||
| Adjust over accrued income taxes | (1,055,987 | ) | (162,692 | ) | ||||||||
| Deferred income taxes provision (benefit) | (25,943 | ) | 204,271 | 31,471 | ||||||||
| Provision (benefit) for income tax | ¥ | 618,687 | ¥ | (851,716 | ) | (131,221 | ) | |||||
| For the six months ended December 31, | ||||||||||||
| 2014 | 2015 | 2015 | ||||||||||
| RMB | RMB | U.S. Dollars | ||||||||||
| Current income tax provision | ¥ | 676,909 | ¥ | - | $ | - | ||||||
| Adjust over accrued tax of prior years | (1,055,987 | ) | (162,692 | ) | ||||||||
| Deferred income taxes provision (benefit) | (27,977 | ) | 187,814 | 28,936 | ||||||||
| Provision (benefit) for income tax | ¥ | 648,932 | ¥ | (868,173 | ) | (133,756 | ) | |||||
NOTE 16. NON-CONTROLLING INTEREST
Non-controlling interest consisted of the following:
| As of June 30, 2015 | ||||||||||||||||
| Nanjing | ||||||||||||||||
| BHD | Recon | Total | Total | |||||||||||||
| RMB | RMB | RMB | U.S. Dollars | |||||||||||||
| Paid-in capital | ¥ | 1,651,000 | ¥ | 200,000 | ¥ | 1,851,000 | $ | 304,001 | ||||||||
| Unappropriated retained earnings | 3,152,687 | 3,250,513 | 6,403,200 | 1,051,636 | ||||||||||||
| Accumulated other comprehensive loss | (18,850 | ) | (11,853 | ) | (30,703 | ) | (5,043 | ) | ||||||||
| Total noncom-trolling interest | ¥ | 4,784,837 | ¥ | 3,438,660 | ¥ | 8,223,497 | $ | 1,350,594 | ||||||||
| As of December 31, 2015 | ||||||||||||||||
| Nanjing | ||||||||||||||||
| BHD | Recon | Total | Total | |||||||||||||
| RMB | RMB | RMB | U.S. Dollars | |||||||||||||
| Paid-in capital | ¥ | 1,651,000 | ¥ | 200,000 | ¥ | 1,851,000 | $ | 285,177 | ||||||||
| Unappropriated retained earnings | 3,152,687 | 3,250,513 | 6,403,200 | 986,519 | ||||||||||||
| Accumulated other comprehensive loss | (12,133 | ) | (4,927 | ) | (17,060 | ) | (2,628 | ) | ||||||||
| Total non-controlling interest | ¥ | 4,791,554 | ¥ | 3,445,586 | ¥ | 8,237,140 | $ | 1,269,068 | ||||||||
NOTE 17. CONCENTRATIONS
For the three months ended December 31, 2014 and 2015, the two largest customers, China National Petroleum Corporation (“CNPC”) and China Petroleum & Chemical Corporation Limited (“SINOPEC”), represented approximately 58.83%, 10.35% and 76.76%, 10.03% of the Company’s revenue, respectively.
| F-21 |
RECON TECHNOLOGY, LTD
NOTES TO THE UNAUDITED CONDENSED CONSOLIDATED FINANCIAL STATEMENTS
For the six months ended December 31, 2014 and 2015, the two largest customers, China National Petroleum Corporation (“CNPC”) and China Petroleum & Chemical Corporation Limited (“SINOPEC”), represented approximately 56.79% and 8.89%, and 74.63% and 11.54% of the Company’s revenue, respectively.
For the three months ended December 31, 2014, one major supplier accounted for 20% of the company’s total purchases. For the three months ended December 31, 2015, two major suppliers accounted for 68% of the Company’s total purchases.
For the six months ended December 31, 2014, one major supplier accounted for 14% of the Company’s total purchases. For the six months ended December 31, 2015, two major suppliers accounted for 57% of the Company’s total purchases.
NOTE 18. COMMITMENTS AND CONTINGENCY
| (a) | Office Leases |
The Company leases three offices in Beijing (two for BHD; one for Recon-JN) and one office in Nanjing for Nanjing Recon. Future payments under such leases are as follows as of December 31, 2015:
| Twelve months ending December 31, | ||||||||
| Office lease payment | ||||||||
| RMB | U.S. Dollars | |||||||
| 2016 | ¥ | 1,010,000 | $ | 155,607 | ||||
| Total | ¥ | 1,010,000 | $ | 155,607 | ||||
(b) Contingency
The Labor Contract Law of the PRC requires employers to assure the liability of severance payments if employees are terminated and have been working for the employers for at least two years prior to January 1, 2008. The employers will be liable for one month of severance pay for each year of the service provided by the employees. As of December 31, 2015, the Company estimated its severance payments of approximately ¥1.6 million ($0.26 million) which has not been reflected in its unaudited condensed consolidated financial statements, because management cannot predict what the actual payment, if any will be in the future.
| F-22 |
RECON TECHNOLOGY, LTD
NOTES TO THE UNAUDITED CONDENSED CONSOLIDATED FINANCIAL STATEMENTS
NOTE 19. RELATED PARTY TRANSACTIONS AND BALANCES
Purchases from related parties – purchases from related parties consisted of the following:
| For the three months ended December 31, | ||||||||||||
| 2014 | 2015 | 2015 | ||||||||||
| RMB | RMB | U.S. Dollars | ||||||||||
| Huanghua Xiang Tong Manufacture | ¥ | - | ¥ | 38,469 | $ | 5,927 | ||||||
| Xiamen Huangsheng Hitek Computer Network Co.Ltd. | - | 12,796 | 1,971 | |||||||||
| Purchase from related parties | ¥ | - | ¥ | 51,265 | $ | 7,898 | ||||||
| For the six months ended December 31, | ||||||||||||
| 2014 | 2015 | 2015 | ||||||||||
| RMB | RMB | U.S. Dollars | ||||||||||
| Huanghua Xiang Tong Manufacture | ¥ | - | ¥ | 300,393 | $ | 46,281 | ||||||
| Xiamen Huangsheng Hitek Computer Network Co.Ltd. | 797,585 | 576,098 | 88,757 | |||||||||
| Purchase from related parties | ¥ | 797,585 | ¥ | 876,491 | $ | 135,038 | ||||||
Account payable due to related parties - The Company purchased automation products and heating furnaces from Xiamen Huangsheng Hitek Computer Network Co.Ltd and Huanghua Xiang Tong, the ending balance of accounts payable due to the two related parties as of December 31, 2015 and June 30, 2015 is RMB 2,736,879 ($421,662) and RMB 3,528,705, respectively.
Leases from related parties - The Company has various agreements for the lease of office space owned by the Founders and their family members. The terms of the agreement state that the Company will continue to lease the property at a monthly rent of ¥95 thousand with annual rental expense at ¥1.14 million ($0.18 million). The one-year lease agreements between Nanjing Recon and Mr. Yin and his family member started from May 10, 2015. The one-year lease agreements between BHD and Mr. Chen Guangqiang and his family member started from January 1, 2016 and the annual lease between the Company and Mr. Chen Guangqiang’s family member started from July 1, 2015.
Short-term borrowings from related parties - The Company borrowed ¥16,916,905 and ¥7,225,775($1,113,250) from the Founders and their family members as of June 30, 2015 and December 31, 2015, respectively. For the specific terms and interest rates of the borrowings, see Note 12.
Expenses paid by the owner on behalf of Recon -One owner of Nanjing Recon, Mr. Yin and the major owner of BHD, Mr. Chen paid certain operating expense for the Company. As of June 30, 2015 and December 31, 2015, ¥1,558,738 and ¥1,220,503($188,039) was due to them, respectively.
| F-23 |
RECON TECHNOLOGY, LTD
NOTES TO THE UNAUDITED CONDENSED CONSOLIDATED FINANCIAL STATEMENTS
NOTE 20. Variable Interest Entities
The Company reports its VIEs’ portion of unaudited condensed consolidated net income and stockholders’ equity as non-controlling interests in the unaudited condensed consolidated financial statements.
Summary information regarding consolidated VIEs is as follows:
| June 30, 2015 | December 31, 2015 | December 31, 2015 | ||||||||||
| RMB | RMB | U.S. Dollars | ||||||||||
| ASSETS | ||||||||||||
| Current Assets | ||||||||||||
| Cash and cash equivalents | ¥ | 7,096,901 | ¥ | 434,899 | $ | 67,003 | ||||||
| Notes receivable | 4,205,530 | 3,026,820 | 466,332 | |||||||||
| Trade accounts receivable, net | 56,956,197 | 66,958,781 | 10,316,111 | |||||||||
| Purchase advances | 19,016,573 | 12,018,393 | 1,851,633 | |||||||||
| Other assets | 28,792,279 | 25,677,395 | 3,956,029 | |||||||||
| Total current assets | ¥ | 116,067,480 | ¥ | 108,116,288 | $ | 16,657,108 | ||||||
| Non-current assets | 7,088,383 | 6,000,048 | 924,407 | |||||||||
| Total Assets | ¥ | 123,155,863 | ¥ | 114,116,336 | $ | 17,581,515 | ||||||
| LIABILITIES | ||||||||||||
| Trade accounts payable | ¥ | 17,155,793 | ¥ | 27,270,337 | $ | 4,201,448 | ||||||
| Taxes payable | 1,153,216 | 1,424,445 | 219,459 | |||||||||
| Other liabilities | 31,386,734 | 16,964,624 | 2,613,682 | |||||||||
| Total current liabilities | 49,695,743 | 45,659,406 | 7,034,589 | |||||||||
| Total Liabilities | ¥ | 49,695,743 | ¥ | 45,659,406 | $ | 7,034,589 | ||||||
The financial performance of VIEs reported in the unaudited condensed consolidated statement of operations and comprehensive income for the three months ended December 31, 2015 includes revenues of ¥28,842,430 ($4,443,655), operating expenses of ¥7,404,066 ($1,140,719), and net loss of ¥1,142,211 ($175,977).
The financial performance of VIEs reported in the unaudited condensed consolidated statement of operations and comprehensive income for the six months ended December 31, 2015 includes revenues of ¥32,436,390 ($4,997,364), operating expenses of ¥11,766,443 ($1,812,816), and net loss of ¥5,100,179 ($785,767).
| F-24 |