Attached files
| file | filename |
|---|---|
| 8-K - 8-K - Energy XXI Ltd | v431937_8k.htm |
Exhibit 99.1

Energy XXI Reports Fiscustomcal 2016 Second quarter Results and Operations Update
HOUSTON – Feb. 16, 2016 – Energy XXI (NASDAQ: EXXI) today announced financial and operating results for the three months ended December 31, 2015 (fiscal 2016 second quarter), and provided an operations update. Highlights include:
| · | Lease Operating Expenses (LOE) decreased 26 percent year-over-year |
| o | $88 million in 2Q 2016, decreased from $119 million in 2Q 2015 |
| · | Approximately $1.7 billion in face-value debt repurchased in the past seven months |
| o | Annualized interest savings of $137 million, over $6.50 per barrel of oil equivalent (BOE) |
| · | Total liquidity of approximately $391 million, as of January 31, 2016 |
| · | Oil production remains on track for mid-point of full year guidance |
| o | 2Q 2016 net liquids production averaged 37,900 barrels per day |
| o | 2Q 2016 total net production averaged 54,500 barrels of oil equivalent per day (BOE/d) |
“Our priorities during this period of challenging commodity prices are two-fold,” Energy XXI’s President and Chief Executive Officer John Schiller commented. “We are managing operations to be efficient through a disciplined capital program while also advancing our deleveraging plan. Our second quarter 2016 average daily production remained stable, despite markedly lower capital spending year over year. Over the past seven months we drastically lowered future interest expenses, resulting in annualized savings of $137 million, by repurchasing more than $1.7 billion in face value of bonds at a cost of $216 million, or a weighted average of $0.13 on the dollar. As planned, second half fiscal 2016 capital spending will be significantly lower compared to spending in the first half of the fiscal year, further preserving our liquidity and positioning Energy XXI to operate at a capital run rate that coincides with our previously announced capital guidance.”
For the fiscal 2016 second quarter, adjusted EBITDA was $50.1 million (a non-GAAP measure reconciled below), on revenue of $184.6 million. These results compare with fiscal 2015 second quarter adjusted EBITDA of $244.2 million on revenue of $503.0 million. Net loss attributable to common shareholders in the 2016 fiscal second quarter totaled $1.31 billion, or $13.81 per diluted share, compared with fiscal 2015 second quarter net loss attributable to common shareholders of $278.8 million, or $2.97 per diluted share. Net loss attributable to common shareholders in the 2016 fiscal second quarter includes a non-cash impairment charge on its oil and gas assets of $1.43 billion, or $15.00 per diluted share, primarily due to sustained lower commodity prices. Additionally, the Company recorded a gain on early extinguishment of debt of $290.3 million, or $3.05 per diluted share, resulting from bond repurchases. Excluding these items and other non-cash items, the Company’s fiscal 2016 second quarter adjusted net loss attributable to common shareholders was $183.4 million, or $1.93 per diluted share, as compared with adjusted net loss attributable to common shareholders in fiscal 2015 second quarter of $27.1 million, or $0.29 per diluted share.

Total production for the fiscal 2016 second quarter totaled 5.0 million barrels of oil equivalent (MMBOE), compared to 5.3 MMBOE in the same period last year. LOE for fiscal 2016 second quarter were $88 million compared to $119 million in the fiscal 2015 second quarter, a decrease of 26 percent year over year.
(Adjusted EBITDA and Adjusted Net Loss are non-GAAP financial measures and are defined and reconciled to the most directly comparable GAAP measure under “Non-GAAP Measures” in the tables below)
Operations Update
Total net production for the 2016 fiscal second quarter averaged 54,500 BOE/d, of which 37,900 or 70 percent was liquids. The sequential decrease in production is primarily attributable to approximately 1,700 BOE/d of uncontrollable third-party downtime on the Williams pipeline due to an accident that occurred in October 2015. The pipeline remains shut-in currently, but is anticipated to open March 2016. Fiscal 2016 third quarter total average daily production to date is approximately 50,285 BOE/d, of which 36,255 barrels are liquids.
The Company continues to reduce LOE, with $88.3 million spent in the fiscal second quarter, down seven percent sequentially, and 26 percent year-over-year. Significant cost improvements include reductions to manpower, transportation and chemicals. Direct LOE run rate is 10% lower than originally forecasted for the fiscal year and 25 percent lower year-over-year. Additionally, workover and maintenance expenses decreased 70 percent sequentially and 49 percent year-over-year. The Company anticipates additional savings throughout the fiscal year as improved efficiencies continue.
| 2 |
The recompletion program continues to deliver volumes at an attractive cost and economics. Year-to-date, the Company has executed on 13 recompletions producing more than 3,000 BOE/d. The Company continues to identify additional targets, increasing its inventory and remains committed to an additional 15 recompletion projects to be implemented by fiscal year-end.
Through the first six months of fiscal 2016, oil production has averaged 40,000 barrels per day, or 71 percent of total production. Oil production as a percentage of total production is significantly ahead of guidance. While the Company lowered the midpoint of the range for its 2016 full year total production by 3.5 percent, its projected liquids volume remains unchanged.
| Full Year 2016 | ||||
| Net Daily Production | Prior Guidance | Updated Guidance | ||
| Oil, including NGLs (Bbls) | 35,000 – 40,000 | 35,000 – 40,000 | ||
| BOE | 54,000 – 59,000 | 52,000 – 57,000 | ||
| Oil, including NGLs (using midpoint of guidance) | 66% | 70% | ||
Capital Expenditures and Liquidity
Fiscal 2016 second quarter capital expenditures (excluding acquisitions) totaled approximately $43 million, a decrease of 79 percent year-over-year. Approximately $7 million was spent on development of core properties, and $36 million on other assets, mostly attributable to plugging and abandonment costs. The Company’s projected range for fiscal 2016 full year capital expenditures remains $130 - $150 million. As of January 31, 2016 the Company had total liquidity of $391 million, including $269 million in cash and short-term investments.
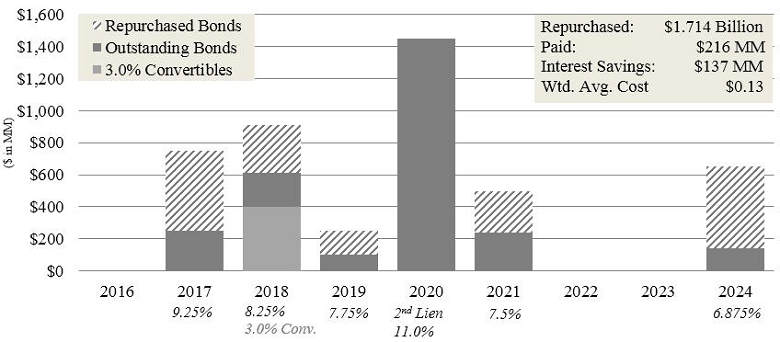
To date, the Company has repurchased and retired approximately $1.7 billion in face value of bonds, or 38% of long-term debt for savings of $137 million in annualized interest. The following debt maturity chart displays the repurchases to-date by tranche.
| 3 |
The Company continues to analyze a variety of solutions to reduce its overall financial leverage while maintaining primary focus on preserving liquidity. The Company has retained PJT Partners LP as its financial advisor and Vinson & Elkins L.L.P. as its legal advisor to assist the Board of Directors and management team with the review process. As part of these efforts, the Company is engaged with various parties to implement a plan to strengthen the Company’s balance sheet. As Energy XXI continues its discussions with these parties, the Company elected not to make an interest payment that was due on February 16, 2016, commencing a 30-day grace period. The decision not to make the interest payment does not constitute an event of default under the indenture governing EPL Oil and Gas, Inc.’s 8.25% Senior Notes due 2018 or any other debt instruments. However, if the Company does not make the interest payment or restructure the debt before the grace period expires, the holders of the notes could accelerate amounts due under the notes and could also result in default and acceleration under other debt instruments. Energy XXI expects operations to continue as normal while these discussions are ongoing.
While the Company has ample cash to make the payment in full, the Board chose to take this action as it believes it is in the best long-term interest of the Company and its stakeholders to continue to engage in discussions with its debtholders related to alternatives to improve the Company’s long-term capital structure. In light of the ongoing discussions the Company is not hosting a conference call, or webcast for investors this quarter. Additional details are available in the Company’s quarterly report on Form 10-Q, which will be filed with the Securities and Exchange Commission and will be available online at www.SEC.gov.
| 4 |
RECONCILIATION OF GAAP TO NON-GAAP MEASURES
Adjusted EBITDA is a supplemental non-GAAP financial measure that is used by management and external users of the Company’s consolidated financial statements, such as industry analysts and investors. The Company defines Adjusted EBITDA as earnings before interest expense, income taxes, depreciation, depletion, amortization, exploration expenses, gains/losses on derivatives less net cash received or paid in settlement of commodity derivatives, non-cash impairments, non-cash gain or (loss) on extinguishment of debt and other similar non-cash or non-recurring charges. Adjusted EBITDA is not a measure of net income or cash flows as determined by the United States generally accepted accounting principles, or GAAP.
Adjusted net income (loss) is a supplemental non-GAAP financial measure that is used by management and external users of our consolidated financial statements, such as industry analysts and investors. We define adjusted net income (loss) as net income (loss) before gains/losses on derivatives less net cash received or paid in settlement of commodity derivatives, non-cash impairments, non-cash gain (loss) on extinguishment of debt and other similar non-cash or non-recurring items. Adjusted net income (loss) is not a measure of net income as determined by the United States generally accepted accounting principles, or GAAP.
The following tables present a reconciliation of the GAAP financial measure net income to the non-GAAP financial measures of Adjusted EBITDA and Adjusted Net Income (Loss) for the periods presented:
| 5 |
ENERGY XXI LTD
RECONCILIATION OF GAAP TO NON-GAAP MEASURES
(In thousands, except per share information)
(Unaudited)
| Three Months Ended | ||||||||
| December 31, | ||||||||
| 2015 | 2014 | |||||||
| Net loss attributable to common shareholders | $ | (1,313,393 | ) | $ | (278,833 | ) | ||
| Total gain on commodity derivative contracts - net | (28,302 | ) | (191,462 | ) | ||||
| Cash settlements of commodity derivative contracts, net of purchased put premium amortization | 22,828 | 70,827 | ||||||
| Impairment of oil and natural gas properties | 1,425,792 | - | ||||||
| Goodwill impairment | - | 329,293 | ||||||
| Gain on early extinguishment of debt | (290,296 | ) | - | |||||
| Loss from equity method investees | - | 1,275 | ||||||
| Tax impact of adjustments to net loss attributable to common shareholders | - | 41,776 | ||||||
| Adjusted net loss attributable to common shareholders | $ | (183,371 | ) | $ | (27,124 | ) | ||
| Weighted average fully diluted shares outstanding | 95,075 | 93,993 | ||||||
| Adjusted net loss per share assuming dilution | $ | (1.93 | ) | $ | (0.29 | ) | ||
| 6 |
ENERGY XXI LTD
RECONCILIATION OF GAAP TO NON-GAAP MEASURES
(In thousands, except per share information)
(Unaudited)
| Three Months Ended | ||||||||
| December 31, | ||||||||
| 2015 | 2014 | |||||||
| Net Loss | $ | (1,310,583 | ) | $ | (275,963 | ) | ||
| Interest expense, net | 90,234 | 66,901 | ||||||
| Depreciation, depletion and amortization | 121,567 | 175,155 | ||||||
| Income tax expense | 51 | 40,358 | ||||||
| EBITDA | (1,098,731 | ) | 6,451 | |||||
| Total Gains on commodity derivative contracts – net | (28,302 | ) | (191,462 | ) | ||||
| Cash settlements of commodity derivative contracts, net of purchased put premium amortization | 22,828 | 70,827 | ||||||
| Impairment of oil and natural gas properties | 1,425,792 | - | ||||||
| Goodwill impairment | - | 329,293 | ||||||
| Gain on early extinguishment of debt | (290,296 | ) | - | |||||
| Accretion of asset retirement obligations | 15,944 | 12,798 | ||||||
| Deferred rent | 2,289 | - | ||||||
| Stock-based compensation | 604 | 853 | ||||||
| Loss from equity method investees | - | 1,275 | ||||||
| Acquisition and integration costs and disposition costs | - | 198 | ||||||
| Severance payments | - | 13,924 | ||||||
| Adjusted EBITDA | $ | 50,128 | $ | 244,157 | ||||
| Adjusted EBITDA per share | ||||||||
| Basic | $ | 0.53 | $ | 2.60 | ||||
| Diluted | $ | 0.48 | $ | 2.38 | ||||
| Weighted average number of common shares outstanding | ||||||||
| Basic | 95,075 | 93,993 | ||||||
| Diluted | 104,097 | 102,535 | ||||||
| 7 |
ENERGY XXI LTD
OPERATING HIGHLIGHTS
(Unaudited)
| Quarter Ended | ||||||||||||||||||||
| December 31, | September 30, | June 30, | March 31, | December 31, | ||||||||||||||||
| Operating Highlights | 2015 | 2015 | 2015 | 2015 | 2014 | |||||||||||||||
| (In thousands, except per unit amounts) | ||||||||||||||||||||
| Operating revenues | ||||||||||||||||||||
| Oil sales | $ | 139,698 | $ | 178,908 | $ | 225,263 | $ | 177,605 | $ | 279,708 | ||||||||||
| Natural gas sales | 16,615 | 23,485 | 23,908 | 27,012 | 31,801 | |||||||||||||||
| Gain (loss) on derivative financial instruments | 28,302 | 55,430 | (29,711 | ) | 16,963 | 191,462 | ||||||||||||||
| Total revenues | $ | 184,615 | $ | 257,823 | $ | 219,460 | $ | 221,580 | $ | 502,971 | ||||||||||
| Percentage of operating revenues from oil | ||||||||||||||||||||
| prior to gain (loss) on derivative financial instruments | 89 | % | 88 | % | 90 | % | 87 | % | 90 | % | ||||||||||
| Operating expenses | ||||||||||||||||||||
| Lease operating expense | ||||||||||||||||||||
| Insurance expense | 10,042 | 11,335 | 8,963 | 8,828 | 11,233 | |||||||||||||||
| Workover and maintenance | 6,656 | 22,028 | 12,243 | 10,773 | 13,130 | |||||||||||||||
| Direct lease operating expense | 71,660 | 61,259 | 72,268 | 88,509 | 95,003 | |||||||||||||||
| Total lease operating expense | 88,358 | 94,622 | 93,474 | 108,110 | 119,366 | |||||||||||||||
| Production taxes | 309 | 757 | 1,492 | 1,537 | 2,263 | |||||||||||||||
| Gathering and transportation | 16,778 | 14,978 | 3,459 | 3,726 | 4,771 | |||||||||||||||
| Depreciation, depletion and amortization | 121,567 | 124,024 | 183,279 | 187,947 | 175,155 | |||||||||||||||
| Accretion of asset retirement obligations | 15,944 | 14,784 | 12,358 | 12,106 | 12,798 | |||||||||||||||
| Impairment of oil and natural gas properties | 1,425,792 | 904,669 | 1,852,268 | 569,616 | - | |||||||||||||||
| Goodwill impairment | - | - | - | - | 329,293 | |||||||||||||||
| General and administrative | 29,015 | 22,189 | 25,210 | 37,121 | 27,745 | |||||||||||||||
| Total operating expenses | $ | 1,697,763 | $ | 1,176,023 | $ | 2,171,540 | $ | 920,163 | $ | 671,391 | ||||||||||
| Operating loss | $ | (1,513,148 | ) | $ | (918,200 | ) | $ | (1,952,080 | ) | $ | (698,583 | ) | $ | (168,420 | ) | |||||
| Sales volumes per day | ||||||||||||||||||||
| Natural gas (MMcf) | 99.4 | 100.4 | 103.2 | 110.4 | 96.5 | |||||||||||||||
| Oil (MBbls) | 37.9 | 42.2 | 42.0 | 41.6 | 41.8 | |||||||||||||||
| Total (MBOE) | 54.5 | 58.9 | 59.3 | 60.0 | 57.9 | |||||||||||||||
| Percent of sales volumes from oil | 70 | % | 72 | % | 71 | % | 69 | % | 72 | % | ||||||||||
| Average sales price | ||||||||||||||||||||
| Oil per Bbl | $ | 40.05 | $ | 46.11 | $ | 58.87 | $ | 47.49 | $ | 72.70 | ||||||||||
| Natural gas per Mcf | 1.82 | 2.54 | 2.55 | 2.72 | 3.58 | |||||||||||||||
| Gain (loss) on derivative financial instruments per BOE | 5.65 | 10.23 | (5.51 | ) | 3.14 | 35.94 | ||||||||||||||
| Total revenues per BOE | 36.83 | 47.57 | 40.70 | 41.06 | 94.40 | |||||||||||||||
| Operating expenses per BOE | ||||||||||||||||||||
| Lease operating expense | ||||||||||||||||||||
| Insurance expense | 2.00 | 2.09 | 1.66 | 1.64 | 2.11 | |||||||||||||||
| Workover and maintenance | 1.33 | 4.06 | 2.27 | 2.00 | 2.46 | |||||||||||||||
| Direct lease operating expense | 14.30 | 11.30 | 13.40 | 16.40 | 17.83 | |||||||||||||||
| Total lease operating expense per BOE | 17.63 | 17.45 | 17.33 | 20.04 | 22.40 | |||||||||||||||
| Production taxes | 0.06 | 0.14 | 0.28 | 0.28 | 0.42 | |||||||||||||||
| Gathering and transportation | 3.35 | 2.76 | 0.64 | 0.69 | 0.90 | |||||||||||||||
| Depreciation, depletion and amortization | 24.26 | 22.88 | 33.99 | 34.83 | 32.87 | |||||||||||||||
| Accretion of asset retirement obligations | 3.18 | 2.73 | 2.29 | 2.24 | 2.40 | |||||||||||||||
| Impairment of oil and natural gas properties | 284.48 | 166.91 | 343.52 | 105.56 | - | |||||||||||||||
| Goodwill impairment | - | - | - | - | 61.80 | |||||||||||||||
| General and administrative | 5.79 | 4.09 | 4.68 | 6.88 | 5.21 | |||||||||||||||
| Total operating expenses per BOE | $ | 338.75 | $ | 216.96 | $ | 402.73 | $ | 170.52 | $ | 126.00 | ||||||||||
| Operating loss per BOE | $ | (301.92 | ) | $ | (169.39 | ) | $ | (362.03 | ) | $ | (129.46 | ) | $ | (31.60 | ) | |||||
| 8 |
ENERGY XXI LTD
CONSOLIDATED BALANCE SHEETS
(In Thousands, except share information)
| December 31, | June 30, | |||||||
| ASSETS | 2015 | 2015 | ||||||
| Current Assets | (Unaudited) | |||||||
| Cash and cash equivalents | $ | 325,890 | $ | 756,848 | ||||
| Accounts receivable | ||||||||
| Oil and natural gas sales | 60,180 | 100,243 | ||||||
| Joint interest billings | 20,600 | 12,433 | ||||||
| Other | 22,667 | 43,513 | ||||||
| Prepaid expenses and other current assets | 33,993 | 24,298 | ||||||
| Restricted cash | 9,708 | 9,359 | ||||||
| Derivative financial instruments | 61,169 | 22,229 | ||||||
| Total Current Assets | $ | 534,207 | $ | 968,923 | ||||
| Property and Equipment | ||||||||
| Oil and natural gas properties, net - full cost method of accounting, including $63.5 million and $436.4 million of unevaluated properties not being amortized at December 31, 2015 and June 30, 2015, respectively | 1,096,466 | 3,570,759 | ||||||
| Other property and equipment, net | 19,344 | 21,820 | ||||||
| Total Property and Equipment, net of accumulated depreciation, depletion, amortization and impairment | $ | 1,115,810 | $ | 3,592,579 | ||||
| Other Assets | ||||||||
| Derivative financial instruments | - | 3,898 | ||||||
| Equity investments | - | 10,835 | ||||||
| Restricted cash | 46,024 | 32,667 | ||||||
| Other assets and debt issuance costs, net of accumulated amortization | 68,196 | 81,927 | ||||||
| Total Other Assets | $ | 114,220 | $ | 129,327 | ||||
| Total Assets | $ | 1,764,237 | $ | 4,690,829 | ||||
| LIABILITIES | ||||||||
| Current Liabilities | ||||||||
| Accounts payable | $ | 160,687 | $ | 156,339 | ||||
| Accrued liabilities | 117,847 | 155,306 | ||||||
| Asset retirement obligations | 43,136 | 33,286 | ||||||
| Derivative financial instruments | - | 2,661 | ||||||
| Current maturities of long-term debt | 873 | 11,395 | ||||||
| Total Current Liabilities | 322,543 | 358,987 | ||||||
| Long-term debt, less current maturities | 3,622,508 | 4,597,037 | ||||||
| Asset retirement obligations | 420,930 | 453,799 | ||||||
| Derivative financial instruments | - | 1,358 | ||||||
| Other liabilities | 15,319 | 8,370 | ||||||
| Total Liabilities | $ | 4,381,300 | $ | 5,419,551 | ||||
| Commitments and Contingencies | ||||||||
| Stockholders’ Deficit | ||||||||
| Preferred stock, $0.001 par value, 7,500,000 shares authorized at December 31, 2015 and June 30, 2015 | ||||||||
| 7.25% Convertible perpetual preferred stock, 3,000 shares issued and outstanding at December 31, 2015 and June 30, 2015 | - | - | ||||||
| 5.625% Convertible perpetual preferred stock, 797,759 and 812,759 shares issued and outstanding at December 31, 2015 and June 30, 2015, respectively | 1 | 1 | ||||||
| Common stock, $0.005 par value, 200,000,000 shares authorized and 95,479,050 and 94,643,498 shares issued and | ||||||||
| outstanding at December 31, 2015 and June 30, 2015, respectively | 476 | 472 | ||||||
| Additional paid-in capital | 1,845,212 | 1,843,918 | ||||||
| Accumulated deficit | (4,462,752 | ) | (2,573,113 | ) | ||||
| Total Stockholders’ Deficit | $ | (2,617,063 | ) | $ | (728,722 | ) | ||
| Total Liabilities and Stockholders’ Deficit | $ | 1,764,237 | $ | 4,690,829 | ||||
| 9 |
ENERGY XXI LTD
CONSOLIDATED STATEMENTS OF OPERATIONS
(In Thousands, except per share information)
(Unaudited)
| Three Months Ended December 31, | Six Months Ended December 31, | |||||||||||||||
| 2015 | 2014 | 2015 | 2014 | |||||||||||||
| Revenues | ||||||||||||||||
| Oil sales | $ | 139,698 | $ | 279,708 | $ | 318,606 | $ | 649,863 | ||||||||
| Natural gas sales | 16,615 | 31,801 | 40,100 | 66,362 | ||||||||||||
| Gain on derivative financial instruments | 28,302 | 191,462 | 83,732 | 248,187 | ||||||||||||
| Total Revenues | $ | 184,615 | $ | 502,971 | $ | 442,438 | $ | 964,412 | ||||||||
| Costs and Expenses | ||||||||||||||||
| Lease operating | 88,358 | 119,366 | 182,980 | 261,951 | ||||||||||||
| Production taxes | 309 | 2,263 | 1,066 | 5,356 | ||||||||||||
| Gathering and transportation | 16,778 | 4,771 | 31,756 | 13,959 | ||||||||||||
| Depreciation, depletion and amortization | 121,567 | 175,155 | 245,591 | 334,295 | ||||||||||||
| Accretion of asset retirement obligations | 15,944 | 12,798 | 30,728 | 25,617 | ||||||||||||
| Impairment of oil and natural gas properties | 1,425,792 | - | 2,330,461 | - | ||||||||||||
| Goodwill impairment | - | 329,293 | - | 329,293 | ||||||||||||
| General and administrative expense | 29,015 | 27,745 | 51,204 | 54,169 | ||||||||||||
| Total Costs and Expenses | $ | 1,697,763 | $ | 671,391 | $ | 2,873,786 | $ | 1,024,640 | ||||||||
| Operating Loss | $ | (1,513,148 | ) | $ | (168,420 | ) | $ | (2,431,348 | ) | $ | (60,228 | ) | ||||
| Other Income (Expense) | ||||||||||||||||
| Loss from equity method investees | - | (1,275 | ) | (10,746 | ) | (316 | ) | |||||||||
| Other income, net | 2,554 | 991 | 3,048 | 1,942 | ||||||||||||
| Gain on early extinguishment of debt | 290,296 | - | 748,574 | - | ||||||||||||
| Interest expense | (90,234 | ) | (66,901 | ) | (193,452 | ) | (133,164 | ) | ||||||||
| Total Other Income (Expense), net | $ | 202,616 | $ | (67,185 | ) | $ | 547,424 | $ | (131,538 | ) | ||||||
| Loss Before Income Taxes | (1,310,532 | ) | (235,605 | ) | (1,883,924 | ) | (191,766 | ) | ||||||||
| Income Tax Expense | 51 | 40,358 | 51 | 57,007 | ||||||||||||
| Net Loss | (1,310,583 | ) | (275,963 | ) | (1,883,975 | ) | (248,773 | ) | ||||||||
| Preferred Stock Dividends | 2,810 | 2,870 | 5,664 | 5,742 | ||||||||||||
| Net Loss Attributable to Common Stockholders | $ | (1,313,393 | ) | $ | (278,833 | ) | $ | (1,889,639 | ) | $ | (254,515 | ) | ||||
| Loss per Share | ||||||||||||||||
| Basic and diluted | $ | (13.81 | ) | $ | (2.97 | ) | $ | (19.91 | ) | $ | (2.71 | ) | ||||
| Weighted Average Number of Common Shares Outstanding | ||||||||||||||||
| Basic and diluted | 95,075 | 93,993 | 94,926 | 93,913 | ||||||||||||
| 10 |
ENERGY XXI LTD
CONSOLIDATED STATEMENTS OF CASH FLOWS
(In Thousands)
(Unaudited)
| Six Months Ended December 31, | ||||||||
| 2015 | 2014 | |||||||
| Cash Flows From Operating Activities | ||||||||
| Net loss | $ | (1,883,975 | ) | $ | (248,773 | ) | ||
| Adjustments to reconcile net loss to net cash provided by | ||||||||
| (used in) operating activities: | ||||||||
| Depreciation, depletion and amortization | 245,591 | 334,295 | ||||||
| Impairment of oil and natural gas properties | 2,330,461 | - | ||||||
| Goodwill impairment | - | 329,293 | ||||||
| Deferred income tax expense | - | 56,447 | ||||||
| Gain on early extinguishment of debt | (748,574 | ) | - | |||||
| Change in fair value of derivative financial instruments | (42,162 | ) | (175,731 | ) | ||||
| Accretion of asset retirement obligations | 30,728 | 25,617 | ||||||
| Loss from equity method investees | 10,746 | 316 | ||||||
| Amortization of debt issuance costs and other | 11,117 | 5,615 | ||||||
| Deferred rent | 4,577 | - | ||||||
| Stock-based compensation | 987 | 2,632-- | ||||||
| Changes in operating assets and liabilities | ||||||||
| Accounts receivable | 70,873 | 33,819 | ||||||
| Prepaid expenses and other assets | (11,001 | ) | 22,483 | |||||
| Settlement of asset retirement obligations | (53,719 | ) | (53,960 | ) | ||||
| Accounts payable and accrued liabilities | (55,573 | ) | (170,745 | ) | ||||
| Net Cash Provided by (Used in) Operating Activities | (89,924 | ) | 161,308 | |||||
| Cash Flows from Investing Activities | ||||||||
| Acquisitions, net of cash | (2,797 | ) | (287 | ) | ||||
| Capital expenditures | (75,784 | ) | (449,114 | ) | ||||
| Insurance payments received | 4,379 | - | ||||||
| Change in equity method investments | - | 12,642 | ||||||
| Transfer from (to) restricted cash | (13,355 | ) | 325 | |||||
| Proceeds from the sale of properties | 4,623 | 6,947 | ||||||
| Other | 62 | 95 | ||||||
| Net Cash Used in Investing Activities | (82,872 | ) | (429,392 | ) | ||||
| Cash Flows from Financing Activities | ||||||||
| Proceeds from the issuance of common and preferred stock, net of offering costs | 312 | 2,059 | ||||||
| Dividends to shareholders – common | - | (22,548 | ) | |||||
| Dividends to shareholders – preferred | (5,673 | ) | (5,744 | ) | ||||
| Proceeds from long-term debt | 1,121 | 1,011,948 | ||||||
| Payments on long-term debt | (225,004 | ) | (759,851 | ) | ||||
| Payment of debt assumed in acquisition | (25,187 | ) | - | |||||
| Fees related to debt extinguishment | (2,080 | ) | - | |||||
| Debt issuance costs | (632 | ) | (2,302 | ) | ||||
| Other | (1,019 | ) | - | |||||
| Net Cash Provided by (Used in) Financing Activities | (258,162 | ) | 223,562 | |||||
| Net Decrease in Cash and Cash Equivalents | (430,958 | ) | (44,522 | ) | ||||
| Cash and Cash Equivalents, beginning of period | 756,848 | 145,806 | ||||||
| Cash and Cash Equivalents, end of period | $ | 325,890 | $ | 101,284 | ||||
| 11 |
Other Information - Gain on Derivative Financial Instruments
(Unaudited)
| Three Months Ended December 31, | Six Months Ended December 31, | |||||||||||||||
| Gain (loss) on derivative financial instruments | 2015 | 2014 | 2015 | 2014 | ||||||||||||
| Cash settlements, net of purchased put premium amortization | $ | 22,828 | $ | 44,954 | $ | 41,570 | $ | 43,220 | ||||||||
| Proceeds from monetizations | - | 25,873 | - | 29,236 | ||||||||||||
| Change in fair value | 5,474 | 120,635 | 42,162 | 175,731 | ||||||||||||
| Total gain on derivative financial instruments | $ | 28,302 | $ | 191,462 | $ | 83,732 | $ | 248,187 | ||||||||
Forward-Looking Statements
All statements included in this release relating to future plans, projects, events or conditions and all other statements other than statements of historical fact included in this release are forward-looking statements within the meaning of the Private Securities Litigation Reform Act of 1995. These statements are based upon current expectations and are subject to a number of risks, uncertainties and assumptions. It is not possible to predict or identify all such factors and the following list should not be considered a complete statement of all potential risks and uncertainties. Certain risks and uncertainties include the current depressed commodity pricing environment affecting the oil and gas industry, whether Energy XXI is able to successfully restructure its indebtedness, improve its short- and long-term liquidity position or complete any strategic transactions, among others, that could cause actual results, including project plans and related expenditures and resource recoveries, to differ materially from those described in the forward-looking statements. For a more detailed discussion of risk factors, please see Item 1A, “Risk Factors” of our most recent Annual Report on Form 10-K and Part II, Item 1A of our Quarterly Report on Form 10-Q for the period ended December 31, 2015 for more information. Energy XXI assumes no obligation and expressly disclaims any duty to update the information contained herein except as required by law.
About the Company
Energy XXI is an independent oil and natural gas development and production company whose growth strategy emphasizes acquisitions, enhanced by its value-added organic drilling program. The Company’s properties are located in the U.S. Gulf of Mexico waters and the Gulf Coast onshore. To learn more, visit the Energy XXI website at www.EnergyXXI.com.
Enquiries of the Company
Greg Smith
Vice President, Investor Relations
713-351-3149
gsmith@energyxxi.com
David Griffith
Associate, Investor Relations
713-351-3176
dgriffith@energyxxi.com
| 12 |