Attached files
| file | filename |
|---|---|
| 8-K - 8-K - Multi Packaging Solutions International Ltd | d282985d8k.htm |
| EX-99.1 - EX-99.1 - Multi Packaging Solutions International Ltd | d282985dex991.htm |
Solutions that Protect and Promote the World’s Great Brands 2Q 2016 Earnings Webcast Exhibit 99.2
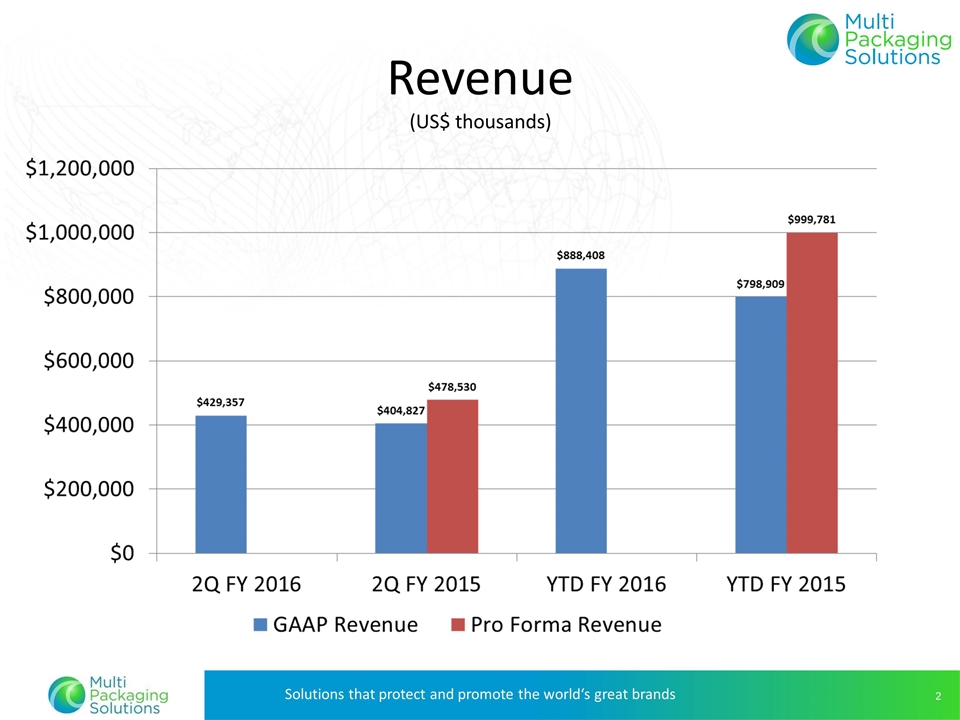
Revenue (US$ thousands)
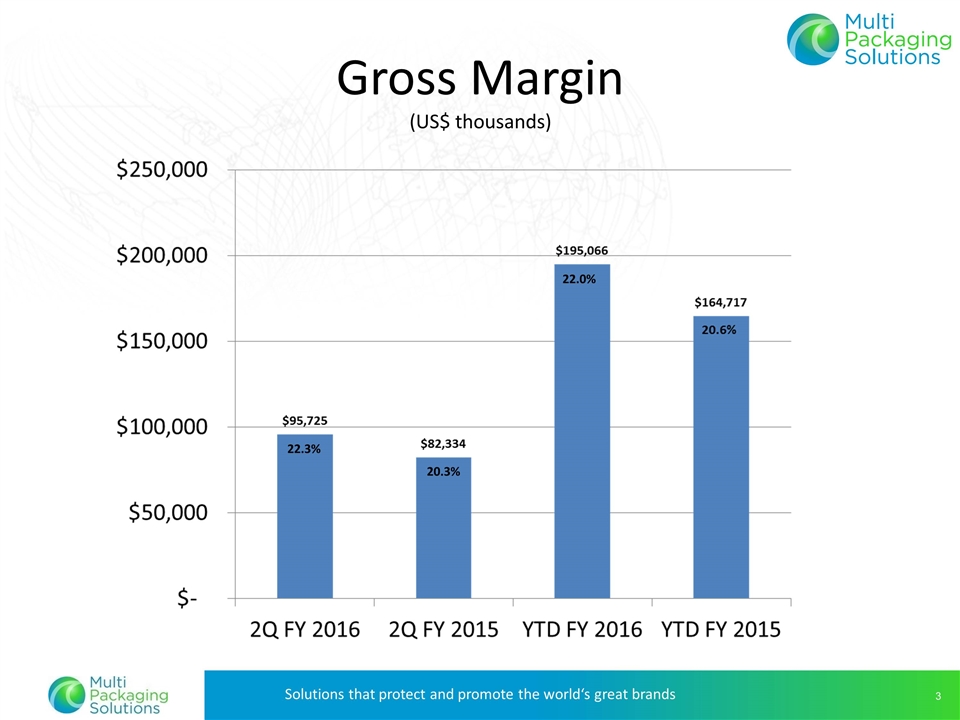
Gross Margin (US$ thousands) 20.3% 22.3% 22.0%
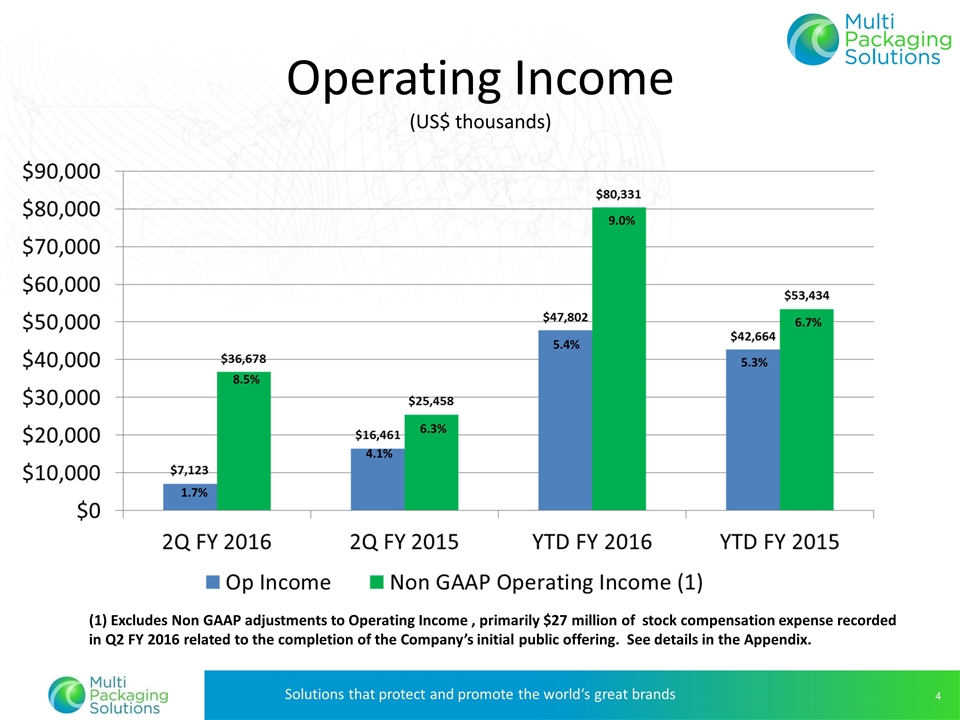
Operating Income (US$ thousands) (1) Excludes Non GAAP adjustments to Operating Income , primarily $27 million of stock compensation expense recorded in Q2 FY 2016 related to the completion of the Company’s initial public offering. See details in the Appendix. 1.7% 8.5% 4.1% 5.4% 6.3% 9.0% 6.7% 5.3%
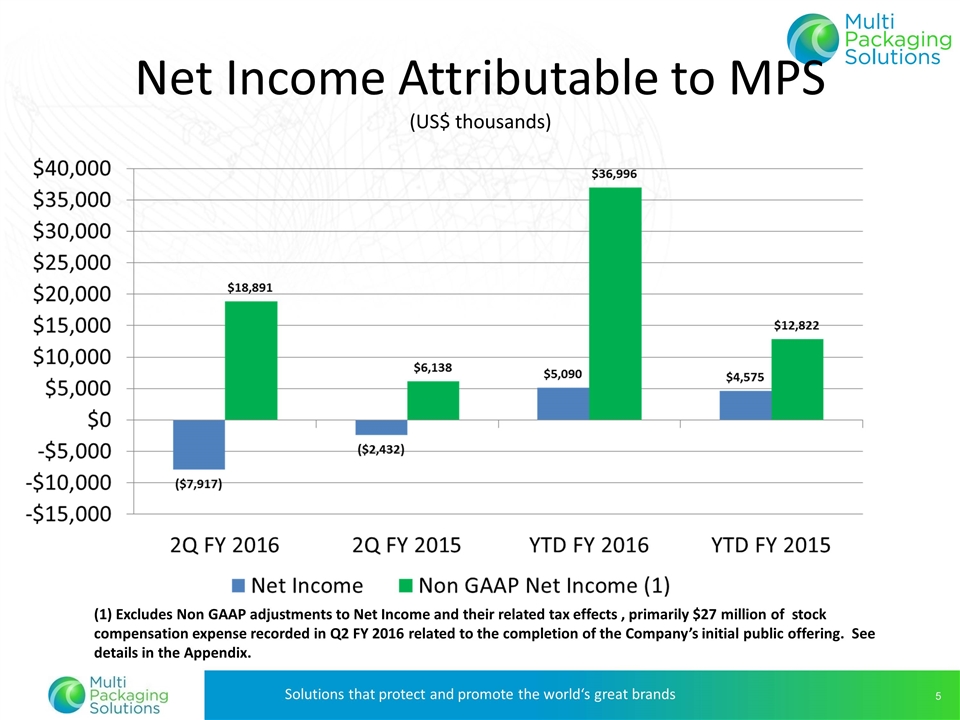
Net Income Attributable to MPS (US$ thousands) (1) Excludes Non GAAP adjustments to Net Income and their related tax effects , primarily $27 million of stock compensation expense recorded in Q2 FY 2016 related to the completion of the Company’s initial public offering. See details in the Appendix.
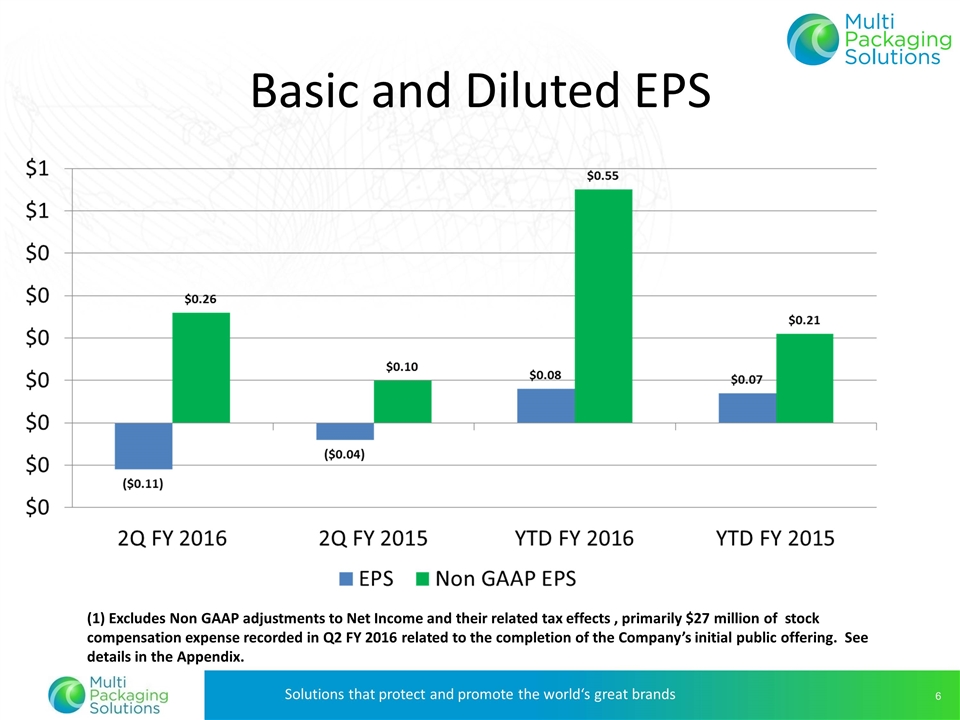
Basic and Diluted EPS (1) Excludes Non GAAP adjustments to Net Income and their related tax effects , primarily $27 million of stock compensation expense recorded in Q2 FY 2016 related to the completion of the Company’s initial public offering. See details in the Appendix.
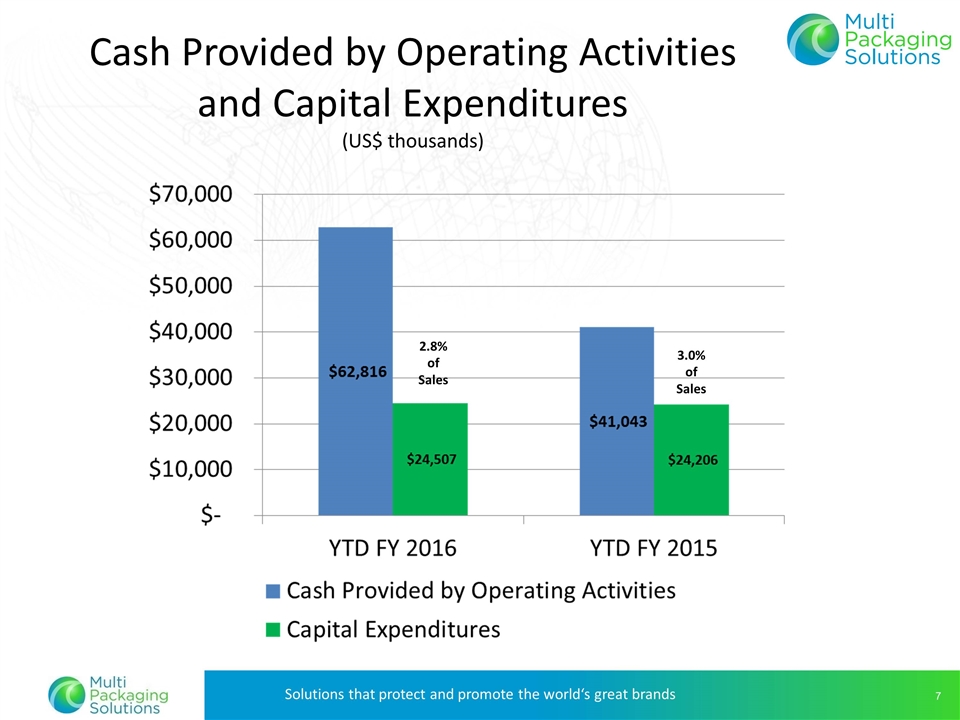
Cash Provided by Operating Activities and Capital Expenditures (US$ thousands) 2.8% of Sales 3.0% of Sales
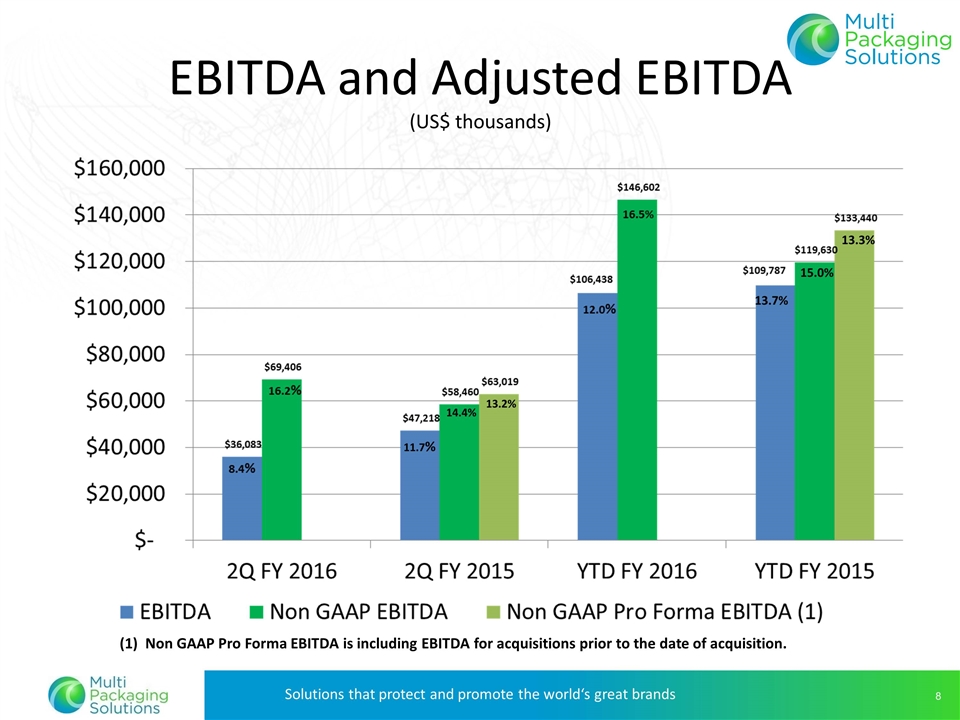
EBITDA and Adjusted EBITDA (US$ thousands) 11.7% 15.0% 14.4% 13.7% (1) Non GAAP Pro Forma EBITDA is including EBITDA for acquisitions prior to the date of acquisition. 13.3% 13.2%
Solutions that Protect and Promote the World’s Great Brands 2Q 2016 Earnings Webcast Appendix Depreciation and Amortization Non GAAP Adjusted EBITDA to Net Income Reconciliation Non GAAP Adjusted Income Reconciliation Non GAAP Pro Forma Sales Reconciliation Debt Summary
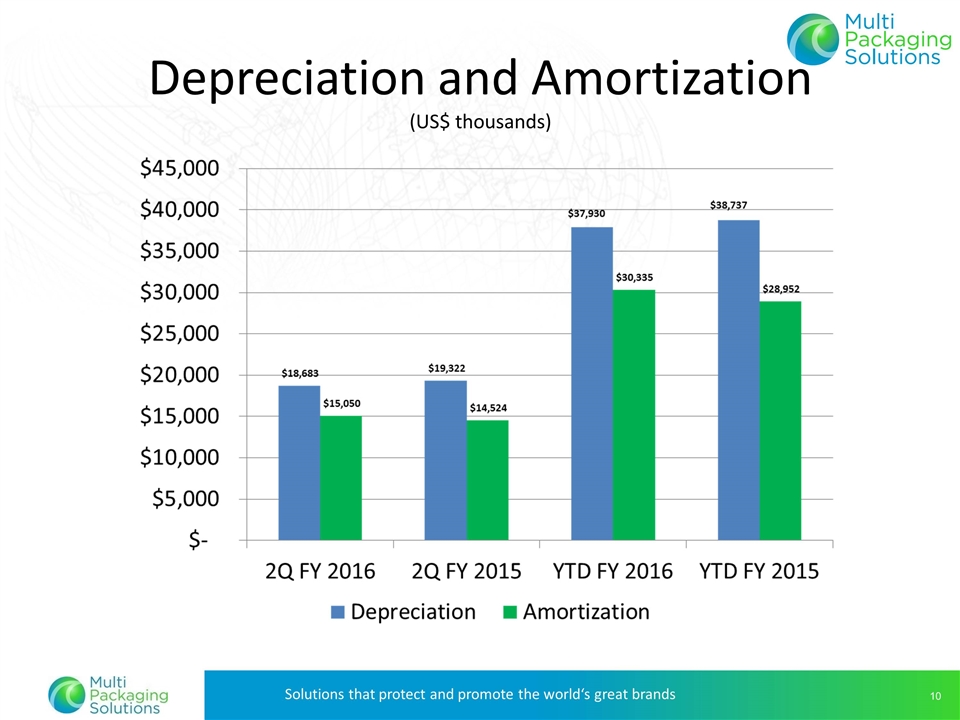
Depreciation and Amortization (US$ thousands)
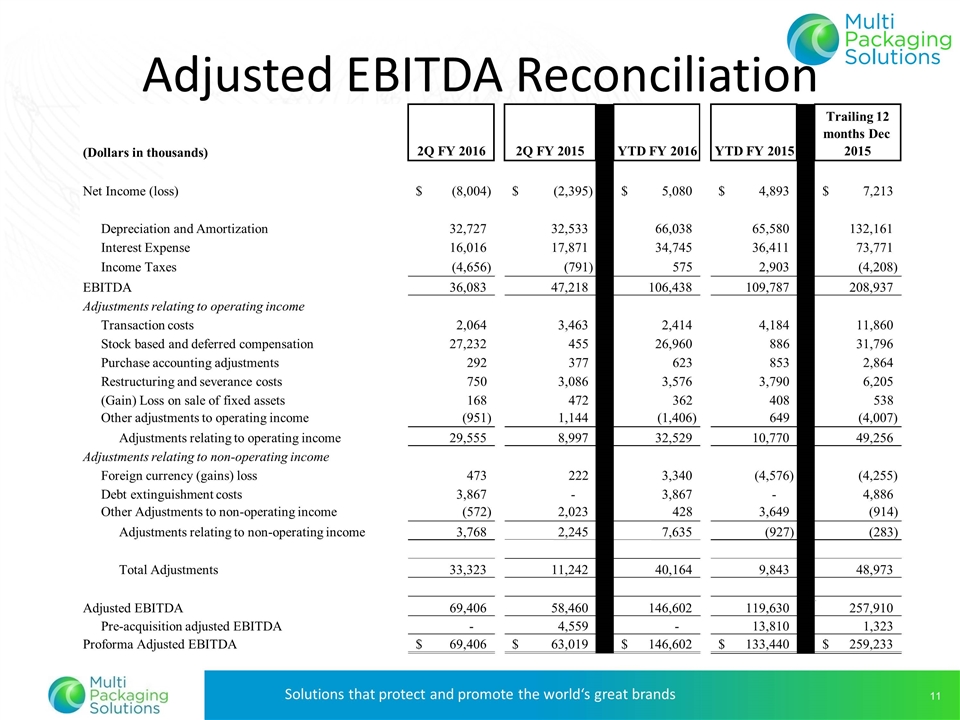
Adjusted EBITDA Reconciliation (US$ thousands) (Dollars in thousands) 2Q FY 2016 2Q FY 2015 YTD FY 2016 YTD FY 2015 Trailing 12 months Dec 2015 Net Income (loss) (8,004) $ (2,395) $ 5,080 $ 4,893 $ 7,213 $ Depreciation and Amortization 32,727 32,533 66,038 65,580 132,161 Interest Expense 16,016 17,871 34,745 36,411 73,771 Income Taxes (4,656) (791) 575 2,903 (4,208) EBITDA 36,083 47,218 106,438 109,787 208,937 Adjustments relating to operating income Transaction costs 2,064 3,463 2,414 4,184 11,860 Stock based and deferred compensation 27,232 455 26,960 886 31,796 Purchase accounting adjustments 292 377 623 853 2,864 Restructuring and severance costs 750 3,086 3,576 3,790 6,205 (Gain) Loss on sale of fixed assets 168 472 362 408 538 Other adjustments to operating income (951) 1,144 0 (1,406) 649 0 (4,007) Adjustments relating to operating income 29,555 8,997 0 32,529 10,770 0 49,256 Adjustments relating to non-operating income Foreign currency (gains) loss 473 222 3,340 (4,576) (4,255) Debt extinguishment costs 3,867 - 3,867 - 4,886 Other Adjustments to non-operating income (572) 2,023 0 428 3,649 0 (914) Adjustments relating to non-operating income 3,768 2,245 0 7,635 (927) 0 (283) Total Adjustments 33,323 11,242 0 40,164 9,843 0 48,973 Adjusted EBITDA 69,406 58,460 0 146,602 119,630 0 257,910 Pre-acquisition adjusted EBITDA - 4,559 0 - 13,810 0 1,323 Proforma Adjusted EBITDA 69,406 $ 63,019 $ 146,602 $ 133,440 $ 259,233 $
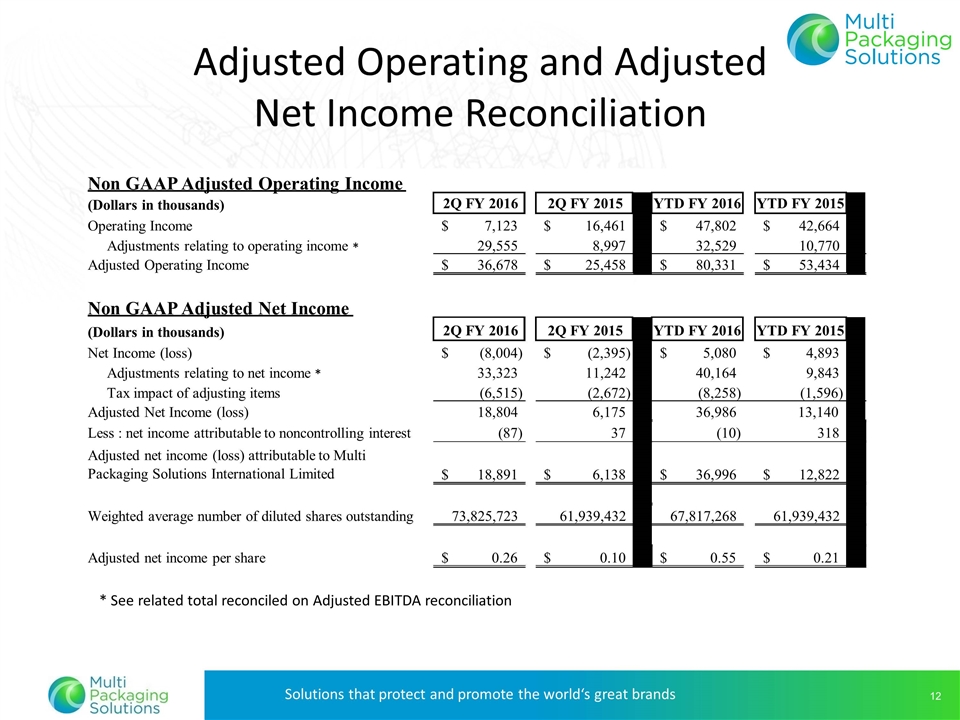
Non GAAP Adjusted Operating Income (Dollars in thousands) 2Q FY 2016 2Q FY 2015 0 YTD FY 2016 YTD FY 2015 0 Operating Income 7,123 $ 16,461 $ 47,802 $ 42,664 $ Adjustments relating to operating income 29,555 8,997 32,529 10,770 Adjusted Operating Income 36,678 $ 25,458 $ 80,331 $ 53,434 $ Non GAAP Adjusted Net Income (Dollars in thousands) 2Q FY 2016 2Q FY 2015 0 YTD FY 2016 YTD FY 2015 0 Net Income (loss) (8,004) $ (2,395) $ 0 5,080 $ 4,893 $ 0 Adjustments relating to net income 33,323 11,242 0 40,164 9,843 0 Tax impact of adjusting items (6,515) (2,672) (8,258) (1,596) Adjusted Net Income (loss) 18,804 6,175 0 36,986 13,140 0 Less : net income attributable to noncontrolling interest (87) 37 (10) 318 18,891 $ 6,138 $ 36,996 $ 12,822 $ 0 Weighted average number of diluted shares outstanding 73,825,723 61,939,432 67,817,268 61,939,432 Adjusted net income per share 0.26 $ 0.10 $ 0.55 $ 0.21 $ Adjusted net income (loss) attributable to Multi Packaging Solutions International Limited Adjusted Operating and Adjusted Net Income Reconciliation * * * See related total reconciled on Adjusted EBITDA reconciliation
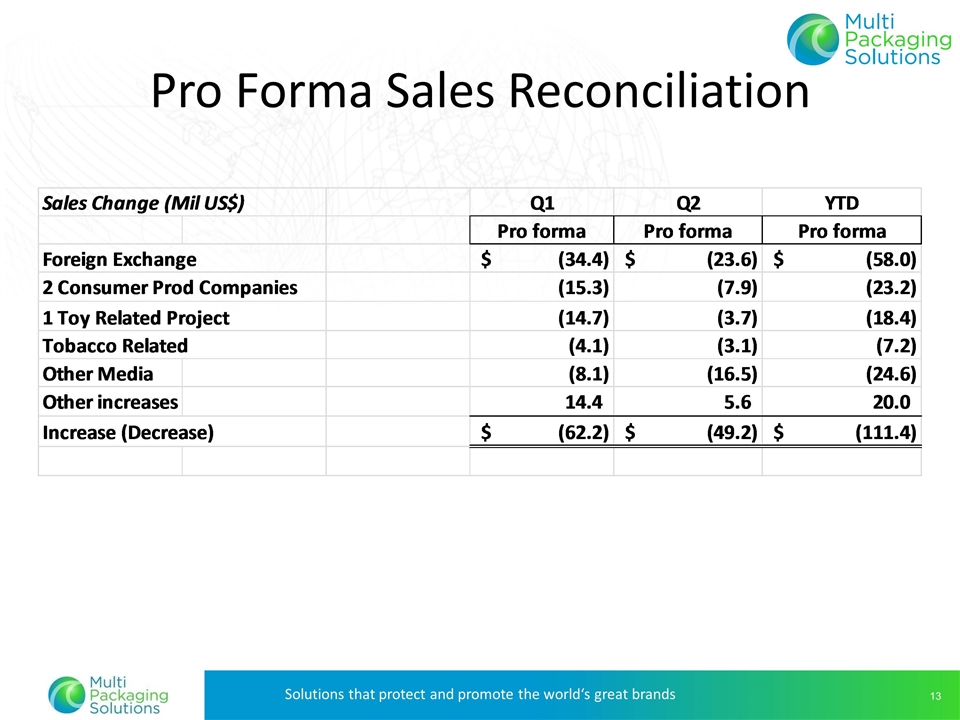
Pro Forma Sales Reconciliation
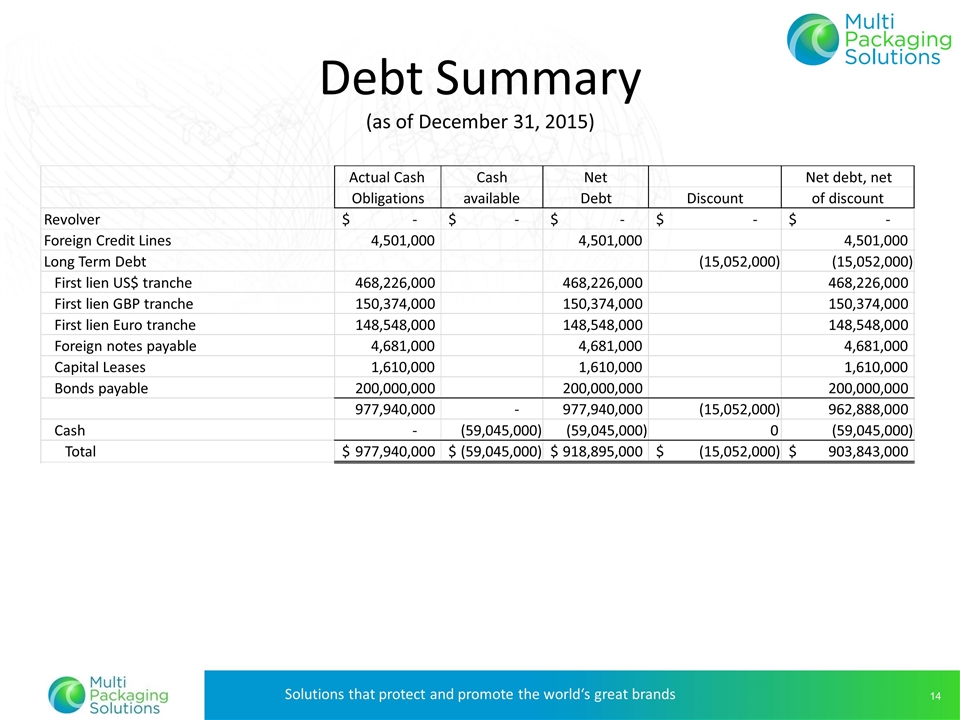
Debt Summary (as of December 31, 2015) Actual Cash Cash Net Net debt, net Obligations available Debt Discount of discount Revolver - $ - $ - $ - $ - $ Foreign Credit Lines 4,501,000 4,501,000 4,501,000 Long Term Debt (15,052,000) (15,052,000) First lien US$ tranche 468,226,000 468,226,000 468,226,000 First lien GBP tranche 150,374,000 150,374,000 150,374,000 First lien Euro tranche 148,548,000 148,548,000 148,548,000 Foreign notes payable 4,681,000 4,681,000 4,681,000 Capital Leases 1,610,000 1,610,000 1,610,000 Bonds payable 200,000,000 200,000,000 200,000,000 977,940,000 - 977,940,000 962,888,000 Cash - (59,045,000) (59,045,000) 0 (59,045,000) Total 977,940,000 $ (59,045,000) $ 918,895,000 $ (15,052,000) $ 903,843,000 $ (15,052,000)

Solutions that Protect and Promote the World’s Great Brands 2Q 2016 Earnings Webcast Thank you for your interest in Multi Packaging Solutions
