Attached files
| file | filename |
|---|---|
| 8-K - 8-K - Black Knight, Inc. | bkfs2015q48k.htm |
| EX-99.01 - EXHIBIT 99.01 - Black Knight, Inc. | bkfsq42015ex991.htm |

Black Knight Financial Services Confidential, Proprietary and/or Trade Secret TM SM ® Trademark(s) of Black Knight IP Holding Company, LLC, or an affiliate. © 2016 Black Knight Financial Technology Solutions, LLC. All Rights Reserved. 1 Black Knight Financial Services, Inc. Fourth Quarter 2015 Earnings Results February 10, 2016

Black Knight Financial Services Confidential, Proprietary and/or Trade Secret TM SM ® Trademark(s) of Black Knight IP Holding Company, LLC, or an affiliate. © 2016 Black Knight Financial Technology Solutions, LLC. All Rights Reserved. 2 Disclaimer Forward-Looking Statements This presentation contains forward-looking statements that involve a number of risks and uncertainties. Statements that are not historical facts, including statements regarding expectations, hopes, intentions or strategies regarding the future are forward-looking statements. Forward-looking statements are based on Black Knight management's beliefs, as well as assumptions made by, and information currently available to, them. Because such statements are based on expectations as to future financial and operating results and are not statements of fact, actual results may differ materially from those projected. Black Knight undertakes no obligation to update any forward-looking statements, whether as a result of new information, future events or otherwise. The risks and uncertainties that forward-looking statements are subject to include, but are not limited to: electronic security breaches against our information systems; our ability to maintain and grow our relationships with our customers; changes to the laws, rules and regulations that impact our and our customers’ businesses; our ability to adapt our services to changes in technology or the marketplace; the impact of any potential defects, development delays, installation difficulties or system failures on our business and reputation; changes in general economic, business, regulatory and political conditions, particularly as they impact the mortgage industry; risks associated with the availability of data; the effects of our substantial leverage on our ability to make acquisitions and invest in our business; risks associated with our structure and status as a “controlled company;” and other risks and uncertainties detailed in the “Cautionary Note Regarding Forward-Looking Statements,” “Risk Factors” and other sections of our Registration Statement on Form S-1 and other filings with the Securities and Exchange Commission. Non-GAAP Financial Measures This presentation contains non-GAAP and pro forma financial measures, including Adjusted Revenues, Adjusted EBITDA, Adjusted EBITDA Margin, Adjusted Net Earnings from Continuing Operations, Pro Forma Adjusted Net Earnings from Continuing Operations and Adjusted Net Earnings Per Share from Continuing Operations. These are important financial performance measures for Black Knight, but are not financial measures as defined by GAAP. The presentation of this financial information is not intended to be considered in isolation of or as a substitute for, or superior to, the financial information prepared and presented in accordance with GAAP. Black Knight uses these non-GAAP and pro forma financial performance measures for financial and operational decision making and as a means to evaluate period-to-period comparisons. Black Knight believes that they provide useful information about operating results, enhance the overall understanding of past financial performance and future prospects and allow for greater transparency with respect to key metrics used by management in its financial and operational decision making. See the Appendix for further information.

Black Knight Financial Services Confidential, Proprietary and/or Trade Secret TM SM ® Trademark(s) of Black Knight IP Holding Company, LLC, or an affiliate. © 2016 Black Knight Financial Technology Solutions, LLC. All Rights Reserved. 3 Financial Highlights Metrics Fourth Quarter Full Year Adjusted Revenues $240.0 million, +8% $940.3 million, +9% Adjusted EBITDA $107.7 million, +8% $413.5 million, +17% Adjusted EBITDA Margin 44.9%, both periods 44.0%, +300 bps Adjusted Net Earnings from Continuing Operations $40.4 million, +10% $151.4 million, +26% Adjusted Net Earnings Per Share from Continuing Operations $0.26 N/A

Black Knight Financial Services Confidential, Proprietary and/or Trade Secret TM SM ® Trademark(s) of Black Knight IP Holding Company, LLC, or an affiliate. © 2016 Black Knight Financial Technology Solutions, LLC. All Rights Reserved. 4 54.0% 55.8% Q4 2014 Q4 2015 $179 $198 Q4 2014 Q4 2015 Technology $708 $766 FY 2014 FY 2015 +180 bps Y/Y expansion +10% Y/Y growth Adjusted EBITDA Margin (%) +8% Y/Y growth +320 bps Y/Y expansion Strong loan count growth in Core Servicing Loan Origination Systems (LOS) growth in professional services and processing revenues Revenues from Closing Insight clients Contribution from revenue increase drives margin expansion Fourth Quarter Highlights Strong loan count growth in Core Servicing LOS growth in professional services and processing revenues Revenues from Closing Insight clients Contribution from revenue increase and synergy drive margin expansion Full Year Highlights Adjusted Revenues ($mm) 52.2% 55.4% FY 2014 FY 2015

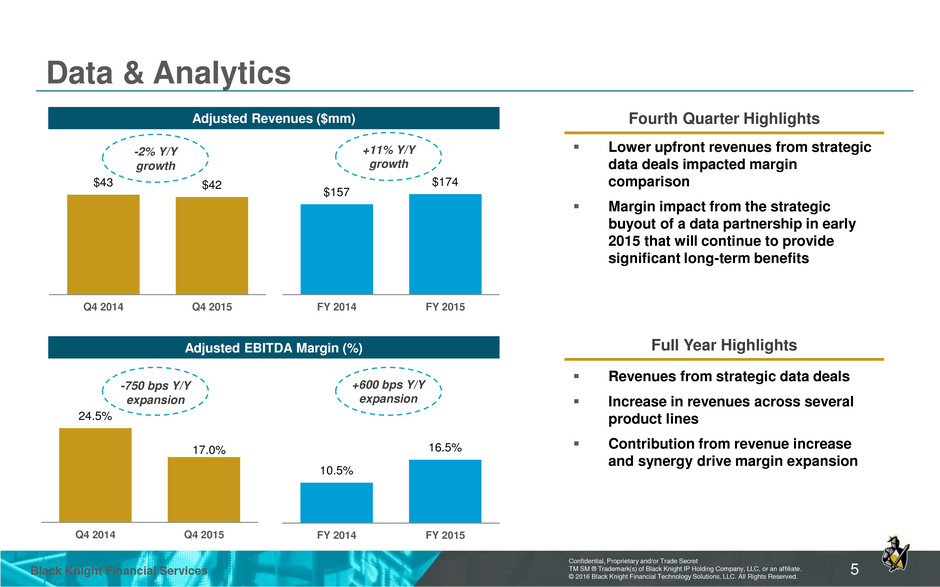
Black Knight Financial Services Confidential, Proprietary and/or Trade Secret TM SM ® Trademark(s) of Black Knight IP Holding Company, LLC, or an affiliate. © 2016 Black Knight Financial Technology Solutions, LLC. All Rights Reserved. 5 24.5% 17.0% Q4 2014 Q4 2015 10.5% 16.5% FY 2014 FY 2015 Data & Analytics -750 bps Y/Y expansion -2% Y/Y growth Adjusted EBITDA Margin (%) Adjusted Revenues ($mm) +11% Y/Y growth +600 bps Y/Y expansion Lower upfront revenues from strategic data deals impacted margin comparison Margin impact from the strategic buyout of a data partnership in early 2015 that will continue to provide significant long-term benefits Fourth Quarter Highlights Revenues from strategic data deals Increase in revenues across several product lines Contribution from revenue increase and synergy drive margin expansion $43 $42 Q4 2014 Q4 2015 $157 $174 FY 2014 FY 2015 Full Year Highlights

Black Knight Financial Services Confidential, Proprietary and/or Trade Secret TM SM ® Trademark(s) of Black Knight IP Holding Company, LLC, or an affiliate. © 2016 Black Knight Financial Technology Solutions, LLC. All Rights Reserved. 6 Capital Structure (1) Excludes unamortized bond premium, original issue discount and debt issuance costs ($ in millions) As of 12/31/15 Maturity Interest Rate Cash and Cash Equivalents $186 Revolver ($400mm) $100 2020 LIBOR + 200bps Term A Loan 780 2020 LIBOR + 200bps Term B Loan 398 2022 LIBOR + 300bps / 75bps floor Senior Notes 390 2023 5.75% Total Debt(1) $1,668 Net Debt $1,482 LTM 12/31/15 Adjusted EBITDA $414 Total Debt / LTM Adjusted EBITDA 4.0x Net Debt / LTM Adjusted EBITDA 3.6x

Black Knight Financial Services Confidential, Proprietary and/or Trade Secret TM SM ® Trademark(s) of Black Knight IP Holding Company, LLC, or an affiliate. © 2016 Black Knight Financial Technology Solutions, LLC. All Rights Reserved. 7 Full Year 2016 Financial Guidance Financial Metric Guidance Adjusted Revenues Growth + 6% to 8% Adjusted EBITDA Growth + 8% to 10% Adjusted Net Earnings Per Share from Continuing Operations $1.09 to $1.13 Full Year 2016 guidance is based upon the following estimates and assumptions: Interest expense of ~$72 million Depreciation and amortization expense of ~$109 million (excluding incremental depreciation and amortization expense resulting from purchase accounting) Fully-distributed tax rate of ~37% Diluted weighted-average shares outstanding of ~153 million shares CAPEX of $80 million to $90 million

Black Knight Financial Services Confidential, Proprietary and/or Trade Secret TM SM ® Trademark(s) of Black Knight IP Holding Company, LLC, or an affiliate. © 2016 Black Knight Financial Technology Solutions, LLC. All Rights Reserved. 8 Appendix

Black Knight Financial Services Confidential, Proprietary and/or Trade Secret TM SM ® Trademark(s) of Black Knight IP Holding Company, LLC, or an affiliate. © 2016 Black Knight Financial Technology Solutions, LLC. All Rights Reserved. 9 Non-GAAP Financial Measures Adjusted Revenues – We define Adjusted Revenues as reported revenues adjusted to include the revenues that were not recorded during the period presented due to the deferred revenue purchase accounting adjustment recorded in accordance with GAAP. Adjusted EBITDA – We define Adjusted EBITDA as operating income (loss) before depreciation and amortization, with further adjustments to reflect the addition or elimination of certain income statement items including, but not limited to (i) the deferred revenue purchase accounting adjustment recorded in accordance with GAAP; (ii) equity-based compensation; (iii) acquisition-related costs; (iv) non-recurring costs associated with the achievement of synergies; (v) charges associated with material legal and regulatory matters; (vi) member management fees paid to FNF and THL Managers LLC; (vii) exit costs, impairments and other charges; (viii) one-time costs associated with the initial public offering; and (ix) other significant, non-recurring items. Adjusted EBITDA Margin – Adjusted EBITDA Margin is calculated by dividing Adjusted EBITDA by Adjusted Revenues. Adjusted Net Earnings from Continuing Operations and Pro Forma Adjusted Net Earnings from Continuing Operations – We define Adjusted Net Earnings from Continuing Operations as earnings (loss) from continuing operations before income taxes with adjustments to reflect the addition or elimination of certain income statement items including, but not limited to, (i) adjustments to calculate Adjusted EBITDA as described above; (ii) adjustment for the net incremental depreciation and amortization adjustments associated with the application of purchase accounting; (iii) non-recurring items in other expense, net; (iv) adjustment for income tax expense at our estimated effective tax rate, excluding noncontrolling interests; and (v) assume the exchange of all the outstanding shares of our Class B common stock into shares of our Class A common stock, which eliminates the noncontrolling interests in Black Knight. For periods that include the results of operations prior to the third quarter of 2015, Pro Forma Adjusted Net Earnings from Continuing Operations would further include pro forma adjustments to present interest expense as if the amount of debt outstanding and applicable interest rates as a result of the debt refinancing were consistent for all periods. Adjusted Net Earnings Per Share from Continuing Operations – We calculate Adjusted Net Earnings Per Share from Continuing Operations using Adjusted Net Earnings from Continuing Operations and assuming the exchange of all shares of Class B common stock into shares of our Class A common stock at the beginning of the respective period, as well as the dilutive effect of any unvested restricted Class A common shares.

Black Knight Financial Services Confidential, Proprietary and/or Trade Secret TM SM ® Trademark(s) of Black Knight IP Holding Company, LLC, or an affiliate. © 2016 Black Knight Financial Technology Solutions, LLC. All Rights Reserved. 10 Non-GAAP Reconciliations: Adjusted Revenues Three Months Ended December 31, Year Ended December 31, ($ in millions) 2014 2015 2014 2015 Technology: Revenues (as reported) $ 177.0 $ 195.4 $ 695.5 $ 756.2 Deferred Revenue Adjustment 2.3 2.2 12.7 9.6 Adjusted Revenues $ 179.3 $ 197.6 $ 708.2 $ 765.8 Data and Analytics: Revenues (as reported) $ 43.2 $ 42.3 $ 156.5 $ 174.3 Deferred Revenue Adjustment 0.1 — 0.1 — Adjusted Revenues $ 43.3 $ 42.3 $ 156.6 $ 174.3 Consolidated: Revenues (as reported) $ 220.3 $ 237.8 $ 852.1 $ 930.7 Deferred Revenue Adjustment 2.4 2.2 12.8 9.6 Adjusted Revenues $ 222.7 $ 240.0 $ 864.9 $ 940.3

Black Knight Financial Services Confidential, Proprietary and/or Trade Secret TM SM ® Trademark(s) of Black Knight IP Holding Company, LLC, or an affiliate. © 2016 Black Knight Financial Technology Solutions, LLC. All Rights Reserved. 11 Non-GAAP Reconciliations: Adjusted EBITDA Three Months Ended December 31, Year Ended December 31, ($ in millions) 2014 2015 2014 2015 Operating Income (as reported) $ 41.3 $ 53.0 $ 29.1 $ 190.2 Depreciation and Amortization 48.3 50.9 188.8 194.3 Deferred Revenue Adjustment 2.4 2.2 12.8 9.6 Equity-Based Compensation 1.1 1.0 6.4 11.4 Transition and Integration Costs 8.3 - 119.3 3.6 IPO Costs - 0.6 - 4.4 Legal and Regulatory Matters (1.5) - (1.5) - Adjusted EBITDA $ 99.9 $ 107.7 $ 354.9 $ 413.5 Adjusted EBITDA Margin (%) 44.9% 44.9% 41.0% 44.0%

Black Knight Financial Services Confidential, Proprietary and/or Trade Secret TM SM ® Trademark(s) of Black Knight IP Holding Company, LLC, or an affiliate. © 2016 Black Knight Financial Technology Solutions, LLC. All Rights Reserved. 12 Non-GAAP Reconciliations: Adjusted EBITDA by Segment Three Months Ended December 31, Year Ended December 31, ($ in millions) 2014 2015 2014 2015 Technology: Operating Income (as reported) $ 50.3 $ 61.8 $ 182.3 $ 238.4 Depreciation and Amortization 43.9 46.2 171.3 176.4 Deferred Revenue Adjustment 2.3 2.2 12.7 9.6 Transition and Integration Costs 0.3 — 3.7 — Adjusted EBITDA $ 96.8 $ 110.2 $ 370.0 $ 424.4 Adjusted EBITDA Margin (%) 54.0% 55.8% 52.2% 55.4% Data and Analytics: Operating Income (as reported) $ 6.5 $ 3.5 $ 1.7 $ 14.9 Depreciation and Amortization 3.6 3.7 13.7 13.9 Deferred Revenue Adjustment 0.1 — 0.1 — Transition and Integration Costs 0.4 — 0.9 — Adjusted EBITDA $ 10.6 $ 7.2 $ 16.4 $ 28.8 Adjusted EBITDA Margin (%) 24.5% 17.0% 10.5% 16.5%

Black Knight Financial Services Confidential, Proprietary and/or Trade Secret TM SM ® Trademark(s) of Black Knight IP Holding Company, LLC, or an affiliate. © 2016 Black Knight Financial Technology Solutions, LLC. All Rights Reserved. 13 Non-GAAP Reconciliations: Adjusted Net Earnings from Continuing Operations and Pro Forma Adjusted Net Earnings from Continuing Operations Three Months Ended December 31, Year Ended December 31, ($ in millions, except per share) 2014 2015 2014 2015 Net Earnings (Loss) from Continuing Operations (as reported) $ 8.2 $ 30.1 $ (106.3) $ 82.4 Depreciation and Amortization Adjustment 24.2 23.8 93.8 90.3 Deferred Revenue Adjustment 2.4 2.2 12.8 9.6 Equity-Based Compensation 1.1 1.0 6.4 11.4 Transition and Integration Costs 7.8 - 129.8 3.6 IPO Costs - 0.6 - 9.2 Interest Expense Adjustment 15.3 - 63.1 23.3 Income Tax Adjustment (22.3) (17.3) (79.1) (78.4) Pro Forma Adjusted Net Earnings from Continuing Operations / Adjusted Net Earnings from Continuing Operations $ 36.7 $40.4 $ 120.5 $ 151.4 Adjusted Net Earnings Per Share from Continuing Operations $ 0.26 Weighted Average Adjusted Shares Outstanding 152.7
