Attached files
| file | filename |
|---|---|
| EX-32.1 - EXHIBIT 32.1 - Black Knight, Inc. | bkfsexhibit32110-kx2016.htm |
| EX-99.1 - EXHIBIT 99.1 - Black Knight, Inc. | ex991lps1114predecessor-20.htm |
| EX-32.2 - EXHIBIT 32.2 - Black Knight, Inc. | bkfsexhibit32210-kx2016.htm |
| EX-31.2 - EXHIBIT 31.2 - Black Knight, Inc. | bkfsexhibit31210-kx2016.htm |
| EX-31.1 - EXHIBIT 31.1 - Black Knight, Inc. | bkfsexhibit31110-kx2016.htm |
| EX-23.1 - EXHIBIT 23.1 - Black Knight, Inc. | bkfsexhibit231-2016.htm |
| EX-21.1 - EXHIBIT 21.1 - Black Knight, Inc. | bkfsex211-2016.htm |
| EX-10.41 - EXHIBIT 10.41 - Black Knight, Inc. | bkfsexhibit1041.htm |
| EX-10.40 - EXHIBIT 10.40 - Black Knight, Inc. | bkfsexhibit1040.htm |
Washington, D.C. 20549
Form 10-K
(Mark One) | |
þ | ANNUAL REPORT PURSUANT TO SECTION 13 OR 15(d) OF THE SECURITIES EXCHANGE ACT OF 1934 |
For the Fiscal Year Ended December 31, 2016 | |
or
o | TRANSITION REPORT PURSUANT TO SECTION 13 OR 15(d) OF THE SECURITIES EXCHANGE ACT OF 1934 |
_________________________________
Black Knight Financial Services, Inc.
(Exact name of registrant as specified in its charter)
Delaware | 36-4798491 | |
(State or other jurisdiction of incorporation or organization) | (I.R.S. Employer Identification No.) | |
601 Riverside Avenue Jacksonville, Florida 32204 (Address of principal executive offices, including zip code) | (904) 854-5100 (Registrant’s telephone number, including area code) | |
Securities registered pursuant to Section 12(b) of the Act:
Title of Each Class | Name of Each Exchange on Which Registered | |
Common Stock, $0.0001 par value | New York Stock Exchange | |
Securities registered pursuant to Section 12(g) of the Act: None
Indicate by check mark if the registrant is a well-known seasoned issuer, as defined in Rule 405 of the Securities Act. Yes þ No o
Indicate by check mark if the registrant is not required to file reports pursuant to Section 13 or Section 15(d) of the Act. Yes o No þ
Indicate by check mark whether the registrant (1) has filed all reports required to be filed by Section 13 or 15(d) of the Securities Exchange Act of 1934 during the preceding 12 months (or for such shorter period that the registrant was required to file such reports), and (2) has been subject to such filing requirements for the past 90 days. Yes þ No o
Indicate by check mark whether the registrant has submitted electronically and posted on its corporate Web site, if any, every Interactive Data File required to be submitted and posted pursuant to Rule 405 of Regulation S-T (§ 232.405 of this chapter) during the preceding 12 months (or for such shorter period that the registrant was required to submit and post such files). Yes þ No o
Indicate by check mark if disclosure of delinquent filers pursuant to Item 405 of Regulation S-K (§ 229.405) is not contained herein, and will not be contained, to the best of registrant's knowledge, in definitive proxy or information statements incorporated by reference in Part III of this Form 10-K, or any amendment to this Form 10-K. þ
Indicate by check mark whether the registrant is a large accelerated filer, an accelerated filer, a non-accelerated filer, or a smaller reporting company. See the definitions of "large accelerated filer," "accelerated filer" and "smaller reporting company" in Rule 12b-2 of the Exchange Act. (Check one):
Large accelerated filer þ | Accelerated filer o | Non-accelerated filer o (Do not check if a smaller reporting company) | Smaller reporting company o | |||
Indicate by check mark whether the registrant is a shell company (as defined in Rule 12b-2 of the Exchange Act). Yes o No þ
The aggregate market value of the shares of our Class A common stock held by non-affiliates of the registrant as of June 30, 2016 was $755,684,386 based on the closing price of $37.60 as reported by the New York Stock Exchange.
As of February 23, 2017, there were 69,975,662 shares of Class A common stock outstanding and 84,826,282 shares of Class B common stock outstanding.
The information in Part III hereof for the fiscal year ended December 31, 2016, will be filed within 120 days after the close of the fiscal year that is the subject of this Report.
BLACK KNIGHT FINANCIAL SERVICES, INC.
FORM 10-K
TABLE OF CONTENTS
Page Number | ||
i
Part I
Item 1. | Business |
Overview
Black Knight Financial Services, Inc. ("Black Knight," the "Company," "we," "us"or "our") is a holding company that conducts business through our interest in Black Knight Financial Services, LLC ("BKFS LLC"). Through its subsidiaries, BKFS LLC is a leading provider of integrated technology, workflow automation, data and analytics to the mortgage and real estate industries. Our solutions facilitate and automate many of the mission-critical business processes across the entire mortgage loan life cycle, from origination until asset disposition. We believe we differentiate ourselves by the breadth and depth of our comprehensive, integrated solutions and the insight we provide to our clients.
We have market-leading positions in mortgage processing and technology solutions combined with comprehensive real estate data and extensive analytic capabilities. Our solutions are utilized by U.S. mortgage originators and mortgage servicers, as well as other financial institutions, investors and real estate professionals, to support mortgage lending and servicing operations, analyze portfolios and properties, operate more efficiently, meet regulatory compliance requirements and mitigate risk.
The U.S. mortgage market is undergoing significant change, and mortgage market participants have been subjected to more stringent oversight in recent years. Regulators have increasingly focused on better disclosure, improved risk mitigation and enhanced oversight. Mortgage lenders large and small have experienced higher costs in order to comply with this higher level of regulation. Despite these new regulatory requirements, the mortgage industry remains a competitive marketplace with numerous large lenders and smaller institutions competing for new loan originations. In order to comply with the increased regulatory requirements and compete more effectively, mortgage market participants have continued to outsource mission-critical functions to third party technology providers that can offer comprehensive and integrated solutions, which are also cost-effective, due to their deep domain expertise and economies of scale.
We believe our comprehensive end-to-end, integrated solutions differentiate us from other technology providers serving the mortgage industry and position us particularly well for evolving opportunities in this market. We have served the mortgage and real estate industries for over 50 years and utilize this experience to design and develop solutions that fit our clients' ever-evolving needs. Our proprietary technology platforms and data and analytics capabilities reduce manual processes, improve compliance and quality, mitigate risk and deliver significant cost savings to our clients. Our scale allows us to continually and cost-effectively invest in our business in order to meet evolving industry requirements and maintain our position as an industry-standard platform for mortgage market participants. We had 32.0 million and 30.7 million active loans on our mortgage servicing platform ("MSP") as of December 31, 2016 and 2015, respectively. Based on the total number of U.S. first lien mortgages outstanding as of December 31, 2016, according to the Black Knight Mortgage Monitor Report, our proprietary technology platform is used to service approximately 61% of all U.S. first lien mortgages, reflecting our leadership in the mortgage servicing technology market.
Our business is organized into two segments:
Technology – offers software and hosting solutions that support loan servicing, loan origination and settlement services.
Data and Analytics – offers data and analytics solutions to the mortgage, real estate and capital markets industries. These solutions include property ownership data, lien data, servicing data, automated valuation models, collateral risk scores, prepayment and default models, lead generation and other data solutions.
We offer our solutions to a wide range of clients across the mortgage and real estate industries. The quality and breadth of our solutions contributes to the long-standing nature of our relationships with our clients, the majority of whom enter into long-term contracts across multiple products that are embedded in their mission critical workflow and decision processes. Given the contractual nature of our revenues and stickiness of our client relationships, our revenues are highly visible and recurring in nature. Due to our integrated suite of solutions and our scale in the mortgage market, we are able to drive significant operating leverage, which we believe enables our clients to operate more efficiently while allowing us to generate strong margins and cash flow.
Our History
We are a majority-owned subsidiary of Fidelity National Financial, Inc. ("FNF"). Our business generally represents a reorganization of the former Technology, Data and Analytics segment of Lender Processing Services, Inc. ("LPS"), a former provider of integrated technology, data and services to the mortgage lending industry in the United States that FNF acquired in January 2014. Our business also includes the businesses of Fidelity National Commerce Velocity, LLC ("Commerce Velocity") and Property Insight, LLC ("Property Insight"), two companies that were contributed to us by FNF. ServiceLink Holdings, LLC, ("ServiceLink"), another majority-owned subsidiary of FNF, operates the Transaction Services businesses of the former LPS as well as FNF's legacy ServiceLink businesses.
1
Acquisition of LPS by FNF and Subsequent Reorganization
On January 2, 2014, FNF acquired LPS (the "Acquisition") and as a result, LPS became an indirect, wholly-owned subsidiary of FNF. Upon the closing of the Acquisition, the shares of LPS common stock, which previously traded under the ticker symbol "LPS" on the New York Stock Exchange ("NYSE"), ceased trading on, and were delisted from, the NYSE.
Following the Acquisition, on January 3, 2014, a series of transactions were effected (the "Internal Reorganization"), pursuant to which (i) LPS was converted into a limited liability company and renamed Black Knight InfoServ, LLC ("BKIS"), a Delaware limited liability company; (ii) the former Transaction Services businesses of LPS were transferred by BKIS to Black Knight Holdings, Inc. ("BKHI"), a Delaware corporation and wholly-owned subsidiary of FNF, and contributed by BKHI to another of its then wholly-owned subsidiaries, ServiceLink, a Delaware limited liability company; (iii) BKFS LLC acquired all of the membership interests of BKIS; and (iv) all of the outstanding membership interests of Commerce Velocity were contributed by BKHI to BKFS LLC.
As a result of the Internal Reorganization, BKFS LLC owns substantially all of the former Technology, Data and Analytics segment of LPS and Commerce Velocity. BKFS LLC did not acquire the former Transaction Services segment of LPS.
Following the Internal Reorganization, BKFS LLC issued, in the aggregate, 35.0% of the membership interests ("Units") of BKFS LLC, to (i) certain affiliates of Thomas H. Lee Partners, L.P. ("THL"), a Delaware limited partnership, ("THL Affiliates") and (ii) THL Black Knight I Holding Corp. and THL Investors Black Knight I Holding Corp. (together, the "THL Intermediaries"), each of which is a Delaware corporation and an affiliate of THL, formed for the purpose of holding investments in BKFS LLC.
Following the Internal Reorganization and the subsequent issuance of Units to THL, BKFS LLC was majority owned by FNF through its wholly-owned subsidiary, BKHI, and certain affiliates of FNF and BKHI, and minority owned by THL through the THL Affiliates and THL Intermediaries.
Contribution of Property Insight
On June 2, 2014, as part of an additional internal reorganization, two wholly-owned subsidiaries of FNF contributed to BKFS LLC their respective interests in Property Insight, which provides property information used by title insurance underwriters, title agents and closing attorneys to underwrite title insurance policies for real property sales and transfers. As a result, BKFS LLC is the sole member of Property Insight. In connection with the Property Insight contribution, BKFS LLC issued an additional 6.4 million Units to certain affiliates of BKHI. As a result of this issuance, THL Affiliates' and THL Intermediaries' combined percentage ownership in BKFS LLC was reduced from 35.0% to 32.9%, and FNF's percentage of beneficial ownership of BKFS LLC increased from 65.0% to 67.1%.
Initial Public Offering
On May 26, 2015, we completed our initial public offering ("IPO") in which we issued and sold 20,700,000 shares of our Class A common stock at a price of $24.50 per share. In connection with our IPO, we effected several reorganization transactions (the "Offering Reorganization"). See Note 1 to the Notes to Consolidated Financial Statements for a more detailed discussion of the IPO.
2016 Acquisitions
On May 16, 2016, Black Knight completed its acquisition of eLynx Holdings, Inc. ("eLynx"), a leading lending document and data delivery platform now known as eLending. eLending helps clients in the financial services and real estate industries electronically capture and manage documents and associated data throughout the document lifecycle. Black Knight purchased eLynx to augment its origination technologies. This acquisition positions Black Knight to electronically support the full mortgage origination process.
On June 22, 2016, Black Knight completed its acquisition of Motivity Solutions, Inc. ("Motivity"), which provides customized mortgage business intelligence software solutions. Motivity will be integrated with Black Knight's LoanSphere product suite, including the LoanSphere Data Hub, to provide clients with deeper insights into their origination and servicing operations and portfolios.
Planned Distribution of FNF's Ownership Interest
On December 7, 2016, we announced that FNF's Board of Directors approved a tax-free plan (the "Distribution Plan") whereby FNF intends to distribute all 83.3 million shares of Black Knight common stock that it currently owns to FNF Group shareholders. We plan to effectuate the Distribution Plan through four newly-formed corporations, New BKH Corp. ("New BKH"), Black Knight Holdco Corp. ("New Black Knight"), New BKH Merger Sub, Inc. ("Merger Sub One") and BKFS Merger Sub, Inc. ("Merger Sub Two"). BKHI will contribute its shares of Black Knight Class B common stock and its Units of BKFS LLC to New BKH in exchange for 100% of the shares of New BKH common stock, following which BKHI will distribute to FNF all of the shares of New BKH common stock held by BKHI. Immediately thereafter, FNF will distribute the shares of New BKH common stock to its shareholders, provided that such distribution shall be subject to the conversion of such shares of New BKH common stock into
2
shares of New Black Knight common stock. Immediately following the spin-off, Merger Sub One will merge with and into New BKH (the "New BKH merger"). In the New BKH merger, each outstanding share of New BKH common stock (other than shares owned by New BKH) will be exchanged for one share of New Black Knight common stock. Immediately following the New BKH merger, Merger Sub Two will merge with and into Black Knight (the "BKFS merger"). In the BKFS merger, each outstanding share of Black Knight common stock (other than shares owned by Black Knight and New BKH) will be exchanged for one share of New Black Knight common stock. New Black Knight will be the public company following the completion of the distribution and mergers.
The Distribution Plan is subject to the receipt of private letter rulings from the Internal Revenue Service ("IRS"), approving the tax-free spin-off of the Black Knight shares; filing and acceptance of a registration statement for the Black Knight spin-off with the Securities and Exchange Commission ("SEC"); refinancing of BKIS's 5.75% senior notes due 2023 (the "Senior Notes"), which are subject to FNF's guarantee, on reasonable terms; Black Knight shareholder approval; and other customary closing conditions. The closing of the tax-free distribution is expected by the third quarter of 2017.
Realignment of Property Insight
Effective January 1, 2017, Property Insight realigned its commercial relationship with FNF. In connection with the realignment, Property Insight employees responsible for title plant posting and maintenance were transferred to FNF. Under the new commercial arrangement, Black Knight will continue to own the title plant technology and retain sales responsibility for third parties, other than FNF. As a result of the realignment, Black Knight will no longer recognize revenue or expense related to title plant posting and maintenance, but will charge FNF a license fee for use of the technology to access and maintain the title plant data. Had the realignment taken place on January 1, 2016, Black Knight's 2016 revenues and expenses would have been lower by approximately $31 million with essentially no effect to operating income. This transaction will not result in any gain or loss.
Our Corporate Structure
Black Knight conducts its business through BKFS LLC and its subsidiaries. We have a sole managing member interest in BKFS LLC, which grants us the exclusive authority to manage, control and operate the business and affairs of BKFS LLC and its subsidiaries, pursuant to the terms of its Second Amended and Restated Limited Liability Company Agreement ("LLC Agreement"). Under the terms of the LLC Agreement, we are authorized to manage the business of BKFS LLC, including enter into contracts, manage bank accounts, hire employees and agents, incur and pay debts and expenses, merge or consolidate with other entities and pay taxes. We consolidate BKFS LLC in our consolidated financial statements and report noncontrolling interests related to the Units in BKFS LLC held by BKHI and certain THL Affiliates. Shareholders of Black Knight indirectly control BKFS LLC through our managing member interest.
FNF, through BKHI, and certain THL Affiliates hold Units and a number of shares of our Class B common stock equal to the number of Units held by each such owner. These owners have the right to exchange their Units, together with the corresponding shares of our Class B common stock, which will be canceled in connection with an exchange, for cash from BKFS LLC or, at our option, shares of our Class A common stock pursuant to the terms of the LLC Agreement.
Our corporate structure, as described above, is commonly referred to as an "Up-C" structure, which is often used by partnerships and limited liability companies when they undertake an initial public offering. Our Up-C structure allows the owners of BKFS LLC to realize tax benefits associated with ownership interests in an entity that is treated as a partnership, or "passthrough" entity, for income tax purposes. These benefits include limiting entity level corporate taxes. Because Units are exchangeable for cash from BKFS LLC or, at our option, shares of our Class A common stock, the Up-C structure also provides the owners of BKFS LLC potential liquidity that holders of privately held limited liability companies are not typically afforded. The owners of BKFS LLC also have voting rights in Black Knight equal to those of holders of our Class A common stock through their ownership of shares of our Class B common stock. Black Knight also holds Units and receives the same benefits as the other holders of Units on account of its ownership in an entity treated as a partnership, or passthrough entity, for income tax purposes. Meanwhile, holders of our Class A common stock have economic and voting rights similar to those of holders of common stock of non-Up-C structured public companies.
Generally, we receive a pro-rata share of any distributions made by BKFS LLC to its members, which include us, BKHI and certain THL Affiliates. However, pursuant to the LLC Agreement, BKFS LLC is required to make tax distributions to help each of the holders of the Units pay taxes according to such holder's allocable share of taxable income rather than on a pro-rata basis. Additionally, tax distributions are required to be made based upon an assumed tax rate, and, under certain circumstances, BKFS LLC may make tax distributions that, in the aggregate, exceed the amount of taxes that BKFS LLC would have paid if it were a similarly situated corporate taxpayer. Funds used by BKFS LLC to satisfy its tax distribution obligations are not available for reinvestment in our business. See "Risk Factors-Risks Related to Our Structure."
Black Knight is a holding company and its sole asset is its interest in BKFS LLC. Black Knight, through our sole managing member interest, has 100% of the voting power in BKFS LLC and, through our ownership of Units, we had 44.5% of the economic
3
interests in BKFS LLC immediately following the IPO. Investors in Black Knight hold an indirect interest in BKFS LLC through us.
Our Industry
The U.S. mortgage market is large, and the loan life cycle is complex and consists of several stages. The mortgage loan life cycle includes origination, servicing and default. Mortgages are originated to finance home purchases or refinance existing mortgages. Once a mortgage is originated, it is serviced on a periodic basis by mortgage servicers, which may not be the lenders that originated the mortgage. Furthermore, if a mortgage experiences default, it triggers a set of multifaceted processes with an assortment of potential outcomes depending on a mix of variables.
Underlying the three major components of the mortgage loan life cycle are the technology, data and analytics support behind each process, which has become increasingly critical to industry participants due to the complexity of regulatory requirements. As the industry has grown in complexity, participants have responded by outsourcing to large scale specialty providers, automating manual processes and seeking end-to-end solutions that support the processes required to manage the entire mortgage loan life cycle.
Overview of the Mortgage Servicing Market
The U.S. mortgage servicing market is comprised of first and second lien mortgage loans. As of December 31, 2016, the first lien mortgage market represents 50.9 million mortgage loans according to the Black Knight Mortgage Monitor Report. As of December 31, 2016, the second lien mortgage market represents 14.8 million mortgage loans according to the February 2017 Equifax National Consumer Credit Trends Report. Even through housing downturns, the mortgage servicing market generally remains stable, as the total number of first lien mortgage loans outstanding tends to stay more constant than mortgage originations. The number of second lien mortgage loans outstanding can vary based on a number of factors including loan-to-value ratios, interest rates and lenders' desire to own such loans.
While delinquent mortgages typically represent a small portion of the overall loan servicing market, the mortgage default process is long and complex and involves multiple parties, a significant exchange of data and documentation and extensive regulatory requirements. Providers in the default process must be able to meet strict regulatory guidelines, which we believe are best met through the use of technology.
Overview of the Mortgage Origination Market
The U.S. mortgage origination market consists of both purchase and refinance originations. The mortgage origination process is complex and involves multiple parties, significant data exchange and significant regulatory oversight, which requires scale and substantial industry experience. According to the Mortgage Bankers Association Mortgage Finance Forecast as of February 15, 2017 (for 2017 and 2016) and January 19, 2017 (for 2015), the U.S. mortgage origination market for purchase and refinance originations by year is estimated as follows (in billions):
2017 | 2016 | 2015 | |||||||||
Mortgage Originations: | |||||||||||
Purchase | $ | 1,092.0 | $ | 990.0 | $ | 903.0 | |||||
Refinance | 479.0 | 901.0 | 776.0 | ||||||||
Total | $ | 1,571.0 | $ | 1,891.0 | $ | 1,679.0 | |||||
Recent Trends in the Mortgage Industry
The U.S. mortgage market has seen significant change over the past few years and is expected to continue to evolve going forward. Key regulatory actions arising from the recent financial crisis, such as the Dodd-Frank Wall Street Reform and Consumer Protection Act ("Dodd-Frank Act") and the establishment of the Consumer Financial Protection Bureau ("CFPB"), impose new and evolving standards for market participants. These regulatory changes have spurred lenders and servicers to seek technology solutions that facilitate the meeting of compliance obligations in the face of a changing regulatory environment while remaining efficient and profitable.
• | Evolving regulation. Most U.S. mortgage market participants have become subject to increased regulatory oversight and regulatory requirements as federal and state governments have enacted various new laws, rules and regulations. One example of such legislation is the Dodd-Frank Act, which contains broad changes for many sectors of the financial services and lending industries and established the CFPB, a new federal regulatory agency responsible for regulating consumer financial protection within the United States. It is our experience that mortgage lenders have become more focused on minimizing the risk of non-compliance with these evolving regulations and are looking toward technologies and solutions that help them to comply with the increased regulatory oversight and requirements. |
4
• | Lenders increasingly focused on core operations. As a result of greater regulatory scrutiny and the higher cost of doing business, we believe lenders have become more focused on their core operations and customers. We believe lenders are increasingly shifting from in-house technologies to solutions with third-party providers who can provide better technology and services more efficiently. Lenders require these vendors to provide best-in-class technology and deep domain expertise and to assist them in maintaining regulatory compliance. |
• | Growing role of technology in the U.S. mortgage industry. Banks and other lenders and servicers have become increasingly focused on technology automation and workflow management to operate more efficiently and meet their regulatory guidelines. We believe vendors must be able to support the complexity of the market, display extensive industry knowledge and possess the financial resources to make the necessary investments in technology to support lenders. |
• | Increased demand for enhanced transparency and analytic insight. As U.S. mortgage market participants work to minimize the risk in lending, servicing and capital markets, they rely on the integration of data and analytics with technologies that enhance the decision making process. These industry participants rely on large comprehensive third-party databases coupled with enhanced analytics to achieve these goals. |
Our Solutions
Our solutions provide U.S. mortgage industry participants with a comprehensive, integrated technology and workflow management solution set that is supported by what we believe is industry-leading data and analytics to enhance capabilities and drive efficiencies while assisting our clients to maintain regulatory compliance.
Technology Solutions
Our Technology segment offers leading software and hosting solutions that facilitate and automate many of the mission-critical business processes across the life cycle of a mortgage. These solutions primarily consist of mortgage origination and servicing, processing and workflow management software applications coupled with related support and services.
Our clients in this segment are primarily mortgage lenders and servicers. We believe they use our technology and services to reduce their operating costs, improve their ability to provide superior customer service and enhance the quality and consistency of various aspects of their mortgage operations. We work with our clients to enhance and integrate our software and services in order to assist them in gaining the greatest value from the solutions we provide.
The primary applications and services within our Technology segment are as follows:
• | Servicing Technology. MSP is a software as a service application that automates loan servicing, including loan setup and ongoing processing, customer service, accounting and reporting to the secondary mortgage market and investor reporting. MSP serves as a core application and database of record for first and second lien mortgages. |
When a bank hires us to process its mortgage portfolio, we provide a hosted software solution and system support personnel whose role is to ensure our system remains up and running 24 hours a day, seven days a week, to monitor our programs and interfaces effectively, to make system and application changes as necessary and to assist our clients with their responsibilities to be compliant with applicable laws and regulations.
We have also developed web-based workflow information systems, which we refer to as LoanSphere Bankruptcy and LoanSphere Foreclosure. These applications can be used for managing and automating a wide range of different workflow processes involving non-performing loans. In addition, we offer LoanSphere Invoicing, which can be used to organize images of paper documents within a particular file, to capture information from imaged documents, to manage invoices and to provide multiple users access to key data needed for various types of monitoring and process management.
• | Origination Technology. We offer two solutions that automate and facilitate the origination of mortgage loans in the United States: Empower, which supports retail and wholesale loan originations, and LendingSpace, which supports correspondent loan originations, which are originations that are funded by one lender, who sells the loan to another lender who services the loan or sells it on the secondary market. Our loan origination technologies are enhanced to assist with the changing regulatory requirements and are used to improve loan quality and store documents and images. |
We also offer the Exchange and the Insight suite of solutions. The Exchange is a platform that provides a fully interconnected network of originators, agents, settlement services providers and investors in the United States. This secure and integrated one-to-many platform allows lenders and their service providers to connect and do business electronically. Our Insight suite consists of Closing Insight, Quality Insight and Valuation Insight. Closing Insight and Quality Insight are solutions integrated with the Exchange and are designed to help lenders meet loan quality and disclosure requirements established by government-sponsored enterprises ("GSEs"), the CFPB and the Federal Housing Finance Agency. Valuation Insight is a tool for lenders to validate and quality control appraisals and other valuation types used in collateral analysis.
5
Our eLending solutions connect the various parties and systems associated with lending transactions enabling lenders, partners and consumers to exchange data quickly and efficiently. Our eLending platform hosts a range of on-demand services that provide electronic document delivery, signature, closings and post-close services accessible to lenders of all sizes.
We build all of our technology platforms to be scalable, secure, flexible, standards-based and web connected for easy use by our clients. Further, we have a history of being able to bring solutions to market quickly due to investments that we have made in integrating our technology and development processes.
Data and Analytics Solutions
Our Data and Analytics segment supports and enhances our technology solutions and is designed to help lenders and servicers make more informed decisions, improve performance, identify and predict risk and generate more qualified leads. We believe, based on our knowledge of the industry and competitors, that we have aggregated one of the largest residential real estate data sets in the United States that is derived from both proprietary and public data sources. Utilizing this data, subject to any applicable use restrictions, and our deep history and understanding of the mortgage market, we have created detailed real estate data solutions that assist in portfolio management, valuations, property records, lead generation and improved risk analysis for all aspects of origination, servicing, default and capital markets/investing. In addition, we deliver data, analytics and technology solutions to customers in the real estate, title insurance, MLS and other industries that rely on property data-centric solutions to make informed decisions and run their businesses.
Our primary data and analytics services are as follows:
• | Property, Mortgage Performance Data and MLS. We make our real estate database available to our clients in a standard, normalized format. We provide a rich and diverse data set for title production activities. We also provide tax status data on properties and offer a number of value-added analytic services designed to enable our clients to utilize our data to assess and mitigate risk, determine property values, track market performance and generate leads. We also provide an MLS system to large MLS groups in the U.S. and Canada. |
• | Mortgage and Real Estate Analytics. We offer a broad range of property valuation services that allow our clients to analyze the value of underlying properties. These include, among others, automated valuation models, collateral risk scores, appraisal review services and valuation reconciliation services. To deliver these services, we utilize proprietary algorithms, detailed real estate statistical analysis and modified physical property inspections. These offerings are designed to reduce risk in origination, servicing and default transactions as well as aid investors in analysis of property and real estate assets. These offerings can be tailored to meet client needs and any regulatory requirements. |
• | Enterprise Business Intelligence. We offer technological solutions that help mortgage lenders and servicers better leverage their extensive data assets by collecting, linking and storing loan data from their applications and from industry sources in a central location and delivering visualization and actionable insights into the data to support proactive decision making at all levels of the enterprise. In addition, we provide near real-time access to information to provide real-time analytics, enabling proactive management of operations through key performance indicators, scorecards, dashboards and on-demand dynamic reporting. |
Our Competitive Strengths
We believe our competitive strengths include the following:
• | Market leadership with comprehensive and integrated solutions. We are a leading provider of comprehensive and integrated solutions to the mortgage industry. One or more of our solutions are utilized by 23 of the top 25 servicers and 22 of the top 25 originators in the United States according to Inside Mortgage Finance as of December 31, 2016. We believe our leadership position is, in part, the result of our unique expertise and insight developed from over 50 years serving the needs of customers in the mortgage industry. We have used this insight to develop an integrated and comprehensive suite of proprietary technology, data and analytics solutions to automate many of the mission-critical business processes across the entire mortgage loan life cycle. These integrated solutions are designed to reduce manual processes, assist in improving organizational compliance and mitigating risk, and to ultimately deliver significant cost savings to our clients. |
• | Broad and deep client relationships with significant recurring revenues. We have long-standing, sticky relationships with our largest clients. We frequently enter into long-term contracts with our mortgage servicing and loan origination clients that contain volume minimums and provide for annual increases. Our products are typically embedded within our clients' mission-critical workflow and decision making processes across various parts of their organizations. |
• | Extensive data assets and analytics capabilities. We develop and maintain large, accurate and comprehensive data sets on the mortgage and housing industry that we believe are competitively differentiated. Our unique data sets provide a combination of public and proprietary data in real-time and each of our data records features a large number of attributes. Our data scientists utilize our data sets, subject to any applicable use restrictions, and comprehensive |
6
analytical capabilities to create highly customized reports, including models of customer behavior for originators and servicers, portfolio analytics for capital markets and government agencies and proprietary market insights for real estate agencies. Our data and analytics capabilities are also embedded into our technology platform and workflow products, providing our clients with integrated and comprehensive solutions.
• | Scalable and cost-effective operating model. We believe we have a highly attractive and scalable operating model derived from our market leadership, hosted technology platforms and the large number of clients we serve across the mortgage industry. Our scalable operating model provides us with significant benefits. Our scale and operating leverage allows us to add incremental clients to our existing platforms with limited incremental cost. As a result, our operating model drives attractive margins and generates significant cash flow. Also, by leveraging our scale and leading market position, we are able to make cost-effective investments in our technology platform to assist with the evolving regulatory and compliance requirements, further increasing our value proposition to clients. |
• | World class management team with depth of experience and track record of success. Our management team has an average of over 20 years of experience in the banking technology and mortgage processing industries and a proven track record of strong execution capabilities. Following the Acquisition, we have significantly improved our operations and enhanced our go-to-market strategy, further integrated our technology platforms, expanded our data and analytics capabilities and introduced several new innovative products. We executed all of these projects while delivering attractive revenues growth and strong profitability. |
Our Strategy
Our comprehensive and integrated technology platforms, robust data and analytic capabilities, differentiated business model, broad and deep client relationships and other competitive strengths enable us to pursue multiple growth opportunities. We intend to continue to expand our business and grow through the following key strategies:
• | Further penetration of our solutions with existing clients. We believe our established client base presents a substantial opportunity for growth. We seek to capitalize on the trend of standardization and increased adoption of leading third party solutions and increase the number of solutions provided to our existing client base. We intend to broaden and deepen our client relationships by cross-selling our suite of end-to-end technology solutions, as well as our robust data and analytics. By helping our clients understand the full extent of our comprehensive solutions and the value of leveraging the multiple solutions we offer, we believe we can expand our existing relationships by allowing our clients to focus on their core businesses and their customers. |
• | Win new clients in existing markets. We intend to attract new clients by leveraging the value proposition provided by our technology platform and comprehensive solutions offering. In particular, we believe there is a significant opportunity to penetrate the mid-tier mortgage originators and servicers market. We believe these institutions can benefit from our proven solutions suite in order to address complex regulatory requirements and compete more effectively in the evolving mortgage market. We intend to continue to pursue this channel and benefit from the low incremental cost of adding new customers to our scaled technology infrastructure. |
• | Continue to innovate and introduce new solutions. Our long-term vision is to be the industry-leading provider for participants of the mortgage industry for their platform, data and analytic needs. We intend to enhance what we believe is a leadership position in the industry by continuing to innovate our solutions and refine the insight we provide to our clients. We have a strong track record of introducing and developing new solutions that span the mortgage loan life cycle, are tailored to specific industry trends and enhance our clients' core operating functions. By working in partnership with key clients, we have been able to develop and market new and advanced solutions to our client base that meet the evolving demands of the mortgage industry. In addition, we will continue to develop and leverage insights from our large public and proprietary data assets to further improve our customer value proposition. |
• | Selectively pursue strategic acquisitions. The core focus of our strategy is to grow organically. However, we may selectively evaluate strategic acquisition opportunities that would allow us to expand our footprint, broaden our client base and deepen our product and service offerings. We believe that there are meaningful synergies that result from acquiring small companies that provide best-of-breed single point solutions. Integrating and cross-selling these point solutions into our broader client base and integrating acquisitions into our efficient operating environment would potentially result in revenues and cost synergies. |
Our Clients
We have numerous clients in each category of service that we offer across the mortgage continuum. A significant focus of our marketing efforts is on the top U.S. mortgage originators and servicers; although, we also provide our solutions to a number of other financial institutions, investors, attorneys, trustees and real estate professionals.
The U.S. mortgage industry is concentrated among the top 25 mortgage institutions and our most significant and long-term relationships tend to follow the industry landscape. We typically provide an extensive number of solutions to each client. Because of the depth of these relationships, we derive a significant portion of our aggregate revenues from our largest clients.
7
During the year ended December 31, 2016, Wells Fargo, N.A. accounted for approximately 12% of our consolidated revenues, approximately 15% of our Technology segment revenues and approximately 1% of our Data and Analytics segment revenues.
During the year ended December 31, 2016, our five largest clients accounted for approximately 36% of our consolidated revenues, approximately 38% of our Technology segment revenues and approximately 28% of our Data and Analytics segment revenues. However, the revenues in each case are spread across a range of services and are subject to multiple separate contracts. Although the diversity of the services we provide to each of these clients reduces the risk that we would lose all of the revenues associated with any of these clients, a significant deterioration in our relationships with or the loss of any one or more of these clients could have a significant effect on our results of operations. See "Risk Factors-We rely on our top clients for a significant portion of our revenues and profits, which makes us susceptible to the same macro-economic and regulatory factors that affect our clients."
Sales and Marketing
Our sales and marketing efforts are focused on both generating new clients as well as cross-selling our broad service offerings to existing clients.
We have teams of experienced sales personnel with subject matter expertise in particular services and in the needs of particular types of clients. A significant portion of our potential clients in each of our business lines is targeted via direct and/or indirect field sales, as well as inbound and outbound telemarketing efforts. Marketing activities include direct marketing, print and electronic advertising, media relations, web-based activities, thought leadership, client meetings and conferences, tradeshow and convention activities and other targeted initiatives.
Given the broad range of solutions we offer and the concentration and scale of many of our existing clients, we have the opportunity to expand our sales to our existing client base through cross-selling efforts. We have established a core team of account managers that cross-sell the full range of our services to existing and potential clients at the top U.S. mortgage originators and servicers, as well as a number of other financial institutions, investors and real estate professionals. The individuals who participate in this effort spend a significant amount of their time on sales and marketing efforts.
We engage in strategic account reviews, during which our executives share their knowledge of clients and the market in order to determine the best sales approach on a client-by-client basis. As a result, we have created an effective cross-selling culture within our organization.
Research and Development
Our research and development activities relate primarily to the design, development and enhancement of our processing systems and related software applications. We expect to continue our practice of investing an appropriate level of resources to maintain, enhance and extend the functionality of our proprietary systems and existing software applications, to develop new and innovative software applications and systems in response to the needs of our clients and to enhance the capabilities surrounding our infrastructure. We work with our clients to determine the appropriate timing and approach to introducing technology or infrastructure changes to our applications and services.
Patents, Trademarks and Other Intellectual Property
We rely on a combination of contractual restrictions, internal security practices and copyright and trade secret laws to establish and protect our software, technology, data and expertise. Further, we have developed a number of brands that have accumulated goodwill in the marketplace, and we rely on the above to protect our rights in that area. We intend to continue our policy of taking all measures we deem necessary to protect our copyright, trade secret and trademark rights.
Competition
A number of the businesses in which we engage are highly competitive. Competitive factors in processing businesses include the quality of the technology-based application or service, application features and functions, ease of delivery and integration, ability of the provider to maintain, enhance and support the applications or services and pricing. We believe that our integrated technology and economies of scale in the mortgage processing business provide us with a competitive advantage in each of these categories. Based on our knowledge of the industry and competitors, we also believe that no single competitor offers the depth and breadth of solutions we are able to offer.
Technology. With respect to our Technology segment, we compete with our customers' internal technology departments and other providers of similar systems, such as Ellie Mae, Inc., Fiserv, Inc., Fidelity National Information Services, Inc., or FIS, Mortgage Cadence and WiPro Gallagher Solutions. Competitive factors include the quality of the technology-based application or service, application features and functions, ease of delivery and integration, ability of the provider to maintain, enhance and support the applications or services, and pricing. We believe that our integrated technology and economies of scale in the mortgage processing business provide us with a competitive advantage in each of these categories.
8
Data and Analytics. In our Data and Analytics segment, we primarily compete with CoreLogic, Inc., First American Financial Corporation, in-house capabilities and certain niche providers. We compete based on the breadth and depth of our data, the exclusive nature of some of our key data sets and the capabilities to create highly customized reports. We believe that the quality of the data we offer is distinguished by the broad range of our data sources, including non-public sources, the volume of records we maintain, our ability to integrate our data and analytics with our technology solutions and the ability to leverage our market leading position in the mortgage origination and servicing industries.
Government Regulation
Various aspects of our businesses are subject to federal and state regulations. Our failure to comply with any applicable laws and regulations could result in restrictions on our ability to provide certain services, as well as the possible imposition of civil fines and criminal penalties.
As a provider of electronic data processing to financial institutions, such as banks and credit unions, we are subject to regulatory oversight and examination by the Federal Financial Institutions Examination Council ("FFIEC"), an interagency body of the Federal Reserve Board, the CFPB, the Office of the Comptroller of the Currency ("OCC"), the Federal Deposit Insurance Corporation and various other federal and state regulatory authorities. We also may be subject to possible review by state agencies that regulate banks in each state in which we conduct our electronic processing activities.
Our financial institution clients are required to comply with various privacy regulations imposed under state and federal law, including the Gramm-Leach-Bliley Act. These regulations place restrictions on the use of non-public personal information. All financial institutions must disclose detailed privacy policies to their customers and offer them the opportunity to direct the financial institution not to share information with third parties. The regulations, however, permit financial institutions to share information with non-affiliated parties who perform services for the financial institutions. As a provider of services to financial institutions, we are required to comply with the same privacy regulations and are generally bound by the same limitations on disclosure of the information received from our clients as those that apply to the financial institutions themselves.
The most recent financial crisis resulted in increased scrutiny of all parties involved in the mortgage industry by governmental authorities with the most recent focus being on those involved in the foreclosure process. This scrutiny has included federal and state governmental review of all aspects of the mortgage lending business, including an increased legislative and regulatory focus on consumer protection practices. The Dodd-Frank Act is one example of such legislation. It is difficult to predict the final form that regulations or other rule-makings to implement the various requirements of the Dodd-Frank Act may take, what additional legislative or regulatory changes may be approved in the future, or whether those changes may require us to change our business practices, incur increased costs of compliance or adversely affect our results of operations.
Employees
As of December 31, 2016, we had approximately 4,250 employees and approximately 230 independent contractors. None of our workforce currently is unionized. We have not experienced any work stoppages, and we consider our relations with employees to be good.
Financial Information by Operating Segment
In addition to our two reporting segments, we have a corporate organization that consists primarily of general and administrative expenses that are not included in the other segments. For financial information by reporting segment, see Note 17 to the Notes to Consolidated Financial Statements.
Statement Regarding Forward-Looking Information
The statements contained in this Form 10-K or in our other documents or in oral presentations or other statements made by our management that are not purely historical are forward-looking statements within the meaning of Section 27A of the Securities Act of 1933 and Section 21E of the Securities Exchange Act of 1934, including statements regarding our expectations, hopes, intentions, or strategies regarding the future. These statements relate to, among other things, future financial and operating results of the Company. In many cases, you can identify forward-looking statements by terminology such as "may," "will," "should," "expect," "plan," "anticipate," "believe," "estimate," "predict," "potential" or "continue," or the negative of these terms and other comparable terminology. Actual results could differ materially from those anticipated in these statements as a result of a number of factors, including, but not limited to the following:
• | our ability to successfully achieve the conditions to and consummate the tax-free spin-off of Black Knight from FNF; |
• | security breaches against our information systems; |
• | changes to our relationships with our top clients, whom we rely on for a significant portion of our revenues and profit; |
• | limitation of our growth due to the time and expense associated with switching from competitors' software and services; |
• | providing credits or refunds for prepaid amounts or contract terminations in connection with our service level commitments; |
• | our ability to offer high-quality technical support services; |
9
• | our ability to comply with or changes in government regulations; |
• | consolidation in our end client market; |
• | regulatory developments with respect to use of consumer data and public records; |
• | efforts by the government to reform or address the mortgage market and current economic environment; |
• | our clients' relationships with government-sponsored enterprises; |
• | our ability to adapt our solutions to technological changes or evolving industry standards; |
• | our ability to compete effectively; |
• | increase in the availability of free or relatively inexpensive information; |
• | our ability to protect our proprietary technology and information rights; |
• | infringement on the proprietary rights of others by our applications or services; |
• | our ability to successfully consummate and integrate acquisitions; |
• | our reliance on third parties; |
• | our dependence on our ability to access data from external sources; |
• | our international operations and third-party service providers; |
• | our ability to develop widespread brand awareness cost-effectively; |
• | system failures, damage or interruption with respect to our technology solutions; |
• | delays or difficulty in developing or implementing new or enhanced mortgage processing or technology solutions; |
• | change in the strength of the economy and housing market generally; |
• | our substantial indebtedness and any additional significant debt we incur; |
• | the adequacy of our risk management policies and procedures; |
• | our ability to achieve our growth strategies; |
• | litigation, investigations or other actions against us; |
• | our dependency on distributions from BKFS LLC to pay taxes and other expenses; |
• | cash payments in exchange for units may reduce our overall cash flow; |
• | our status as a "controlled company" within the meaning of the NYSE; and |
• | conflicts of interest that may arise due to FNF's control over us. |
See "Risk Factors" for a further description of these and other factors. For the reasons described above, we caution you against relying on any forward-looking statements, which should also be read in conjunction with the other cautionary statements that are included elsewhere in this Annual Report on Form 10-K. Any forward-looking statement made by us in this Annual Report on Form 10-K speaks only as of the date on which we make it. Factors or events that could cause our actual results to differ may emerge from time to time, and it is not possible for us to predict all of them. We are not under any obligation (and expressly disclaim any such obligation) to update or alter our forward-looking statements, whether as a result of new information, future events or otherwise. You should carefully consider the possibility that actual results may differ materially from our forward-looking statements.
Additional Information
Our website address is www.bkfs.com. We make available free of charge on or through our website our Annual Report on Form 10-K, Quarterly Reports on Form 10-Q, Current Reports on Form 8-K and all amendments to those reports filed or furnished pursuant to Section 13(a) or 15(d) of the Securities Exchange Act of 1934, as amended, as soon as reasonably practicable after such material is electronically filed with or furnished to the Securities and Exchange Commission. However, the information found on our website is not part of this or any other report.
Item 1A. | Risk Factors |
In addition to the normal risks of business, we are subject to significant risks and uncertainties, including those listed below and others described elsewhere in this Annual Report on Form 10-K. Any of the risks described herein could result in a significant or material adverse effect on our results of operations or financial condition.
Risks Related to Our Business
If we are unable to protect our information systems against data corruption, cyber-based attacks or network security breaches, or if we are unable to provide adequate security in the electronic transmission of sensitive data, it could have a material adverse effect on our business, financial condition and results of operations.
We are highly dependent on information technology networks and systems, including the Internet, to securely process, transmit and store electronic information. Security breaches of this infrastructure, including physical or electronic break-ins, computer viruses, attacks by hackers and similar breaches, can create system disruptions, shutdowns or unauthorized disclosure of confidential information, including non-public personal information, consumer data and proprietary business information. Cyber-based attacks against financial institutions to extort payment in return for the release of sensitive information are increasing. Unauthorized access, including through use of fraudulent schemes such as "phishing" schemes, could jeopardize the security of information stored in our systems. In addition, malware or viruses could jeopardize the security of information stored or used in a user's
10
computer. If we are unable to prevent such security or privacy breaches, our operations could be disrupted, or we may suffer loss of reputation, financial loss, lawsuits and other regulatory imposed restrictions and penalties because of lost or misappropriated information, including sensitive consumer data, which could have a material adverse effect on our business, financial condition and results of operations. Likewise, our clients are increasingly imposing more stringent contractual obligations on us relating to our information security protections. If we are unable to maintain protections and processes at a level commensurate with that required by our large clients, it could negatively affect our relationships with those clients, increase our operating costs or subject us to liability under those contractual obligations, which could have a material adverse effect on our business, financial condition and results of operations.
We rely on our top clients for a significant portion of our revenues and profits, which makes us susceptible to the same macro-economic and regulatory factors that affect our clients. If these clients are negatively affected by current economic or regulatory conditions or otherwise experience financial hardship or stress, or if the terms of our relationships with these clients change, it could have a material adverse effect on our business, financial condition and results of operations.
We operate in a consolidated industry and as a result, a small number of our clients have accounted for a significant portion of our revenues. We expect that a limited number of our clients will continue to represent a significant portion of our revenues for the foreseeable future. The significant portion or our revenues that a limited number of our clients currently represent may increase in the future. During the year ended December 31, 2016, our largest client, Wells Fargo, N.A., or Wells Fargo, accounted for approximately 12% of our consolidated revenues and approximately 15% and 1% of the revenues from our Technology and Data and Analytics segments, respectively. During the year ended December 31, 2016, our five largest clients accounted for approximately 36% of our consolidated revenues, approximately 38% of our Technology segment revenues and approximately 28% of our Data and Analytics segment revenues.
Our clients face continued pressure in the current economic and regulatory climate. Many of our relationships with these clients are long-standing and are important to our business and results of operations, but there is no guarantee that we will be able to retain or renew existing agreements or maintain our relationships on acceptable terms or at all. Additionally, we rely on cross-selling our products and services to our existing clients as a source of growth. The deterioration in or termination of any of these relationships could significantly reduce our revenues and could have a material adverse effect on our business, financial condition and results of operations. As a result, we may be disproportionately affected by declining revenues from, or loss of, a significant client. In addition, by virtue of their significant relationships with us, these clients may be able to exert pressure on us with respect to the pricing of our services.
The time and expense associated with switching from our competitors' software and services to ours may limit our growth.
The costs for a mortgage lender or servicer to switch providers of technology, data and analytics solutions and services can be significant and the process can sometimes take 12 to 18 months to complete. As a result, potential clients may decide that it is not worth the time and expense to begin using our solutions and services, even if we offer competitive and economic advantages. If we are unable to convince these potential clients to switch to our software and services, our ability to increase market share will be limited, which could have a material adverse effect on our business, financial condition and results of operations.
We typically provide service level commitments under our client contracts. If we fail to meet these contractual commitments, we could be obligated to provide credits or refunds for prepaid amounts related to unused subscription services or face contract terminations, which could adversely affect our business, financial condition and results of operations.
Our client agreements typically provide service level commitments measured on a daily and monthly basis. If we are unable to meet the stated service level commitments or suffer extended periods of unavailability for our applications, we may be contractually obligated to provide these clients with service credits or refunds or we could face contract terminations. If we suffer unscheduled downtime that exceeds the allowed downtimes under our agreements with our clients or if we experience any extended service outages, it could have a material adverse effect on our business, financial condition and results of operations.
Any failure to offer high-quality technical support services may adversely affect our relationships with our clients and could have a material adverse effect on our business, financial condition and results of operations.
Once our applications and technology are deployed, our clients depend on our support organization to resolve technical issues relating thereto. We may be unable to respond adequately to accommodate short-term increases in client demand for support services. We also may be unable to modify the format of our support services to compete with changes in support services provided by our competitors. Increased client demand for these services, without corresponding revenues, could increase costs and adversely affect our results of operations. In addition, our sales process is highly dependent on our applications and business reputation and on positive recommendations from our existing clients. Any failure to maintain high-quality technical support, or a market perception that we do not maintain high-quality support, could adversely affect our reputation and our ability to sell our applications to existing and prospective clients, any of which could have a material adverse effect on our business, financial condition and results of operations.
11
Our clients and we are subject to various governmental regulations, and a failure to comply with governmental regulations or changes in these regulations, including changes that may result from changes in the political landscape, could result in penalties, restrict or limit our or our clients' operations or make it more burdensome to conduct such operations, any of which could have a material adverse effect on our business, financial condition and results of operations.
Many of our clients' and our businesses are subject to various federal, state, local and foreign laws and regulations. Our failure to comply with applicable laws and regulations could restrict our ability to provide certain services or result in imposition of civil fines and criminal penalties, substantial regulatory and compliance costs, litigation expense, adverse publicity and loss of revenues.
As a provider of electronic data processing to financial institutions, such as banks and credit unions, we are subject to regulatory oversight and examination by the FFIEC. We also may be subject to possible review by state agencies that regulate banks in each state in which we conduct our electronic processing activities.
In addition, our businesses are subject to an increased degree of compliance oversight by regulators and by our clients. Specifically, the CFPB has authority to write rules affecting the business of, supervise, conduct examinations of, and enforce compliance as to federal consumer financial protection laws and regulations with respect to certain "non-depository covered persons" determined by the CFPB to be "larger participants" that offer consumer financial products and services. The CFPB and the prudential financial institution regulators such as the OCC also have the authority to examine us in our role as a service provider to large financial institutions, although it is yet unclear how broadly they will apply this authority going forward. In addition, we believe some of our largest bank clients' regulators are requiring the banks to exercise greater oversight and perform more rigorous audits of their key vendors such as us.
The Real Estate Settlement Procedures Act ("RESPA") and related regulations generally prohibit the payment or receipt of fees or any other item of value for the referral of real estate-related settlement services. RESPA also prohibits fee shares or splits or unearned fees in connection with the provision of residential real estate settlement services, such as mortgage brokerage and real estate brokerage. Notwithstanding these prohibitions, RESPA permits payments for goods furnished or for services actually performed, so long as those payments bear a reasonable relationship to the market value of the goods or services provided. RESPA and related regulations may to some extent restrict our real estate-related businesses from entering into certain preferred alliance arrangements. The CFPB is responsible for enforcing RESPA.
Changes to laws and regulations and regulatory oversight of our clients and us, including those that may result from changes in the political landscape, may cause us to increase our prices in certain situations or decrease our prices in other situations, may restrict our ability to implement price increases or otherwise limit the manner in which we conduct our business. We may also incur additional expense in keeping our technology services up to date as laws and regulations change, and we may not be able to pass those additional costs on to our clients. In addition, in response to increased regulatory oversight, participants in the mortgage lending industry may develop policies pursuant to which they limit the extent to which they can rely on any one vendor or service provider. Conversely, in an environment with less stringent regulatory oversight, prospective clients may choose to retain their in-house platforms, or current service providers, or seek alternative service providers who provide services that are less compliance and quality oriented at a lower price point. If we are unable to adapt our products and services to conform to the new laws and regulations, or if these laws and regulations have a negative affect on our clients, we may experience client losses or increased operating costs, which could have a material adverse effect on our business, financial condition and results of operations.
There may be consolidation in our end client market, which could reduce the use of our services by our clients and could have a material adverse effect on our business, financial condition and results of operations.
Consolidations among existing or potential clients could reduce the number of our clients and potential clients. If our clients merge with, are acquired by or sell their servicing portfolios to other entities that are not our clients, or that use fewer of our services, they may discontinue or reduce their use of our services. In addition, if potential clients merge, our ability to increase our client base may be adversely affected and the ability of our customers to exert pressure on our pricing may increase. Any of these developments could have a material adverse effect on our business, financial condition and results of operations.
Regulatory developments with respect to use of consumer data and public records could have a material adverse effect on our business, financial condition and results of operations.
Because our databases include certain public and non-public personal information concerning consumers, we are subject to government regulation and potential adverse publicity concerning our use of consumer data. We acquire, store, use and provide many types of consumer data and related services that are subject to regulation under the Fair Credit Reporting Act, the Gramm-Leach-Bliley Act, the Driver's Privacy Protection Act and, to a lesser extent, various other federal, state and local laws and regulations. These laws and regulations are designed to protect the privacy of consumers and to prevent the unauthorized access and misuse of personal information in the marketplace. Our failure to comply with these laws, or any future laws or regulations of a similar nature, could result in substantial regulatory penalties, litigation expense and loss of revenues, which could have a material adverse effect on our business, financial condition and results of operations.
12
In addition, some of our data suppliers face similar regulatory requirements and, consequently, they may cease to be able to provide data to us or may substantially increase the fees they charge us for this data, which may make it financially burdensome or impossible for us to acquire data that is necessary to offer our products and services. Further, many consumer advocates, privacy advocates and government regulators believe that existing laws and regulations do not adequately protect privacy or ensure the accuracy of consumer-related data. As a result, they are seeking further restrictions on the dissemination or commercial use of personal information to the public and private sectors as well as contemplating requirements relative to data accuracy and the ability of consumers to opt to have their personal data removed from databases such as ours. Any future laws, regulations or other restrictions limiting the dissemination or use of personal information may reduce the quality and availability of our solutions and services, which could have a material adverse effect on our business, financial condition and results of operations.
Participants in the mortgage industry are under intense scrutiny, and efforts by the government to reform the mortgage industry or address the troubled mortgage market and the current economic environment could have a material adverse effect on our business, financial condition and results of operations.
Since the beginning of the housing crisis, the mortgage industry has been under intense scrutiny by governmental authorities, judges and the news media, among others. This scrutiny has included federal and state governmental review of all aspects of the mortgage lending business, and several actions to aid the housing market and the economy in general, and to implement more rigorous standards around mortgage servicing, with particular focus on loans that are in default.
New national mortgage servicing rules have been implemented that, among other things, require very specific loan modification procedures to be followed and offered to the borrower before any foreclosure proceeding can be initiated or completed. These standards have further reduced the number of loans entering the foreclosure process and have negatively affected our default technology revenues and profits, and it is unclear what effect these standards will have on us in the future.
Additional state and federal government actions directed at housing and the mortgage industry may occur and could have a material adverse effect on our business, financial condition and results of operations.
Our clients' relationships with GSEs are subject to change, which could have a material adverse effect on our business, financial condition and results of operations.
Our clients have significant relationships with Fannie Mae and Freddie Mac, which are GSEs, tasked with working with financial institutions to provide liquidity to the mortgage market. They do this by purchasing loans from the lenders either for cash or in exchange for mortgage-backed securities that are backed by those loans and that, for a fee, carries the GSEs guarantee of timely payment of interest and principal to investors of those mortgage-backed securities. Because our clients service the loans owned by GSEs, we provide solutions and services for many of those loans. As a result of these relationships, GSEs have been able to implement changes to our pricing structure on certain products and services we provide. GSEs or other governmental agencies may be able to exert similar pressure on the pricing of our solutions and services in the future, which could have a material adverse effect on our business, financial condition and results of operations.
If we fail to adapt our solutions to technological changes or evolving industry standards, or if our ongoing efforts to upgrade our technology are not successful, we could lose clients and have difficulty attracting new clients for our solutions, which could have a material adverse effect on our business, financial condition and results of operations.
The markets for our solutions are characterized by constant technological changes, frequent introductions of new products and services and evolving industry standards and regulations. Our future success will be significantly affected by our ability to successfully enhance our current solutions, and develop and introduce new solutions and services that address the increasingly sophisticated needs of our clients and their customers. These initiatives carry the risks associated with any new product or service development effort, including cost overruns, delays in delivery and performance issues. There can be no assurance that we will be successful in developing, marketing and selling new solutions and services that meet these changing demands, that we will not experience difficulties that could delay or prevent the successful development, introduction, and marketing of these solutions and services or that our new solutions and services and their enhancements will adequately meet the demands of the marketplace and achieve market acceptance. If our efforts are unsuccessful, it could have a material adverse effect on our business, financial condition and results of operations.
We operate in a competitive business environment and, if we are unable to compete effectively, it could have a material adverse effect on our business, financial condition and results of operations.
The markets for our solutions are intensely competitive. Our competitors vary in size and in the scope and breadth of the services they offer. Some of our competitors have substantial resources. In addition, we expect that the markets in which we compete will continue to attract new competitors and new technologies. There can be no assurance that we will be able to compete successfully against current or future competitors or that competitive pressures we face in the markets in which we operate will not have a material adverse effect on our business, financial condition and results of operations.
13
Further, because many of our larger potential clients have historically developed their key processing applications in-house and therefore view their system requirements from a make-versus-buy perspective, we often compete against our potential clients' in-house capacities. As a result, gaining new clients in our mortgage processing business can be difficult. For banks and other potential clients, switching from an internally designed system to an outside vendor, or from one vendor of mortgage processing services to a new vendor, is a significant undertaking. These potential clients worry about potential disadvantages such as loss of custom functionality, increased costs and business disruption. As a result, these potential clients often resist change. There can be no assurance that our strategies for overcoming potential clients' reluctance to change will be successful, and if we are unsuccessful, it could have a material adverse effect on our business, financial condition and results of operations.
To the extent the availability of free or relatively inexpensive information increases, the demand for some of our data and information solutions may decrease, which could have a material adverse effect on our business, financial condition and results of operations.
Public sources of free or relatively inexpensive information have become increasingly available recently, particularly through the Internet, and this trend is expected to continue. Governmental agencies in particular have increased the amount of information to which they provide free public access. Public sources of free or relatively inexpensive information may reduce demand for, or the price that clients are willing to pay for, our data and information solutions. To the extent that clients choose not to obtain data and information from us and instead rely on information obtained at little or no cost from these public sources, it could have a material adverse effect on our business, financial condition and results of operations.
We rely upon proprietary technology and information rights, and if we are unable to protect our rights, it could have a material adverse effect on our business, financial condition and results of operations.
Our success depends, in part, upon our intellectual property rights. We rely primarily on a combination of patents, copyrights, trade secrets, and trademark laws and nondisclosure and other contractual restrictions on copying, distribution and creation of derivative products to protect our proprietary technology and information. This protection is limited, and our intellectual property could be used by others without our consent. In addition, patents may not be issued with respect to our pending or future patent applications, and our patents may not be upheld as valid or may not prevent the development of competitive products. Any infringement, disclosure, loss, invalidity of or failure to protect our intellectual property could have a material adverse effect on our business, financial condition and results of operations. Moreover, litigation may be necessary to enforce or protect our intellectual property rights, to protect our trade secrets or to determine the validity and scope of the proprietary rights of others. Such litigation could be time-consuming, result in substantial costs and diversion of resources and could have a material adverse effect on our business, financial condition and results of operations.
If our applications or services are found to infringe the proprietary rights of others, we may be required to change our business practices and may also become subject to significant costs and monetary penalties, any of which could have a material adverse effect on our business, financial condition and results of operations.
As our information technology applications and services develop, we may become increasingly subject to infringement claims. Any such claims, whether with or without merit, could:
• | be expensive and time-consuming to defend; |
• | cause us to cease providing solutions that incorporate the challenged intellectual property; |
• | require us to redesign our solutions, if feasible; |
• | divert management's attention and resources; and |
• | require us to enter into royalty or licensing agreements in order to obtain the right to use necessary technologies. |
Any one or more of the foregoing outcomes could have a material adverse effect on our business, financial condition and results of operations. Additionally, we may be liable for damages for past infringement if a court determines that our software or technologies infringe upon a third party's patent or other proprietary rights.
If we are unable to successfully consummate and integrate acquisitions, it could have a material adverse effect on our business, financial condition and results of operations.
One of our strategies to grow our business is to opportunistically acquire complementary businesses, technologies and services. This strategy will depend on our ability to find suitable acquisitions and finance them on acceptable terms. We may require additional debt or equity financing for future acquisitions, and doing so will be made more difficult by our substantial debt. Raising additional capital for acquisitions through debt financing could result in increased interest expense and may involve agreements that include covenants limiting or restricting our ability to take certain actions, such as incurring additional debt, making capital expenditures or declaring dividends. If we raise additional capital for acquisitions through equity financing, the ownership interests of existing shareholders will be diluted.
If we are unable to acquire suitable acquisition candidates, we may experience slower growth. Further, we may face challenges in integrating any acquired business. These challenges include eliminating redundant operations, facilities and systems,
14
coordinating management and personnel, retaining key employees, managing different corporate cultures and achieving cost reductions and cross-selling opportunities. Additionally, the acquisition and integration processes may disrupt our business and divert management attention and our resources. If we fail to successfully integrate acquired businesses, products, technologies and personnel, it could impair relationships with employees, clients and strategic partners, distract management attention from our core businesses, result in control failures and otherwise disrupt our ongoing business, any of which could have a material adverse effect on our business, financial condition and results of operations. We also may not be able to retain key management and other critical employees after an acquisition. In addition, we may be required to record future charges for impairment of goodwill and other intangible assets resulting from such acquisitions.
Our profitability may be affected by gains or losses on any sales of businesses, or lost operating income or cash flows from such businesses. We also may be required to record asset impairment or restructuring charges related to divested businesses, or indemnify buyers for liabilities, which may reduce our profitability and cash flows. We may also be unable to negotiate such divestitures on terms acceptable to us. If we are unsuccessful in divesting such businesses, it could have a material adverse effect on our business, financial condition and results of operations.
Our reliance on third parties subjects us to risk and may disrupt or adversely affect our operations. In addition, we may not realize the full benefit of our third-party arrangements, which may result in increased costs, or may adversely affect the service levels we are able to provide our clients.
We rely upon third parties for various business process and information technology services, including information security testing, telecommunications and software code development. Although we have contractual provisions with our providers that specify performance requirements, we do not ultimately control their performance, which may make our operations vulnerable to their performance failures. In addition, our failure to adequately monitor and regulate the performance of our third-party vendors could subject us to additional risk. Reliance on third parties also makes us vulnerable to changes in our vendors' businesses, financial condition and other matters outside of our control, including their violations of laws or regulations, which could increase our exposure to liability or otherwise increase the costs associated with the operation of our business. The failure of our providers to perform as expected or as contractually required could result in significant disruptions and costs to our operations and to the services we provide to our clients, which could have a material adverse effect on our business, financial condition and results of operations.
We depend on our ability to access data from external sources to maintain and grow our businesses. If we are unable to access needed data from these sources or if the prices charged for these services increase, the quality, pricing and availability of our solutions may be adversely affected, which could have a material adverse effect on our business, financial condition and results of operations.
We rely extensively upon data from a variety of external sources to maintain our proprietary and non-proprietary databases, including data from third-party suppliers, various government and public record sources and data contributed by our clients. Our data sources could cease providing or reduce the availability of their data to us, increase the price we pay for their data or limit our use of their data for a variety of reasons, including legislatively or judicially imposed restrictions on use. If a number of suppliers are no longer able or are unwilling to provide us with certain data, or if our public record sources of data become unavailable or too expensive, we may need to find alternative sources. If we are unable to identify and contract with suitable alternative data suppliers and efficiently and effectively integrate these data sources into our service offerings, we could experience service disruptions, increased costs and reduced quality of our services. Moreover, some of our suppliers compete with us in certain product offerings, which may make us vulnerable to unpredictable price increases from them. Significant price increases could require us to seek substitute sources of data on more favorable economic terms, which may not be available at all. Loss of such access or the availability of data in the future on commercially reasonable terms or at all may reduce the quality and availability of our services and solutions, which could have a material adverse effect on our business, financial condition and results of operations.
Our international third-party service providers and our own international operations subject us to additional risks, which could have a material adverse effect on our business, financial condition and results of operations.
Over the last few years, we have sought to reduce our costs by utilizing lower-cost labor outside the United States in countries such as India. These countries may be subject to higher degrees of political and social instability than the United States and may lack the infrastructure to withstand political unrest or natural disasters. Such disruptions can affect our ability to deliver our solutions on a timely basis, if at all, and to a lesser extent can decrease efficiency and increase our costs. Weakness of the U.S. dollar in relation to the currencies used and higher inflation rates experienced in these countries may also reduce anticipated savings. Furthermore, the practice of utilizing labor based in foreign countries has come under increased scrutiny in the United States and, as a result, many of our clients may require us to use labor based in the United States. We may not be able to pass on the increased costs of higher-priced United States-based labor to our clients, which could have a material adverse effect on our business, financial condition and results of operations.
15
In addition, the foreign countries in which we have outsourcing arrangements or operate could adopt new legislation or regulations that could make it difficult, more costly or impossible for us to continue our foreign activities as currently being conducted. In addition, in many foreign countries, particularly in those with developing economies, it is common to engage in business practices that are prohibited by laws and regulations applicable to us, such as the Foreign Corrupt Practices Act ("FCPA") or other local anti-corruption laws. Any violations of FCPA or local anti-corruption laws by us or our subsidiaries, could result in substantial financial and other penalties, which could have a material adverse effect on our business, financial condition and results of operations.
We have substantial investments in recorded goodwill and other intangible assets as a result of prior acquisitions, and an economic downturn or troubled mortgage market could cause these investments to become impaired, requiring write-downs that could have a material adverse effect on our results of operations.
Goodwill recorded on our balance sheet was approximately $2.3 billion, or approximately 61% of our total assets, as of December 31, 2016. Other intangible assets recorded on our balance sheet were approximately $299.5 million, or approximately 8% of our total assets. Current accounting rules require that goodwill and other indefinite lived intangible assets be assessed for impairment at least annually or whenever changes in circumstances indicate that the carrying amount may not be recoverable. Current accounting rules require that intangible assets with finite useful lives be assessed for impairment whenever events or changes in circumstances indicate that the carrying amount may not be recoverable. Factors that may indicate the carrying value of our intangible assets, including goodwill, may not be recoverable include, but are not limited to, significant underperformance relative to historical or projected future results of operations, a significant decline in our stock price and market capitalization, and negative industry or economic trends. No goodwill or other intangible assets impairment charge was recorded during 2016. However, if there is an economic downturn in the future, the carrying amount of our goodwill or other intangible assets may no longer be recoverable, and we may be required to record an impairment charge, which could have a material adverse effect on our results of operations. We will continue to monitor our market capitalization and the effect of the economy to determine if there is an impairment of goodwill or other intangible assets in future periods.
If we fail to develop widespread brand awareness cost-effectively, it could have a material adverse effect on our business, financial condition and results of operations.
We believe that developing and maintaining widespread awareness of our brand in a cost-effective manner is critical to our ability to achieve widespread acceptance of our technology and attract new clients. Brand promotion activities may not generate client awareness or increase revenues, and even if they do, any increase in revenues may not offset the expenses we incur in building our brand. If we fail to successfully promote and maintain our brand, or incur substantial expenses, we may fail to attract or retain clients necessary to realize a sufficient return on our brand-building efforts, or to achieve the widespread brand awareness that is critical for broad client adoption of our applications, which could have a material adverse effect on our business, financial condition and results of operations.
We may experience system failures with respect to our technology solutions, damage or interruption that could harm our business and reputation and expose us to potential liability.
We depend heavily upon the computer systems and our existing technology infrastructure located in our data centers and certain systems interruptions or events beyond our control could interrupt or terminate the delivery of our solutions and services to our clients and may interfere with our suppliers' ability to provide necessary data to us and our employees' ability to attend to work and perform their responsibilities.
These potential interruptions include, but are not limited to, damage or interruption from hurricanes, floods, fires, power losses, telecommunications outages, terrorist attacks, acts of war, human errors and similar events. Our U.S. corporate offices and primary data center are located in Jacksonville, Florida, which is an area that is at high risk of hurricane and flood damage. In addition, acts of terrorism, which may be targeted at metropolitan areas that have higher population density than rural areas, could cause disruptions in our business or the economy as a whole. The servers that we use through various third-party service providers may also be vulnerable to similar disruptions, which could lead to interruptions, delays and loss of critical data. Such service providers may not have sufficient protection or recovery plans in certain circumstances, and our insurance may not be sufficient to compensate us for losses that may occur.
Defects in our technology solutions, errors or delays in the processing of electronic transactions, or other difficulties could result in:
• | interruption of business operations; |
• | delay in market acceptance; |
• | us, or our clients, missing a regulatory deadline; |
• | additional development and remediation costs; |
• | diversion of technical and other resources; |
• | loss of clients; |
16
• | negative publicity; or |
• | exposure to liability claims. |
Any one or more of the foregoing occurrences could have a material adverse effect on our business, financial condition and results of operations. Although we attempt to limit our potential liability through disclaimers and limitation-of-liability provisions in our license and client agreements, we cannot be certain that these measures will be successful in limiting our liability.
We may experience delays or difficulty in developing or implementing new, enhanced or existing software or hosting solutions, which may negatively affect our relationships with existing and potential clients, reduce or delay the generation of revenues or increase development and implementation costs, which could have a material adverse effect on our business, financial condition and results of operations.
Our future financial performance depends upon the successful development, implementation and client acceptance of new, existing and enhanced versions of our software and hosting solutions. We continually seek to develop enhancements to our solutions, including updates in response to changes in applicable laws, as well as new offerings to supplement our existing solutions. As a result, we are subject to the risks inherent in the development and integration of new technologies, including defects or undetected errors in our technology solutions, difficulties in installing or integrating our technologies on platforms used by our clients, or other unanticipated performance, stability and compatibility problems. Any of these problems could result in material delays in the introduction or acceptance of our solutions, increased costs, decreased client satisfaction, breach of contract claims, harm to our industry reputation and reduced or delayed revenues. If we are unable to implement existing solutions or deliver new solutions or upgrades or other enhancements to our existing solutions on a timely and cost-effective basis, it could have a material adverse effect on our business, financial condition and results of operations.
Because our revenues from clients in the mortgage lending industry are affected by the strength of the economy and the housing market generally, including the volume of real estate transactions, a change in any of these conditions could have a material adverse effect on our business, financial condition and results of operations.
Our revenues are primarily generated from technology, data and analytics we provide to the mortgage industry and, as a result, a weak economy or housing market may have a material adverse effect on our business, financial condition and results of operations. The volume of mortgage origination and residential real estate transactions is highly variable and reductions in these transaction volumes could have a direct effect on the revenues we generate from our technology business and some of our data and analytics businesses.
The revenues we generate from our servicing technology depend upon the total number of mortgage loans processed on MSP, which tends to be comparatively consistent regardless of economic conditions. However, in the event that a difficult economy or other factors lead to a decline in levels of home ownership and a reduction in the number of mortgage loans outstanding and we are not able to counter the effect of those events with increased market share or higher fees, our mortgage processing revenues could be adversely affected. Moreover, negative economic conditions, including increased unemployment or interest rates or a downturn in other general economic factors, among other things, could adversely affect the performance and financial condition of some of our clients in many of our businesses, which may have a material adverse effect on our business, financial condition and results of operations if these clients go bankrupt or otherwise exit certain businesses.
A weaker economy and housing market tend to increase the volume of consumer mortgage defaults, which can increase revenues from our applications focused on supporting default management functions. However, government regulation of the mortgage industry in general, and the default and foreclosure process in particular, has greatly slowed the processing of defaulted mortgages in recent years and has changed the way many of our clients address mortgage loans in default. A downturn in the origination market and a concurrent slowdown or change in the way mortgage loans in default are addressed could have a material adverse effect on our business, financial condition and results of operations.
We have substantial indebtedness, which could have a negative effect on our financing options and liquidity position.
As of December 31, 2016, we had approximately $1.6 billion of total debt outstanding.
Our substantial indebtedness could have important consequences to us, including:
• | making us more vulnerable to economic downturns and adverse developments in our business, which may cause us to have difficulty borrowing money in the future for working capital, capital expenditures, acquisitions or other purposes and may limit our ability to pursue other business opportunities and implement certain business strategies; |
• | requiring us to use a large portion of the money we earn to pay principal and interest on our debt, which could reduce the amount of money available to finance operations, acquisitions and other business activities; |
• | exposing us to the risk of increased interest rates as $1.2 billion in principal amount of our debt bears interest at a floating rate as of December 31, 2016 (an increase of one percentage point in the applicable interest rate could cause an increase in interest expense of approximately $11.8 million on an annual basis ($7.8 million including the effect |
17
of our current interest rate swaps) based on the principal outstanding as of December 31, 2016, which may make it more difficult for us to service our debt);
• | exposing us to costs and risks associated with agreements limiting our exposure to higher interest rates, as such agreements may not offer complete protection from these risks, and we are subject to the risk that one or more of the counterparties to these agreements may fail to satisfy their obligations under such agreements; and |
• | causing a competitive disadvantage if we have higher levels of debt than our competitors by reducing our flexibility in responding to changing business and economic conditions, including increased competition. |
Risks associated with our indebtedness could have a material adverse effect on our business, financial condition and results of operations.
Despite our indebtedness level, we still may be able to incur significant additional amounts of debt, which could further exacerbate the risks associated with our substantial indebtedness.
We and our subsidiaries may be able to incur substantial additional indebtedness in the future. Although the indenture governing the Senior Notes and the Credit Agreement governing the Facilities, as described in Note 11 to the Notes to Consolidated Financial Statements, impose operating and financial restrictions on our activities, these restrictions are subject to a number of significant qualifications and exceptions, and under certain circumstances, the amount of indebtedness that could be incurred in compliance with these restrictions could be substantial. If new debt is added to our outstanding debt levels, the risks related to our indebtedness that we will face could increase.
Certain of our financing arrangements subject us to various restrictions that could limit our operating flexibility.
The indenture governing the Senior Notes and the Credit Agreement governing the Facilities impose operating and financial restrictions on our activities, and future debt instruments may as well. These restrictions include compliance with, or maintenance of, certain financial tests and ratios, including a minimum interest coverage ratio and maximum leverage ratio, and limit or prohibit our ability to, among other things:
• | create, incur or assume any additional debt and issue preferred stock; |
• | create, incur or assume certain liens; |
• | redeem and/or prepay certain subordinated debt we might issue in the future; |
• | pay dividends on our stock or repurchase stock; |
• | make certain investments and acquisitions; |
• | enter into or permit to exit contractual limits on the ability of our subsidiaries to pay dividends to us; |
• | enter new lines of business; |
• | engage in mergers and acquisitions; |
• | engage in specified sales of assets; and |
• | enter into transactions with affiliates. |
These restrictions on our ability to operate our business could limit our ability to take advantage of financing, merger and acquisition and other corporate opportunities, which could have a material adverse effect on our business, financial condition and results of operations.
We may not be able to generate sufficient cash to service all of our indebtedness and may be forced to take other actions to satisfy our obligations under our outstanding debt instruments, which may not be successful.
Our ability to make scheduled payments on or refinance our debt obligations depends on our financial condition and results of operations, which are subject to prevailing economic and competitive conditions and to certain financial, business, legislative, regulatory and other factors beyond our control. We may be unable to maintain a level of cash flows from operating activities sufficient to permit us to pay the principal, premium, if any, and interest on our indebtedness. Our inability to generate sufficient cash flows to satisfy our debt obligations, or to refinance our indebtedness on commercially reasonable terms or at all, could have a material adverse effect on our business, financial condition and results of operations. If we cannot make scheduled payments on our debt, we will be in default and holders of our outstanding debt could declare all outstanding principal and interest to be due and payable, and we could be forced into bankruptcy or liquidation.
Our risk management policies and procedures may prove inadequate for the risks we face, which could have a material adverse effect on our business, financial condition and results of operations.
We have devoted significant resources to develop our risk management policies and procedures and expect to continue to do so in the future. Nonetheless, our risk management strategies may not be fully effective in mitigating our risk exposure in all market environments or against all types of risk, including risks that are unidentified or unanticipated. If our solutions change and as the markets in which we operate evolve, our risk management strategies may not always adapt to such changes. Some of our methods of managing risk are based upon our use of observed historical market behavior and management's judgment. Other of our methods of managing risk depend on the evaluation of information regarding markets, customers, catastrophe occurrence or
18
other matters that is publicly available or otherwise accessible to us. This information may not always be accurate, complete, up-to-date or properly evaluated. As a result, these methods may not predict future risk exposures, which could be significantly greater than the historical measures or available information indicate. In addition, management of operational, legal and regulatory risks requires, among other things, policies and procedures to record and verify large numbers of transactions and events, which may not be fully effective. While we employ a broad and diversified set of risk monitoring and risk mitigation techniques, those techniques and the judgments that accompany their application cannot anticipate every economic and financial outcome or the timing of such outcomes. If our risk management efforts are ineffective, we could suffer losses that could have a material adverse effect on our business, financial condition and results of operations. In addition, we could be subject to litigation, particularly from our clients, and sanctions or fines from regulators.
Certain members of our Board of Directors and certain of our officers and directors have interests and positions that could present potential conflicts.
We are party to a variety of related party agreements and relationships with FNF, certain of FNF's subsidiaries and THL. Certain of our executive officers are employed by FNF or FNF's subsidiaries and certain of our directors serve on the boards of directors of FNF or its subsidiaries or are affiliated with THL. As a result of the foregoing, there may be circumstances where certain of our executive officers and directors may be subject to conflicts of interest with respect to, among other things: (i) our ongoing relationships with FNF, FNF's subsidiaries or THL, including related party agreements and other arrangements with respect to the administration of tax matters, employee benefits and indemnification; (ii) the quality, pricing and other terms associated with services that we provide to FNF or its subsidiaries, or that they provide to us, under related party agreements; (iii) business opportunities arising for any of us, FNF, FNF's subsidiaries or THL; and (iv) conflicts of time with respect to matters potentially or actually involving or affecting us.
We have in place a code of business conduct and ethics prescribing procedures for managing conflicts of interest and our chief compliance officer and audit committee are responsible for the review, approval, or ratification of any potential conflicts of interest transactions. Additionally, we expect that interested directors will abstain from decisions with respect to conflicts of interest as a matter of practice. However, there can be no assurance that such measures will be effective or that we will be able to resolve all potential conflicts, or that the resolution of any such conflicts will be no less favorable to us than if we were dealing with an unaffiliated third party.
Our senior leadership team is critical to our continued success and the loss of such personnel could have a material adverse effect on our business, financial condition and results of operations.
Our future success substantially depends on the continued service and performance of the members of our senior leadership team. These personnel possess business and technical capabilities that are difficult to replace. We have attempted to mitigate this risk by entering into long-term (two to three year) employment contracts with the members of our senior management operating team. If we lose key members of our senior management operating team, we may not be able to effectively manage our current operations or meet ongoing and future business challenges, and this could have a material adverse effect on our business, financial condition and results of operations.
We may fail to attract and retain enough qualified employees to support our operations, which could have an adverse effect on our ability to expand our business and service our clients.
Our business relies on large numbers of skilled employees and our success depends on our ability to attract, train and retain a sufficient number of qualified employees. If our attrition rate increases, our operating efficiency and productivity may decrease. We compete for employees not only with other companies in our industry but also with companies in other industries, such as software services, engineering services and financial services companies, and there is a limited pool of employees who have the skills and training needed to do our work. If our business continues to grow, the number of people we will need to hire will increase. We will also need to increase our hiring if we are not able to maintain our attrition rate through our current recruiting and retention policies. Increased competition for employees could have a material adverse effect on our ability to expand our business and service our clients, as well as cause us to incur greater personnel expenses and training costs.
We may not be able to effectively achieve our growth strategies, which could adversely affect our business, financial condition and results of operations.
Our growth strategies depend in part on maintaining our competitive advantage with current solutions in new and existing markets, as well as our ability to develop new technologies and solutions to serve such markets. There can be no assurance that we will be able to compete successfully in new markets or continue to compete effectively in our existing markets. If we fail to introduce new technologies or solutions effectively or on a timely basis, or if we are not successful in introducing or obtaining regulatory or market acceptance for new solutions, we may lose market share and our results of operations or cash flows could be adversely affected.
19
Current and future litigation, investigations or other actions against us could be costly and time consuming to defend.
We are from time to time subject to legal proceedings and claims that arise in the ordinary course of business, such as claims brought by our clients in connection with commercial disputes and employment claims made by our current or former employees. Litigation can result in substantial costs and may divert management's attention and resources, which may seriously harm our business, financial condition and results of operations. From time to time, we also receive requests for information from various state and federal regulatory authorities, some of which take the form of civil investigative demands or subpoenas. Some of these regulatory inquiries may result in the assessment of fines for violations of regulations or settlements with such authorities requiring a variety of remedies.
Although certain matters are subject to a cross-indemnity agreement between BKFS LLC and ServiceLink, there can be no assurance that we will not incur additional material costs and expenses in connection with ongoing or future investigations or claims, including but not limited to fines or penalties and legal costs, or be subject to other remedies, any of which could have a material adverse effect on our business, financial condition and results of operations. Insurance may not cover such investigations and claims, may not be sufficient for one or more such investigations and claims and may not continue to be available on terms acceptable to us. An investigation or claim brought against us that is uninsured or underinsured could result in unanticipated costs, management distraction or reputational harm, which could have a material adverse effect on our business, financial condition and results of operations and adversely affect the trading price of our stock.
Risks Related to Our Structure
We are a holding company and our only material asset is our interest in BKFS LLC and, accordingly, we are dependent upon distributions from BKFS LLC to pay taxes and other expenses.
We are a holding company and we have no material assets other than our ownership of Units of BKFS LLC. We have no independent means of generating revenues. Based on current accounting guidance, we have determined that BKFS LLC is a variable interest entity, or VIE, for accounting purposes and that we have a controlling interest in the VIE. As a result, our results of operations and financial condition are reported on a consolidated basis with BKFS LLC. In the event of a change in the accounting guidance or amendments to BKFS LLC's operating agreement resulting in us no longer having a controlling interest in BKFS LLC, we may not be able to consolidate BKFS LLC, which could have a material effect on our business, financial condition and results of operations.
BKFS LLC is treated as a partnership for United States federal income tax purposes and, as such, is itself not subject to United States federal income tax. Instead, its taxable income is generally allocated to its members, including us. Accordingly, we incur income taxes on any taxable income of BKFS LLC that is allocated to us and also incur expenses related to our operations. Subject to the availability of net cash flow at the BKFS LLC level and to applicable legal and contractual restrictions, we intend to cause BKFS LLC to distribute cash to its members, including us, to cover their respective tax liabilities, if any, with respect to their allocable share of the income of BKFS LLC and to cover any other costs or expenses of Black Knight, including any dividends.
We have entered into an advancement agreement with BKFS LLC pursuant to which BKFS LLC advances the cost of (or pays on behalf of Black Knight) expenses incurred by Black Knight, including fees and expenses incurred in any equity offering by Black Knight or selling shareholders, customary costs and expenses associated with being a public company, including costs of professional advisors engaged by Black Knight or its Board of Directors, indemnification obligations of Black Knight, directors fees and certain taxes. To the extent that we need funds to pay our liabilities or to fund our operations, and BKFS LLC is restricted from making distributions to us under applicable agreements, laws or regulations or does not have sufficient cash to make these distributions, we may have to borrow funds to meet these obligations and operate our business, and our liquidity and financial condition could be materially adversely affected.
In certain circumstances, items of taxable income, gain, deduction or loss may not be allocated by BKFS LLC for income tax purposes to its members in proportion to the number of Units owned by each member and we may not receive our proportionate share of tax distributions from BKFS LLC.
BKFS LLC is treated as a partnership for income tax purposes and, as such, is itself not subject to income tax. Instead, the taxable income of BKFS LLC is allocated to its members, including us, and the members are required to reflect on their own income tax returns the items of income, gain, deduction and loss and other tax items of BKFS LLC that are allocated to them. Under the LLC Agreement and subject to restrictions under any financing arrangements, BKFS LLC is required to make tax distributions to its members in order to enable them to pay taxes on their allocable share of BKFS LLC's taxable income. Under the LLC Agreement, the right to receive tax distributions is independent from the right to receive ordinary distributions from BKFS LLC, and any tax distributions received by a holder of Units are taken into account in determining the portion of any ordinary distributions that the holder is entitled to receive.
Under the tax rules, BKFS LLC is required to allocate net taxable income disproportionately to its members in certain circumstances. Accordingly, certain items of deduction are not allocated pro rata among the holders of Units, and we and certain THL Affiliates may be allocated, on a net basis, a disproportionately greater percentage of certain items of deduction relative to
20
BKHI and certain of its affiliates. As a result, we may receive less than our proportionate share of tax distributions relative to BKHI and certain of its affiliates. Moreover, any disproportionately greater tax distributions received by BKHI and certain of its affiliates will itself require an additional allocation of income to BKHI and certain of its affiliates to reflect such entitlement to the greater amount of tax distributions, which in turn could require an even greater tax distribution to BKHI and certain of its affiliates in respect of such additional allocation of income.
BKFS LLC may be required to make tax distributions to holders of Units in amounts in excess of the tax expense that BKFS LLC would incur if it were a similarly situated corporate taxpayer.
Tax distributions are generally made based on an assumed tax rate equal to the highest combined marginal federal, state and local income tax rate applicable to a U.S. corporation, which may be higher than the combined tax rate that would be applicable to BKFS LLC if it were a similarly situated corporate taxpayer. Thus, after taking into account required tax distributions, BKFS LLC may have less funds available to reinvest in its business and to fund future growth than it would have had if BKFS LLC were a similarly situated corporate taxpayer. In addition, under the LLC Agreement, tax distributions are calculated based on allocations of income for a particular taxable year without taking into account any losses allocated to the holder in a prior taxable year. However, if BKFS LLC were a similarly situated corporate taxpayer, it would generally be entitled to offset taxable income earned in one year with losses incurred in a prior year, thereby reducing its income tax expense. Further, as discussed above, certain items of deduction may be allocated disproportionately among the holders of Units, us and certain THL Affiliates in particular. As a result, it is possible that even if BKFS LLC incurs an overall loss for a particular taxable year, BKHI and certain of its affiliates may be allocated net earnings (as a result of an allocation of fewer deductions that does not fully offset its proportionate share of gross earnings allocations) while we and certain THL Affiliates will be allocated a greater amount of loss than the overall loss incurred by BKFS LLC. In such circumstance, BKFS LLC may be required to make a tax distribution to BKHI and certain of its affiliates even though it would have had an overall loss, and therefore no tax expense, had it been a similarly situated corporate taxpayer.
If we do not elect to issue shares of Class A common stock for future exchanges of Units in lieu of BKFS LLC making cash payments, such cash payments may reduce the amount of overall cash flow that would otherwise be available to us.
Each outstanding Unit, together with one share of our Class B common stock, is exchangeable for a cash payment from BKFS LLC, or, at our option, one share of Class A common stock. If BKFS LLC makes cash payments in respect of exchanges of Units, such payments may require the payment of significant amounts of cash and may reduce the amount of overall cash flow that could otherwise be available for distribution to us from BKFS LLC, and our ability to successfully execute our growth strategy may be negatively affected.
We are a "controlled company" within the meaning of NYSE rules, and as a result, we qualify for, and rely on, exemptions from certain corporate governance requirements. You may not have the same protections afforded to shareholders of companies that are subject to such requirements.
FNF, through BKHI, controls a majority of the voting power of our outstanding common stock and a controlling interest in us as a result of its ownership of Class B common stock. As a result, we qualify as a "controlled company" within the meaning of the corporate governance rules of the NYSE. Under these rules, a company of which more than 50% of the voting power in the election of directors is held by an individual, group or another company is a "controlled company" and may elect not to comply with certain corporate governance requirements, including the requirements that (i) a majority of the Board of Directors consist of independent directors and (ii) that the Board of Directors have compensation and nominating and corporate governance committees composed entirely of independent directors.
We utilize the independence exception provided for our compensation and nominating and corporate governance committees. As a result, we do not have a compensation or nominating and corporate governance committee composed entirely of independent directors. In addition, one-half of our Board of Directors is currently composed of independent directors, and we are not required to have a Board of Directors that is composed of a majority of independent directors at any time in the future so long as we are still a "controlled company." Accordingly, you will not have the same protections afforded to shareholders of companies that are subject to all of the corporate governance requirements set by the NYSE. In the event that we cease to be a "controlled company" and our shares continue to be listed on the NYSE, we will be required to comply with these provisions within the applicable transition periods.
We are controlled by FNF, whose interests may differ from those of our public shareholders.
We are controlled by FNF through its wholly-owned subsidiary BKHI who beneficially owns approximately 54.1% of the combined voting power of our common stock. As a result of this ownership, FNF has effective control over the outcome of votes on all matters requiring approval by our shareholders, including the election of directors, the adoption of amendments to our certificate of incorporation and bylaws and other significant corporate transactions. FNF can also cause BKHI to take actions that have the effect of delaying or preventing a change of control of us or discouraging others from making tender offers for our shares,
21
which could prevent shareholders from receiving a premium for their shares. These actions may be taken even if other shareholders oppose them.
In addition, persons associated with FNF currently serve on our Board of Directors. The interests of FNF may not always coincide with the interests of our other shareholders, and the concentration of effective control in FNF will limit other shareholders' ability to influence corporate matters. The concentration of ownership and voting power of FNF, through BKHI, may also delay, defer or even prevent an acquisition by a third party or other change of control and may make some transactions more difficult or impossible without their support, even if such events are in the best interests of our other shareholders. Therefore, the concentration of voting power controlled by FNF, through BKHI, may have an adverse effect on the price of our Class A common stock. We may also take actions that our other shareholders do not view as beneficial, which may adversely affect our business, financial condition and results of operations and cause the value of your investment to decline.
Further, FNF may have an interest in pursuing acquisitions, divestitures, financing or other transactions, including, but not limited to, the issuance of additional debt or equity and the declaration and payment of dividends, that, in its judgment, could enhance their equity investments, even though such transactions may involve risk to us or to our creditors. Additionally, FNF may make investments in businesses that directly or indirectly compete with us, or may pursue acquisition opportunities that may be complementary to our business and, as a result, those acquisition opportunities may not be available to us.
FNF's proposed plan to distribute shares of Black Knight is subject to inherent risks.
FNF has announced a plan by which it intends to distribute all 83.3 million shares of Black Knight common stock currently owned by FNF to FNF Group shareholders. The Distribution Plan is subject to the receipt of a private letter ruling from the IRS approving the distribution of Black Knight shares, filing and acceptance of a registration statement related to the distribution with the SEC, the refinancing of the Senior Notes, which are subject to the FNF guarantee, on reasonable terms, Black Knight shareholder approval and other customary closing conditions. No assurance can be given that any of the foregoing conditions will be met. The Distribution Plan is subject to inherent risks and uncertainties including, among others: risks that the Distribution Plan as a whole will not be consummated or that the distribution of Black Knight shares will not be consummated, increased demands on our management team to accomplish the Distribution Plan and significant transaction costs. In addition, no assurance can be given that we will realize the potential strategic and financial benefits from the Distribution Plan in the near term or at all, and no assurance can be given that the market will react favorably to the Distribution Plan or any of the transactions contemplated thereby.
Our certificate of incorporation and bylaws, the LLC Agreement and provisions of Delaware law may discourage or prevent strategic transactions, including a takeover of our company, even if such a transaction would be beneficial to our shareholders.
Provisions contained in our certificate of incorporation and bylaws, the LLC Agreement and provisions of the Delaware General Corporation Law, or DGCL, could delay or prevent a third party from entering into a strategic transaction with us, as applicable, even if such a transaction would benefit our shareholders. For example, our certificate of incorporation and bylaws:
• | divide our Board of Directors into three classes with staggered three-year terms, which may delay or prevent a change of our management or a change of control; |
• | authorize the issuance of "blank check" preferred stock that could be issued by us upon approval of our Board of Directors to increase the number of outstanding shares of capital stock, making a takeover more difficult and expensive; |
• | provide that directors may be removed from office only for cause and that any vacancy on our Board of Directors may only be filled by a majority of our directors then in office, which may make it difficult for other shareholders to reconstitute our Board of Directors; |
• | provide that special meetings of the shareholders may be called only upon the request of a majority of our Board of Directors or by the chairman of the Board of Directors or our chief executive officer; and |
• | require advance notice to be given by shareholders for any shareholder proposals or director nominees. |
These restrictions and provisions could keep us from pursuing relationships with strategic partners and from raising additional capital, which could impede our ability to expand our business and strengthen our competitive position. These restrictions could also limit shareholder value by impeding a sale of us or BKFS LLC.
Risks Related to Owning Shares of Our Class A Common Stock
The market price of our Class A common stock may be volatile and you may lose all or part of your investment.
The market price of our Class A common stock could fluctuate significantly, and you may not be able to resell your shares at or above the price at which your shares were acquired. Those fluctuations could be based on various factors, including those described under "Risks Related to Our Business" and the following:
• | our operating performance and the performance of our competitors and fluctuations in our operating results; |
• | the public's reaction to our press releases, our other public announcements and our filings with the SEC; |
22
• | changes in earnings estimates or recommendations by research analysts who follow us or other companies in our industry; |
• | global, national or local economic, legal and regulatory factors unrelated to our performance; |
• | announcements by us or our competitors of new products, services, strategic investments or acquisitions; |
• | actual or anticipated variations in our or our competitors' operating results, and our and our competitors' growth rates; |
• | failure by us or our competitors to meet analysts' projections or guidance we or our competitors may give the market; |
• | changes in laws or regulations, or new interpretations or applications of laws and regulations, that are applicable to our business; |
• | changes in accounting standards, policies, guidance, interpretations or principles; |
• | the arrival or departure of key personnel; |
• | the number of shares publicly traded; |
• | future sales or issuances of our Class A common stock, including sales, distributions or issuances by us, our officers or directors and our significant shareholders, including BKHI, THL and certain of their affiliates; and |
• | other developments affecting us, our industry or our competitors. |
In addition, in recent years the stock market has experienced significant price and volume fluctuations that have affected and continue to affect the market prices of equity securities of many companies. These fluctuations have often been unrelated or disproportionate to the operating performance of those companies. These broad market fluctuations, as well as general economic, political and market conditions such as recessions or interest rate changes, may cause declines in the market price of our Class A common stock and you may not realize any return on your investment in us and may lose some or all of your investment.
As we primarily operate in a single industry, we are especially vulnerable to these factors to the extent that they affect our industry or our products. In the past, securities class action litigation has often been initiated against companies following periods of volatility in their stock price. This type of litigation could result in substantial costs and divert our management's attention and resources, and could also require us to make substantial payments to satisfy judgments or to settle litigation.
If we elect to issue shares of Class A common stock upon exchange or conversion of Units, in lieu of BKFS LLC making a cash payment, such issuance of Class A common stock may dilute your ownership of Class A common stock.
Each outstanding Unit, together with one share of our Class B common stock, is exchangeable for a cash payment from BKFS LLC or, at our option, one share of Class A common stock. If we elect to issue shares of our Class A common stock in respect of these exchanges, your ownership of shares of Class A common stock will be diluted.
If securities or industry analysts publish inaccurate or unfavorable research about our business, our stock price and trading volume could decline.
The trading market for our Class A common stock is influenced in part on the research and reports that securities or industry analysts publish about us or our business. If one or more of the analysts who cover us downgrades our Class A common stock or publishes inaccurate or unfavorable research about our business, our stock price could decline. If one or more of these analysts ceases coverage of us or fails to publish reports on us regularly, demand for our Class A common stock could decrease, which could cause our stock price and trading volume to decline.
We do not intend to pay dividends for the foreseeable future.
We may retain future earnings, if any, for future operations, expansion and debt repayment. We have not paid cash dividends to date and have no current plans to pay any cash dividends for the foreseeable future. As a result of our current dividend policy, you may not receive any return on an investment in our Class A common stock unless you sell our Class A common stock for a price greater than that which you paid for it. Any future determination to declare and pay cash dividends will be at the discretion of our Board of Directors and will depend on, among other things, our financial condition, results of operations, cash requirements, contractual restrictions and such other factors as our Board of Directors deems relevant. Our ability to pay dividends depends on our receipt of cash dividends from our operating subsidiaries, which may further restrict our ability to pay dividends as a result of the laws of their jurisdiction of organization or agreements of our subsidiaries, including agreements governing our indebtedness. Any cash dividends, other than tax distributions, paid by BKFS LLC will be distributed pro-rata to its members, including us, BKHI and certain of its affiliates and certain THL Affiliates, according to the number of Units held. Existing or future agreements governing our indebtedness may also limit our ability to pay dividends.
Item 1B. | Unresolved Staff Comments |
None.
23
Item 2. | Properties |
Our corporate headquarters is located at 601 Riverside Avenue, Jacksonville, Florida 32204, which we own. We also own a facility in Sharon, Pennsylvania. We lease office space as follows as of December 31, 2016:
Location | Number of locations | ||
California | 5 | ||
Texas | 4 | ||
Florida | 3 | ||
Illinois | 3 | ||
Maryland | 3 | ||
Colorado | 2 | ||
Other states(1) | 9 | ||
India | 2 | ||
__________
(1) | Represents one location in each of nine states. |
As a result of the realignment of Property Insight on January 1, 2017, leases associated with 10 of the above locations were transferred to FNF.
Item 3. | Legal Proceedings |
For a description of our legal proceedings see discussion of Commitments and Contingencies in Note 12 to the Notes to Consolidated Financial Statements included in Item 8 of Part II of this Report, which is incorporated by reference into this Part I, Item 3.
Item 4. | Mine Safety Disclosure |
Not applicable.
PART II
Item 5. | Market for Registrant's Common Equity, Related Shareholder Matters and Issuer Purchases of Equity Securities |
On May 26, 2015, we completed the IPO of 18,000,000 shares of our Class A common stock, par value $0.0001 per share ("Class A common stock"), at an offering price of $24.50 per share. We granted the underwriters a 30-day option to purchase an additional 2,700,000 shares of our Class A common stock at the offering price, which was exercised in full. A total of 20,700,000 shares of Class A common stock were issued on May 26, 2015, with net proceeds of $475.1 million, reflecting gross proceeds of $507.2 million, net of underwriting fees of approximately $27.9 million and other offering costs of approximately $4.2 million. The use of the proceeds from the IPO is as follows: approximately $223.6 million for the partial repayment and refinancing of our other outstanding long-term debt, $218.0 million for the partial redemption of the Senior Notes (inclusive of $11.8 million in call premium and $1.4 million in accrued interest), a $17.3 million cash payment to certain THL Intermediaries and $16.2 million to fund operations.
Our Class A common stock is listed on the NYSE and trades under the trading symbol "BKFS." Our stock began trading on May 20, 2015. Prior to that time, there was no public market for our Class A common stock. Our initial public offering of Class A common stock was priced at $24.50 per share on May 20, 2015. There is currently no established public trading market for our Class B common stock. The information presented in the table below represents the high and low closing prices per share of our Class A common stock as reported on the NYSE for the periods indicated.
24
BKFS | Stock price high | Stock price low | |||||
Year ended December 31, 2016 | |||||||
First quarter | $ | 31.66 | $ | 26.00 | |||
Second quarter | 37.60 | 28.89 | |||||
Third quarter | 41.04 | 37.00 | |||||
Fourth quarter | 40.38 | 35.75 | |||||
Year ended December 31, 2015 | |||||||
Second quarter (since May 20, 2015) | $ | 30.87 | $ | 27.11 | |||
Third quarter | 35.35 | 28.54 | |||||
Fourth quarter | 36.25 | 32.07 | |||||
Information concerning securities authorized for issuance under our equity compensation plans will be included in Item 12 of Part III of this report.
Share Repurchase Program
On January 31, 2017, our Board of Directors authorized a three-year share repurchase program, effective February 3, 2017, under which the Company may repurchase up to 10 million shares of its Class A common stock. The timing and volume of share repurchases will be determined by our management based on ongoing assessments of the capital needs of the business, the market price of Black Knight common stock and general market conditions. The repurchase program authorizes us to purchase Black Knight common stock from time to time through February 2, 2020, through open market purchases, negotiated transactions or other means, in accordance with applicable securities laws and other restrictions.
25
PERFORMANCE GRAPH
The following graph shows a comparison of the cumulative total return for our Class A common stock from May 20, 2015 (the date our Class A common stock commenced trading on the NYSE) through December 31, 2016, and the S&P 500 Index and the S&P North American Technology Sector Index from May 20, 2015 though December 31, 2016. The data for the S&P 500 Index and the S&P North American Technology Sector Index assumes reinvestment of dividends. The graph assumes an initial investment of $100.00, and the cumulative returns are based on the market price as of each month end. Note that historic stock price performance is not necessarily indicative of future stock price performance.
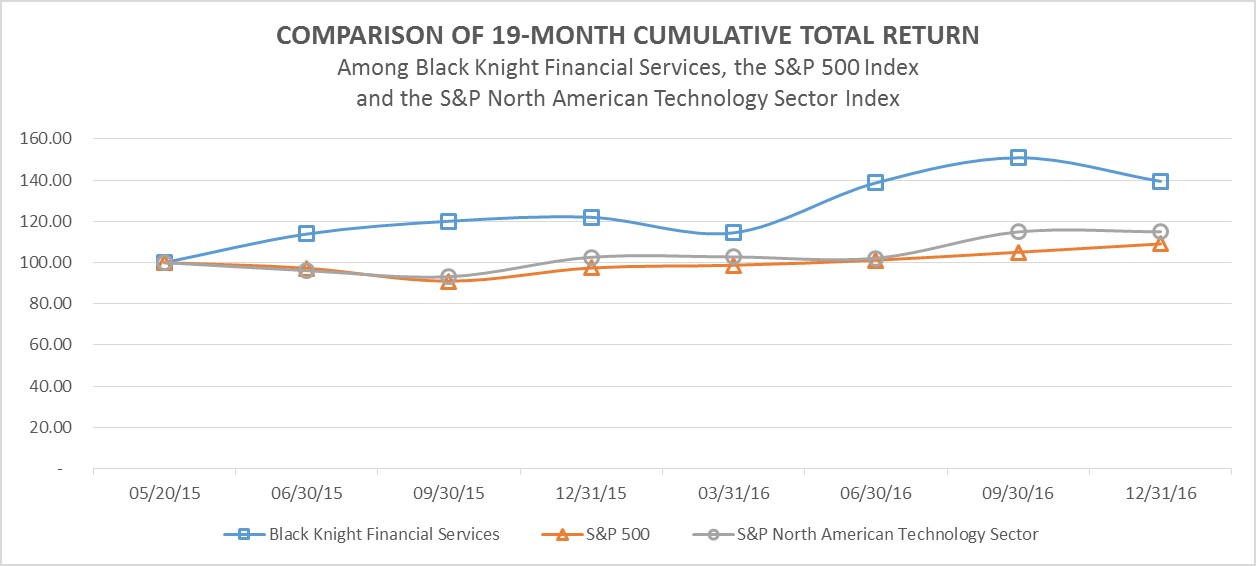
*$100 invested on May 20, 2015 in Black Knight or each respective index, including reinvestment of dividends.
Copyright© 2017 Standard & Poor's, a division of S&P Global. All rights reserved.
Initial | 6/30/15 | 9/30/15 | 12/31/15 | 3/31/16 | 6/30/16 | 9/30/16 | 12/31/16 | |
Black Knight | $100.00 | $113.87 | $120.07 | $121.95 | $114.46 | $138.69 | $150.87 | $139.43 |
S&P 500 Index | $100.00 | $97.26 | $91.00 | $97.41 | $98.72 | $101.15 | $105.04 | $109.06 |
S&P North American Technology Sector Index | $100.00 | $96.13 | $93.14 | $102.61 | $102.72 | $102.14 | $114.89 | $114.97 |
On January 31, 2017, the closing price of our Class A common stock on the NYSE was $36.45 per share. We had 64 holders of record of our Class A common stock. The actual number of shareholders is greater than this number of record holders, and includes shareholders who are beneficial owners but whose shares are held in street name by brokers and other nominees.
We have not declared or paid dividends on our Class A common stock, and have not and will not pay dividends on our Class B common stock (which holds no economic interest in Black Knight). We do not intend to pay cash dividends on our Class A common stock in the foreseeable future. Any future determination to pay dividends will be at the discretion of our Board of Directors and subject to, among other things, our compliance with applicable law, and depending on, among other things, our results of operations, financial condition, level of indebtedness, capital requirements, contractual restrictions, restrictions in our debt agreements, business prospects and other factors that our Board of Directors may deem relevant. We will evaluate future quarterly dividend payment amounts based on, among other things, our cash flow and liquidity position.
Our ability to pay dividends depends on our receipt of cash dividends from our operating subsidiaries, including BKFS LLC, which may further restrict our ability to pay dividends as a result of the laws of their jurisdiction of organization or agreements of our subsidiaries, including agreements governing our indebtedness. Any cash dividends, other than tax distributions, paid by BKFS LLC will be distributed pro-rata to its members, including us, BKHI and certain THL Affiliates, according to the number of Units held. Future agreements governing our indebtedness may also limit our ability to pay dividends.
If dividends are declared, holders of shares of our Class A common stock could be eligible to receive dividends in respect of such shares; however, holders of shares of our Class B common stock would not be entitled to any dividend payments in respect of such shares.
There were no unregistered sales of equity securities during the years ended December 31, 2016 and 2015.
26
Item 6. | Selected Financial Data |
The information set forth below should be read in conjunction with the Consolidated Financial Statements and related notes and "Management's Discussion and Analysis of Financial Condition and Results of Operations" included elsewhere in this Form 10-K. Certain reclassifications have been made to the prior year amounts to conform with the 2016 presentation.
As a result of the Internal Reorganization, BKFS LLC acquired substantially all of the former Technology, Data and Analytics segment of LPS and Commerce Velocity, a former indirect subsidiary of FNF. BKFS LLC did not acquire the former Transaction Services segment of LPS. On June 2, 2014, two wholly-owned subsidiaries of FNF contributed their respective interests in Property Insight to BKFS LLC. In accordance with U.S. generally accepted accounting principles ("GAAP") requirements for transactions between entities under common control, the Consolidated and Combined Financial Statements of BKFS LLC have been adjusted to reflect Commerce Velocity and Property Insight as of October 16, 2013, the date on which BKFS LLC was formed. LPS is considered the legal predecessor of BKFS LLC. For financial reporting purposes, BKFS LLC, including Commerce Velocity and Property Insight, is a predecessor for the period from October 16, 2013 through January 1, 2014. BKFS LLC is presented as the successor for periods subsequent to January 1, 2014.
Selected Historical Consolidated and Combined Financial Data of Black Knight
The Consolidated Statements of Operations data for the years ended December 31, 2016, 2015 and 2014 and the Consolidated Balance Sheet data as of December 31, 2016 and 2015 are derived from the audited Consolidated Financial Statements of Black Knight and BKFS LLC included in this Annual Report on Form 10-K. The Combined Statement of Operations data for the period from October 16, 2013 through December 31, 2013 and the Consolidated Balance Sheet data as of December 31, 2014 are derived from the audited Consolidated and Combined Financial Statements of Black Knight and BKFS LLC not included or incorporated by reference into this Annual Report on Form 10-K. The Combined Statement of Operations data for the period from October 16, 2013 through December 31, 2013 represents the combined financial data of Commerce Velocity and Property Insight that is not included or incorporated by reference into this Annual Report on Form 10-K.
27
Successor | Predecessor | |||||||||||||||
Year ended December 31, | Period from October 16, 2013 through December 31, 2013 | |||||||||||||||
2016 | 2015 | 2014 | ||||||||||||||
(In millions, except per share data) | ||||||||||||||||
Statements of Operations Data: | ||||||||||||||||
Revenues | $ | 1,026.0 | $ | 930.7 | $ | 852.1 | $ | 15.0 | ||||||||
Expenses: | ||||||||||||||||
Operating expenses | 582.6 | 538.2 | 514.9 | 16.9 | ||||||||||||
Depreciation and amortization | 208.3 | 194.3 | 188.8 | 1.1 | ||||||||||||
Transition and integration costs | 2.3 | 8.0 | 119.3 | — | ||||||||||||
Total expenses | 793.2 | 740.5 | 823.0 | 18.0 | ||||||||||||
Operating income (loss) | 232.8 | 190.2 | 29.1 | (3.0 | ) | |||||||||||
Other income and expense: | ||||||||||||||||
Interest expense, net | (67.6 | ) | (89.8 | ) | (128.7 | ) | — | |||||||||
Other expense, net | (6.4 | ) | (4.6 | ) | (12.0 | ) | — | |||||||||
Total other expense, net | (74.0 | ) | (94.4 | ) | (140.7 | ) | — | |||||||||
Earnings (loss) from continuing operations before income taxes | 158.8 | 95.8 | (111.6 | ) | (3.0 | ) | ||||||||||
Income tax expense (benefit) | 25.8 | 13.4 | (5.3 | ) | — | |||||||||||
Net earnings (loss) from continuing operations | 133.0 | 82.4 | (106.3 | ) | (3.0 | ) | ||||||||||
Loss from discontinued operations, net of tax | — | — | (0.8 | ) | — | |||||||||||
Net earnings (loss) | 133.0 | 82.4 | (107.1 | ) | (3.0 | ) | ||||||||||
Less: Net earnings (loss) attributable to noncontrolling interests | 87.2 | 62.4 | (107.1 | ) | (3.0 | ) | ||||||||||
Net earnings attributable to Black Knight Financial Services, Inc. | $ | 45.8 | $ | 20.0 | $ | — | $ | — | ||||||||
Year ended December 31, 2016 | May 26, 2015 through December 31, 2015 | |||||||||||||||
Net earnings per share attributable to Black Knight Financial Services, Inc., Class A common shareholders: | ||||||||||||||||
Basic | $ | 0.69 | $ | 0.31 | ||||||||||||
Diluted | $ | 0.67 | $ | 0.29 | ||||||||||||
Weighted average shares of Class A common stock outstanding: | ||||||||||||||||
Basic | 65.9 | 64.4 | ||||||||||||||
Diluted | 67.9 | 67.9 | ||||||||||||||
Successor | Predecessor | |||||||||||||||
December 31, | December 31, 2013 | |||||||||||||||
2016 | 2015 | 2014 | ||||||||||||||
(In millions) | ||||||||||||||||
Balance Sheets Data: | ||||||||||||||||
Cash and cash equivalents | $ | 133.9 | $ | 186.0 | $ | 61.9 | $ | 7.4 | ||||||||
Total assets | $ | 3,762.0 | $ | 3,703.7 | $ | 3,598.3 | $ | 88.1 | ||||||||
Total debt (current and long-term) | $ | 1,570.2 | $ | 1,661.5 | $ | 2,135.1 | $ | — | ||||||||
28
Selected Historical Combined Financial Data of Commerce Velocity and Property Insight
The following selected unaudited historical combined financial information has been derived from the unaudited financial information of Commerce Velocity and Property Insight that is not included or incorporated by reference into this Annual Report on Form 10-K.
The selected unaudited financial information as of and for the year ended December 31, 2012 and the period January 1, 2013 through October 15, 2013 is derived from the historical financial records of FNF.
January 1, 2013 through October 15, 2013 | Year ended December 31, 2012 | ||||||
(In millions) | |||||||
Statements of Operations Data: | |||||||
Revenues | $ | 58.2 | $ | 73.5 | |||
Net (loss) earnings | $ | (7.2 | ) | $ | 4.1 | ||
Balance Sheets Data: | |||||||
Total assets | $ | 79.1 | $ | 90.4 | |||
Selected Historical Consolidated Financial Data of LPS
The Consolidated Statement of Operations data for the day ended January 1, 2014 and the Consolidated Balance Sheet data as of January 1, 2014 are derived from the audited Consolidated Financial Statements of LPS attached as Exhibit 99.1 to this Annual Report on Form 10-K. The Consolidated Statements of Operations data for the years ended December 31, 2013 and 2012 and Consolidated Balance Sheets data as of December 31, 2013 and 2012, are derived from the audited Consolidated Financial Statements of LPS not included elsewhere in this Annual Report on Form 10-K.
Day ended January 1, 2014 | Year ended December 31, | ||||||||||
2013 (1) | 2012 (1) | ||||||||||
(In millions, except per share data) | |||||||||||
Statements of Operations Data: | |||||||||||
Revenues | $ | — | $ | 1,716.2 | $ | 1,991.3 | |||||
Net (loss) earnings from continuing operations | $ | (39.0 | ) | $ | 104.2 | $ | 79.6 | ||||
Net (loss) earnings | $ | (39.0 | ) | $ | 102.7 | $ | 70.4 | ||||
Net earnings per share - basic from continuing operations | $ | 1.22 | $ | 0.94 | |||||||
Net earnings per share - basic | $ | 1.20 | $ | 0.83 | |||||||
Weighted average shares - basic | 85.4 | 84.6 | |||||||||
Net earnings per share - diluted from continuing operations | $ | 1.21 | $ | 0.94 | |||||||
Net earnings per share - diluted | $ | 1.19 | $ | 0.83 | |||||||
Weighted average shares - diluted | 85.9 | 84.9 | |||||||||
Balance Sheets Data: | |||||||||||
Cash and cash equivalents | $ | 278.4 | $ | 329.6 | $ | 236.2 | |||||
Total assets | $ | 2,446.6 | $ | 2,486.7 | $ | 2,445.8 | |||||
Total debt (current and long-term) | $ | 1,068.1 | $ | 1,068.1 | $ | 1,068.1 | |||||
Cash dividends per share | $ | — | $ | 0.40 | $ | 0.40 | |||||
_______________________________________________________
(1) | On June 30, 2014, we completed the sale of PCLender, the results of which have been included in discontinued operations. |
29
Selected Quarterly Financial Data of Black Knight and BKFS LLC (Unaudited)
Selected quarterly financial data is as follows:
Quarter Ended | |||||||||||||||
March 31, | June 30, | September 30, | December 31, | ||||||||||||
(In millions, except per share data) | |||||||||||||||
2016 | |||||||||||||||
Revenues | $ | 241.9 | $ | 255.5 | $ | 267.1 | $ | 261.5 | |||||||
Earnings from continuing operations before income taxes and noncontrolling interests | $ | 39.3 | $ | 39.9 | $ | 38.7 | $ | 40.9 | |||||||
Net earnings | $ | 33.1 | $ | 33.2 | $ | 32.4 | $ | 34.3 | |||||||
Net earnings attributable to Black Knight Financial Services, Inc. | $ | 11.4 | $ | 11.4 | $ | 11.2 | $ | 11.8 | |||||||
Basic earnings per shares attributable to Black Knight Financial Services, Inc. | $ | 0.17 | $ | 0.17 | $ | 0.17 | $ | 0.18 | |||||||
Diluted earnings per share attributable to Black Knight Financial Services, Inc. | $ | 0.17 | $ | 0.17 | $ | 0.16 | $ | 0.17 | |||||||
2015 | |||||||||||||||
Revenues | $ | 227.2 | $ | 232.1 | $ | 233.6 | $ | 237.8 | |||||||
Earnings from continuing operations before income taxes and noncontrolling interests | $ | 14.7 | $ | 8.2 | $ | 36.4 | $ | 36.5 | |||||||
Net earnings | $ | 14.5 | $ | 7.8 | $ | 30.0 | $ | 30.1 | |||||||
Net earnings attributable to Black Knight Financial Services, Inc. | $ | 0.3 | $ | 9.9 | $ | 9.8 | |||||||||
Basic earnings per shares attributable to Black Knight Financial Services, Inc. | $ | 0.01 | $ | 0.15 | $ | 0.15 | |||||||||
Diluted earnings per share attributable to Black Knight Financial Services, Inc. | $ | — | $ | 0.15 | $ | 0.14 | |||||||||
2014 | |||||||||||||||
Revenues | $ | 202.5 | $ | 214.3 | $ | 215.0 | $ | 220.3 | |||||||
Net (loss) earnings from continuing operations | $ | (89.7 | ) | $ | (24.6 | ) | $ | (0.2 | ) | $ | 8.2 | ||||
Net (loss) earnings | $ | (89.9 | ) | $ | (24.4 | ) | $ | (1.0 | ) | $ | 8.2 | ||||
Item 7. | Management's Discussion and Analysis of Financial Condition and Results of Operations |
The statements in the discussion and analysis regarding industry outlook, our expectations regarding the performance of our business, our liquidity and capital resources and the other non-historical statements are forward-looking statements. These forward-looking statements are subject to numerous risks and uncertainties, including, but not limited to, the risks and uncertainties described in "Risk Factors" and "Statement Regarding Forward-Looking Information." Our actual results may differ materially from those contained in or implied by the forward-looking statements. You should read the following discussion together with the sections entitled "Risk Factors," "Selected Historical Financial Data," "Liquidity and Capital Resources" and the financial statements and the related notes thereto included elsewhere in this Annual Report on Form 10-K.
Overview
Black Knight Financial Services, Inc. ("Black Knight," the "Company," "we," "us" or "our") is a holding company that conducts business through our interest in Black Knight Financial Services, LLC ("BKFS LLC"). Through its subsidiaries, BKFS LLC is a leading provider of integrated technology, workflow automation, data and analytics to the mortgage and real estate industries. Our solutions facilitate and automate many of the mission-critical business processes across the entire mortgage loan life cycle, from origination until asset disposition. We believe we differentiate ourselves by the breadth and depth of our comprehensive, integrated solutions and the insight we provide to our clients.
We have market-leading positions in mortgage processing and technology solutions combined with comprehensive real estate data and extensive analytic capabilities. Our solutions are utilized by U.S. mortgage originators and mortgage servicers, as well as other financial institutions, investors and real estate professionals, to support mortgage lending and servicing operations, analyze portfolios and properties, operate more efficiently, meet regulatory compliance requirements and mitigate risk.
The U.S. mortgage market is undergoing significant change, and mortgage market participants have been subjected to more stringent oversight in recent years. Regulators have increasingly focused on better disclosure, improved risk mitigation and
30
enhanced oversight. Mortgage lenders large and small have experienced higher costs in order to comply with this higher level of regulation. Despite these new regulatory requirements, the mortgage industry remains a competitive marketplace with numerous large lenders and smaller institutions competing for new loan originations. In order to comply with the increased regulatory requirements and compete more effectively, mortgage market participants have continued to outsource mission-critical functions to third party technology providers that can offer comprehensive and integrated solutions, which are also cost-effective, due to their deep domain expertise and economies of scale.
We believe our comprehensive end-to-end, integrated solutions differentiate us from other technology providers serving the mortgage industry and position us particularly well for evolving opportunities in this market. We have served the mortgage and real estate industries for over 50 years and utilize this experience to design and develop solutions that fit our clients' ever-evolving needs. Our proprietary technology platforms and data and analytics capabilities reduce manual processes, improve compliance and quality, mitigate risk and deliver significant cost savings to our clients. Our scale allows us to continually and cost-effectively invest in our business in order to meet evolving industry requirements and maintain our position as an industry-standard platform for mortgage market participants. We had 32.0 million and 30.7 million active loans on our mortgage servicing platform as of December 31, 2016 and 2015, respectively. Based on the total number of U.S. first lien mortgages outstanding as of December 31, 2016, according to the Black Knight Mortgage Monitor Report, our proprietary technology platform is used to service approximately 61% of all U.S. first lien mortgages, reflecting our leadership in the mortgage servicing technology market.
Our business is organized into two segments:
Technology - offers software and hosting solutions that support loan servicing, loan origination and settlement services.
Data and Analytics - offers data and analytics solutions to the mortgage, real estate and capital markets industries. These solutions include property ownership data, lien data, servicing data, automated valuation models, collateral risk scores, prepayment and default models, lead generation and other data solutions.
We offer our solutions to a wide range of clients across the mortgage and real estate industries. The quality and breadth of our solutions contributes to the long-standing nature of our relationships with our clients, the majority of whom enter into long-term contracts across multiple products that are embedded in their mission critical workflow and decision processes. Given the contractual nature of our revenues and stickiness of our client relationships, our revenues are highly visible and recurring in nature. Due to our integrated suite of solutions and our scale in the mortgage market, we are able to drive significant operating leverage, which we believe enables our clients to operate more efficiently while allowing us to generate strong margins and cash flow.
The following table sets forth the revenues from continuing operations for our reporting segments and corporate organization (in millions):
Year ended December 31, | |||||||||||
2016 | 2015 | 2014 | |||||||||
Technology | $ | 855.8 | $ | 765.8 | $ | 708.2 | |||||
Data and Analytics | 177.5 | 174.3 | 156.6 | ||||||||
Corporate and Other (1) | (7.3 | ) | (9.4 | ) | (12.7 | ) | |||||
Total | $ | 1,026.0 | $ | 930.7 | $ | 852.1 | |||||
_______________________________________________________
(1) | Revenues for Corporate and Other represent deferred revenue purchase accounting adjustments recorded in accordance with GAAP. |
Our History
We are a majority-owned subsidiary of Fidelity National Financial, Inc. ("FNF"). Our business generally represents a reorganization of the former Technology, Data and Analytics segment of Lender Processing Services, Inc. ("LPS"), a former provider of integrated technology, data and services to the mortgage lending industry in the United States that FNF acquired in January 2014. Our business also includes the businesses of Fidelity National Commerce Velocity, LLC ("Commerce Velocity") and Property Insight, LLC ("Property Insight"), two companies that were contributed to us by FNF. ServiceLink Holdings, LLC, ("ServiceLink"), another majority-owned subsidiary of FNF, operates the Transaction Services businesses of the former LPS as well as FNF's legacy ServiceLink businesses.
Acquisition of LPS by FNF and Subsequent Reorganization
On January 2, 2014, FNF acquired LPS (the "Acquisition") and as a result, LPS became an indirect, wholly-owned subsidiary of FNF. Upon the closing of the Acquisition, the shares of LPS common stock, which previously traded under the ticker symbol "LPS" on the New York Stock Exchange ("NYSE"), ceased trading on, and were delisted from, the NYSE.
Following the Acquisition, on January 3, 2014, a series of transactions were effected (the "Internal Reorganization"), pursuant to which (i) LPS was converted into a limited liability company and renamed Black Knight InfoServ, LLC ("BKIS"), a Delaware
31
limited liability company; (ii) the former Transaction Services businesses of LPS were transferred by BKIS to Black Knight Holdings, Inc. ("BKHI"), a Delaware corporation and wholly-owned subsidiary of FNF, and contributed by BKHI to another of its then wholly-owned subsidiaries, ServiceLink, a Delaware limited liability company; (iii) BKFS LLC acquired all of the membership interests of BKIS; and (iv) all of the outstanding membership interests of Commerce Velocity were contributed by BKHI to BKFS LLC.
As a result of the Internal Reorganization, BKFS LLC owns substantially all of the former Technology, Data and Analytics segment of LPS and Commerce Velocity. BKFS LLC did not acquire the former Transaction Services segment of LPS.
Following the Internal Reorganization, BKFS LLC issued, in the aggregate, 35.0% of the membership interests ("Units") of BKFS LLC, to (i) certain affiliates of Thomas H. Lee Partners, L.P. ("THL"), a Delaware limited partnership, ("THL Affiliates") and (ii) THL Black Knight I Holding Corp. and THL Investors Black Knight I Holding Corp. (together, the "THL Intermediaries"), each of which is a Delaware corporation and an affiliate of THL, formed for the purpose of holding investments in BKFS LLC.
Following the Internal Reorganization and the subsequent issuance of Units to THL, BKFS LLC was majority owned by FNF through its wholly-owned subsidiary, BKHI, and certain affiliates of FNF and BKHI, and minority owned by THL through the THL Affiliates and THL Intermediaries.
Contribution of Property Insight
On June 2, 2014, as part of an additional internal reorganization, two wholly-owned subsidiaries of FNF contributed to BKFS LLC their respective interests in Property Insight, which provides property information used by title insurance underwriters, title agents and closing attorneys to underwrite title insurance policies for real property sales and transfers. As a result, BKFS LLC is the sole member of Property Insight. In connection with the Property Insight contribution, BKFS LLC issued an additional 6.4 million Units to certain affiliates of BKHI. As a result of this issuance, THL Affiliates' and THL Intermediaries' combined percentage ownership in BKFS LLC was reduced from 35.0% to 32.9%, and FNF's percentage of beneficial ownership of BKFS LLC increased from 65.0% to 67.1%.
Initial Public Offering
On May 26, 2015, we completed our initial public offering ("IPO") in which we issued and sold 20,700,000 shares of our Class A common stock at a price of $24.50 per share. In connection with our IPO, we effected several reorganization transactions (the "Offering Reorganization"). See Note 1 to the Notes to Consolidated Financial Statements for a more detailed discussion of the IPO.
2016 Acquisitions
On May 16, 2016, Black Knight completed its acquisition of eLynx Holdings, Inc. ("eLynx"), a leading lending document and data delivery platform now known as eLending. eLending helps clients in the financial services and real estate industries electronically capture and manage documents and associated data throughout the document lifecycle. Black Knight purchased eLynx to augment its origination technologies. This acquisition positions Black Knight to electronically support the full mortgage origination process.
On June 22, 2016, Black Knight completed its acquisition of Motivity Solutions, Inc. ("Motivity"), which provides customized mortgage business intelligence software solutions. Motivity will be integrated with Black Knight's LoanSphere product suite, including the LoanSphere Data Hub, to provide clients with deeper insights into their origination and servicing operations and portfolios.
Planned Distribution of FNF's Ownership Interest
On December 7, 2016, we announced that FNF's Board of Directors approved a tax-free plan (the "Distribution Plan") whereby FNF intends to distribute all 83.3 million shares of Black Knight common stock that it currently owns to FNF Group shareholders. We plan to effectuate the Distribution Plan through four newly-formed corporations, New BKH Corp. ("New BKH"), Black Knight Holdco Corp. ("New Black Knight"), New BKH Merger Sub, Inc. ("Merger Sub One") and BKFS Merger Sub, Inc. ("Merger Sub Two"). BKHI will contribute its shares of Black Knight Class B common stock and its Units of BKFS LLC to New BKH in exchange for 100% of the shares of New BKH common stock, following which BKHI will distribute to FNF all of the shares of New BKH common stock held by BKHI. Immediately thereafter, FNF will distribute the shares of New BKH common stock to its shareholders, provided that such distribution shall be subject to the conversion of such shares of New BKH common stock into shares of New Black Knight common stock. Immediately following the spin-off, Merger Sub One will merge with and into New BKH (the "New BKH merger"). In the New BKH merger, each outstanding share of New BKH common stock (other than shares owned by New BKH) will be exchanged for one share of New Black Knight common stock. Immediately following the New BKH merger, Merger Sub Two will merge with and into Black Knight (the "BKFS merger"). In the BKFS merger, each outstanding share of Black Knight common stock (other than shares owned by Black Knight and New BKH) will be exchanged for one share of New Black Knight common stock. New Black Knight will be the public company following the completion of the distribution and mergers.
32
The Distribution Plan is subject to the receipt of private letter rulings from the Internal Revenue Service, approving the tax-free spin-off of the Black Knight shares; filing and acceptance of a registration statement for the Black Knight spin-off with the Securities and Exchange Commission ("SEC"); refinancing of BKIS's 5.75% senior notes due 2023 (the "Senior Notes"), which are subject to FNF's guarantee, on reasonable terms; Black Knight shareholder approval; and other customary closing conditions. The closing of the tax-free distribution is expected by the third quarter of 2017.
Realignment of Property Insight
Effective January 1, 2017, Property Insight realigned its commercial relationship with FNF. In connection with the realignment, Property Insight employees responsible for title plant posting and maintenance were transferred to FNF. Under the new commercial arrangement, Black Knight will continue to own the title plant technology and retain sales responsibility for third parties, other than FNF. As a result of the realignment, Black Knight will no longer recognize revenue or expense related to title plant posting and maintenance, but will charge FNF a license fee for use of the technology to access and maintain the title plant data. Had the realignment taken place on January 1, 2016, Black Knight's 2016 revenues and expenses would have been lower by approximately $31 million with essentially no effect to operating income. This transaction will not result in any gain or loss.
Our Corporate Structure
Black Knight conducts its business through BKFS LLC and its subsidiaries. We have a sole managing member interest in BKFS LLC, which grants us the exclusive authority to manage, control and operate the business and affairs of BKFS LLC and its subsidiaries, pursuant to the terms of its Second Amended and Restated Limited Liability Company Agreement ("LLC Agreement"). Under the terms of the LLC Agreement, we are authorized to manage the business of BKFS LLC, including enter into contracts, manage bank accounts, hire employees and agents, incur and pay debts and expenses, merge or consolidate with other entities and pay taxes. We consolidate BKFS LLC in our consolidated financial statements and report noncontrolling interests related to the Units in BKFS LLC held by BKHI and certain THL Affiliates. Shareholders of Black Knight indirectly control BKFS LLC through our managing member interest.
FNF, through BKHI, and certain THL Affiliates hold Units and a number of shares of our Class B common stock equal to the number of Units held by each such owner. These owners have the right to exchange their Units, together with the corresponding shares of our Class B common stock, which will be canceled in connection with an exchange, for cash from BKFS LLC or, at our option, shares of our Class A common stock pursuant to the terms of the LLC Agreement.
Our corporate structure, as described above, is commonly referred to as an "Up-C" structure, which is often used by partnerships and limited liability companies when they undertake an initial public offering. Our Up-C structure allows the owners of BKFS LLC to realize tax benefits associated with ownership interests in an entity that is treated as a partnership, or "passthrough" entity, for income tax purposes. These benefits include limiting entity level corporate taxes. Because Units are exchangeable for cash from BKFS LLC or, at our option, shares of our Class A common stock, the Up-C structure also provides the owners of BKFS LLC potential liquidity that holders of privately held limited liability companies are not typically afforded. The owners of BKFS LLC also have voting rights in Black Knight equal to those of holders of our Class A common stock through their ownership of shares of our Class B common stock. Black Knight also holds Units and receives the same benefits as the other holders of Units on account of its ownership in an entity treated as a partnership, or passthrough entity, for income tax purposes. Meanwhile, holders of our Class A common stock have economic and voting rights similar to those of holders of common stock of non-Up-C structured public companies.
Generally, we receive a pro-rata share of any distributions made by BKFS LLC to its members, which include us, BKHI and certain THL Affiliates. However, pursuant to the LLC Agreement, BKFS LLC is required to make tax distributions to help each of the holders of the Units pay taxes according to such holder's allocable share of taxable income rather than on a pro-rata basis. Additionally, tax distributions are required to be made based upon an assumed tax rate, and, under certain circumstances, BKFS LLC may make tax distributions that, in the aggregate, exceed the amount of taxes that BKFS LLC would have paid if it were a similarly situated corporate taxpayer. Funds used by BKFS LLC to satisfy its tax distribution obligations are not available for reinvestment in our business. See "Risk Factors-Risks Related to Our Structure."
Black Knight is a holding company and its sole asset is its interest in BKFS LLC. Black Knight, through our sole managing member interest, has 100% of the voting power in BKFS LLC and, through our ownership of Units, we had 44.5% of the economic interests in BKFS LLC immediately following the IPO. Investors in Black Knight hold an indirect interest in BKFS LLC through us.
33
Basis of Presentation
As a result of the Internal Reorganization, IPO and Offering Reorganization, and for the purposes of this "Management's Discussion and Analysis of Financial Condition and Results of Operations," our financial position, results of operations and cash flows include:
• | the consolidated financial position, results of operations and cash flows of Black Knight for all periods following the completion of our IPO on May 26, 2015; and |
• | the consolidated financial position, results of operations and cash flows of BKFS LLC, including the results of operations and cash flows of the businesses of Commerce Velocity and Property Insight for the time period beginning on January 1, 2014 through May 25, 2015, the day prior to the completion of our IPO. |
Business Trends and Conditions
General
The U.S. mortgage market is large, and the loan life cycle is complex and consists of several stages. The mortgage loan life cycle includes origination, servicing and default. Mortgages are originated to finance home purchases or refinance existing mortgages. Once a mortgage is originated, it is serviced on a periodic basis by mortgage servicers, which may not be the lenders that originated the mortgage. Furthermore, if a mortgage experiences default, it triggers a set of multifaceted processes with an assortment of potential outcomes depending on a mix of variables.
Underlying the three major components of the mortgage loan life cycle are the technology, data and analytics support behind each process, which has become increasingly critical to industry participants due to the complexity of regulatory requirements. As the industry has grown in complexity, participants have responded by outsourcing to large scale specialty providers, automating manual processes and seeking end-to-end solutions that support the processes required to manage the entire mortgage loan life cycle.
The U.S. mortgage market has seen significant change over the past few years and is expected to continue to evolve going forward. Key regulatory actions arising from the recent financial crisis, such as the Dodd-Frank Wall Street Reform and Consumer Protection Act ("Dodd-Frank Act") and the establishment of the Consumer Financial Protection Bureau ("CFPB"), impose new and evolving standards for market participants. These regulatory changes have spurred lenders and servicers to seek technology solutions that facilitate the meeting of compliance obligations in the face of a changing regulatory environment while remaining efficient and profitable.
• | Evolving regulation. Most U.S. mortgage market participants have become subject to increased regulatory oversight and regulatory requirements as federal and state governments have enacted various new laws, rules and regulations. One example of such legislation is the Dodd-Frank Act, which contains broad changes for many sectors of the financial services and lending industries and established the CFPB, a new federal regulatory agency responsible for regulating consumer financial protection within the United States. It is our experience that mortgage lenders have become more focused on minimizing the risk of non-compliance with these evolving regulations and are looking toward technologies and solutions that help them to comply with the increased regulatory oversight and requirements. |
• | Lenders increasingly focused on core operations. As a result of greater regulatory scrutiny and the higher cost of doing business, we believe lenders have become more focused on their core operations and customers. We believe that lenders are increasingly shifting from in-house technologies to solutions with third-party providers who can provide better technology and services more efficiently. Lenders require these vendors to provide best-in-class technology and deep domain expertise and to assist them in maintaining regulatory compliance. |
• | Growing role of technology in the U.S. mortgage industry. Banks and other lenders and servicers have become increasingly focused on technology automation and workflow management to operate more efficiently and meet their regulatory guidelines. We believe that vendors must be able to support the complexity of the market, display extensive industry knowledge and possess the financial resources to make the necessary investments in technology to support lenders. |
• | Increased demand for enhanced transparency and analytic insight. As U.S. mortgage market participants work to minimize the risk in lending, servicing and capital markets, they rely on the integration of data and analytics with technologies that enhance the decision making process. These industry participants rely on large comprehensive third-party databases coupled with enhanced analytics to achieve these goals. |
Mortgage Originations
Our various businesses are affected differently by the level of mortgage originations, including refinancing transactions. Our mortgage servicing platform is less affected by varying levels of mortgage originations because it earns revenues based on the total number of mortgage loans it processes, which tend to stay more constant than the market for originations. Our origination technology and some of our data businesses are directly affected by the volume of real estate transactions and mortgage originations, but many of our client contracts for origination technology contain minimum charges.
34
Economic Conditions
Our various businesses are also affected by general economic conditions. For example, in the event that a difficult economy or other factors lead to a decline in levels of home ownership and a reduction in the number of mortgage loans outstanding and we are not able to counter the effect of those events with increased market share or higher fees, it could have a material adverse effect on our mortgage processing revenues. In contrast, we believe that a weaker economy tends to increase the volume of consumer mortgage defaults, which can increase the revenues in our specialty servicing technology business that is used to service residential mortgage loans in default. Also, interest rates tend to decline in a weaker economy driving higher than normal refinance transactions that provide potential volume increases to our origination technology offerings, most specifically the Exchange platform.
Regulatory Requirements
In recent years, there has been an increased legislative and regulatory focus on consumer protection practices. As a result, federal and state governments have enacted various new laws, rules and regulations. One example of such legislation is the Dodd-Frank Act, which was signed into law in July 2010. The Dodd-Frank Act contains broad changes for many sectors of the financial services and lending industries and established the CFPB, a new federal regulatory agency responsible for regulating consumer financial protection within the U.S. This has led banks and other lenders to seek technology solutions that assist them in satisfying their regulatory compliance obligations in the face of a changing regulatory environment. We have developed solutions that target this need, which has resulted in additional revenues.
The CFPB has issued guidance that applies to "supervised service providers," which the CFPB has defined to include service providers, like us, to CFPB-supervised banks and non-banks. In addition, the Dodd-Frank Act contains the Mortgage Reform and Anti-Predatory Lending Act that imposes a number of additional requirements on lenders and servicers of residential mortgage loans. It is difficult to predict the form that new rules or regulations implemented by the CFPB or other regulations implemented under other requirements of the Dodd-Frank Act may take, what additional legislative or regulatory changes may be approved in the future, or whether those changes may require us to change our business practices or incur increased costs of compliance.
Critical Accounting Estimates
Our discussion and analysis of our financial condition and results of operations is based upon audited consolidated financial statements, which have been prepared in accordance with U.S. generally accepted accounting principles ("GAAP"). The preparation of these financial statements requires management to make estimates, judgments and assumptions that affect the reported amounts of assets and liabilities and disclosures with respect to contingent liabilities and assets at the date of the consolidated financial statements and the reported amounts of revenues and expenses during the reporting periods. Certain of our accounting policies require the application of significant judgment by management in selecting the appropriate assumptions for calculating financial estimates. By their nature, these judgments are subject to an inherent degree of uncertainty. On an ongoing basis, we evaluate our estimates including those related to revenue recognition, goodwill and other intangible assets and computer software. These judgments are based on our historical experience, terms of our existing contracts, our evaluation of trends in the industry, information provided by our clients and information available from outside sources as appropriate. Our actual results may differ from those estimates. See Note 3 to the Notes to Consolidated Financial Statements for additional description of the significant accounting policies that have been followed in preparing our Consolidated Financial Statements.
The accounting policies described below are the ones that we consider to be the most critical to an understanding of our financial condition and results of operations and that require the most complex and subjective management judgment.
Revenue Recognition
We recognize revenues in accordance with Financial Accounting Standards Board ("FASB"), Accounting Standards Codification ("ASC") Topic 605, Revenue Recognition ("ASC 605"). Recording revenues requires judgment, including determining whether an arrangement includes multiple elements, whether any of the elements are essential to the functionality of any other elements and the allocation of the consideration based on each element's relative selling price. Clients receive certain contract elements over time and changes to the elements in an arrangement or, in our determination, to the relative selling price for these elements, could materially affect the amount of earned and unearned revenues reflected in our financial statements.
The primary judgments relating to our revenue recognition include determining whether (i) persuasive evidence of an arrangement exists; (ii) delivery has occurred or services have been rendered; (iii) the seller's price to the buyer is fixed or determinable; and (iv) collectability is reasonably assured. Judgment is also required to determine whether an arrangement involving more than one deliverable contains more than one unit of accounting and how the arrangement consideration should be measured and allocated to the separate units of accounting.
If the deliverables under a contract are software related, we determine the appropriate units of accounting and how the arrangement consideration should be measured and allocated to the separate units. This determination, as well as management's ability to establish vendor specific objective evidence ("VSOE") of the fair value for the individual deliverables can affect both
35
the amount and the timing of revenue recognition under these agreements. The inability to establish VSOE of the fair value for each contract deliverable results in having to record deferred revenues and/or applying the residual method. For arrangements where we determine VSOE of the fair value for software maintenance using a stated renewal rate within the contract, we use judgment to determine whether the renewal rate represents fair value for that element as if it had been sold on a stand-alone basis. For a small percentage of revenues, we use contract accounting when the arrangement with the client includes significant customization, modification or production of software. For elements accounted for under contract accounting, revenues are recognized using the percentage-of-completion method since reasonably dependable estimates of revenues and contract hours applicable to various elements of a contract can be made.
We are often party to multiple concurrent contracts with the same client. These situations require judgment to determine whether the individual contracts should be aggregated or evaluated separately for purposes of revenue recognition. In making this determination we consider the timing of negotiating and executing the contracts, whether the different elements of the contracts are interdependent and whether any of the payment terms of the contracts are interrelated.
Due to the large number, broad nature and average size of individual contracts we are a party to, the affect of judgments and assumptions we apply in recognizing revenues for any single contract is not likely to have a material effect on our consolidated operations. However, the broader accounting policy assumptions that we apply across similar arrangements or classes of clients could significantly influence the timing and amount of revenues recognized in our results of operations.
Goodwill and Other Intangible Assets
We have significant intangible assets that were acquired through business acquisitions. These assets consist of purchased client relationships, contracts, intellectual property and the excess of purchase price over the fair value of identifiable net assets acquired (goodwill).
As of December 31, 2016, goodwill was $2,303.8 million. Goodwill is not amortized, but is tested for impairment annually or more frequently if circumstances indicate potential impairment. In evaluating the recoverability of goodwill, we perform a qualitative analysis to determine whether it is more likely than not that our fair value exceeds our carrying value. Based on the results of this analysis, an annual goodwill impairment test may be completed based on an analysis of the discounted future cash flows generated by the underlying assets. The process of determining whether or not an asset, such as goodwill, is impaired or recoverable relies on projections of future cash flows, operating results and market conditions. Such projections are inherently uncertain and, accordingly, actual future cash flows may differ materially from projected cash flows. In evaluating the recoverability of goodwill, we perform an annual goodwill impairment test on our reporting units based on an analysis of the discounted future net cash flows generated by the reporting units' underlying assets. Such analyses are particularly sensitive to changes in estimates of future net cash flows and discount rates. Changes to these estimates might result in material changes in the fair value of the reporting units and determination of the recoverability of goodwill that may result in charges against earnings and a reduction in the carrying value of our goodwill. We have completed our annual goodwill impairment analysis in each of the past three years and as a result, no impairment charges were recorded to goodwill in 2016, 2015 and 2014.
As of December 31, 2016, intangible assets, net of accumulated amortization, were $299.5 million, which consists primarily of client relationships and client contracts. Long-lived assets and intangible assets with definite useful lives are reviewed for impairment whenever events or changes in circumstances indicate that the carrying amount of an asset may not be recoverable. The valuation of these assets involves significant estimates and assumptions concerning matters such as client retention, future cash flows and discount rates. If any of these assumptions change, it could affect the recoverability of the carrying value of these assets. Client relationships are amortized over their estimated useful lives using an accelerated method that takes into consideration expected client attrition rates over a period of up to 10 years from the acquisition date. All intangible assets that have been determined to have indefinite lives are not amortized, but are reviewed for impairment at least annually in accordance with ASC Topic 350, Intangibles-Goodwill and Other, or ASC 350. The initial determination of estimated useful lives and the allocation of the purchase price to the fair values of the intangible assets other than goodwill require significant judgment and may affect the amount of future amortization of such intangible assets.
Definite-lived intangible assets are amortized over their estimated useful lives ranging from 5 to 10 years using accelerated methods. There is an inherent uncertainty in determining the expected useful life of or cash flows to be generated from intangible assets. We have not historically experienced material changes in these estimates but could be subject to them in the future.
Computer Software
Computer software includes the fair value of software acquired in business combinations, purchased software and capitalized software development costs. As of December 31, 2016, computer software, net of accumulated amortization, was $450.0 million. Purchased software is recorded at cost and amortized using the straight-line method over its estimated useful life. Software acquired in business combinations is recorded at its fair value and amortized using straight-line or accelerated methods over its estimated useful life, ranging from 3 years to 10 years.
36
Capitalized software development costs are accounted for in accordance with either ASC Topic 985, Software, Subtopic 20, Costs of Software to Be Sold, Leased, or Marketed, or ASC 350, Subtopic 40, Internal-Use Software. For computer software products to be sold, leased, or otherwise marketed (ASC 985-20 software), all costs incurred to establish the technological feasibility are research and development costs, and are expensed as they are incurred. Costs incurred subsequent to establishing technological feasibility, such as programmers' salaries and related payroll costs and costs of independent contractors, are capitalized and amortized on a product-by-product basis commencing on the date of general release to clients. We do not capitalize any costs once the product is available for general release to clients. For internal-use computer software products (ASC 350-40 software), internal and external costs incurred during the preliminary project stage are expensed as they are incurred. Internal and external costs incurred during the application development stage are capitalized and amortized on a product-by-product basis commencing on the date the software is ready for its intended use. We do not capitalize any costs once the software is ready for its intended use. Internally developed software costs are amortized using straight-line or accelerated methods over the estimated useful life. Useful lives of computer software range from 3 years to 10 years.
We also assess the recorded value of computer software for impairment on a regular basis by comparing the carrying value to the estimated future cash flows to be generated by the underlying software asset. There is an inherent uncertainty in determining the expected useful life of or cash flows to be generated from computer software. We have not historically experienced material changes in these estimates but could be subject to them in the future.
Factors Affecting the Comparability of Our Results of Operations
As a result of a number of factors, our results of operations for periods prior to the IPO and the debt refinancing, as described in Note 11 to the Notes to Consolidated Financial Statements, are not comparable to periods thereafter, and our historical results of operations may not be comparable to our results of operations in future periods and our results of operations may vary from period to period. Set forth below is a brief discussion of the key factors affecting the comparability of our results of operations.
Expenses Associated with the Internal Reorganization. In connection with the Internal Reorganization, we incurred significant transaction costs and transition and integration expenses in 2014, including employee severance, bonuses under our short-term compensation program, referred to as the Synergy Incentive Program, that rewarded our executive officers for maximizing cost reductions relating to the Acquisition and certain other non-recurring professional fees and other costs.
Related Party Transactions. We are party to certain transactions with entities that became our related parties on January 2, 2014 as part of the Acquisition. For example, prior to our IPO, we had a management agreement with each of THL Managers VI, LLC and FNF pursuant to which we received services in exchange for a fee for such services in the annual amount of $3.2 million to THL Managers VI, LLC and $5.8 million to FNF. Following our IPO, we no longer pay these management fees. The other related party transactions with FNF, THL, THL Managers VI, LLC, THL Affiliates and ServiceLink do not have a material effect on the comparability of our results of operations.
Interest Expense. We used a portion of the proceeds from our IPO to reduce our outstanding debt by repaying a portion of the Senior Notes and Former Intercompany Notes, as described in Note 11 to the Notes to Consolidated Financial Statements. Also, on May 27, 2015, we entered into a credit agreement for new facilities with lower interest rates to refinance the remaining balance of our former intercompany notes and former mirror note with FNF. Subsequent to May 26, 2015, we pay FNF a guarantee fee for its ongoing guarantee of the Senior Notes. Our total long-term debt outstanding decreased from $2,135.1 million at December 31, 2014 to $1,661.5 million as of December 31, 2015. Our total long-term debt outstanding further declined to $1,570.2 million as of December 31, 2016. As a result of the decrease in total long-term debt outstanding and the lower interest rates with the new facilities, our interest expense is significantly lower in periods following our IPO.
Income Taxes. Our effective tax rate for the years ended December 31, 2016, 2015 and 2014 was 16.2%, 14.0% and 4.7%, respectively. The increase in the effective tax rate is primarily due to the fact that following the IPO we are taxed as a corporation on our 44.5% ownership interest in BKFS LLC.
Cost Reduction Actions. In connection with the Acquisition, we put action plans in place to reduce operating costs and increase our profitability. We also put the Synergy Incentive Program in place to incentivize our management team to accomplish planned cost reductions. As a result of the actions taken during 2014, we have reduced our operating expenses as a percent of revenues. Substantially all of our planned cost reduction actions were complete as of September 30, 2014.
Key Components of Results of Operations
Revenues
We generate revenues primarily through contractual arrangements that we enter into with clients to provide services, software and software-related services either individually or as part of an integrated offering of multiple services. These arrangements occasionally include offerings from more than one business unit to the same client.
37
The following is a description of our revenues by segment:
Technology
Our Technology segment revenues are primarily derived from hosted software, licensed software and software-related services. In some cases, these services are offered in combination with one another, and in other cases we offer them individually. Revenues from hosted software are typically volume-based and depend on factors such as the number of accounts processed, transactions processed and computer resources utilized.
Data and Analytics
Our Data and Analytics segment revenues are primarily derived from data and valuation-related services. Our Data and Analytics segment owns or licenses data assets that primarily include loan information and property sales and characteristic information. We both license our data directly to our clients and provide our clients with analytical products and workflow solutions for risk management, multiple listing services, title insurance underwriting, collateral assessment and loan quality reviews.
Expenses
The following is a brief description of the components of our expenses:
• | Operating expenses include payroll, employee benefits, occupancy costs, data processing costs, program design and development costs and professional services. |
• | Transition and integration costs for 2016 consist of incremental costs associated with acquisitions and professional services related to the planned distribution of FNF's ownership interest. In 2015, these consist of costs related to our IPO, as well as member management fees through May 25, 2015. In 2014, these consisted of incremental costs associated with executing the Acquisition, as well as the related transitioning costs including employee severance, expenses associated with our Synergy Incentive Program, certain other non-recurring professional and other costs as well as member management fees paid to FNF and THL Managers VI, LLC. |
• | Depreciation and amortization expense consists of our depreciation related to investments in property and equipment, including information technology hardware, as well as amortization of purchased and developed software and other intangible assets, principally client relationships recorded in connection with acquisitions. It also includes the amortization of previously deferred implementation-related expenses. |
• | Interest expense subsequent to May 26, 2015, consists of interest on the Senior Notes, interest on our new credit facilities, commitment fees on our revolving credit facility, administrative agent fees, rating agency fees and a guarantee fee that we pay FNF for its ongoing guarantee of the Senior Notes. See Note 11 in the Notes to Consolidated Financial Statements for a more detailed discussion of our Interest expense. In 2014 and 2015 through May 26, 2015, Interest expense consisted of interest on the Senior Notes and interest on the former intercompany notes and the former mirror note that were payable to FNF. |
• | Other expense, net for 2016 primarily consisted of litigation-related costs primarily associated with the Merion Capital legal matter, as described in Note 12 to the Notes to Consolidated Financial Statements. Other expense, net for 2015 includes a $4.8 million net loss on the partial redemption of the Senior Notes, as described in Note 11 to the Notes to Consolidated Financial Statements. In 2014, Other expense, net consisted of costs associated with the Merion Capital legal matter that resulted from the Acquisition, including interest and estimated costs to defend ourselves in this matter. On September 18, 2014, we reached an agreement with Merion Capital to resolve an interest motion and FNF paid Merion Capital the merger consideration (cash and stock). As of December 31, 2014, Black Knight had incurred expenses of $11.9 million in connection with this matter, including $9.0 million for interest accrued through the settlement date and a $2.9 million accrual for legal defense expenses. |
• | Income tax expense (benefit) represents federal, state, local and foreign taxes based on income attributable to Black Knight in multiple jurisdictions. |
38
Results of Operations
Key Performance Metrics
We use Adjusted Revenues, Adjusted EBITDA and Adjusted EBITDA Margin for financial and operational decision making and as a means to evaluate period-to-period comparisons. Adjusted Revenues, Adjusted EBITDA and Adjusted EBITDA Margin are non-GAAP financial measures, which we believe are useful for investors in evaluating our overall financial performance. Black Knight believes these measures provide useful information about operating results, enhance the overall understanding of past financial performance and future prospects and allow for greater transparency with respect to key metrics used by management in its financial and operational decision making, including determining a portion of executive compensation. Adjusted Revenues, Adjusted EBITDA and Adjusted EBITDA Margin for the Technology and Data and Analytics segments are presented in conformity with Accounting Standards Codification 280, Segment Reporting. These measures are reported to the chief operating decision maker for purposes of making decisions about allocating resources to the segments and assessing their performance. For these reasons, these measures are excluded from the definition of non-GAAP financial measures under the Securities and Exchange Commission's Regulation G and Item 10(e) of Regulation S-K.
• | Adjusted Revenues — We define Adjusted Revenues as Revenues adjusted to include the revenues that were not recorded by Black Knight during the periods presented due to the deferred revenue purchase accounting adjustment recorded in accordance with GAAP. These adjustments are reflected in Corporate and Other. |
• | Adjusted EBITDA — We define Adjusted EBITDA as Net earnings, with adjustments to reflect the addition or elimination of certain income statement items including, but not limited to (i) depreciation and amortization; (ii) interest expense; (iii) income tax expense; (iv) the deferred revenue purchase accounting adjustment recorded in accordance with GAAP; (v) equity-based compensation; (vi) charges associated with significant legal and regulatory matters; (vii) member management fees paid to FNF and THL Managers, LLC; (viii) exit costs, impairments and other charges; (ix) costs associated with debt and equity offerings; (x) acquisition-related costs; (xi) discontinued operations and (xii) other expenses, net. These adjustments are reflected in Corporate and Other. |
• | Adjusted EBITDA Margin — Adjusted EBITDA Margin is calculated by dividing Adjusted EBITDA by Adjusted Revenues. |
Consolidated Results of Operations
The following table sets forth the consolidated statements of operations of Black Knight and BKFS LLC for the periods indicated (dollars in millions):
Year ended December 31, | |||||||||||
2016 | 2015 | 2014 | |||||||||
Revenues | $ | 1,026.0 | $ | 930.7 | $ | 852.1 | |||||
Expenses: | |||||||||||
Operating expenses | 582.6 | 538.2 | 514.9 | ||||||||
Depreciation and amortization | 208.3 | 194.3 | 188.8 | ||||||||
Transition and integration costs | 2.3 | 8.0 | 119.3 | ||||||||
Total expenses | 793.2 | 740.5 | 823.0 | ||||||||
Operating income | 232.8 | 190.2 | 29.1 | ||||||||
Operating margin | 22.7 | % | 20.4 | % | 3.4 | % | |||||
Interest expense | (67.6 | ) | (89.8 | ) | (128.7 | ) | |||||
Other expense, net | (6.4 | ) | (4.6 | ) | (12.0 | ) | |||||
Earnings (loss) from continuing operations before income taxes | 158.8 | 95.8 | (111.6 | ) | |||||||
Income tax expense (benefit) | 25.8 | 13.4 | (5.3 | ) | |||||||
Net earnings (loss) from continuing operations | 133.0 | 82.4 | (106.3 | ) | |||||||
Loss from discontinued operations, net of tax | — | — | (0.8 | ) | |||||||
Net earnings (loss) | $ | 133.0 | $ | 82.4 | $ | (107.1 | ) | ||||
Key Performance Metrics (Non-GAAP) | |||||||||||
Adjusted Revenues | $ | 1,033.3 | $ | 940.3 | $ | 864.9 | |||||
Adjusted EBITDA | $ | 463.1 | $ | 413.5 | $ | 354.9 | |||||
Adjusted EBITDA Margin | 44.8 | % | 44.0 | % | 41.0 | % | |||||
39
A reconciliation of the above non-GAAP financial measures to the most directly comparable GAAP financial measures is presented in the tables below (in millions):
Year ended December 31, | |||||||||||
2016 | 2015 | 2014 | |||||||||
Revenues | $ | 1,026.0 | $ | 930.7 | $ | 852.1 | |||||
Deferred revenue adjustment | 7.3 | 9.6 | 12.8 | ||||||||
Adjusted Revenues | $ | 1,033.3 | $ | 940.3 | $ | 864.9 | |||||
Year ended December 31, | |||||||||||
2016 | 2015 | 2014 | |||||||||
Net earnings (loss) | $ | 133.0 | $ | 82.4 | $ | (107.1 | ) | ||||
Depreciation and amortization | 208.3 | 194.3 | 188.8 | ||||||||
Interest expense | 67.6 | 89.8 | 128.7 | ||||||||
Income tax expense (benefit) | 25.8 | 13.4 | (5.3 | ) | |||||||
Other expense, net | 6.4 | 4.6 | 12.0 | ||||||||
Discontinued operations, net of tax | — | — | 0.8 | ||||||||
EBITDA | 441.1 | 384.5 | 217.9 | ||||||||
Deferred revenue adjustment | 7.3 | 9.6 | 12.8 | ||||||||
Equity-based compensation | 12.4 | 11.4 | 6.4 | ||||||||
Transition and integration costs | 2.3 | 3.6 | 119.3 | ||||||||
IPO costs | — | 4.4 | — | ||||||||
Legal and regulatory matters | — | — | (1.5 | ) | |||||||
Adjusted EBITDA | $ | 463.1 | $ | 413.5 | $ | 354.9 | |||||
Adjusted EBITDA Margin | 44.8 | % | 44.0 | % | 41.0 | % | |||||
Year Ended December 31, 2016 Compared to Year Ended December 31, 2015
Revenues
Consolidated Revenues were $1,026.0 million in 2016 and $930.7 million in 2015, an increase of $95.3 million, or 10%. The change in revenues is discussed further at the segment level below.
The following table sets forth revenues of Black Knight and BKFS LLC by segment for the periods presented (in millions):
Year ended December 31, | |||||||
2016 | 2015 | ||||||
Technology | $ | 855.8 | $ | 765.8 | |||
Data and Analytics | 177.5 | 174.3 | |||||
Corporate and Other (1) | (7.3 | ) | (9.4 | ) | |||
Total | $ | 1,026.0 | $ | 930.7 | |||
_______________________________________________________
(1) | Revenues for Corporate and Other represent deferred revenue purchase accounting adjustments recorded in accordance with GAAP. |
Technology
Revenues were $855.8 million in 2016 compared to $765.8 million in 2015, an increase of $90.0 million, or 12%. Our servicing technology business contributed $48.3 million of this increase, primarily driven by higher average loan volumes on our core servicing platform, which increased 5.4% to 31.9 million average loans, price increases and new client wins. Our origination technology business contributed $41.7 million of this increase, primarily driven by prior year client implementations, higher transaction volumes on the Exchange and revenues attributable to eLynx, partially offset by lower net professional services revenue.
40
Data and Analytics
Revenues were $177.5 million in 2016 compared to $174.3 million in 2015, an increase of $3.2 million, or 2%. The increase was primarily driven by the Motivity Solutions acquisition partially offset by lower upfront revenues from long-term strategic license deals.
Operating Expenses
Consolidated Operating expenses were $582.6 million in 2016 compared to $538.2 million in 2015, an increase of $44.4 million, or 8%. The changes in operating expenses are discussed further at the segment level below.
The following table sets forth operating expenses of Black Knight and BKFS LLC by segment for the periods presented (in millions):
Year ended December 31, | |||||||
2016 | 2015 | ||||||
Technology | $ | 368.0 | $ | 341.4 | |||
Data and Analytics | 151.0 | 145.5 | |||||
Corporate and Other | 63.6 | 51.3 | |||||
Total | $ | 582.6 | $ | 538.2 | |||
Technology
Operating expenses were $368.0 million in 2016 compared to $341.4 million in 2015, an increase of $26.6 million, or 8%. In our origination technology business, the increase was primarily driven by the addition of eLynx and lower capitalized software development and deferred implementation costs. Our servicing technology business experienced a decrease in operating expenses, primarily driven by lower personnel costs.
Data and Analytics
Operating expenses were $151.0 million in 2016 compared to $145.5 million in 2015, an increase of $5.5 million, or 4%. The increase was primarily driven by the Motivity Solutions acquisition and higher data-related costs, which were partially offset by reductions in other operating expenses, primarily lower personnel costs.
Corporate and Other
Operating expenses were $63.6 million in 2016 compared to $51.3 million in 2015, an increase of $12.3 million, or 24%. The increase was primarily driven by higher incentive bonus accruals, higher compensation and employee-related costs as we expanded certain corporate functions in 2016 to support our continued growth and a full year of public company costs.
Depreciation and Amortization
Consolidated Depreciation and amortization was $208.3 million in 2016 compared to $194.3 million in 2015. The changes in depreciation and amortization are discussed further at the segment level below.
The following table sets forth depreciation and amortization of Black Knight and BKFS LLC by segment for the periods presented (in millions):
Year ended December 31, | |||||||
2016 | 2015 | ||||||
Technology | $ | 106.2 | $ | 93.3 | |||
Data and Analytics | 8.8 | 7.2 | |||||
Corporate and Other (1) | 93.3 | 93.8 | |||||
Total | $ | 208.3 | $ | 194.3 | |||
_______________________________________________________
(1) | Depreciation and amortization for Corporate and Other primarily represents net incremental depreciation and amortization adjustments associated with the application of purchase accounting recorded in accordance with GAAP. |
Technology
Depreciation and amortization was $106.2 million in 2016 compared to $93.3 million in 2015, an increase of $12.9 million, or 14%. The main drivers of this increase are the amortization of deferred contract costs relating to client implementations, including accelerated amortization of $4.1 million related to certain deferred implementation costs, and the amortization from new software development offset by lower amortization of customer relationship assets.
41
Data and Analytics
Depreciation and amortization was $8.8 million in 2016 compared to $7.2 million in 2015, an increase of $1.6 million, or 22%, primarily due to amortization from new software development.
Transition and Integration Costs
Consolidated Transition and integration costs were $2.3 million in 2016 compared to $8.0 million in 2015. Transition and integration costs for the year ended December 31, 2016 primarily represent costs associated with the eLynx and Motivity acquisitions and professional services related to the planned distribution of FNF's ownership interest in Black Knight. Transition and integration costs during the year ended December 31, 2015 represent management fees paid to FNF and THL through May 25, 2015, prior to the IPO, and costs related to the IPO.
Operating Income (Loss)
Consolidated Operating income was $232.8 million in 2016 compared to $190.2 million in 2015, an increase of $42.6 million, or 22%. The change in operating income (loss) is discussed further at the segment level below.
The following table sets forth operating income (loss) of Black Knight and BKFS LLC by segment for the periods presented (in millions):
Year ended December 31, | |||||||
2016 | 2015 | ||||||
Technology | $ | 381.6 | $ | 331.1 | |||
Data and Analytics | 17.7 | 21.6 | |||||
Corporate and Other | (166.5 | ) | (162.5 | ) | |||
Total | $ | 232.8 | $ | 190.2 | |||
Technology
Operating income was $381.6 million in 2016 compared to $331.1 million in 2015, an increase of $50.5 million, or 15%. Operating margin was 44.6% in 2016 compared to 43.2% in 2015. The increases in operating income and operating margin are due to strong incremental margins on the revenue growth and the benefit of prior year cost actions that were partially offset by higher depreciation and amortization.
Data and Analytics
Operating income was $17.7 million in 2016 compared to $21.6 million in 2015, a decrease of $3.9 million. Operating margin was 10.0% in 2016 compared to 12.4% in 2015. The decrease is primarily due to the net impact of lower upfront revenues from long-term strategic license deals in the current year and higher depreciation and amortization.
Corporate and Other
Operating loss was $166.5 million in 2016 compared to $162.5 million in 2015, an increase of $4.0 million, or 2%. The increase was primarily driven by higher incentive bonus accruals, higher compensation and employee-related costs as we expanded certain corporate functions in 2016 to support our continued growth and a full year of public company costs, partially offset by lower Transition and integration costs in 2016.
Interest Expense, Net
Consolidated Interest expense, net was $67.6 million in 2016 compared to $89.8 million in 2015, a decrease of $22.2 million, or 25%. The decrease is attributable to the new credit facilities entered into during 2015, as well as lower debt outstanding following the IPO.
Other Expense, Net
Consolidated Other expense, net was $6.4 million in 2016 compared to $4.6 million in 2015. The increase is primarily driven by legal fees associated with litigation matters.
Income Tax Expense
Consolidated Income tax expense was $25.8 million in 2016 compared to $13.4 million in 2015. Our effective tax rate was 16.2% in 2016 compared to 14.0% in 2015. These rates are lower than the typical federal and state statutory rate because of the effect of our noncontrolling interests.
42
Adjusted EBITDA and Adjusted EBITDA Margin
Consolidated Adjusted EBITDA was $463.1 million in 2016 compared to $413.5 million in 2015. The changes in Adjusted EBITDA are discussed further at the segment level below.
Consolidated Adjusted EBITDA Margin was 44.8% in 2016 compared to 44.0% in 2015. The changes in Adjusted EBITDA Margin are discussed further at the segment level below.
The following tables set forth Adjusted EBITDA (in millions) and Adjusted EBITDA Margin by segment for the periods presented:
Year ended December 31, | |||||||
2016 | 2015 | ||||||
Technology | $ | 487.8 | $ | 424.4 | |||
Data and Analytics | 26.5 | 28.8 | |||||
Corporate and Other | (51.2 | ) | (39.7 | ) | |||
Total | $ | 463.1 | $ | 413.5 | |||
Year ended December 31, | |||||
2016 | 2015 | ||||
Technology | 57.0 | % | 55.4 | % | |
Data and Analytics | 14.9 | % | 16.5 | % | |
Corporate and Other | N/A | N/A | |||
Total | 44.8 | % | 44.0 | % | |
Technology
Adjusted EBITDA was $487.8 million in 2016 compared to $424.4 million in 2015, an increase of $63.4 million, or 15%, with an Adjusted EBITDA Margin of 57.0%, an increase of 160 basis points from the prior year. The increase was primarily driven by incremental margins on revenue growth and the benefit of prior year cost actions.
Data and Analytics
Adjusted EBITDA was $26.5 million in 2016 compared to $28.8 million in 2015, with an Adjusted EBITDA Margin of 14.9% in 2016 compared 16.5% in 2015. The decrease was primarily driven by higher data-related costs and lower upfront revenues from long-term strategic licensing deals, which were partially offset by reductions in other operating expenses, primarily lower personnel costs.
Year Ended December 31, 2015 Compared to Year Ended December 31, 2014
Revenues
Consolidated Revenues were $930.7 million in 2015 compared to $852.1 million in 2014. The change in revenues is discussed further at the segment level below.
The following table sets forth revenues of Black Knight and BKFS LLC by segment for the periods presented (in millions):
Year ended December 31, | |||||||
2015 | 2014 | ||||||
Technology | $ | 765.8 | $ | 708.2 | |||
Data and Analytics | 174.3 | 156.6 | |||||
Corporate and Other | (9.4 | ) | (12.7 | ) | |||
Total | $ | 930.7 | $ | 852.1 | |||
Technology
Revenues were $765.8 million in 2015 compared to $708.2 million in 2014, an increase of $57.6 million or 8%. Our servicing technology business contributed $25.3 million of this increase, primarily driven by higher average loan counts on our core servicing platform, which increased 3.8% to 30.3 million average loans, price increases and increased usage and communication fees. Our origination technology business contributed $32.3 million of this increase, primarily driven by an $18.4 million increase in professional services as well as revenues from new client implementations and Closing Insight clients.
43
Data and Analytics
Revenues were $174.3 million in 2015 compared to $156.6 million in 2014, an increase of $17.7 million or 11%. The increase was driven primarily by additional revenues from long-term strategic license deals.
Operating Expenses
Consolidated Operating expenses were $538.2 million in 2015 compared to $514.9 million in 2014. The changes in operating expenses are discussed further at the segment level below.
The following table sets forth operating expenses of Black Knight and BKFS LLC by segment for the periods presented (in millions):
Year ended December 31, | |||||||
2015 | 2014 | ||||||
Technology | $ | 341.4 | $ | 338.2 | |||
Data and Analytics | 145.5 | 140.2 | |||||
Corporate and Other | 51.3 | 36.5 | |||||
Total | $ | 538.2 | $ | 514.9 | |||
Technology
Operating expenses were $341.4 million in 2015 compared to $338.2 million in 2014, an increase of $3.2 million, or 1%.
Data and Analytics
Operating expenses were $145.5 million in 2015 compared to $140.2 million in 2014, an increase of $5.3 million, or 4%. The increase was primarily driven by the buyout of a strategic data partner.
Corporate and Other
Operating expenses were $51.3 million in 2015 compared to $36.5 million in 2014, an increase of $14.8 million, or 41%. The increase was primarily driven by a one-time charge for the accelerated vesting of 4.4 million restricted shares in connection with the IPO, the addition of public company costs, a non-recurring insurance benefit in 2014, professional fees and severance expenses related to cost-reduction efforts.
Depreciation and Amortization
Consolidated Depreciation and amortization was $194.3 million in 2015 compared to $188.8 million in 2014. The changes in depreciation and amortization are discussed further at the segment level below.
The following table sets forth depreciation and amortization of Black Knight and BKFS LLC by segment for the periods presented (in millions):
Year ended December 31, | |||||||
2015 | 2014 | ||||||
Technology | $ | 93.3 | $ | 84.7 | |||
Data and Analytics | 7.2 | 6.5 | |||||
Corporate and Other | 93.8 | 97.6 | |||||
Total | $ | 194.3 | $ | 188.8 | |||
Technology
Depreciation and amortization was $93.3 million in 2015 compared to $84.7 million in 2014, an increase of $8.6 million, or 10%. The main driver of the increase is the amortization of deferred contract costs relating to client implementations. These costs are capitalized and then amortized over the life of the respective contracts.
Data and Analytics
Depreciation and amortization was $7.2 million in 2015 compared to $6.5 million in 2014, representing an increase of $0.7 million, or 11%.
44
Transition and Integration Costs
Consolidated Transition and integration costs in 2015 primarily represent management fees paid to FNF and THL through May 25, 2015, prior to the IPO, and costs related to the IPO. The transition and integration costs in 2014 primarily represent legal and professional fees related to the Acquisition, severance, transaction-related bonuses and management fees paid to FNF and THL.
Operating Income (Loss)
Consolidated Operating income was $190.2 million in 2015 compared to $29.1 million in 2014. The change in operating income (loss) is discussed further at the segment level below.
The following table sets forth operating income (loss) of Black Knight and BKFS LLC by segment for the periods presented (in millions):
Year ended December 31, | |||||||
2015 | 2014 | ||||||
Technology | $ | 331.1 | $ | 285.3 | |||
Data and Analytics | 21.6 | 9.9 | |||||
Corporate and Other | (162.5 | ) | (266.1 | ) | |||
Total | $ | 190.2 | $ | 29.1 | |||
Technology
Operating income was $331.1 million in 2015 compared to $285.3 million in 2014, an increase of $45.8 million, or 16%. The increase was driven mainly by the revenues growth and expense reductions discussed above. Operating margin was 43.2% in 2015 compared to 40.3% in 2014. The increase was driven by the incremental benefit from cost reduction actions taken in 2014 as well as high incremental margins on the revenues growth discussed above.
Data and Analytics
Operating income was $21.6 million in 2015 compared to $9.9 million in 2014, an increase of $11.7 million. Operating margin was 12.4% in 2015 compared to 6.3% in 2014. The increase was driven by the incremental benefit from cost reduction actions taken in 2014 as well as high incremental margins on the revenues growth discussed above.
Corporate and Other
Operating loss was $162.5 million in 2015 compared to $266.1 million in 2014, a decrease of $103.6 million. The loss in 2015 includes $8.0 million of transition and integration costs compared to $114.7 million in 2014.
Interest Expense, Net
Consolidated Interest expense, net was $89.8 million in 2015 compared to $128.7 million in 2014, a decrease of $38.9 million, or 30%. The decrease is attributable to the credit facilities entered into during the second quarter of 2015 as well as lower debt outstanding following the IPO. See Note 11 to the Notes to Consolidated Financial Statements for a more detailed discussion of the changes to our debt.
Other Expense, Net
Consolidated Other expense, net was $4.6 million in 2015 compared to $12.0 million in 2014. The decrease is primarily driven by reduced legal fees associated with litigation matters in 2015, partially offset by a loss on the partial redemption of the Senior Notes in 2015.
Income Tax Expense (Benefit)
Consolidated Income tax expense (benefit) was $13.4 million in 2015 compared to $(5.3) million in 2014. Our effective tax rate was 14.0% in 2015 compared to 4.7% in 2014.
Adjusted EBITDA and Adjusted EBITDA Margin
Consolidated Adjusted EBITDA was $413.5 million in 2015 compared to $354.9 million in 2014. The changes in Adjusted EBITDA are discussed further at the segment level below.
Consolidated Adjusted EBITDA Margin was 44.0% in 2015 compared to 41.0% in 2014. The changes in Adjusted EBITDA Margin are discussed further at the segment level below.
45
The following tables set forth Adjusted EBITDA (in millions) and Adjusted EBITDA Margin by segment for the periods presented:
Year ended December 31, | |||||||
2015 | 2014 | ||||||
Technology | $ | 424.4 | $ | 370.0 | |||
Data and Analytics | 28.8 | 16.4 | |||||
Corporate and Other | (39.7 | ) | (31.5 | ) | |||
Total | $ | 413.5 | $ | 354.9 | |||
Year ended December 31, | |||||
2015 | 2014 | ||||
Technology | 55.4 | % | 52.2 | % | |
Data and Analytics | 16.5 | % | 10.5 | % | |
Corporate and Other | N/A | N/A | |||
Total | 44.0 | % | 41.0 | % | |
Technology
Adjusted EBITDA was $424.4 million in 2015 compared to $370.0 million in 2014, an increase of $54.4 million, or 15%, with an Adjusted EBITDA Margin of 55.4%, an increase of 320 basis points from the prior year. The increase was primarily driven by incremental margins on revenue growth and the incremental benefit of cost actions taken in 2014.
Data and Analytics
Adjusted EBITDA was $28.8 million in 2015 compared to $16.4 million in 2014, an increase of $12.4 million, or 76%, with an Adjusted EBITDA Margin of 16.5%, an increase of 600 basis points from the prior year, which was primarily driven by higher upfront revenues from long-term strategic licensing deals.
Liquidity and Capital Resources
Cash Requirements
Our primary sources of liquidity are our existing cash balances, cash flows from operations and borrowings on our Revolving Credit Facility, as described in Note 11 to the Notes to Consolidated Financial Statements.
Our primary cash requirements include operating expenses, debt service payments (principal and interest), capital expenditures (including property, equipment and computer software expenditures), tax distributions and income tax payments and may include business acquisitions, share repurchases and/or dividends. Our cash requirements may also include tax distributions to holders of BKFS LLC Units, the timing and amount of which will be dependent upon the taxable income allocable to such holders. The expected tax distributions to be made during the first quarter of 2017 for the 2016 tax year are approximately $38.0 million. Tax distributions are also expected to be made quarterly during 2017 for the 2017 tax year. In addition, we would need cash to purchase shares of Class B common stock that are converted into shares of Class A common stock pursuant to the LLC Agreement if we choose to pay cash for such shares.
As of December 31, 2016, we had cash and cash equivalents of $133.9 million and debt of $1,574.0 million, excluding the debt issuance costs and the unamortized premium associated with the Senior Notes. We believe that our cash flows from operations and available cash and cash equivalents are sufficient to meet our liquidity needs, including the repayment of our outstanding debt, for at least the next 12 months. We anticipate that to the extent that we require additional liquidity, it will be funded through borrowings on our Revolving Credit Facility, the incurrence of other indebtedness, equity issuance or a combination thereof. We cannot be assured that we will be able to obtain this additional liquidity on reasonable terms, or at all. The loss of the largest lender on our Revolving Credit Facility would reduce our borrowing capacity by $36.7 million. Additionally, our liquidity and our ability to meet our obligations and fund our capital requirements are also dependent on our future financial performance, which is subject to general economic, financial and other factors that are beyond our control. Accordingly, we cannot be assured that our business will generate sufficient cash flow from operations or that future borrowings will be available from additional indebtedness or otherwise to meet our liquidity needs. Although we have no specific current plans to do so, if we decide to pursue one or more significant acquisitions, we may incur additional debt or sell additional equity to finance such acquisitions.
46
Cash Flows
The following table provides a summary of cash flows from operating, investing and financing activities of Black Knight and BKFS LLC for the periods presented (in millions):
Year ended December 31, | |||||||||||
2016 | 2015 | 2014 | |||||||||
Cash flows provided by operating activities | $ | 325.7 | $ | 248.2 | $ | 19.4 | |||||
Cash flows used in investing activities | (230.2 | ) | (102.5 | ) | (65.4 | ) | |||||
Cash flows (used in) provided by financing activities | (147.6 | ) | (21.6 | ) | 107.9 | ||||||
Net (decrease) increase in cash and cash equivalents | $ | (52.1 | ) | $ | 124.1 | $ | 61.9 | ||||
Operating Activities
Cash provided by operating activities was $325.7 million, $248.2 million and $19.4 million in 2016, 2015 and 2014, respectively. The increase in cash provided by operating activities in 2016 compared to 2015 is primarily related to increased earnings. The increase in cash provided by operating activities in 2015 compared to 2014 is primarily related to increased earnings in 2015 as well as non-recurring costs paid in 2014 relating to the Acquisition.
Investing Activities
Cash used in investing activities was $230.2 million, $102.5 million and $65.4 million in 2016, 2015 and 2014, respectively. The increase in cash used in investing activities in 2016 compared to 2015 is primarily related to the eLynx and Motivity acquisitions that were partially offset by lower capital expenditures in 2016 and a one-time investment in our property records database from the buyout of a strategic data partner in 2015. The increase in cash used in investing activities in 2015 as compared to 2014 is primarily related to increased capital expenditures in 2015 due to the timing of our capital projects.
Financing Activities
Cash (used in) provided by financing activities was $(147.6) million, $(21.6) million and $107.9 million in 2016, 2015 and 2014, respectively. 2016 includes debt service payments of $149.0 million, tax distributions to BKFS LLC members of $48.6 million and capital lease payments of $5.0 million, partially offset by cash inflows of $55.0 million in borrowings. In 2015, we had cash inflows of $1,299.0 million in borrowings, net of original issue discount, and $479.3 million in gross proceeds from the IPO. These were offset by cash outflows of $1,745.9 million in debt service payments, $20.6 million in debt issuance costs, $17.3 million to the THL Intermediaries in connection with their merger with and into us in connection with the IPO, $11.8 million in call premium on the partial redemption of the Senior Notes, $4.2 million in costs attributable to the IPO and a $0.1 million distribution to members for income taxes. 2014 includes cash inflows of $469.0 million from the Acquisition and Internal Reorganization and $88.0 million in borrowings. These amounts were offset by $432.2 million in debt service payments and a $16.9 million distribution to members.
Financing
For a description of our financing arrangements, see Note 11 to the Notes to Consolidated Financial Statements included in Item 8 of Part 2 of this Report, which is incorporated by reference into this Part II Item 7.
Contractual Obligations
Our long-term contractual obligations generally include our debt and related interest payments, data processing and maintenance commitments, purchase commitments, operating lease payments and capital lease payments on certain of our property and equipment.
47
As of December 31, 2016, our required annual payments relating to these contractual obligations were as follows (in millions):
Payments due by period | ||||||||||||||||||||
Total | 2017 | 2018-2019 | 2020-2021 | Thereafter | ||||||||||||||||
Long-term debt | $ | 1,574.0 | $ | 64.0 | $ | 188.0 | $ | 558.0 | $ | 764.0 | ||||||||||
Interest on long-term debt (1) | 289.1 | 60.5 | 113.4 | 80.4 | 34.8 | |||||||||||||||
Data processing and maintenance commitments | 63.9 | 36.1 | 27.4 | 0.4 | — | |||||||||||||||
Purchase obligation | 18.5 | 18.5 | — | — | — | |||||||||||||||
Operating lease payments | 23.8 | 9.4 | 10.8 | 3.5 | 0.1 | |||||||||||||||
Capital lease payments | 5.0 | 5.0 | — | — | — | |||||||||||||||
Other (2) | 51.9 | 5.3 | 18.3 | 16.5 | 11.8 | |||||||||||||||
Total | $ | 2,026.2 | $ | 198.8 | $ | 357.9 | $ | 658.8 | $ | 810.7 | ||||||||||
_______________
(1) | These calculations assume that (a) applicable margins remain constant; (b) the Term A Loan variable rate debt is priced at the one-month LIBOR rate in effect as of December 31, 2016; (c) the Term B Loan variable rate debt is priced at the one-month LIBOR rate in effect as of December 31, 2016; (d) the Revolving Credit Facility is priced at the one-month LIBOR rate in effect as of December 31, 2016; (e) only mandatory debt repayments are made; and (f) no refinancing occurs at debt maturity. |
(2) | Other includes the guarantee fee paid to FNF for their ongoing guarantee of the Senior Notes, commitment fees on our |
Revolving Credit Facility and rating agency fees.
We entered into a one-year capital lease agreement commencing January 1, 2017 with a bargain purchase option for certain computer equipment. The leased equipment was valued based on the net present value of the minimum lease payments, which was $8.4 million (net of imputed interest of $0.1 million) and will be paid in 2017.
Share Repurchase Program
On January 31, 2017, our Board of Directors authorized a three-year share repurchase program, effective February 3, 2017, under which the Company may repurchase up to 10 million shares of its Class A common stock. The timing and volume of share repurchases will be determined by our management based on ongoing assessments of the capital needs of the business, the market price of Black Knight common stock and general market conditions. The repurchase program authorizes us to purchase Black Knight common stock from time to time through February 2, 2020, through open market purchases, negotiated transactions or other means, in accordance with applicable securities laws and other restrictions.
Indemnifications and Warranties
We often agree to indemnify our clients against damages and costs resulting from claims of patent, copyright, trademark infringement or breaches of confidentiality associated with use of our software through software licensing agreements. Historically, we have not made any payments under such indemnifications, but continue to monitor the conditions that are subject to the indemnifications to identify whether a loss has occurred that is both probable and estimable that would require recognition. In addition, we warrant to clients that our software operates substantially in accordance with the software specifications. Historically, no costs have been incurred related to software warranties and none are expected in the future, and as such, no accruals for warranty costs have been made.
Capital Stock Transactions
On May 26, 2015, we completed the IPO of 18,000,000 shares of our Class A common stock at an offering price of $24.50 per share. We granted the underwriters a 30-day option to purchase an additional 2,700,000 shares of our Class A common stock at the offering price, which was exercised in full. A total of 20,700,000 shares of Class A common stock were issued on May 26, 2015, with net proceeds of $475.1 million, after deducting $32.1 million for the underwriters' discount and IPO-related expenses. See Note 1 to the Notes to Consolidated Financial Statements for a more detailed discussion of the IPO.
Off-Balance Sheet Arrangements
We do not have any material off-balance sheet arrangements other than operating leases and interest rate swaps.
Recent Accounting Pronouncements
See Note 3 to the Notes to Consolidated Financial Statements for a description of recent accounting pronouncements.
48
Item 7A. | Quantitative and Qualitative Disclosure about Market Risk |
In the normal course of business, we are routinely subject to a variety of risks, as described in Item 1A. Risk Factors of Part I of this Annual Report on Form 10-K and in our other filings with the Securities and Exchange Commission.
The risks related to our business also include certain market risks that may affect our debt and other financial instruments. At present, we face the market risks associated with our cash equivalents and with interest rate movements on our outstanding debt.
Market Risk
We regularly assess market risks and have established policies and business practices designed to protect against the adverse effects of these exposures. We are exposed to market risks primarily from changes in interest rates. We use interest rate swaps to manage interest rate risk. We do not use interest rate swaps for trading purposes, to generate income or to engage in speculative activity.
Interest Rate Risk
In addition to existing cash balances and cash provided by operating activities, we use fixed rate and variable rate debt to finance our operations. We are exposed to interest rate risk on these debt obligations and related interest rate swaps. We had $1,570.2 million in long-term debt outstanding as of December 31, 2016. The Senior Notes represent all of our fixed-rate long-term debt obligations as of December 31, 2016. The carrying value of the Senior Notes was $401.1 million as of December 31, 2016. The fair value of the Senior Notes was $408.5 million as of December 31, 2016.
The credit facilities as described in Note 11 to the Notes to Consolidated Financial Statements represent our variable rate long-term debt obligations as of December 31, 2016. The carrying value of these facilities was $1,169.1 million as of December 31, 2016. We performed a sensitivity analysis on the principal amount of our long-term debt subject to variable interest rates as of December 31, 2016. This sensitivity analysis is based solely on the principal amount of such debt as of December 31, 2016, and does not take into account any changes that occurred in the prior 12 months or that may take place in the next 12 months in the amount of our outstanding debt or in the notional amount of outstanding interest rate swaps. Further, in this sensitivity analysis, the change in interest rates is assumed to be applicable for an entire year. An increase of 100 basis points in the applicable interest rate would cause an increase in interest expense of $11.8 million on an annual basis ($7.8 million including the effect of our current interest rate swaps). A decrease of 100 basis points in the applicable rate would cause a decrease in interest expense of $6.7 million on an annual basis ($3.4 million including the effect of our current interest rate swaps) as the current LIBOR rate is less than 1%.
On January 20, 2016, we entered into two interest rate swap agreements to hedge forecasted monthly interest rate payments on $400.0 million of our floating rate debt ($200.0 million notional value each) (the "Swap Agreements"). The Swap Agreements were designated as cash flow hedging instruments. Under the terms of the Swap Agreements, we receive payments based on the 1-month LIBOR rate and pay a weighted average fixed rate of 1.01%. A portion of the amount included in Accumulated other comprehensive loss is reclassified into Interest expense as a yield adjustment as interest payments are made on the term and revolving loans. In accordance with the authoritative guidance for fair value measurements, the inputs used to determine the estimated fair value of our interest rate swaps are Level 2-type measurements. We considered our own credit risk and the credit risk of the counterparties when determining the fair value of our interest rate swaps. The effective term for the Swap Agreements is February 1, 2016 through January 31, 2019.
49
Item 8. | Financial Statements and Supplementary Data |
BLACK KNIGHT FINANCIAL SERVICES, INC. AND SUBSIDIARIES
INDEX TO FINANCIAL STATEMENTS
Page Number | |
50
Report of Independent Registered Public Accounting Firm
The Board of Directors and Shareholders
Black Knight Financial Services, Inc.:
We have audited Black Knight Financial Services, Inc.'s (the Company) internal control over financial reporting as of December 31, 2016, based on criteria established in Internal Control - Integrated Framework issued by the Committee of Sponsoring Organizations of the Treadway Commission (COSO). The Company's management is responsible for maintaining effective internal control over financial reporting and for its assessment of the effectiveness of internal control over financial reporting, included in the accompanying Management's Report on Internal Control over Financial Reporting. Our responsibility is to express an opinion on the Company's internal control over financial reporting based on our audit.
We conducted our audit in accordance with the standards of the Public Company Accounting Oversight Board (United States). Those standards require that we plan and perform the audit to obtain reasonable assurance about whether effective internal control over financial reporting was maintained in all material respects. Our audit included obtaining an understanding of internal control over financial reporting, assessing the risk that a material weakness exists and testing and evaluating the design and operating effectiveness of internal control based on the assessed risk. Our audit also included performing such other procedures as we considered necessary in the circumstances. We believe that our audit provides a reasonable basis for our opinion.
A company's internal control over financial reporting is a process designed to provide reasonable assurance regarding the reliability of financial reporting and the preparation of financial statements for external purposes in accordance with generally accepted accounting principles. A company's internal control over financial reporting includes those policies and procedures that (1) pertain to the maintenance of records that, in reasonable detail, accurately and fairly reflect the transactions and dispositions of the assets of the company; (2) provide reasonable assurance that transactions are recorded as necessary to permit preparation of financial statements in accordance with generally accepted accounting principles, and that receipts and expenditures of the company are being made only in accordance with authorizations of management and directors of the company; and (3) provide reasonable assurance regarding prevention or timely detection of unauthorized acquisition, use, or disposition of the company's assets that could have a material effect on the financial statements.
Because of its inherent limitations, internal control over financial reporting may not prevent or detect misstatements. Also, projections of any evaluation of effectiveness to future periods are subject to the risk that controls may become inadequate because of changes in conditions, or that the degree of compliance with the policies or procedures may deteriorate.
In our opinion, Black Knight Financial Services, Inc. maintained, in all material respects, effective internal control over financial reporting as of December 31, 2016, based on criteria established in Internal Control - Integrated Framework issued by the Committee of Sponsoring Organizations of the Treadway Commission (COSO).
Black Knight Financial Services, Inc. acquired eLynx Holdings, Inc. (eLynx) on May 16, 2016 and Motivity Solutions, Inc. (Motivity) on June 22, 2016, and management has excluded from its assessment of the effectiveness of Black Knight Financial Services, Inc.'s internal control over financial reporting as of December 31, 2016, eLynx's and Motivity's internal control over financial reporting associated with approximately 4.1% of total assets and 2.3% of total revenues included in the Consolidated Financial Statements of Black Knight Financial Services, Inc. and subsidiaries as of and for the year ended December 31, 2016. Our audit of internal control over financial reporting of Black Knight Financial Services, Inc. also excludes an evaluation of the internal control over financial reporting of eLynx and Motivity.
We also have audited, in accordance with the standards of the Public Company Accounting Oversight Board (United States), the Consolidated Balance Sheets of Black Knight Financial Services, Inc. and subsidiaries as of December 31, 2016 and 2015, and the related Consolidated Statements of Operations and Comprehensive Earnings (Loss), Equity and Cash Flows for each of the years in the three-year period ended December 31, 2016, and our report dated February 24, 2017 expressed an unqualified opinion on those Consolidated Financial Statements.
/s/ KPMG LLP
February 24, 2017
Jacksonville, Florida
Certified Public Accountants
Report of Independent Registered Public Accounting Firm
The Board of Directors and Shareholders
Black Knight Financial Services, Inc.:
We have audited the accompanying Consolidated Balance Sheets of Black Knight Financial Services, Inc. and subsidiaries (the Company) as of December 31, 2016 and 2015, and the related Consolidated Statements of Operations and Comprehensive Earnings (Loss), Equity and Cash Flows for each of the years in the three-year period ended December 31, 2016. These Consolidated Financial Statements are the responsibility of the Company's management. Our responsibility is to express an opinion on these Consolidated Financial Statements based on our audits.
We conducted our audits in accordance with the standards of the Public Company Accounting Oversight Board (United States). Those standards require that we plan and perform the audit to obtain reasonable assurance about whether the financial statements are free of material misstatement. An audit includes examining, on a test basis, evidence supporting the amounts and disclosures in the financial statements. An audit also includes assessing the accounting principles used and significant estimates made by management, as well as evaluating the overall financial statement presentation. We believe that our audits provide a reasonable basis for our opinion.
In our opinion, the Consolidated Financial Statements referred to above present fairly, in all material respects, the financial position of Black Knight Financial Services, Inc. and subsidiaries as of December 31, 2016 and 2015, and the results of their operations and their cash flows for each of the years in the three-year period ended December 31, 2016, in conformity with U.S. generally accepted accounting principles.
We also have audited, in accordance with the standards of the Public Company Accounting Oversight Board (United States), Black Knight Financial Services, Inc.'s internal control over financial reporting as of December 31, 2016, based on criteria established in Internal Control - Integrated Framework issued by the Committee of Sponsoring Organizations of the Treadway Commission (COSO), and our report dated February 24, 2017, expressed an unqualified opinion on the effectiveness of the Company's internal control over financial reporting.
As discussed in Note 1 to the Consolidated Financial Statements, Black Knight Financial Services, Inc. completed an initial public offering (IPO) of its stock on May 26, 2015 and contributed the net cash proceeds received from the IPO to Black Knight Financial Services, LLC in exchange for 44.5% of the units and a managing member's membership interest in Black Knight Financial Services, LLC. Additionally, as discussed in Notes 1 and 2 to the Consolidated Financial Statements, Lender Processing Services, Inc. merged with Lion Merger Sub, Inc. on January 2, 2014, through which Lender Processing Services, Inc. became a wholly-owned subsidiary of Fidelity National Financial, Inc., which then reorganized the operations of Lender Processing Services, Inc. and contributed certain of its operations into Black Knight Financial Services, LLC on January 3, 2014.
/s/ KPMG LLP
February 24, 2017
Jacksonville, Florida
Certified Public Accountants
BLACK KNIGHT FINANCIAL SERVICES, INC.
Consolidated Balance Sheets
(In millions, except share data)
December 31, | |||||||
2016 | 2015 | ||||||
ASSETS | |||||||
Current assets: | |||||||
Cash and cash equivalents | $ | 133.9 | $ | 186.0 | |||
Trade receivables, net | 155.8 | 138.7 | |||||
Prepaid expenses and other current assets | 45.4 | 28.2 | |||||
Receivables from related parties | 4.1 | 7.6 | |||||
Total current assets | 339.2 | 360.5 | |||||
Property and equipment, net | 173.0 | 152.0 | |||||
Computer software, net | 450.0 | 466.5 | |||||
Other intangible assets, net | 299.5 | 330.2 | |||||
Goodwill | 2,303.8 | 2,220.1 | |||||
Other non-current assets | 196.5 | 174.4 | |||||
Total assets | $ | 3,762.0 | $ | 3,703.7 | |||
LIABILITIES AND EQUITY | |||||||
Current liabilities: | |||||||
Trade accounts payable and other accrued liabilities | $ | 55.2 | $ | 42.1 | |||
Accrued compensation and benefits | 61.1 | 52.2 | |||||
Current portion of long-term debt | 63.4 | 43.5 | |||||
Deferred revenues | 47.4 | 40.4 | |||||
Total current liabilities | 227.1 | 178.2 | |||||
Deferred revenues | 77.3 | 56.2 | |||||
Deferred income taxes, net | 7.9 | 4.7 | |||||
Long-term debt, net of current portion | 1,506.8 | 1,618.0 | |||||
Other non-current liabilities | 3.5 | 1.6 | |||||
Total liabilities | 1,822.6 | 1,858.7 | |||||
Commitments and contingencies (Note 12) | |||||||
Equity: | |||||||
Class A common stock; $0.0001 par value; 350,000,000 shares authorized, 69,091,008 and 68,303,680 shares issued and outstanding as of December 31, 2016 and 2015, respectively | — | — | |||||
Class B common stock; $0.0001 par value; 200,000,000 shares authorized, 84,826,282 shares issued and outstanding as of December 31, 2016 and 2015 | — | — | |||||
Preferred stock; $0.0001 par value; 25,000,000 shares authorized; none issued and outstanding | — | — | |||||
Additional paid-in capital | 810.8 | 798.9 | |||||
Retained earnings | 65.7 | 19.9 | |||||
Accumulated other comprehensive loss | (0.8 | ) | (0.1 | ) | |||
Total shareholders' equity | 875.7 | 818.7 | |||||
Noncontrolling interests | 1,063.7 | 1,026.3 | |||||
Total equity | 1,939.4 | 1,845.0 | |||||
Total liabilities and equity | $ | 3,762.0 | $ | 3,703.7 | |||
See Notes to Consolidated Financial Statements.
53
BLACK KNIGHT FINANCIAL SERVICES, INC.
Consolidated Statements of Operations and Comprehensive Earnings (Loss)
(In millions, except per share data)
Year ended December 31, | |||||||||||
2016 | 2015 | 2014 | |||||||||
Revenues | $ | 1,026.0 | $ | 930.7 | $ | 852.1 | |||||
Expenses: | |||||||||||
Operating expenses | 582.6 | 538.2 | 514.9 | ||||||||
Depreciation and amortization | 208.3 | 194.3 | 188.8 | ||||||||
Transition and integration costs | 2.3 | 8.0 | 119.3 | ||||||||
Total expenses | 793.2 | 740.5 | 823.0 | ||||||||
Operating income | 232.8 | 190.2 | 29.1 | ||||||||
Other income and expense: | |||||||||||
Interest expense | (67.6 | ) | (89.8 | ) | (128.7 | ) | |||||
Other expense, net | (6.4 | ) | (4.6 | ) | (12.0 | ) | |||||
Total other expense, net | (74.0 | ) | (94.4 | ) | (140.7 | ) | |||||
Earnings (loss) from continuing operations before income taxes | 158.8 | 95.8 | (111.6 | ) | |||||||
Income tax expense (benefit) | 25.8 | 13.4 | (5.3 | ) | |||||||
Net earnings (loss) from continuing operations | 133.0 | 82.4 | (106.3 | ) | |||||||
Loss from discontinued operations, net of tax | — | — | (0.8 | ) | |||||||
Net earnings (loss) | 133.0 | 82.4 | (107.1 | ) | |||||||
Less: Net earnings (loss) attributable to noncontrolling interests | 87.2 | 62.4 | (107.1 | ) | |||||||
Net earnings attributable to Black Knight Financial Services, Inc. | $ | 45.8 | $ | 20.0 | $ | — | |||||
Other comprehensive earnings (loss): | |||||||||||
Unrealized holding losses, net of tax | (1.1 | ) | — | — | |||||||
Reclassification adjustments for losses included in net earnings, net of tax (1) | 0.5 | — | — | ||||||||
Total unrealized losses on interest rate swaps, net of tax (2) | (0.6 | ) | — | — | |||||||
Foreign currency translation adjustment | (0.1 | ) | (0.1 | ) | (0.1 | ) | |||||
Other comprehensive loss | (0.7 | ) | (0.1 | ) | (0.1 | ) | |||||
Comprehensive earnings (loss) attributable to noncontrolling interests | 86.0 | 62.4 | (107.1 | ) | |||||||
Comprehensive earnings (loss) | $ | 131.1 | $ | 82.3 | $ | (107.2 | ) | ||||
Year ended December 31, 2016 | May 26, 2015 through December 31, 2015 | ||||||||||
Net earnings per share attributable to Black Knight Financial Services, Inc., Class A common shareholders: | |||||||||||
Basic | $ | 0.69 | $ | 0.31 | |||||||
Diluted | $ | 0.67 | $ | 0.29 | |||||||
Weighted average shares of Class A common stock outstanding (see Note 5): | |||||||||||
Basic | 65.9 | 64.4 | |||||||||
Diluted | 67.9 | 67.9 | |||||||||
______________________________
(1) | Amounts reclassified to net earnings relate to losses on interest rate swaps and are included in Interest expense on the Consolidated Statements of Operations and Comprehensive Earnings (Loss). Amount is net of income tax expense of $0.3 million for the year ended December 31, 2016. |
(2) | Net of income tax benefit of $0.4 million for the year ended December 31, 2016. |
See Notes to Consolidated Financial Statements.
54
BLACK KNIGHT FINANCIAL SERVICES, INC.
Consolidated Statements of Equity
(In millions)
Black Knight Financial Services, LLC | |||||||||||||||||||
Contributed member capital | Accumulated deficit | Accumulated other comprehensive loss | Total equity | Redeemable members' interest | |||||||||||||||
Balance, January 1, 2014 | $ | — | $ | — | $ | — | $ | — | $ | — | |||||||||
Contribution of Black Knight InfoServ, LLC from Fidelity National Financial, Inc. | 2,792.9 | — | — | 2,792.9 | — | ||||||||||||||
Assumption of debt from Fidelity National Financial, Inc. | (1,858.0 | ) | — | — | (1,858.0 | ) | — | ||||||||||||
Contribution of Fidelity National Commerce Velocity, LLC from Fidelity National Financial, Inc. | 62.2 | (28.4 | ) | — | 33.8 | — | |||||||||||||
Contribution from Member (Thomas H. Lee Partners, L.P.) | — | — | — | — | 350.0 | ||||||||||||||
Return of capital to members | (9.5 | ) | — | — | (9.5 | ) | (7.4 | ) | |||||||||||
Contribution of Property Insight, LLC from Fidelity National Financial, Inc. | 95.0 | 1.8 | — | 96.8 | — | ||||||||||||||
Dividend of Property Insight, LLC assets to Fidelity National Financial, Inc. | — | (9.8 | ) | — | (9.8 | ) | — | ||||||||||||
Profits interests expense | 6.1 | — | — | 6.1 | — | ||||||||||||||
Dividend profits interests to Fidelity National Financial, Inc. for awards granted to non-employees | 3.2 | (3.2 | ) | — | — | — | |||||||||||||
Redemption values of profits interests grants | (28.1 | ) | — | — | (28.1 | ) | 28.1 | ||||||||||||
Net loss | — | (107.1 | ) | — | (107.1 | ) | — | ||||||||||||
Foreign currency translation adjustment | — | — | (0.1 | ) | (0.1 | ) | — | ||||||||||||
Balance, December 31, 2014 | $ | 1,063.8 | $ | (146.7 | ) | $ | (0.1 | ) | $ | 917.0 | $ | 370.7 | |||||||
See Notes to Consolidated Financial Statements.
55
BLACK KNIGHT FINANCIAL SERVICES, INC.
Consolidated Statements of Equity - (Continued)
(In millions)
Black Knight Financial Services, LLC | Black Knight Financial Services, Inc. | ||||||||||||||||||||||||||||||||||||||||||||||||
Class A common stock | Class B common stock | ||||||||||||||||||||||||||||||||||||||||||||||||
Contributed member capital | Accumulated deficit | Accumulated other comprehensive loss | Shares | $ | Shares | $ | Additional paid-in capital | Retained earnings | Accumulated other comprehensive loss | Noncontrolling interests | Total equity | Redeemable members' interest | |||||||||||||||||||||||||||||||||||||
Balance, December 31, 2014 | $ | 1,063.8 | $ | (146.7 | ) | $ | (0.1 | ) | — | $ | — | — | $ | — | $ | — | $ | — | $ | — | $ | — | $ | 917.0 | $ | 370.7 | |||||||||||||||||||||||
Profits interests expense | 2.6 | — | — | — | — | — | — | — | — | — | — | 2.6 | — | ||||||||||||||||||||||||||||||||||||
Redemption value of profits interests | (59.5 | ) | — | — | — | — | — | — | — | — | — | — | (59.5 | ) | 59.5 | ||||||||||||||||||||||||||||||||||
Net earnings | — | 21.4 | — | — | — | — | — | — | — | — | — | 21.4 | — | ||||||||||||||||||||||||||||||||||||
Foreign currency translation adjustment | — | — | (0.1 | ) | — | — | — | — | — | — | — | — | (0.1 | ) | — | ||||||||||||||||||||||||||||||||||
Balance, May 25, 2015, prior to organizational transactions and IPO | 1,006.9 | (125.3 | ) | (0.2 | ) | — | — | — | — | — | — | — | — | 881.4 | 430.2 | ||||||||||||||||||||||||||||||||||
Issuance of Class A common stock, net of underwriters' discount and issuance costs | — | — | — | 20.7 | — | — | — | 475.1 | — | — | — | 475.1 | — | ||||||||||||||||||||||||||||||||||||
Conversion of THL member interest into shares of Class A common stock | — | — | — | 39.3 | — | — | — | 319.4 | — | — | 12.7 | 332.1 | (342.6 | ) | |||||||||||||||||||||||||||||||||||
Conversion of profits interests into restricted shares of Class A common stock | 75.7 | — | — | 8.0 | — | — | — | 11.9 | — | — | — | 87.6 | (87.6 | ) | |||||||||||||||||||||||||||||||||||
Issuance of Class B common stock to FNF and THL | — | — | — | — | — | 84.8 | — | — | — | — | — | — | — | ||||||||||||||||||||||||||||||||||||
Reclassification of FNF member capital to noncontrolling interests | (1,082.6 | ) | — | — | — | — | — | — | — | — | — | 1,082.6 | — | — | |||||||||||||||||||||||||||||||||||
Reclassification of accumulated deficit and accumulated other comprehensive loss | — | 125.3 | 0.2 | — | — | — | — | (15.5 | ) | — | — | (110.0 | ) | — | — | ||||||||||||||||||||||||||||||||||
Issuance of restricted shares of Class A common stock | — | — | — | 0.3 | — | — | — | — | — | — | — | — | — | ||||||||||||||||||||||||||||||||||||
Equity-based compensation expense | — | — | — | — | — | — | — | 8.0 | — | — | — | 8.0 | — | ||||||||||||||||||||||||||||||||||||
Net earnings | — | — | — | — | — | — | — | — | 20.0 | — | 41.0 | 61.0 | — | ||||||||||||||||||||||||||||||||||||
Foreign currency translation adjustment | — | — | — | — | — | — | — | — | — | (0.1 | ) | — | (0.1 | ) | — | ||||||||||||||||||||||||||||||||||
Tax distributions | — | — | — | — | — | — | — | — | (0.1 | ) | — | — | (0.1 | ) | — | ||||||||||||||||||||||||||||||||||
Balance, December 31, 2015 | — | — | — | 68.3 | — | 84.8 | — | 798.9 | 19.9 | (0.1 | ) | 1,026.3 | 1,845.0 | — | |||||||||||||||||||||||||||||||||||
Issuance of restricted shares of Class A common stock | — | — | — | 0.8 | — | — | — | — | — | — | — | — | — | ||||||||||||||||||||||||||||||||||||
Equity-based compensation expense | — | — | — | — | — | — | — | 11.9 | — | — | — | 11.9 | — | ||||||||||||||||||||||||||||||||||||
Net earnings | — | — | — | — | — | — | — | — | 45.8 | — | 87.2 | 133.0 | — | ||||||||||||||||||||||||||||||||||||
Foreign currency translation adjustment | — | — | — | — | — | — | — | — | — | (0.1 | ) | — | (0.1 | ) | — | ||||||||||||||||||||||||||||||||||
Unrealized loss on interest rate swaps | — | — | — | — | — | — | — | — | — | (0.6 | ) | (1.2 | ) | (1.8 | ) | — | |||||||||||||||||||||||||||||||||
Tax distributions | — | — | — | — | — | — | — | — | — | — | (48.6 | ) | (48.6 | ) | — | ||||||||||||||||||||||||||||||||||
Balance, December 31, 2016 | $ | — | $ | — | $ | — | 69.1 | $ | — | 84.8 | $ | — | $ | 810.8 | $ | 65.7 | $ | (0.8 | ) | $ | 1,063.7 | $ | 1,939.4 | $ | — | ||||||||||||||||||||||||
See Notes to Consolidated Financial Statements.
56
BLACK KNIGHT FINANCIAL SERVICES, INC.
Consolidated Statements of Cash Flows
(In millions)
Year ended December 31, | |||||||||||
2016 | 2015 | 2014 | |||||||||
Cash flows from operating activities: | |||||||||||
Net earnings (loss) | $ | 133.0 | $ | 82.4 | $ | (107.1 | ) | ||||
Adjustments to reconcile net earnings (loss) to net cash provided by operating activities: | |||||||||||
Depreciation and amortization | 208.3 | 194.3 | 188.8 | ||||||||
Amortization of debt issuance costs, bond premium and original issue discount | 2.7 | 0.8 | (2.1 | ) | |||||||
Loss on extinguishment of debt, net | — | 4.8 | — | ||||||||
Deferred income taxes, net | 3.2 | 11.8 | 0.1 | ||||||||
Equity-based compensation | 12.4 | 11.4 | 6.4 | ||||||||
Changes in assets and liabilities: | |||||||||||
Trade and other receivables, including receivables from related parties | (6.4 | ) | (20.9 | ) | 0.2 | ||||||
Prepaid expenses and other assets | (11.2 | ) | (6.4 | ) | (9.5 | ) | |||||
Deferred contract costs | (51.9 | ) | (54.9 | ) | (42.5 | ) | |||||
Deferred revenues | 26.2 | 32.6 | 27.8 | ||||||||
Trade accounts payable and other accrued liabilities | 9.4 | (7.7 | ) | (42.7 | ) | ||||||
Net cash provided by operating activities | 325.7 | 248.2 | 19.4 | ||||||||
Cash flows from investing activities: | |||||||||||
Additions to property and equipment | (38.1 | ) | (45.6 | ) | (21.4 | ) | |||||
Additions to computer software | (41.9 | ) | (50.1 | ) | (45.5 | ) | |||||
Business acquisitions, net of cash acquired | (150.2 | ) | — | — | |||||||
Investment in property records database | — | (6.8 | ) | — | |||||||
Proceeds from sale of PCLender | — | — | 1.5 | ||||||||
Net cash used in investing activities | (230.2 | ) | (102.5 | ) | (65.4 | ) | |||||
Cash flows from financing activities: | |||||||||||
Borrowings, net of original issue discount | 55.0 | 1,299.0 | 88.0 | ||||||||
Debt service payments | (149.0 | ) | (1,745.9 | ) | (432.2 | ) | |||||
Distributions to members | (48.6 | ) | (17.4 | ) | (16.9 | ) | |||||
Capital lease payments | (5.0 | ) | — | — | |||||||
Proceeds from issuance of Class A common stock, before offering expenses | — | 479.3 | — | ||||||||
Costs directly associated with issuance of Class A common stock | — | (4.2 | ) | — | |||||||
Debt issuance costs | — | (20.6 | ) | — | |||||||
Senior notes call premium | — | (11.8 | ) | — | |||||||
Contribution from Thomas H. Lee Partners, LP | — | — | 350.0 | ||||||||
Cash from contribution of Black Knight InfoServ, LLC | — | — | 61.4 | ||||||||
Net proceeds from sale of National Title Insurance of New York, Inc. to Fidelity National Financial, Inc. | — | — | 50.2 | ||||||||
Cash from contribution of Fidelity National Commerce Velocity, LLC from Fidelity National Financial, Inc. | — | — | 0.7 | ||||||||
Cash from contribution of Property Insight, LLC from Fidelity National Financial, Inc. | — | — | 6.7 | ||||||||
Net cash (used in) provided by financing activities | (147.6 | ) | (21.6 | ) | 107.9 | ||||||
Net (decrease) increase in cash and cash equivalents | (52.1 | ) | 124.1 | 61.9 | |||||||
Cash and cash equivalents, beginning of period | 186.0 | 61.9 | — | ||||||||
Cash and cash equivalents, end of period | $ | 133.9 | $ | 186.0 | $ | 61.9 | |||||
Supplemental cash flow information: | |||||||||||
Interest paid | $ | (60.2 | ) | $ | (89.2 | ) | $ | (131.8 | ) | ||
Income taxes (paid) refunded, net | $ | (21.9 | ) | $ | 0.2 | $ | 30.7 | ||||
See Notes to Consolidated Financial Statements.
57
BLACK KNIGHT FINANCIAL SERVICES, INC. AND SUBSIDIARIES
NOTES TO CONSOLIDATED FINANCIAL STATEMENTS
Except as otherwise indicated or unless the context otherwise requires, all references to "Black Knight," the "Company," "we," "us" or "our" are to Black Knight Financial Services, Inc., a Delaware corporation, and its subsidiaries.
(1) | Basis of Presentation |
The accompanying audited Consolidated Financial Statements were prepared in accordance with U.S. generally accepted accounting principles ("GAAP"). As further discussed below and in Note 2—Acquisition and Internal Reorganization by FNF and Other Transactions, Black Knight Financial Services, LLC ("BKFS LLC") was established in connection with the acquisition of Lender Processing Services, Inc. ("LPS") by Fidelity National Financial, Inc. ("FNF") on January 2, 2014 (the "Acquisition") and ensuing internal reorganization (the "Internal Reorganization"). As part of the Internal Reorganization, certain pre-existing FNF businesses were contributed to BKFS LLC. Accordingly, we have applied GAAP requirements for transactions between entities under common control to the Consolidated Financial Statements.
We consider the contribution of Black Knight InfoServ, LLC ("BKIS"), a Delaware limited liability company, (including the Technology, Data and Analytics business of LPS) to BKFS LLC on January 3, 2014 to be a change in reporting entity. BKIS was contributed by FNF to BKFS LLC subsequent to the Acquisition, but has been retroactively reflected as being included in BKFS LLC since January 2, 2014, the date it came under the common control of FNF. The results of operations and cash flows for the day ended January 1, 2014 are immaterial and we have included these results and cash flows for that day within the accompanying Consolidated Statements of Operations and Comprehensive Earnings (Loss) and Consolidated Statements of Cash Flows for the year ended December 31, 2014. See Note 2—Acquisition and Internal Reorganization by FNF and Other Transactions for further discussion of these transactions.
The periods presented represent the consolidated financial position, results of operations and cash flows of (1) Black Knight for the period from May 26, 2015, the date we completed our initial public offering (the "IPO"), through December 31, 2015 and for the year ended December 31, 2016 and (2) BKFS LLC for the period from January 2, 2014 through May 25, 2015, the day prior to the IPO.
Description of Business
Black Knight was incorporated in the State of Delaware on October 27, 2014. We are a holding company that conducts business through our interest in BKFS LLC, our sole asset and a provider of integrated technology, data and analytics solutions that facilitates and automates many of the business processes across the mortgage lifecycle. We provide solutions to the mortgage and real estate industries primarily in the United States.
BKFS LLC owns all of the membership interests of BKIS, formerly known as LPS. As discussed further in Note 2—Acquisition and Internal Reorganization by FNF and Other Transactions, FNF acquired LPS on January 2, 2014, and LPS underwent a series of transactions on January 3, 2014 in which the Technology, Data and Analytics businesses of LPS, as well as certain pre-existing FNF businesses, were contributed to BKFS LLC.
Reporting Segments
We conduct our operations through two reporting segments, (1) Technology and (2) Data and Analytics. See further discussion in Note 17—Segment Information.
Organizational Transactions
An IPO of Black Knight was completed on May 26, 2015. In connection with the IPO, the following transactions occurred:
• | the amendment and restatement of our certificate of incorporation to authorize the issuance of two classes of common stock, Class A and Class B, which generally vote as a single class on all matters submitted for a vote to shareholders; |
• | the issuance of shares of Class B common stock by us to FNF and certain Thomas H. Lee Partners, L.P. ("THL") affiliates ("THL Affiliates"), former holders of membership interests in BKFS LLC ("Units"). Class B common stock is neither registered nor publicly traded and does not entitle the holders thereof to any of the economic rights, including rights to dividends and distributions upon liquidation, that would be provided to holders of Class A common stock; and the total voting power of the Class B common stock is equal to the percentage of Units not held by us; |
• | the issuance of shares of Class A common stock and a $17.3 million cash payment to certain THL Affiliates, in connection with the merger of certain THL affiliated entities (the "THL Intermediaries") with and into us, pursuant to which we acquired the Units held by the THL Intermediaries; |
• | the issuance of shares of Class A common stock by Black Knight to the investors in the IPO; |
• | the contribution by us of the net cash proceeds received in the IPO to BKFS LLC in exchange for 44.5% of the Units and a managing member's membership interest in BKFS LLC; |
58
BLACK KNIGHT FINANCIAL SERVICES, INC.
NOTES TO CONSOLIDATED FINANCIAL STATEMENTS - (Continued)
• | the conversion of all outstanding equity incentive awards in the form of profits interests in BKFS LLC into restricted shares of our Class A common stock; and |
• | the restatement of the limited liability company agreement ("LLC Agreement") to provide for the governance and control of BKFS LLC by Black Knight as its managing member and to establish the terms upon which other holders of Units may exchange their Units, and a corresponding number of shares of Class B common stock for, at our option, shares of Class A common stock on a one-for-one basis or a cash payment from BKFS LLC. |
We refer to the above transactions as the "Offering Reorganization."
Initial Public Offering
On May 26, 2015, we completed the IPO of 18,000,000 shares of our Class A common stock, par value $0.0001 per share ("Class A common stock"), at an offering price of $24.50 per share. We granted the underwriters a 30-day option to purchase an additional 2,700,000 shares of our Class A common stock at the offering price, which was exercised in full. A total of 20,700,000 shares of Class A common stock were issued on May 26, 2015, with net proceeds of $475.1 million, after deducting $32.1 million for the underwriters' discount and IPO-related expenses.
The use of the proceeds from the IPO is as follows (in millions):
Gross proceeds | $ | 507.2 | ||
Less: | ||||
Underwriters' discount | 27.9 | |||
IPO-related expenses | 4.2 | |||
Partial redemption of 5.75% Senior Notes due 2023 (Note 11) | 204.8 | |||
Call premium on partial redemption of 5.75% Senior Notes due 2023 | 11.8 | |||
Interest on partial redemption of 5.75% Senior Notes due 2023 | 1.4 | |||
Cash payment to THL Intermediaries | 17.3 | |||
Partial repayment of principal on other outstanding long-term debt | 203.0 | |||
Refinancing expenses | 20.6 | |||
Cash to balance sheet | 16.2 | |||
Unused proceeds | $ | — | ||
As a result of the organizational transactions and IPO described above, we owned 44.5% of the Units of BKFS LLC; Black Knight Holdings, Inc. ("BKHI"), Chicago Title Insurance Company ("CTIC") and Fidelity National Title Insurance Company, all subsidiaries of FNF, collectively owned 54.5% of the Units; and THL and THL Affiliates owned 1.0% of the Units immediately following the IPO.
Discontinued Operations
On June 30, 2014, we completed the sale of PCLender.com, Inc. ("PCLender") for $1.5 million. No gain or loss was recognized on the disposal. The results of PCLender are reflected within the Consolidated Statements of Operations and Comprehensive Earnings (Loss) as discontinued operations. Revenues from discontinued operations were $2.5 million for the year ended December 31, 2014. Loss from discontinued operations before income taxes was $0.8 million for the year ended 2014.
Planned Distribution of FNF's Ownership Interest
On December 7, 2016, we announced that FNF's Board of Directors approved a tax-free plan (the "Distribution Plan") whereby FNF intends to distribute all 83.3 million shares of Black Knight common stock that it currently owns to FNF Group shareholders. We plan to effectuate the Distribution Plan through four newly-formed corporations, New BKH Corp. ("New BKH"), Black Knight Holdco Corp. ("New Black Knight"), New BKH Merger Sub, Inc. ("Merger Sub One") and BKFS Merger Sub, Inc. ("Merger Sub Two"). BKHI will contribute its shares of Black Knight Class B common stock and its Units of BKFS LLC to New BKH in exchange for 100% of the shares of New BKH common stock, following which BKHI will distribute to FNF all of the shares of New BKH common stock held by BKHI. Immediately thereafter, FNF will distribute the shares of New BKH common stock to its shareholders, provided that such distribution shall be subject to the conversion of such shares of New BKH common stock into shares of New Black Knight common stock. Immediately following the spin-off, Merger Sub One will merge with and into New BKH (the "New BKH merger"). In the New BKH merger, each outstanding share of New BKH common stock (other than shares owned by New BKH) will be exchanged for one share of New Black Knight common stock. Immediately following the New BKH
59
BLACK KNIGHT FINANCIAL SERVICES, INC.
NOTES TO CONSOLIDATED FINANCIAL STATEMENTS - (Continued)
merger, Merger Sub Two will merge with and into Black Knight (the "BKFS merger"). In the BKFS merger, each outstanding share of Black Knight common stock (other than shares owned by Black Knight and New BKH) will be exchanged for one share of New Black Knight common stock. New Black Knight will be the public company following the completion of the distribution and mergers.
The Distribution Plan is subject to the receipt of private letter rulings from the Internal Revenue Service, approving the tax-free spin-off of the Black Knight shares; filing and acceptance of a registration statement for the Black Knight spin-off with the Securities and Exchange Commission ("SEC"); refinancing of BKIS's 5.75% senior notes due 2023 (the "Senior Notes"), which are subject to FNF's guarantee, on reasonable terms; Black Knight shareholder approval; and other customary closing conditions. The closing of the tax-free distribution is expected by the third quarter of 2017.
Realignment of Property Insight
Effective January 1, 2017, Property Insight, LLC ("Property Insight"), a Black Knight subsidiary that provides information used by title insurance underwriters, title agents and closing attorneys to source and underwrite title insurance for real property sales and transfer, realigned its commercial relationship with FNF. In connection with the realignment, Property Insight employees responsible for title plant posting and maintenance were transferred to FNF. Under the new commercial arrangement, Black Knight will continue to own the title plant technology and retain sales responsibility for third parties, other than FNF. As a result of the realignment, Black Knight will no longer recognize revenues or expense related to title plant posting and maintenance, but will charge FNF a license fee for use of the technology to access and maintain the title plant data. This transaction will not result in any gain or loss.
Share Repurchase Program
On January 31, 2017, our Board of Directors authorized a three-year share repurchase program, effective February 3, 2017, under which the Company may repurchase up to 10 million shares of its Class A common stock. The timing and volume of share repurchases will be determined by the Company's management based on its ongoing assessments of the capital needs of the business, the market price of its common stock and general market conditions. The repurchase program authorizes us to purchase Black Knight common stock from time to time through February 2, 2020, through open market purchases, negotiated transactions or other means, in accordance with applicable securities laws and other restrictions.
(2) | Acquisition and Internal Reorganization by FNF and Other Transactions |
On January 2, 2014, FNF completed the Acquisition, pursuant to the Agreement and Plan of Merger (the "Merger Agreement"), dated as of May 28, 2013, among FNF, BKHI and Lion Merger Sub, Inc., a Delaware corporation and a subsidiary of BKHI ("Merger Sub") and LPS. Pursuant to the Merger Agreement, Merger Sub merged with and into LPS (the "Merger"), with LPS surviving as a subsidiary of BKHI, and each outstanding share of common stock, par value $0.0001 per share, of LPS (the "LPS Common Stock") (other than shares owned by LPS, its subsidiaries, FNF, BKHI or Merger Sub and shares in respect of which appraisal rights had been properly exercised and perfected under Delaware law) was automatically converted into the right to receive (i) $28.102 in cash and (ii) 0.28742 of a share of Class A common stock, par value $0.0001 per share, of FNF ("FNF Common Stock") (the "Merger Consideration"). The Merger was effective on January 2, 2014. Upon the closing of the Merger, the shares of LPS Common Stock, which previously traded under the ticker symbol "LPS" on the New York Stock Exchange ("NYSE"), ceased trading on, and were delisted from, the NYSE. As a result of the Merger, LPS became an indirect subsidiary of FNF.
On January 3, 2014, LPS was converted into a Delaware limited liability company and was renamed BKIS. Also on that date, pursuant to the Internal Reorganization, BKIS distributed all of its limited liability company membership interests and equity interests in its subsidiaries engaged in the Transaction Services business to BKHI (the "Distribution"). Following the Distribution, BKHI contributed the Transaction Services subsidiaries to its wholly-owned subsidiary Black Knight Financial Services II, LLC, which has been renamed ServiceLink Holdings, LLC ("ServiceLink") and contributed BKIS to its subsidiary Black Knight Financial Services I, LLC, now known as BKFS LLC. Also on January 3, 2014, BKHI contributed its subsidiary, Fidelity National Commerce Velocity, LLC ("Commerce Velocity") to BKFS LLC, which then contributed Commerce Velocity to BKIS. In addition, BKIS sold its interest in National Title Insurance of New York, Inc. ("NTNY") to CTIC (a wholly-owned subsidiary of FNF) on this date. All of these steps are referred to herein as the "Internal Reorganization." Thereafter, 35% of the membership interest of BKFS LLC was issued to certain funds affiliated with THL.
As part of the LLC Agreement, THL had an option to put its ownership interest of BKFS LLC to BKFS LLC or FNF if no public offering of the corresponding business had been consummated after four years. As a result of the IPO completed on May 26, 2015, THL no longer has the option to put its ownership interest of BKFS LLC to BKFS LLC or FNF. As the redeemable interest provided for redemption features not solely within the control of BKFS LLC or FNF, BKFS LLC classified the redeemable
60
BLACK KNIGHT FINANCIAL SERVICES, INC.
NOTES TO CONSOLIDATED FINANCIAL STATEMENTS - (Continued)
interest, through the completion of the IPO, outside of permanent equity in accordance with Financial Accounting Standards Board ("FASB") Accounting Standards Codification ("ASC") Topic 480-10, Distinguishing Liabilities from Equity.
In connection with the Acquisition and the subsequent formation of BKFS LLC, all LPS assets and liabilities contributed to BKFS LLC were set to their fair value on January 2, 2014 as part of FNF's allocation of the LPS purchase price to the identifiable assets and liabilities acquired. The purchase price was allocated to the assets acquired and liabilities assumed based on our best estimates of their fair values as of the Acquisition date. Goodwill was recorded based on the amount that the purchase price exceeded the fair value of the net assets acquired.
The opening balance sheet of LPS on January 2, 2014, as ultimately contributed to BKFS LLC on January 3, 2014, and based on the purchase price allocation of the acquired assets and liabilities by FNF, is as follows (in millions):
Cash and cash equivalents | $ | 61.4 | |
Trade receivables | 103.0 | ||
Income tax receivable | 26.9 | ||
Prepaid expenses and other assets, including indefinite-lived intangible assets | 187.7 | ||
Property and equipment | 140.4 | ||
Computer software | 490.2 | ||
Other intangible assets | 504.9 | ||
Deferred income taxes, net | 0.3 | ||
Goodwill | 2,148.5 | ||
Total assets | 3,663.3 | ||
Long-term debt | 623.3 | ||
Deferred revenues | 35.8 | ||
Legal and regulatory accrual | 14.0 | ||
Other liabilities | 197.3 | ||
Total liabilities | 870.4 | ||
Net assets | $ | 2,792.9 | |
During 2016, we identified a $3.8 million adjustment related to the opening balance sheet of LPS resulting in an increase in Trade receivables, net and a decrease in Goodwill. This adjustment is reflected in the table above, in the Consolidated Balance Sheets as of December 31, 2015 and in Note 3—Significant Accounting Policies and Note 10—Goodwill. The adjustment had no effect on opening Equity or Net earnings in any period presented.
On January 3, 2014, FNF, through BKHI, contributed Commerce Velocity to BKFS LLC at its historical basis, since the contribution was a transaction between entities under common control. BKFS LLC recognized assets of $35.9 million and liabilities of $2.1 million as a result of the contribution. In accordance with GAAP requirements for transactions between entities under common control, the Consolidated Financial Statements have been adjusted as if the contribution occurred as of the earliest period presented as the entities were under common control.
Also on January 3, 2014, BKHI sold its interest in NTNY to CTIC for $85.0 million. No gain or loss was recognized on this sale.
On June 2, 2014, as part of an internal reorganization, two wholly-owned subsidiaries of FNF contributed their respective interests in Property Insight to BKFS LLC in exchange for 6.4 million BKFS LLC Class A Units. As a result of the transaction, BKFS LLC now owns 100% of Property Insight. In accordance with GAAP requirements for transactions between entities under common control, assets and liabilities contributed in the transaction were recorded at their respective historical FNF book values on the date of contribution. Net assets recorded at the contribution date totaled $89.0 million. The Consolidated Financial Statements have been adjusted as if the contribution occurred as of the earliest period presented.
In connection with the contribution of Property Insight, the LLC Agreement was amended to increase the number of Class A Units issued from 100.0 million to 106.4 million. The amendment also provides FNF with the option, but not the obligation, to repurchase Property Insight from BKFS LLC at fair value in the event of a sale of BKFS LLC, as defined in the LLC Agreement. As a result of the additional shares issued, THL owned 32.9% of the outstanding member interests of BKFS LLC, while FNF and its subsidiaries collectively owned 67.1% of the outstanding member interests of BKFS LLC.
61
BLACK KNIGHT FINANCIAL SERVICES, INC.
NOTES TO CONSOLIDATED FINANCIAL STATEMENTS - (Continued)
(3) | Significant Accounting Policies |
The following describes our significant accounting policies that have been followed in preparing the accompanying Consolidated Financial Statements.
Principles of Consolidation
The accompanying Consolidated Financial Statements were prepared in accordance with GAAP, and all adjustments considered necessary for a fair presentation have been included. All significant intercompany accounts and transactions have been eliminated.
BKFS LLC is subject to the consolidation guidance related to variable interest entities as set forth in ASC Topic 810, Consolidation ("ASC 810"). Black Knight, as the sole managing member of BKFS LLC, has the exclusive authority to manage, control and operate the business and affairs of BKFS LLC and its subsidiaries, pursuant to the terms of the LLC Agreement. Under the terms of the LLC Agreement, Black Knight is authorized to manage the business of BKFS LLC, including the authority to enter into contracts, manage bank accounts, hire employees and agents, incur and pay debts and expenses, merge or consolidate with other entities and pay taxes. Because Black Knight is the primary beneficiary through its sole managing member interest and possessing the rights established in the LLC Agreement and in accordance with the requirements of ASC 810, Black Knight controls BKFS LLC and appropriately consolidates the operations thereof.
We account for noncontrolling interests in accordance with ASC 810. Noncontrolling interests represent BKHI and certain of its affiliates' and THL and THL Affiliates' share of net earnings or loss and of equity in BKFS LLC. Our Class A shareholders indirectly control BKFS LLC through our managing member interest. Our Class B shareholders have a noncontrolling interest in BKFS LLC. Their share of equity in BKFS LLC is reflected in Noncontrolling interests in our Consolidated Balance Sheets and their share of net earnings or loss in BKFS LLC is reported in Net earnings (loss) attributable to noncontrolling interests in our Consolidated Statements of Operations and Comprehensive Earnings (Loss). Net earnings or loss attributable to noncontrolling interests do not include expenses incurred directly by Black Knight, including income tax expense attributable to Black Knight.
All earnings prior to the closing of our IPO on May 26, 2015 have been disclosed as Net earnings (loss) attributable to noncontrolling interests.
Reclassifications
Certain reclassifications have been made in the 2015 and 2014 Consolidated Financial Statements to conform to the classifications used in 2016. These reclassifications have not changed Net earnings (loss) or Total equity, as previously reported.
Fair Value
Fair Value of Financial Assets and Liabilities
The fair values of financial assets and liabilities are determined using the following fair value hierarchy:
• | Level 1 inputs to the valuation methodology are unadjusted quoted prices for identical assets or liabilities in active markets that we have the ability to access. |
• | Level 2 inputs to the valuation methodology include: |
◦ | quoted prices for similar assets or liabilities in active markets; |
◦ | quoted prices for identical or similar assets or liabilities in inactive markets; |
◦ | inputs other than quoted prices that are observable for the asset or liability; and |
◦ | inputs that are derived principally from or corroborated by observable market data by correlation or other means. |
• | Level 3 inputs to the valuation methodology are unobservable and significant to the fair value measurement. |
Assets are classified in their entirety based on the lowest level of input that is significant to the fair value measurement. We believe our valuation methods are appropriate and consistent with other market participants. The use of different methodologies or assumptions to determine the fair value of certain financial instruments could result in a different fair value measurement at the reporting date.
Fair Value of Assets Acquired and Liabilities Assumed
The fair values of assets acquired and liabilities assumed in business combinations are estimated using various assumptions. The most significant assumptions, and those requiring the most judgment, involve the estimated fair values of intangible assets and software, with the remaining value, if any, attributable to goodwill. We utilize third-party valuation specialists to assist with determining the fair values of intangible assets and software purchased in business combinations. These estimates are based on Level 2 and Level 3 inputs.
62
BLACK KNIGHT FINANCIAL SERVICES, INC.
NOTES TO CONSOLIDATED FINANCIAL STATEMENTS - (Continued)
Management Estimates
The preparation of these financial statements in conformity with GAAP requires management to make estimates and assumptions that affect the reported amounts of assets and liabilities and disclosure of contingent assets and liabilities at the date of the financial statements and the reported amounts of revenues and expenses during the reporting periods. The accounting estimates that require our most significant, difficult and subjective judgments include the determination of elements and allocation of fair value of our revenue arrangements, the recoverability of other intangible assets and goodwill, and the assessment of loss contingencies. Actual results that we experience could differ from our estimates.
Cash and Cash Equivalents
Highly liquid instruments purchased with original maturities of three months or less are considered cash equivalents. Cash equivalents are invested with high credit quality financial institutions and consist of short-term investments, such as demand deposit accounts, money market accounts, money market funds and time deposits. The carrying amounts of these instruments reported in the Consolidated Balance Sheets approximate their fair value because of their immediate or short-term maturities.
Cash and cash equivalents include the following (in millions):
December 31, | |||||||
2016 | 2015 | ||||||
Unrestricted: | |||||||
Cash | $ | 129.8 | $ | 52.3 | |||
Cash equivalents | 1.8 | 130.1 | |||||
Total unrestricted cash and cash equivalents | 131.6 | 182.4 | |||||
Restricted cash equivalents (1) | 2.3 | 3.6 | |||||
Total cash and cash equivalents | $ | 133.9 | $ | 186.0 | |||
_______________
(1) | Restricted cash equivalents relate to our subsidiary, I-Net Reinsurance Limited, and are held in trust until the final reinsurance policy is canceled. |
Trade Receivables, Net
The carrying amounts reported in the Consolidated Balance Sheets for Trade receivables, net approximate their fair value because of their short-term nature.
A summary of Trade receivables, net of allowance for doubtful accounts, as of December 31, 2016 and 2015 is as follows (in millions):
December 31, | |||||||
2016 | 2015 | ||||||
Trade receivables — billed | $ | 115.4 | $ | 102.7 | |||
Trade receivables — unbilled | 42.6 | 38.5 | |||||
Total trade receivables | 158.0 | 141.2 | |||||
Allowance for doubtful accounts | (2.2 | ) | (2.5 | ) | |||
Total trade receivables, net | $ | 155.8 | $ | 138.7 | |||
In addition to the amounts above, we have approximately $14.8 million in unbilled receivables as of December 31, 2016 that we do not expect to collect within the next year. These unbilled receivables are classified in Other non-current assets in our Consolidated Balance Sheets and were $18.4 million as of December 31, 2015. Billings for these receivables are primarily based on contractual terms.
The allowance for doubtful accounts represents management's estimate of those balances that are uncollectible as of the balance sheet date. We determine the allowance based on known troubled accounts, historical experience and other currently available evidence. We write off trade receivables when the likelihood of collection of a trade receivable balance is considered remote.
63
BLACK KNIGHT FINANCIAL SERVICES, INC.
NOTES TO CONSOLIDATED FINANCIAL STATEMENTS - (Continued)
The rollforward of allowance for doubtful accounts for the years ended December 31, 2016, 2015 and 2014 is as follows (in millions):
Beginning balance | Bad debt expense | Write-offs, net of recoveries | Transfers and acquisitions | Ending balance | ||||||||||||||||
Year ended December 31, 2014 | $ | — | $ | (1.5 | ) | $ | 0.1 | $ | (0.2 | ) | $ | (1.6 | ) | |||||||
Year ended December 31, 2015 | (1.6 | ) | (2.1 | ) | 1.1 | 0.1 | (2.5 | ) | ||||||||||||
Year ended December 31, 2016 | (2.5 | ) | (0.6 | ) | 0.9 | — | (2.2 | ) | ||||||||||||
Prepaid Expenses and Other Current Assets
Prepaid expenses and other current assets consists of the following (in millions):
December 31, | |||||||
2016 | 2015 | ||||||
Prepaid expenses | $ | 37.2 | $ | 25.0 | |||
Other current assets | 8.2 | 3.2 | |||||
Prepaid expenses and other current assets | $ | 45.4 | $ | 28.2 | |||
Property and Equipment, Net
Property and equipment is recorded at cost, less accumulated depreciation and amortization. Depreciation and amortization are computed primarily using the straight-line method based on the following estimated useful lives of the related assets: 30 years for buildings and 3 to 7 years for furniture, fixtures and computer equipment. Leasehold improvements are amortized using the straight-line method over the lesser of the initial term of the respective lease or the estimated useful life of such asset.
Computer Software, Net
Computer software includes the fair value of software acquired in business combinations, purchased software and internally developed software. Purchased software is recorded at cost and amortized using the straight-line method over its estimated useful life, ranging from 3 to 7 years. Software acquired in business combinations is recorded at its fair value and amortized using the straight-line or accelerated methods over its estimated useful life.
Internal development costs are accounted for in accordance with ASC Topic 985, Software, Subtopic 20, Costs of Software to Be Sold, Leased, or Otherwise Marketed, or ASC Topic 350, Intangibles - Goodwill and Other, Subtopic 40, Internal-Use Software. For computer software products to be sold, leased or otherwise marketed, all costs incurred to establish the technological feasibility are research and development costs and are expensed as they are incurred. Costs incurred subsequent to establishing technological feasibility, such as programmers salaries and related payroll costs and costs of independent contractors, are capitalized and amortized on a product by product basis commencing on the date of general release to customers. We do not capitalize any costs once the product is available for general release to customers. Amortization expense is recorded using straight-line or accelerated methods over the estimated software life, which generally ranges from 5 to 10 years. We also assess the recorded value for impairment on a regular basis by comparing the carrying value to the estimated future cash flows to be generated by the underlying software asset.
For internal-use computer software products, internal and external costs incurred during the preliminary project stage are expensed as they are incurred. Internal and external costs incurred during the application development stage are capitalized and amortized on a product-by-product basis commencing on the date the software is ready for its intended use. We do not capitalize any costs once the software is ready for its intended use. Amortization expense is recorded ratably over the software's estimated useful life, generally ranging from 5 to 7 years.
Other Intangible Assets, Net
Other intangible assets, net consist primarily of customer relationships and trademarks that are recorded in connection with acquisitions at their fair value based on the results of a valuation analysis. Customer relationships are amortized over their estimated useful lives using an accelerated method that takes into consideration expected customer attrition rates over a period of up to 10 years from the acquisition date.
Our property records database, which is an intangible asset not subject to amortization, is included in Other non-current assets in our Consolidated Balance Sheets. The carrying value as of December 31, 2016 and 2015 was $59.7 million.
64
BLACK KNIGHT FINANCIAL SERVICES, INC.
NOTES TO CONSOLIDATED FINANCIAL STATEMENTS - (Continued)
Impairment Testing
Long-lived assets, including property and equipment, computer software and other intangible assets with definite useful lives are reviewed for impairment whenever events or changes in circumstances indicate that the carrying amount of an asset may not be recoverable. Recoverability of assets to be held and used is measured by comparison of the carrying amount of an asset to estimated undiscounted future cash flows expected to be generated by the asset. If the carrying amount of an asset exceeds its estimated future cash flows, an impairment charge is recognized in the amount by which the carrying amount of the asset exceeds the fair value of the asset. We did not have any events or circumstances indicating impairment of our long-lived assets for the years ended December 31, 2016, 2015 and 2014.
Goodwill
Goodwill represents the excess of cost over the fair value of identifiable assets acquired and liabilities assumed in business combinations. Goodwill is not amortized and is tested for impairment annually, or more frequently if circumstances indicate potential impairment, through a comparison of fair value to the carrying amount. In evaluating the recoverability of goodwill, we perform an annual goodwill impairment analysis based on a review of qualitative factors to determine if events and circumstances exist that could lead to a determination that the fair value of a reporting unit is greater than its carrying amount. We have three reporting units that carry goodwill as of December 31, 2016 - Servicing Technology, Origination Technology and Data and Analytics. We completed an annual goodwill impairment analysis as of September 30, 2016. We did not have any events or circumstances indicating impairment of our goodwill during the years ended December 31, 2016, 2015 and 2014.
Deferred Contract Costs
Cost of software sales, outsourced data processing and application management arrangements, including costs incurred for bid and proposal activities, are generally expensed as incurred. However, certain costs incurred upon initiation of a contract are deferred and expensed over the contract life. These costs represent incremental external costs or certain specific internal costs that are directly related to the contract acquisition or transition activities and are primarily associated with installation of systems, processes and data conversion.
In the event indications exist that a deferred contract cost balance related to a particular contract may not be recoverable, undiscounted estimated cash flows of the contract are projected over its remaining estimated term and compared to the unamortized deferred contract cost balance. If the projected cash flows are not adequate to recover the unamortized cost balance, the balance would be adjusted with a charge to earnings to equal the contract's net realizable value, including any termination fees provided for under the contract, in the period such a determination is made.
As of December 31, 2016 and 2015, we had deferred contract costs of $113.3 million and $87.0 million, respectively, included in Other non-current assets in our Consolidated Balance Sheets. Amortization expense for deferred contract costs was $25.5 million, $9.2 million and $1.0 million for the years ended December 31, 2016, 2015 and 2014, respectively, and is included in Depreciation and amortization in the accompanying Consolidated Statements of Operations and Comprehensive Earnings (Loss).
Trade Accounts Payable and Other Accrued Liabilities
The carrying amount reported in the Consolidated Balance Sheets for Trade accounts payable and other accrued liabilities approximates fair value because of their short-term nature.
Loss Contingencies
ASC Topic 450, Contingencies, requires that we accrue for loss contingencies associated with outstanding litigation, claims and assessments, as well as unasserted claims for which management has determined it is probable that a loss contingency exists and the amount of loss can be reasonably estimated.
Deferred Compensation Plan
Certain of our management level employees and directors are eligible to participate in the FNF Deferred Compensation Plan (the "Plan"). The Plan permits participants to defer receipt of part of their current compensation. Participant benefits for the Plan are provided by a funded rabbi trust.
The compensation withheld from Plan participants, together with investment income on the Plan, is recorded as a deferred compensation obligation to participants. During 2014, the LPS Deferred Compensation Plan was frozen for new contributions and eligible employees were allowed to enroll in the FNF Deferred Compensation Plan. Also during 2014, the underlying rabbi trust was merged into the FNF deferred compensation rabbi trust, and the related liability was transferred to FNF. As a result of the aforementioned activities, the liability to Plan participants as well as the assets of the funded rabbi trust are carried by FNF.
65
BLACK KNIGHT FINANCIAL SERVICES, INC.
NOTES TO CONSOLIDATED FINANCIAL STATEMENTS - (Continued)
Equity-Based Compensation
We expense employee equity-based payments under ASC Topic 718, Compensation—Stock Compensation, which requires compensation cost for the grant date fair value of equity-based payments to be recognized over the requisite service period. We estimated the grant date fair value of the equity-based awards issued in the form of profits interests using the Black-Scholes option pricing model. The fair value of our restricted stock awards is measured based on the closing market price of our stock on the grant date.
Earnings Per Share
Basic earnings per share is computed by dividing Net earnings attributable to Black Knight by the weighted average shares outstanding during the period. Diluted earnings per share is computed by dividing Net earnings attributable to Black Knight, adjusted as necessary for the affect of potentially dilutive securities, by the number of weighted-average shares outstanding during the period and the affect of securities that would have a dilutive effect on earnings per share. See Note 5—Earnings Per Share for a more detailed discussion.
Revenue Recognition
The following describes our primary types of revenues and our revenue recognition policies as they pertain to the types of contractual arrangements we enter into with our customers to provide services, software licenses and software-related services either individually or as part of an integrated offering of multiple services. These arrangements occasionally include offerings from more than one segment to the same customer. We recognize revenues relating to hosted software, licensed software, software-related services, data and analytics services and valuation-related services. In some cases, these services are offered in combination with one another, and in other cases we offer them individually. Revenues from processing services are typically volume-based depending on factors such as the number of accounts processed, transactions processed and computer resources utilized.
Revenue is realized or realizable and earned when all of the following criteria are met: (1) persuasive evidence of an arrangement exists; (2) delivery has occurred or services have been rendered; (3) the seller's price to the buyer is fixed or determinable; and (4) collectability is reasonably assured. For hosting arrangements, revenues and costs related to implementation, conversion and programming services are deferred and subsequently recognized using the straight-line method over the term of the related services agreement. We evaluate these deferred contract costs for recoverability in the event any indications exist that deferred contract costs may not be recoverable.
In the event that our arrangements with our customers include more than one element, we determine whether the individual revenue elements can be recognized separately. In arrangements with multiple deliverables, the delivered items are considered separate units of accounting if (1) they have value on a standalone basis and (2) performance of the undelivered items is considered probable and within our control. Arrangement consideration is then allocated to the separate units of accounting based on relative selling price. If it exists, vendor-specific objective evidence ("VSOE") of fair value is used to determine relative selling price, otherwise third-party evidence of selling price is used. If neither exists, the best estimate of selling price is used for the deliverable.
For multiple element software arrangements, we determine the appropriate units of accounting and how the arrangement consideration should be measured and allocated to the separate units. Initial license fees are recognized when a contract exists, the fee is fixed or determinable, software delivery has occurred and collection of the receivable is deemed probable, provided that VSOE of fair value has been established for each element or for any undelivered elements. We determine the fair value of each element or the undelivered elements in multiple element software arrangements based on VSOE of fair value. VSOE of fair value for each element is based on the price charged when the same element is sold separately, or in the case of post-contract customer support, when a stated renewal rate is provided to the customer. If evidence of fair value of all undelivered elements exists but evidence does not exist for one or more delivered elements, then revenue is recognized using the residual method. Under the residual method, the fair value of the undelivered elements is deferred, and the remaining portion of the arrangement fee is recognized as revenue. If evidence of fair value does not exist for one or more undelivered elements of a contract, then all revenue is deferred until all elements are delivered or fair value is determined for all remaining undelivered elements. Revenue from post-contract customer support is recognized ratably over the term of the agreement. We record deferred revenue for all billings invoiced prior to revenue recognition.
Operating Expenses
Operating expenses include all costs, excluding depreciation and amortization, incurred by us to produce revenues. Operating expenses include personnel expense, employee benefits, occupancy costs, data processing costs, program design and development costs and professional services.
General and administrative expenses, which are primarily included in our corporate segment within Operating expenses, include personnel expense, employee benefits, occupancy and other costs associated with personnel employed in marketing, human
66
BLACK KNIGHT FINANCIAL SERVICES, INC.
NOTES TO CONSOLIDATED FINANCIAL STATEMENTS - (Continued)
resources, legal, enterprise risk, finance and other support functions. General and administrative expenses also include certain professional and legal fees and costs of advertising and other marketing-related programs.
Depreciation and Amortization
Depreciation and amortization includes depreciation of property and equipment and amortization of computer software, deferred contract costs and other intangible assets. Depreciation and amortization on the Consolidated Statements of Operations and Comprehensive Earnings (Loss) include the following (in millions):
Year ended December 31, | |||||||||||
2016 | 2015 | 2014 | |||||||||
Property and equipment | $ | 28.4 | $ | 28.4 | $ | 29.6 | |||||
Computer software | 78.0 | 70.3 | 65.2 | ||||||||
Other intangible assets | 76.4 | 86.4 | 93.0 | ||||||||
Deferred contract costs | 25.5 | 9.2 | 1.0 | ||||||||
Total | $ | 208.3 | $ | 194.3 | $ | 188.8 | |||||
Transition and Integration Costs
Transition and integration costs primarily contain incremental costs associated with acquisitions for the year ended December 31, 2016. In prior periods, transition and integration costs contain incremental costs associated with executing the Acquisition and completing the Internal Reorganization and the Offering Reorganization as described above, as well as the related transitioning costs including employee severance, synergy program bonuses and certain other non-recurring professional and other costs, including costs related to the IPO, as well as member management fees, of which substantially all were incurred prior to the completion of the IPO on May 26, 2015.
Interest Expense
Interest expense consists primarily of interest on our borrowings, a guarantee fee that we pay FNF for their ongoing guarantee of the Senior Notes, amortization of our debt issuance costs, bond premium and original issue discount, payments on our interest rate swaps and commitment fees on our revolving credit facility.
Income Taxes
We are required to determine income taxes in each of the jurisdictions in which we operate as a part of the process of preparing the Consolidated Financial Statements. This process involves calculating actual current tax expense together with assessing basis differences resulting from differing recognition of items for income tax and accounting purposes. These differences result in deferred income tax assets and liabilities, which are included within the Consolidated Balance Sheets. We must then assess the likelihood that deferred income tax assets will be recovered from future taxable earnings and, to the extent we believe that recovery is not likely, establish a valuation allowance. We believe that based on its historical pattern of taxable earnings, projections of future earnings, tax planning strategies and other relevant evidence, we will produce sufficient earnings in the future to realize recorded deferred income tax assets. To the extent we establish a valuation allowance or increase this allowance in a period, we must reflect this increase as expense within Income tax expense in the Consolidated Statements of Operations and Comprehensive Earnings (Loss). Determination of income tax expense requires estimates and can involve complex issues that may require an extended period to resolve. Further, the estimated level of annual earnings before income tax can cause the overall effective income tax rate to vary from period to period. We believe our tax positions comply with applicable tax law, and we adequately provide for any known tax contingencies. Final determination of prior-year tax liabilities, either by settlement with tax authorities or expiration of statutes of limitations, could be materially different than estimates reflected in assets and liabilities and historical income tax expense. The outcome of these final determinations could have a material effect on our income tax expense, net earnings or cash flows in the period that determination is made.
For the period through May 25, 2015, the day prior to the IPO, BKFS LLC was treated as a partnership under applicable federal and state income tax laws in connection with the Acquisition and Internal Reorganization. Corporate subsidiaries are subject to applicable U.S. federal, foreign and state taxation. Deferred tax assets and liabilities were recognized for temporary differences between the financial reporting basis and the tax basis of the corporate subsidiaries' assets and liabilities and expected benefits of utilizing net operating loss carryforwards.
Deferred tax assets and liabilities are measured using enacted tax rates expected to apply to taxable earnings in the years in which those temporary differences are expected to be recovered or settled. The effect on deferred taxes of changes in tax rates and laws in future periods, if any, is reflected in the Consolidated Financial Statements in the period enacted.
67
BLACK KNIGHT FINANCIAL SERVICES, INC.
NOTES TO CONSOLIDATED FINANCIAL STATEMENTS - (Continued)
Recent Accounting Pronouncements
Revenue Recognition (ASC Topic 606, Revenue from Contracts with Customers ("ASC 606"))
In May 2016, the FASB issued Accounting Standards Update ("ASU") 2016-12, Revenue from Contracts with Customers (Topic 606): Narrow-Scope Improvements and Practical Expedients. The amendments in this ASU do not change the core principle of the guidance in ASC 606. Rather, the amendments in this update simplify the transition and clarify certain aspects of the revenue standard.
Also in May 2016, the FASB issued ASU 2016-11, Revenue Recognition (Topic 605) and Derivatives and Hedging (Topic 815): Rescission of SEC Guidance Because of Accounting Standards Updates 2014-09 and 2014-16 Pursuant to Staff Announcements at the March 3, 2016 EITF Meeting. The SEC Staff is rescinding certain SEC Staff Observer comments that are codified in ASC Topic 605, Revenue Recognition, and ASC Topic 932, Extractive Activities-Oil and Gas, effective upon adoption of ASC 606. Specifically, registrants should not rely on the SEC Staff Observer comments upon adoption of ASC 606 related to revenue and expense recognition for freight services in process, accounting for shipping and handling fees and costs, accounting for consideration given by a vendor to a customer and accounting for gas-balancing arrangements.
In April 2016, the FASB issued ASU 2016-10, Revenue from Contracts with Customers (Topic 606): Identifying Performance Obligations and Licensing. This guidance clarifies how to determine whether goods and services are separately identifiable and thus accounted for as separate performance obligations. Additionally, this update clarifies how to evaluate the nature of a promise in granting a license of intellectual property, which determines whether to recognize revenue over time or at a point in time.
In March 2016, the FASB issued ASU 2016-08, Revenue from Contracts with Customers (Topic 606): Principal versus Agent Considerations (Reporting Revenue Gross versus Net). This new standard requires a company to determine whether it is a principal (that controls the promised good or service before transferring it to the customer) or an agent (that arranges for another entity to provide the goods or services). Principals are required to recognize revenue equal to the gross amount of consideration exchanged for the promised good or service. Agents are required to recognize revenue net of any fees or commissions paid for arranging the promised good or service to be provided by another party.
In May 2014, the FASB issued ASU 2014-09, Revenue from Contracts with Customers ("ASU 2014-09"). This ASU supersedes the revenue recognition requirements in ASC 605. The guidance requires a five-step analysis of transactions to determine when and how revenue is recognized based upon the core principle that revenue is recognized to depict the transfer of goods or services to customers in an amount that reflects the consideration to which the entity expects to be entitled in exchange for those goods or services. The amendment also requires additional disclosures regarding the nature, amount, timing and uncertainty of revenues and cash flows arising from contracts with customers. This ASU is effective for fiscal years, and interim periods within those fiscal years, beginning after December 15, 2017, with early adoption permitted. The standard allows companies to use either a full retrospective or a modified retrospective approach to adopt this ASU.
The ASUs listed above are related to ASC 606 and are effective on adoption of ASU 2014-09, which we plan to adopt on January 1, 2018. In preparation for adoption of ASC 606, we have formed a project team and engaged a third-party professional services firm to assist us with our evaluation. We have completed the assessment phase and are working through the next phases of the adoption project. We are continuing to evaluate which transition approach to use and assessing the effect the adoption of ASC 606 will have on our results of operations, financial position and related disclosures. It is too early to make a final determination of transition method and effect of adoption given the many facets of this adoption that need to be considered.
Other Accounting Pronouncements
In August 2016, the FASB issued ASU 2016-15, Statement of Cash Flows (Topic 230): Classification of Certain Cash Receipts and Cash Payments. The amendments in this ASU introduce clarifications to the presentation of certain cash receipts and cash payments in the statement of cash flows. The primary updates include additions and clarifications of the classification of cash flows related to certain debt repayment activities, contingent consideration payments related to business combinations, proceeds from insurance policies, distributions from equity method investees and cash flows related to securitized receivables. This update is effective for annual periods beginning after December 15, 2017, including interim periods within those fiscal years. Early adoption is permitted, including in interim periods. This ASU requires retrospective application to all prior periods presented upon adoption. We do not expect this update to have a material effect on our statement of cash flows.
In June 2016, the FASB issued ASU 2016-13, Financial Instruments—Credit Losses. This guidance significantly changes how companies measure and recognize credit impairment for many financial assets. The new Current Expected Credit Loss Model will require companies to immediately recognize an estimate of credit losses expected to occur over the remaining life of the financial assets included in the scope of this standard, which include trade receivables. This standard is effective for fiscal years, and interim periods within those fiscal years, beginning after December 15, 2019. Early adoption is permitted for annual and
68
BLACK KNIGHT FINANCIAL SERVICES, INC.
NOTES TO CONSOLIDATED FINANCIAL STATEMENTS - (Continued)
interim periods in fiscal years beginning after December 15, 2018. We do not expect this update to have a material effect on our results of operations or our financial position.
In March 2016, the FASB issued ASU 2016-09, Compensation-Stock Compensation (Topic 718): Improvements to Employee Share-Based Payment Accounting. Under the new guidance, companies will no longer record excess tax benefits and certain tax deficiencies related to share-based awards in additional paid-in capital. Instead, income tax effects of awards will be recorded in the income statement when the awards vest or are settled. It also will allow an employer to repurchase more of an employee's shares than it can today for tax withholding purposes without triggering liability accounting and to make a policy election to account for forfeitures as they occur. Amendments requiring recognition of excess tax benefits and tax deficiencies in the income statements should be applied prospectively. Amendments related to minimum statutory withholding requirements and forfeitures should be applied using a modified retrospective transition method by means of a cumulative-effect adjustment to equity as of the beginning of the period in which the guidance is adopted. The guidance is effective for public companies for fiscal years beginning after December 15, 2016, and interim periods within those fiscal years. Early adoption is permitted, but all of the guidance must be adopted in the same period. This update will not have a material effect on our results of operations or our financial position.
In February 2016, the FASB issued ASU 2016-02, Leases (Topic 842). Under this ASU, lessees will be required to recognize the following for all leases (with the exception of leases with a term of 12 months or less) at the commencement date: (1) a lease liability, which is a lessee's obligation to make lease payments arising from a lease, measured on a discounted basis; and (2) a right-of-use asset, which is an asset that represents the lessee's right to use, or control the use of, a specified asset for the lease term. Under this ASU, lessor accounting remains largely unchanged. The ASU requires a modified retrospective transition approach for leases existing at, or entered into after, the beginning of the earliest comparative period presented in the financial statements. The modified retrospective approach would not require any transition accounting for leases that expire before the earliest comparative period presented. A full retrospective transition approach is not permitted. The amendments in this ASU are effective for fiscal years, and interim periods within those years, beginning after December 15, 2018. Early application is permitted. We are continuing to assess the effect the adoption of this ASU will have on our results of operations or our financial position.
(4) | Business Acquisitions |
We include the results of operations of acquired businesses beginning on the respective acquisition dates. The purchase price is allocated to the tangible and intangible assets acquired and the liabilities assumed based on their estimated fair values, with the excess recorded as goodwill. Measurement period adjustments to provisional purchase price allocations are recognized in the period in which they are determined, with the effect on earnings of changes in depreciation, amortization or other income resulting from such changes calculated as if the accounting had been completed on the acquisition date. Acquisition-related costs are expensed as incurred.
During the year ended December 31, 2016, Black Knight completed the acquisitions of eLynx Holdings, Inc. ("eLynx") and Motivity Solutions, Inc. ("Motivity"). Neither acquisition meets the definition of "significant" pursuant to Article 3 of Regulation S-X (§210.3-05) either individually or in the aggregate. Further, the individual and aggregate results of operations are not material to Black Knight's financial statements. Further details on each acquisition are discussed below.
Allocation of Purchase Price
The purchase price for each of the acquisitions was allocated to the assets acquired and liabilities assumed based on their estimated fair value at the acquisition date. The fair value of the acquired Computer software and Other intangible assets for both transactions was determined using a third-party valuation based on significant estimates and assumptions, including Level 3 inputs, which are judgmental in nature. These estimates and assumptions include the projected timing and amount of future cash flows, discount rates reflecting the risk inherent in the future cash flows and future market prices. These estimates for the eLynx acquisition are preliminary and subject to adjustments as we complete our valuation process with respect to Computer software, Other intangible assets and Goodwill. These estimates for the Motivity acquisition were finalized in the fourth quarter of 2016.
eLynx
On May 16, 2016, Black Knight completed its acquisition of eLynx, a leading lending document and data delivery platform now known as eLending. eLending helps clients in the financial services and real estate industries electronically capture and manage documents and associated data throughout the document lifecycle. Black Knight purchased eLynx to augment its origination technologies. This acquisition positions Black Knight to electronically support the full mortgage origination process.
69
BLACK KNIGHT FINANCIAL SERVICES, INC.
NOTES TO CONSOLIDATED FINANCIAL STATEMENTS - (Continued)
Total consideration paid, net of cash received, was $115.0 million for 100% of the equity interests of eLynx. Additionally, Black Knight incurred direct transaction costs of $1.2 million for the year ended December 31, 2016 that are included in Transition and integration costs on the Consolidated Statements of Operations and Comprehensive Earnings (Loss). The total consideration paid was as follows (in millions):
Cash paid from cash on hand | $ | 95.6 | |
Cash paid from Revolving Credit Facility (Note 11) | 25.0 | ||
Less: cash acquired | (5.6 | ) | |
Total consideration paid, net | $ | 115.0 | |
The following table summarizes the total purchase price consideration and the preliminary fair value amounts recognized for the assets acquired and liabilities assumed as of the acquisition date (in millions):
Total purchase price consideration | $ | 115.0 | |
Trade receivables | $ | 3.8 | |
Prepaid expenses and other current assets | 3.9 | ||
Property and equipment | 1.1 | ||
Computer software | 14.0 | ||
Other intangible assets (Note 9) | 35.2 | ||
Goodwill (Note 10) | 64.0 | ||
Total assets acquired | 122.0 | ||
Trade accounts payable and other accrued liabilities | 4.5 | ||
Accrued compensation and benefits | 1.1 | ||
Deferred revenues | 1.4 | ||
Total liabilities assumed | 7.0 | ||
Net assets acquired | $ | 115.0 | |
Motivity
On June 22, 2016, Black Knight completed its acquisition of Motivity, which provides customized mortgage business intelligence software solutions. Motivity will be integrated with Black Knight's LoanSphere product suite, including the LoanSphere Data Hub, to provide clients with deeper insights into their origination and servicing operations and portfolios.
Total consideration paid, net of cash received, was $35.2 million for 100% of the equity interests of Motivity. Additionally, Black Knight incurred direct transaction costs of $0.4 million for the year ended December 31, 2016 that are included in Transition and integration costs on the Consolidated Statements of Operations and Comprehensive Earnings (Loss). The total consideration paid was as follows (in millions):
Cash paid from Revolving Credit Facility (Note 11) | $ | 30.0 | |
Cash paid from cash on hand | 6.0 | ||
Less: cash acquired | (0.8 | ) | |
Total consideration paid, net | $ | 35.2 | |
70
BLACK KNIGHT FINANCIAL SERVICES, INC.
NOTES TO CONSOLIDATED FINANCIAL STATEMENTS - (Continued)
The following table summarizes the total purchase price consideration and the fair value amounts recognized for the assets acquired and liabilities assumed as of the acquisition date (in millions):
Total purchase price consideration | $ | 35.2 | |
Trade receivables | $ | 0.4 | |
Prepaid expenses and other current assets | 0.7 | ||
Property and equipment | 0.1 | ||
Computer software | 5.7 | ||
Other intangible assets (Note 9) | 10.5 | ||
Goodwill (Note 10) | 19.7 | ||
Total assets acquired | 37.1 | ||
Trade accounts payable and other accrued liabilities | 1.4 | ||
Deferred revenues | 0.5 | ||
Total liabilities assumed | 1.9 | ||
Net assets acquired | $ | 35.2 | |
Estimated Useful Lives of Property and Equipment, Computer Software and Other Intangible Assets Acquired
As of the respective acquisition dates, the gross carrying value and weighted average estimated useful lives of Property and equipment, Computer software and Other intangible assets acquired in the above acquisitions consisted of the following (dollars in millions):
Gross carrying value | Weighted average estimated life (in years) | ||||||||||||
eLynx | Motivity | Total | |||||||||||
Computer software | $ | 14.0 | $ | 5.7 | $ | 19.7 | 5 | ||||||
Property and equipment | 1.1 | 0.1 | 1.2 | 3 | |||||||||
Other intangible assets: | |||||||||||||
Customer relationships | 34.6 | 8.4 | 43.0 | 10 | |||||||||
Trade names | 0.4 | 1.7 | 2.1 | 8 | |||||||||
Non-compete agreements | 0.2 | 0.4 | 0.6 | 4 | |||||||||
Total Other intangible assets (Note 9) | 35.2 | 10.5 | 45.7 | ||||||||||
Total gross carrying value | $ | 50.3 | $ | 16.3 | $ | 66.6 | |||||||
(5) | Earnings Per Share |
Basic earnings per share is computed by dividing Net earnings attributable to Black Knight by the weighted-average number of shares of Class A common stock outstanding during the period.
For the periods presented, potentially dilutive securities include unvested restricted stock awards and the shares of Class B common stock that are convertible on a one-for-one basis into shares of our Class A common stock. However, the 84.8 million shares of Class B common stock have been excluded in computing diluted net earnings per share because including them on an "if-converted" basis would have an antidilutive effect. Diluted net earnings per share is calculated by dividing Net earnings attributable to Black Knight by the weighted-average diluted number of shares of Class A common stock outstanding. The denominator includes the dilutive effect of approximately 2.0 million and 3.5 million shares of unvested restricted shares of Class A common stock for the year ended December 31, 2016 and the period from May 26, 2015 through December 31, 2015, respectively.
The shares of Class B common stock do not share in the earnings or losses of Black Knight and are, therefore, not participating securities. Accordingly, basic and diluted net earnings per share of Class B common stock have not been presented.
71
BLACK KNIGHT FINANCIAL SERVICES, INC.
NOTES TO CONSOLIDATED FINANCIAL STATEMENTS - (Continued)
The following table sets forth the computation of basic and diluted earnings per share (in millions, except per share amounts):
Year ended December 31, 2016 | May 26, 2015 through December 31, 2015 | ||||||
Basic: | |||||||
Net earnings attributable to Black Knight | $ | 45.8 | $ | 20.0 | |||
Shares used for basic net earnings per share: | |||||||
Weighted average shares of Class A common stock outstanding | 65.9 | 64.4 | |||||
Basic net earnings per share | $ | 0.69 | $ | 0.31 | |||
Diluted: | |||||||
Net earnings attributable to Black Knight | $ | 45.8 | $ | 20.0 | |||
Shares used for diluted net earnings per share: | |||||||
Weighted average shares of Class A common stock outstanding | 65.9 | 64.4 | |||||
Dilutive effect of unvested restricted shares of Class A common stock | 2.0 | 3.5 | |||||
Weighted average shares of Class A common stock, diluted | 67.9 | 67.9 | |||||
Diluted net earnings per share | $ | 0.67 | $ | 0.29 | |||
Basic and diluted net earnings per share information is not applicable for reporting periods prior to the completion of the IPO.
(6) | Related Party Transactions |
We are party to certain related party agreements, including those with FNF and THL. These parties became related parties of BKFS LLC on January 2, 2014 as a result of the Acquisition and Internal Reorganization and remain related parties after the completion of the Offering Reorganization. The following table sets forth the ownership interests of FNF, THL and other holders of Black Knight common stock (shares in millions):
December 31, 2016 | December 31, 2015 | ||||||||||
Shares | Ownership percentage | Shares | Ownership percentage | ||||||||
Class A common stock: | |||||||||||
THL and its affiliates | 39.3 | 25.5 | % | 39.3 | 25.7 | % | |||||
Restricted shares | 2.9 | 1.9 | % | 3.9 | 2.5 | % | |||||
Other, including those publicly traded | 26.9 | 17.5 | % | 25.1 | 16.4 | % | |||||
Total shares of Class A common stock | 69.1 | 44.9 | % | 68.3 | 44.6 | % | |||||
Class B common stock: | |||||||||||
FNF | 83.3 | 54.1 | % | 83.3 | 54.4 | % | |||||
THL and its affiliates | 1.5 | 1.0 | % | 1.5 | 1.0 | % | |||||
Total shares of Class B common stock | 84.8 | 55.1 | % | 84.8 | 55.4 | % | |||||
Total common stock outstanding | 153.9 | 100.0 | % | 153.1 | 100.0 | % | |||||
Transactions with FNF and THL are described below.
FNF
We have various agreements with FNF and certain FNF subsidiaries to provide technology, data and analytics services, as well as corporate shared services and information technology. In addition, FNF provided certain corporate services to us, including management consulting and corporate administrative services. Following the IPO, we no longer pay management fees to FNF. We are also a party to certain other agreements under which we incur other expenses or receive revenues from FNF.
72
BLACK KNIGHT FINANCIAL SERVICES, INC.
NOTES TO CONSOLIDATED FINANCIAL STATEMENTS - (Continued)
A detail of the revenues and expenses, net from FNF is set forth in the table below (in millions):
Year ended December 31, | |||||||||||
2016 | 2015 | 2014 | |||||||||
Revenues | $ | 73.5 | $ | 68.5 | $ | 71.8 | |||||
Operating expenses | 15.6 | 8.0 | (3.3 | ) | |||||||
Management fees (1) | — | 2.3 | 5.8 | ||||||||
Interest expense (2) | 3.9 | 39.5 | 97.5 | ||||||||
_______________
(1) | Amounts are included in Transition and integration costs on the Consolidated Statements of Operations and Comprehensive Earnings (Loss). |
(2) | Amounts include guarantee fee (see below). |
We were party to intercompany notes with FNF through May 27, 2015 and recognized $37.2 million and $97.5 million in Interest expense related to the intercompany notes for the years ended December 31, 2015 and 2014. We had no outstanding intercompany notes as of December 31, 2016 and 2015.
Beginning on May 26, 2015, we pay FNF a guarantee fee of 1.0% of the outstanding principal of the Senior Notes (as defined in Note 11—Long Term Debt) in exchange for the ongoing guarantee by FNF of the Senior Notes. In October 2017, the guarantee fee increases to 2.0% of the outstanding principal of the Senior Notes. During the years ended December 31, 2016 and 2015, we recognized $3.9 million and $2.3 million, respectively, in Interest expense related to the guarantee fee.
FNF subsidiaries held $49.3 million and $49.8 million as of December 31, 2016 and 2015, respectively, of principal amount of our Term B Loan (as defined in Note 11—Long Term Debt) from our credit agreement dated May 27, 2015.
THL
Two managing directors of THL currently serve on our Board of Directors. We purchase software and systems services from certain entities over which THL exercises control. In addition, THL provided certain corporate services to us, including management and consulting services. Following the IPO, we no longer pay management fees to THL.
A detail of the expenses, net from THL is set forth in the table below (in millions):
Year ended December 31, | |||||||||||
2016 | 2015 | 2014 | |||||||||
Operating expenses | $ | 1.3 | $ | 1.6 | $ | 1.6 | |||||
Management fees (1) | — | 1.3 | 3.2 | ||||||||
Software and software-related purchases | 1.1 | 1.4 | 2.2 | ||||||||
_______________
(1) | Amounts are included in Transition and integration costs on the Consolidated Statements of Operations and Comprehensive Earnings (Loss). |
In connection with the IPO, we made a $17.3 million cash payment to certain THL Affiliates during the year ended December 31, 2015, in connection with the merger of certain THL intermediaries with and into us.
THL Affiliates held $39.4 million and $39.8 million as of December 31, 2016 and 2015, respectively, of principal amount of our Term B Loan (as defined in Note 11—Long Term Debt) from our credit agreement dated May 27, 2015.
Revenues and Expenses
A detail of related party items included in Revenues is as follows (in millions):
Year ended December 31, | |||||||||||
2016 | 2015 | 2014 | |||||||||
Data and analytics services | $ | 47.2 | $ | 48.1 | $ | 55.4 | |||||
Servicing, origination and default technology services | 26.3 | 20.4 | 16.4 | ||||||||
Total related party revenues | $ | 73.5 | $ | 68.5 | $ | 71.8 | |||||
73
BLACK KNIGHT FINANCIAL SERVICES, INC.
NOTES TO CONSOLIDATED FINANCIAL STATEMENTS - (Continued)
A detail of related party items included in Operating expenses (net of expense reimbursements) is as follows (in millions):
Year ended December 31, | |||||||||||
2016 | 2015 | 2014 | |||||||||
Data entry, indexing services and other operating expenses | $ | 9.6 | $ | 8.7 | $ | 11.8 | |||||
Corporate services | 10.4 | 8.8 | 12.4 | ||||||||
Technology and corporate services | (3.1 | ) | (7.9 | ) | (25.9 | ) | |||||
Total related party expenses, net | $ | 16.9 | $ | 9.6 | $ | (1.7 | ) | ||||
Additionally, related party prepaid fees were $0.1 million and $0.2 million as of December 31, 2016 and 2015, respectively, which are included in Prepaid expenses and other current assets on the Consolidated Balance Sheets.
We believe the amounts earned from or charged by us under each of the foregoing arrangements are fair and reasonable. We believe our service arrangements are priced within the range of prices we offer to third parties, except for certain corporate services provided to an FNF subsidiary and certain corporate services provided by FNF, which are at cost. However, the amounts we earned or that were charged under these arrangements were not negotiated at arm's length and may not represent the terms that we might have obtained from an unrelated third party.
(7) Property and Equipment
Property and equipment, net consists of the following (in millions):
December 31, | |||||||
2016 | 2015 | ||||||
Land | $ | 11.9 | $ | 11.9 | |||
Buildings and improvements | 64.1 | 62.3 | |||||
Leasehold improvements | 4.8 | 4.7 | |||||
Computer equipment | 172.5 | 128.8 | |||||
Furniture, fixtures and other equipment | 9.2 | 6.1 | |||||
Property and equipment | 262.5 | 213.8 | |||||
Accumulated depreciation and amortization | (89.5 | ) | (61.8 | ) | |||
Property and equipment, net | $ | 173.0 | $ | 152.0 | |||
Depreciation and amortization expense on property and equipment related to continuing operations amounted to $28.4 million, $28.4 million and $29.6 million for the years ended December 31, 2016, 2015 and 2014, respectively.
(8) Computer Software
Computer software, net consists of the following (in millions):
December 31, | |||||||
2016 | 2015 | ||||||
Internally developed software | $ | 634.9 | $ | 578.1 | |||
Purchased software | 42.4 | 37.8 | |||||
Computer software | 677.3 | 615.9 | |||||
Accumulated amortization | (227.3 | ) | (149.4 | ) | |||
Computer software, net | $ | 450.0 | $ | 466.5 | |||
Amortization expense on computer software related to continuing operations amounted to $78.0 million, $70.3 million and $65.2 million for the years ended December 31, 2016, 2015 and 2014, respectively. Internally developed software and purchased software are inclusive of amounts acquired through acquisitions.
74
BLACK KNIGHT FINANCIAL SERVICES, INC.
NOTES TO CONSOLIDATED FINANCIAL STATEMENTS - (Continued)
Estimated amortization expense on Computer software for the next five fiscal years is as follows (in millions):
2017 (1) | $ | 83.7 | |
2018 | 85.0 | ||
2019 | 74.7 | ||
2020 | 66.8 | ||
2021 | 52.7 | ||
_______________________________________________________
(1) | Assumes assets not in service as of December 31, 2016 are placed in service equally throughout the year. |
(9) Other Intangible Assets
Other intangible assets, net consists of the following (in millions):
December 31, 2016 | December 31, 2015 | |||||||||||||||||||||||
Gross carrying amount | Accumulated amortization | Net carrying amount | Gross carrying amount | Accumulated amortization | Net carrying amount | |||||||||||||||||||
Customer relationships | $ | 557.8 | $ | (260.7 | ) | $ | 297.1 | $ | 514.8 | $ | (186.3 | ) | $ | 328.5 | ||||||||||
Other | 12.5 | (10.1 | ) | 2.4 | 9.8 | (8.1 | ) | 1.7 | ||||||||||||||||
Total intangible assets | $ | 570.3 | $ | (270.8 | ) | $ | 299.5 | $ | 524.6 | $ | (194.4 | ) | $ | 330.2 | ||||||||||
Intangible assets, other than those with indefinite lives, are amortized over their estimated useful lives ranging from 2 to 10 years from the acquisition date using straight-line and accelerated methods. Amortization expense on intangible assets with definite lives related to continuing operations is included in Depreciation and amortization in the accompanying Consolidated Statements of Operations and Comprehensive Earnings (Loss) and amounted to $76.4 million, $86.4 million and $93.0 million for the years ended December 31, 2016, 2015 and 2014, respectively.
Estimated amortization expense on existing intangible assets for the next five fiscal years is as follows (in millions):
2017 | $ | 67.8 | |
2018 | 56.5 | ||
2019 | 55.8 | ||
2020 | 45.0 | ||
2021 | 34.2 | ||
(10) Goodwill
Goodwill consists of the following (in millions):
Technology | Data and Analytics | Corporate and Other | Total | ||||||||||||
Balance, December 31, 2014 | $ | 2,048.0 | $ | 172.1 | $ | — | $ | 2,220.1 | |||||||
Activity | — | — | — | — | |||||||||||
Balance, December 31, 2015 | 2,048.0 | 172.1 | — | 2,220.1 | |||||||||||
Increases to goodwill related to: | |||||||||||||||
eLynx acquisition (Note 4) | 64.0 | — | — | 64.0 | |||||||||||
Motivity acquisition (Note 4) | — | 19.7 | — | 19.7 | |||||||||||
Balance, December 31, 2016 | $ | 2,112.0 | $ | 191.8 | $ | — | $ | 2,303.8 | |||||||
Goodwill related to the eLynx and Motivity acquisitions is deductible for tax purposes.
75
BLACK KNIGHT FINANCIAL SERVICES, INC.
NOTES TO CONSOLIDATED FINANCIAL STATEMENTS - (Continued)
(11) Long-Term Debt
Long-term debt consists of the following (in millions):
December 31, 2016 | December 31, 2015 | ||||||||||||||||||||||||||||||
Principal | Debt issuance costs | Premium (discount) | Total | Principal | Debt issuance costs | Premium (discount) | Total | ||||||||||||||||||||||||
Term A Loan | $ | 740.0 | $ | (7.0 | ) | $ | — | $ | 733.0 | $ | 780.0 | $ | (9.4 | ) | $ | — | $ | 770.6 | |||||||||||||
Term B Loan | 394.0 | (3.4 | ) | (0.8 | ) | 389.8 | 398.0 | (3.9 | ) | (0.9 | ) | 393.2 | |||||||||||||||||||
Revolving Credit Facility | 50.0 | (3.7 | ) | — | 46.3 | 100.0 | (4.8 | ) | — | 95.2 | |||||||||||||||||||||
Senior Notes, issued at par | 390.0 | — | 11.1 | 401.1 | 390.0 | — | 12.5 | 402.5 | |||||||||||||||||||||||
Total long-term debt | 1,574.0 | (14.1 | ) | 10.3 | 1,570.2 | 1,668.0 | (18.1 | ) | 11.6 | 1,661.5 | |||||||||||||||||||||
Less: Current portion of long-term debt | 64.0 | (0.6 | ) | — | 63.4 | 44.0 | (0.5 | ) | — | 43.5 | |||||||||||||||||||||
Long-term debt, net of current portion | $ | 1,510.0 | $ | (13.5 | ) | $ | 10.3 | $ | 1,506.8 | $ | 1,624.0 | $ | (17.6 | ) | $ | 11.6 | $ | 1,618.0 | |||||||||||||
Credit Agreement
On May 27, 2015, our indirect subsidiary, BKIS, entered into a credit and guaranty agreement (the "Credit Agreement"), dated as of May 27, 2015, with JPMorgan Chase Bank, N.A., as administrative agent, the guarantors party thereto and the other agents and lenders party thereto. The Credit Agreement provides for (i) an $800.0 million term loan A facility (the "Term A Loan"), (ii) a $400.0 million term loan B facility (the "Term B Loan") and (iii) a $400.0 million revolving credit facility (the "Revolving Credit Facility," and collectively with the Term A Loan and Term B Loan, the "Facilities"). The Term A Loan and the Revolving Credit Facility mature on May 27, 2020, and the Term B Loan matures on May 27, 2022. The Facilities are guaranteed by substantially all of BKIS's wholly-owned domestic restricted subsidiaries and BKFS LLC, and are secured by associated collateral agreements that pledge a lien on virtually all of BKIS's assets, including fixed assets and intangible assets, and assets of the guarantors.
The Term A Loan is subject to amortization of principal, payable in quarterly installments on the last day of each fiscal quarter, which commenced on September 30, 2015, equal to the percentage set forth below of the initial aggregate principal amount of the Term A Loan for such fiscal quarter:
Payment Dates | Percentage | |
September 30, 2015 through and including June 30, 2017 | 1.25% | |
Commencing on September 30, 2017 through and including June 30, 2019 | 2.50% | |
Commencing on September 30, 2019 through and including March 31, 2020 | 3.75% | |
The remaining principal balance of the Term A Loan is due upon maturity.
The Term B Loan is subject to amortization of principal, payable in equal quarterly installments on the last day of each fiscal quarter, which commenced on September 30, 2015, with 1.0% of the initial aggregate advances thereunder to be payable each year prior to the maturity date of the Term B Loan, and the remaining initial aggregate advances thereunder to be payable at the Term B Loan maturity date.
The Term A Loan and the Revolving Credit Facility bear interest at rates based upon, at the option of BKIS, either (i) the base rate plus a margin of between 50 and 125 basis points depending on the total leverage ratio of BKIS and its restricted subsidiaries on a consolidated basis (the "Consolidated Leverage Ratio") or (ii) the Eurodollar rate plus a margin of between 150 and 225 basis points depending on the Consolidated Leverage Ratio. As of December 31, 2016, the Term A Loan and the Revolving Credit Facility bear interest at the Eurodollar rate plus a margin of 200 basis points. The Term B Loan bears interest at rates based upon, at the option of BKIS, either (i) the base rate plus a margin of 175 or 200 basis points depending on the Consolidated Leverage Ratio or (ii) the Eurodollar rate plus a margin of 275 or 300 basis points depending on the Consolidated Leverage Ratio; subject to a Eurodollar rate floor of 75 basis points. As of December 31, 2016, the Term B Loan bears interest at the Eurodollar rate plus a margin of 300 basis points, subject to a Eurodollar rate floor of 75 basis points. In addition, BKIS will pay an unused commitment fee of between 25 and 35 basis points on the undrawn commitments under the Revolving Credit Facility, also depending on the Consolidated Leverage Ratio. As of December 31, 2016, we have $350.0 million capacity on the Revolving Credit Facility and pay an unused commitment fee of 30 basis points. During the year ended December 31, 2016, we borrowed $55.0 million on our Revolving Credit Facility, all of which was related to the eLynx and Motivity acquisitions. See further discussion in Note 4—Business Acquisitions. We made payments of $105.0 million on this facility during the year ended December 31, 2016. As of
76
BLACK KNIGHT FINANCIAL SERVICES, INC.
NOTES TO CONSOLIDATED FINANCIAL STATEMENTS - (Continued)
December 31, 2016, the interest rates on the Term A Loan, Term B Loan and Revolving Credit Facility were 2.81%, 3.81% and 2.81%, respectively.
Under the Credit Agreement, BKIS (and in certain circumstances, BKFS LLC) and its restricted subsidiaries are subject to customary affirmative, negative and financial covenants, and events of default for facilities of this type (with customary grace periods, as applicable, and lender remedies).
Intercompany and Mirror Notes
On January 2, 2014, BKHI issued (i) a Mirror Note (the "Original Mirror Note"), in the original principal amount of $1,400.0 million and (ii) an Intercompany Note (the "Original Intercompany Note"), in the original principal amount of $1,175.0 million to FNF. BKFS LLC entered into an assumption agreement, dated as of January 3, 2014, among BKFS LLC, BKHI and FNF pursuant to which BKFS LLC assumed $820.0 million of the debt issued under the Original Mirror Note and $688.0 million of the debt issued under the Original Intercompany Note (such amounts, the "BKFS LLC Assumed Amounts") and FNF released BKHI of its obligations with respect to the BKFS LLC Assumed Amounts. Subsequently, on January 6, 2014, BKFS LLC borrowed an additional sum of $63.0 million pursuant to an intercompany note (the "Second Intercompany Note") issued by BKFS LLC to FNF, and on March 31, 2014, BKFS LLC borrowed an additional sum of $25.0 million pursuant to the Second Intercompany Note. BKFS LLC amended and restated the Second Intercompany Note on May 30, 2014 to remove required amortization payments. The Second Intercompany Note, as amended and restated, is referred to herein as the "Amended and Restated Second Intercompany Note." BKFS LLC amended and restated the Original Intercompany Note on May 30, 2014 to remove required amortization payments and to reflect BKFS LLC as the Borrower with respect to the indebtedness assumed thereunder. The Original Intercompany Note, as amended and restated, is referred to herein as the "Amended and Restated Original Intercompany Note." We amended and restated each of the Amended and Restated Original Intercompany Note and the Original Mirror Note on March 30, 2015 so that the obligations of each borrower thereunder are evidenced by a separate note. The Amended and Restated Original Intercompany Note and the Original Mirror Note, as amended and restated, are referred to herein as the "Second Amended and Restated Original Intercompany Note" and "Amended and Restated Original Mirror Note," respectively. The Amended and Restated Original Mirror Note is also referred to herein as the "Former Mirror Note." The Second Amended and Restated Original Intercompany Note and the Amended and Restated Second Intercompany Note are collectively referred to herein as the "Former Intercompany Notes." The Intercompany Notes bore interest at a rate of 10.0% per annum.
The Former Mirror Note was divided into two tranches known as Tranche "T" and Tranche "R". Tranche "T" in the original amount of $644.0 million bore interest at the rate or rates of interest charged on borrowings under FNF's term loan credit agreement, plus 100 basis points. Tranche "R" in the original amount of $176.0 million bore interest at the rate or rates of interest charged on borrowings under FNF's revolving credit agreement, plus 100 basis points. On May 27, 2015, we repaid the entire $627.9 million in outstanding principal on Tranche "T", as well as $1.3 million in accrued interest. We also repaid the entire $176.0 million in outstanding principal on Tranche "R", as well as $0.3 million in accrued interest. Additionally, on May 27, 2015, we repaid the entire $699.0 million in outstanding principal on the Amended and Restated Second Intercompany Note, as well as $10.7 million in accrued interest.
Senior Notes
The 5.75% Senior Notes pay interest semi-annually and mature on April 15, 2023. The Senior Notes are senior unsecured obligations, registered under the Securities Act of 1933 and contain customary affirmative, negative and financial covenants, and events of default for indebtedness of this type (with grace periods, as applicable, and lender remedies).
On May 29, 2015, we redeemed approximately $204.8 million in aggregate principal of the outstanding Senior Notes at a price of 105.75% (the "Redemption"), and paid $1.4 million in accrued interest. We incurred a charge on the Redemption of $11.8 million. We also reduced the bond premium by $7.0 million for the portion of the premium that related to the redeemed Senior Notes, resulting in a net loss on the Redemption of $4.8 million. Following the Redemption, $390.0 million in aggregate principal of the Senior Notes remained outstanding.
On May 27, 2015, BKIS, Black Knight Lending Solutions, Inc. ("BKLS," and, together with BKIS, the "Issuers"), the guarantors named therein (the "Guarantors") and U.S. Bank National Association, as trustee (the "Trustee"), entered into the Third Supplemental Indenture (the "Third Supplemental Indenture") to the Indenture, dated as of October 12, 2012, governing the Senior Notes, among the Issuers, the Guarantors party thereto and the Trustee, (as supplemented to date, the "Indenture"). The Third Supplemental Indenture supplements the Indenture to add the Guarantors as guarantors of the Issuers' obligations under the Indenture and the Senior Notes. As the Guarantors consist of substantially all of the subsidiaries of BKHI, with the exception of two insignificant subsidiaries, the Consolidated Financial Statements present all of the required guarantor financial statements, and we have not presented separate guarantor financial statements.
77
BLACK KNIGHT FINANCIAL SERVICES, INC.
NOTES TO CONSOLIDATED FINANCIAL STATEMENTS - (Continued)
On January 16, 2014, we issued an offer to purchase the Senior Notes pursuant to the change of control provisions under the related Indenture at a purchase price of 101% of the principal amount plus accrued interest to the purchase date. As a result of the offer, bondholders tendered $5.2 million in principal of the Senior Notes, which were subsequently purchased by us on February 24, 2014. On February 7, 2014, BKIS, FNF, BKLS and the Trustee entered into a second Supplemental Indenture pursuant to which we paid $0.7 million to the holders of the Senior Notes in exchange for the removal of certain financial reporting covenants.
On January 2, 2014, upon consummation of the Merger, LPS entered into a Supplemental Indenture (the "Supplemental Indenture") with FNF, BKLS and the Trustee, to the Indenture dated as of October 12, 2012, among LPS, the subsidiary guarantors party thereto and the Trustee, related to the Senior Notes. Pursuant to the terms of the Supplemental Indenture, (i) FNF became a guarantor of LPS' obligations under the Senior Notes and agreed to fully and unconditionally guarantee the Senior Notes, on a joint and several basis with the guarantors named in the Indenture and (ii) BKLS became a "co-issuer" of the Senior Notes and agreed to become a co-obligor of LPS' obligations under the Indenture and the Senior Notes, on the same terms and subject to the same conditions as LPS, on a joint and several basis. As a result of FNF's guarantee of the Senior Notes, the Senior Notes were rated as investment grade, which resulted in the suspension of certain restrictive covenants in the Indenture. Since May 26, 2015, we have been paying to FNF a guarantee fee of 1.0% of the outstanding principal of the Senior Notes in exchange for the ongoing guarantee by FNF of the Senior Notes. In October 2017, the guarantee fee increases to 2.0% of the outstanding principal of the Senior Notes.
Prior to October 15, 2017, we may redeem some or all of the Senior Notes by paying a "make-whole" premium based on U.S. Treasury rates. On or after October 15, 2017, we may redeem some or all of the Senior Notes at the redemption prices described in the table below, plus accrued and unpaid interest. In addition, if a change of control occurs, we are required to offer to purchase all outstanding Senior Notes at a price equal to 101% of the principal amount plus accrued and unpaid interest, if any, to the date of purchase.
Redemption Period | Percentage | |
October 15, 2017 to October 14, 2018 | 102.875% | |
October 15, 2018 to October 14, 2019 | 101.917% | |
October 15, 2019 to October 14, 2020 | 100.958% | |
October 15, 2020 and thereafter | 100.000% | |
As a result of the Acquisition, the Senior Notes were adjusted to fair value, resulting in our recording a premium on the Senior Notes of approximately $23.3 million. The premium is amortized over the remaining term of the Senior Notes using the effective interest method. During the years ended December 31, 2016, 2015 and 2014, we recognized $1.5 million, $1.7 million and $2.1 million of amortization, respectively, which is included as a component of Interest expense. As of December 31, 2016, the unamortized portion of the premium was $11.1 million.
Fair Value of Long-Term Debt
The fair value of the Senior Notes as of December 31, 2016 was $408.5 million (104.8% of par value), based upon established market prices for the securities using Level 2 inputs. The fair value of our Facilities approximates their carrying value at December 31, 2016 as they are variable rate instruments with short reset periods (either monthly or quarterly), which reflect current market rates. The fair value of our Facilities is based upon established market prices for the securities using Level 2 inputs.
Interest Rate Swaps
On January 20, 2016, we entered into two interest rate swap agreements to hedge forecasted monthly interest rate payments on $400.0 million of our floating rate debt ($200.0 million notional value each) (the "Swap Agreements"). Under the terms of the Swap Agreements, we receive payments based on the 1-month LIBOR rate (equal to 0.81% as of December 31, 2016) and pay a weighted average fixed rate of 1.01%. The effective term for the Swap Agreements is February 1, 2016 through January 31, 2019.
We entered into the Swap Agreements to convert a portion of the interest rate exposure on our floating rate debt from variable to fixed. We designated these Swap Agreements as cash flow hedges. A portion of the amount included in Accumulated other comprehensive loss will be reclassified into Interest expense as a yield adjustment as interest payments are made on the Term A Loan. The fair value of our Swap Agreements is based upon level 2 inputs. We have considered our own credit risk and the credit risk of the counterparties when determining the fair value of our Swap Agreements.
78
BLACK KNIGHT FINANCIAL SERVICES, INC.
NOTES TO CONSOLIDATED FINANCIAL STATEMENTS - (Continued)
The estimated fair value of our Swap Agreements in the Consolidated Balance Sheets is as follows (in millions):
Balance Sheet Account | December 31, 2016 | |||
Other non-current liabilities | $ | 2.2 | ||
As of December 31, 2016, a cumulative loss of $1.0 million ($0.6 million net of tax) is reflected in Accumulated other comprehensive loss, and a cumulative loss of $1.2 million is reflected in Noncontrolling interests. Below is a summary of the effect of our swap agreements on amounts recognized in other comprehensive earnings ("OCE") on the accompanying Consolidated Statements of Operations and Comprehensive Earnings (Loss) (in millions):
Year ended December 31, 2016 | |||||||
Amount of loss recognized in OCE | Amount of loss reclassified from Accumulated OCE into Net earnings | ||||||
Swap agreements | |||||||
Attributable to noncontrolling interests | $ | (2.2 | ) | $ | 1.0 | ||
Attributable to Black Knight | (1.1 | ) | 0.5 | ||||
Total | $ | (3.3 | ) | $ | 1.5 | ||
Approximately $0.1 million ($0.1 million net of tax) of the balance in Accumulated other comprehensive loss and Noncontrolling interests as of December 31, 2016 is expected to be reclassified into Interest expense over the next 12 months.
It is our policy to execute such instruments with credit-worthy banks and not to enter into derivative financial instruments for speculative purposes. As of December 31, 2016, we believe our interest rate swap counterparties will be able to fulfill their obligations under our agreements, and we believe we will have debt outstanding through the various expiration dates of the swaps such that the occurrence of future cash flow hedges remains probable.
Principal Maturities of Debt
Principal maturities as of December 31, 2016 for each of the next five years and thereafter are as follows (in millions):
2017 | $ | 64.0 | |
2018 | 84.0 | ||
2019 | 104.0 | ||
2020 | 554.0 | ||
2021 | 4.0 | ||
Thereafter | 764.0 | ||
Total | $ | 1,574.0 | |
Scheduled maturities noted above exclude the effect of the $11.1 million unamortized bond premium as well as debt issuance costs and discounts associated with the Facilities.
(12) | Commitments and Contingencies |
In the ordinary course of business, we are involved in various pending and threatened litigation and regulatory matters related to our operations, some of which include claims for punitive or exemplary damages. Our ordinary course litigation includes purported class action lawsuits, which make allegations related to various aspects of our business. From time to time, we also receive requests for information from various state and federal regulatory authorities, some of which take the form of civil investigative demands or subpoenas. Some of these regulatory inquiries may result in the assessment of fines for violations of regulations or settlements with such authorities requiring a variety of remedies. We believe that no actions, other than those discussed below, depart from customary litigation or regulatory inquiries incidental to our business.
We review lawsuits and other legal and regulatory matters (collectively "legal proceedings") on an ongoing basis when making accrual and disclosure decisions. When assessing reasonably possible and probable outcomes, management bases its decision on its assessment of the ultimate outcome assuming all appeals have been exhausted. For legal proceedings where it has been determined that a loss is both probable and reasonably estimable, a liability based on known facts and which represents our best estimate has been recorded. Actual losses may materially differ from the amounts recorded and the ultimate outcome of our pending cases is
79
BLACK KNIGHT FINANCIAL SERVICES, INC.
NOTES TO CONSOLIDATED FINANCIAL STATEMENTS - (Continued)
generally not yet determinable. The accrual for legal and regulatory matters was $0.6 million as of December 31, 2016 and $8.0 million as of December 31, 2015. While some of these matters could be material to our operating results or cash flows for any particular period if an unfavorable outcome results, at present we do not believe that the ultimate resolution of currently pending legal proceedings, either individually or in the aggregate, will have a material adverse effect on our financial condition.
Litigation Matters
On December 16, 2013, LPS received notice that Merion Capital, L.P. and Merion Capital II, L.P. (together "Merion Capital") were asserting their appraisal right relative to their ownership of 5,682,276 shares of LPS stock (the "Appraisal Shares") in connection with the acquisition of LPS by FNF on January 2, 2014. On February 6, 2014, Merion Capital filed an appraisal proceeding, captioned Merion Capital LP and Merion Capital II, LP v. Lender Processing Services, Inc., C.A. No. 9320-VCL, in the Delaware Court of Chancery seeking a judicial determination of the "fair" value of Merion Capital's 5,682,276 shares of LPS common stock under Delaware law, together with statutory interest. Merion Capital's expert opined that the consideration should have been $50.46 per share, which was approximately 36 percent higher than the final consideration of $37.14. The Company's position was that the merger consideration paid was fair value, and no additional consideration was owed. A bench trial was held in May 2016, and post-trial arguments were heard on September 21, 2016. On December 16, 2016, the trial court issued its decision that the fair value of the stock as of January 2, 2014, was $37.14 per share. The final judgment was entered on December 23, 2016, with the parties acknowledging that no further consideration was due as a result of the court's decision. Merion Capital did not appeal the judgment and the time to do so has expired. This matter is now closed.
Regulatory Matters
Following a review by the Board of Governors of the Federal Reserve System, the Federal Deposit Insurance Corporation, the Office of the Comptroller of the Currency and the Office of Thrift Supervision (collectively, the "banking agencies"), LPS entered into a consent order (the "2011 Consent Order") dated April 13, 2011, with the banking agencies. The banking agencies' review of LPS's services included the services provided by its default operations to mortgage servicers regulated by the banking agencies, including document execution services. The 2011 Consent Order did not make any findings of fact or conclusions of wrongdoing, nor did LPS admit any fault or liability. Although LPS is a party to the 2011 Consent Order, the ongoing costs of litigation and any potential resulting liability is expected to be borne by the underlying LPS default operations, which are now part of ServiceLink. Under the 2011 Consent Order, ServiceLink agreed to further study the issues identified in the review and to enhance ServiceLink's compliance, internal audit, risk management and board oversight plans with respect to those businesses. LPS also agreed to engage an independent third party to conduct a risk assessment and review of its default management businesses and document execution services it provided to mortgage servicers from January 1, 2008 through December 31, 2010, which has been on hold since June 2013.
To the extent such third party review, once completed, requires additional remediation of mortgage documents, ServiceLink had agreed to implement an appropriate plan to address the issues. The 2011 Consent Order did not include any fine or other monetary penalty. The banking agencies notified ServiceLink in December 2015 that they wished to discuss amending the 2011 Consent Order through a possible agreed civil monetary penalty amount in lieu of requiring any additional document execution review by the independent third party. The parties entered into a tolling agreement to allow the parties to engage in these discussions.
On January 24, 2017, the banking agencies and ServiceLink entered into an Amendment of Consent Order and Consent Order for Civil Money Penalty (the "Amendment"). Pursuant to the Amendment, (1) the banking agencies assessed and ServiceLink has paid a civil money penalty of $65.0 million, (2) ServiceLink's obligations under the 2011 Consent Order with respect to the document execution review have been terminated; and (3) the banking agencies have agreed they will not take any further action against ServiceLink or any of its current or former institution-affiliated parties, including without limitation, FNF and Black Knight, based upon the conduct alleged in the 2011 Consent Order. Neither the Amendment nor the 2011 Consent Order makes any findings of fact or conclusions of wrongdoing, nor did LPS or ServiceLink admit any fault or liability.
This matter is subject to a Cross-Indemnity Agreement between BKFS LLC and ServiceLink (see Indemnification Agreement below).
Indemnifications and Warranties
We often agree to indemnify our clients against damages and costs resulting from claims of patent, copyright, trademark infringement or breaches of confidentiality associated with use of our software through software licensing agreements. Historically, we have not made any payments under such indemnifications, but continue to monitor the conditions that are subject to the indemnifications to identify whether a loss has occurred that is both probable and estimable that would require recognition. In addition, we warrant to clients that our software operates substantially in accordance with the software specifications. Historically, no costs have been incurred related to software warranties and none are expected in the future, and as such, no accruals for warranty costs have been made.
80
BLACK KNIGHT FINANCIAL SERVICES, INC.
NOTES TO CONSOLIDATED FINANCIAL STATEMENTS - (Continued)
Indemnification Agreement
We are party to a cross-indemnity agreement dated December 22, 2014 with ServiceLink (the "Cross-Indemnity Agreement"). Pursuant to this agreement, ServiceLink indemnifies us from liabilities relating to, arising out of or resulting from the conduct of ServiceLink's business or any action, suit or proceeding in which we or any of our subsidiaries are named by reason of being a successor to the business of LPS and the cause of such action, suit or proceeding relates to the business of ServiceLink. In return, we indemnify ServiceLink for liabilities relating to, arising out of, or resulting from the conduct of our business.
Operating Leases
We lease certain of our property under leases which expire at various dates. Several of these agreements include escalation clauses and provide for purchases and renewal options for periods ranging from one to five years.
Future minimum operating lease payments for leases with initial or remaining terms greater than one year for each of the next five years and thereafter are as follows (in millions):
2017 | $ | 9.4 | |
2018 | 6.1 | ||
2019 | 4.7 | ||
2020 | 2.9 | ||
2021 | 0.6 | ||
Thereafter | 0.1 | ||
Total | $ | 23.8 | |
Rent expense incurred pertaining to continuing operations under all operating leases during the years ended December 31, 2016, 2015 and 2014 was $11.0 million, $10.4 million and $10.6 million, respectively.
Capital Leases
On June 29, 2016, Black Knight entered into a one-year capital lease agreement with a bargain purchase option for certain computer equipment. The leased equipment has a useful life of five years and will be depreciated on a straight-line basis over this period. The leased equipment was valued based on the net present value of the minimum lease payments, which was $10.0 million (net of imputed interest of $0.1 million) and is included in Property and equipment, net on the Consolidated Balance Sheets. The remaining capital lease obligation of $5.0 million will be paid in 2017 and is included in Trade accounts payable and other accrued liabilities on the Consolidated Balance Sheets and represents the non-cash investing and financing activity for the year ended December 31, 2016.
Black Knight entered into a one-year capital lease agreement commencing January 1, 2017 with a bargain purchase option for certain computer equipment. The leased equipment has a useful life of five years and will be depreciated on a straight-line basis over this period. The leased equipment was valued based on the net present value of the minimum lease payments, which was $8.4 million (net of imputed interest of $0.1 million) and will be paid in 2017.
Data Processing and Maintenance Services Agreements
We have various data processing and maintenance services agreements with vendors, which expire through 2020, for portions of our computer data processing operations and related functions.
Data processing and maintenance services agreement payments for agreements with initial or remaining terms greater than one year as follows (in millions):
2017 | $ | 36.1 | |
2018 | 26.7 | ||
2019 | 0.7 | ||
2020 | 0.4 | ||
Total | $ | 63.9 | |
However, these amounts could be more or less depending on various factors such as the inflation rate, the introduction of significant new technologies or changes in our data processing needs.
81
BLACK KNIGHT FINANCIAL SERVICES, INC.
NOTES TO CONSOLIDATED FINANCIAL STATEMENTS - (Continued)
Off-Balance Sheet Arrangements
We do not have any material off-balance sheet arrangements other than operating leases and interest rate swaps.
(13) | Equity-Based Compensation |
Profits Interests Plan
Under the Black Knight Financial Services, LLC 2013 Management Incentive Plan (the "Incentive Plan"), we were authorized to issue up to 11,111,111 Class B units of BKFS LLC ("BKFS LLC profits interests") to eligible members of management and the Board of Managers. During the year ended December 31, 2014, we issued BKFS LLC profits interests to certain members of BKFS LLC management, the BKFS LLC Board of Managers and certain employees of FNF and ServiceLink, which vested over three years, with 50% vesting after the second year and 50% vesting after the third year. The terms of the profits interests grants provided for the grantees to participate in any value of BKFS LLC in excess of its fair value at the date of grant in proportion to the Class A member unit holders participation in the same. The fair value of BKFS LLC at the date of grant was otherwise known as the hurdle amount. Profits interests granted were determined and approved by the Compensation Committee of the Board of Managers. Once vested, Class B units were not subject to expiration. The Class B units could be settled under various scenarios. According to the terms of the LLC Agreement and depending on the scenario, the Class B units could be settled in shares of FNF stock or cash at the election of FNF. We accounted for the BKFS LLC profits interests granted to employees and the Board of Managers in accordance with GAAP for equity-based payments, which requires that compensation cost relating to equity-based payments made to employees and directors be recognized in the Consolidated Financial Statements based on the fair value of each award. BKFS LLC profits interests granted to BKFS LLC employees and the Board of Managers were equity-classified in accordance with GAAP. Using the fair value method of accounting, compensation cost was measured based on the fair value of the award at the date of grant and recognized over the service period. We utilized the Black-Scholes model to calculate the fair value of the profits interests awards on the date of grant (the "Calculation").
There were 9.5 million BKFS LLC profits interests granted to BKFS LLC employees and the Board of Managers during the year ended December 31, 2014. The hurdle rate as of the date of grant was used to determine the per unit strike price for the Calculation. The risk free interest rates used in the calculation of the fair value of the BKFS LLC profits interests are the rates that correspond to the weighted average expected life of the profits interests. The volatility was estimated based on the historical volatility of BKFS LLC peers and of the historical LPS stock price over a term equal to the weighted average expected life of the profits interests. We used a weighted average risk free interest rate of 1.06%, a volatility factor for the expected market price of the member units of 33.6%, a dividend yield of 0.0% and a weighted average expected life of 3.5 years with a discount of 22.2% for lack of marketability resulting in a weighted average fair value of $2.10 per BKFS LLC profits interests unit granted. The redemption value of the BKFS LLC profits interests granted to BKFS LLC management and the Board of Managers was recorded to Redeemable members' interests and was $24.7 million as of December 31, 2014 with an offsetting amount recorded to Contributed member capital. The redemption value was determined based on the fair value of the award and the proportionate service period rendered through December 31, 2014.
During the year ended December 31, 2014, 1.6 million BKFS LLC profits interests grants were made to certain FNF and ServiceLink employees. In accordance with GAAP for accounting for equity-based payments, these awards were recorded as a dividend from BKFS LLC to FNF at the fair value on the date of grant. The amount of this dividend was $3.2 million and was reflected in Accumulated loss with an offsetting amount in Contributed member capital. The redemption value of BKFS LLC profits interests granted to ServiceLink employees was recorded to Redeemable members' interest and was $3.4 million as of December 31, 2014 with the offsetting amount recorded to Contributed member capital.
Certain employees of BKFS LLC were also granted profits interests of ServiceLink ("ServiceLink profits interests"). In accordance with GAAP, BKFS LLC is required to account for these ServiceLink profits interests because the grants are to BKFS LLC employees. The ServiceLink profits interests are liability-classified and must be revalued each quarter based on their current fair value with compensation costs recognized over the service period (the "Updated Calculation"). There were 2.6 million ServiceLink profits interests granted to BKFS LLC employees during the year ended December 31, 2014. The hurdle rate as of the grant date was used to determine the per unit strike price for the Updated Calculation. The risk free interest rates used in the calculation of the fair value of the ServiceLink profits interests are the rates that correspond to the weighted average expected life of the profits interests. The volatility was estimated based on the historical volatility of ServiceLink peers and of the historical LPS stock price over a term equal to the weighted average expected life of the profits interests. As of December 31, 2016, 2015 and 2014, we used a risk free interest rate of 0.8%, 0.6% and 0.9%, respectively, a dividend yield of 0.0% in each period, a volatility factor for the expected market price of the member units of 35%, 40% and 45%, respectively, and an expected life of 1.08, 1.75 and 2.5 years, respectively, with a discount of 14%, 20% and 26%, respectively, for lack of marketability resulting in a fair value of $0.30, $0.44 and $0.42, respectively, per profits interests unit granted. As of December 31, 2016 and 2015, we had a liability
82
BLACK KNIGHT FINANCIAL SERVICES, INC.
NOTES TO CONSOLIDATED FINANCIAL STATEMENTS - (Continued)
of approximately $0.8 million and $1.0 million, respectively, included on the Consolidated Balance Sheets related to the ServiceLink profits interests awards granted to BKFS LLC employees and the Board of Managers.
Omnibus Incentive Plan
In 2015, we established the Black Knight Financial Services, Inc. 2015 Omnibus Incentive Plan (the "Omnibus Plan") authorizing the issuance of up to 11.0 million shares of our Class A common stock, subject to the terms of the Omnibus Plan. The Omnibus Plan provides for the grant of stock options, stock appreciation rights, restricted stock, restricted stock units, performance shares, performance units, other cash and stock-based awards and dividend equivalents. Awards granted are approved by the Compensation Committee of the Board of Directors.
In connection with the IPO, we converted the 10,733,330 outstanding BKFS LLC profits interests units into 7,994,215 restricted shares of Black Knight Class A common stock. The fair value of the restricted shares was not greater than the value of the BKFS LLC profits interests units immediately prior to the conversion; therefore, no additional compensation expense was recognized. We accelerated the vesting of 4,381,021 restricted shares of Class A common stock held by our directors, incurring an acceleration charge of $6.2 million during the year ended December 31, 2015. The shares were subject to a six-month underwriter requested lock-up, which expired on November 15, 2015. The remaining 3,596,344 unvested restricted shares continued to vest on the same schedule as the former BKFS LLC profits interests.
On December 21, 2015, we granted 318,000 restricted shares of our Class A common stock with a grant date fair value of $32.37 per share, which was based on the closing price of our common stock on the date of grant. These restricted shares vest over a three-year period; vesting is also based on certain operating performance criteria.
On February 3, 2016, we granted 799,748 restricted shares of our Class A common stock with a grant date fair value of $28.29 per share, which was based on the closing price of our common stock on the date of grant. Of the 799,748 restricted shares granted, 247,437 restricted shares vest over a three-year period, and 552,311 restricted shares vest over a four-year period. The vesting of all the restricted shares granted on February 3, 2016 is also based on certain operating performance criteria.
During 2016, the Company also granted 44,898 restricted shares of our Class A common stock with a grant date fair value ranging from $32.74 to $34.84, which was based on the closing price of our common stock on the date of grant. These vest over a four-year period.
Restricted stock transactions under the Omnibus plan in 2015 and 2016 are as follows (shares in millions):
Shares | Weighted average grant date fair value | |||||
Balance December 31, 2014 | — | $ | — | |||
Converted | 7,994,215 | * | ||||
Granted | 318,000 | $ | 32.37 | |||
Forfeited | (16,850 | ) | * | |||
Vested | (4,381,021 | ) | * | |||
Balance December 31, 2015 | 3,914,344 | * | ||||
Granted | 844,646 | $ | 28.56 | |||
Forfeited | (57,484 | ) | * | |||
Vested | (1,793,132 | ) | * | |||
Balance, December 31, 2016 | 2,908,374 | * | ||||
_______________
* | The converted shares were originally BKFS LLC profits interests units with a weighted average grant date fair value of $2.10 per unit. The fair value of the restricted shares at the date of conversion, May 20, 2015, was $24.50 per share. The original grant date fair value of the forfeited and vested restricted shares, which were originally granted as profits interests units, was $2.01 per unit. |
On February 3, 2017, we granted 884,570 restricted shares of our Class A common stock with a grant date fair value of $37.90 per share, which was based on the closing price of our common stock on the date of grant. Of the 884,570 restricted shares granted, 203,160 restricted shares vest over a three-year period and 681,410 restricted shares vest over a four-year period. The vesting of all the restricted shares granted on February 3, 2017 is also based on certain operating performance criteria.
83
BLACK KNIGHT FINANCIAL SERVICES, INC.
NOTES TO CONSOLIDATED FINANCIAL STATEMENTS - (Continued)
Equity-based compensation expense is included in Operating expenses in the Consolidated Statements of Operations and Comprehensive Earnings (Loss). Net earnings (loss) from continuing operations reflects equity-based compensation expense of $12.4 million, $11.4 million and $6.4 million for the years ended December 31, 2016, 2015 and 2014, respectively. As noted above, the expense for the year ended December 31, 2015, includes an acceleration charge of $6.2 million for the accelerated vesting of the shares held by our directors. As of December 31, 2016, the total unrecognized compensation cost related to non-vested restricted shares of our Class A common stock and ServiceLink profits interests granted to BKFS LLC employees and directors is $24.9 million, which is expected to be recognized over a weighted average period of approximately 2.6 years.
(14) | Employee Benefit Plans |
Stock Purchase Plan
Effective July 20, 2015, we adopted the Black Knight Financial Services, Inc. Employee Stock Purchase Plan (the "Black Knight ESPP Plan") that allows our eligible employees to voluntarily make after-tax contributions ranging from 3% to 15% of eligible earnings. We contribute varying matching amounts as specified in the Black Knight ESPP Plan document. Prior to July 20, 2015 and upon consummation of the Acquisition (see Note 2—Acquisition and Internal Reorganization by FNF and Other Transactions for a more detailed discussion on the Acquisition), our employees became eligible to participate in the FNF Employee Stock Purchase Plan (the "FNF ESPP Plan") that allowed eligible employees to make voluntary after-tax contributions ranging from 3% to 15% of eligible earnings. We contributed varying matching amounts as specified in the FNF ESPP Plan document. During July of 2014, matching contributions were reinstated under the FNF ESPP Plan. We recorded expense of $5.8 million, $5.0 million and $2.8 million for the years ended December 31, 2016, 2015 and 2014, respectively, relating to the participation of our employees in the ESPP Plans.
401(k) Profit Sharing Plan
Our employees participate in a qualified 401(k) plan sponsored by FNF. Under the terms of the plan and subsequent amendments, eligible employees may contribute up to 40% of their pretax annual compensation, up to the amount allowed pursuant to the Internal Revenue Code ("IRC"). We generally match 37.5% of each dollar of employee contribution up to 6% of the employee's total eligible compensation. We recorded expense of $5.5 million, $5.2 million and $5.4 million for the years ended December 31, 2016, 2015 and 2014, respectively, relating to the participation of our employees in the 401(k) plan.
(15) Income Taxes
The income tax expense (benefit) attributable to continuing operations for the years ended December 31, 2016, 2015 and 2014 consists of the following (in millions):
Year ended December 31, | |||||||||||
2016 | 2015 | 2014 | |||||||||
Current: | |||||||||||
Federal | $ | 15.3 | $ | 0.5 | $ | (5.3 | ) | ||||
State | 6.0 | 0.7 | 0.1 | ||||||||
Foreign | 1.0 | 0.4 | — | ||||||||
Total current | 22.3 | 1.6 | (5.2 | ) | |||||||
Deferred: | |||||||||||
Federal | 5.0 | 11.3 | (0.1 | ) | |||||||
State | (1.1 | ) | 0.5 | — | |||||||
Foreign | (0.4 | ) | — | — | |||||||
Total deferred | 3.5 | 11.8 | (0.1 | ) | |||||||
Total income tax expense (benefit) | $ | 25.8 | $ | 13.4 | $ | (5.3 | ) | ||||
As described in Note 1—Basis of Presentation, the IPO and Offering Reorganization were completed on May 26, 2015, and resulted in our ownership of 44.5% of BKFS LLC. For the period prior to the IPO, the taxable status of BKFS LLC was a partnership under federal and state income tax laws.
84
BLACK KNIGHT FINANCIAL SERVICES, INC.
NOTES TO CONSOLIDATED FINANCIAL STATEMENTS - (Continued)
In connection with the IPO, two partners of BKFS LLC, THL Black Knight I Holding Corp. and THL Investors Black Knight I Holding Corp. (collectively, the "THL Blocker Corps"), merged with and into Black Knight with Black Knight as the surviving entity. For federal tax purposes, certain tax attributes, including a net operating loss of $46.1 million, were transferred to Black Knight under IRC Section 381.
A reconciliation of the federal statutory income tax rate to our effective income tax rate for the years ended December 31, 2016, 2015 and 2014 is as follows:
Year ended December 31, | ||||||||
2016 | 2015 | 2014 | ||||||
Federal statutory rate | 35.0 | % | 35.0 | % | 35.0 | % | ||
State income taxes, net of federal benefit | 2.0 | 1.3 | — | |||||
Noncontrolling interests | (19.2 | ) | (14.9 | ) | — | |||
Partnership income not subject to tax | — | (7.7 | ) | (22.2 | ) | |||
Tax credits | (0.6 | ) | (0.3 | ) | — | |||
Transaction costs | — | — | (8.1 | ) | ||||
Domestic Production Activities Deduction | (1.1 | ) | — | — | ||||
Other | 0.1 | 0.6 | — | |||||
Effective tax rate | 16.2 | % | 14.0 | % | 4.7 | % | ||
The significant components of deferred tax assets and liabilities as of December 31, 2016 and 2015 consist of the following (in millions):
December 31, | |||||||
2016 | 2015 | ||||||
Deferred tax assets: | |||||||
Net operating loss carryovers | $ | — | $ | 10.1 | |||
Tax credit carryovers | — | 0.7 | |||||
State income tax | 1.6 | — | |||||
Other | 0.4 | 0.2 | |||||
Total deferred tax assets | 2.0 | 11.0 | |||||
Deferred tax liabilities: | |||||||
Partnership basis | (9.9 | ) | (15.6 | ) | |||
Other - foreign | — | (0.1 | ) | ||||
Total deferred tax liabilities | (9.9 | ) | (15.7 | ) | |||
Net deferred tax liability | $ | (7.9 | ) | $ | (4.7 | ) | |
The merger described above resulted in a merger of the assets and liabilities of the THL Blocker Corps, which included the investment in BKFS LLC and the net deferred tax assets. During the 2016 and 2015 years, the change in the deferred tax liability related to the partnership basis book and tax difference was partially offset by the change in the deferred tax asset related to the net operating loss carryovers.
ASC Topic 740-10, Accounting for Uncertain Tax Positions, requires that a tax position be recognized or derecognized based on a more likely than not threshold. This applies to positions taken or expected to be taken on a tax return. There were no uncertain tax positions for Black Knight as of December 31, 2016 and 2015.
We had a net operating loss as of December 31, 2015 on a pre-tax basis of $28.8 million, available to carryforward and offset future federal taxable income. The net operating loss carryovers are U.S. federal net operating losses arising from the merger with the THL Blocker Corps as described above. We were not limited under IRC Section 382 in our ability to utilize the net operating loss carryovers. These net operating loss carryovers were fully utilized in 2016.
The Bipartisan Budget Act of 2015 provides that any tax adjustments resulting from partnership audits will generally be determined, and any resulting tax, interest and penalties collected, at the partnership level for tax years beginning after December 31, 2017. The Bipartisan Budget Act of 2015 allows a partnership to elect to apply these provisions to any return of the partnership
85
BLACK KNIGHT FINANCIAL SERVICES, INC.
NOTES TO CONSOLIDATED FINANCIAL STATEMENTS - (Continued)
filed for partnership taxable years beginning after the date of the enactment, November 2, 2015. BKFS LLC does not intend to elect to apply these provisions for any tax return filed for partnership taxable years beginning before January 1, 2018.
Tax Distributions
The taxable income of BKFS LLC is allocated to its members, including Black Knight, and the members are required to reflect on their own income tax returns the items of income, gain, deduction and loss and other tax items of BKFS LLC that are allocated to them. BKFS LLC makes tax distributions to its members in order to enable them to pay taxes on their allocable share of BKFS LLC's taxable income. Tax distributions are calculated based on allocations of income to a member for a particular taxable year without taking into account any losses allocated to the member in a prior taxable year. This practice is consistent with IRS regulations. Subject to certain reductions, tax distributions are generally made based on an assumed tax rate equal to the highest combined marginal federal, state and local income tax rate applicable to a U.S. corporation.
(16) | Concentrations of Risk |
We generate a significant amount of revenues from large customers, including a customer that accounted for 12% of total revenues for the years ended December 31, 2016 and 2015, respectively. We had two large customers that accounted for 14% and 12% of total revenues in the year ended December 31, 2014.
Financial instruments that potentially subject us to concentrations of credit risk consist primarily of cash equivalents, trade receivables and interest rate swaps.
(17) | Segment Information |
ASC Topic 280, Segment Reporting ("ASC 280"), establishes standards for reporting information about segments and requires that a public business enterprise reports financial and descriptive information about its segments. Segments are components of an enterprise for which separate financial information is available and are evaluated regularly by the chief operating decision maker ("CODM") in deciding how to allocate resources and in assessing performance. Black Knight's president and chief executive officer is identified as the CODM as defined by ASC 280. To align with the internal management of our business operations based on service offerings, our business is organized into two segments:
• | Technology — offers software and hosting solutions that support loan servicing, loan origination and settlement services. |
• | Data and Analytics — offers data and analytics solutions to the mortgage, real estate and capital markets industries. These solutions include property ownership data, lien data, servicing data, automated valuation models, collateral risk scores, prepayment and default models, lead generation and other data solutions. |
Separate discrete financial information is available for these two segments and the operating results of each segment are regularly evaluated by the CODM in order to assess performance and allocate resources. We use EBITDA as the primary profitability measure for making decisions regarding ongoing operations. EBITDA is earnings before Interest expense, Income tax expense and the Depreciation and amortization of Property and equipment, Computer software, Other intangible assets and deferred contract costs. We do not allocate Interest expense, Other expense, net, Income tax expense and certain other items, such as purchase accounting adjustments and acquisition-related costs to the segments, since these items are not considered in evaluating the segments' overall operating performance.
Effective January 2, 2014, the Technology segment includes the results of Commerce Velocity, and the Data and Analytics segment includes the results of Property Insight, which were contributed into BKFS LLC by FNF in transactions between entities under common control during 2014. See Note 1—Basis of Presentation for further discussion.
86
BLACK KNIGHT FINANCIAL SERVICES, INC.
NOTES TO CONSOLIDATED FINANCIAL STATEMENTS - (Continued)
Summarized financial information concerning our segments is shown in the tables below (in millions). Prior period results have been reclassified to conform to the current segment presentation. We have reclassified purchase accounting adjustments from the Technology and Data and Analytics segments to Corporate and Other to provide a better indication of ongoing segment performance.
Year ended December 31, 2016 | |||||||||||||||
Technology | Data and Analytics | Corporate and Other | Total | ||||||||||||
Revenues | $ | 855.8 | $ | 177.5 | $ | (7.3 | ) | (1) | $ | 1,026.0 | |||||
Expenses: | |||||||||||||||
Operating expenses | 368.0 | 151.0 | 63.6 | 582.6 | |||||||||||
Transition and integration costs | — | — | 2.3 | 2.3 | |||||||||||
EBITDA | 487.8 | 26.5 | (73.2 | ) | 441.1 | ||||||||||
Depreciation and amortization | 106.2 | 8.8 | 93.3 | (2) | 208.3 | ||||||||||
Operating income (loss) | 381.6 | 17.7 | (166.5 | ) | 232.8 | ||||||||||
Interest expense | (67.6 | ) | |||||||||||||
Other expense, net | (6.4 | ) | |||||||||||||
Earnings before income taxes | 158.8 | ||||||||||||||
Income tax expense | 25.8 | ||||||||||||||
Net earnings | $ | 133.0 | |||||||||||||
Balance sheet data: | |||||||||||||||
Total assets | $ | 3,196.7 | $ | 355.6 | $ | 209.7 | $ | 3,762.0 | |||||||
Goodwill | $ | 2,112.0 | $ | 191.8 | $ | — | $ | 2,303.8 | |||||||
_______________________________________________________
(1) | Revenues for Corporate and Other represent deferred revenue purchase accounting adjustments recorded in accordance with GAAP. |
(2) | Depreciation and amortization for Corporate and Other primarily represents net incremental depreciation and amortization adjustments associated with the application of purchase accounting recorded in accordance with GAAP. |
Year ended December 31, 2015 | |||||||||||||||
Technology | Data and Analytics | Corporate and Other | Total | ||||||||||||
Revenues | $ | 765.8 | $ | 174.3 | $ | (9.4 | ) | (1) | $ | 930.7 | |||||
Expenses: | |||||||||||||||
Operating expenses | 341.4 | 145.5 | 51.3 | 538.2 | |||||||||||
Transition and integration costs | — | — | 8.0 | 8.0 | |||||||||||
EBITDA | 424.4 | 28.8 | (68.7 | ) | 384.5 | ||||||||||
Depreciation and amortization | 93.3 | 7.2 | 93.8 | (2) | 194.3 | ||||||||||
Operating income (loss) | 331.1 | 21.6 | (162.5 | ) | 190.2 | ||||||||||
Interest expense | (89.8 | ) | |||||||||||||
Other expense, net | (4.6 | ) | |||||||||||||
Earnings before income taxes | 95.8 | ||||||||||||||
Income tax expense | 13.4 | ||||||||||||||
Net earnings | $ | 82.4 | |||||||||||||
Balance sheet data: | |||||||||||||||
Total assets | $ | 3,126.7 | $ | 312.1 | $ | 264.9 | $ | 3,703.7 | |||||||
Goodwill | $ | 2,048.0 | $ | 172.1 | $ | — | $ | 2,220.1 | |||||||
_______________________________________________________
(1) | Revenues for Corporate and Other represent deferred revenue purchase accounting adjustments recorded in accordance with GAAP. |
(2) | Depreciation and amortization for Corporate and Other primarily represents net incremental depreciation and amortization adjustments associated with the application of purchase accounting recorded in accordance with GAAP. |
87
BLACK KNIGHT FINANCIAL SERVICES, INC.
NOTES TO CONSOLIDATED FINANCIAL STATEMENTS - (Continued)
Year ended December 31, 2014 | |||||||||||||||
Technology | Data and Analytics | Corporate and Other | Total | ||||||||||||
Revenues | $ | 708.2 | $ | 156.6 | $ | (12.7 | ) | (1) | $ | 852.1 | |||||
Expenses: | |||||||||||||||
Operating expenses | 338.2 | 140.2 | 36.5 | 514.9 | |||||||||||
Transition and integration costs | — | — | 119.3 | 119.3 | |||||||||||
EBITDA | 370.0 | 16.4 | (168.5 | ) | 217.9 | ||||||||||
Depreciation and amortization | 84.7 | 6.5 | 97.6 | (2) | 188.8 | ||||||||||
Operating income (loss) | 285.3 | 9.9 | (266.1 | ) | 29.1 | ||||||||||
Interest expense | (128.7 | ) | |||||||||||||
Other expense, net | (12.0 | ) | |||||||||||||
Loss from continuing operations before income taxes | (111.6 | ) | |||||||||||||
Income tax benefit | (5.3 | ) | |||||||||||||
Net loss from continuing operations | $ | (106.3 | ) | ||||||||||||
_______________________________________________________
(1) | Revenues for Corporate and Other represent deferred revenue purchase accounting adjustments recorded in accordance with GAAP. |
(2) | Depreciation and amortization for Corporate and Other primarily represents net incremental depreciation and amortization adjustments associated with the application of purchase accounting recorded in accordance with GAAP. |
Item 9. | Changes in and Disagreements with Accountants on Accounting and Financial Disclosure |
None.
Item 9A. | Controls and Procedures |
As of the end of the year covered by this report, we carried out an evaluation, under the supervision and with the participation of our principal executive officer and principal financial officer, of the effectiveness of the design and operation of our disclosure controls and procedures as such term is defined in Rule 13a-15(e) or 15d-15(e) under the Exchange Act. Based on this evaluation, our principal executive officer and principal financial officer concluded that our disclosure controls and procedures are effective to ensure that information required to be disclosed by the Company in the reports that we file or submit under the Act is: (a) recorded, processed, summarized and reported, within the time periods specified in the Commission's rules and forms; and (b) accumulated and communicated to management, including our principal executive and principal financial officers, as appropriate to allow timely decisions regarding required disclosure.
There were no changes in our internal control over financial reporting that occurred during the quarter ended December 31, 2016 that have materially affected, or are reasonably likely to materially affect, our internal control over financial reporting.
Management's Report on Internal Control Over Financial Reporting
Management is responsible for establishing and maintaining adequate internal control over financial reporting, as such term is defined in Exchange Act Rule 13a-15(f) or 15d-15(f). Under the supervision and with the participation of our management, including our principal executive officer and principal financial officer, we conducted an evaluation of the effectiveness of our internal control over financial reporting. Management has adopted the framework in Internal Control-Integrated Framework issued by the Committee of Sponsoring Organizations of the Treadway Commission (COSO). Based on our evaluation under this framework, our management concluded that our internal control over financial reporting was effective as of December 31, 2016. Management has excluded eLynx and Motivity, (the "Excluded Businesses") from its assessment of internal control over financial reporting as of December 31, 2016, because the Excluded Businesses were acquired during 2016. The total assets, including goodwill and identifiable intangible assets, and total revenues of the Excluded Businesses represent approximately 4.1% and 2.3%, respectively, of the related consolidated financial statement amounts as of and for the year ended December 31, 2016.
The effectiveness of our internal control over financial reporting as of December 31, 2016 has been audited by KPMG LLP, an independent registered public accounting firm, as stated in their report which is included herein.
Item 9B. | Other Information |
None.
88
Part III
Items 10-14.
Within 120 days after the close of our fiscal year, we intend to file with the Securities and Exchange Commission a definitive proxy statement pursuant to Regulation 14A of the Securities Exchange Act of 1934, as amended, which will include the matters required by these items.
89
PART IV
Item 15. | Exhibits and Financial Statement Schedules |
(a) (1) Financial Statements. The following is a list of the Consolidated Financial Statements of Black Knight Financial Services, Inc. and its subsidiaries included in Item 8 of Part II:
Page Number | |
(a) (2) Financial Statement Schedules. All financial statement schedules have been omitted because they are not applicable or the required information is presented in the financial statements or the notes thereto.
(a) (3) Exhibits. See the Exhibit Index immediately following the signature page of this Annual Report on Form 10-K, which is incorporated herein by reference.
90
SIGNATURES
Pursuant to the requirements of Section 13 or 15(d) of the Securities Exchange Act of 1934, the Registrant has duly caused this report to be signed on its behalf by the undersigned, thereunto duly authorized.
Black Knight Financial Services, Inc. | |||
By: | /s/ Thomas J. Sanzone | ||
Thomas J. Sanzone | |||
President and Chief Executive Officer | |||
Date: February 24, 2017
Pursuant to the requirements of the Securities Exchange Act of 1934, this report has been signed below by the following persons on behalf of the Registrant and in the capacities and on the dates indicated. | ||||
Signature | Title | Date | ||
/s/ Thomas J. Sanzone | President and Chief Executive Officer | February 24, 2017 | ||
Thomas J. Sanzone | (Principal Executive Officer) | |||
/s/ Kirk T. Larsen | Executive Vice President and Chief Financial Officer | February 24, 2017 | ||
Kirk T. Larsen | (Principal Financial and Accounting Officer) | |||
/s/ William P. Foley, II | Director and Executive Chairman of the Board | February 24, 2017 | ||
William P. Foley, II | ||||
/s/ Thomas M. Hagerty | Director | February 24, 2017 | ||
Thomas M. Hagerty | ||||
/s/ David K. Hunt | Director | February 24, 2017 | ||
David K. Hunt | ||||
/s/ Richard N. Massey | Director | February 24, 2017 | ||
Richard N. Massey | ||||
/s/ Ganesh B. Rao | Director | February 24, 2017 | ||
Ganesh B. Rao | ||||
/s/ John D. Rood | Director | February 24, 2017 | ||
John D. Rood | ||||
91
EXHIBIT INDEX
Exhibit Number | ||
Description | ||
3.1 | Amended and Restated Certificate of Incorporation of Black Knight Financial Services, Inc., as currently in effect (incorporated by reference to Exhibit 3.1 to the Form 8-K filed by Black Knight Financial Services, Inc. on May 28, 2015 (No. 001-37394)) | |
3.2 | Amended and Restated Bylaws of Black Knight Financial Services, Inc., as currently in effect (incorporated by reference to Exhibit 3.2 to the Form 8-K filed by Black Knight Financial Services, Inc. on May 28, 2015 (No. 001-37394)) | |
4.1 | Form of Certificate of Class A common stock (incorporated by reference to Exhibit 4.1 to Amendment No. 4 to the Form S-1 Registration Statement filed by Black Knight Financial Services, Inc. on May 4, 2015 (No. 333-201241)) | |
4.2 | Form of Registration Rights Agreement by and among Black Knight Financial Services, Inc., Black Knight Holdings, Inc., the THL Parties, Chicago Title Insurance Company, Fidelity National Title Insurance Company, Holders, Other Stockholders and, solely in respect of Section 4.16 thereof, Black Knight Financial Services, LLC (incorporated by reference to Exhibit 4.2 to Amendment No. 2 to the Form S-1 Registration Statement filed by Black Knight Financial Services, Inc. on March 30, 2015 (No. 333-201241)) | |
4.3 | Indenture between Lender Processing Services, Inc., dated October 12, 2012, the guarantors party thereto and U.S. Bank National Association, as Trustee, relating to the 5.75% Senior Notes due 2023 (incorporated by reference to Exhibit 4.3 to the Form S-1 Registration Statement filed by Black Knight Financial Services, Inc. on December 23, 2014 (No. 333-201241)) | |
4.4 | Supplemental Indenture, dated as of January 2, 2014, by and among Lender Processing Services, Inc., Black Knight Lending Solutions, Inc., Fidelity National Financial Inc. and U.S. Bank National Association, as Trustee, relating to the 5.75% Senior Notes due 2023 (incorporated by reference to Exhibit 4.4 to the Form S-1 Registration Statement filed by Black Knight Financial Services, Inc. on December 23, 2014 (No. 333-201241)) | |
4.5 | Second Supplemental Indenture, dated as of February 7, 2014, by and among Black Knight InfoServ, LLC, Black Knight Lending Solutions, Inc. and U.S. Bank National Association, as Trustee, relating to the 5.75% Senior Notes due 2023 (incorporated by reference to Exhibit 4.5 to the Form S-1 Registration Statement filed by Black Knight Financial Services, Inc. on December 23, 2014 (No. 333-201241)) | |
4.6 | Third Supplemental Indenture, dated as of May 27, 2015, by and among Black Knight InfoServ, LLC, Black Knight Lending Solutions, Inc., the Guarantors Party Thereto and U.S. National Bank Association, as Trustee, relating to the 5.75% Senior Notes due 2023 (incorporated by reference to Exhibit 10.2 to the Form 8-K filed by Black Knight Financial Services, Inc. on May 28, 2015 (No. 001-37394)) | |
4.7 | Fourth Supplemental Indenture, dated as of June 6, 2016, by and among Black Knight InfoServ, LLC, Black Knight Lending Solutions, Inc., the Guarantors Party Thereto and U.S. Bank National Association, as Trustee, relating to the 5.75% Senior Notes due 2023 (incorporated by reference to Exhibit 4.1 to the Form 10-Q filed by Black Knight Financial Services, Inc. on August 9, 2016 (No. 001-37394)) | |
4.8 | Fifth Supplemental Indenture, dated as of July 12, 2016, by and among Black Knight InfoServ, LLC, Black Knight Lending Solutions, Inc., the Guarantors Party Thereto and U.S. Bank National Association, as Trustee, relating to the 5.75% Senior Notes due 2023 (incorporated by reference to Exhibit 4.2 to the Form 10-Q filed by Black Knight Financial Services, Inc. on August 9, 2016 (No. 001-37394)) | |
4.9 | Sixth Supplemental Indenture, dated as of August 4, 2016 by and among Black Knight InfoServ, LLC, Black Knight Lending Solutions, Inc., the Guarantors Party Thereto and U.S. Bank National Association, as Trustee, relating to the 5.75% Senior Notes due 2023 (incorporated by reference to Exhibit 4.3 to the Form 10-Q filed by Black Knight Financial Services, Inc. on August 9, 2016 (No. 001-37394)) | |
10.1 | Form of Second Amended and Restated Limited Liability Company Agreement of Black Knight Financial Services, LLC, by and among, Black Knight Financial Services, Inc. and the Other Parties Thereto (incorporated by reference to Exhibit 10.1 to Amendment No.6 to the Form S-1 Registration Statement filed by Black Knight Financial Services, Inc. on May 11, 2015 (No. 333-201241)) | |
10.2 | Form of Voting Agreement of Black Knight Financial Services, Inc. by and among Black Knight Financial Services, Inc., Black Knight Financial Services LLC, Chicago Title Insurance Company, Fidelity National Title Insurance Company, Black Knight Holdings, Inc., THL Equity Fund VI Investors (BKFS-LM), LLC, THL Equity Fund VI Investors (BKFS-NB), the THL Blocker I Stockholders, the THL Blocker II Stockholders and THL Equity Fund VI Investors (BKFS) III, L.P. (incorporated by reference to Exhibit 10.1 to Amendment No.4 to the Form S-1 Registration Statement filed by Black Knight Financial Services, Inc. on May 4, 2015 (No. 333-201241)) | |
92
10.3 | Form of Merger Agreement by and among Black Knight Financial Services, Inc., THL Black Knight I Holding Corp., THL Investors Black Knight I Holding Corp., the THL Blocker I Stockholders and the THL Blocker II Stockholders (incorporated by reference to Exhibit 10.3 to Amendment No.6 to the Form S-1 Registration Statement filed by Black Knight Financial Services, Inc. on May 11, 2015 (No. 333-201241)) | |
10.4 | Form of Advancement Agreement by and between Black Knight Financial Services, Inc. and Black Knight Financial Services, LLC (incorporated by reference to Exhibit 10.1 to Amendment No.2 to the Form S-1 Registration Statement filed by Black Knight Financial Services, Inc. on March 30, 2015 (No. 333-201241)) | |
10.5 | Credit and Guaranty Agreement, dated as of May 27, 2015, among Black Knight Infoserv, LLC, as Borrower, Black Knight Financial Services, LLC, as Holdings, the Subsidiaries of the Borrower from time to time party thereto, the Lenders from time to time party thereto, JPMorgan Chase Bank, N.A., as Administrative Agent, Swing Line Lender and L/C Issuer and Bank of America, N.A., as a Swing Line Lender and L/C Issuer (incorporated by reference to Exhibit 10.1 to Form 8-K filed by Black Knight Financial Services, Inc. on May 28, 2015 (No. 001-37394)) | |
10.6 | Amended and Restated Employment Agreement by and between William P. Foley, II and BKFS I Management, Inc. dated January 8, 2016 (incorporated by reference to Exhibit 10.6 to the Form 10-K filed by Black Knight Financial Services, Inc. on February 26, 2016 (No. 001-37394)) (1) | |
10.7 | Amended and Restated Employment Agreement by and between Thomas J. Sanzone and BKFS I Management, Inc. dated January 3, 2014 (incorporated by reference to Exhibit 10.10 to Amendment No. 3 to the Form S-1 Registration Statement filed by Black Knight Financial Services, Inc. on April 20, 2015 (No. 333-201241)) (1) | |
10.8 | Amended and Restated Employment Agreement by and between Kirk T. Larsen and BKFS I Management, Inc. dated April 23, 2015 (incorporated by reference to Exhibit 10.11 to Amendment No. 4 to the Form S-1 Registration Statement filed by Black Knight Financial Services, Inc. on May 4, 2015 (No. 333-201241)) (1) | |
10.9 | Black Knight Financial Services, LLC Incentive Plan dated January 1, 2014 (incorporated by reference to Exhibit 10.12 to the Form S-1 Registration Statement filed by Black Knight Financial Services, Inc. on December 23, 2014 (No. 333-201241)) (1) | |
10.10 | Black Knight Financial Services, LLC 2013 Management Incentive Plan (incorporated by reference to Exhibit 10.13 to the Form S-1 Registration Statement filed by Black Knight Financial Services, Inc. on December 23, 2014 (No. 333-201241)) (1) | |
10.11 | Amended and Restated Employment Agreement by and between Anthony Orefice and BKFS I Management, Inc. dated January 3, 2014 (incorporated by reference to Exhibit 10.14 to Amendment No. 3 to the Form S-1 Registration Statement filed by Black Knight Financial Services, Inc. on April 20, 2015 (No. 333-201241)) (1) | |
10.12 | Amendment to Employment Agreement by and between Anthony Orefice and BKFS I Management, Inc. effective as of September 2, 2014 (incorporated by reference to Exhibit 10.15 to Amendment No. 3 to the Form S-1 Registration Statement filed by Black Knight Financial Services, Inc. on April 20, 2015 (No. 333-201241)) (1) | |
10.13 | Employment Agreement by and between BKFS I Management, Inc. and Michael L. Gravelle, effective as of March 1, 2015 (incorporated by reference to Exhibit 10.16 to Amendment No. 3 to the Form S-1 Registration Statement filed by Black Knight Financial Services, Inc. on April 20, 2015 (No. 333-201241)) (1) | |
10.14 | Fidelity National Financial, Inc. Deferred Compensation Plan, as Amended and Restated, effective January 1, 2009 (incorporated by reference to 10.17 to Amendment No. 1 to the Form S-1 Registration Statement filed by Black Knight Financial Services, Inc. on February 17, 2015 (No. 333-201241)) (1) | |
10.15 | First Amendment to the Fidelity National Financial, Inc. Deferred Compensation Plan, effective February 1, 2012 (incorporated by reference to 10.18 to Amendment No. 1 to the Form S-1 Registration Statement filed by Black Knight Financial Services, Inc. on February 17, 2015 (No. 333-201241)) (1) | |
10.16 | Form of Black Knight Financial Services, Inc. 2015 Omnibus Incentive Plan (incorporated by reference to Exhibit 10.19 to Amendment No. 3 to the Form S-1 Registration Statement filed by Black Knight Financial Services, Inc. on April 20, 2015 (No. 333-201241)) (1) | |
10.17 | Cross-Indemnity Agreement by and between Black Knight Financial Services, LLC and ServiceLink Holdings, LLC dated as of December 22, 2014 (incorporated by reference to 10.20 to Amendment No. 2 to the Form S-1 Registration Statement filed by Black Knight Financial Services, Inc. on March 30, 2015 (No. 333-201241)) | |
10.18 | Black Knight Financial Services, LLC Unit Grant Agreement by and between William P. Foley II and Black Knight Financial Services, LLC dated January 9, 2014 (incorporated by reference to Exhibit 10.21 to Amendment No. 3 to the Form S-1 Registration Statement filed by Black Knight Financial Services, Inc. on April 20, 2015 (No. 333-201241)) (1) | |
93
10.19 | Black Knight Financial Services, LLC Unit Grant Agreement by and between Thomas J. Sanzone and Black Knight Financial Services, LLC dated October 29, 2014 (incorporated by reference to Exhibit 10.22 to Amendment No. 3 to the Form S-1 Registration Statement filed by Black Knight Financial Services, Inc. on April 20, 2015 (No. 333-201241)) (1) | |
10.20 | Black Knight Financial Services, LLC Unit Grant Agreement by and between Thomas J. Sanzone and Black Knight Financial Services, LLC dated January 9, 2014 (incorporated by reference to Exhibit 10.23 to Amendment No. 3 to the Form S-1 Registration Statement filed by Black Knight Financial Services, Inc. on April 20, 2015 (No. 333-201241)) (1) | |
10.21 | Black Knight Financial Services, LLC Unit Grant Agreement by and between Michael L. Gravelle and Black Knight Financial Services, LLC dated January 9, 2014 (incorporated by reference to Exhibit 10.24 to Amendment No. 3 to the Form S-1 Registration Statement filed by Black Knight Financial Services, Inc. on April 20, 2015 (No. 333-201241)) (1) | |
10.22 | Black Knight Financial Services, LLC Unit Grant Agreement by and between Kirk T. Larsen and Black Knight Financial Services, LLC dated January 9, 2014 (incorporated by reference to Exhibit 10.25 to Amendment No. 3 to the Form S-1 Registration Statement filed by Black Knight Financial Services, Inc. on April 20, 2015 (No. 333-201241)) (1) | |
10.23 | Black Knight Financial Services, LLC Unit Grant Agreement by and between Anthony Orefice and Black Knight Financial Services, LLC dated January 9, 2014 (incorporated by reference to Exhibit 10.26 to Amendment No. 3 to the Form S-1 Registration Statement filed by Black Knight Financial Services, Inc. on April 20, 2015 (No. 333-201241)) (1) | |
10.24 | Black Knight Financial Services, LLC Unit Grant Agreement by and between David K. Hunt and Black Knight Financial Services, LLC dated March 31, 2014 (incorporated by reference to Exhibit 10.27 to Amendment No. 3 to the Form S-1 Registration Statement filed by Black Knight Financial Services, Inc. on April 20, 2015 (No. 333-201241)) (1) | |
10.25 | Black Knight Financial Services, LLC Unit Grant Agreement by and between Richard N. Massey and Black Knight Financial Services, LLC dated January 9, 2014 (incorporated by reference to Exhibit 10.28 to Amendment No. 3 to the Form S-1 Registration Statement filed by Black Knight Financial Services, Inc. on April 20, 2015 (No. 333-201241)) (1) | |
10.26 | Black Knight Financial Services, LLC Unit Grant Agreement by and between John D. Rood and Black Knight Financial Services, LLC dated January 9, 2014 (incorporated by reference to Exhibit 10.29 to Amendment No. 3 to the Form S-1 Registration Statement filed by Black Knight Financial Services, Inc. on April 20, 2015 (No. 333-201241)) (1) | |
10.27 | Form of Grant Agreement for Restricted Stock Awards under the Black Knight Financial Services, Inc. 2015 Omnibus Incentive Plan to Be Issued upon Exchange of Grant Units (incorporated by reference to Exhibit 10.30 to Amendment No. 5 to the Form S-1 Registration Statement filed by Black Knight Financial Services, Inc. on May 7, 2015 (No. 333-201241)) (1) | |
10.28 | Black Knight Financial Services, Inc. Employee Stock Purchase Plan (incorporated by reference to Exhibit 99.1 to the Form S-8 Registration Statement filed by Black Knight Financial Services, Inc. on July 21, 2015 (No. 333-205784)) | |
10.29 | Fidelity National Financial Group 401(k) Profit Sharing Plan (incorporated by reference to Exhibit 99.2 to the Form S-8 Registration Statement filed by Black Knight Financial Services, Inc. on July 21, 2015 (No. 333-205784)) | |
10.30 | First Amendment to Amended and Restated Employment Agreement by and between Kirk T. Larsen and BKFS I Management, Inc. dated March 17, 2016 (incorporated by reference to Exhibit 10.1 to the Form 10-Q filed by Black Knight Financial Services, Inc. on April 29, 2016 (No. 001-37394)) (1) | |
10.31 | Amendment No. 2 to Amended and Restated Employment Agreement by and between Anthony Orefice and BKFS I Management, Inc. dated January 3, 2016 (incorporated by reference to Exhibit 10.2 to the Form 10-Q filed by Black Knight Financial Services, Inc. on April 29, 2016 (No. 001-37394)) (1) | |
10.32 | Second Amendment to Employment Agreement by and between BKFS I Management, Inc. and Kirk Larsen effective April 30, 2016 (incorporated by reference to Exhibit 10.1 to the Form 10-Q filed by Black Knight Financial Services, Inc. on August 9, 2016 (No. 001-37394)) (1) | |
10.33 | Amendment No. 3 to Employment Agreement by and between BKFS I Management, Inc. and Tony Orefice effective April 30, 2016 (incorporated by reference to Exhibit 10.2 to the Form 10-Q filed by Black Knight Financial Services, Inc. on August 9, 2016 (No. 001-37394)) (1) | |
94
10.34 | First Amendment to Amended and Restated Employment Agreement by and between BKFS I Management, Inc. and Tom Sanzone effective April 30, 2016 (incorporated by reference to Exhibit 10.3 to the Form 10-Q filed by Black Knight Financial Services, Inc. on August 9, 2016 (No. 001-37394)) (1) | |
10.35 | First Amendment to Employment Agreement by and between BKFS I Management, Inc. and Michael L. Gravelle effective April 30, 2016 (incorporated by reference to Exhibit 10.4 to the Form 10-Q filed by Black Knight Financial Services, Inc. on August 9, 2016 (No. 001-37394)) (1) | |
10.36 | Amendment to the Restricted Stock Award Agreement (Subject to Time-Based Restriction) (incorporated by reference to Exhibit 10.1 to the Form 10-Q filed by Black Knight Financial Services, Inc. on November 3, 2016 (No. 001-37394)) | |
10.37 | Form of Notice of Restricted Stock Grant and Restricted Stock Award Agreement (2015) under Black Knight Financial Services, Inc. 2015 Omnibus Incentive Plan (incorporated by reference to Exhibit 10.33 to the Form 10-K filed by Black Knight Financial Services, Inc. on February 26, 2016 (No. 001-37394)) (1) | |
10.38 | Form of Notice of Restricted Stock Grant and Restricted Stock Award Agreement (2016) with a 3 year vesting under Black Knight Financial Services, Inc. 2015 Omnibus Incentive Plan (incorporated by reference to Exhibit 10.34 to the Form 10-K filed by Black Knight Financial Services, Inc. on February 26, 2016 (No. 001-37394)) (1) | |
10.39 | Form of Notice of Restricted Stock Grant and Restricted Stock Award Agreement (2016) with a 4 year vesting under Black Knight Financial Services, Inc. 2015 Omnibus Incentive Plan (incorporated by reference to Exhibit 10.35 to the Form 10-K filed by Black Knight Financial Services, Inc. on February 26, 2016 (No. 001-37394)) (1) | |
10.40 | Form of Notice of Restricted Stock Grant and Restricted Stock Award Agreement (2017) with a 3 year vesting under Black Knight Financial Services, Inc. 2015 Omnibus Incentive Plan (1) | |
10.41 | Form of Notice of Restricted Stock Grant and Restricted Stock Award Agreement (2017) with a 4 year vesting under Black Knight Financial Services, Inc. 2015 Omnibus Incentive Plan (1) | |
21.1 | Subsidiaries of the Registrant | |
23.1 | Consent of KPMG LLP, Independent Registered Public Accounting Firm | |
31.1 | Certification of Chief Executive Officer pursuant to Section 302 of the Sarbanes-Oxley Act of 2002 | |
31.2 | Certification of Chief Financial Officer pursuant to Section 302 of the Sarbanes-Oxley Act of 2002 | |
32.1 | Certification by Chief Executive Officer of Periodic Financial Reports pursuant to Section 906 of the Sarbanes-Oxley Act of 2002, 18 U.S.C. Section 1350 | |
32.2 | Certification by Chief Financial Officer of Periodic Financial Reports pursuant to Section 906 of the Sarbanes-Oxley Act of 2002, 18 U.S.C. Section 1350 | |
99.1 | Audited Consolidated Financial Statements of Lender Processing Services, Inc. as of January 1, 2014 for the day ended January 1, 2014 | |
101 | Interactive Data Files | |
(1) | A management or compensatory plan or arrangement required to be filed as an exhibit to this report pursuant to Item 15(c) of Form 10-K. |
95