Attached files
| file | filename |
|---|---|
| 8-K - 8-K - Prestige Consumer Healthcare Inc. | a8-kpressreleasedecember20.htm |
| EX-99.1 - EXHIBIT 99.1 PRESS RELEASE - Prestige Consumer Healthcare Inc. | exhibit991fy16-q3earningsr.htm |

Review of Third Quarter FY 16 Results February 4, 2016 Exhibit 99.2

T h i r d Q u a r t e r F Y 1 6 R e s u l t s 2 This presentation contains certain “forward-looking” statements within the meaning of the Private Securities Litigation Reform Act of 1995, such as statements regarding the expected timing for consummating and integrating the DenTek acquisition, the growth of the DenTek international revenue, the acquisition’s impact on shareholder value, the impact of the acquisition on the Company’s portfolio of brands and growth, the Company’s expected financial performance, including revenue growth, adjusted EPS and adjusted free cash flow, and the impact of foreign exchange rates, the Company’s investment in brand-building and A&P, the Company’s ability to de-lever and increase M&A capacity, and the impact of the Company’s strategy of acquiring, integrating and building brands. Words such as “continue,” “will,” “expect,” “project,” “anticipate,” “likely,” “estimate,” “may,” “should,” “could,” “would,” and similar expressions identify forward-looking statements. Such forward-looking statements represent the Company’s expectations and beliefs and involve a number of known and unknown risks, uncertainties and other factors that may cause actual results to differ materially from those expressed or implied by such forward-looking statements. These factors include, among others, failure to satisfy the DenTek closing conditions or the inability to successfully integrate the DenTek brands, general economic and business conditions, regulatory matters, competitive pressures, the impact of our advertising and promotional initiatives, supplier issues, unexpected costs, the success of our brand-building investments and integration of newly acquired products, and other risks set forth in Part I, Item 1A. Risk Factors in the Company’s Annual Report on Form 10-K for the year ended March 31, 2015 and in Part II, Item 1A. Risk Factors in the Company’s Quarterly Report on Form 10-Q for the quarter ended September 30, 2015. You are cautioned not to place undue reliance on these forward-looking statements, which speak only as of the date this presentation. Except to the extent required by applicable law, the Company undertakes no obligation to update any forward-looking statement contained in this presentation, whether as a result of new information, future events, or otherwise. Safe Harbor Disclosure

T h i r d Q u a r t e r F Y 1 6 R e s u l t s 3 Agenda for Today’s Discussion I. Performance Highlights II. Financial Overview III. FY 16 Outlook and the Road Ahead

T h i r d Q u a r t e r F Y 1 6 R e s u l t s 4

T h i r d Q u a r t e r F Y 1 6 R e s u l t s 5 Solid Q3 Results In Line with Expectations Q3 consolidated Revenue of $200.2 million, up 1.3% versus prior year Q3, and up 3.2%(1) on a constant currency basis – Q3 Invest for Growth (Core OTC + International Revenue) up 3.4% or 5.7% on a constant currency basis – Q3 YTD consolidated Revenue growth of 14.1%, on pace to meet full year guidance of +10% to +11% – Q3 YTD Organic Revenue growth of 2.1%(1) on a constant currency basis Q3 Core OTC consumption growth of 4.7% and YTD growth of 5.2% – 84% of Core OTC portfolio with consumption growth in Q3 – Continued strength in our biggest brands – Consistent and innovative marketing support building long-term brand equity in Core OTC brands Q3 Adjusted Gross Margin of 58.3%(2) versus 57.2% in the prior year Q3, and in-line with 58.2% Gross Margin in Q2 Q3 Adjusted EPS of $0.53(2), up 10.4% versus the prior year Q3 Q3 Strong Adjusted Free Cash Flow of $45.8(2) million, leverage of ~4.8x(3) DenTek acquisition expected to close in early February

T h i r d Q u a r t e r F Y 1 6 R e s u l t s 6 Solid Q3 Results Company on Track to Meet FY2016 Expectations Expected Q4 up 0.5% to 1.5% Full year up 10% to 11% Full Year Revenue Outlook Expect full year Adjusted EPS at high end of $2.05 to $2.10(7) range, or slightly above Adjusted E.P.S. Free Cash Flow of $175MM(8) or more expected Year-end leverage expected to improve to ~4.6x(3) excluding DenTek, ~5.1x(3) pro forma for DenTek Free Cash Flow and Leverage Company on track to continue to deliver strong financial performance in FY2016 Company on track to deliver strong financial performance in FY2016 Note: Figures exclude impact of DenTek Acquisition and related financing.

T h i r d Q u a r t e r F Y 1 6 R e s u l t s 7 Continued Core OTC Consumption Growth and Sales Momentum Source: IRI multi-outlet + C-Store retail dollar sales growth for relevant period. Data reflects retail dollar sales percentage growth versus prior period; FY’16 Organic sales growth presented on a constant currency basis. O rg a n ic Sa les G ro w th C o n s u m p ti o n G ro w th 0.5% 3.6% 5.6% 7.0% 6.5% 3.6% 4.7% FY 15 FY 16 (0.8%) (1.1%) 10.7% 5.8% 7.1% 2.2% 6.5% Q2 Q3 Q4 Q1 Q2 1H: 5.5% 1H: 4.4% Q1 Q3

T h i r d Q u a r t e r F Y 1 6 R e s u l t s 8 Core OTC International Other OTC Household Contribution to Portfolio: # of Brands: Investment: Targeted Mix Over Time(4)(5): Invest for Growth Manage for Cash Flow Generation ~25% of Total Brands ~75% of Total Brands 63% 15% Q3 Investment in Core OTC and International Driving Organic Growth +5.7% (2.1)% 3.2%(1) Organic Growth High Maintain ~78% ~85% Current Target ~22% ~15% Current Target 11% 11% Q3 FY 16 % Organic Growth: (Constant Currency)(1)

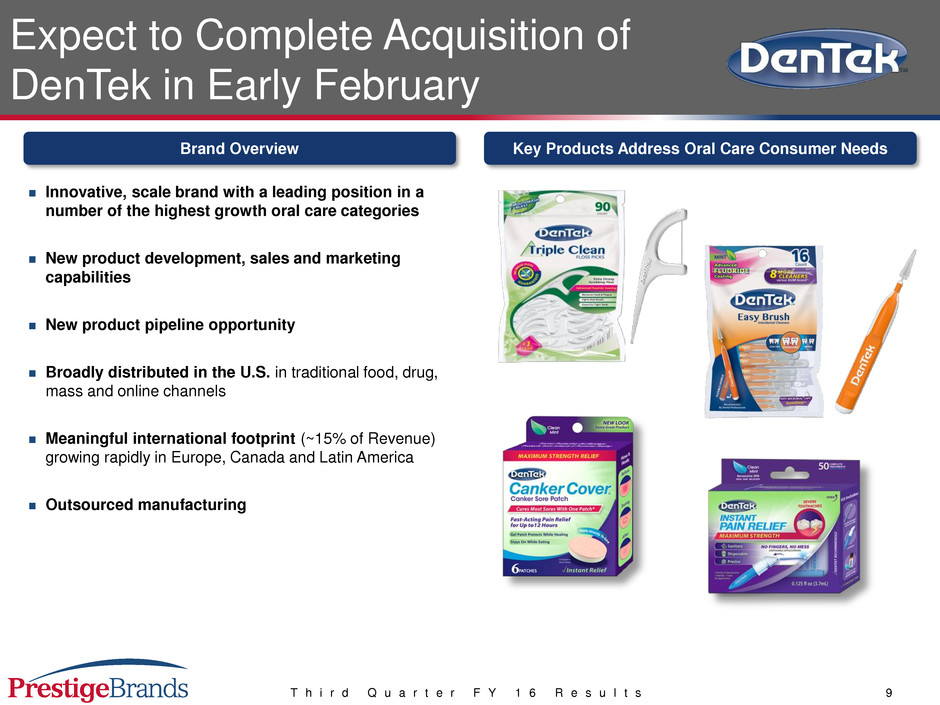
T h i r d Q u a r t e r F Y 1 6 R e s u l t s 9 Expect to Complete Acquisition of DenTek in Early February Innovative, scale brand with a leading position in a number of the highest growth oral care categories New product development, sales and marketing capabilities New product pipeline opportunity Broadly distributed in the U.S. in traditional food, drug, mass and online channels Meaningful international footprint (~15% of Revenue) growing rapidly in Europe, Canada and Latin America Outsourced manufacturing Brand Overview Dollar values in millions Source: Nielsen xAOC L-52 weeks ending October 3, 2015 Key Products Address Oral Care Consumer Needs

T h i r d Q u a r t e r F Y 1 6 R e s u l t s 10 New $100MM+ Oral Care Platform ~$130 ~$120 ~$120 ~$100 ~$110 Women’s Health Cough & Cold Analgesics Eye & Ear Care Oral Care Dollar values in millions Note: Figures represent Total Revenues.

T h i r d Q u a r t e r F Y 1 6 R e s u l t s 11 Transaction Nears Objective of 85% of Portfolio Representing Invest for Growth Brands Core OTC / International Other OTC / Household Pre-Acquisition Period Contribution to Portfolio: Investment: Targeted Mix Over Time: Invest for Growth Manage for Cash Flow Generation 78% High Maintain ~50% ~78% ~80% ~85% FY 10 FY 16 Pro Forma Target ~50% ~22% ~20% ~15% FY 10 FY 16 Pro Forma Target 22% Source: Company data

T h i r d Q u a r t e r F Y 1 6 R e s u l t s 12 Expect to Complete by End of Q3 FY 17 On-Going 12-24 Months Regulatory / Quality Assurance Systems / Back-Office Supply Chain Sales & Distribution Common IT systems and processes Leverage existing organization Brand Building Regulatory and quality functions integrated Go-to-market strategy in-place and selling organization integrated Optimizing common supplier network Identifying and capturing cost savings potential Marketing strategy formation underway Brand plans and new product / innovation pipeline development Proven Core Competency of Rapidly Integrating Acquisitions Proven Path for Value Creation

T h i r d Q u a r t e r F Y 1 6 R e s u l t s 13

T h i r d Q u a r t e r F Y 1 6 R e s u l t s 14 Key Financial Results for Third Quarter Performance Solid overall financial performance in the quarter − Revenue of $200.2 million, an increase of 1.3% − Revenue growth of 3.2%(1) excluding the impact of foreign currency − Adjusted EPS of $0.53(2), up 10.4% − Q3 Adjusted Free Cash Flow of $45.8 million(2), YTD Adjusted Free Cash Flow of $134.7 million(2) $197.6 $69.1 $113.6 $200.2 $69.7 $134.7 Total Revenue Adjusted EBITDA Adjusted EPS YTD Adjusted Free Cash Flow Q3 FY 16 Q3 FY 15 1.3% 0.9% 10.4% 18.5% $0.48 $0.53 (2) (2) (2) Dollar values in millions, except per share data.

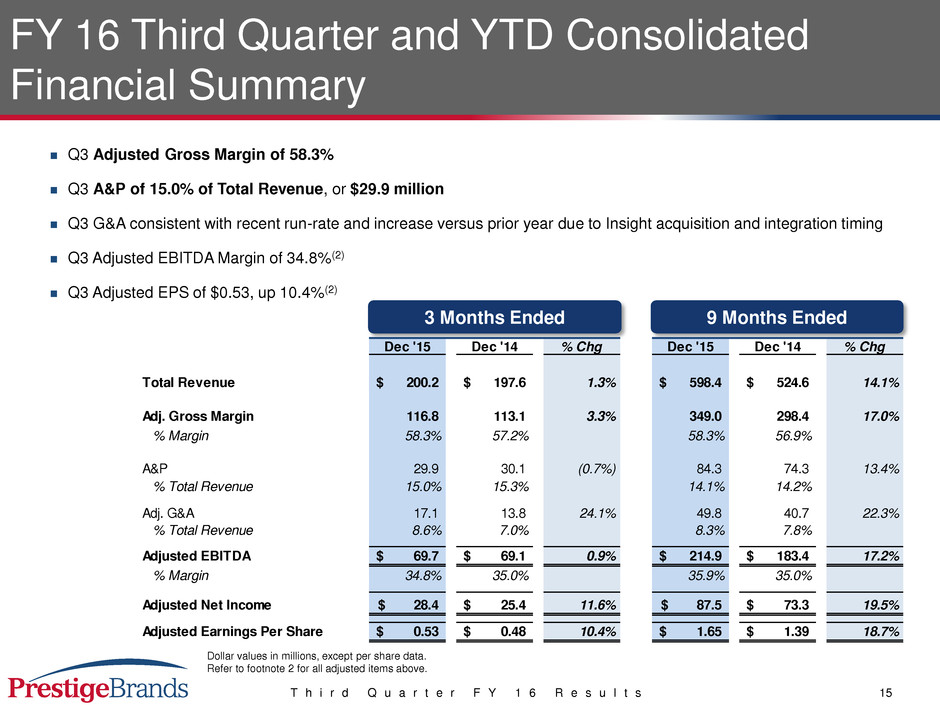
T h i r d Q u a r t e r F Y 1 6 R e s u l t s 15 FY 16 Third Quarter and YTD Consolidated Financial Summary Q3 Adjusted Gross Margin of 58.3% Q3 A&P of 15.0% of Total Revenue, or $29.9 million Q3 G&A consistent with recent run-rate and increase versus prior year due to Insight acquisition and integration timing Q3 Adjusted EBITDA Margin of 34.8%(2) Q3 Adjusted EPS of $0.53, up 10.4%(2) 3 Months Ended Dollar values in millions, except per share data. Refer to footnote 2 for all adjusted items above. 9 Months Ended Dec '15 Dec '14 % Chg Dec '15 Dec '14 % Chg Total Revenue 200.2$ 197.6$ 1.3% 598.4$ 524.6$ 14.1% Adj. Gross Margin 116.8 113.1 3.3% 349.0 298.4 17.0% % Margin 58.3% 57.2% 58.3% 56.9% A&P 29.9 30.1 (0.7%) 84.3 74.3 13.4% % Total Revenue 15.0% 15.3% 14.1% 14.2% Adj. G&A 17.1 13.8 24.1% 49.8 40.7 22.3% % Tot l R venue 8.6% 7.0% 8.3% 7.8% Adjus ed EBITDA 69.7$ 69.1$ 0.9% 214.9$ 183.4$ 17.2% % Margin 34.8% 35.0% 35.9% 35.0% Adjusted Net Income 28.4$ 25.4$ 11.6% 87.5$ 73.3$ 19.5% Adjusted Earnings Per Share 0.53$ 0.48$ 10.4% 1.65$ 1.39$ 18.7%

T h i r d Q u a r t e r F Y 1 6 R e s u l t s 16 Three Months Ended Nine Months Ended Dec '15 Dec '14 Dec '15 Dec '14 Net Income - As Reported 28.0$ 21.3$ 86.0$ 54.5$ Depreciation & Amortization 6.1 5.2 17.5 12.0 Other Non-Cash Operating Items 13.0 12.6 44.5 30.7 Working Capital (1.3) 8.0 (11.5) 7.0 Operating Cash Flow 45.9$ 47.1$ 136.5$ 104.1$ Additions to Property and Equipment (0.9) (2.3) (2.5) (3.7) Free Cash Flow 45.0$ 44.8$ 133.9$ 100.4$ Acquisition Costs 0.8 0.8 0.8 13.2 Adjusted Free Cash Flow 45.8$ 45.5$ 134.7$ 113.6$ Debt Profile & Financial Compliance: Net Debt at 12/31/15 of $1,429 million comprised of: – Cash on hand of $49 million – $828 million of term loan and revolver – $650 million of bonds Leverage ratio(3) of ~4.8x Pro forma leverage ratio(3) of ~5.1x at year-end including acquisition of DenTek Exceptional Free Cash Flow Trends Cash Flow Comments (6) (2) Dollar values in millions. (2)

T h i r d Q u a r t e r F Y 1 6 R e s u l t s 17

T h i r d Q u a r t e r F Y 1 6 R e s u l t s 18 Staying the Strategic Course to Continue Shareholder Value Creation − Consumption driving good momentum into Q4 − Retail environment continues to present headwinds, expected to continue through FY 17 − Expected Fx impact of approximately +$15MM full year, no impact expected on EPS or FCF − Continued focus on investment in brand building for FY 16 − Invest and innovate in Core OTC brands and international platform − Continue to build new product pipeline for the long term − Rapidly integrate DenTek upon closing − Focus on DenTek brand building and new product development pipeline − Rapidly de-levering and building meaningful M&A capacity − Revenue growth of +10% to +11% to reflect current Fx rates, Q4 +0.5% to +1.5% − Expect full year Adjusted EPS at high end of $2.05 to $2.10(7) range, or slightly above − Free cash flow of $175MM(8) or more − Continued A&P investment in portfolio Brand Building Confident in Full FY 16 Outlook Strong Consumption Trends M&A Strategy Note: Figures exclude impact of DenTek Acquisition and related financing.

T h i r d Q u a r t e r F Y 1 6 R e s u l t s 19 Q&A

T h i r d Q u a r t e r F Y 1 6 R e s u l t s 20 Appendix (1) Revenue Growth and Organic Revenue Growth on a constant currency basis are Non-GAAP financial measures and are reconciled to their most closely related GAAP financial measures in our earnings release in the “About Non-GAAP Financial Measures” section. (2) Adjusted Gross Margin, Adjusted G&A, Adjusted EBITDA, Adjusted EBITDA Margin, Adjusted Net Income, Adjusted EPS, Free Cash Flow and Adjusted Free Cash Flow are Non-GAAP financial measures and are reconciled to their most closely related GAAP financial measures in our earnings release in the “About Non-GAAP Financial Measures” section. (3) Leverage ratio reflects net debt / covenant defined EBITDA. (4) Pro forma Net Sales for FY 15 as if Insight and Hydralyte were acquired on April 1, 2014. (5) Based on Company's organic long-term plan. Source: Company data. (6) Operating cash flow is equal to GAAP net cash provided by operating activities. (7) Adjusted EPS for FY 16 is a projected Non-GAAP financial measure, is reconciled to projected GAAP EPS in our earnings release in the “About Non-GAAP Financial Measures” section and is calculated based on projected GAAP EPS of $2.00 to $2.05 plus $0.05 of cost associated with legal and professional fees associated with acquisitions, term loan refinancing and CEO retirement totaling $2.05 to $2.10. (8) Free Cash Flow for FY 16 is a projected Non-GAAP financial measure, is reconciled to projected GAAP Net Cash Provided by Operating Activities in our earnings release in the “About Non-GAAP Financial Measures” section and is calculated based on projected Net Cash Provided by Operating Activities of $181 million less projected capital expenditures of $6 million.
