Attached files
| file | filename |
|---|---|
| 8-K - FORM 8-K - Arlington Asset Investment Corp. | v430442_8k.htm |
| EX-99.1 - EXHIBIT 99.1 - Arlington Asset Investment Corp. | v430442_ex99-1.htm |
Exhibit 99.2
Investor Presentation – Fourth Quarter 2015 February 2, 2016
1 Information Related to Forward - Looking Statements This presentation contains “forward - looking statements” within the meaning of the Private Securities Litigation Reform Act of 19 95. These include statements regarding future results or expectations about our investments, interest rates, portfolio allocation, divi den ds, financing agreements, returns on invested capital, investment strategy, taxes, portfolio, earnings, book value, housing market, compens ati on, growth in capital, agency MBS spreads, prepayments, hedging instruments, duration, credit performance of private - label MBS, cash flow and benefit of deferred tax asset value. Forward - looking statements can be identified by forward - looking language, including words such as “be lieves,” “anticipates,” “views,” “expects,” “estimates,” “intends,” “may,” “plans,” “projects,” “potential,” “prospective,” “will” and si milar expressions, or the negative of these words. Such forward - looking statements are based on facts and conditions as they exist at the time such statements are made. Forward - looking statements are also based on predictions as to future facts and conditions, the accurate p rediction of which may be difficult and involve the assessment of events beyond our control. Forward - looking statements are further based on various operating and return assumptions. Caution must be exercised in relying on forward - looking statements. Due to known and unknown risks, actual results may differ materially from expectations or projections. You should carefully consider these risks when you make a decision concerning an investment in our common stock or senior not es , along with the following factors, among others, that may cause our actual results to differ materially from those described in any for ward - looking statements: availability of, and our ability to deploy, capital; growing our business primarily through a strategy focused on ac quiring primarily private - label mortgage - backed securities (“MBS”) and agency MBS; yields on MBS; our ability to successfully implement our hedgin g strategy; our ability to realize reflation on our private - label MBS; the credit performance of our private - label MBS; current co nditions and adverse developments in the residential mortgage market and the overall economy; potential risk attributable to our mortgage - rel ated portfolios; impacts of regulatory changes, including actions taken by the SEC, the U.S. Federal Reserve, the Federal Housing Fin ance Agency and the U.S. Treasury and changes affecting Fannie Mae and Freddie Mac; overall interest rate environment and changes in inte res t rates, interest rate spreads, the yield curve and prepayment rates; changes in anticipated earnings and returns; the amount and grow th in our cash earnings and distributable income; growth in our book value per share; our ability to maintain adequate liquidity; our use of le verage and dependence on repurchase agreements and other short - term borrowings to finance our mortgage - related holdings; the loss of our ex clusion from the definition of an “investment company” under the Investment Company Act of 1940; our ability to forecast our tax attr ibu tes and protect and use our net operating loss carry - forwards and net capital loss carry - forwards to offset future taxable income and ga ins; changes in our business, acquisition, leverage, asset allocation, operational, hedging and financing strategies and policies; our abilit y a nd willingness to make future dividends; changes in, and our ability to remain in compliance with, law, regulations or governmental policies af fec ting our business; and the factors described in the sections entitled “Risk Factors” in our Annual Report on Form 10 - K for the year ended December 31, 2014, subsequent Quarterly Reports on Form 10 - Q and other documents filed by the Company with the SEC from time to time. You sh ould not place undue reliance on these forward - looking statements, which apply only as of the date of this presentation. We undertak e no obligation to update or revise any forward - looking statement, whether written or oral, relating to matters discussed in this presentation, except as may be required by applicable securities laws.
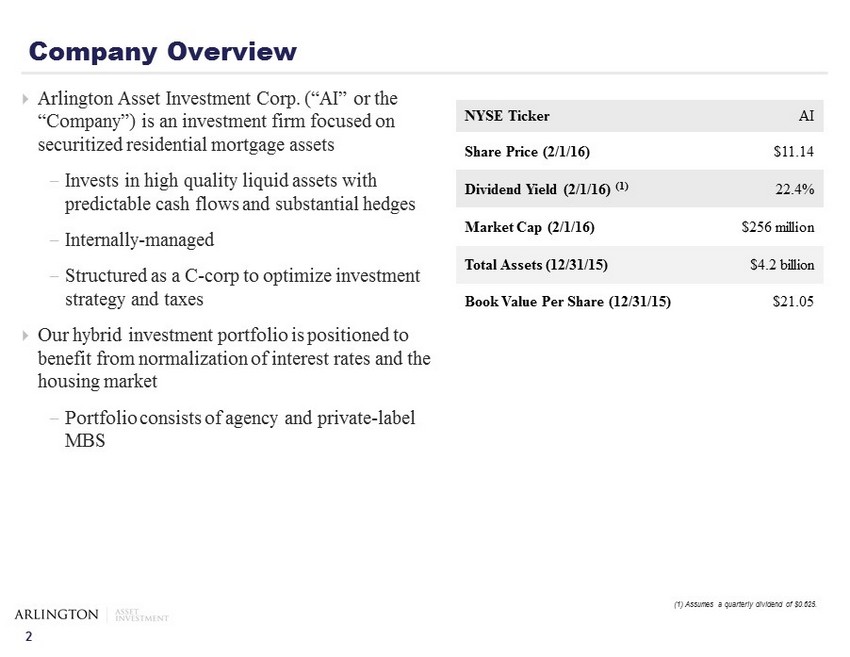
2 Company Overview ; Arlington Asset Investment Corp. (“AI” or the “Company”) is an investment firm focused on securitized residential mortgage assets - Invests in high quality liquid assets with predictable cash flows and substantial hedges - Internally - managed - Structured as a C - corp to optimize investment strategy and taxes ; Our hybrid investment portfolio is positioned to benefit from normalization of interest rates and the housing market - Portfolio consists of agency and private - label MBS NYSE Ticker AI Share Price (2/1/16) $11.14 Dividend Yield (2/1/16) (1) 22.4% Market Cap (2/1/16 ) $256 million Total Assets (12/31/15) $4.2 billion Book Value P er Share (12/31/15) $21.05 (1) Assumes a quarterly dividend of $0.625.
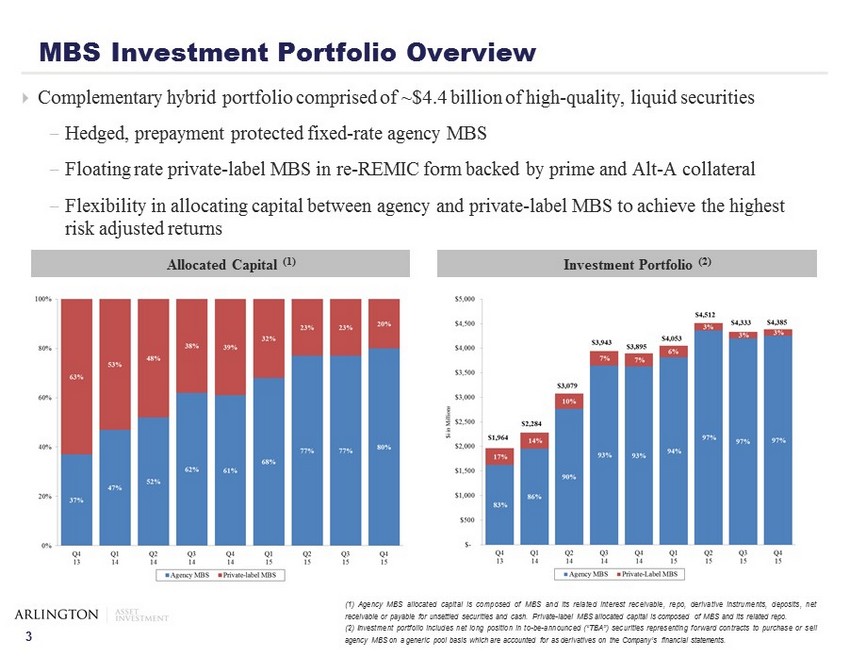
3 ; Complementary hybrid portfolio comprised of ~$4.4 billion of high - quality, liquid securities - Hedged, prepayment protected fixed - rate agency MBS - Floating rate private - label MBS in re - REMIC form backed by prime and Alt - A collateral - Flexibility in allocating capital between agency and private - label MBS to achieve the highest risk adjusted returns MBS Investment Portfolio Overview ( 1 ) Agency MBS allocated capital is composed of MBS and its related interest receivable, repo, derivative instruments, deposits, net receivable or payable for unsettled securities and cash . Private - label MBS allocated capital is composed of MBS and its related repo . ( 2 ) Investment portfolio includes net long position in to - be - announced (“TBA”) securities representing forward contracts to purchase or sell agency MBS on a generic pool basis which are accounted for as derivatives on the Company’s financial statements . Investment Portfolio (2) Allocated Capital (1)
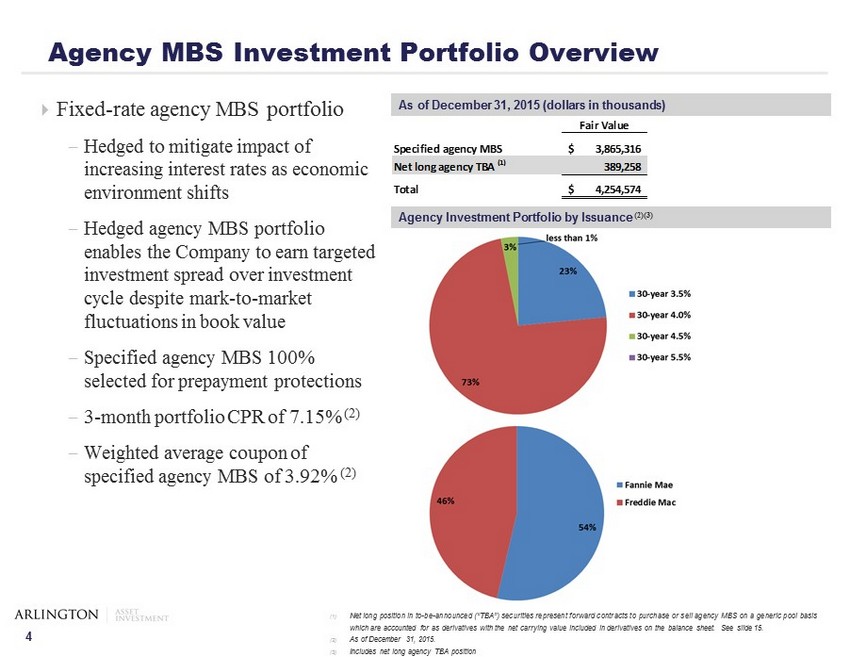
4 ; Fixed - rate agency MBS portfolio - Hedged to mitigate impact of increasing interest rates as economic environment shifts - Hedged agency MBS portfolio enables the Company to earn targeted investment spread over investment cycle despite mark - to - market fluctuations in book value - Specified agency MBS 100% selected for prepayment protections - 3 - month portfolio CPR of 7.15% (2) - Weighted average coupon of specified agency MBS of 3.92% (2) Agency MBS Investment Portfolio Overview As of December 31, 2015 (dollars in thousands) (1) Net long position in to - be - announced (“TBA”) securities represent forward contracts to purchase or sell agency MBS on a generic pool basis which are accounted for as derivatives with the net carrying value included in derivatives on the balance sheet . See slide 15 . (2) As of December 31 , 2015 . (3) Includes net long agency TBA position Agency Investment Portfolio by Issuance (2)(3) Fair Value Specified agency MBS 3,865,316$ Net long agency TBA (1) 389,258 Total 4,254,574$
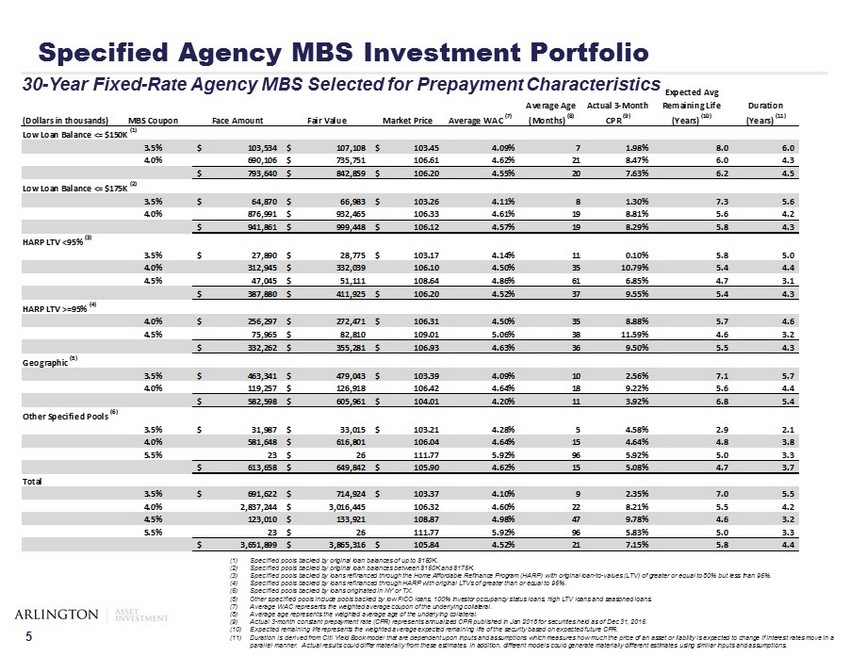
5 Specified Agency MBS Investment Portfolio (1) Specified pools backed by original loan balances of up to $150K. (2) Specified pools backed by original loan balances between $150K and $175K. (3) Specified pools backed by loans refinanced through the Home Affordable Refinance Program (HARP) with original loan - to - values (LT V) of greater or equal to 80% but less than 95%. (4) Specified pools backed by loans refinanced through HARP with original LTVs of greater than or equal to 95%. (5) Specified pools backed by loans originated in NY or TX. (6) Other specified pools include pools backed by low FICO loans, 100% investor occupancy status loans, high LTV loans and season ed loans. (7) Average WAC represents the weighted average coupon of the underlying collateral. (8) Average age represents the weighted average age of the underlying collateral. (9) Actual 3 - month constant prepayment rate (CPR) represents annualized CPR published in Jan 2016 for securities held as of Dec 31, 2015. (10) Expected remaining life represents the weighted average expected remaining life of the security based on expected future CPR. (11) Duration is derived from Citi Yield Book model that are dependent upon inputs and assumptions which measures how much the pri ce of an asset or liability is expected to change if interest rates move in a parallel manner. Actual results could differ materially from these estimates . In addition, different models could generate materially different estimates using similar inputs and assumptions. 30 - Year Fixed - Rate Agency MBS Selected for Prepayment Characteristics (Dollars in thousands) MBS Coupon Face Amount Fair Value Market Price Average WAC (7) Average Age (Months) (8) Actual 3-Month CPR (9) Expected Avg Remaining Life (Years) (10) Duration (Years) (11) Low Loan Balance <= $150K (1) 3.5% 103,534$ 107,108$ 103.45$ 4.09% 7 1.98% 8.0 6.0 4.0% 690,106 735,751$ 106.61 4.62% 21 8.47% 6.0 4.3 793,640$ 842,859$ 106.20$ 4.55% 20 7.63% 6.2 4.5 Low Loan Balance <= $175K (2) 3.5% 64,870$ 66,983$ 103.26$ 4.11% 8 1.30% 7.3 5.6 4.0% 876,991 932,465$ 106.33 4.61% 19 8.81% 5.6 4.2 941,861$ 999,448$ 106.12$ 4.57% 19 8.29% 5.8 4.3 HARP LTV <95% (3) 3.5% 27,890$ 28,775$ 103.17$ 4.14% 11 0.10% 5.8 5.0 4.0% 312,945 332,039$ 106.10 4.50% 35 10.79% 5.4 4.4 4.5% 47,045 51,111$ 108.64 4.86% 61 6.85% 4.7 3.1 387,880$ 411,925$ 106.20$ 4.52% 37 9.55% 5.4 4.3 HARP LTV >=95% (4) 4.0% 256,297$ 272,471$ 106.31$ 4.50% 35 8.88% 5.7 4.6 4.5% 75,965 82,810$ 109.01 5.06% 38 11.59% 4.6 3.2 332,262$ 355,281$ 106.93$ 4.63% 36 9.50% 5.5 4.3 Geographic (5) 3.5% 463,341$ 479,043$ 103.39$ 4.09% 10 2.56% 7.1 5.7 4.0% 119,257 126,918$ 106.42 4.64% 18 9.22% 5.6 4.4 582,598$ 605,961$ 104.01$ 4.20% 11 3.92% 6.8 5.4 Other Specified Pools (6) 3.5% 31,987$ 33,015$ 103.21$ 4.28% 5 4.58% 2.9 2.1 4.0% 581,648 616,801$ 106.04 4.64% 15 4.64% 4.8 3.8 5.5% 23 26$ 111.77 5.92% 96 5.92% 5.0 3.3 613,658$ 649,842$ 105.90$ 4.62% 15 5.08% 4.7 3.7 Total 3.5% 691,622$ 714,924$ 103.37$ 4.10% 9 2.35% 7.0 5.5 4.0% 2,837,244 3,016,445$ 106.32 4.60% 22 8.21% 5.5 4.2 4.5% 123,010 133,921$ 108.87 4.98% 47 9.78% 4.6 3.2 5.5% 23 26$ 111.77 5.92% 96 5.83% 5.0 3.3 3,651,899$ 3,865,316$ 105.84$ 4.52% 21 7.15% 5.8 4.4
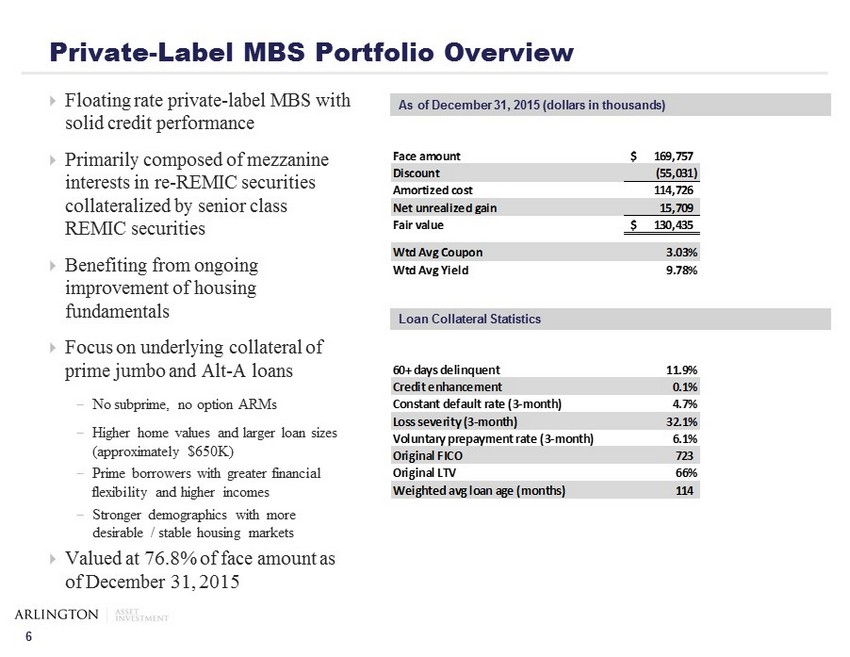
6 ; Floating rate private - label MBS with solid credit performance ; Primarily composed of mezzanine interests in re - REMIC securities collateralized by senior class REMIC securities ; Benefiting from ongoing improvement of housing fundamentals ; Focus on underlying collateral of prime jumbo and A lt - A loans - No subprime, no option ARMs - Higher home values and larger loan sizes (approximately $ 650K ) - Prime borrowers with greater financial flexibility and higher incomes - Stronger demographics with more desirable / stable housing markets ; Valued at 76.8% of face amount as of December 31, 2015 Private - Label MBS Portfolio Overview As of December 31, 2015 (dollars in thousands) Loan Collateral Statistics 60+ days delinquent 11.9% Credit enhancement 0.1% Constant default rate (3-month) 4.7% Loss severity (3-month) 32.1% Voluntary prepayment rate (3-month) 6.1% Original FICO 723 Original LTV 66% Weighted avg loan age (months) 114 Face amount 169,757$ Discount (55,031) Amortized cost 114,726 Net unrealized gain 15,709 Fair value 130,435$ Wtd Avg Coupon 3.03% Wtd Avg Yield 9.78%
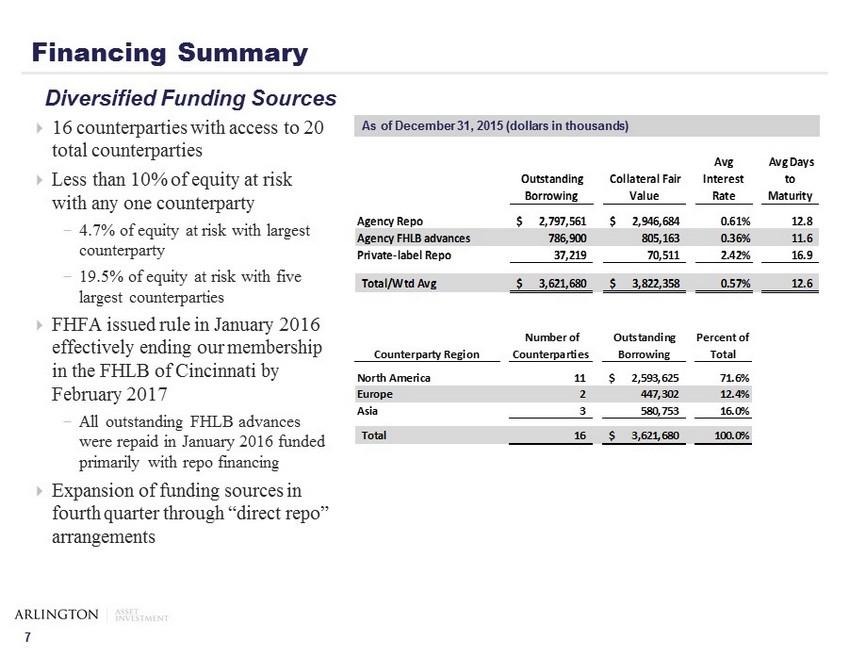
7 Financing Summary ; 16 counterparties with access to 20 total counterparties ; Less than 10% of equity at risk with any one counterparty - 4.7% of equity at risk with largest counterparty - 19.5% of equity at risk with five largest counterparties ; FHFA issued rule in January 2016 effectively ending our membership in the FHLB of Cincinnati by February 2017 - All outstanding FHLB advances were repaid in January 2016 funded primarily with repo financing ; Expansion of funding sources in fourth quarter through “direct repo” arrangements Diversified Funding Sources As of December 31, 2015 (dollars in thousands) Outstanding Borrowing Collateral Fair Value Avg Interest Rate Avg Days to Maturity Agency Repo 2,797,561$ 2,946,684$ 0.61% 12.8 Agency FHLB advances 786,900 805,163 0.36% 11.6 Private-label Repo 37,219 70,511 2.42% 16.9 Total/Wtd Avg 3,621,680$ 3,822,358$ 0.57% 12.6 Counterparty Region Number of Counterparties Outstanding Borrowing Percent of Total North America 11 2,593,625$ 71.6% Europe 2 447,302 12.4% Asia 3 580,753 16.0% Total 16 3,621,680$ 100.0%
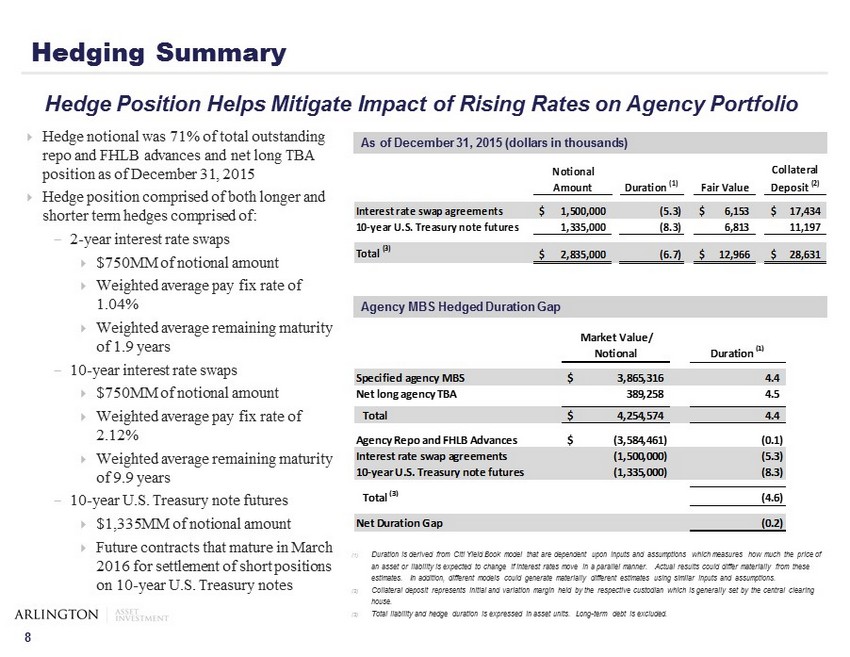
8 ; Hedge notional was 71% of total outstanding repo and FHLB advances and net long TBA position as of December 31, 2015 ; Hedge position comprised of both longer and shorter term hedges comprised of: - 2 - year interest rate swaps ; $750MM of notional amount ; Weighted average pay fix rate of 1.04% ; Weighted average remaining maturity of 1.9 years - 10 - year interest rate swaps ; $750MM of notional amount ; Weighted average pay fix rate of 2.12% ; Weighted average remaining maturity of 9.9 years - 10 - year U.S. Treasury note futures ; $1,335MM of notional amount ; Future contracts that mature in March 2016 for settlement of short positions on 10 - year U.S. Treasury notes Hedgin g Summary Hedge Position Helps Mitigate Impact of Rising Rates on Agency Portfolio As of December 31, 2015 (dollars in thousands) (1) Duration is derived from Citi Yield Book model that are dependent upon inputs and assumptions which measures how much the price of an asset or liability is expected to change if interest rates move in a parallel manner. Actual results could differ materia lly from these estimates. In addition, different models could generate materially different estimates using similar inputs and assumptions. (2) Collateral deposit represents initial and variation margin held by the respective custodian which is generally set by the cen tra l clearing house. (3) Total liability and hedge duration is expressed in asset units. Long - term debt is excluded. Agency MBS Hedged Duration Gap Market Value/ Notional Duration (1) Specified agency MBS 3,865,316$ 4.4 Net long agency TBA 389,258 4.5 Total 4,254,574$ 4.4 Agency Repo and FHLB Advances (3,584,461)$ (0.1) Interest rate swap agreements (1,500,000) (5.3) 10-year U.S. Treasury note futures (1,335,000) (8.3) Total (3) (4.6) Net Duration Gap (0.2) Notional Amount Duration (1) Fair Value Collateral Deposit (2) Interest rate swap agreements 1,500,000$ (5.3) 6,153$ 17,434$ 10-year U.S. Treasury note futures 1,335,000 (8.3) 6,813 11,197 Total (3) 2,835,000$ (6.7) 12,966$ 28,631$
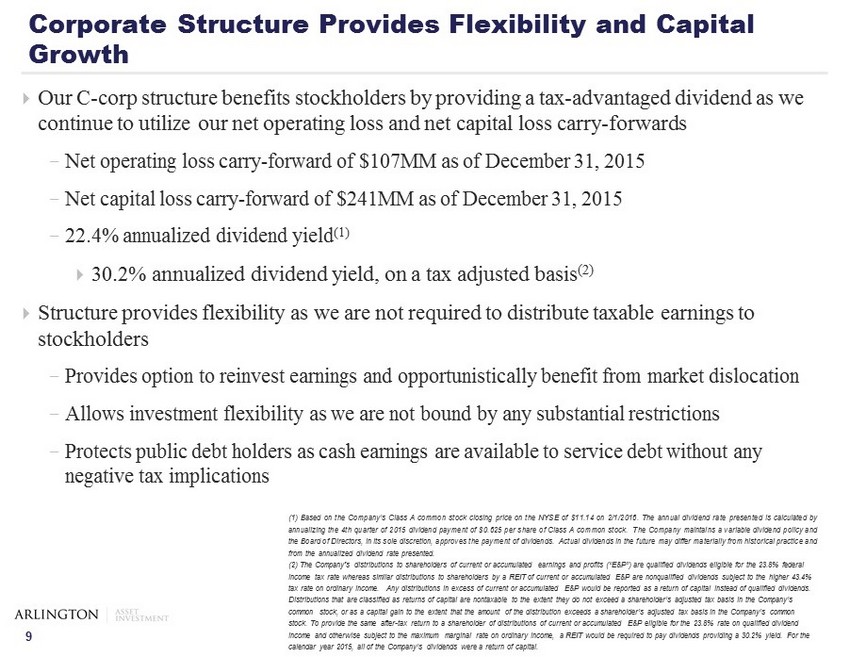
9 ; Our C - corp structure benefits stockholders by providing a tax - advantaged dividend as we continue to utilize our net operating loss and net capital loss carry - forwards - Net operating loss carry - forward of $107MM as of December 31, 2015 - Net capital loss carry - forward of $241MM as of December 31, 2015 - 22.4% annualized dividend yield (1) ; 30.2% annualized dividend yield, on a tax adjusted basis (2) ; S tructure provides flexibility as we are not required to distribute taxable earnings to stockholders - Provides option to reinvest earnings and opportunistically benefit from market dislocation - Allows investment flexibility as we are not bound by any substantial restrictions - Protects public debt holders as cash earnings are available to service debt without any negative tax implications ( 1 ) Based on the Company’s Class A common stock closing price on the NYSE of $ 11 . 14 on 2 / 1 / 2016 . The annual dividend rate presented is calculated by annualizing the 4 th quarter of 2015 dividend payment of $ 0 . 625 per share of Class A common stock . The Company maintains a variable dividend policy and the Board of Directors, in its sole discretion, approves the payment of dividends . Actual dividends in the future may differ materially from historical practice and from the annualized dividend rate presented . (2) The Company's distributions to shareholders of current or accumulated earnings and profits (“E&P”) are qualified dividends eligible for the 23 .8% federal income tax rate whereas similar distributions to shareholders by a REIT of current or accumulated E&P are nonqualified divide nds subject to the higher 43.4% tax rate on ordinary income. Any distributions in excess of current or accumulated E&P would be reported as a return of capi tal instead of qualified dividends. Distributions that are classified as returns of capital are nontaxable to the extent they do not exceed a shareholder’s adjus ted tax basis in the Company’s common stock, or as a capital gain to the extent that the amount of the distribution exceeds a shareholder’s adjusted tax bas is in the Company’s common stock. To provide the same after - tax return to a shareholder of distributions of current or accumulated E&P eligible for the 23.8% rate on qualified dividend income and otherwise subject to the maximum marginal rate on ordinary income, a REIT would be required to pay dividends providin g a 30.2% yield. For the calendar year 2015, all of the Company’s dividends were a return of capital. Corporate Structure Provides Flexibility and Capital Growth
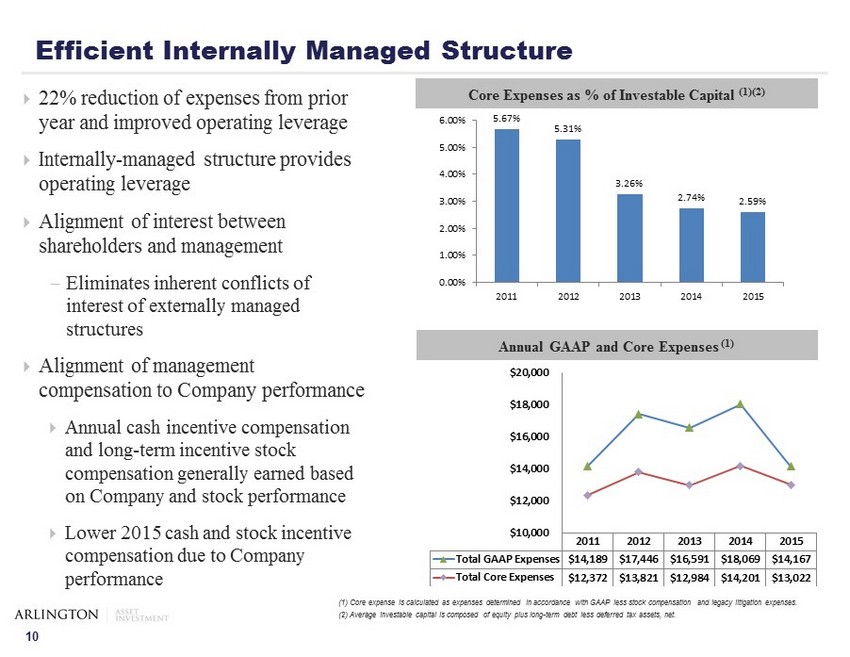
10 ; 22% reduction of expenses from prior year and improved operating leverage ; Internally - managed structure provides operating leverage ; Alignment of interest between shareholders and management - Eliminates inherent conflicts of interest of externally managed structures ; Alignment of management compensation to Company performance ; Annual cash incentive compensation and long - term incentive stock compensation generally earned based on Company and stock performance ; Lower 2015 cash and stock incentive compensation due to Company performance Core Expenses as % of Investable Capital (1)(2) Efficient Internally Managed Structure (1) Core expense is calculated as expenses determined in accordance with GAAP less stock compensation and legacy litigation e xpe nses. (2) Average investable capital is composed of equity plus long - term debt less deferred tax assets, net . Annual GAAP and Core Expenses (1) 2011 2012 2013 2014 2015 Total GAAP Expenses $14,189 $17,446 $16,591 $18,069 $14,167 Total Core Expenses $12,372 $13,821 $12,984 $14,201 $13,022 $10,000 $12,000 $14,000 $16,000 $18,000 $20,000 5.67% 5.31% 3.26% 2.74% 2.59% 0.00% 1.00% 2.00% 3.00% 4.00% 5.00% 6.00% 2011 2012 2013 2014 2015

11 Appendix

12 Balance Sheet (1) Represents shares of Class A common stock and Class B common stock outstanding plus vested restricted stock units convertible into Class A common stock less unvested restricted Class A common stock. (2) Tangible book value is calculated as total equity less deferred tax asset. (in thousands, except per share data) December 31, 2015 September 30, 2015 ASSETS: Cash 36,987$ 13,529$ Sold securities receivable - 28,035 Interest receivable 11,936 11,459 Private-label MBS 130,435 134,789 Agency MBS 3,865,316 3,790,044 Deposits 29,429 87,258 Deferred tax asset 97,530 103,319 Derivatives 12,991 3,863 Other assets 20,182 9,938 Total assets 4,204,806$ 4,182,234$ LIABILITIES AND EQUITY Liabilities: Repurchase agreements 2,834,780$ 3,153,756$ FHLB advances 786,900 308,500 Dividend payable 14,504 14,553 Derivatives 553 53,514 Purchased securities payable - 92,107 Accrued expenses and other liabilities 8,738 6,496 Long-term debt 75,300 75,300 Total liabilities 3,720,775 3,704,226 Equity: Common stock and paid-in capital 1,898,315 1,897,702 Accumulated other comprehensive income 12,371 11,334 Accumlated deficit (1,426,655) (1,431,028) Total equity 484,031 478,008 Total liabilities and equity 4,204,806$ 4,182,234$ Common shares outstanding (1) 22,994 23,042 GAAP book value per share 21.05$ 20.75$ Tangible book value per share (2) 16.81$ 16.26$
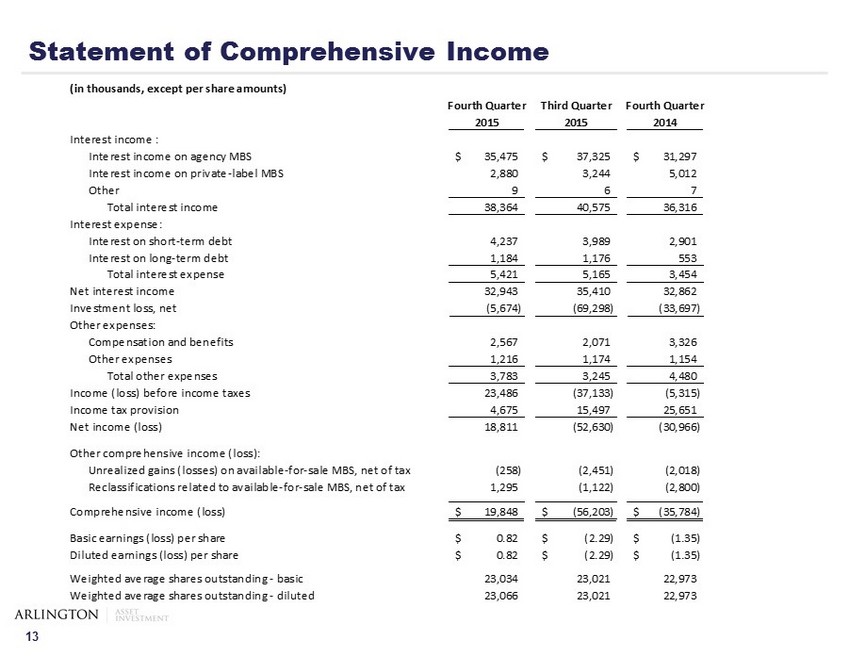
13 Statement of Comprehensive Income (in thousands, except per share amounts) Fourth Quarter Third Quarter Fourth Quarter 2015 2015 2014 Interest income : Interest income on agency MBS 35,475$ 37,325$ 31,297$ Interest income on private-label MBS 2,880 3,244 5,012 Other 9 6 7 Total interest income 38,364 40,575 36,316 Interest expense: Interest on short-term debt 4,237 3,989 2,901 Interest on long-term debt 1,184 1,176 553 Total interest expense 5,421 5,165 3,454 Net interest income 32,943 35,410 32,862 Investment loss, net (5,674) (69,298) (33,697) Other expenses: Compensation and benefits 2,567 2,071 3,326 Other expenses 1,216 1,174 1,154 Total other expenses 3,783 3,245 4,480 Income (loss) before income taxes 23,486 (37,133) (5,315) Income tax provision 4,675 15,497 25,651 Net income (loss) 18,811 (52,630) (30,966) Other comprehensive income (loss): Unrealized gains (losses) on available-for-sale MBS, net of tax (258) (2,451) (2,018) Reclassifications related to available-for-sale MBS, net of tax 1,295 (1,122) (2,800) Comprehensive income (loss) 19,848$ (56,203)$ (35,784)$ Basic earnings (loss) per share 0.82$ (2.29)$ (1.35)$ Diluted earnings (loss) per share 0.82$ (2.29)$ (1.35)$ Weighted average shares outstanding - basic 23,034 23,021 22,973 Weighted average shares outstanding - diluted 23,066 23,021 22,973

14 Core Operating Income (1 ) ( 1) Core operating income is a non - GAAP measure. This non - GAAP core operating income measurement is used by management to analyz e and assess the Company’s operating results on its portfolio and assist with the determination of the appropriate level of dividends. The Co mpa ny believes that this non - GAAP measurement assists investors in understanding the impact of these non - core items and non - cash expenses on our performance and p rovides additional clarity around our earnings capacity and trends. A limitation of utilizing this non - GAAP measure is that the GAAP accounting effects of these events do in fact reflect the underlying financial results of our business and these effects should not be ignored in evaluating and analyzing our financia l r esults. Therefore, the Company believes net income on a GAAP basis and core operating income on a non - GAAP basis should be considered together. (in thousands, except per share amounts) Fourth Quarter Third Quarter Fourth Quarter 2015 2015 2014 GAAP net income (loss) 18,811$ (52,630)$ (30,966)$ Adjustments: Non-cash income tax provision 5,480 14,729 25,254 Stock compensation 853 (189) 834 Net realized and unrealized loss (gain) on trading MBS and derivative instruments 3,879 70,275 38,022 Realized gain on private-label MBS (291) (969) (4,431) Other-than-temporary impairment charges 2,417 - 298 Non-GAAP core operating income excluding gain on private-label MBS 31,149 31,216 29,011 Realized gain on private-label MBS 291 969 4,431 Other-than-temporary impairment charges realilzed upon sale or repayment - ( 1,222 ) ( 1,154 ) Purchase discount accretion of private-label MBS realized upon sale or repayment 485 1,912 1,453 Non-cash interest income related to purchase discount accretion of private-label MBS ( 1,633 ) ( 1,797 ) ( 2,315 ) Non-GAAP core operating income 30,292$ 31,078$ 31,426$ Non-GAAP core operating income excluding gain on private-label MBS per share 1.35$ 1.35$ 1.24$ Non-GAAP core operating income per share 1.31$ 1.35$ 1.35$ Weighted average diluted shares outstanding 23,066 23,065 23,316
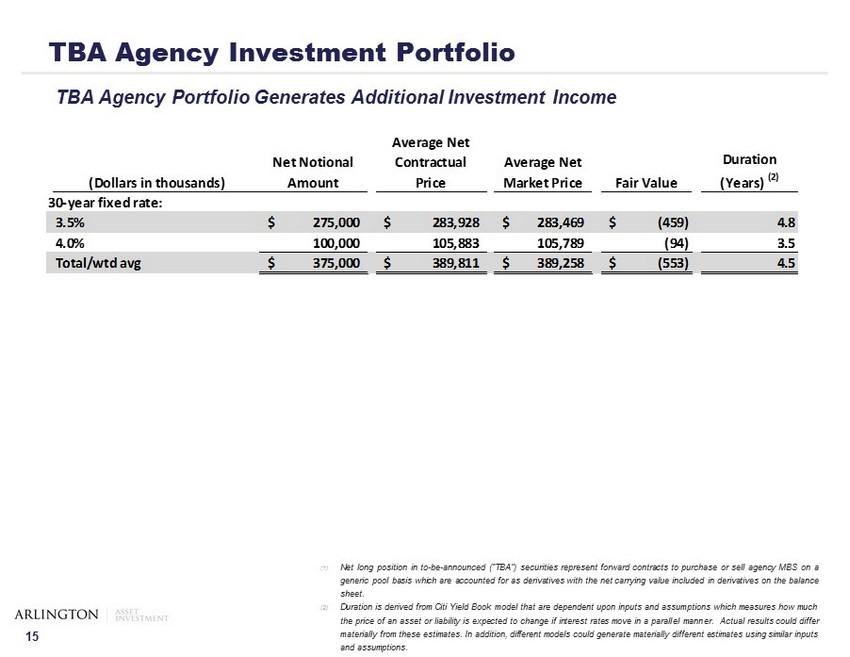
15 TBA Agency Investment Portfolio (1) Net long position in to - be - announced (“TBA”) securities represent forward contracts to purchase or sell agency MBS on a generic pool basis which are accounted for as derivatives with the net carrying value included in derivatives on the balance sheet . (2) Duration is derived from Citi Yield Book model that are dependent upon inputs and assumptions which measures how much the price of an asset or liability is expected to change if interest rates move in a parallel manner . Actual results could differ materially from these estimates . In addition, different models could generate materially different estimates using similar inputs and assumptions . TBA Agency Portfolio Generates Additional Investment Income (Dollars in thousands) Net Notional Amount Average Net Contractual Price Average Net Market Price Fair Value Duration (Years) (2) 30-year fixed rate: 3.5% 275,000$ 283,928$ 283,469$ (459)$ 4.8 4.0% 100,000 105,883 105,789 (94) 3.5 Total/wtd avg 375,000$ 389,811$ 389,258$ (553)$ 4.5
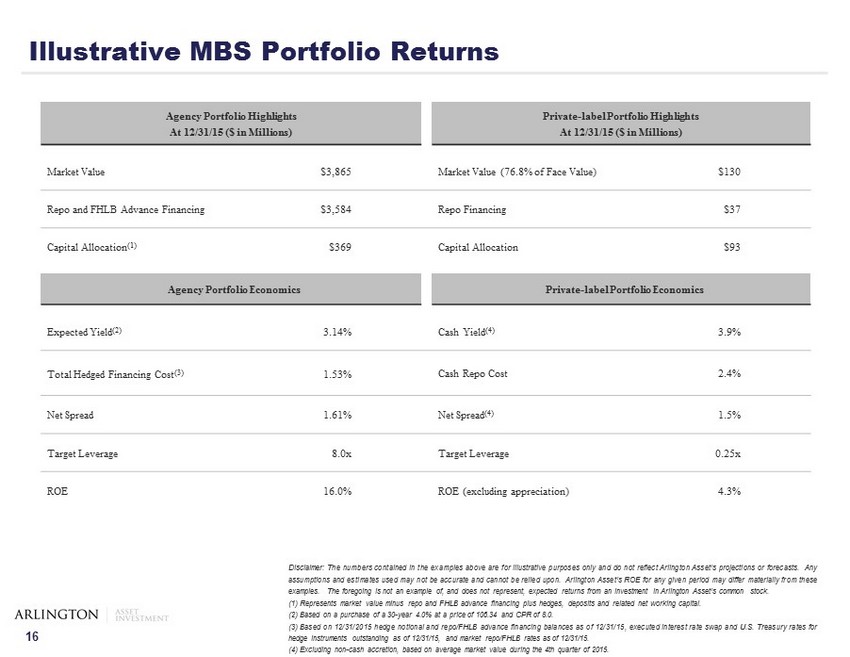
16 Disclaimer : The numbers contained in the examples above are for illustrative purposes only and do not reflect Arlington Asset’s projections or forecasts . Any assumptions and estimates used may not be accurate and cannot be relied upon . Arlington Asset’s ROE for any given period may differ materially from these examples . The foregoing is not an example of, and does not represent, expected returns from an investment in Arlington Asset’s common stock . ( 1 ) Represents market value minus repo and FHLB advance financing plus hedges, deposits and related net working capital . ( 2 ) Based on a purchase of a 30 - year 4 . 0 % at a price of 106 . 34 and CPR of 8 . 0 . ( 3 ) Based on 12 / 31 / 2015 hedge notional and repo/FHLB advance financing balances as of 12 / 31 / 15 , executed interest rate swap and U . S . Treasury rates for hedge instruments outstanding as of 12 / 31 / 15 , and market repo/FHLB rates as of 12 / 31 / 15 . ( 4 ) Excluding non - cash accretion, based on average market value during the 4 th quarter of 2015 . Agency Portfolio Highlights At 12/31/15 ($ in Millions) Private - label Portfolio Highlights At 12/31/15 ($ in Millions) Market Value $3,865 Market Value (76.8% of Face Value) $130 Repo and FHLB Advance Financing $3,584 Repo Financing $37 Capital Allocation (1) $369 Capital Allocation $93 Agency Portfolio Economics Private - label Portfolio Economics Expected Yield (2) 3.14% Cash Yield (4) 3.9% Total Hedged Financing Cost (3) 1.53% Cash Repo Cost 2.4% Net Spread 1.61% Net Spread (4) 1.5% Target Leverage 8.0x Target Leverage 0.25x ROE 16.0% ROE (excluding appreciation) 4.3% Illustrative MBS Portfolio Returns
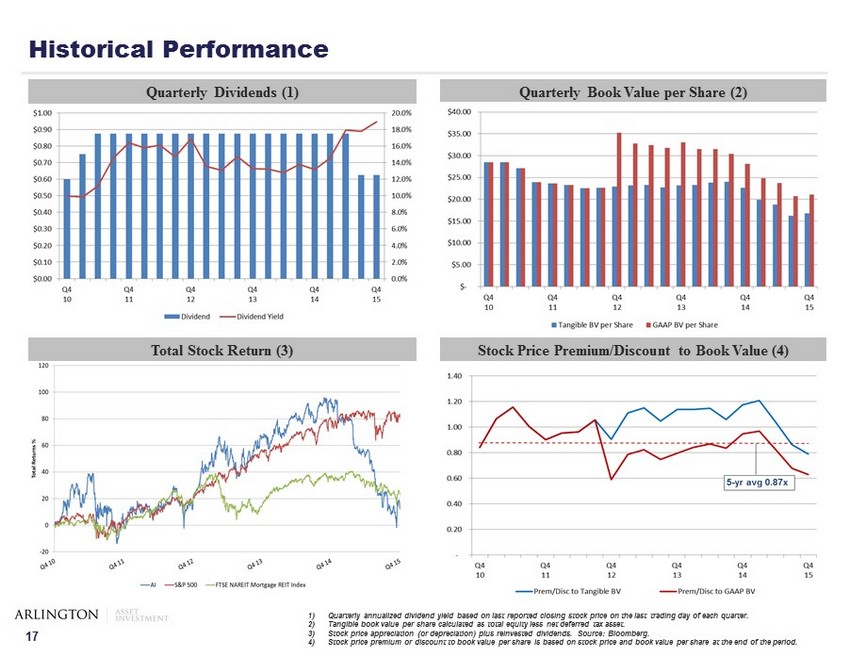
17 Historical Performance Quarterly Dividends (1) Quarterly Book Value per Share (2) Stock Price Premium/Discount to Book Value (4) 1) Quarterly annualized dividend yield based on last reported closing stock price on the last trading day of each quarter . 2) Tangible book value per share calculated as total equity less net deferred tax asset. 3) Stock price appreciation (or depreciation) plus reinvested dividends. Source: Bloomberg. 4) Stock price premium or discount to book value per share is based on stock price and book value per share at the end of the pe rio d. Total Stock Return (3)
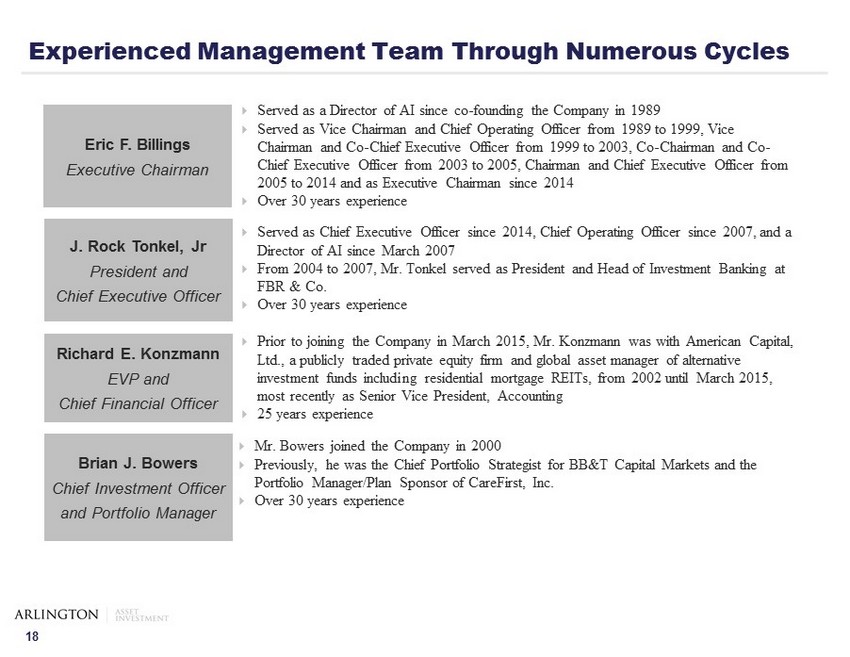
18 ; Served as a Director of AI since co - founding the Company in 1989 ; Served as Vice Chairman and Chief Operating Officer from 1989 to 1999, Vice Chairman and Co - Chief Executive Officer from 1999 to 2003, Co - Chairman and Co - Chief Executive Officer from 2003 to 2005, Chairman and Chief Executive Officer from 2005 to 2014 and as Executive Chairman since 2014 ; Over 30 years experience ; Served as Chief Executive Officer since 2014, Chief Operating Officer since 2007, and a Director of AI since March 2007 ; From 2004 to 2007, Mr. Tonkel served as President and Head of Investment Banking at FBR & Co. ; Over 30 years experience J. Rock Tonkel, Jr President and Chief Executive Officer Richard E. Konzmann EVP and Chief Financial Officer Brian J. Bowers Chief Investment Officer and Portfolio Manager ; Prior to joining the Company in March 2015, Mr. Konzmann was with American Capital, Ltd., a publicly traded private equity firm and global asset manager of alternative investment funds including residential mortgage REITs, from 2002 until March 2015, most recently as Senior Vice President, Accounting ; 2 5 years experience ; Mr. Bowers joined the Company in 2000 ; Previously, he was the Chief Portfolio Strategist for BB&T Capital Markets and the Portfolio Manager/Plan Sponsor of CareFirst, Inc. ; Over 30 years experience Experienced Management Team Through Numerous Cycles Eric F. Billings Executive Chairman