Attached files
| file | filename |
|---|---|
| EX-99.1 - EX-99.1 - ARCBEST CORP /DE/ | a16-3190_1ex99d1.htm |
| 8-K - CURRENT REPORT OF MATERIAL EVENTS OR CORPORATE CHANGES - ARCBEST CORP /DE/ | a16-3190_18k.htm |
Exhibit 99.2
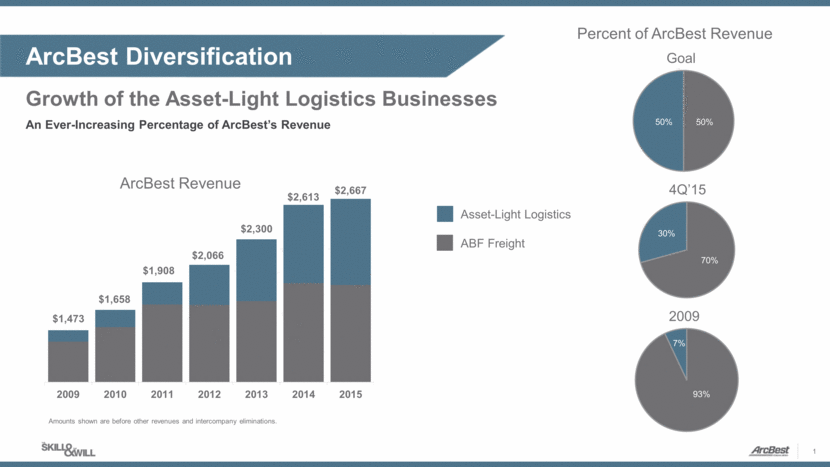
Amounts shown are before other revenues and intercompany eliminations. ArcBest Diversification 1 An Ever-Increasing Percentage of ArcBest’s Revenue Growth of the Asset-Light Logistics Businesses $1,658 $1,908 $2,066 $2,300 $2,613 $2,667 93% 30% 70% 50% 50% Asset-Light Logistics ABF Freight Percent of ArcBest Revenue ArcBest Revenue 2009 2010 2011 2012 2013 2014 2015 $1,473 Goal 4Q’15 2009 7 %

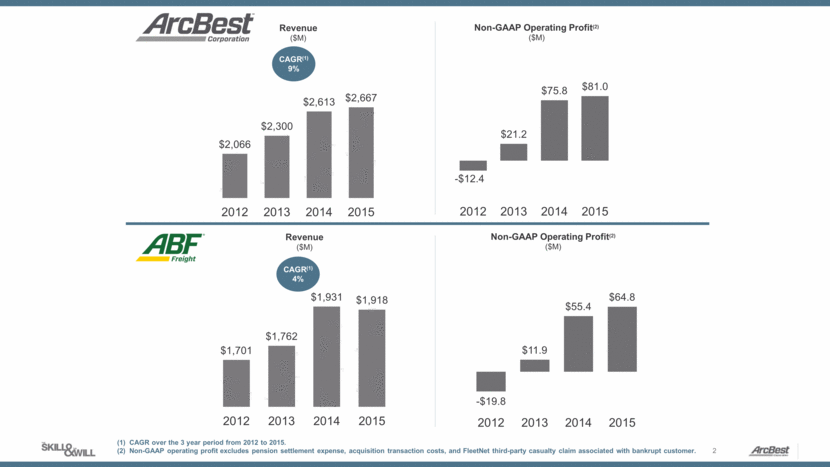
2 Revenue ($M) CAGR(1) 4% Non-GAAP Operating Profit(2) ($M) Revenue ($M) CAGR(1) 9% Non-GAAP Operating Profit(2) ($M) (1) CAGR over the 3 year period from 2012 to 2015. (2) Non-GAAP operating profit excludes pension settlement expense, acquisition transaction costs, and FleetNet third-party casualty claim associated with bankrupt customer.

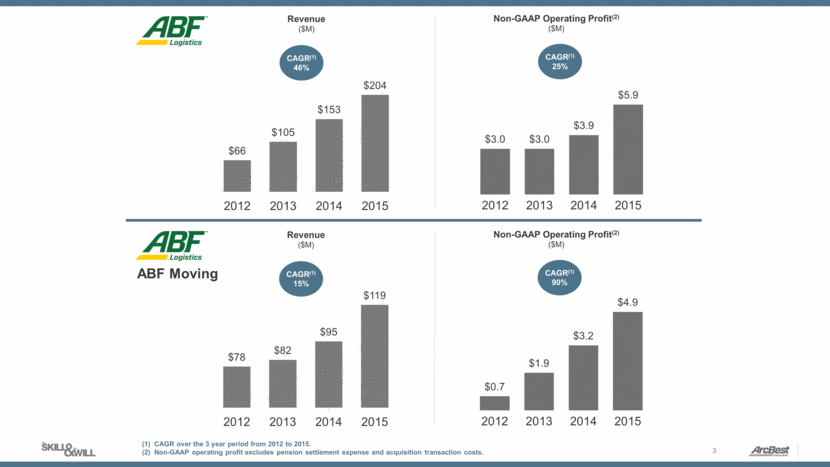
3 ABF Moving Revenue ($M) CAGR(1) 15% CAGR(1) 90% Non-GAAP Operating Profit(2) ($M) Revenue ($M) CAGR(1) 46% CAGR(1) 25% Non-GAAP Operating Profit(2) ($M) (1) CAGR over the 3 year period from 2012 to 2015. (2) Non-GAAP operating profit excludes pension settlement expense and acquisition transaction costs.

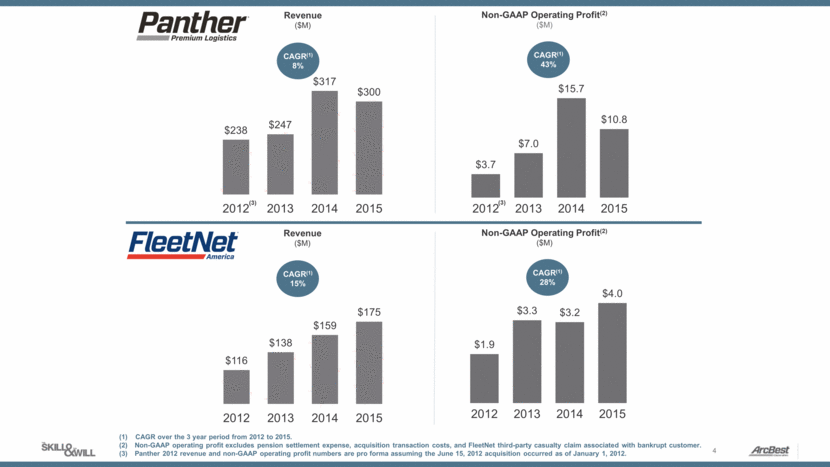
4 Revenue ($M) CAGR(1) 8% CAGR(1) 43% Non-GAAP Operating Profit(2) ($M) Revenue ($M) CAGR(1) 15% CAGR(1) 28% Non-GAAP Operating Profit(2) ($M) (1) CAGR over the 3 year period from 2012 to 2015. Non-GAAP operating profit excludes pension settlement expense, acquisition transaction costs, and FleetNet third-party casualty claim associated with bankrupt customer. Panther 2012 revenue and non-GAAP operating profit numbers are pro forma assuming the June 15, 2012 acquisition occurred as of January 1, 2012. (3) (3)

