Attached files
| file | filename |
|---|---|
| 8-K - 8-K - MYRIAD GENETICS INC | d131466d8k.htm |
| EX-99.1 - EX-99.1 - MYRIAD GENETICS INC | d131466dex991.htm |

Myriad Genetics Fiscal Second Quarter 2016 Earnings Call 02/02/2016 Exhibit 99.2
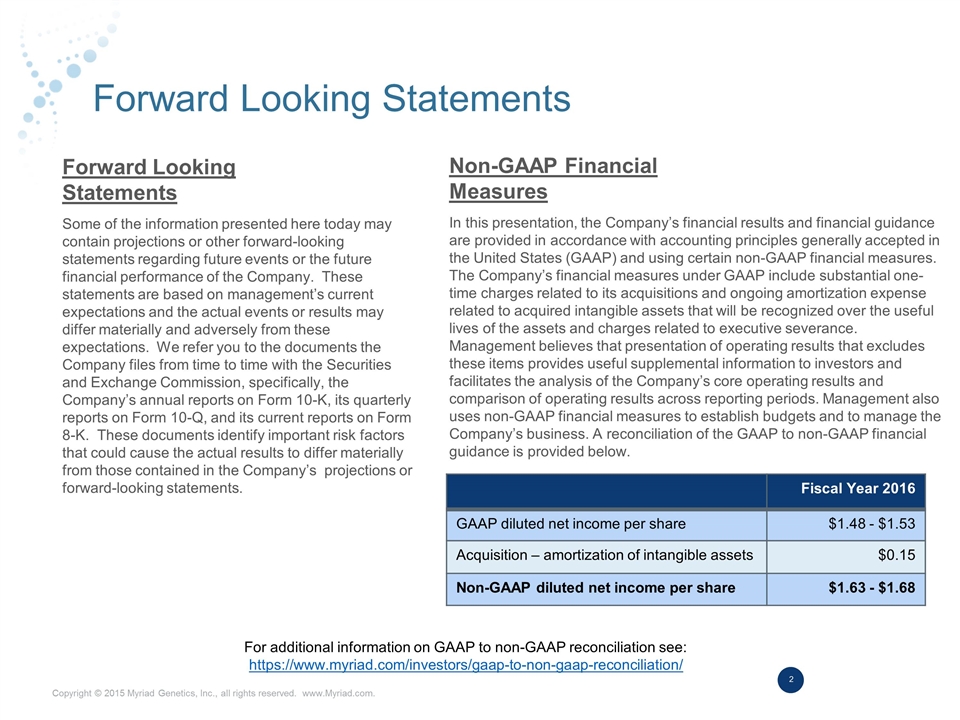
Forward Looking Statements Some of the information presented here today may contain projections or other forward-looking statements regarding future events or the future financial performance of the Company. These statements are based on management’s current expectations and the actual events or results may differ materially and adversely from these expectations. We refer you to the documents the Company files from time to time with the Securities and Exchange Commission, specifically, the Company’s annual reports on Form 10-K, its quarterly reports on Form 10-Q, and its current reports on Form 8-K. These documents identify important risk factors that could cause the actual results to differ materially from those contained in the Company’s projections or forward-looking statements. In this presentation, the Company’s financial results and financial guidance are provided in accordance with accounting principles generally accepted in the United States (GAAP) and using certain non-GAAP financial measures. The Company’s financial measures under GAAP include substantial one-time charges related to its acquisitions and ongoing amortization expense related to acquired intangible assets that will be recognized over the useful lives of the assets and charges related to executive severance. Management believes that presentation of operating results that excludes these items provides useful supplemental information to investors and facilitates the analysis of the Company’s core operating results and comparison of operating results across reporting periods. Management also uses non-GAAP financial measures to establish budgets and to manage the Company’s business. A reconciliation of the GAAP to non-GAAP financial guidance is provided below. Forward Looking Statements Non-GAAP Financial Measures Fiscal Year 2016 GAAP diluted net income per share $1.48 - $1.53 Acquisition – amortization of intangible assets $0.15 Non-GAAP diluted net income per share $1.63 - $1.68 For additional information on GAAP to non-GAAP reconciliation see: https://www.myriad.com/investors/gaap-to-non-gaap-reconciliation/
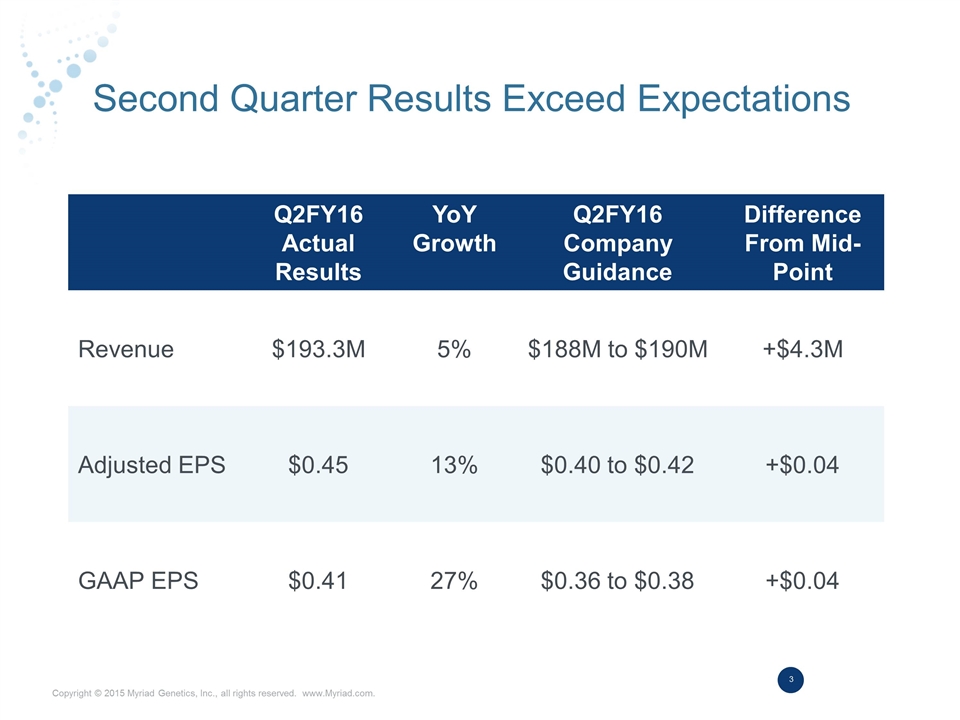
Second Quarter Results Exceed Expectations Q2FY16 Actual Results YoY Growth Q2FY16 Company Guidance Difference From Mid-Point Revenue $193.3M 5% $188M to $190M +$4.3M Adjusted EPS $0.45 13% $0.40 to $0.42 +$0.04 GAAP EPS $0.41 27% $0.36 to $0.38 +$0.04
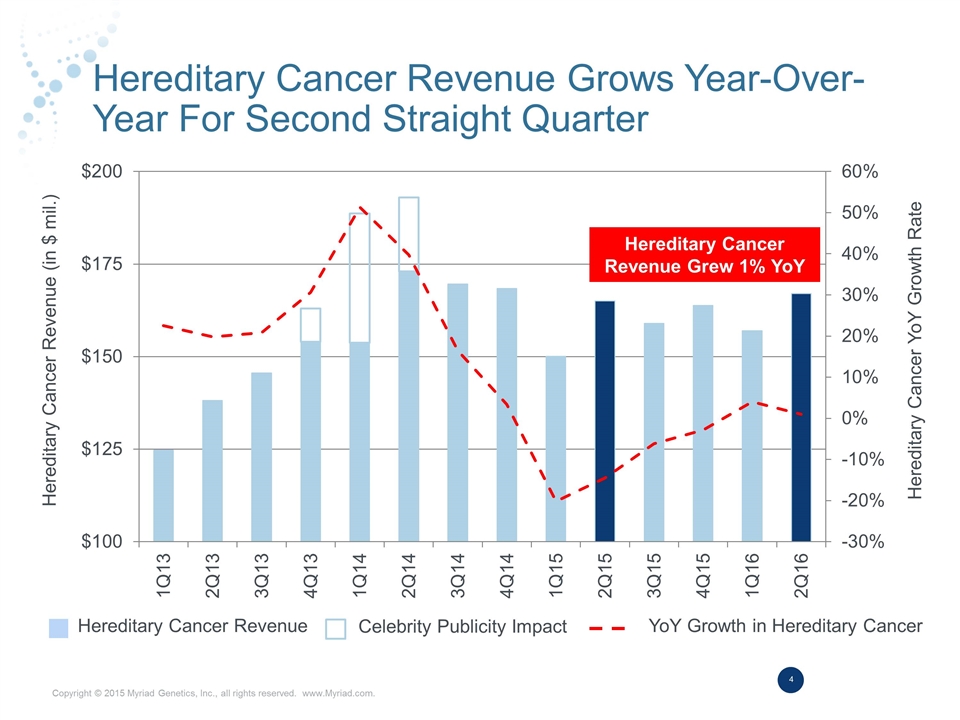
Hereditary Cancer Revenue Grows Year-Over-Year For Second Straight Quarter Hereditary Cancer Revenue Grew 1% YoY Hereditary Cancer Revenue Celebrity Publicity Impact YoY Growth in Hereditary Cancer Hereditary Cancer Revenue (in $ mil.) Hereditary Cancer YoY Growth Rate
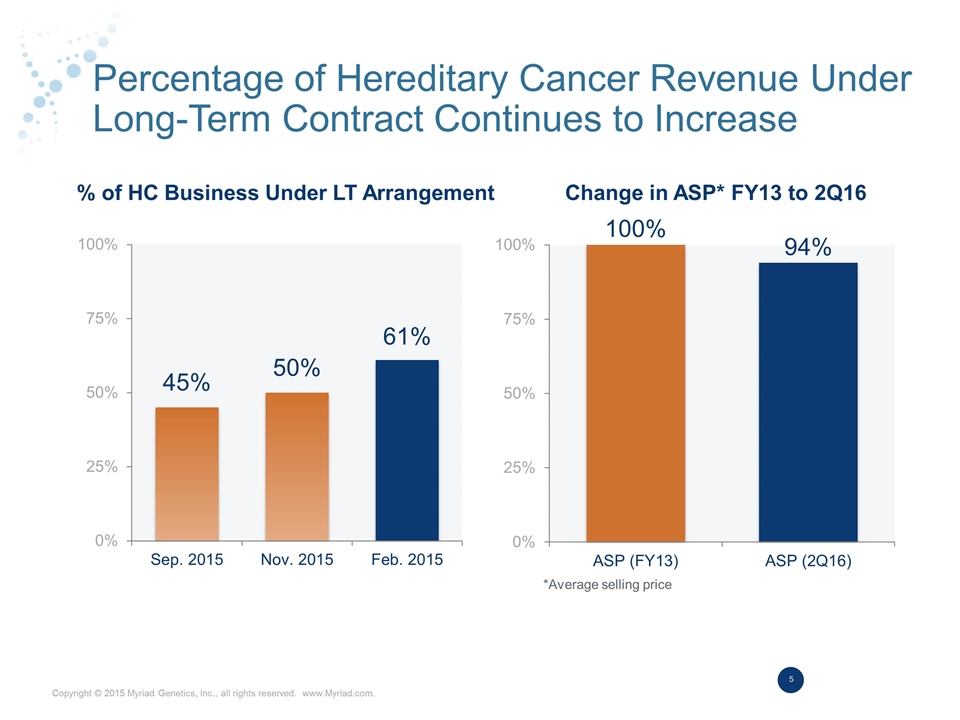
Percentage of Hereditary Cancer Revenue Under Long-Term Contract Continues to Increase % of HC Business Under LT Arrangement Change in ASP* FY13 to 2Q16 *Average selling price
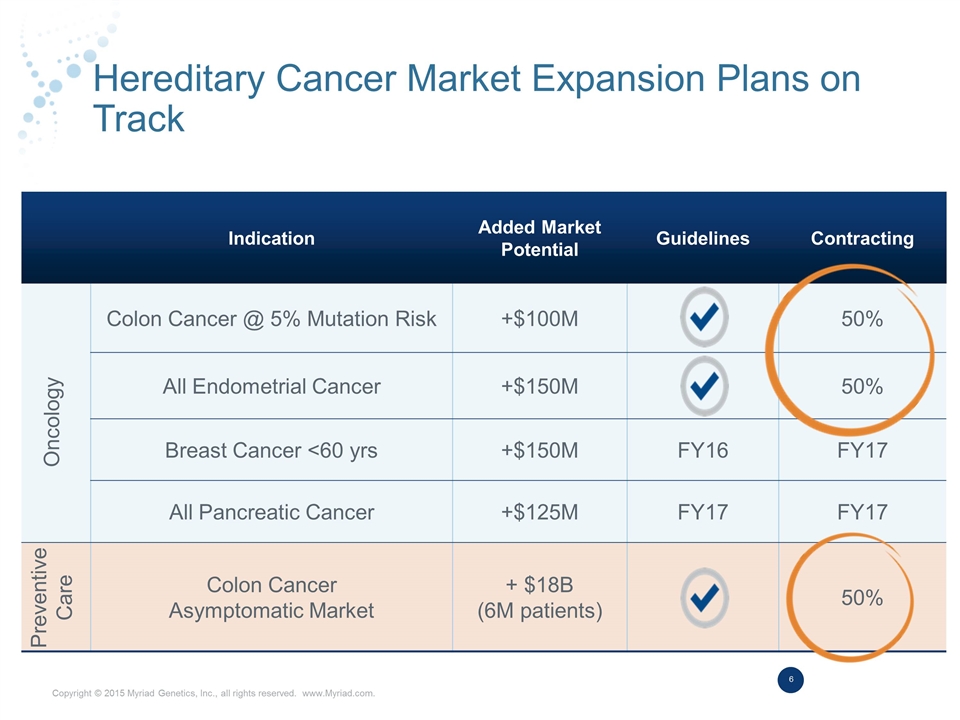
Hereditary Cancer Market Expansion Plans on Track Indication Added Market Potential Guidelines Contracting Colon Cancer @ 5% Mutation Risk +$100M 50% All Endometrial Cancer +$150M 50% Breast Cancer <60 yrs +$150M FY16 FY17 All Pancreatic Cancer +$125M FY17 FY17 Colon Cancer Asymptomatic Market + $18B (6M patients) 50% Oncology Preventive Care
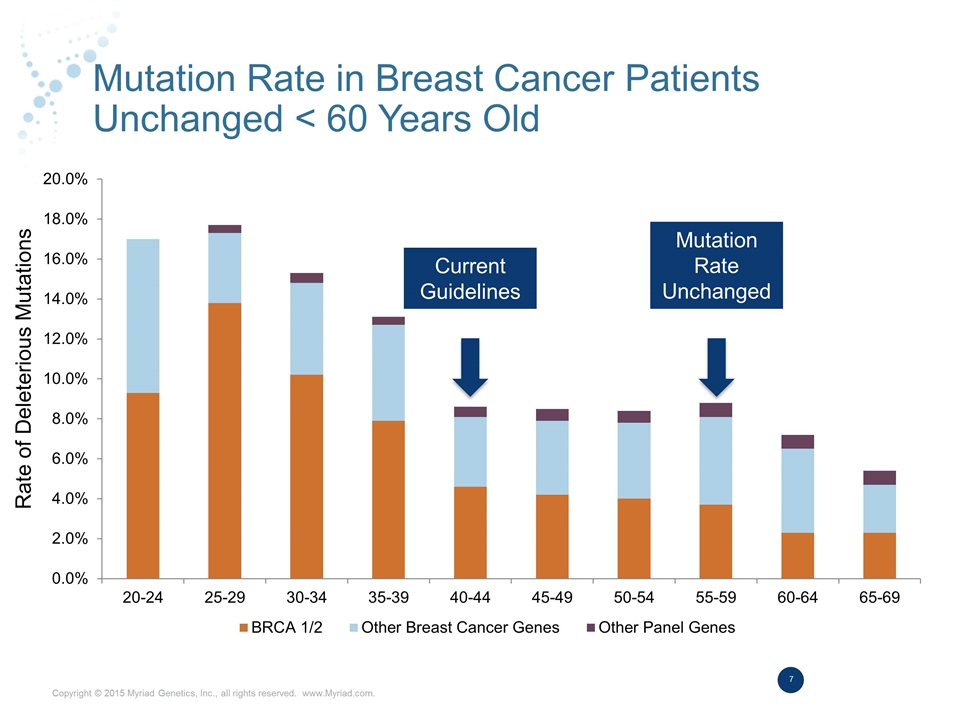
Mutation Rate in Breast Cancer Patients Unchanged < 60 Years Old Current Guidelines Rate of Deleterious Mutations Mutation Rate Unchanged
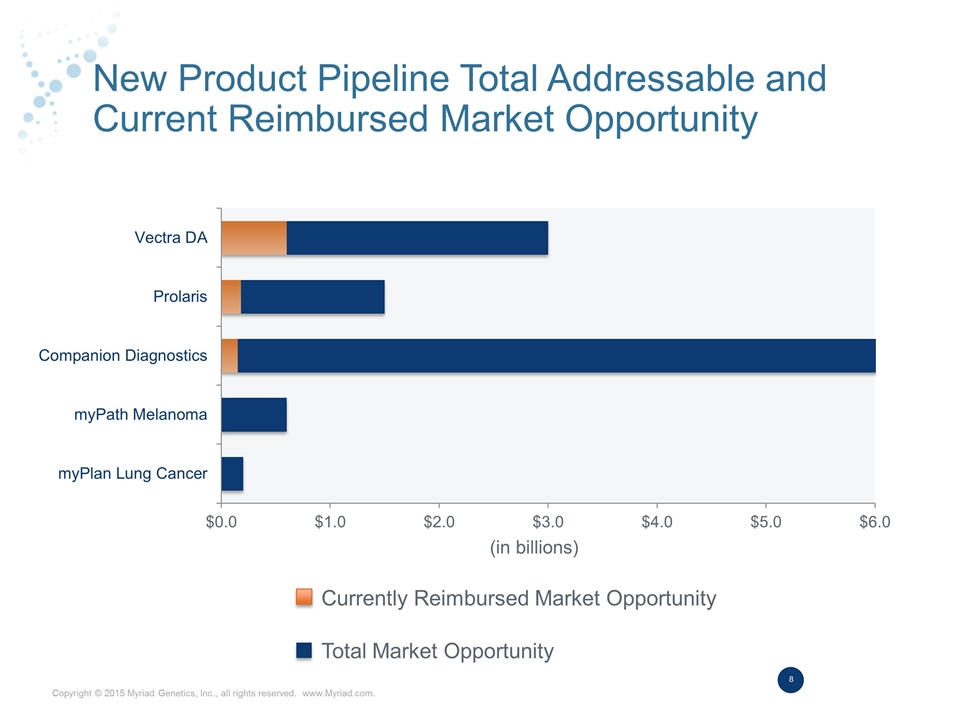
New Product Pipeline Total Addressable and Current Reimbursed Market Opportunity Currently Reimbursed Market Opportunity Total Market Opportunity (in billions)
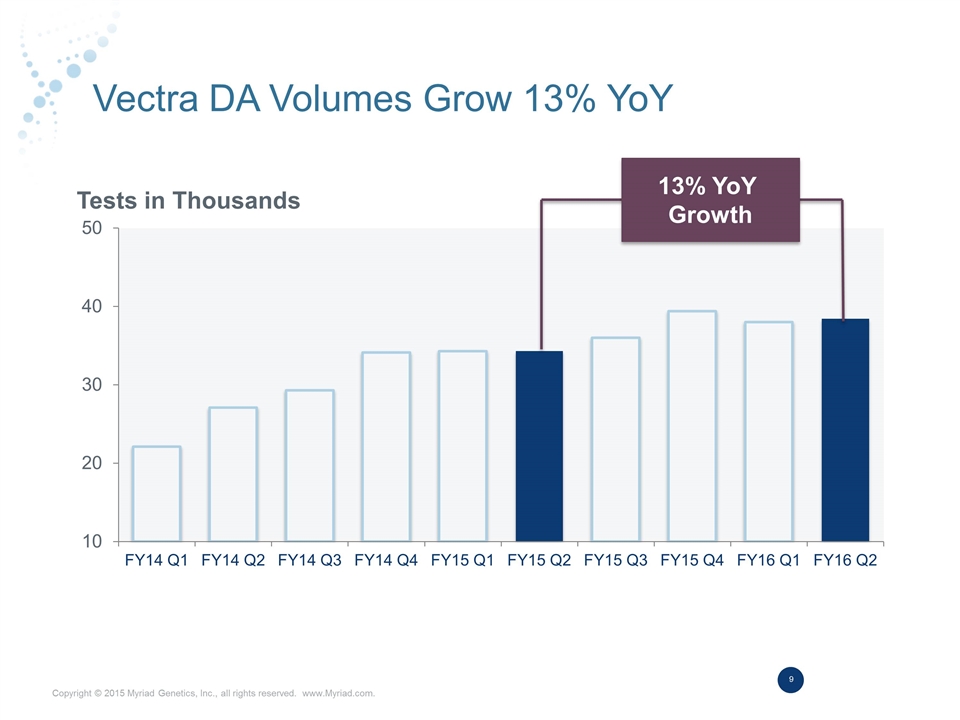
Vectra DA Volumes Grow 13% YoY Tests in Thousands 13% YoY Growth
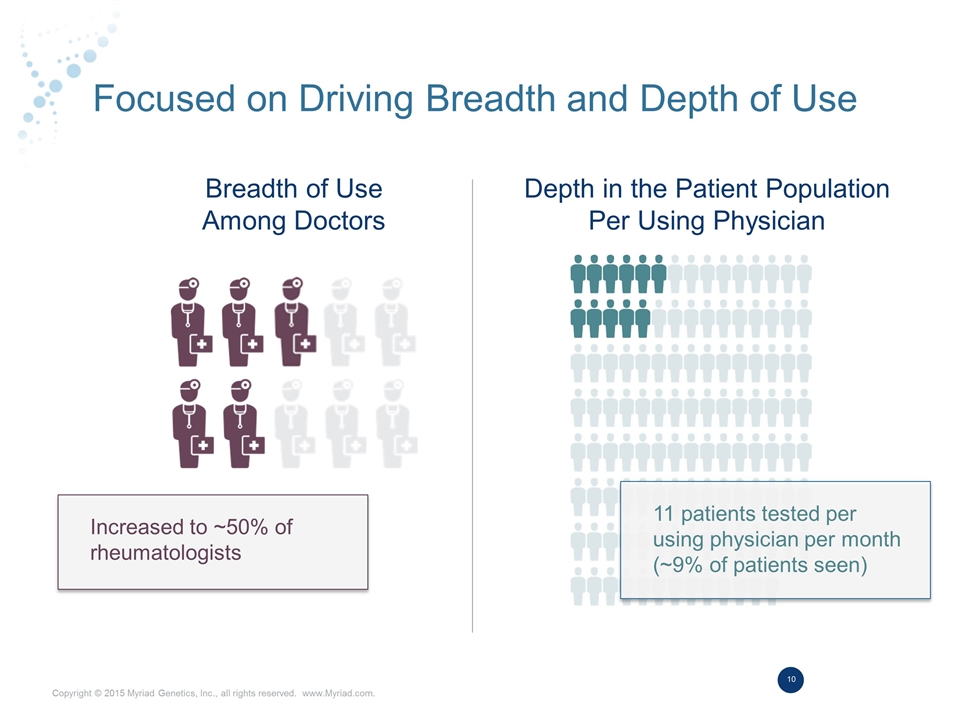
Focused on Driving Breadth and Depth of Use Breadth of Use Among Doctors Depth in the Patient Population Per Using Physician 11 patients tested per using physician per month (~9% of patients seen) Increased to ~50% of rheumatologists
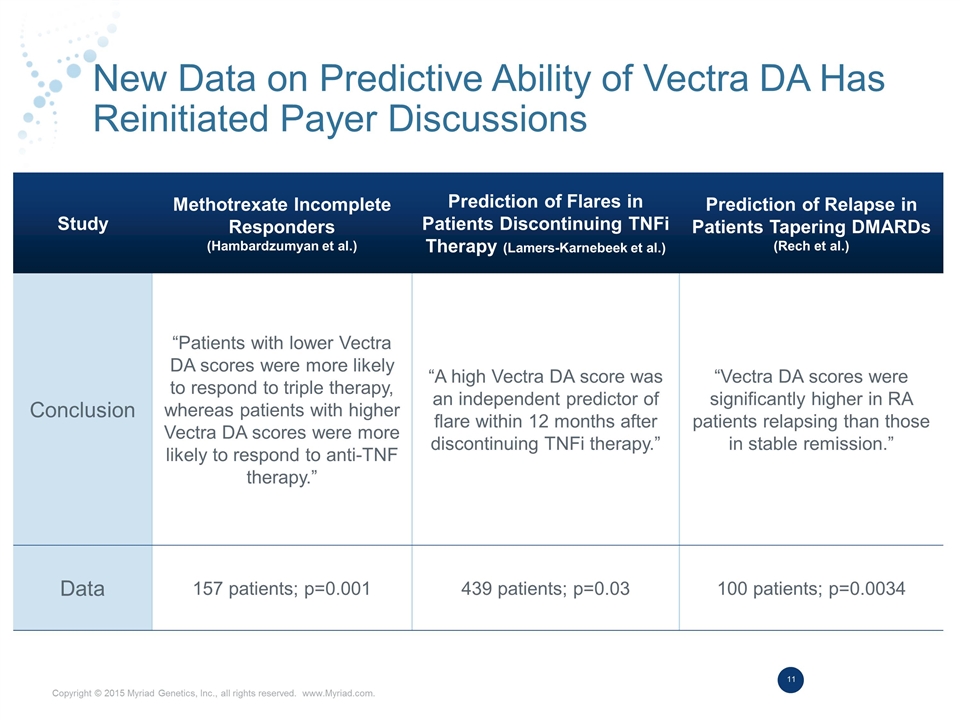
New Data on Predictive Ability of Vectra DA Has Reinitiated Payer Discussions Study Methotrexate Incomplete Responders (Hambardzumyan et al.) Prediction of Flares in Patients Discontinuing TNFi Therapy (Lamers-Karnebeek et al.) Prediction of Relapse in Patients Tapering DMARDs (Rech et al.) Conclusion “Patients with lower Vectra DA scores were more likely to respond to triple therapy, whereas patients with higher Vectra DA scores were more likely to respond to anti-TNF therapy.” “A high Vectra DA score was an independent predictor of flare within 12 months after discontinuing TNFi therapy.” “Vectra DA scores were significantly higher in RA patients relapsing than those in stable remission.” Data 157 patients; p=0.001 439 patients; p=0.03 100 patients; p=0.0034
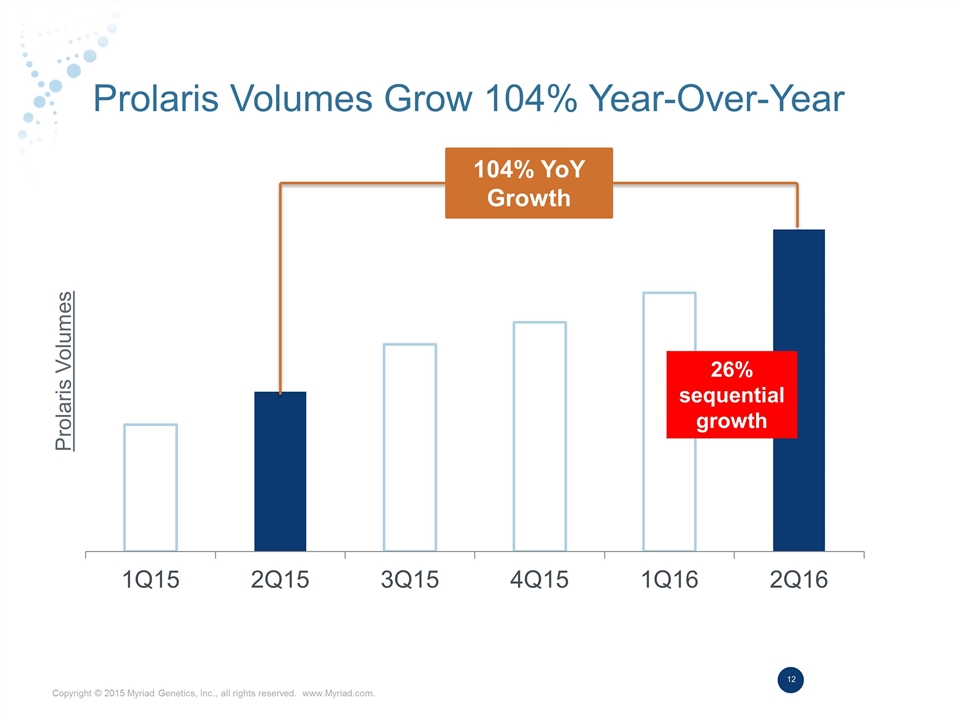
Prolaris Volumes Grow 104% Year-Over-Year Prolaris Volumes 26% sequential growth 104% YoY Growth
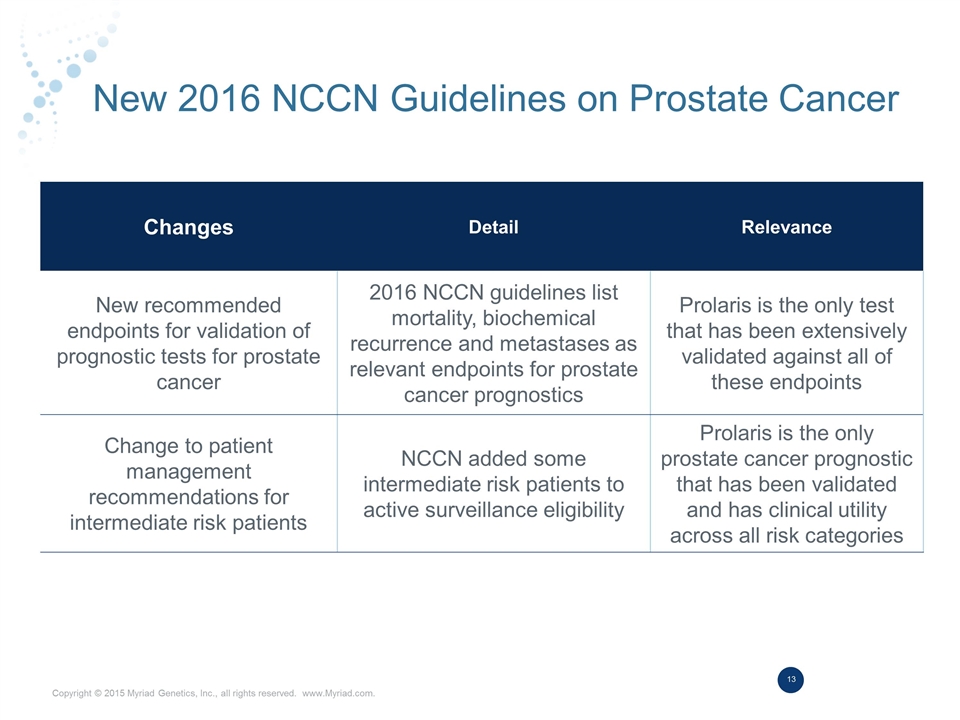
New 2016 NCCN Guidelines on Prostate Cancer Changes Detail Relevance New recommended endpoints for validation of prognostic tests for prostate cancer 2016 NCCN guidelines list mortality, biochemical recurrence and metastases as relevant endpoints for prostate cancer prognostics Prolaris is the only test that has been extensively validated against all of these endpoints Change to patient management recommendations for intermediate risk patients NCCN added some intermediate risk patients to active surveillance eligibility Prolaris is the only prostate cancer prognostic that has been validated and has clinical utility across all risk categories
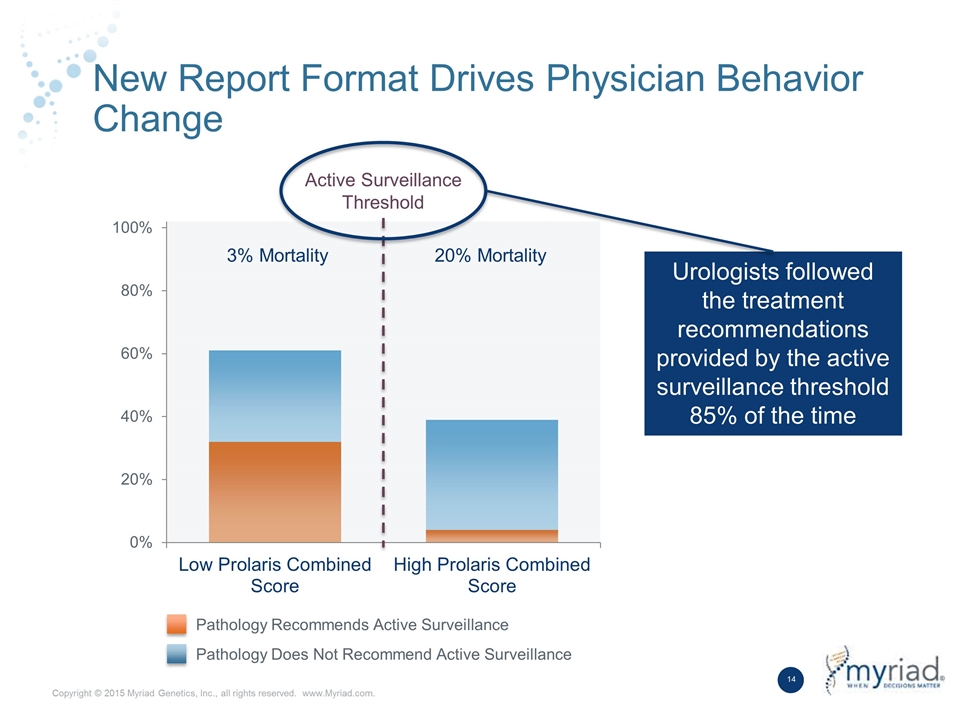
New Report Format Drives Physician Behavior Change Active Surveillance Threshold 3% Mortality 20% Mortality Urologists followed the treatment recommendations provided by the active surveillance threshold 85% of the time Pathology Recommends Active Surveillance Pathology Does Not Recommend Active Surveillance
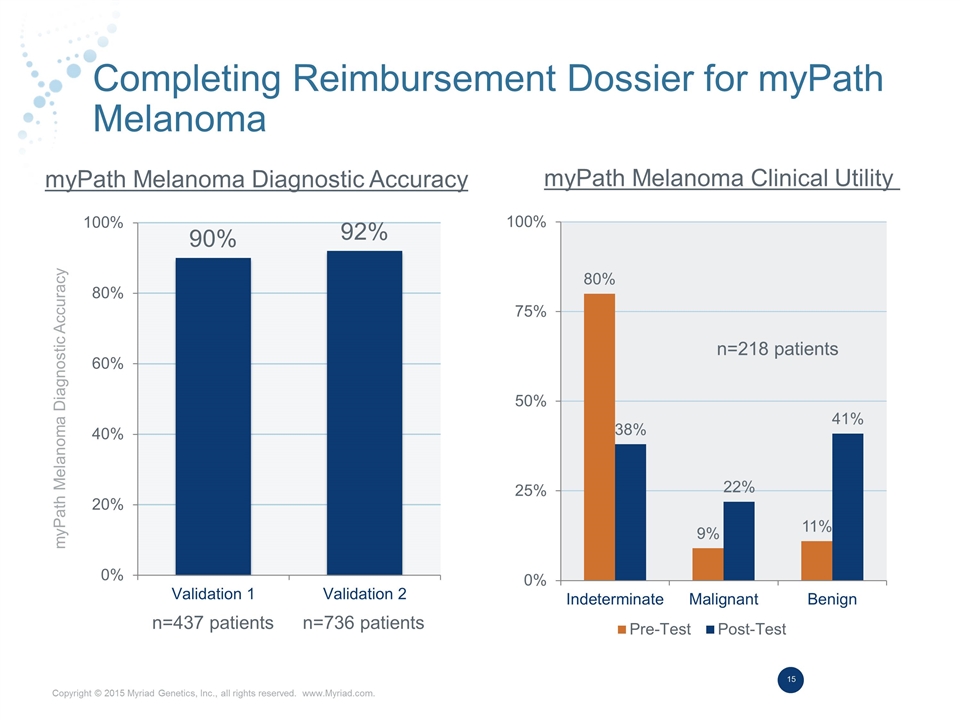
Completing Reimbursement Dossier for myPath Melanoma myPath Melanoma Diagnostic Accuracy myPath Melanoma Diagnostic Accuracy myPath Melanoma Clinical Utility n=437 patients n=736 patients n=218 patients
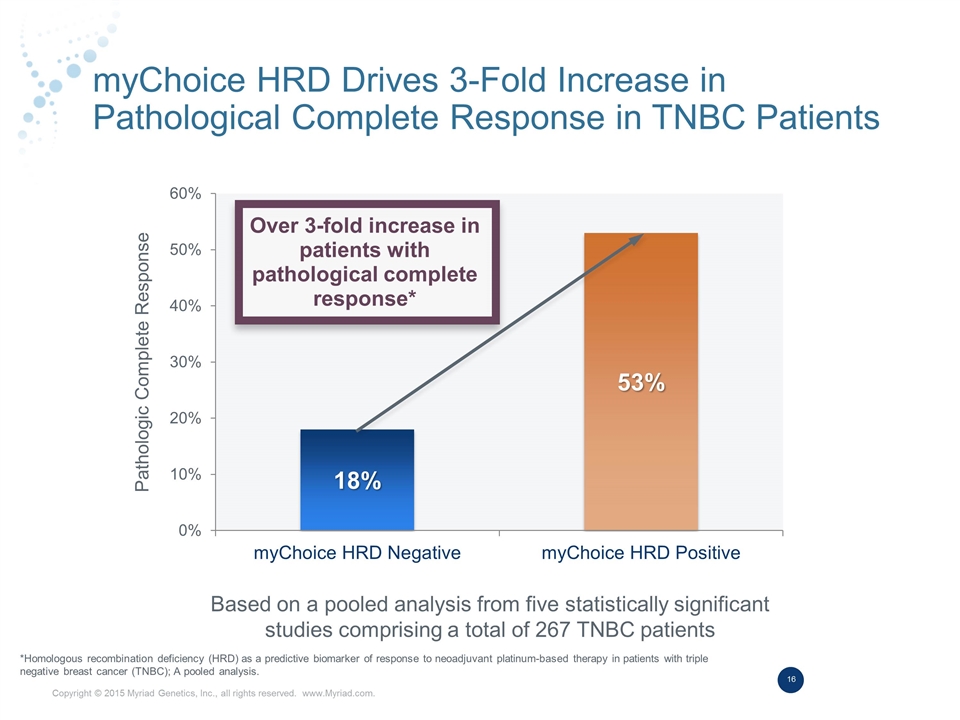
myChoice HRD Drives 3-Fold Increase in Pathological Complete Response in TNBC Patients Based on a pooled analysis from five statistically significant studies comprising a total of 267 TNBC patients Over 3-fold increase in patients with pathological complete response* Pathologic Complete Response *Homologous recombination deficiency (HRD) as a predictive biomarker of response to neoadjuvant platinum-based therapy in patients with triple negative breast cancer (TNBC); A pooled analysis.
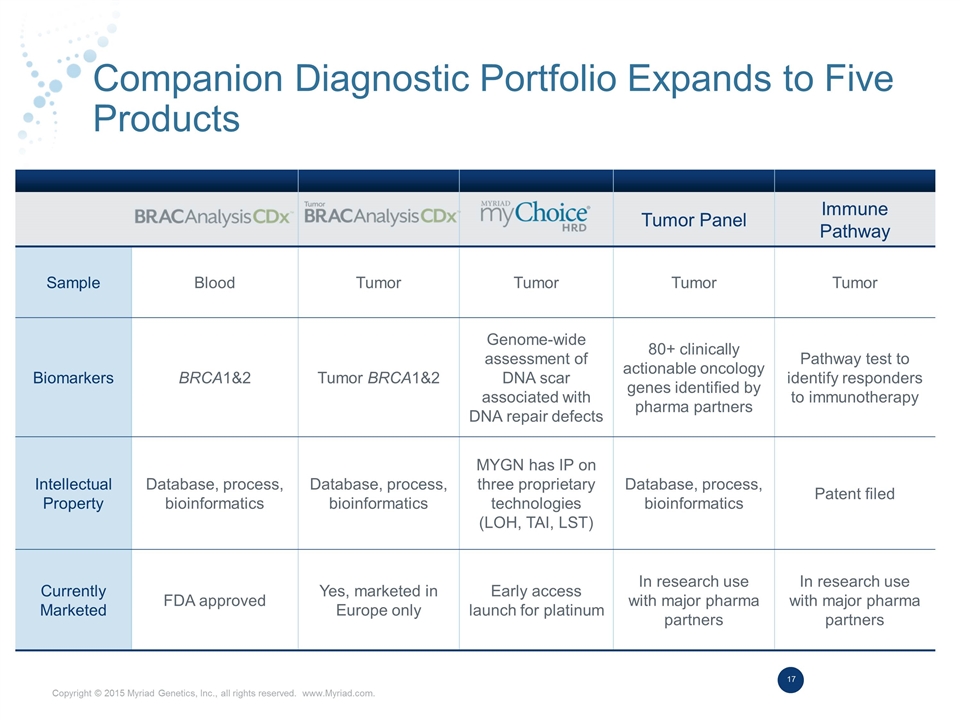
Companion Diagnostic Portfolio Expands to Five Products Tumor Panel Immune Pathway Sample Blood Tumor Tumor Tumor Tumor Biomarkers BRCA1&2 Tumor BRCA1&2 Genome-wide assessment of DNA scar associated with DNA repair defects 80+ clinically actionable oncology genes identified by pharma partners Pathway test to identify responders to immunotherapy Intellectual Property Database, process, bioinformatics Database, process, bioinformatics MYGN has IP on three proprietary technologies (LOH, TAI, LST) Database, process, bioinformatics Patent filed Currently Marketed FDA approved Yes, marketed in Europe only Early access launch for platinum In research use with major pharma partners In research use with major pharma partners
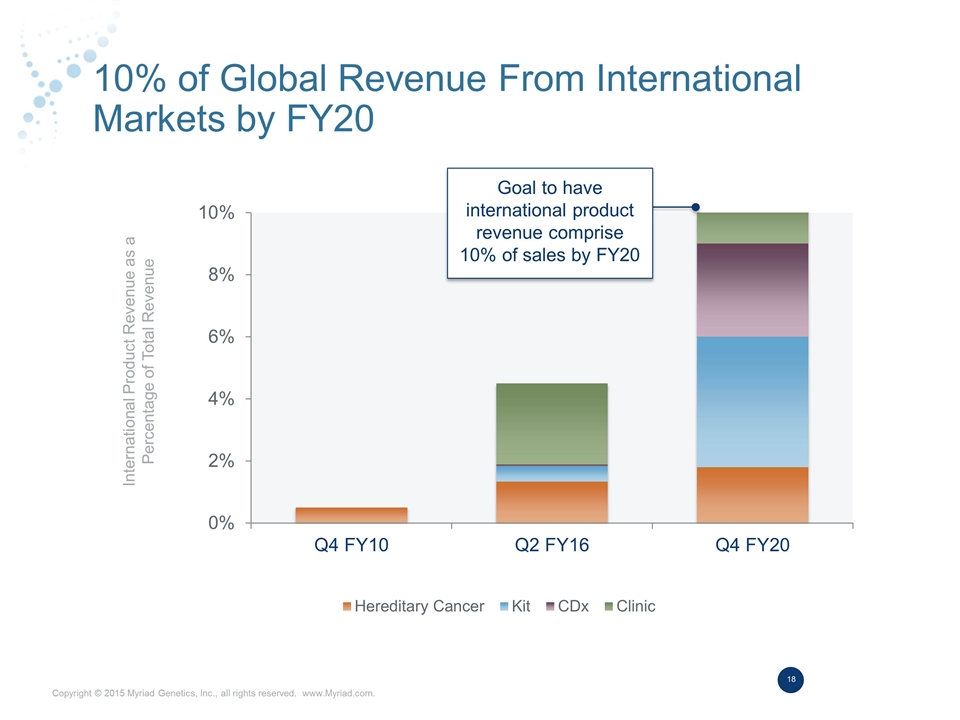
10% of Global Revenue From International Markets by FY20 International Product Revenue as a Percentage of Total Revenue Goal to have international product revenue comprise 10% of sales by FY20
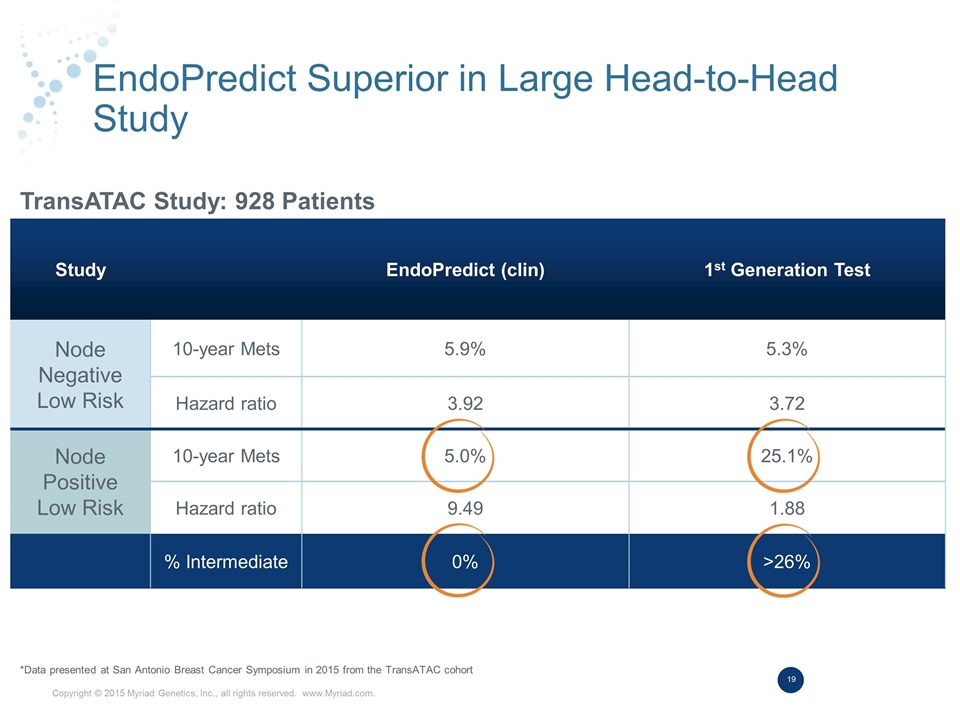
EndoPredict Superior in Large Head-to-Head Study *Data presented at San Antonio Breast Cancer Symposium in 2015 from the TransATAC cohort Study EndoPredict (clin) 1st Generation Test Node Negative Low Risk 10-year Mets 5.9% 5.3% Hazard ratio 3.92 3.72 Node Positive Low Risk 10-year Mets 5.0% 25.1% Hazard ratio 9.49 1.88 % Intermediate 0% >26% TransATAC Study: 928 Patients
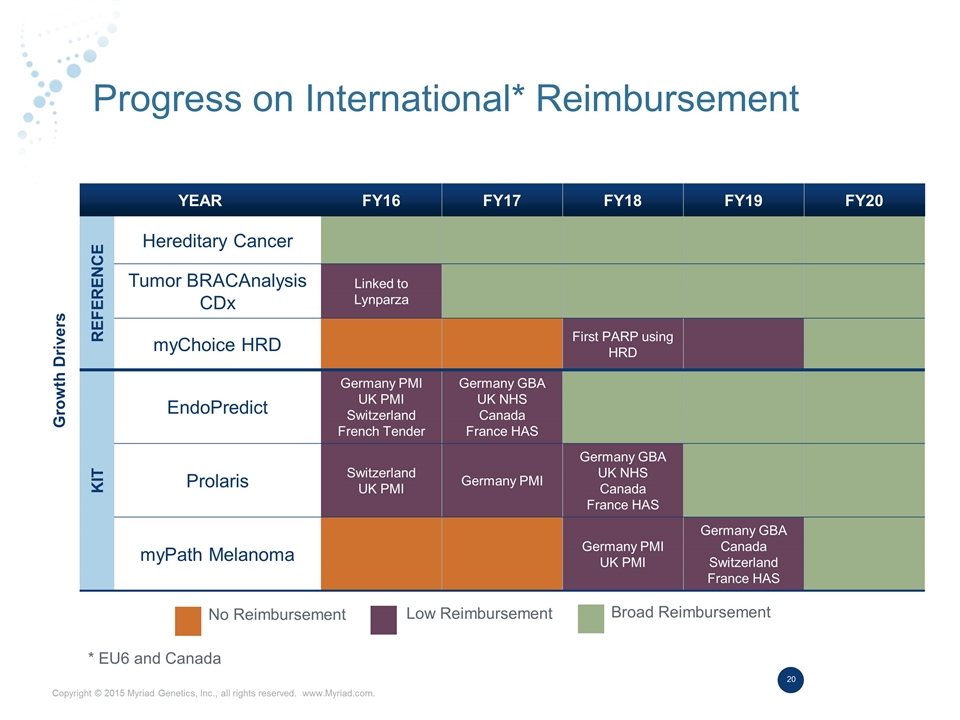
Progress on International* Reimbursement Growth Drivers YEAR FY16 FY17 FY18 FY19 FY20 Reference Hereditary Cancer Tumor BRACAnalysis CDx Linked to Lynparza myChoice HRD First PARP using HRD KIT EndoPredict Germany PMI UK PMI Switzerland French Tender Germany GBA UK NHS Canada France HAS Prolaris Switzerland UK PMI Germany PMI Germany GBA UK NHS Canada France HAS myPath Melanoma Germany PMI UK PMI Germany GBA Canada Switzerland France HAS No Reimbursement Low Reimbursement Broad Reimbursement * EU6 and Canada
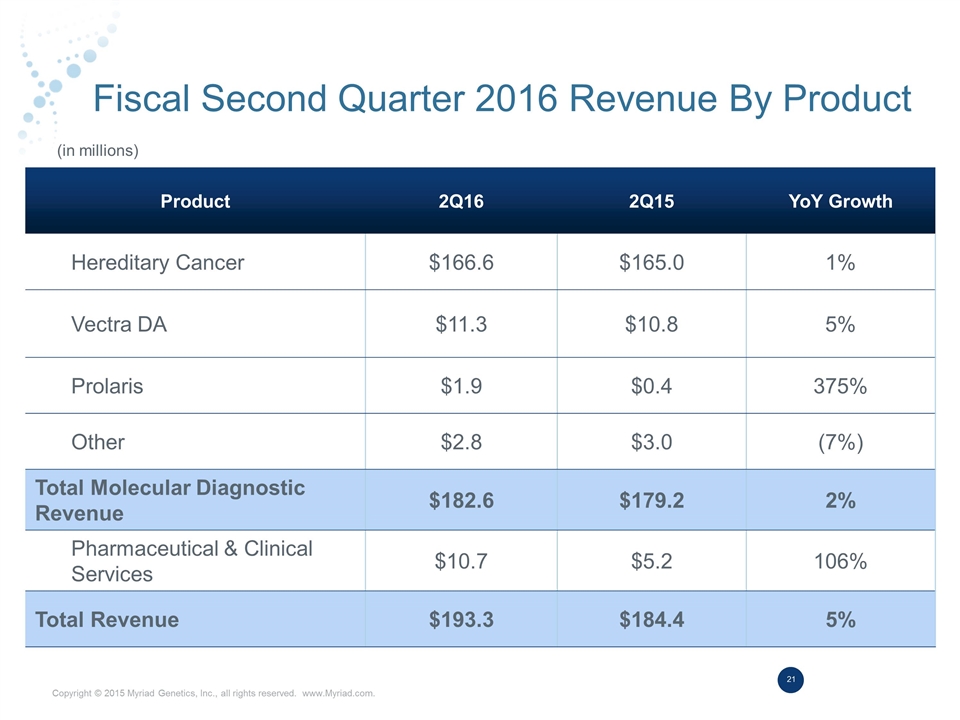
Fiscal Second Quarter 2016 Revenue By Product Product 2Q16 2Q15 YoY Growth Hereditary Cancer $166.6 $165.0 1% Vectra DA $11.3 $10.8 5% Prolaris $1.9 $0.4 375% Other $2.8 $3.0 (7%) Total Molecular Diagnostic Revenue $182.6 $179.2 2% Pharmaceutical & Clinical Services $10.7 $5.2 106% Total Revenue $193.3 $184.4 5% (in millions)
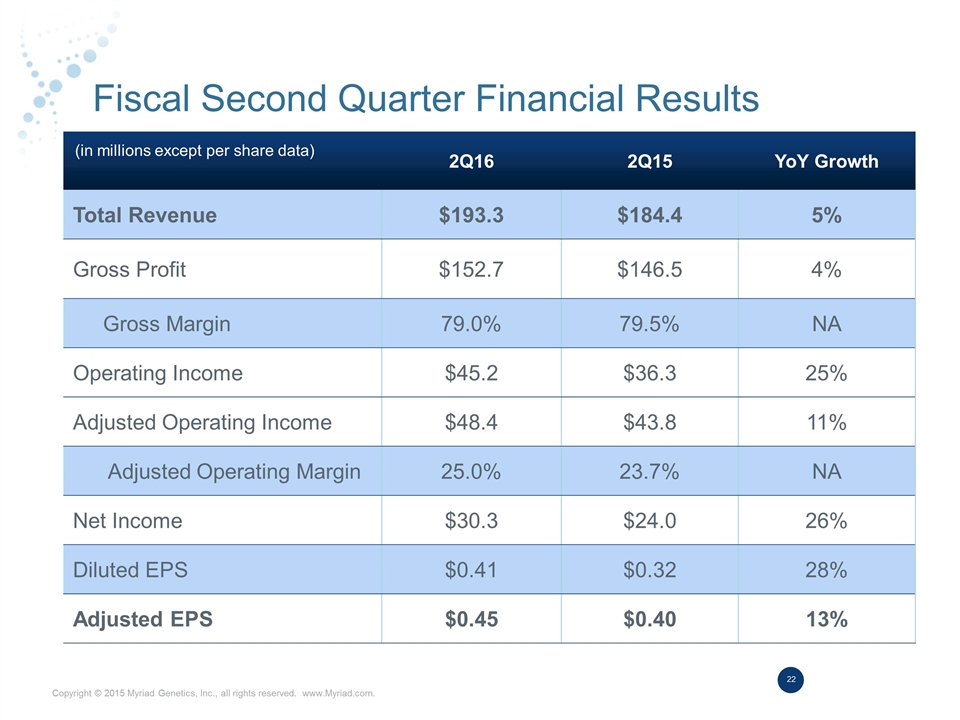
Fiscal Second Quarter Financial Results 2Q16 2Q15 YoY Growth Total Revenue $193.3 $184.4 5% Gross Profit $152.7 $146.5 4% Gross Margin 79.0% 79.5% NA Operating Income $45.2 $36.3 25% Adjusted Operating Income $48.4 $43.8 11% Adjusted Operating Margin 25.0% 23.7% NA Net Income $30.3 $24.0 26% Diluted EPS $0.41 $0.32 28% Adjusted EPS $0.45 $0.40 13% (in millions except per share data)
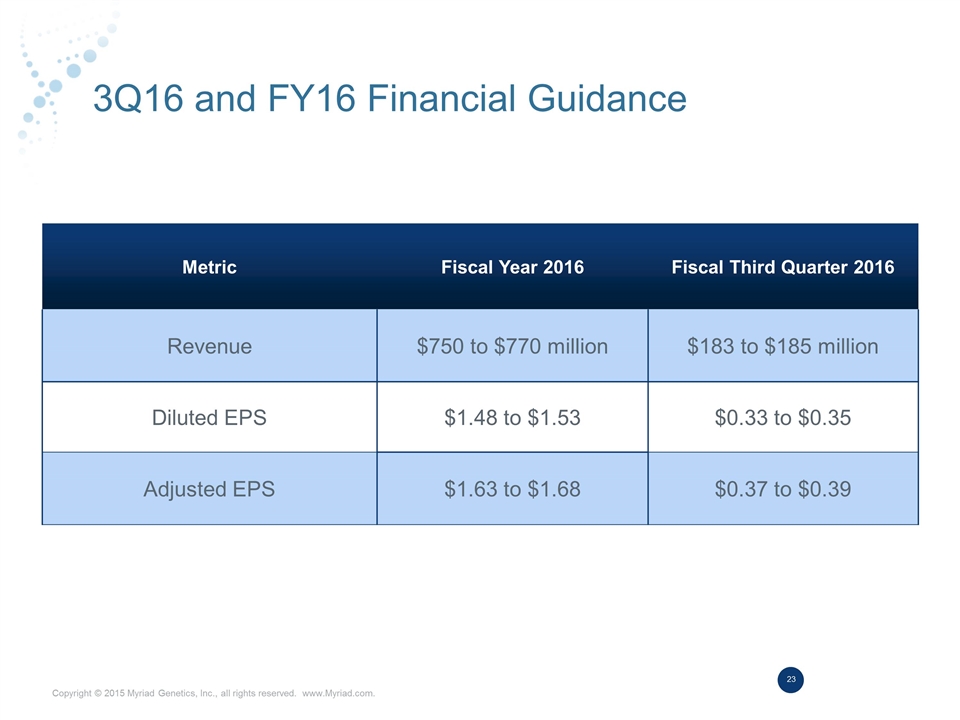
3Q16 and FY16 Financial Guidance Metric Fiscal Year 2016 Fiscal Third Quarter 2016 Revenue $750 to $770 million $183 to $185 million Diluted EPS $1.48 to $1.53 $0.33 to $0.35 Adjusted EPS $1.63 to $1.68 $0.37 to $0.39
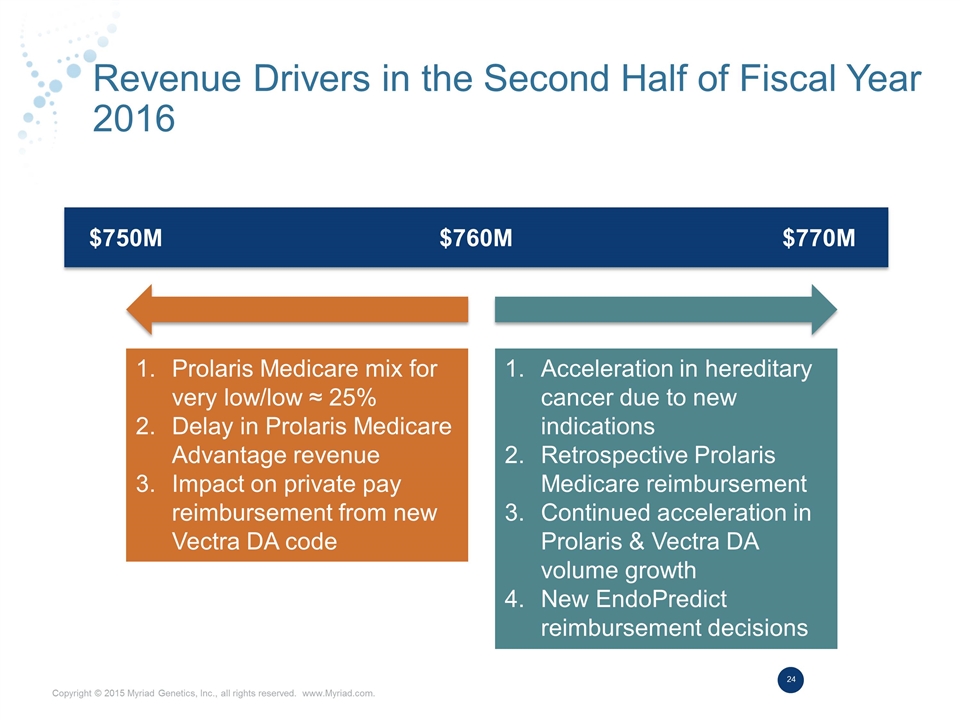
Revenue Drivers in the Second Half of Fiscal Year 2016 $750M $760M $770M Prolaris Medicare mix for very low/low ≈ 25% Delay in Prolaris Medicare Advantage revenue Impact on private pay reimbursement from new Vectra DA code Acceleration in hereditary cancer due to new indications Retrospective Prolaris Medicare reimbursement Continued acceleration in Prolaris & Vectra DA volume growth New EndoPredict reimbursement decisions
